Abstract
Erosion gullies can reduce arable land area and decrease agricultural machinery efficiency; therefore, automatic gully extraction on a regional scale should be one of the preconditions of gully control and land management. The purpose of this study is to compare the effects of the grey level co-occurrence matrix (GLCM) and topographic–hydrologic features on automatic gully extraction and guide future practices in adjacent regions. To accomplish this, GaoFen-2 (GF-2) satellite imagery and high-resolution digital elevation model (DEM) data were first collected. The GLCM and topographic–hydrologic features were generated, and then, a gully label dataset was built via visual interpretation. Second, the study area was divided into training, testing, and validation areas, and four practices using different feature combinations were conducted. The DeepLabV3+ and ResNet50 architectures were applied to train five models in each practice. Thirdly, the trainset gully intersection over union (IOU), test set gully IOU, receiver operating characteristic curve (ROC), area under the curve (AUC), user’s accuracy, producer’s accuracy, Kappa coefficient, and gully IOU in the validation area were used to assess the performance of the models in each practice. The results show that the validated gully IOU was 0.4299 (±0.0082) when only the red (R), green (G), blue (B), and near-infrared (NIR) bands were applied, and solely combining the topographic–hydrologic features with the RGB and NIR bands significantly improved the performance of the models, which boosted the validated gully IOU to 0.4796 (±0.0146). Nevertheless, solely combining GLCM features with RGB and NIR bands decreased the accuracy, which resulted in the lowest validated gully IOU of 0.3755 (±0.0229). Finally, by employing the full set of RGB and NIR bands, the GLCM and topographic–hydrologic features obtained a validated gully IOU of 0.4762 (±0.0163) and tended to show an equivalent improvement with the combination of topographic–hydrologic features and RGB and NIR bands. A preliminary explanation is that the GLCM captures the local textures of gullies and their backgrounds, and thus introduces ambiguity and noise into the convolutional neural network (CNN). Therefore, the GLCM tends to provide no benefit to automatic gully extraction with CNN-type algorithms, while topographic–hydrologic features, which are also original drivers of gullies, help determine the possible presence of water-origin gullies when optical bands fail to tell the difference between a gully and its confusing background.
1. Introduction
The world population is growing at a relatively high rate [1], indicating that securing a sufficient food supply will be a major challenge in the future [2]. Soil is a key resource for food production that is threatened by worldwide soil loss and degradation, which reduces crop yields [3], especially black soil, which is characterized by humus-rich layers, high productivity, and scarcity [4]. In China, the northeast black soil region, one of the four black soil regions in the world [5], is an important commercial grain production base [6], accounting for 25% of the total national food production [7], thus contributing a lot to food security [8,9]. However, due to natural factors and extensive exploitation, the soil quality has been deteriorating, and soil erosion has also intensified [10], which is dominated by wind in the drier western part and water in the wetter eastern part of the northeast black soil region [11]. Erosion gullies have become the most common form of water erosion [12]. There are approximately 666,700 gullies in the northeast black soil region [13]. Gullies reduce the arable land area, make land fragmented, and decrease the efficiency of agricultural machinery [14], resulting in the loss of 10% of the total grain supply every year [13].
Black soil in the northeast region of China is predicted to be completely eroded within 113 years [11]. Measures are being taken to control erosion gullies, and the extraction of data on gullies on a regional scale should be a precondition for gully control and land management. There are three major methods of gully data extraction via remote sensing data, including visual interpretation [15,16,17,18,19], information-analysis-based semi-automatic extraction, and machine learning-based automatic extraction. Visual interpretation is generally considered highly accurate, but it requires a vast workforce and time. The practice of visually interpreting erosion gullies within an area of 1000 km2 in the northeast black soil region requires one person working for a period of two months. Semi-automatic extraction, with its explainable logic, is generally conducted by highlighting gullies according to their spectral and topographical characteristics compared to their surroundings [20,21]. Automatic extraction is generally considered workforce-efficient and theoretically involves four kinds of technical routes: pixel-based pixel-oriented, object-based object-oriented, scene-based scene-oriented (i.e., image classification), and scene-based pixel-oriented (i.e., semantic segmentation) methods. The first method regards every pixel as a sample; the independent variables consist of spectral bands, indexes, and topographical features of a particular pixel; and machine learning models are trained to determine whether a pixel belongs to a gully. The object-based object-oriented method first segments the imagery into objects, and regards every object as a sample. The independent variables include the statistics of spectral bands, indexes, and geometric and topographic features within this particular object, and machine learning models are trained to determine whether an object belongs to a gully. The scene-based scene-oriented method regards every m-row m-column d-band scene as a sample; the independent variables contain spectral bands, indexes, and topographic features of pixels in this particular scene, and convolutional neural network (CNN)-class machine learning models are usually trained to determine whether a scene contains a gully. The scene-based pixel-oriented method, first accomplished by a fully convolutional network (FCN) [22,23], also regards every m-row n-column d-band scene as a sample; the independent variables still contain spectral bands, indexes, and topographic features of pixels in this particular scene. On the other hand, CNN-class machine learning models are usually trained to determine whether a pixel belongs to a gully. Studies on automatic gully extraction are scarce. Bokaei et al. (2022) [21] selected part of the Kajoo-Gargaroo watershed in Chahbahr county, Iran, as the study area; pixels within the gully, vegetation, soil, water, and asphalt were set as samples; independent variables were composed of red (R) bands, green (G) bands, and blue (B) bands from a drone camara; and the maximum likelihood model was applied to estimate the class of a pixel. Phinzi et al. (2020) [24] selected three small parts of Eastern Cape, South Africa, as the study area; pixels within the gully, vegetation, bare soil, rocks, settlement, and roads were set as samples; independent variables were composed of RGB bands and near-infrared (NIR) bands from SPOT-7; and linear discriminant analysis (LDA), support vector machine (SVM), and random forest (RF) models were applied to estimate the class of a pixel. Wang (2022) [25] chose a small watershed in Baiquan County, China, as the study area; objects were obtained by a multiscale segmentation algorithm based on the online imagery; the independent variables of objects included RGB bands, the vegetation index (VI), the grey level cooccurrence matrix (GLCM), and geometric features; and the tree-based pipeline optimization tool (TPOT) model was applied to estimate the class of an object. Feng et al. (2024) [26] selected Hailun City, China, as the study area; nearly 10,000 scenes (224-row 224-column 3-band) were constructed as samples based on online imagery; the independent variables contained RGB bands; and the multiscale dense dilated convolutional neural network (MDD-CNN) model was applied to estimate the class of a scene. Chen, C. et al. (2024) [27] took a watershed in Bin County, China, as the study area to compare the effectiveness of the object-based object-oriented method and scene-based pixel-oriented method. For the first method, objects were obtained based on the GF-7 imagery; the independent variables of objects included RGB bands, NIR bands, VIs, water indexes (WIs), the GLCM, and geometric features; and the RF model was applied to estimate the class of an object. For the second method, nearly 8000 scenes (500-row 500-column 3-band) were constructed as samples based on the GF-7 imagery; the independent variables included RGB bands; and a high-resolution net (HRNet) model was applied to estimate the class of a pixel [27]. Shen, Y. et al. (2024) [28] took three districts in Bin County, China, as the study area; scenes (512-row 512-column 4-band) were constructed as samples based on the drone imagery; the independent variables included RGB bands and the digital surface model (DSM); and a novel foreground-driven fusion network (FFNet) model was applied to estimate the class of a pixel.
As recent gully extraction studies have demonstrated above, the scene-based pixel-oriented method, collocated with CNN-class machine learning models, is more technologically ideationally advanced and becoming popular. The CNN model earned its reputation during the ImageNet large-scale visual recognition challenge (LSVRC) in 2012 [29], and is superior in capturing spatial features and patterns of an image due to its hierarchical layers [30,31], typically consisting of a convolutional layer, pooling layer, activation layer, batch normalization layer, dropout layer, and fully connected layer [32]. Nevertheless, there is a drawback with traditional CNNs: as the network depth of traditional CNN models increases, the accuracy can saturate and then degrade rapidly [33], so the ResNet model, with its novel residual and batch standardization structure, was introduced to address the degradation and gradient vanishing problem [34]. The “50” in ResNet50 indicates the quantity of layers designed to extract information [35,36], and the feature learning capacity of ResNet50 is strong [37]. Many machine learning models have adopted the ResNet architecture to deal with the application of high-resolution remote sensing imagery [38,39], including the DeepLabV3+ model, which was released in 2018 [40] and contains an encoding module which comprises a deep convolutional neural network (DCNN), followed by an atrous spatial pyramid pooling (ASPP) layer, which can learn multiscale information [41]. Compared to previous DeepLab architectures, DeepLabV3+ contains a simple and effective decoding module and can fuse low-level features with high-level features to improve the edge of segmentation [42]. DeepLabV3+ with ResNet as the DCNN has been widely used in semantic segmentation based on remote sensing imagery and has achieved ideal accuracies [43,44,45].
The grey level cooccurrence matrix (GLCM) is widely used in the processing of remote sensing imagery and acquires features through calculation of the cooccurrence matrix of pixel values within a particular direction and range [46,47]. The common features of a GLCM are the mean, variance, homogeneity, contrast, dissimilarity, entropy, angular second moment (ASM), and correlation. It can interact with the direction, range, and changing magnitude of adjacent pixels and can reflect image textures [48]. In addition to the GLCM, a gully is mainly affected by topography, land use, rainfall, hydrology, and soil [49,50], and it forms when surface water accumulates and erodes the soil along its way [51], so the topographic–hydrologic features can both cause a gully and indicate the possible presence of a gully [52].
Among the scarce previous studies on automatic gully extraction, GLCM features were mainly utilized in the object-based object-oriented method, and topographic features (DSM) were only mentioned once in a scene-based pixel-oriented practice [25,26,27,28]. Hence, three legacies arise: First, considering the computational processes of GLCM features [53], the convolutional and pooling layers of the CNN model might not be able to completely replace the GLCM’s function, so it is worth determining the possible contribution of GLCMs in the scene-based pixel-oriented method. Second, the topographic and hydrologic factors can determine the land use to a certain extent [54], making the optical satellite imagery equipped to carry topographic and hydrologic information, but without the high-resolution digital elevation model (DEM), the detailed local topographic–hydrologic features cannot be derived, which are of value to gully extraction. Third, the characteristic elevation of gullies tends to concentrate within a particular range in a small flat area, but this characteristic elevation range may disappear as the region scale increases, so it is necessary to introduce multiple topographic–hydrologic features, which are more robust in the regional scale with shifty background elevations.
To make full use of the high-resolution satellite imagery and DEM, which are accessible through governmental institutes, as well as to explore the three residual queries above, Dexiang Town, China, was selected as the study area. A label dataset of gullies was newly constructed, and GaoFen-2 (GF-2) satellite imagery with 1 m spatial resolution, a DEM with 2 m spatial resolution, and the derived GLCM and topographic–hydrological features were utilized as independent variables. In addition, the scene-based pixel-oriented method (the DeepLabV3+ architecture with ResNet50 as the DCNN) was applied to automatically extract gullies. We expect that this study could test the joint effect of optical imagery, the DEM, and semantic segmentation algorithm, and could form a practical workflow for automatic regional gully extraction in the northeast black soil region based on data collected from governmental institutes, thus contributing to erosion gully control and arable land management.
2. Study Area
Dexiang Town, Bayan County, Harbin City, Heilongjiang Province, China, located around E127°06′20″~127°23′50″ and N46°24′30″~46°35′15″, was selected as the study area (Figure 1a). It is a 200 km2 rolling-hilly region located in the transitional zone of Songnen Plain and Lesser Khingan Range. The coldest and hottest months are January and July, respectively, and precipitation is primarily concentrated from May to September. The elevation ranges from 150 to 230 m, and slopes are mostly less than 15 degrees. Due to the rolling hill, gentle slope, and sufficient surface water resources, the study area consists of many small catchments covered by cultivated land for corn and rice, and gullies are widespread. To reduce the spatial connections among samples in the trainset, test set, and validation set, the study area was divided into training, testing, and validating areas (Figure 1b), and sample generation for different purposes was restricted in distinct areas.
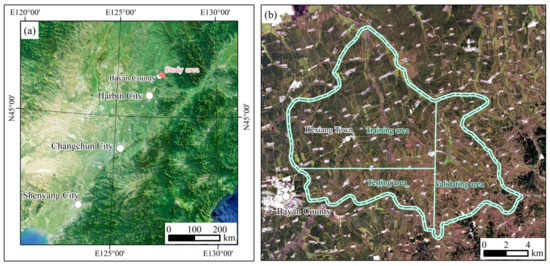
Figure 1.
(a) Regional location of the study area in Northeastern China; (b) the training, testing, and validation areas in the study area.
3. Materials and Methods
We used four gully extraction practices in this study: in Practice #1, only RGB and NIR bands were utilized as independent variables; in Practice #2, RGB and NIR bands and topographic–hydrologic features were both utilized as independent variables; in Practice #3, RGB and NIR bands and GLCM features were both utilized as independent variables; and in Practice #4, RGB and NIR bands, the GLCM, and topographic–hydrologic features were all utilized as independent variables. The accuracies of these four practices were compared to verify the positive (or negative) effect of the GLCM and topographic–hydrologic features for gully extraction. Figure 2 shows the automatic gully extraction workflow in Practice #4, comprising three main parts: data acquisition, feature analysis, and automatic gully extraction.
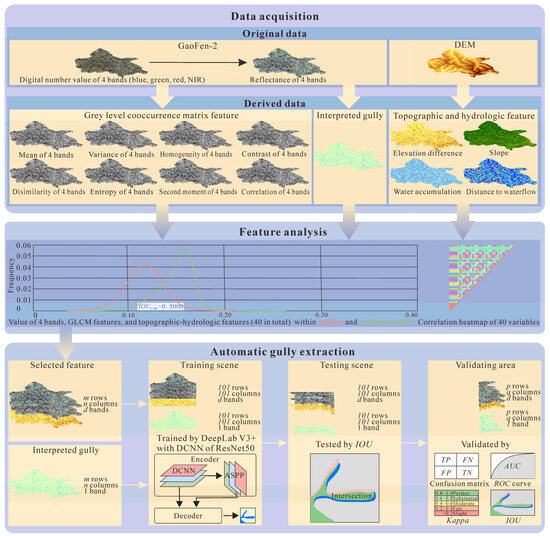
Figure 2.
Workflow of Practice #4.
3.1. Data Acquisition
The original data, including GF-2 Level-1A imagery in autumn (since gullies are clearer in the harvested bare cultivated land, and vegetation transpiration-related water vapour and clouds would restrict the optical sensing during the summer) together with the high-resolution DEM, were acquired from relevant governmental institutes (Table 1), and the corresponding derived data were obtained on the basis of the original data.

Table 1.
Data list.
3.1.1. Visual Interpretation of Gullies
Ground true gullies were newly delineated by visual interpretation based on GF-2 Level-1A imagery, and were used as the label dataset. As a surface waterflow path, an erosion gully usually reaches into a river or gradually becomes a river itself, and the concept and visual boundary between an erosion gully and river are not clear enough. Therefore, the erosion gullies and their superiorities (rivers) were all regarded as gullies for interpretation. According to a previous category of an erosion gully [25], six levels of gullies were classified according to width, cross-sectional shape, and lengthwise section shape in this study (Table 2). Considering that the spatial resolution of GF-2 imagery is 1 m, only gullies greater than or equal to Level-3 were visually delineated and were regarded as the object of automatic extraction.

Table 2.
Levels of gullies.
3.1.2. Imagery Preprocessing
To obtain the ground reflectance of 4 bands, image fusion, calibration, atmospheric correction, orthorectification, and registration were applied to GF-2 Level-1A imagery using the ENVI 5.3. Fusion was conducted via the nearest neighbour diffuse algorithm (NNDiffuse) [55]; calibration was conducted through band algebra according to the sensor’s gains and offsets; atmospheric correction was conducted via the fast line-of-sight atmospheric analysis of spectral hypercubes (FLAASH) algorithm [56]; and orthorectification and registration were conducted via ground control points (GCPs), rational polynomial coefficients (RPCs), the reference digital orthophoto map (DOM), and the DEM. Four independent variables were derived via this method (Table 1).
3.1.3. Grey Level Cooccurrence Matrix Feature
Taking the red reflectance band for illustration, the GLCM at every pixel of the red band was first built. During this step, the search window size was set according to the width scale of the gully minimum enclosing rectangle (MER) and the spatial resolution of the satellite image (Equation (1) [46]). The cooccurrence range was set according to the search window size, the cooccurrence direction was set as 0° (the results of 45, 90, and 135° would also be obtained by repeating this step), and the grey levels were set as 64:
where SWindow refers to the search window size of the GLCM, which should be an odd number; W refers to the width scale of the gully MER, which should be the floor of the peak range of the gully MER; and R refers to the spatial resolution of satellite images. Secondly, eight GLCM features of the red band, including the mean, variance, homogeneity, contrast, dissimilarity, entropy, angular second moment (ASM), and correlation, were calculated based on the GLCM [53,57,58,59,60]:
where L refers to the total number of grey levels, m refers to the grey level of a row in the GLCM, n refers to the grey level of a column in the GLCM, and Vmn refers to the normalized element value of row m column n in the GLCM. Thirdly, steps 1 and 2 were repeated three times, and the 8 GLCM features of the red band were calculated in the 45, 90, and 135° directions. Fourth, the average value of the 8 GLCM features for the red band were calculated in the 0, 45, 90, and 135° directions, and the 8 average GLCM features were taken as the final GLCM features of the red band. Fifth, steps 1 and 4 were repeated three times, and the 8 GLCM features of the green, blue, and NIR bands were calculated. Thirty-two independent variables were derived via this method (Table 1).
3.1.4. Topographic–Hydrologic Features
Topographic–hydrologic features were built based on the high-resolution DEM using ArcGIS 10.2. To find the elevation difference, the maximum and minimum elevations within a 21 m × 21 m square were first calculated, and then the minimum elevation was subtracted from the maximum. To obtain the slope, the “slope” tool was directly applied to the DEM. As for water accumulation, the “fill”, “flow direction”, and “flow accumulation” tools were applied to the DEM, where the output represents the accumulation of pixels, so the output was multiplied by 4 (4 m2 per pixel) to obtain the water accumulative area. For distance to waterflow, pixels greater (or less) than 10,000 m2 were first reclassed to 1 (or 0), respectively; secondly, the “stream link”, “stream order”, and “stream to feature” tools were utilized to obtain waterflow vector data; and thirdly, the “Euclidean distance” tool was applied to waterflow vector data to obtain the final distance to the waterflow data. Four independent variables were derived via this method (Table 1).
3.2. Feature Analysis
Both the correlation coefficient and frequency distribution curve of these forty variables were utilized to qualitatively and quantitatively identify variables that are possibly effective in distinguishing gullies from the background, as well as to reduce the size of input data for models. For correlation, the Pearson correlation coefficient was applied (Equation (14)):
where CPearson refers to the Pearson correlation coefficient between Variables A and B; Ai and Bi refer to the value of a pixel in Variables A and B, respectively; Amean and Bmean refer to the average value of pixels in Variables A and B, respectively; and n refers to the quantity of pixels in Variables A or B. As for the frequency distribution curve, 3000 circles with a radius of 20 m were first randomly generated beyond the 50 m buffer of gullies; second, pixels of 40 independent variables within the domains of gullies and circles were extracted; and third, frequency distribution curves were generated based on the pixels in gullies and circles, respectively. To quantitatively analyze the frequency distribution curve, the intersection over union of the frequency distribution curve (IOUFDC) was utilized, and the lower the IOUFDC, the higher the separability (Equation (15)):
where AGB refers to the area both under the frequency distribution curve of gullies and the background, AG refers to the area solely under the frequency distribution curve of gullies, and AB refers to the area solely under the frequency distribution curve of the background.
In this study, variables were selected according to the correlation coefficient, frequency distribution curve, and their types (reflectance bands, GLCM features, and topographic–hydrological features). Three principles were followed. First, four practices should be conducted: in Practice #1, RGB and NIR bands should be directly utilized as the baseline; in Practice #2, RGB and NIR bands and some specific topographic–hydrological features should be utilized; in Practice #3, RGB and NIR bands and some specific GLCM features should be utilized; and in Practice #4, RGB and NIR bands and the previously selected GLCM and topographic–hydrological features should be utilized. Second, GLCM features that were both less correlated with the RGB and NIR bands and lower in IOUFDC should be utilized in Practices #3 and #4. Third, considering the distinct data origins between the RGB and NIR bands and the topographic–hydrological features, their correlation should not be taken into account, and the topographic–hydrological features with lower IOUFDC should be utilized in Practices #2 and #4.
3.3. Automatic Gully Extraction
The automatic gully extraction practice involved model training, testing, and validating, and the study area was correspondingly divided into training, testing, and validating areas. In addition, Practice #4 could help demonstrate the process.
3.3.1. Training
It was assumed that d independent variables were selected for gully extraction in Practice #4, and gullies in the study area were delineated. First, gully vector data were converted to raster data, in which the pixel values within and out of the gullies were set as 1 and 0, respectively, and the pixel values of d independent variables were normalized to the range of 0~1. Secondly, in the smallest rectangle that covers the training area, a 101-row 101-column scene started to jump from the 51st row and 51st column with a step length of 50 pixels. If the quantity of gully pixels in the scene exceeded 500, then the 101-row 101-column d-band scene, with three other scenes (the left–right-flipped, up–down-flipped, and left–right-up–down-flipped scene of this particular scene), would be extracted as samples of the trainset. Third, the DeepLabV3+ architecture (Figure 3) was applied for automatic extraction. The input size was 101 rows and 101 columns, with a d-band (based on the variables selected), and ResNet50’s convolutional structure was selected as the DCNN. To dynamically weight the input features, a squeeze-and-excitation module (SE) was inserted behind every residual block of the ResNet50 net, and was expected to help recalibrate feature responses by modelling interdependencies between features [61]. Fourth, two computers with an RTX4060 8G-memory GPU (manufactured by NVIDIA, Santa Clara, CA, USA), and Python 3.11 were used to train and predict. During training, the batch size was set as 8, the max epoch was 18, the initial learning rate was 0.01, and the learning rate reduced by 0.1 times every 6 epochs. To mitigate the sample imbalance between gullies and backgrounds, the weighted cross-entropy (WCE) was utilized, which is designed to assign various higher or lower weights to the training loss related to classes with less or more pixel quantities, respectively, thus making the models pay more attention to identifying small targets [62]. Fifth, Steps 3~4 were repeated five times, and five models were finally obtained. Sixth, the gully and background in trainset samples were semantically segmented by the trained models, and the intersection over union of the gully (IOUGully) for the trainset was calculated to preliminarily evaluate the model performance:
where TP refers to the number of pixels that were correctly classified as a gully, FP refers to the number of pixels that were incorrectly classified as a gully, and FN refers to the number of pixels that were incorrectly classified as the background.
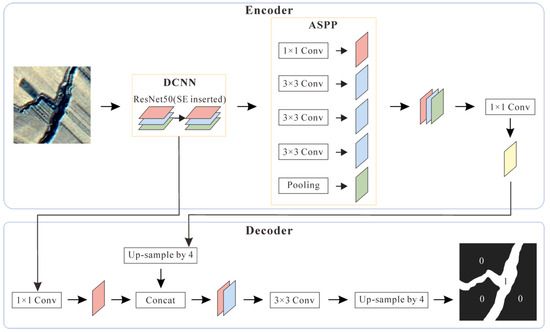
Figure 3.
Flowchart of DeepLabV3+ (modified from Yao et al., 2025 [63]).
3.3.2. Testing
Assuming d independent variables were selected for gully extraction in Practice #4, first, in the smallest rectangle that covers the testing area, a 101-row 101-column scene started to jump from the 51st row and 51st column with a step length of 50 pixels, and if the quantity of gully pixels in the scene exceeded 500, then the 101-row 101-column d-band scene, with three other scenes, would be extracted as samples of the test set. The statistics of the Euclidean distance from the training samples to the testing samples were used as an indicator of spatial independence. Secondly, the gullies and background in the test set samples were also semantically segmented by the trained models, and the IOUGully for the test set was calculated to preliminarily evaluate the model performance (Equation (16)).
3.3.3. Validating
Assuming d independent variables were selected for gully extraction in Practice #4, three kinds of metrics could be applied to analyze the effects of GLCM and topographic–hydrologic features on automatic gully extraction. First, the whole imagery of the validating area (d-band) was semantically segmented by the trained models. Second, the receiver operating characteristic curve (ROC) and area under curve (AUC) were calculated based on the true positive rate (TPR) and false positive rate (FPR) (Table 3) [64,65], derived from the confusion matrix with a changing classification threshold. Third, the Kappa coefficient (Table 3) [66] and IOUGully (Equation (16)) were calculated based on the confusion matrix with the preferred classification threshold:

Table 3.
Index algorithms related to confusion matrix.
4. Results
4.1. Gully Distribution
Gullies are almost spatially homogeneous in the study area (Figure 4), covering a total area of nearly 7,625,000 m2. Most gullies belong to Levels 3~5, with an area of about 6,388,000 m2, accounting for 83.78% of the total area. They stretch along both sides of the superior gullies and form dendritic drainages together with Level 6 gullies, whose area is about 1,237,000 m2, accounting for 16.22% of the total area. According to the scale of training, testing, and validating areas, approximately 3,815,000 m2 of the gullies was used to generate the training samples, and the trainset IOUGully was calculated; 1,525,000 m2 of the gullies was used to generate the testing samples, and the test set IOUGully was calculated; 2,285,000 m2 of the gullies in the validating area as a whole was used to compare with the predicted gullies, and then the confusion matrix, ROC, AUC, Kappa coefficient, and IOUGully were calculated.
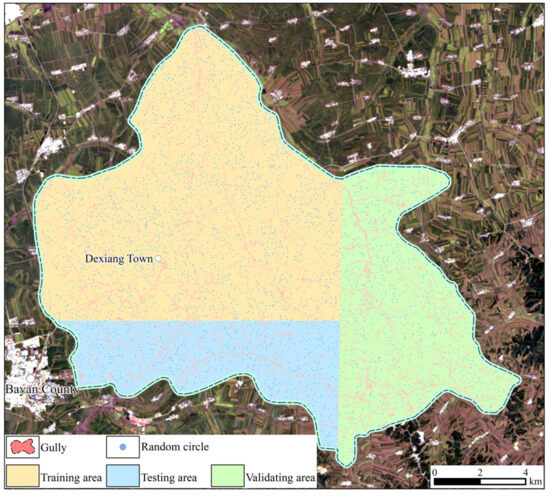
Figure 4.
Spatial distribution of visually interpreted gullies.
4.2. Feature Analysis
4.2.1. RGB and NIR Bands
As visually spotted, the separating capacities of the RGB and NIR bands are significant, and the main ranges and peak values of frequency curves within the gullies and surroundings both progressively increase from blue (Figure 5a), green (Figure 5b), and red (Figure 5c) to the NIR band (Figure 5d), indicating a progressively increasing trend of spectral reflectance. The frequency curve shapes within gullies for the four bands are similar, which are normally distributed (Figure 5a–d) because of the similar reflective characteristics. Meanwhile, for the surroundings, only the frequency curve shape for the blue band is normally distributed, and the frequency curve shapes for the green, red, and NIR bands are approximately normally distributed with a second peak because of the various land uses and colours in the background. Among these four bands, the green band possesses the lowest IOUFDC at 0.1937, followed by the red band (0.1997), and the NIR band possesses the highest IOUFDC at 0.2366 (Table 4).
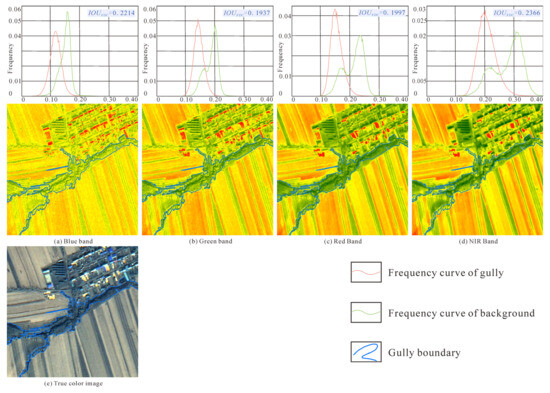
Figure 5.
Frequency curves of RGB and NIR bands within gully and background and their corresponding spatial distributions.

Table 4.
Frequency curve statistics of RGB and NIR bands.
4.2.2. GLCM Features
The frequency histogram peak for the width of the gully MERs ranges from 8 to 10 m (Figure 6), and the original result value was 4 according to Equation (1). The GLCM search window size in this study was rounded up to 5 to meet the “odd number” criteria [46], and the cooccurrence range was set as 2. The eight features of the GLCM in four directions for the RGB and NIR bands were calculated, and the mean of four directions for each feature was obtained to represent the GLCM features for the RGB and NIR bands.
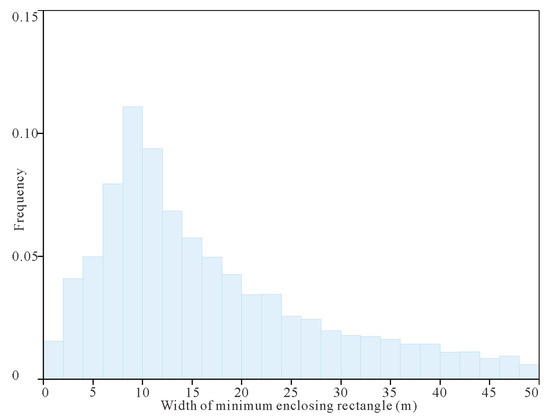
Figure 6.
A frequency histogram for the width of gully MERs.
- (1)
- Blue band
The peak values and shapes of frequency curves within the gullies and surroundings for the mean (Figure 7a), variance (Figure 7b), homogeneity (Figure 7c), contrast (Figure 7d), dissimilarity (Figure 7e), entropy (Figure 7f), ASM (Figure 7g), and correlation (Figure 7h) show some qualitatively visual differences. As visually seen from the frequency curves, the separating capacity of the mean is significant, and the separating capacities of homogeneity, dissimilarity, entropy, and ASM are moderate. The frequency curves for eight GLCM features within gullies are normally distributed, suggesting that gullies tend to possess similar GLCM characteristics, while the shapes of frequency curves within surroundings are mainly irregular or single-slope-inclined, suggesting complex textures in the background [46]. Among these eight features for the blue band, GLCM mean possesses the lowest IOUFDC at 0.2016, followed by GLCM entropy (0.4068), and GLCM correlation possesses the highest IOUFDC at 0.6615 (Table 5).
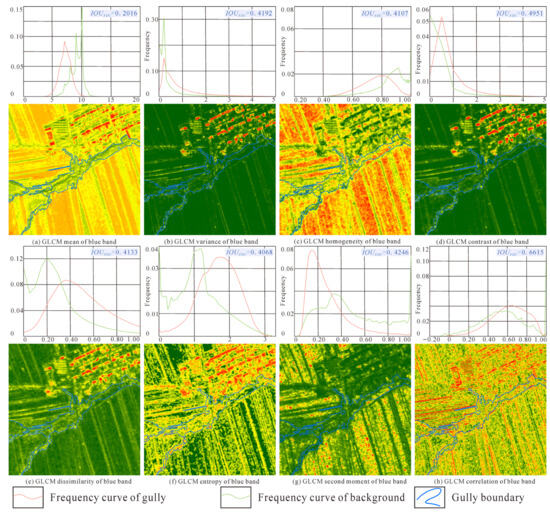
Figure 7.
Frequency curves of GLCM features for blue band within gully and background and their corresponding spatial distributions.

Table 5.
Frequency curve statistics of GLCM features for blue band.
- (2)
- Green band
The peak values and shapes of frequency curves within gullies and surroundings for the mean (Figure 8a), variance (Figure 8b), homogeneity (Figure 8c), contrast (Figure 8d), dissimilarity (Figure 8e), entropy (Figure 8f), ASM (Figure 8g), and correlation (Figure 8h) also show some differences, which is still visually clear for the mean, and is moderate for homogeneity, dissimilarity, entropy, and ASM. The frequency curve shapes for eight GLCM features within gullies are also mainly normal, while the shapes of frequency curves within the surroundings are primarily irregular. Among these eight features for the green band, GLCM mean still possesses the lowest IOUFDC at 0.1842, followed by GLCM entropy (0.4139), and GLCM correlation still possesses the highest IOUFDC at 0.7012 (Table 6).
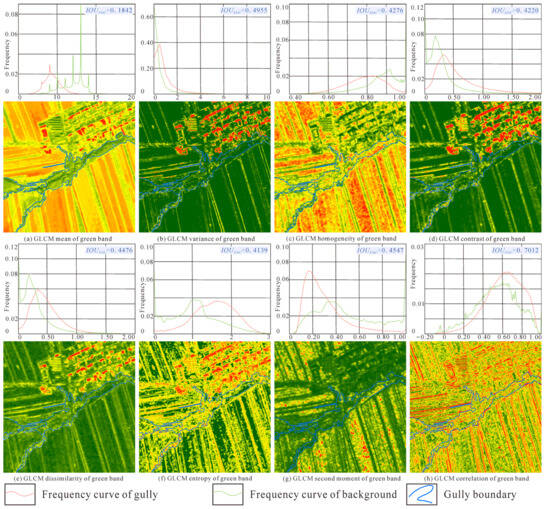
Figure 8.
Frequency curves of GLCM features for green band within gully and background and their corresponding spatial distributions.

Table 6.
Frequency curve statistics of GLCM features for green band.
- (3)
- Red band
There are still visual differences among the peak values and shapes of frequency curves within gullies and surroundings for the mean (Figure 9a), variance (Figure 9b), homogeneity (Figure 9c), contrast (Figure 9d), dissimilarity (Figure 9e), entropy (Figure 9f), ASM (Figure 9g), and correlation (Figure 9h), which is evident for the mean and is moderate for homogeneity, entropy, and ASM. The frequency curve shapes for eight GLCM features within gullies are generally normal, while the shapes of the frequency curves within the surroundings are mainly approximately normal or irregular. Among these eight features for the red band, the IOUFDC of GLCM mean remains the lowest at 0.1958, followed by GLCM entropy (0.4303), and the IOUFDC of correlation remains the highest at 0.7403 (Table 7).
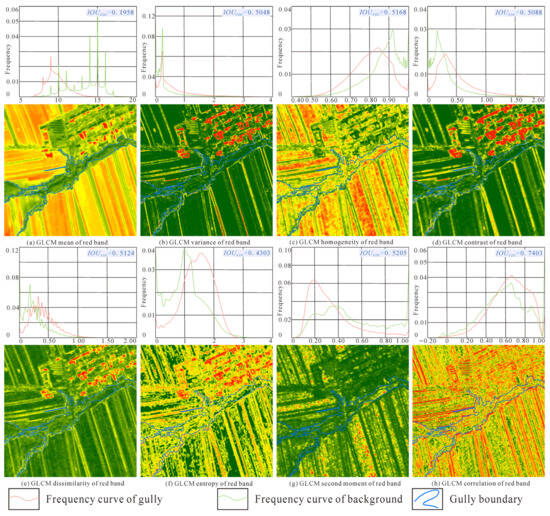
Figure 9.
Frequency curves of GLCM features for red band within gully and background and their corresponding spatial distributions.

Table 7.
Frequency curve statistics of GLCM features for red band.
- (4)
- NIR band
Qualitative differences among the peak values and shapes of frequency curves within gullies and surroundings for the mean (Figure 10a), variance (Figure 10b), homogeneity (Figure 10c), contrast (Figure 10d), dissimilarity (Figure 10e), entropy (Figure 10f), ASM (Figure 10g), and correlation (Figure 10h) still exist, which is visually clear for the mean, and is moderate for homogeneity, dissimilarity, entropy, and ASM. Normal distributions still make up the majority of the frequency curves for eight GLCM features within gullies, and the distribution of frequency curves within surroundings begins to show some relatively normal characteristics. Among these eight features for the NIR band, the IOUFDC of GLCM mean remains the lowest at 0.2394, also followed by GLCM entropy (0.4243), and the IOUFDC of correlation remains the highest at 0.6712 (Table 8).
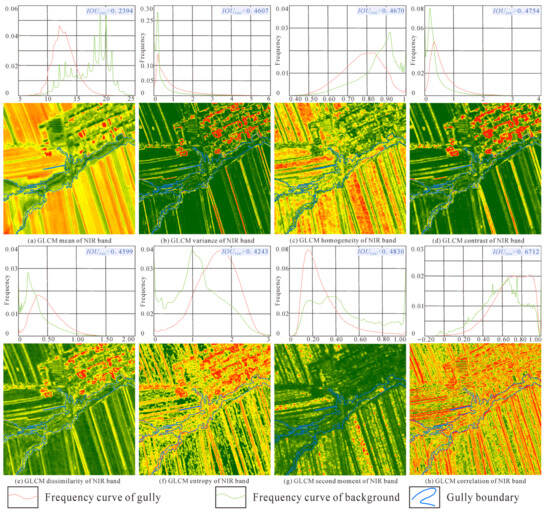
Figure 10.
Frequency curves of GLCM features for NIR band within gully and background and their corresponding spatial distributions.

Table 8.
Frequency curve statistics of GLCM features for NIR band.
4.2.3. Topographic–Hydrologic Features
Visually judging from the ranges and peak values of frequency curves within gullies and surroundings, there are evident diversities for elevation difference (Figure 11a), slope (Figure 11b), and distance to waterflow (Figure 11c), but the curves of water accumulation overlap completely (Figure 11d). Compared to the frequency curve shapes of GLCM features, the counterparts of topographic–hydrologic features are more regular, which are normal or single-slope-inclined, indicating that topographic–hydrologic features within gullies and surroundings exhibit particular patterns. Among these four features, distance to waterflow possesses the lowest IOUFDC at 0.1998, followed by elevation difference (0.2912), and water accumulation possesses the highest IOUFDC (0.9120) (Table 9), which is because pixels with high water accumulation values only distribute in the gullies as a pixel-wide line, which are overwhelmed by adjacent pixels with low values.
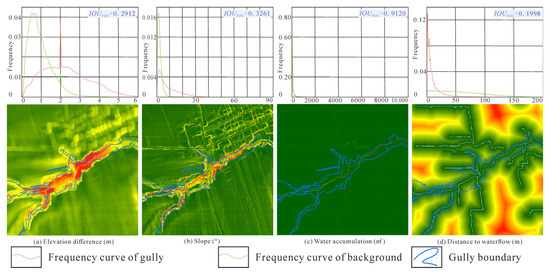
Figure 11.
Frequency curves of topographic–hydrologic features within gully and background and their corresponding spatial distributions.

Table 9.
Frequency curve statistics of topographic–hydrologic features.
4.2.4. Variable Selection
According to the feature selection principles, the variable types, correlation with RGB and NIR bands, and IOUFDC were all taken into account to determine what variables could be utilized in Practices #1~4. In Practice #1, the RGB and NIR bands (four variables in total) were utilized as the baseline for automatic gully extraction (Table 10). In Practice #2, considering its very high IOUFDC value (Table 9), water accumulation was excluded, and the RGB and NIR bands, together with the elevation difference, slope, and distance to waterflow (seven variables in total), were utilized for automatic gully extraction (Table 10). In Practice #3, the GLCM mean showed a high correlation with the RGB and NIR bands (Figure 12), so they were excluded, despite their most ideal IOUFDC values (Table 5, Table 6, Table 7 and Table 8). Among the residual GLCM features, the variance of the blue band and the contrast of the green band exhibited IOUFDC values less than 0.45 (0.4192 and 0.4220, respectively; Table 5 and Table 6), and simultaneously showed less correlation with the RGB and NIR bands (less than 0.25, Figure 12), but a correlation of 0.77 was shown between these two variables (Figure 12), so in Practice #3, the RGB and NIR bands, together with the GLCM variance of the B band (because its lower IOUFDC), were utilized for automatic gully extraction (five variables in total, Table 10). In Practice #4, according to the GLCM and topographical–hydrological features selected in Practices #1~3, the RGB and NIR bands, together with the GLCM variance of the B band, as well as with the elevation difference, slope, and distance to waterflow (eight variables in total), were utilized for automatic gully extraction (Table 10).

Table 10.
Variables selected in Practices #1~4.
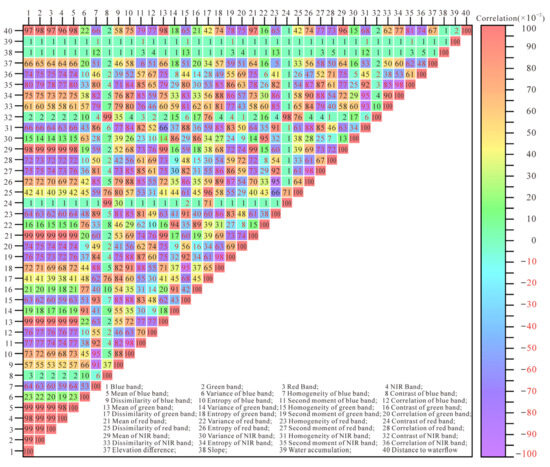
Figure 12.
Correlation heatmap of forty variables.
4.3. Model Performance
4.3.1. Sample Statistics
Approximately 32,500 101-row 101-column d-band (d = 4, 7, 5, 8) samples generated in the training area were utilized to train the model in Practices #1, #2, #3, and #4, respectively (Figure 13a). Correspondingly, almost 13,700 101-row 101-column d-band samples generated in the testing area were utilized to test the model in Practices #1, #2, #3, and #4, respectively (Figure 13b). In addition, to further validate the models trained in the four practices, gullies in the whole validating area were automatically extracted and evaluated according to the visually interpreted gullies in the whole validating area (Figure 13c). The proportions of the gully and background in the trainset, test set, and validating area range from 5.55 to 14.08% and from 85.92 to 94.45%, respectively (Figure 13d). The spatial distance between the nearest training samples and testing samples mainly ranges from 300 to 3000 m with a mean of 1838 m and standard deviation (SD) of 1070 m, suggesting an acceptable spatial independence between training and testing samples (Figure 13e).
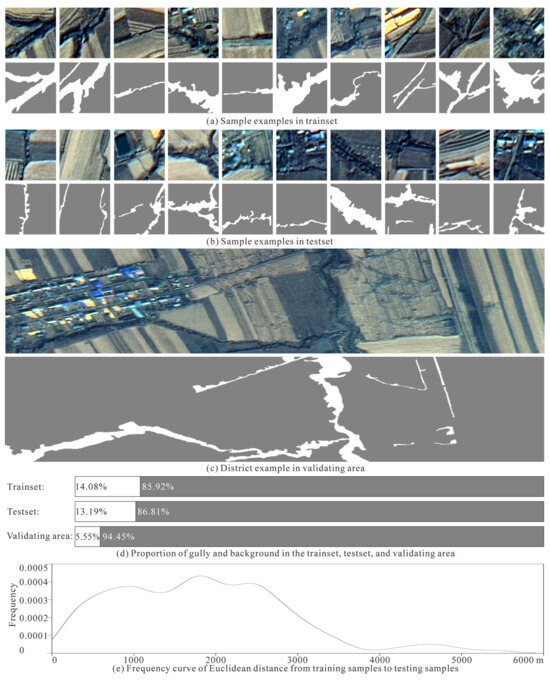
Figure 13.
Examples of (a) trainset, (b) test set, (c) validating area, and (d) proportions of gully background; (e) frequency curve of Euclidean distance from training samples to testing samples.
4.3.2. Performance Assessment
The training curve of each model meets with convergence and saturation after approximately 75,000 iterations, which would cost about 8 h for each training process (Figure 14a). Although Models #1~5 in Practices #1~4 are capable of distinguishing gullies from the background to some extent, the model performances between Practices #1~4 are heterogeneous. The baseline Models #1~5 in Practice #1 show moderate accuracies with a trainset IOUGully of 0.5188 ± 0.0172 (Figure 14c), test set IOUGully of 0.4249 ± 0.0148 (Figure 14d), validating AUC of 0.9585 ± 0.0035 (Figure 14b,e), gully user’s accuracy of 0.5644 ± 0.0122 (Figure 14f), gully producer’s accuracies of 0.6434 ± 0.0077 (Figure 14g), Kappa coefficient of 0.5753 ± 0.0087 (Figure 14h), and IOUGully of 0.4299 ± 0.0082 (Figure 14i, Table 11). The baseline models’ performances indicate that solely R, G, B, and NIR bands are capable of drawing gullies at a regional scale with acceptable accuracy, and could be used to understand the general gully distribution and guide land management, providing a basic choice when additional data are not available.
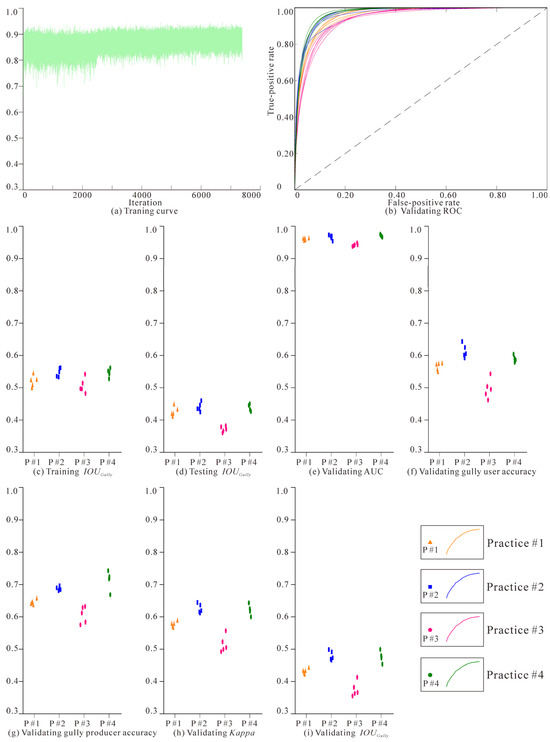
Figure 14.
(a) Training curve, (b) validating ROC, (c) training IOUGully, (d) testing IOUGully, (e) validating AUC, (f) validating gully user’s accuracy, (g) validating gully producer’s accuracy, (h) validating Kappa, and (i) validating IOUGully of Practices #1, #2, #3, and #4.

Table 11.
Performance statistics of Models #1~5 in Practices #1~4.
Models #1~5 in Practice #2 were trained on the basis of R, G, B, and NIR bands and elevation difference, slope, and distance to waterflow. Compared to Practice #1, the participation of topographic–hydrologic features improves the model performances significantly, especially for the validating user’s accuracy, producer’s accuracy, Kappa, and IOUGully, which completely exceed the counterparts in Practice #1, and increases by 0.0489, 0.0442, 0.0503, and 0.0497, respectively. As for trainset IOUGully, test set IOUGully, and validating AUC, they are generally higher than those of the baseline models, despite some overlaps (Figure 14b–i, Table 11).
Models #1~5 in Practice #3 were trained using the R, G, B, and NIR bands, together with the GLCM variance of the B band. Compared to Practice #1, the participation of GLCM features deteriorates the models’ performance, and there are overlaps for accuracy indicators between Practices #3 and #1, but they are generally lower than those of the baseline models (Figure 14b–i, Table 11), and the GLCM feature brings no benefit to gully extraction.
Models #1~5 in Practice #4 were trained with the total combination of R, G, B, and NIR bands; the GLCM variance of the B band; and elevation difference, slope, and distance to waterflow. Compared to Practice #1, the joint effect of the GLCM and topographic–hydrologic features on model performances is still positive, and the validating Kappa and IOUGully are completely higher than those in Practice #1, and increases by 0.0460 and 0.0463, respectively, while the trainset IOUGully, test set IOUGully, validating AUC, user’s accuracy, and producer’s accuracy are generally higher than those in Practice #1 (Figure 14b–i, Table 11).
The performances of Models #1~5 in Practices #2 and #4, with seven or eight variables, show overlapping confidence intervals, and tie for the highest. Compared to Practice #1, the participation of three topographic–hydrologic features increases the accuracies significantly and shows robustness to the negative effect of GLCM features.
5. Discussion
According to the performances of Models #1~5 in Practices #1~4, the topographic–hydrologic features like elevation difference, slope, and distance to waterflow could evidently improve the accuracy of automatic gully extraction. The models in Practice #2 tend to give higher automatic extraction performances than in Practice #1 (Figure 14, Table 11). On the other hand, the GLCM feature, which was represented by the variance of the blue band in this study, would dramatically lower the accuracy of automatic gully extraction, and the models in Practice #3 tend to show the lowest automatic extraction accuracies (Figure 14, Table 11), despite the apparent frequency curve differences of GLCM features between gullies and backgrounds (Figure 7). The negative effects of the GLCM were also reported in previous satellite image target detections using machine learning methods [67]. Interestingly, when combining the GLCM feature together with topographic–hydrologic features in Practice #4, the models do not show clearly lower performances than the models in Practice #2, as expected, but give generally equivalent accuracies with models in Practice #2 (Figure 14, Table 11), showing the correction capability of topographic–hydrologic features.
There are four possible outcomes when comparing the automatically extracted gullies to the visually interpreted gullies. First, a gully is correctly identified (true-positive gully), and the width and boundary are almost similar to the visually interpreted one. Second, a gully is identified, but its width might be wider or narrower than it truly is, and its boundary sometimes swings along the actual boundary line, generating a false-positive or false-negative part of the gully. Third, some banded background stripes are falsely extracted as a gully (false-positive gully). Fourth, some true gully areas are missed and classified as the background (false-negative gully). In this study, the false-positive and false-negative results of Practices #1~4 in the validating area (Figure 15) are suitable for determining some specific effects of the GLCM and topographic–hydrologic features.
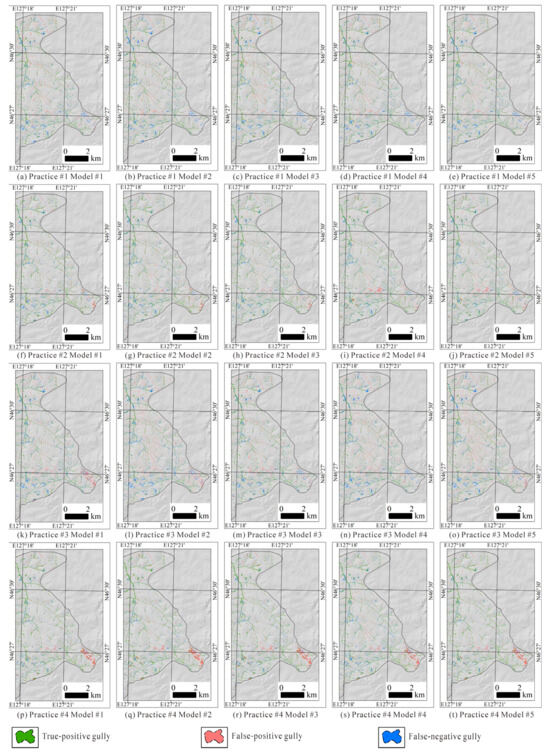
Figure 15.
True-positive, false-positive, and false-negative result distributions of models in Practices (a–e) #1, (f–j) #2, (k–o) #3, and (p–t) #4.
In Practice #1 (Figure 15a–e), the false-positive gullies are mainly distributed as dark narrow stripes in the cultivated land (mainly caused by harrowing and ploughing after harvest, which would expose the black wet soil to the surface, or the wet water-concentrating low-lying stripes that are parallel to crop rows), due to the phenomenon of different objects with similar spectra [46], while the false-negative gullies are mainly located in a dark background. The false-negative gullies sometimes possess lighter colours, making them blurry compared to the background. There are also a few cases where the wide irregularly shaped gully is constantly ignored by five models. A possible reason is that the majority of training samples contain narrow stripped gullies, so the models were mainly trained to identify the narrow stripped gullies.
In Practice #2 (Figure 15f–j), compared to Practice #1, the false-positive gullies caused by dark stripes decrease significantly, owing to the topographic–hydrologic features, which could distinguish the gully and dark stripes in a flat or monoclinal slope area, but some areas that are dark and adjacent to waterflows, together with areas where there is a slightly dark waterflow region but without an eroded gully, are falsely extracted as gullies. There are also false-negative gullies due to a dark background or lighter colour, but the models could more likely identify a gully from a similar background with the help of topographic–hydrologic features. For a wide irregularly shaped gully, the five models showed a tendency to extract the lower bottom as the gully, and the higher bottom of a wide irregularly shaped gully would be treated as the background. Topographic–hydrologic features, which are also the original drivers of gullies, could help in determining the possible presence of a water-origin gully when optical bands fail to tell the difference between a gully and its confusing background.
In Practice #3 (Figure 15k–o), compared to Practice #1, the false-positive gullies caused by dark stripes of dark areas clearly increase, which is thought to be because the GLCM could capture the local textures of the gully and background, and magnify their textures to an equal intensity, which is advantageous in subtle texture detection and target detection with vague boundaries, but is disadvantageous in target detection with clear boundaries when it emphasizes a slightly dark or brown stripe as a gully.
As for the false-negative gullies, their relative quantity fluctuates and the SD of the gully producer’s accuracy is 0.0259 (Table 11), giving a more fluctuating gully producer’s accuracy than in Practice #1. This might be because the GLCM-derived local textures would interfere with the ResNet50’s contextual texture derivation process, and generate noise and then confuse the models, making it sometimes tend to extract more dark stripes as gullies, which would increase the gully producer’s accuracy, and sometimes tend to ignore real gullies that are similar to dark stripes, which would decrease the gully producer’s accuracy. In other words, the GLCM brings ambiguity, and this ambiguity is also clear to the wide irregularly shaped gully. The GLCM simultaneously gives very inhomogeneous variance values to a wide irregularly shaped gully, which makes the models come with a confusing classification strategy. They would still ignore a wide irregularly shaped gully and would also be misguided by the very inhomogeneous variance values in a wide irregularly shaped gully when identifying a narrow stripe-shaped gully. Although the GLCM ambiguity might be restrained by the inserted SE module to some extent, it is better to not introduce the GLCM to automatic gully extraction in the rolling-hilly region of the east of Songnen Plain.
In Practice #4 (Figure 15p–t), the false-positive and false-negative gullies also decrease notably compared to Practice #1, and show an equivalent accuracy compared to Practice #2. The models in Practices #2 and #4 learned a similar identification strategy, both to the common narrow stripe-shaped gully and scarce wide irregularly shaped gully. In addition, in Practice #4, the joint effect of optical bands and topographic–hydrologic features gives models a clearer big picture of the gully and background, and they are robust enough to counteract the ambiguity of GLCM features.
Temporally, the GF-2 satellite images on 10 October 2023 (post-rainy season) and other features were utilized to delineate gully labels and train models, and the R, G, B, and NIR bands and elevation difference, slope, and distance to waterflow verified their contribution to automatic gully extraction. The image date selection is determined by data availability and gully detectability. In the eastern part of Songnen Plain, during the autumn (post-rainy season), the image sources are relatively sufficient (cloud-free), and the harvested cultivated land surface is mainly light brown, while the gullies are always darker due to water accumulation; however, during the summer (rainy season), because of the constant cloud cover, there is a serious shortage of optical images. In addition, crops in cultivated land and the constant shrub covers in gullies tend to share similar spectral characteristics, the dense vegetation canopy makes it difficult to draw precise gully boundaries for training labels, and the importance of topographic–hydrologic features might be further highlighted. During the spring (pre-rainy season), the image quality is as high as that in the autumn, and images in later-April, May, and early June are preferred, because some wetter lands caused by melting snow would share a darker colour with the gullies in April, and crops and shrubs would turn green in June [60], which would influence the detection of a gully boundary. Spatially, this study is focused on the feature selection of automatic gully extraction in the eastern rolling-hilly region of Songnen Plain, China, where vegetation is lush. In the arid loess region, the vegetation cover is usually thin, slopes are steeper [68], and gullies are usually larger in size (sometimes to the valley level [69]), so the sunlight shadows caused by the slope aspect should be seriously treated in optical images, thus making the topographic–hydrologic features more important for automatic gully extraction, but the parameters applied to calculate topographic–hydrologic features should be suited to the gully scales in the arid loess region.
There are still several limitations to this study: (1) It focused on the performance comparison of models using various variables; although SE modules were custom-added to the ResNet50 architecture in DeepLabV3+ to dynamically suit the feature weights in gully extraction, the model accuracies may not be as high or ideal as previous studies that focused on higher-level algorithm innovation [28,70]. (2) Every pixel value in the automatically extracted result indicates its probability of being a gully, but in this binary classification model, the optimal classification threshold (maximizing the Kappa) was not exactly 0.5 as expected, but ranged around 0.5. This would lead to a fuzzy automatic gully extraction result when introducing the models to a totally blank region without reference gullies, indicating an important research direction for future studies.
6. Conclusions
This study constructed a new dataset to verify the effects of the GLCM and topographic–hydrologic features on automatic gully extraction in Dexiang Town, Bayan County, China, using the DeepLabV3+ and ResNet50 architectures.
(1) The dataset comprises a 200 km2 region with RGB, NIR bands, GLCM derived from GF-2 images, elevation difference, water accumulation, distance to waterflow derived from high-resolution DEM, and gully labels obtained by visual interpretation. The gully labels are homogeneously distributed in Dexiang Town, forming dendritic drainages with a total area of about 7,625,000 m2, and are convenient for m-row m-column d-band training sample generation with various custom sizes.
(2) Compared to Practice #1, solely combining topographic–hydrologic features with RGB and NIR bands would significantly improve the performance of models (Kappa by 5.03%, IOUGully by 4.97%), because topography and surface waterflow are the main causes of the gullies. Meanwhile, compared to Practice #1, solely combining GLCM features with the RGB and NIR bands would lower the accuracy of the models (Kappa by −6.02%, IOUGully by −5.44%), because GLCM features would deteriorate the ambiguity between the gully and background. Compared to Practice #1, the combination of RGB and NIR bands, GLCM features, and topographic–hydrologic features also significantly promotes the performance of models (Kappa by 4.60%, IOUGully by 4.63%), and the improvement is similar to Practice #2. The topographic–hydrologic features and RGB and NIR bands are optimal and robust variables for automatic gully extraction.
Author Contributions
Conceptualization, Z.C. and T.L.; methodology, Z.C.; software, Z.C. and T.L.; validation, Z.C.; formal analysis, Z.C. and T.L.; investigation, Z.C.; resources, Z.C. and T.L.; data curation, Z.C. and T.L.; writing—original draft preparation, Z.C.; writing—review and editing, T.L.; visualization, Z.C.; supervision, T.L.; project administration, Z.C. and T.L.; funding acquisition, T.L. All authors have read and agreed to the published version of the manuscript.
Funding
This research was funded by the Harbin Center for Integrated Natural Resources Survey, China Geological Survey, grant numbers DD20230517 and DD20242396, and the Northeast Geological S&T Innovation Center of China Geological Survey, grant number QCJJ2022-6. The APC was funded by the Harbin Center for Integrated Natural Resources Survey, China Geological Survey, grant number DD20230517.
Data Availability Statement
Data are unavailable due to privacy.
Acknowledgments
The authors thank reviewers for their constructive comments and instructions, and editors for their elaborative, patient assistance. The authors would also like to acknowledge USGS for the access to Landsat data, the China Aero Geophysical Remote Sensing Center for Natural Resources for providing GF-2 Level-1A imagery, and other institutions for providing DOM and DEM, which were all of great help.
Conflicts of Interest
The authors declare no conflicts of interest.
References
- Hussain, M.A.; Li, L.; Kalu, A.; Wu, X.; Naumovski, N. Sustainable food security and nutritional challenges. Sustainability 2025, 17, 874. [Google Scholar] [CrossRef]
- Papargyropoulou, E.; Ingram, J.; Poppy, G.M.; Quested, T.; Valente, C.; Jackson, L.A.; Hogg, T.; Achterbosch, T.; Sicuro, E.P.; Bryngelsson, S.; et al. Research framework for food security and sustainability. Npj Sci. Food 2025, 9, 13. [Google Scholar] [CrossRef] [PubMed]
- Montgomery, D.R. Soil security and global food security. Front. Agric. Sci. Eng. 2024, 11, 297–302. [Google Scholar] [CrossRef]
- Liu, Y.; Wang, C.; Wang, E.; Mao, X.; Liu, Y.; Hu, Z. Raster scale farmland productivity assessment with multi-source data fusion—A case of typical black soil region in Northeast China. Remote Sens. 2024, 16, 1435. [Google Scholar] [CrossRef]
- Shen, H.; Hu, W.; Che, X.; Li, C.; Liang, Y.; Wei, X. Assessment of effectiveness and suitability of soil and water conservation measures on hillslopes of the black soil region in Northeast China. Agronomy 2024, 14, 1755. [Google Scholar] [CrossRef]
- Li, Y.; Chen, Z.; Chen, Y.; Li, T.; Wang, C.; Li, C. Predicting the spatial distribution of soil organic carbon in the black soil area of Northeast Plain, China. Sustainability 2025, 17, 396. [Google Scholar] [CrossRef]
- Han, X.; Zou, W. Research perspectives and footprint of utilization and protection of black soil in Northeast China. Acta Pedol. Sin. 2021, 58, 1341–1358. [Google Scholar] [CrossRef]
- Kong, D.; Chu, N.; Luo, C.; Liu, H. Analyzing spatial distribution and influencing factors of soil organic matter in cultivated land of Northeast China, implications for black soil protection. Land 2024, 13, 1028. [Google Scholar] [CrossRef]
- Kang, L.; Wu, K. Impact of spatial evolution of cropland pattern on cropland suitability in black soil region of Northeast China, 1990–2020. Agronomy 2025, 15, 172. [Google Scholar] [CrossRef]
- Wu, Z.; Jiang, J.; Dong, W.; Cui, S. The spatiotemporal characteristics and driving factors of soil degradation in the black soil region of Northeast China. Agronomy 2024, 14, 2870. [Google Scholar] [CrossRef]
- Wang, H.; Yang, S.; Wang, Y.; Gu, Z.; Xiong, S.; Huang, X.; Sun, M.; Zhang, S.; Guo, L.; Cui, J.; et al. Rates and causes of black soil erosion in Northeast China. Catena 2022, 214, 106250. [Google Scholar] [CrossRef]
- Wang, T. Research on Characteristics and Influencing Factors of Soil Erosion in Bin County. Master’s Thesis, Northeast Agricultural University, Harbin, China, 2021. (In Chinese with English Abstract). [Google Scholar] [CrossRef]
- Liu, J.; Zhu, Y.; Li, J.; Kong, X.; Zhang, Q.; Wang, X.; Peng, D.; Zhang, X. Short-term artificial revegetation with herbaceous species can prevent soil degradation in a black soil erosion gully of Northeast China. Land 2024, 13, 1486. [Google Scholar] [CrossRef]
- Zhang, J.; Wang, M.; Liu, K.; Zhao, Z. Dynamic changes in soil erosion and challenges to grain productivity in the black soil region of Northeast China. Ecol. Indic. 2025, 171, 113145. [Google Scholar] [CrossRef]
- Vrieling, A.; Jong, S.M.D.; Sterk, G.; Rodrigues, S.C. Timing of erosion and satellite data, a multi-resolution approach to soil erosion risk mapping. Int. J. Appl. Earth Obs. Geoinf. 2008, 10, 267–281. [Google Scholar] [CrossRef]
- Wang, R.; Zhang, S.; Pu, L.; Yang, J.; Yang, C.; Chen, J.; Guan, C.; Wang, Q.; Chen, D.; Fu, B. Gully erosion mapping and monitoring at multiple scales based on multi-source remote sensing data of the Sancha River Catchment, Northeast China. ISPRS J. Int. Geo-Inf. 2016, 5, 200. [Google Scholar] [CrossRef]
- Yan, T.; Zhao, W.; Xu, F.; Shi, S.; Qin, W.; Zhang, G.; Fang, N. Is it reliable to extract gully morphology parameters based on high-resolution stereo images? a case of gully in a “soil-rock dual structure area”. Remote Sens. 2024, 16, 3500. [Google Scholar] [CrossRef]
- Zhang, C.; Wang, C.; Long, Y.; Pang, G.; Shen, H.; Wang, L.; Yang, Q. Comparative analysis of gully morphology extraction suitability using unmanned aerial vehicle and Google Earth imagery. Remote Sens. 2023, 15, 4302. [Google Scholar] [CrossRef]
- Zhang, J.; Zhang, Y.; Li, K.; Chen, C.; Liang, Y.; Yang, R. Accessing accuracy of extracting gully and ephemeral gully in the Songnen typical black soil region based on GF-7 satellite images. Sci. Soil Water Conserv. 2024, 22, 152–161, (In Chinese with English Abstract). [Google Scholar] [CrossRef]
- Chen, J. Study on Erosion Gully Extraction Technology Based on GF-7 Satellite. Master’s Thesis, Beijing Forestry University, Beijing, China, 2022. (In Chinese with English Abstract). [Google Scholar] [CrossRef]
- Bokaei, M.; Samadi, M.; Hadavand, A.; Moslem, A.P.; Soufi, M.; Bameri, A.; Sarvarinezhad, A. Gully extraction and mapping in Kajoo-Gargaroo watershed-comparative evaluation of DEM-based and image-based machine learning algorithm. ISPRS Ann. Photogramm. Remote Sens. Spat. Inf. Sci. 2022, X-4-W1-2022, 101–108. [Google Scholar] [CrossRef]
- Shelhamer, E.; Long, J.; Darrell, T. Fully convolutional networks for semantic segmentation. IEEE Trans. Pattern Anal. Mach. Intell. 2017, 39, 640–651. [Google Scholar] [CrossRef]
- Wang, Z.; Fan, B.; Tu, Z.; Li, H.; Chen, D. Cloud and snow identification based on DeepLabV3+and CRF combined model for GF-1WFV images. Remote Sens. 2022, 14, 4880. [Google Scholar] [CrossRef]
- Phinzi, K.; Abriha, D.; Bertalan, L.; Holb, I.; Szabó, S. Machine learning for gully feature extraction based on a pan-sharpened multispectral image, multiclass vs. binary approach. ISPRS Int. J. Geo-Inf. 2020, 9, 252. [Google Scholar] [CrossRef]
- Wang, B. Extraction and Risk Assessment of Erosion Gully in Black Soil Area of Northeast China. Ph.D. Thesis, University of Chinese Academy of Sciences, Beijing, China, 2022. (In Chinese with English Abstract). [Google Scholar] [CrossRef]
- Feng, Q.; Jiang, Z.; Niu, B.; Gao, B.; Yang, J.; Yang, K. Multiscale feature extraction model for remote sensing identification of erosion gullies in Northeast China’s black soil region, a case study of Hailun City. Natl. Remote Sens. Bull. 2024, 28, 3147–3157, (In Chinese with English Abstract). [Google Scholar] [CrossRef]
- Chen, C.; Zhang, Y.; Li, K.; Yang, R.; Zhang, J.; Liang, Y. A method of automatic mapping of gullies based on GF-7 satellite image in the black soil region in Northeast China. Bull. Surv. Mapp. 2024, 1–7, (In Chinese with English abstract). [Google Scholar] [CrossRef]
- Shen, Y.; Su, N.; Zhao, C.; Yan, Y.; Feng, S.; Liu, Y.; Xiang, W. A foreground-driven fusion network for gully erosion extraction utilizing UAV orthoimages and digital surface models. IEEE Trans. Geosci. Remote Sens. 2024, 62, 4409116. [Google Scholar] [CrossRef]
- Krizhevsky, A.; Sutskever, I.; Hinton, G.E. ImageNet classification with deep convolutional neural networks. Commun. ACM 2017, 60, 84–90. [Google Scholar] [CrossRef]
- Chen, Y.; Jiang, H.; Li, C.; Jia, X.; Ghamisi, P. Deep feature extraction and classification of hyperspectral images based on convolutional neural networks. IEEE Trans. Geosci. Remote Sens. 2016, 54, 6232–6251. [Google Scholar] [CrossRef]
- Tu, F.; Yin, S.; Ouyang, P.; Tang, S.; Liu, L.; Wei, S. Deep convolutional neural network architecture with reconfigurable computation patterns. IEEE Trans. Very Large Scale Integr. (VLSI) Syst. 2017, 25, 2220–2233. [Google Scholar] [CrossRef]
- Krichen, M. Convolutional neural networks. Computers 2023, 12, 151. [Google Scholar] [CrossRef]
- He, K.; Zhang, X.; Ren, S.; Sun, J. Deep residual learning for image recognition. In Proceedings of the 2016 IEEE Conference on Computer Vision and Pattern Recognition (CVPR), Las Vegas, NV, USA, 27–30 June 2016. [Google Scholar] [CrossRef]
- Gao, S.; Liang, H.; Hu, D.; Hu, X.; Lin, E.; Huang, H. SAM-ResNet50, a deep learning model for the identification and classification of drought stress in the seedling stage of betula luminifera. Remote Sens. 2024, 16, 4141. [Google Scholar] [CrossRef]
- Stateczny, A.; Uday Kiran, G.; Bindu, G.; Ravi Chythanya, K.; Ayyappa Swamy, K. Spiral search grasshopper features selection with VGG19-ResNet50 for remote sensing object detection. Remote Sens. 2022, 14, 5398. [Google Scholar] [CrossRef]
- Ravula, A.K.; Kovvur, R.M.R. Optimizing deep residual networks, incorporating separable convolutions into ResNet50 architecture. Int. J. Commun. Netw. Inf. Secur. 2024, 16, 108–116. [Google Scholar]
- Ma, J.; Shi, D.; Tang, X.; Zhang, X.; Jiao, L. Dual modality collaborative learning for cross-source remote sensing retrieval. Remote Sens. 2022, 14, 1319. [Google Scholar] [CrossRef]
- Anwer, R.M.; Khan, F.S.; Van De Weijer, J.; Molinier, M.; Laaksonen, J. Binary patterns encoded convolutional neural networks for texture recognition and remote sensing scene classification. ISPRS J. Photogramm. Remote Sens. 2018, 138, 74–85. [Google Scholar] [CrossRef]
- Zhang, X.; Wang, G.; Zhu, P.; Zhang, T.; Li, C.; Jiao, L. GRS-Det, an anchor-free rotation ship detector based on Gaussian-mask in remote sensing images. IEEE Trans. Geosci. Remote Sens. 2020, 59, 3518–3531. [Google Scholar] [CrossRef]
- Chen, L.; Zhu, Y.; Papandreou, G.; Schroff, F.; Adam, H. Encoder-decoder with atrous separable convolution for semantic image segmentation. In Proceedings of the Computer Vision-ECCV 2018, Munich, Germany, 8–14 September 2018. [Google Scholar] [CrossRef]
- Wang, C.; Zhang, R.; Chang, L. A study on the dynamic effects and ecological stress of eco-environment in the headwaters of the Yangtze River based on improved DeepLabV3+ Network. Remote Sens. 2022, 14, 2225. [Google Scholar] [CrossRef]
- Zheng, K.; Wang, H.; Qin, F.; Miao, C.; Han, Z. An improved land use classification method based on DeepLabV3+ under GauGAN data enhancement. IEEE J. Sel. Top. Appl. Earth Obs. Remote Sens. 2023, 16, 5526–5537. [Google Scholar] [CrossRef]
- Wieland, M.; Martinis, S.; Kiefl, R.; Gstaiger, V. Semantic segmentation of water bodies in very high-resolution satellite and aerial images. Remote Sens. Environ. 2023, 287, 113452. [Google Scholar] [CrossRef]
- Sun, Y.; Hao, Z.; Guo, Z.; Liu, Z.; Huang, J. Detection and mapping of Chestnut using deep learning from high-resolution UAV-based RGB imagery. Remote Sens. 2023, 15, 4923. [Google Scholar] [CrossRef]
- Sussi; Husni, E.; Yusuf, R.; Harto, A.B.; Suwardhi, D.; Siburian, A. Utilization of improved annotations from object-based image analysis as training data for DeepLabV3+ model, a focus on road extraction in very high-resolution orthophotos. IEEE Access 2024, 12, 67910–67923. [Google Scholar] [CrossRef]
- Lan, Z.; Liu, Y. Study on multi-scale window determination for GLCM texture description in high-resolution remote sensing image geo-analysis supported by GIS and domain knowledge. ISPRS Int. J. Geo-Inf. 2018, 7, 175. [Google Scholar] [CrossRef]
- Iqbal, N.; Mumtaz, R.; Shafi, U.; Zaidi, S.M.H. Gray level co-occurrence matrix (GLCM) texture based crop classification using low altitude remote sensing platforms. PeerJ Comput. Sci. 2021, 19, e536. [Google Scholar] [CrossRef] [PubMed]
- Hu, Y.; Qi, Z.; Zhou, Z.; Qin, Y. Detection of benggang in remote sensing imagery through integration of segmentation anything model with object-based classification. Remote Sens. 2024, 16, 428. [Google Scholar] [CrossRef]
- Ciccolini, U.; Bufalini, M.; Materazzi, M.; Dramis, F. Gully erosion development in drainage basins, a new morphometric approach. Land 2024, 13, 792. [Google Scholar] [CrossRef]
- Liu, C.; Fan, H. Research advances and prospects on gully erosion susceptibility assessment based on statistical modeling. Trans. Chin. Soc. Agric. Eng. 2024, 40, 29–40, (In Chinese with English Abstract). [Google Scholar] [CrossRef]
- Guan, Q.; Tong, Z.; Arabameri, A.; Santosh, M.; Mondal, I. Scrutinizing gully erosion hotspots to predict gully erosion susceptibility using ensemble learning framework. Adv. Space Res. 2024, 74, 2941–2957. [Google Scholar] [CrossRef]
- Wilkinson, S.N.; Rutherfurd, I.D.; Brooks, A.P.; Bartley, R. Achieving change through gully erosion research. Earth Surf. Process Landf. 2024, 49, 49–57. [Google Scholar] [CrossRef]
- Liu, P.; Wang, C.; Ye, M.; Han, R. Coastal zone classification based on U-net and remote sensing. Appl. Sci. 2024, 14, 7050. [Google Scholar] [CrossRef]
- Chen, Z.; Liu, T.; Yang, K.; Li, Y. Spatial temporal patterns of ecological-environmental attributes within different geological topographical zones, a case from Hailun District, Heilongjiang Province, China. Front. Environ. Sci. 2024, 12, 1393031. [Google Scholar] [CrossRef]
- Zheng, H.; Du, P.; Chen, J.; Xia, J.; Li, E.; Xu, Z.; Li, X.; Yokoya, N. Performance evaluation of downscaling sentinel-2 imagery for land use and land cover classification by spectral-spatial features. Remote Sens. 2017, 9, 1274. [Google Scholar] [CrossRef]
- Yang, M.; Hu, Y.; Tian, H.; Khan, F.A.; Liu, Q.; Goes, J.I.; Gomes, H.d.R.; Kim, W. Atmospheric correction of airborne hyperspectral CASI data using Polymer, 6S and FLAASH. Remote Sens. 2021, 13, 5062. [Google Scholar] [CrossRef]
- Zubair, A.R.; Alo, O.A. Grey level co-occurrence matrix (GLCM) based second order statistics for image texture analysis. Int. J. Sci. Eng. Investig. 2019, 8, 64–73. [Google Scholar] [CrossRef]
- Shi, C.; Zhang, Q.; Liu, Z.; Sun, F. A micro-motion jamming classification and recognition method based on grey-level co-occurrence matrix. J. Air Force Eng. Univ. 2022, 23, 35–42. Available online: http://kjgcdx.ijournal.cn/kjgcdxxb/article/pdf/20220406 (accessed on 17 July 2025). (In Chinese with English Abstract).
- Wang, D.; Wu, Y.; Wei, J.; Zhao, X.; Zhang, H.; Zhu, C.; Yuan, A. Fracture dynamic evolution features of a coal-containing gas based on gray level co-occurrence matrix and industrial CT scanning. Chin. J. Eng. 2023, 45, 31–43, (In Chinese with English Abstract). [Google Scholar] [CrossRef]
- Rumman, A.H.; Barua, K.; Monju, S.I.; Hasan Abed, M.R.; Tan-Ema, S.J.; Sharab, J.F.; Ahmed, S. Classification of CoCr-based magnetic thin films via GLCM texture features extracted from EFTEM images and machine learning. AIP Adv. 2024, 14, 115017. [Google Scholar] [CrossRef]
- Hu, J.; Shen, L.; Albanie, S.; Sun, G.; Wu, E. Squeeze-and-excitation networks. IEEE Trans. Pattern Anal. Mach. Intell. 2020, 42, 2011–2023. [Google Scholar] [CrossRef] [PubMed]
- Rezaei-Dastjerdehei, M.; Mijani, A.; Fatemizadeh, E. Addressing imbalance in multi-label classification using weighted cross entropy loss function. In Proceedings of the 27th National and 5th International Iranian Conference on Biomedical Engineering, Tehran, Iran, 26–27 November 2020; pp. 333–338. [Google Scholar] [CrossRef]
- Yao, C.; Lv, D.; Li, H.; Fu, J.; Li, C.; Gao, X.; Hong, D. A real-time crop lodging recognition method for combine harvesters based on machine vision and modified DeepLabV3+. Smart Agric. Technol. 2025, 11, 100926. [Google Scholar] [CrossRef]
- Markoulidakis, I.; Rallis, I.; Georgoulas, I.; Kopsiaftis, G.; Doulamis, A.; Doulamis, N. Multiclass confusion matrix reduction method and its Application on net promoter score classification problem. Technologies 2021, 9, 81. [Google Scholar] [CrossRef]
- Chunhabundit, P.; Arayapisit, T.; Srimaneekarn, N. Sex prediction from human tooth dimension by ROC curve analysis, a preliminary study. Sci. Rep. 2025, 15, 6627. [Google Scholar] [CrossRef]
- De Raadt, A.; Warrens, M.J.; Bosker, R.J.; Kiers, H.A.L. Kappa coefficients for missing data. Educ. Psychol. Meas. 2019, 79, 558–576. [Google Scholar] [CrossRef]
- Singh, R.; Biswas, M.; Pal, M. Cloud detection using sentinel 2 imageries: A comparison of XGBoost, RF, SVM, and CNN algorithms. Geocarto Int. 2022, 38, 1–32. [Google Scholar] [CrossRef]
- Wang, Z.; Zhang, G.; Wang, C.; Xing, S. Gully morphological characteristics and topographic threshold determined by UAV in a small watershed on the Loess Plateau. Remote Sens. 2022, 14, 3529. [Google Scholar] [CrossRef]
- Na, J.; Yang, X.; Tang, G.; Dang, W.; Strobl, J. Population characteristics of loess gully system in the Loess Plateau of China. Remote Sens. 2020, 12, 2639. [Google Scholar] [CrossRef]
- Zhao, C.; Shen, Y.; Su, N.; Yan, Y.; Feng, S.; Xiang, W.; Liu, Y.; Zhao, T. A label correction learning framework for gully erosion extraction using high-resolution remote sensing images and noisy labels. IEEE J. Sel. Top. Appl. Earth Obs. Remote Sens. 2024, 17, 1638–1655. [Google Scholar] [CrossRef]
Disclaimer/Publisher’s Note: The statements, opinions and data contained in all publications are solely those of the individual author(s) and contributor(s) and not of MDPI and/or the editor(s). MDPI and/or the editor(s) disclaim responsibility for any injury to people or property resulting from any ideas, methods, instructions or products referred to in the content. |
© 2025 by the authors. Licensee MDPI, Basel, Switzerland. This article is an open access article distributed under the terms and conditions of the Creative Commons Attribution (CC BY) license (https://creativecommons.org/licenses/by/4.0/).


