
Minding Spatial Allocation Entropy: Sentinel-2 Dense Time Series Spectral Features Outperform Vegetation Indices to Map Desert Plant Assemblages

Abstract
1. Introduction
2. Materials and Methods
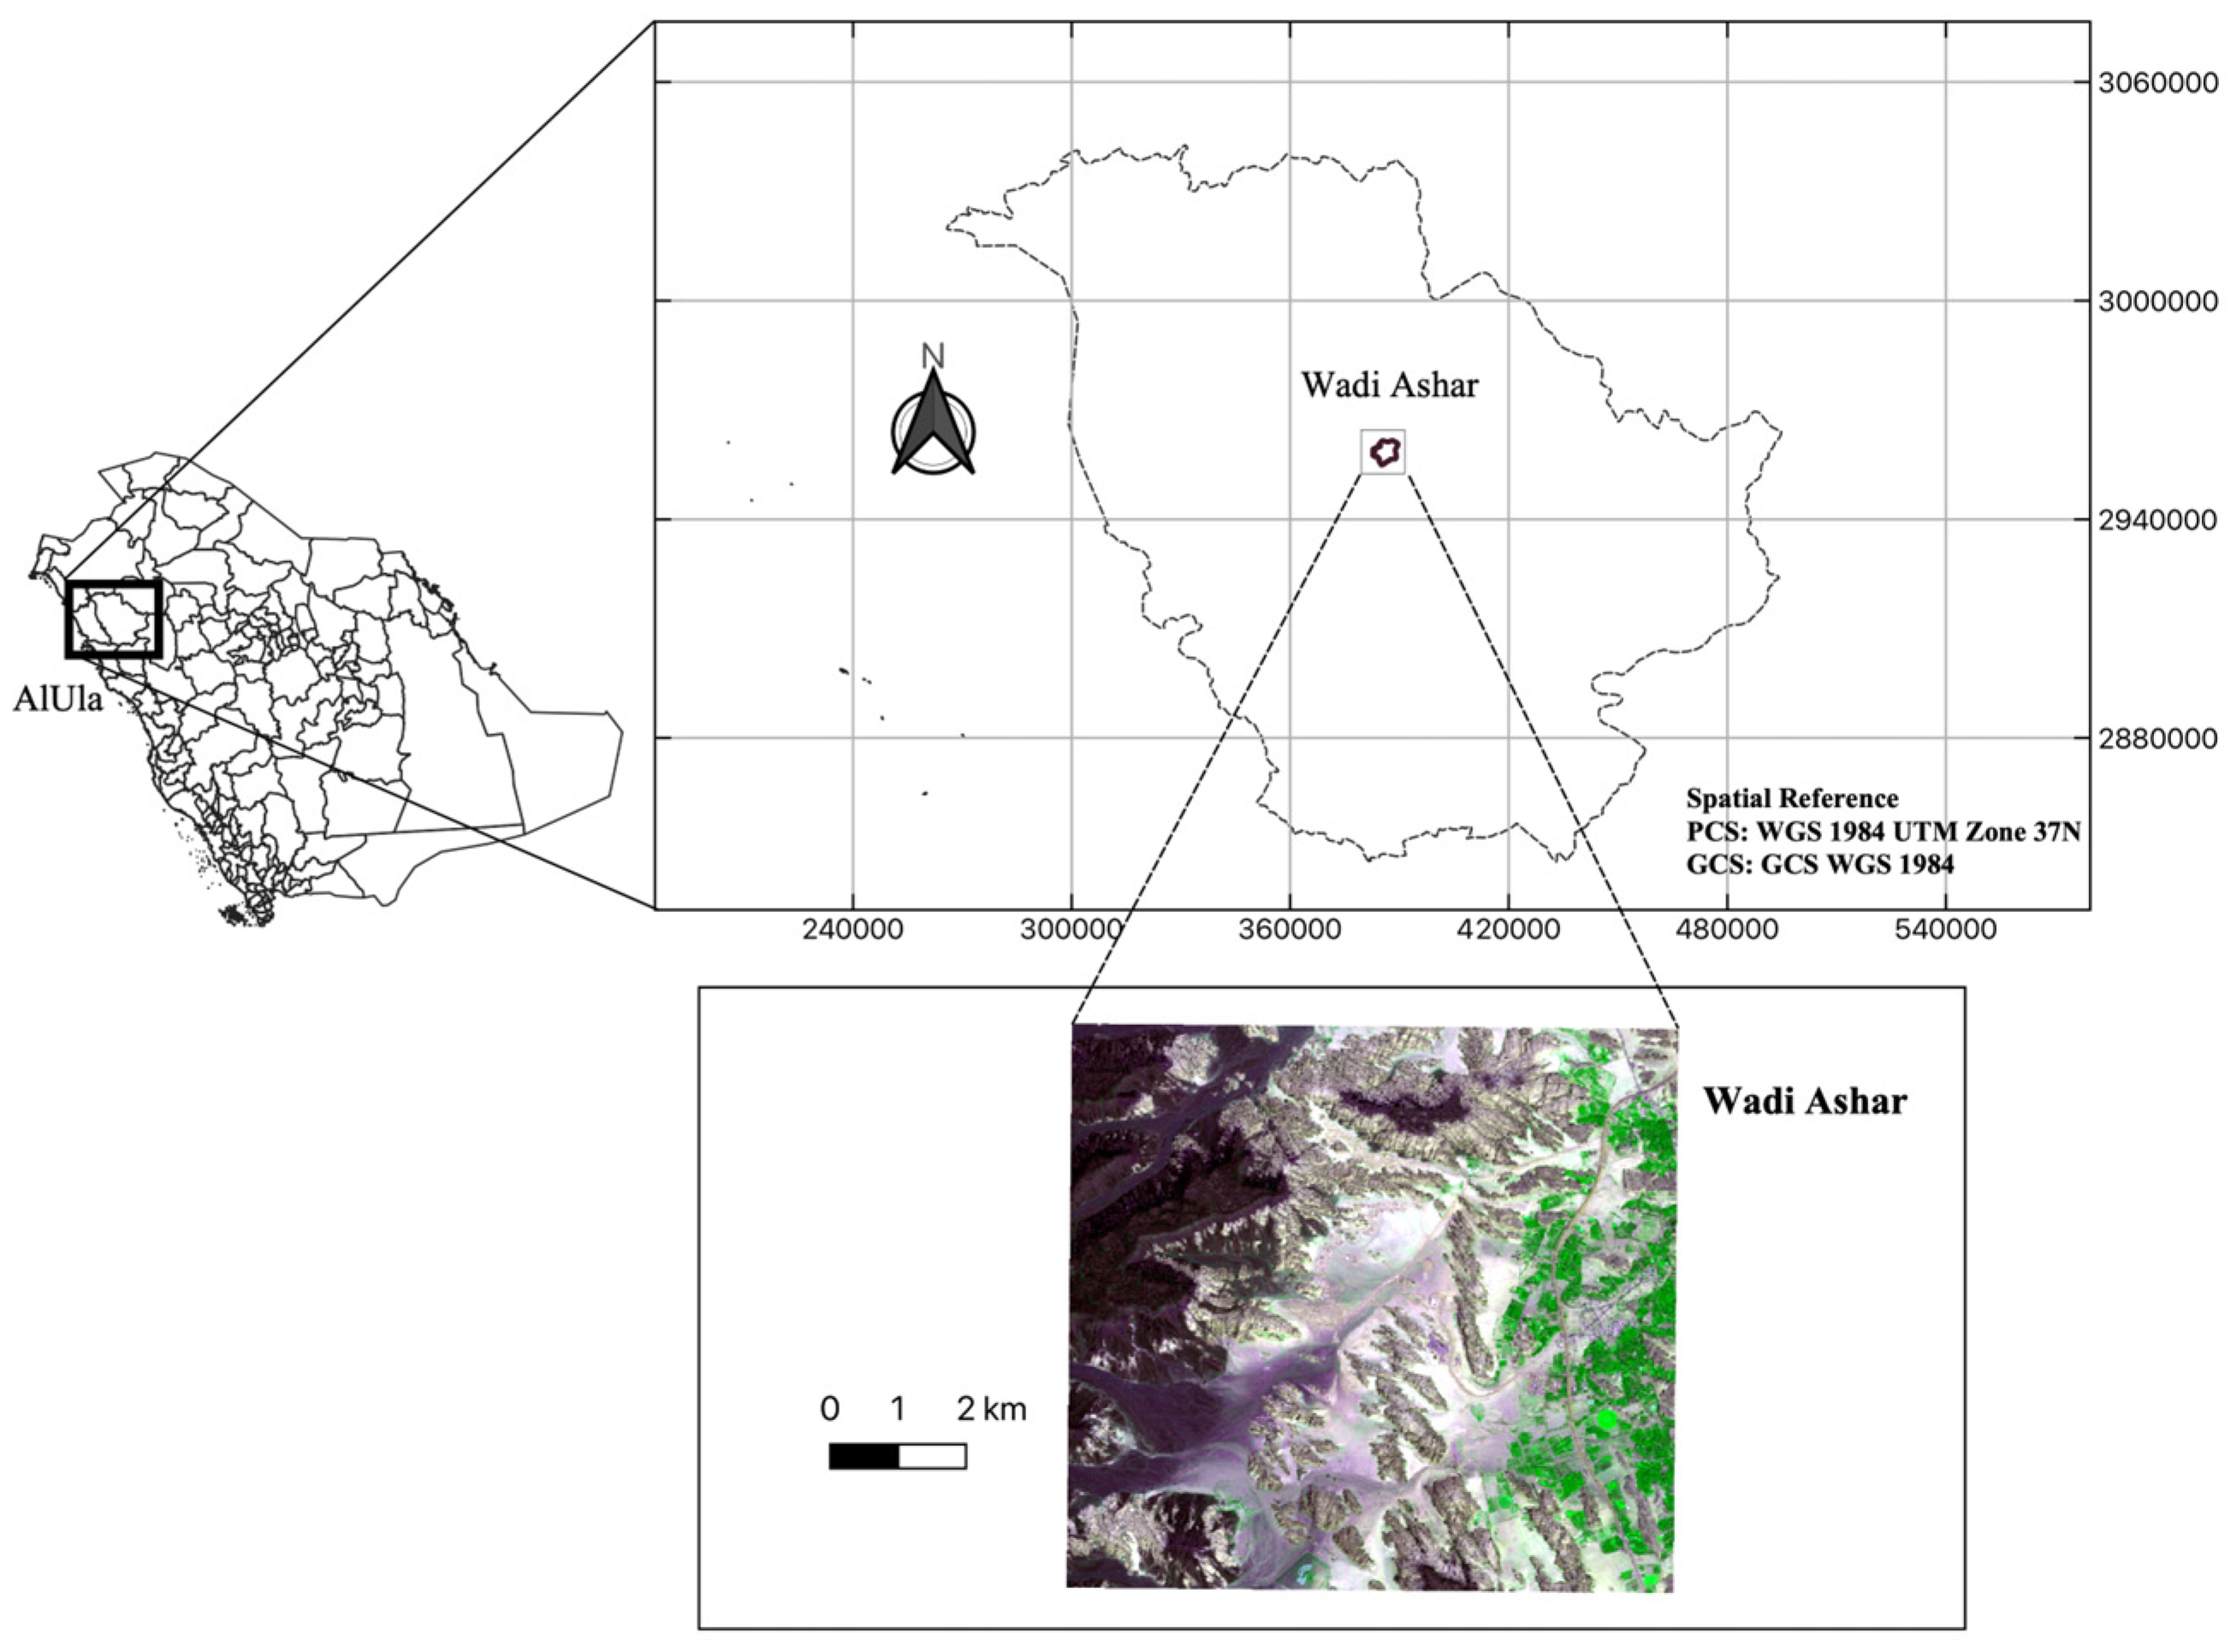
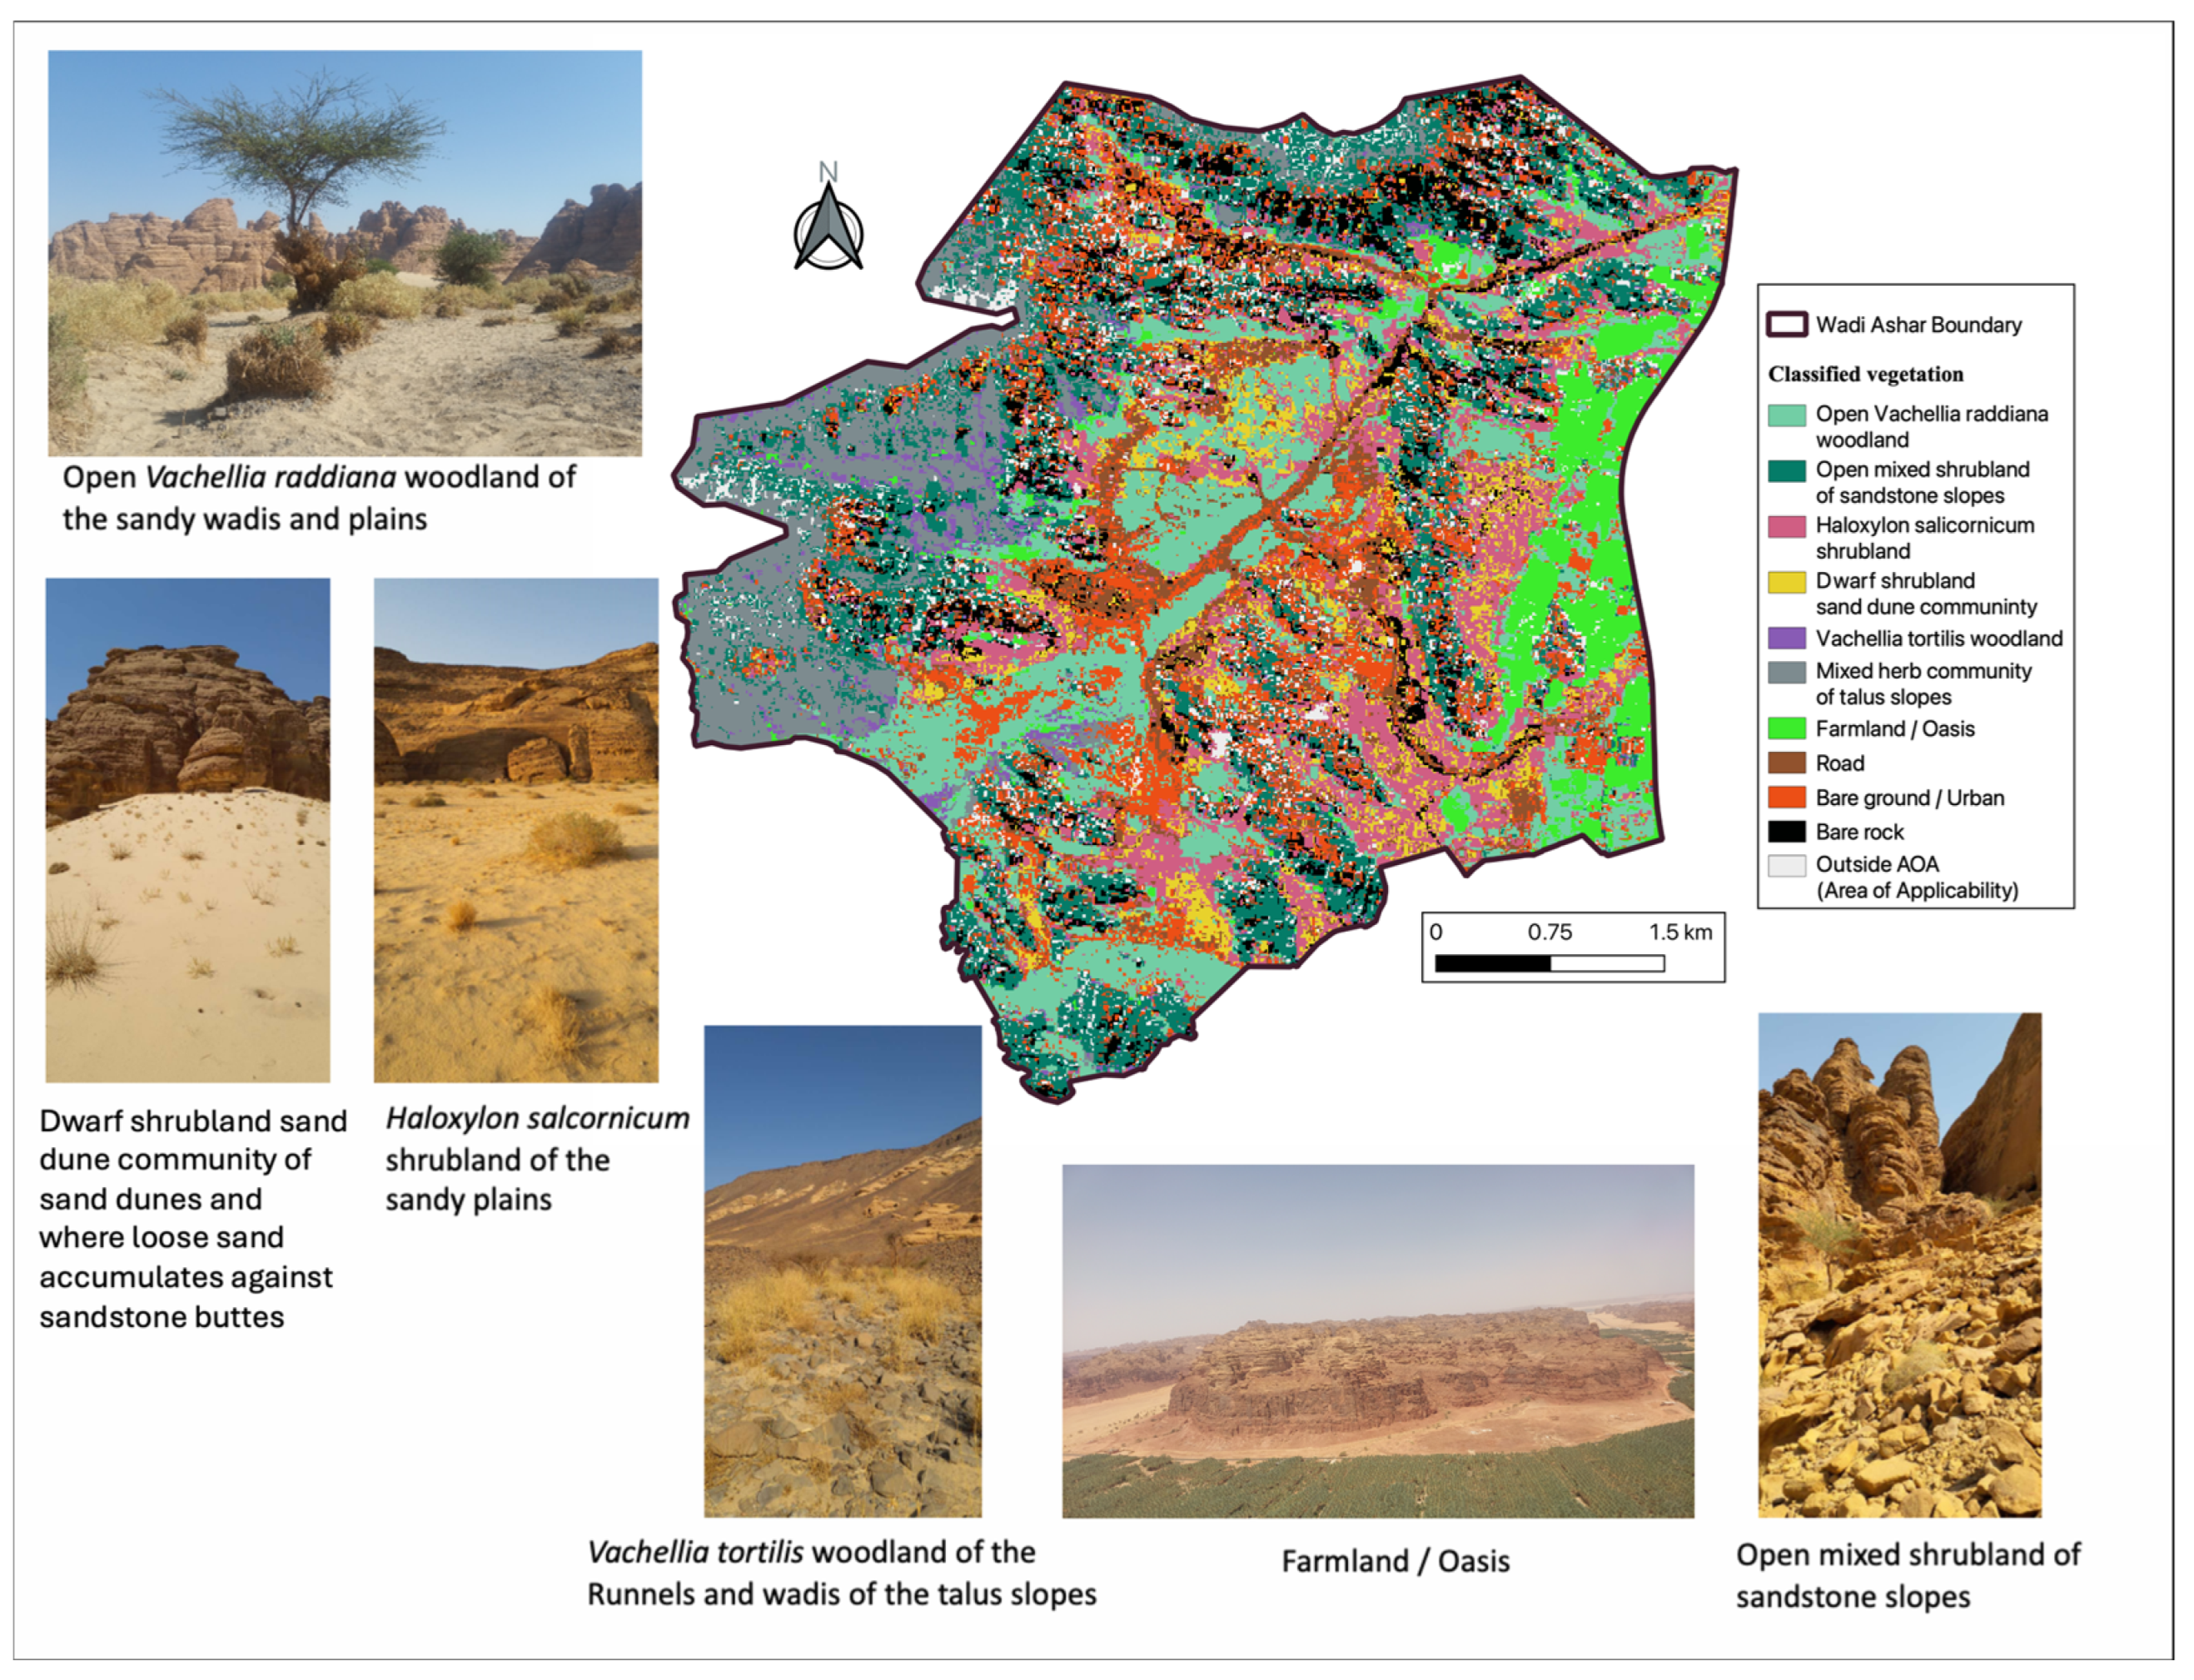
2.1. Study Area
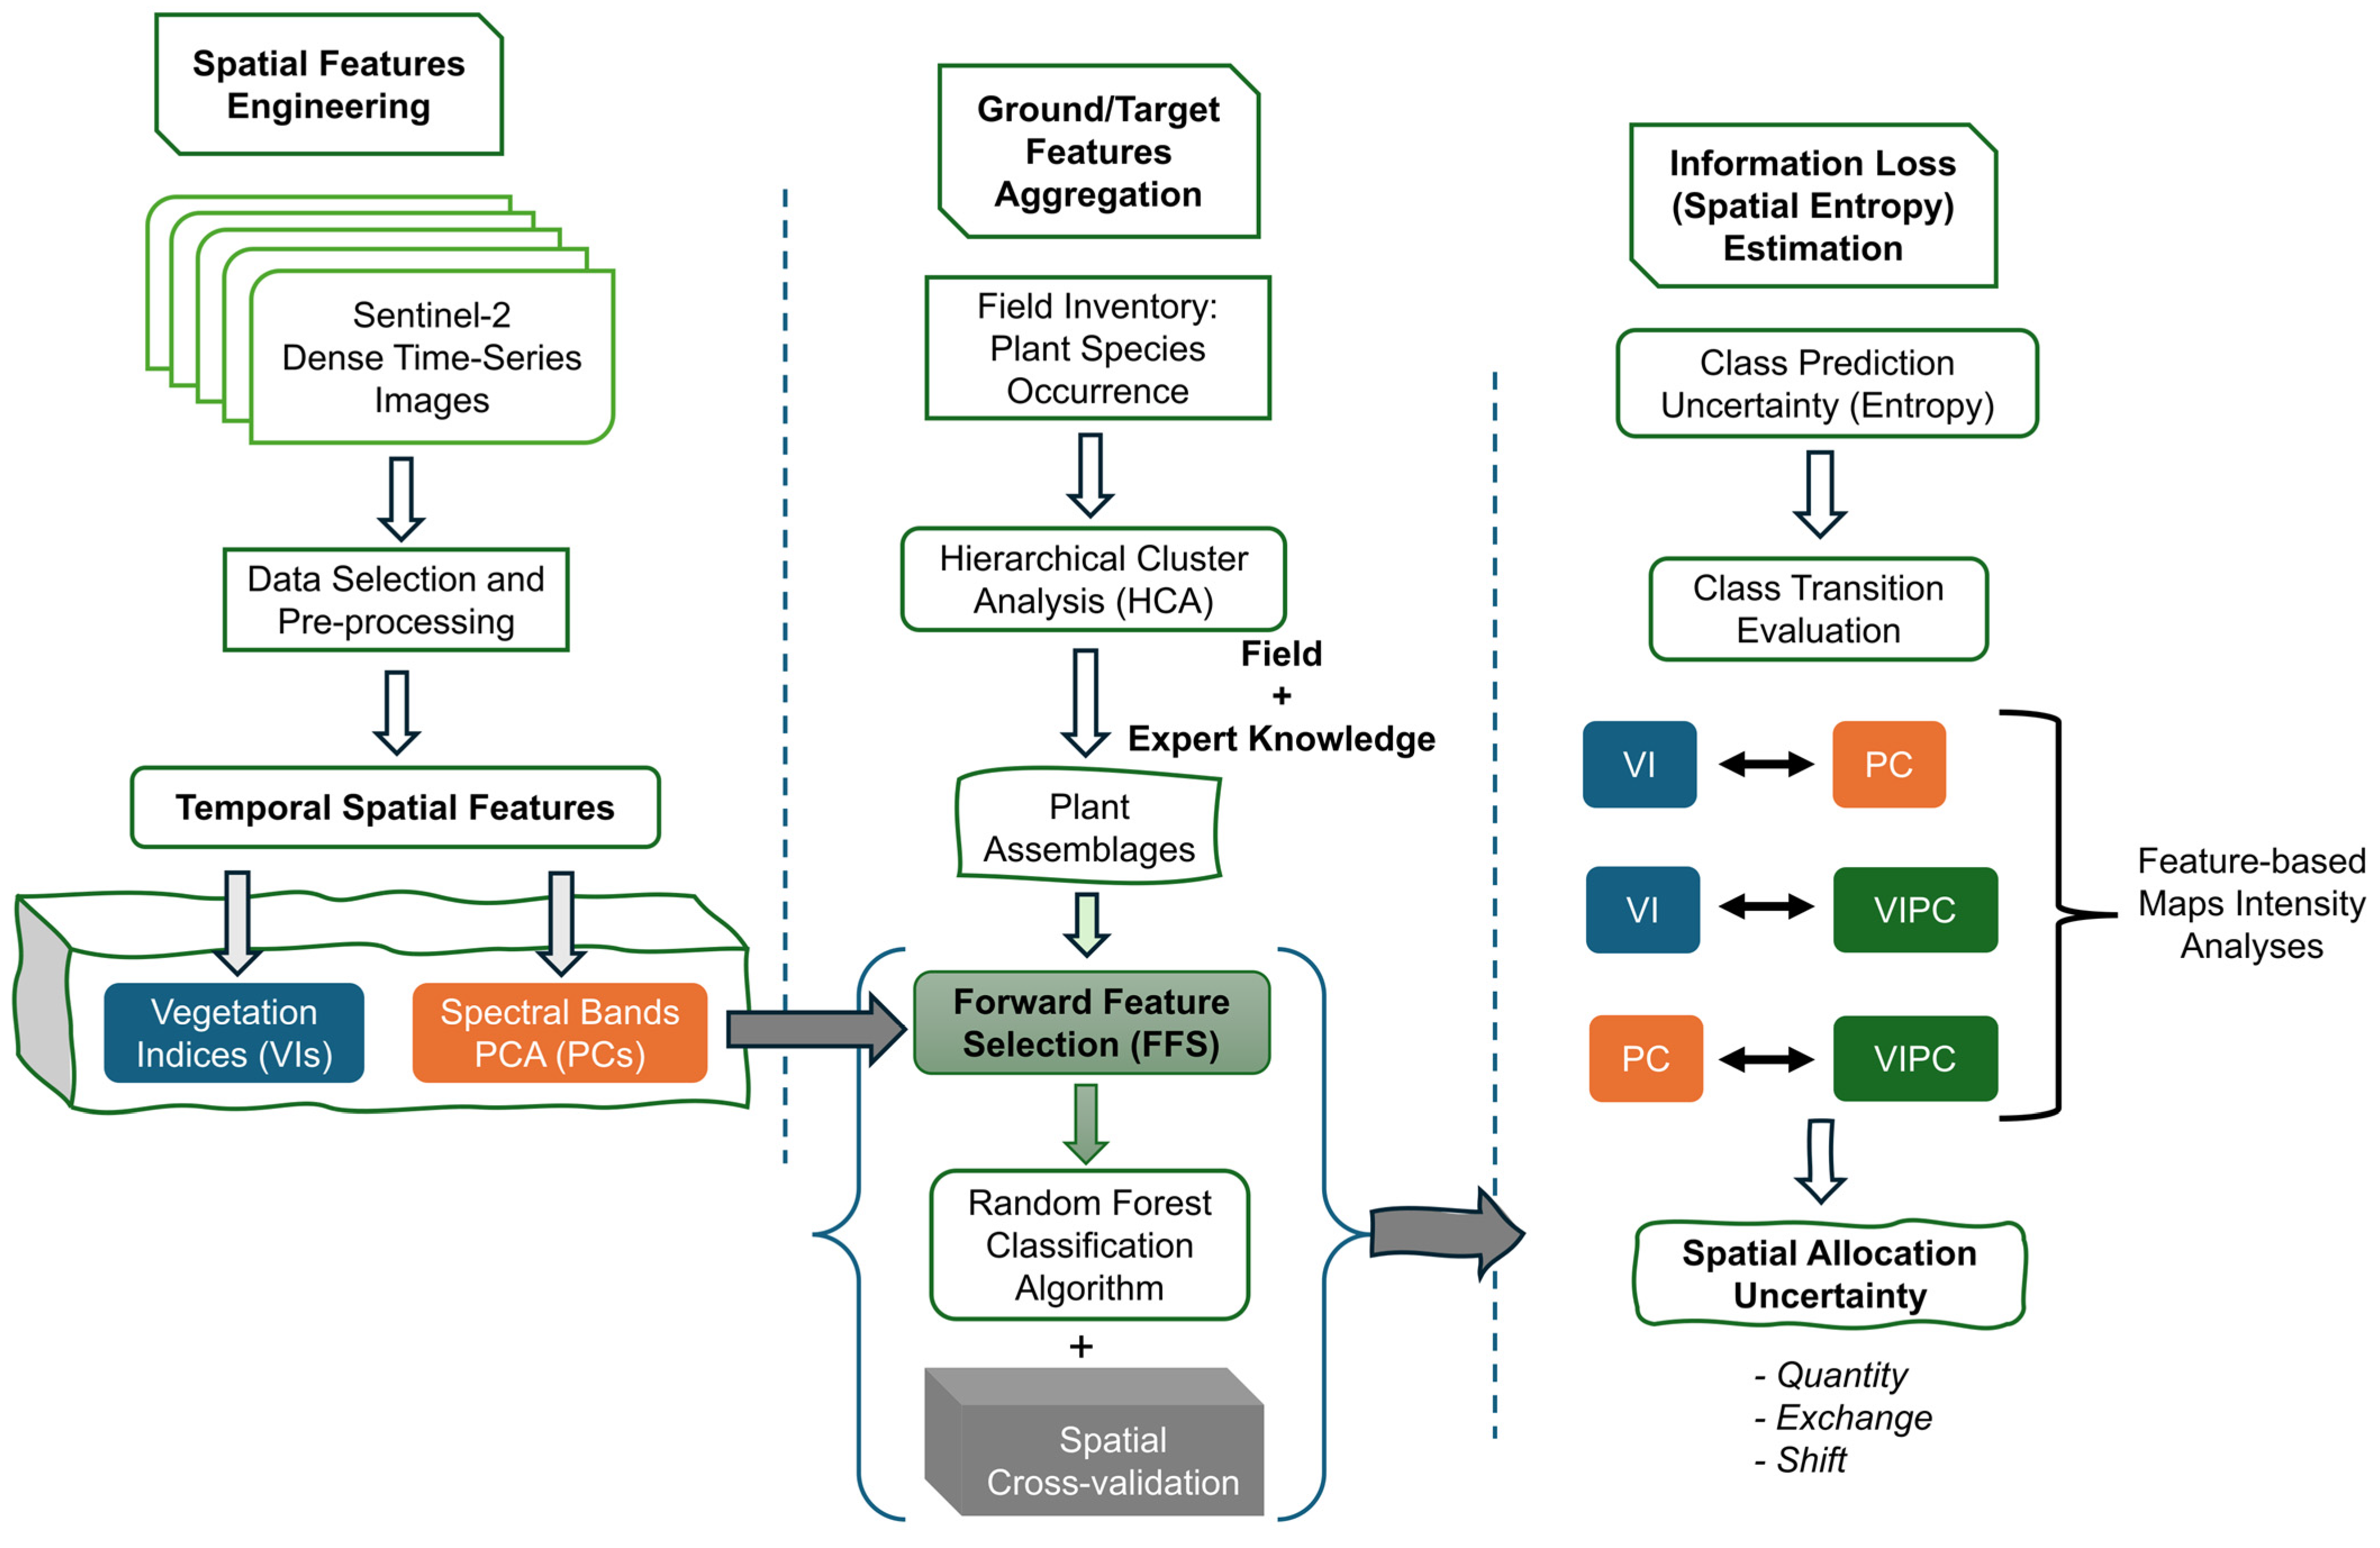
2.2. Vegetation Classification and Mapping
2.2.1. Plant Survey (Field) Data
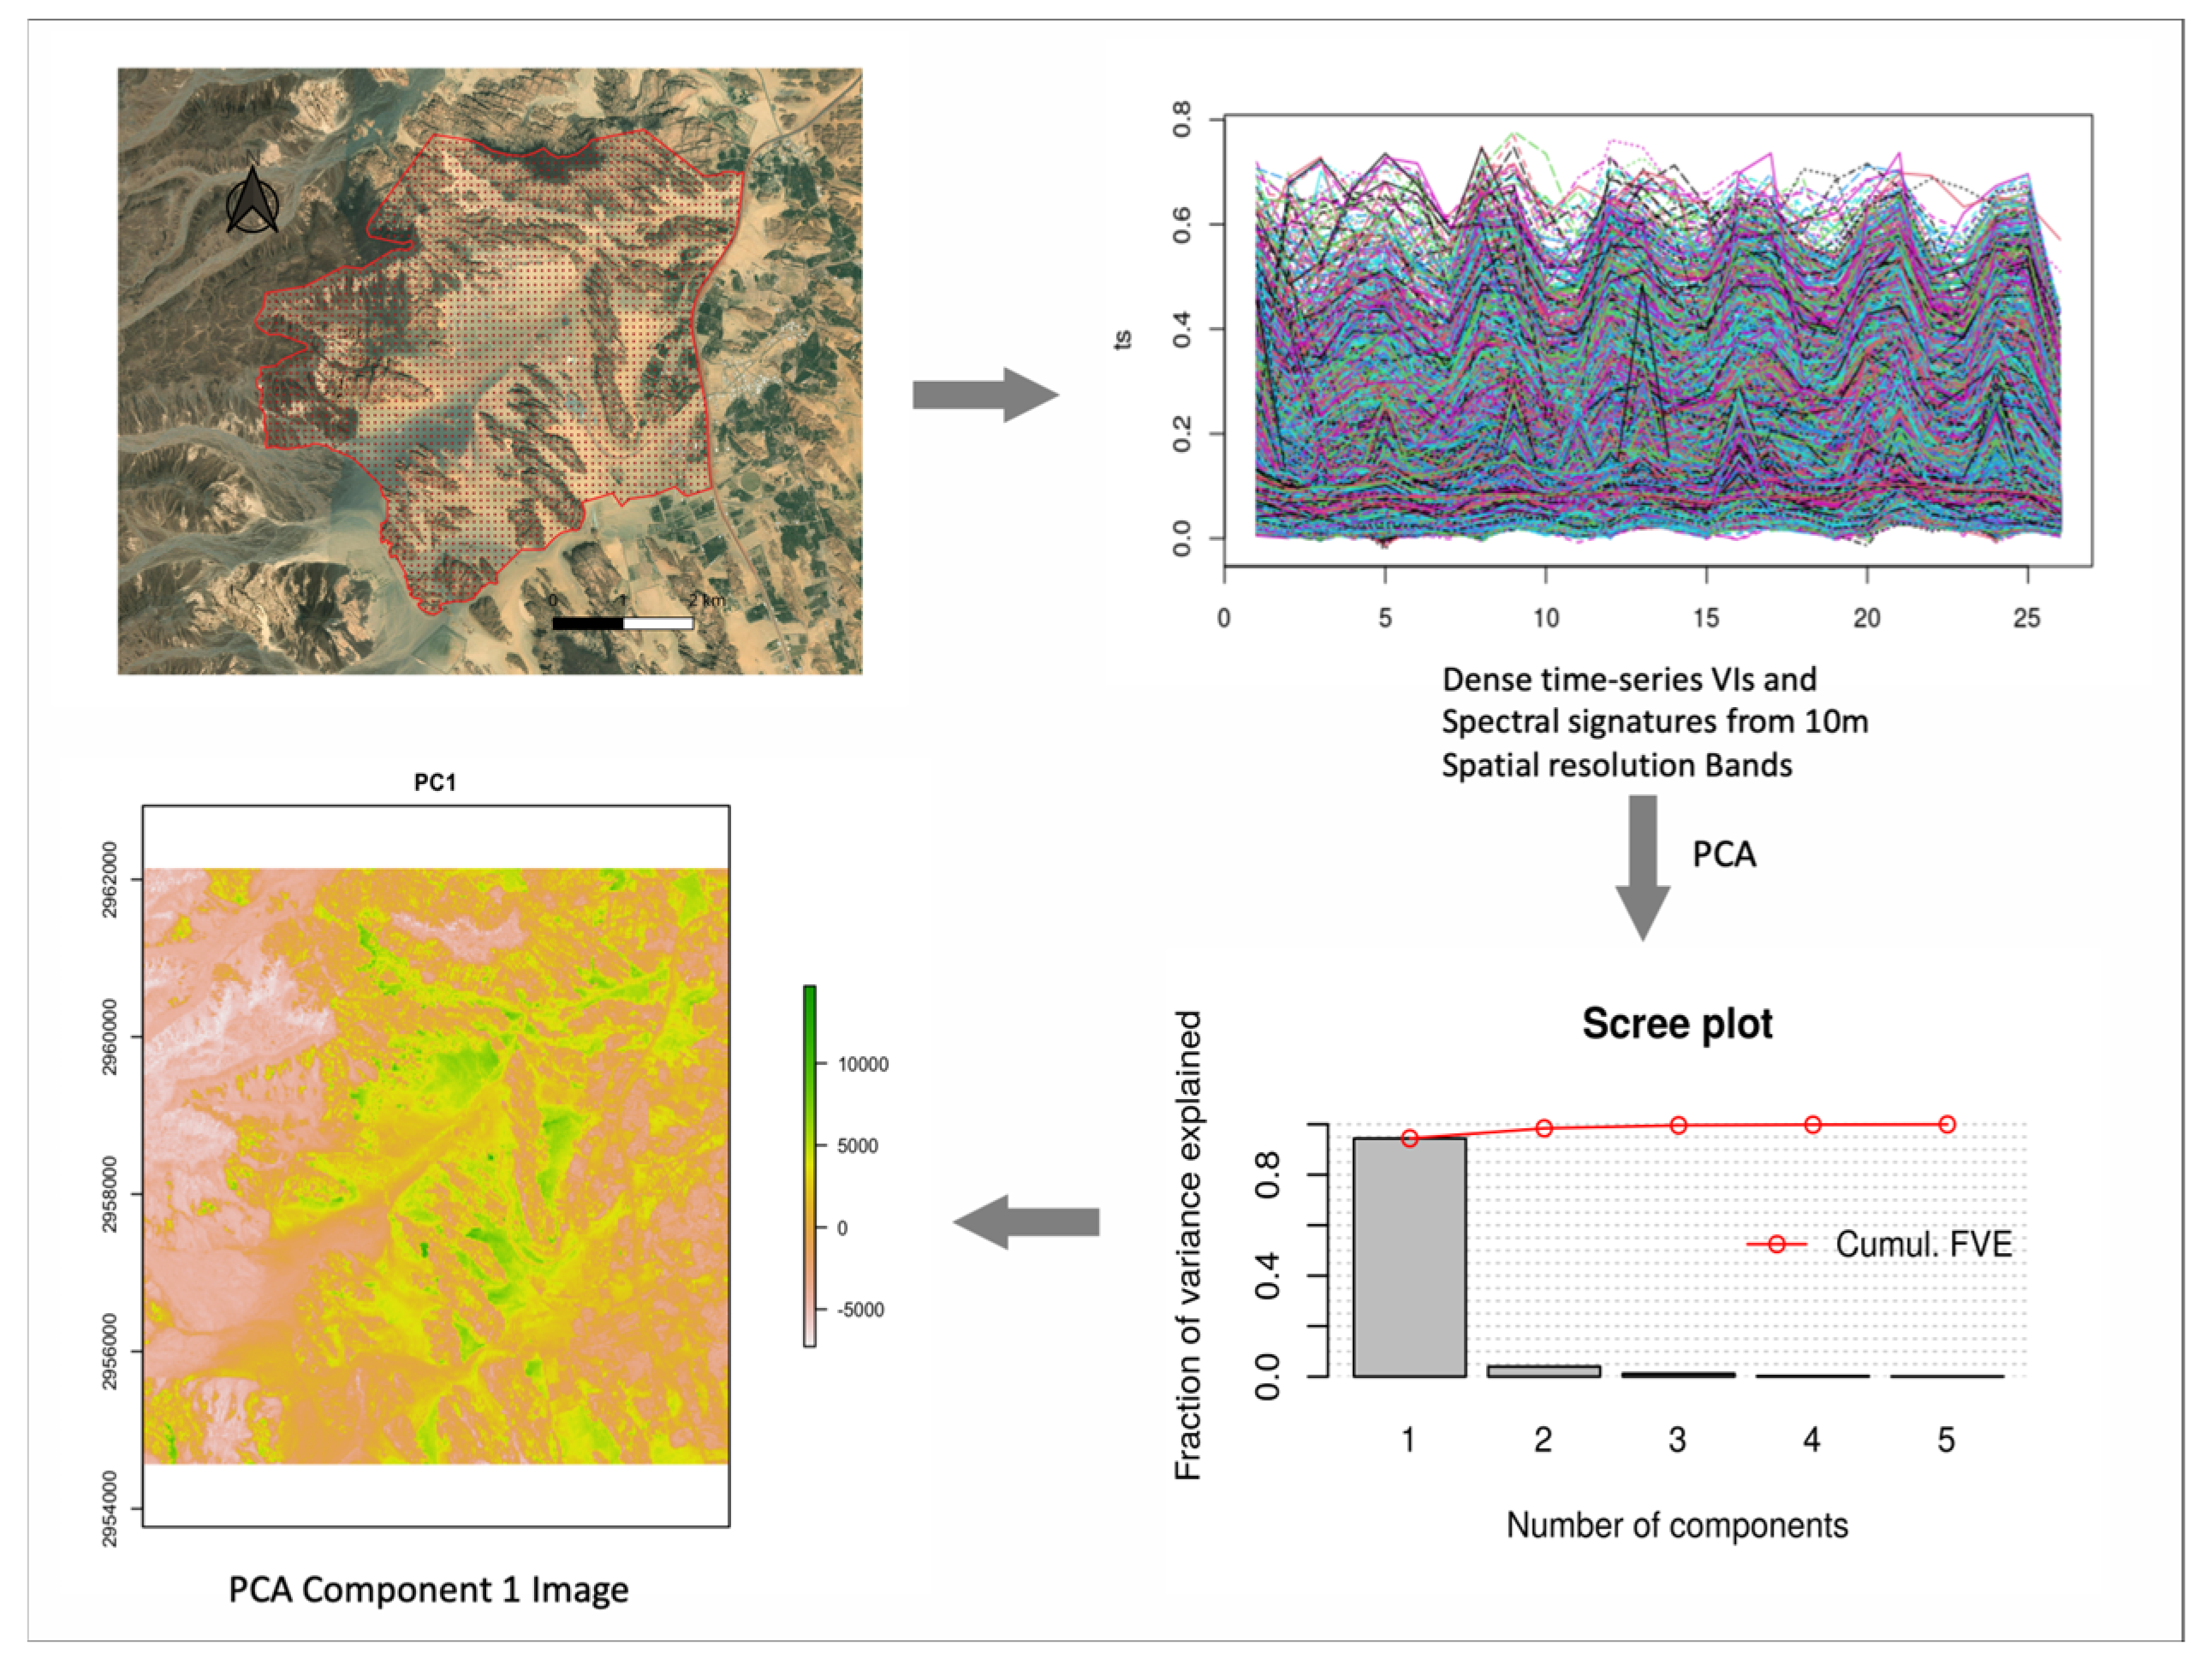
2.2.2. Spatial Data and Processing
2.2.3. Vegetation Type Classification and Validation
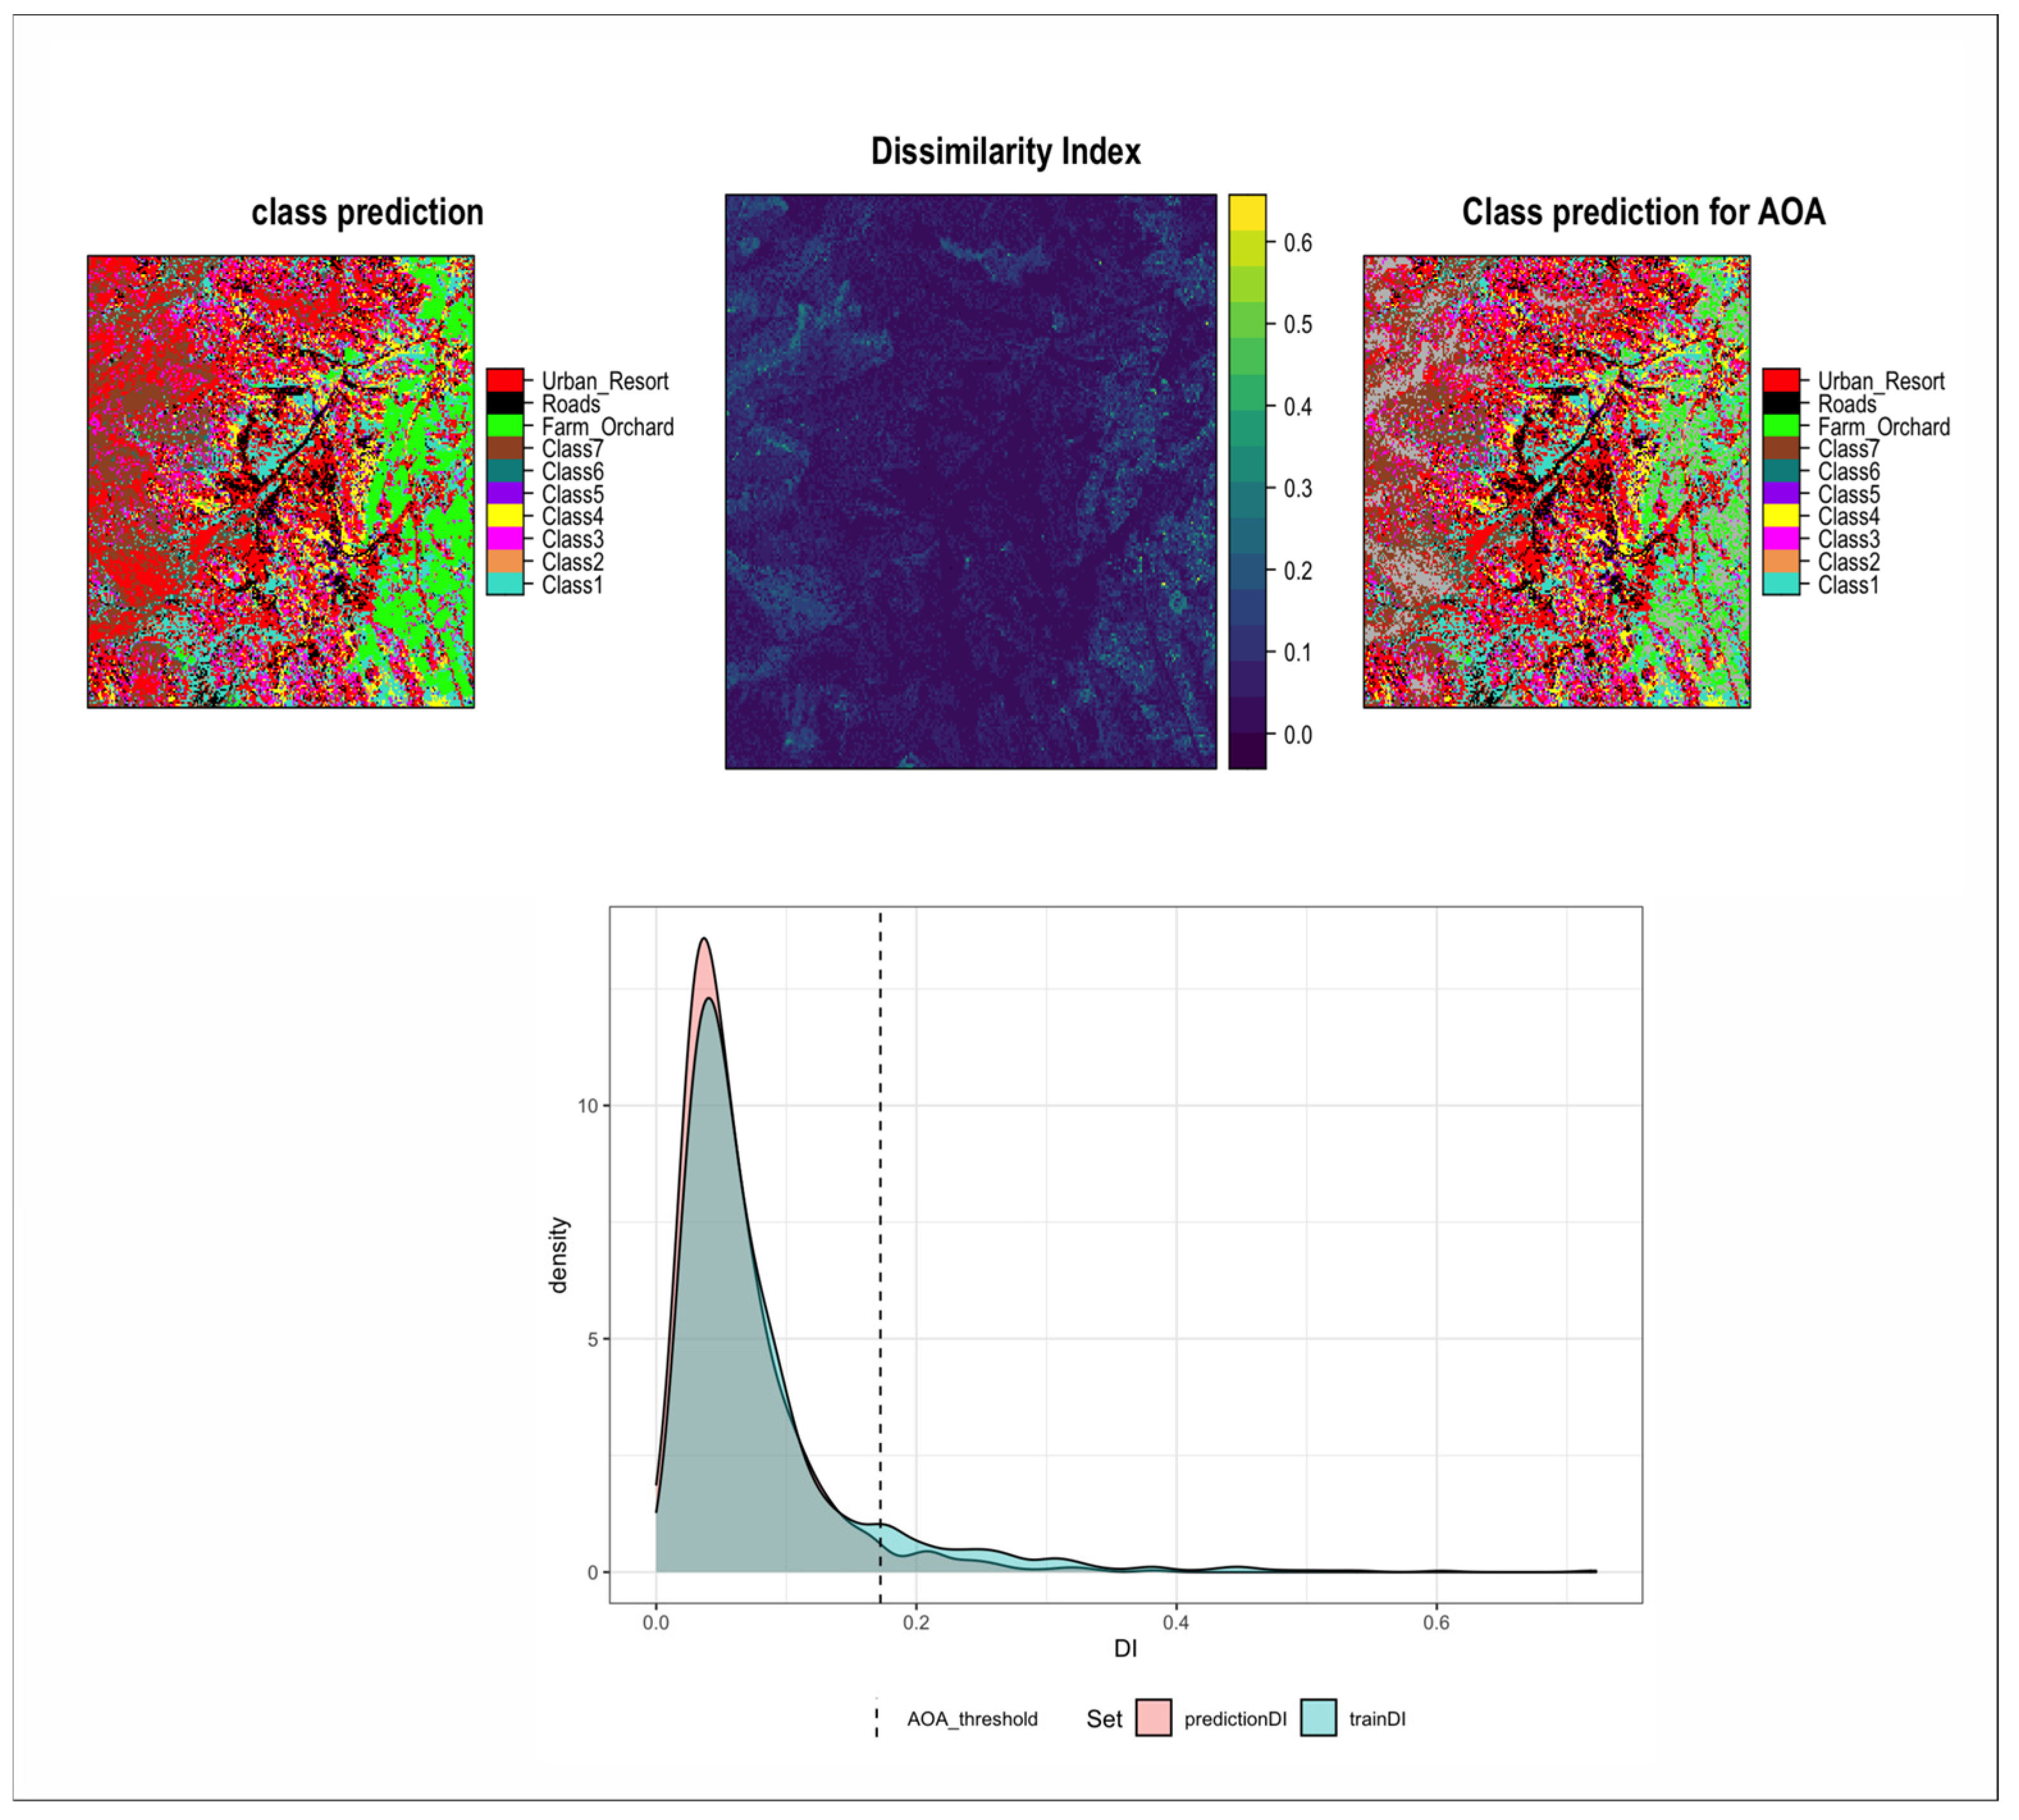
2.2.4. Classification Error and Area of Applicability
2.3. Quantifying Uncertainty (Information) in Class Prediction
2.4. Dissociating the Contribution of Predictor Features: Intensity Analysis
3. Results
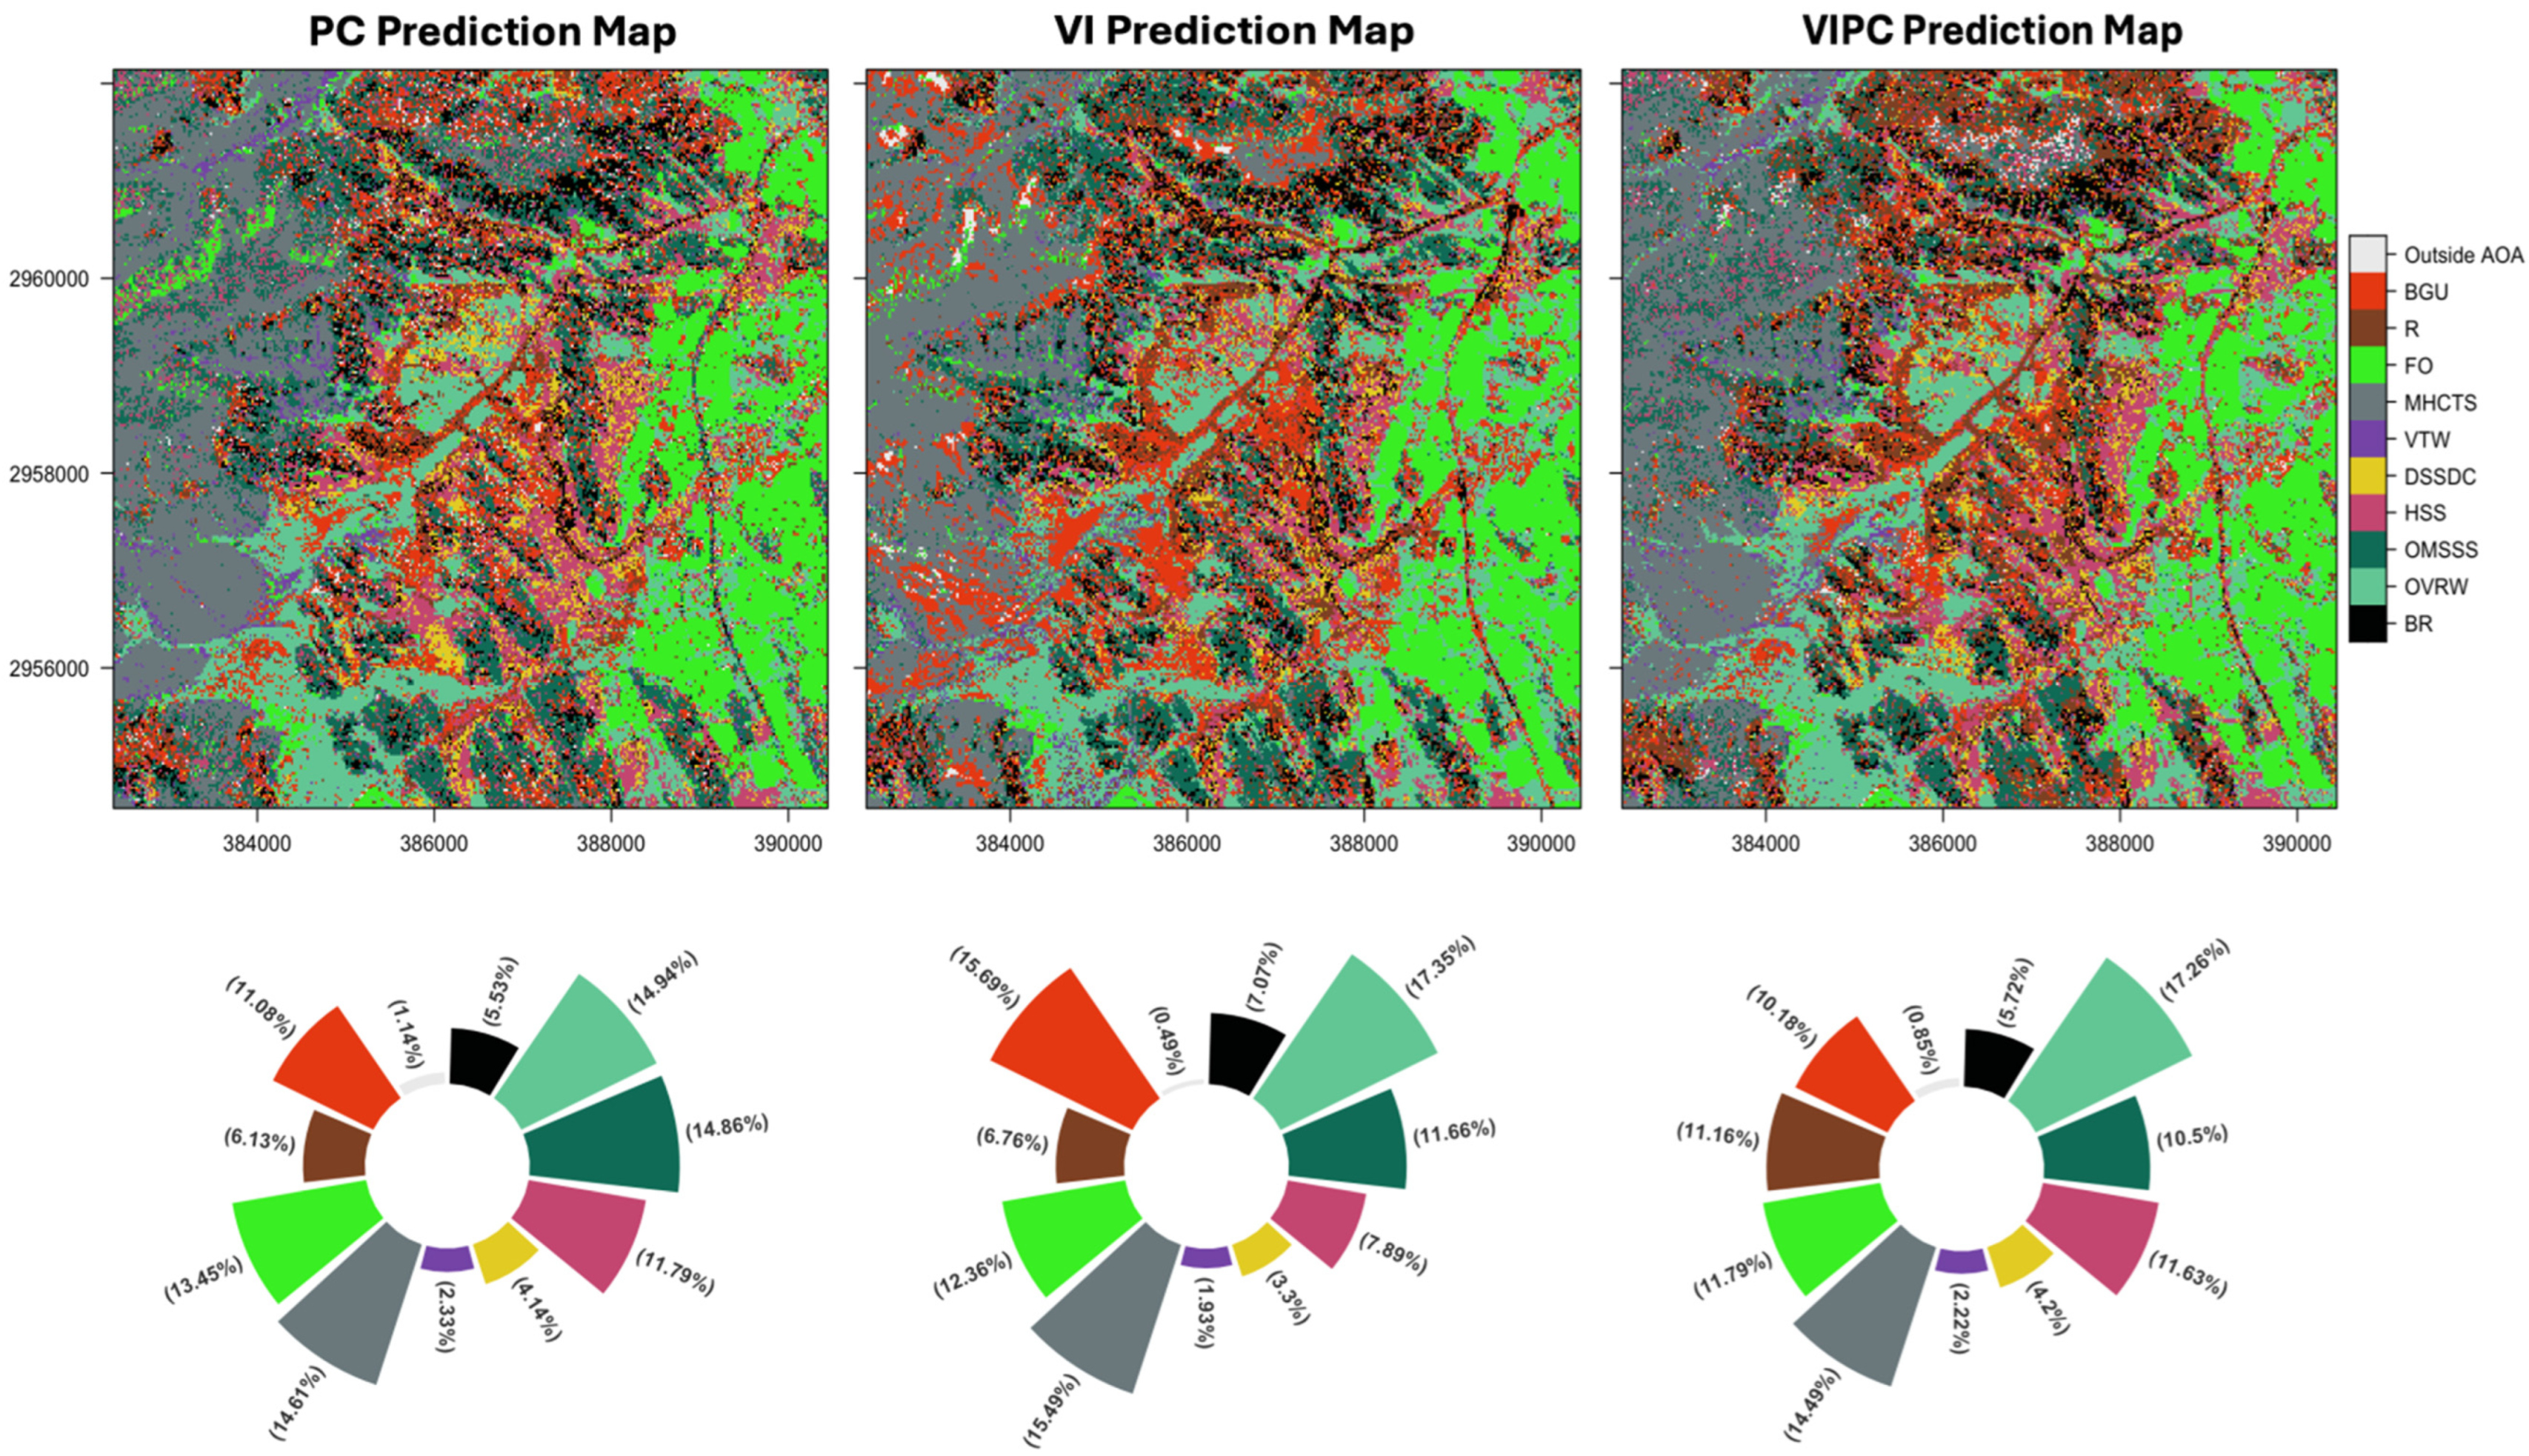
3.1. Vegetation and Land Cover Classification
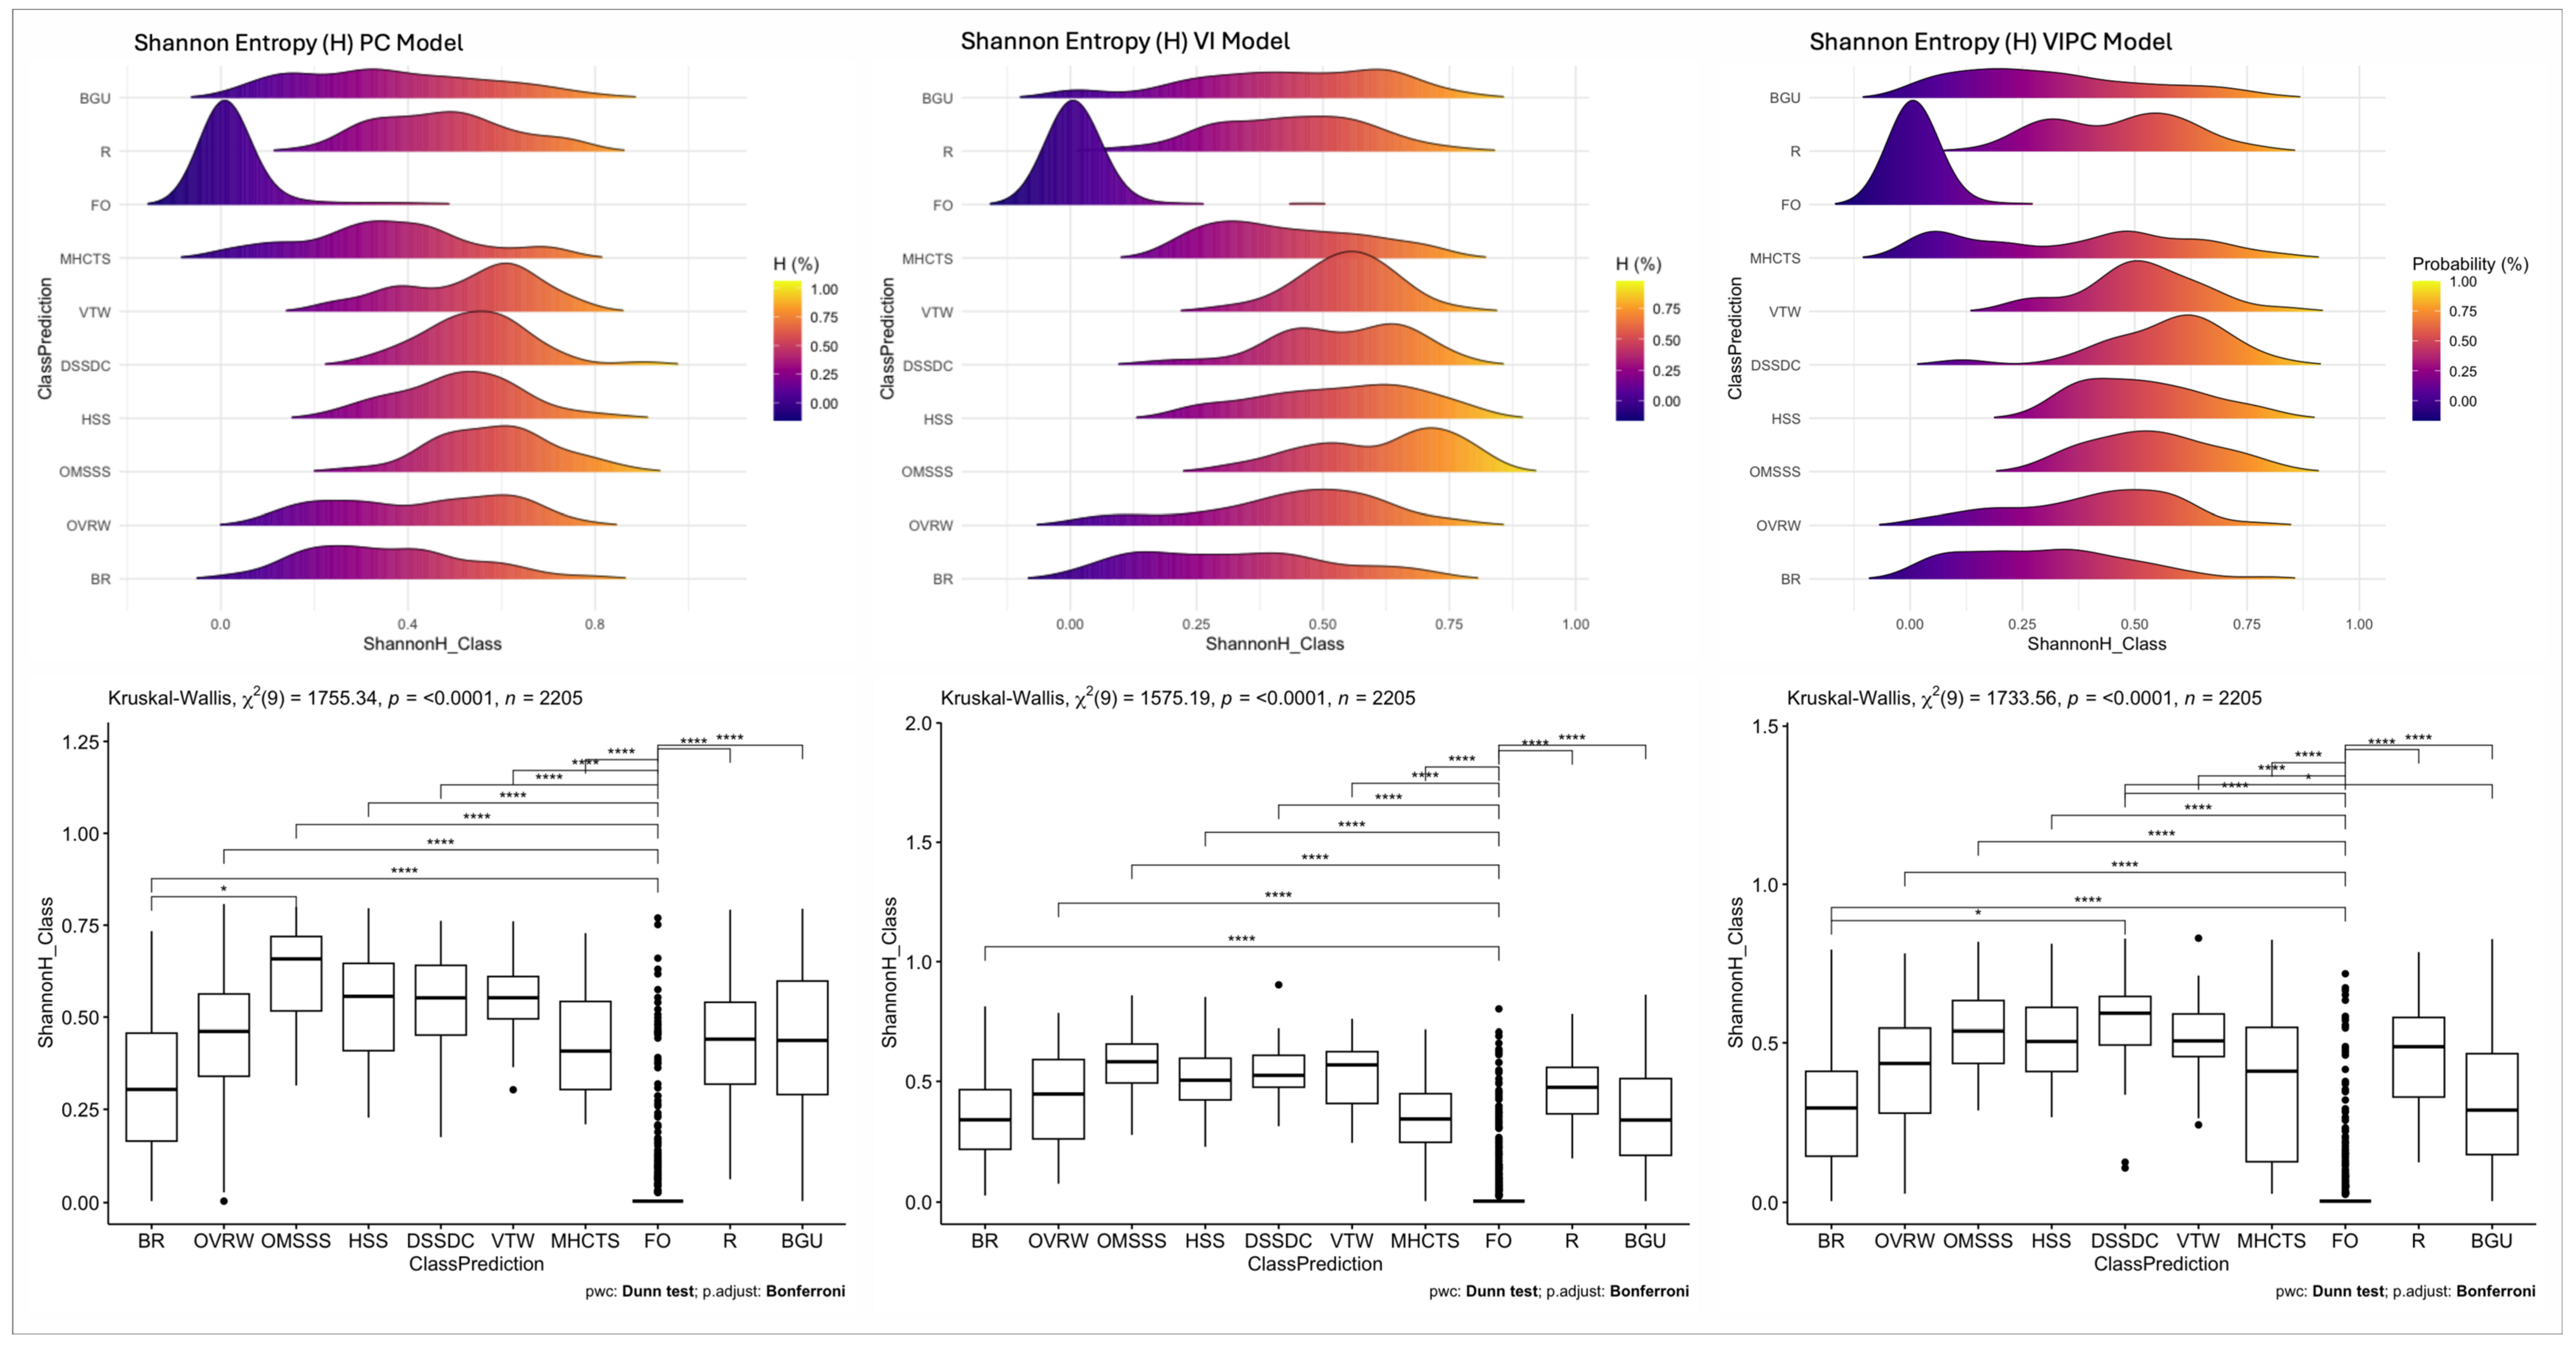
3.2. Classification Uncertainty
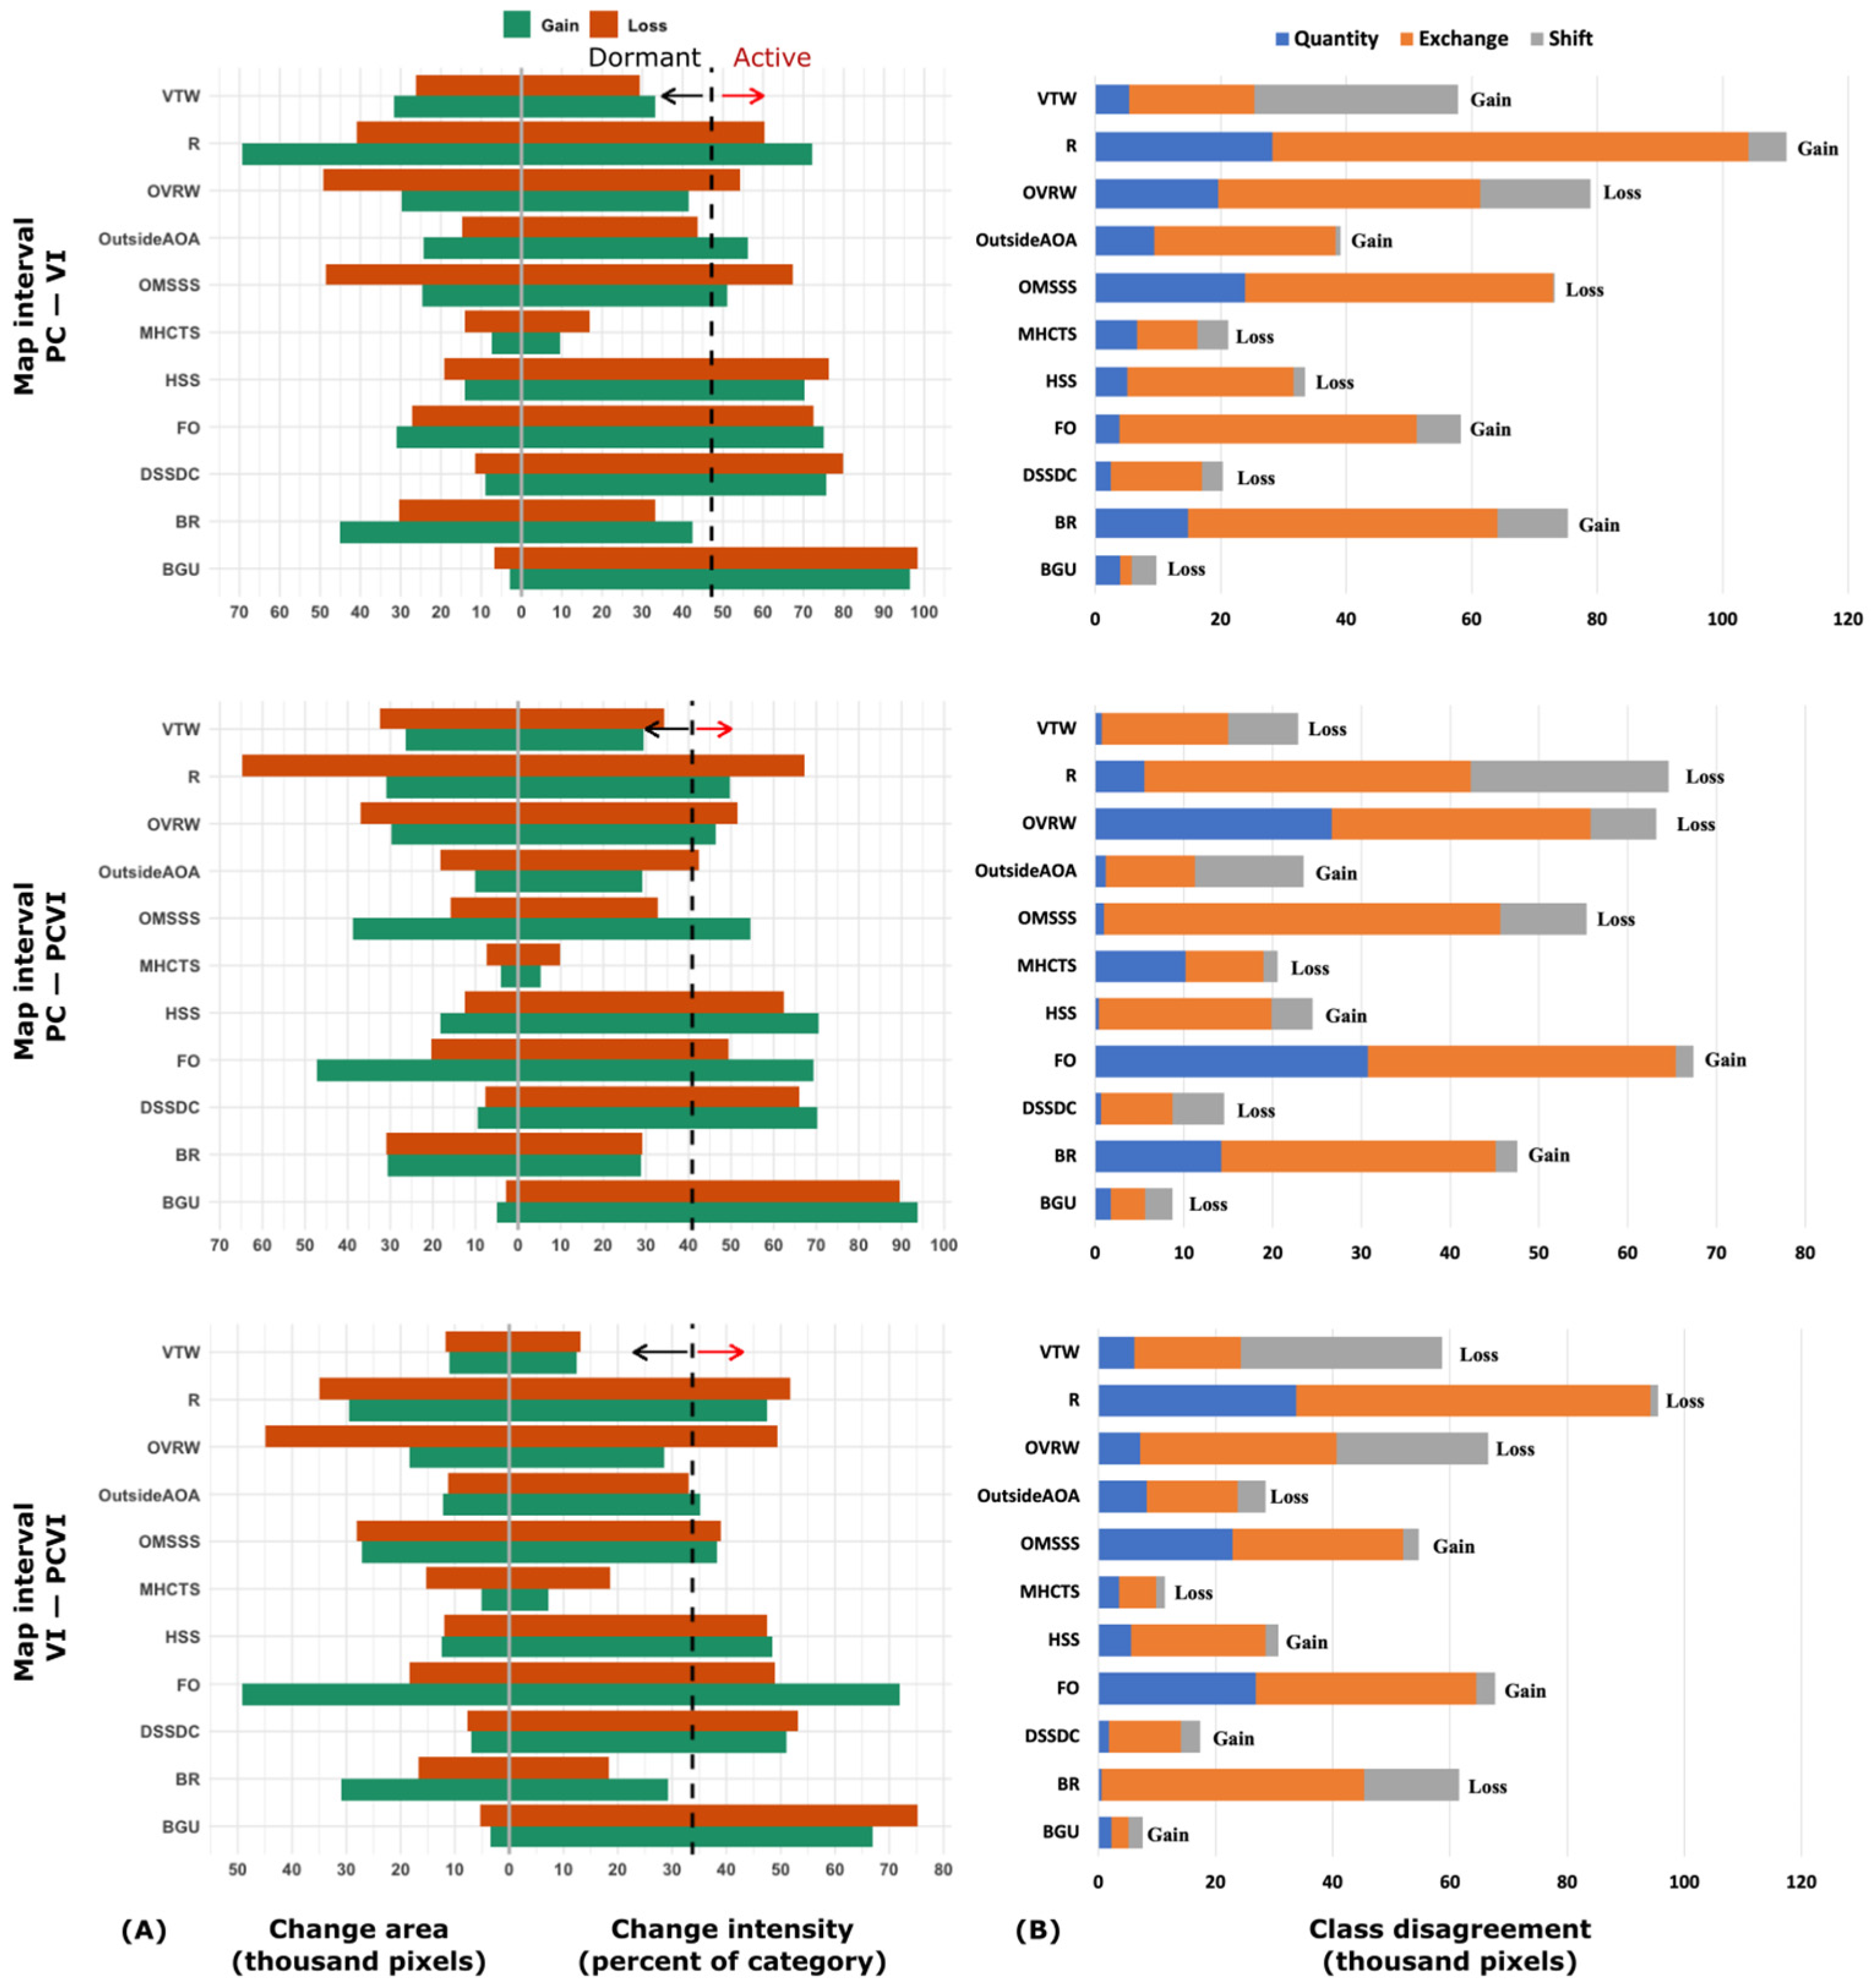
3.3. Comparison of Classification Methods: Change Intensity
4. Discussion
4.1. Vegetation Discrimination Accuracy
4.2. Class Uncertainty Distribution
4.3. Class Spatial Allocation and Intensity
5. Conclusions
Supplementary Materials
Funding
Data Availability Statement
Acknowledgments
Conflicts of Interest
Abbreviations
| AOA | Area of Applicability |
| DI | Dissimilarity Index |
| FFS | Forward Feature Selection |
| HCA | Hierarchical Cluster Analysis |
| PCA | Principal Component Analysis |
| PCs | Principal Component images |
| RF | Random Forest |
| RFE | Recursive Feature Elimination |
| VIs | Vegetation Indices |
References
- Zomer, R.J.; Xu, J.; Trabucco, A. Version 3 of the Global Aridity Index and Potential Evapotranspiration Database. Sci. Data 2022, 9, 409. [Google Scholar] [CrossRef] [PubMed]
- Deutschewitz, K.; Lausch, A.; Kühn, I.; Klotz, S. Native and alien plant species richness in relation to spatial heterogeneity on a regional scale in Germany. Glob. Ecol. Biogeogr. 2003, 12, 299–311. [Google Scholar] [CrossRef]
- Lundholm, J.T. Plant species diversity and environmental heterogeneity: Spatial scale and competing hypotheses. J. Veg. Sci. 2009, 20, 377–391. [Google Scholar] [CrossRef]
- Opedal, Ø.H.; Armbruster, W.S.; Graae, B.J. Linking small-scale topography with microclimate, plant species diversity and intra-specific trait variation in an alpine landscape. Plant Ecol. Divers. 2015, 8, 305–315. [Google Scholar] [CrossRef]
- Dobrowski, S.Z. A climatic basis for microrefugia: The influence of terrain on climate: A Climatic Basis for Microrefugia. Glob. Change Biol. 2011, 17, 1022–1035. [Google Scholar] [CrossRef]
- Dufour, A.; Gadallah, F.; Wagner, H.H.; Guisan, A.; Buttler, A. Plant species richness and environmental heterogeneity in a mountain landscape: Effects of variability and spatial configuration. Ecography 2006, 29, 573–584. [Google Scholar] [CrossRef]
- Aburas, M.M.; Abdullah, S.H.; Ramli, M.F.; Ash’aari, Z.H. Measuring Land Cover Change in Seremban, Malaysia Using NDVI Index. Procedia Environ. Sci. 2015, 30, 238–243. [Google Scholar] [CrossRef]
- Bhandari, A.K.; Kumar, A.; Singh, G.K. Feature Extraction using Normalized Difference Vegetation Index (NDVI): A Case Study of Jabalpur City. Procedia Technol. 2012, 6, 612–621. [Google Scholar] [CrossRef]
- Bharathkumar, L.; Mohammed-Aslam, M.A. Crop Pattern Mapping of Tumkur Taluk Using NDVI Technique: A Remote Sensing and GIS Approach. Aquat. Procedia 2015, 4, 1397–1404. [Google Scholar] [CrossRef]
- Hammond, W.M.; Williams, A.P.; Abatzoglou, J.T.; Adams, H.D.; Klein, T.; López, R.; Sáenz-Romero, C.; Hartmann, H.; Breshears, D.D.; Allen, C.D. Global field observations of tree die-off reveal hotter-drought fingerprint for Earth’s forests. Nat. Commun. 2022, 13, 1761. [Google Scholar] [CrossRef] [PubMed]
- Yengoh, G.T.; Dent, D.; Olsson, L.; Tengberg, A.E.; Tucker, C.J. Limits to the Use of NDVI in Land Degradation Assessment. In Use of the Normalized Difference Vegetation Index (NDVI) to Assess Land Degradation at Multiple Scales; Springer International Publishing: Cham, Switzerland, 2015; pp. 27–30. [Google Scholar]
- Beckschäfer, P. Obtaining rubber plantation age information from very dense Landsat TM & ETM + time series data and pixel-based image compositing. Remote Sens. Environ. 2017, 196, 89–100. [Google Scholar] [CrossRef]
- Galletti, C.; Myint, S. Land-Use Mapping in a Mixed Urban-Agricultural Arid Landscape Using Object-Based Image Analysis: A Case Study from Maricopa, Arizona. Remote Sens. 2014, 6, 6089–6110. [Google Scholar] [CrossRef]
- Mishra, N.B.; Crews, K.A. Mapping vegetation morphology types in a dry savanna ecosystem: Integrating hierarchical object-based image analysis with Random Forest. Int. J. Remote Sens. 2014, 35, 1175–1198. [Google Scholar] [CrossRef]
- Wang, S.; Waldner, F.; Lobell, D.B. Unlocking large-scale crop field delineation in smallholder farming systems with transfer learning and weak supervision. Remote Sens. 2022, 14, 5738. [Google Scholar] [CrossRef]
- Meyer, H.; Reudenbach, C.; Hengl, T.; Katurji, M.; Nauss, T. Improving performance of spatio-temporal machine learning models using forward feature selection and target-oriented validation. Environ. Model. Softw. 2018, 101, 1–9. [Google Scholar] [CrossRef]
- Meyer, H.; Pebesma, E. Predicting into unknown space? Estimating the area of applicability of spatial prediction models. Methods Ecol. Evol. 2021, 12, 1620–1633. [Google Scholar] [CrossRef]
- Ye, S.; Pontius, R.G.; Rakshit, R. A review of accuracy assessment for object-based image analysis: From per-pixel to per-polygon approaches. ISPRS J. Photogramm. Remote Sens. 2018, 141, 137–147. [Google Scholar] [CrossRef]
- Ganem, K.A.; Xue, Y.; Rodrigues, A.D.A.; Franca-Rocha, W.; Oliveira, M.T.D.; Carvalho, N.S.D.; Cayo, E.Y.T.; Rosa, M.R.; Dutra, A.C.; Shimabukuro, Y.E. Mapping South America’s Drylands through Remote Sensing—A Review of the Methodological Trends and Current Challenges. Remote Sens. 2022, 14, 736. [Google Scholar] [CrossRef]
- Karnieli, A.; Agam, N.; Pinker, R.T.; Anderson, M.; Imhoff, M.L.; Gutman, G.G.; Panov, N.; Goldberg, A. Use of NDVI and Land Surface Temperature for Drought Assessment: Merits and Limitations. J. Clim. 2010, 23, 618–633. [Google Scholar] [CrossRef]
- Numbisi, F.N.; Van Coillie, F.M.B.; De Wulf, R. Delineation of Cocoa Agroforests Using Multiseason Sentinel-1 SAR Images: A Low Grey Level Range Reduces Uncertainties in GLCM Texture-Based Mapping. ISPRS Int. J. Geo-Inf. 2019, 8, 179. [Google Scholar] [CrossRef]
- Peña-Barragán, J.M.; Ngugi, M.K.; Plant, R.E.; Six, J. Object-based crop identification using multiple vegetation indices, textural features and crop phenology. Remote Sens. Environ. 2011, 115, 1301–1316. [Google Scholar] [CrossRef]
- Almalki, R.; Khaki, M.; Saco, P.M.; Rodriguez, J.F. Monitoring and Mapping Vegetation Cover Changes in Arid and Semi-Arid Areas Using Remote Sensing Technology: A Review. Remote Sens. 2022, 14, 5143. [Google Scholar] [CrossRef]
- Gil, A.; Yu, Q.; Lobo, A.; Lourenço, P.; Silva, L.; Calado, H. Assessing the effectiveness of high resolution satellite imagery for vegetation mapping in small islands protected areas. J. Coast. Res. 2011, 64, 1663–1667. [Google Scholar]
- Forkel, M.; Carvalhais, N.; Verbesselt, J.; Mahecha, M.; Neigh, C.; Reichstein, M. Trend Change Detection in NDVI Time Series: Effects of Inter-Annual Variability and Methodology. Remote Sens. 2013, 5, 2113–2144. [Google Scholar] [CrossRef]
- Jiang, Z.; Huete, A.R.; Chen, J.; Chen, Y.; Li, J.; Yan, G.; Zhang, X. Analysis of NDVI and scaled difference vegetation index retrievals of vegetation fraction. Remote Sens. Environ. 2006, 101, 366–378. [Google Scholar] [CrossRef]
- Zhen, Z.; Chen, S.; Yin, T.; Chavanon, E.; Lauret, N.; Guilleux, J.; Henke, M.; Qin, W.; Cao, L.; Li, J.; et al. Using the Negative Soil Adjustment Factor of Soil Adjusted Vegetation Index (SAVI) to Resist Saturation Effects and Estimate Leaf Area Index (LAI) in Dense Vegetation Areas. Sensors 2021, 21, 2115. [Google Scholar] [CrossRef] [PubMed]
- Pellat, F.P.; Sanchez, M.E.R.; Vélez, E.P.; González, M.B.; Lazalde, J.R.V. Alcances Y Limitaciones de Los Índices Espectrales de La Vegetación: Análisis de Índices de Banda Ancha. Terra Latinoam. 2015, 33, 27–49. [Google Scholar]
- Loranty, M.; Davydov, S.; Kropp, H.; Alexander, H.; Mack, M.; Natali, S.; Zimov, N. Vegetation Indices Do Not Capture Forest Cover Variation in Upland Siberian Larch Forests. Remote Sens. 2018, 10, 1686. [Google Scholar] [CrossRef]
- Mbow, C.; Fensholt, R.; Rasmussen, K.; Diop, D. Can vegetation productivity be derived from greenness in a semi-arid environment? Evidence from ground-based measurements. J. Arid Environ. 2013, 97, 56–65. [Google Scholar] [CrossRef]
- Smith, W.K.; Dannenberg, M.P.; Yan, D.; Herrmann, S.; Barnes, M.L.; Barron-Gafford, G.A.; Biederman, J.A.; Ferrenberg, S.; Fox, A.M.; Hudson, A.; et al. Remote sensing of dryland ecosystem structure and function: Progress, challenges, and opportunities. Remote Sens. Environ. 2019, 233, 111401. [Google Scholar] [CrossRef]
- Khatami, R.; Mountrakis, G.; Stehman, S.V. Predicting individual pixel error in remote sensing soft classification. Remote Sens. Environ. 2017, 199, 401–414. [Google Scholar] [CrossRef]
- Zhang, J.; Zhang, W.; Mei, Y.; Yang, W. Geostatistical characterization of local accuracies in remotely sensed land cover change categorization with complexly configured reference samples. Remote Sens. Environ. 2019, 223, 63–81. [Google Scholar] [CrossRef]
- Zhang, Q.; Zhang, P.; Hu, X. Novel Classification Uncertainty Measurement Model Integrating Spatial Information for Remote Sensing Image. ISPRS Ann. Photogramm. Remote Sens. Spat. Inf. Sci. 2020, V-3-2020, 723–730. [Google Scholar] [CrossRef]
- Clinton, N.; Holt, A.; Scarborough, J.; Yan, L.; Gong, P. Accuracy Assessment Measures for Object-based Image Segmentation Goodness. Photogramm. Eng. Remote Sens. 2010, 76, 289–299. [Google Scholar] [CrossRef]
- Arora, A.; Pandey, M.; Mishra, V.N.; Kumar, R.; Rai, P.K.; Costache, R.; Punia, M.; Di, L. Comparative evaluation of geospatial scenario-based land change simulation models using landscape metrics. Ecol. Indic. 2021, 128, 107810. [Google Scholar] [CrossRef]
- Tsutsumida, N.; Rodríguez-Veiga, P.; Harris, P.; Balzter, H.; Comber, A. Investigating spatial error structures in continuous raster data. Int. J. Appl. Earth Obs. Geoinf. 2019, 74, 259–268. [Google Scholar] [CrossRef]
- Pontius, R.G.; Millones, M. Death to Kappa: Birth of quantity disagreement and allocation disagreement for accuracy assessment. Int. J. Remote Sens. 2011, 32, 4407–4429. [Google Scholar] [CrossRef]
- Al-Ghamdi, A.S. Classifying and mapping of vegetated area in Al- Baha region, Saudi Arabia using remote sensing. I. Extent and distribution of ground vegetated cover categories. Indian J. Appl. Res. 2020, 10, 75–80. [Google Scholar] [CrossRef]
- Al-Rowaily, S.R.; Assaeed, A.M.; Al-Khateeb, S.A.; Al-Qarawi, A.A.; Al Arifi, F.S. Vegetation and condition of arid rangeland ecosystem in Central Saudi Arabia. Saudi J. Biol. Sci. 2018, 25, 1022–1026. [Google Scholar] [CrossRef] [PubMed]
- Malatesta, L.; Attorre, F.; Altobelli, A.; Adeeb, A.; De Sanctis, M.; Taleb, N.M.; Scholte, P.T.; Vitale, M. Vegetation mapping from high-resolution satellite images in the heterogeneous arid environments of Socotra Island (Yemen). J. Appl. Remote Sens. 2013, 7, 073527. [Google Scholar] [CrossRef]
- Roy, P.S.; Behera, M.D.; Murthy, M.S.R.; Roy, A.; Singh, S.; Kushwaha, S.P.S.; Jha, C.S.; Sudhakar, S.; Joshi, P.K.; Reddy, C.S.; et al. New vegetation type map of India prepared using satellite remote sensing: Comparison with global vegetation maps and utilities. Int. J. Appl. Earth Obs. Geoinf. 2015, 39, 142–159. [Google Scholar] [CrossRef]
- Breiman, L. Random Forests. Mach. Learn. 2001, 45, 5–32. [Google Scholar] [CrossRef]
- Rouse, W.; Haas, R.H.; Schell, J.A.; Deering, D.W. Monitoring Vegetation Systems in the Great Plains with ERTS. In Proceedings of the 3rd Earth Resources Technology Satellite-1 Symposium, Greenbelt, NASASP-351, Washington, DC, USA, 10–14 December 1973; NASA: Washington, DC, USA, 1974; pp. 3010–3017. [Google Scholar]
- Huete, A. A comparison of vegetation indices over a global set of TM images for EOS-MODIS. Remote Sens. Environ. 1997, 59, 440–451. [Google Scholar] [CrossRef]
- Huete, A.; Didan, K.; Miura, T.; Rodriguez, E.P.; Gao, X.; Ferreira, L.G. Overview of the radiometric and biophysical performance of the MODIS vegetation indices. Remote Sens. Environ. 2002, 83, 195–213. [Google Scholar] [CrossRef]
- Jiang, Z.; Huete, A.; Didan, K.; Miura, T. Development of a two-band enhanced vegetation index without a blue band. Remote Sens. Environ. 2008, 112, 3833–3845. [Google Scholar] [CrossRef]
- Huete, A.R. A soil-adjusted vegetation index (SAVI). Remote Sens. Environ. 1988, 25, 295–309. [Google Scholar] [CrossRef]
- Qi, J.; Chehbouni, A.; Huete, A.R.; Kerr, Y.H.; Sorooshian, S. A modified soil adjusted vegetation index. Remote Sens. Environ. 1994, 48, 119–126. [Google Scholar] [CrossRef]
- Sripada, R.P.; Heiniger, R.W.; White, J.G.; Meijer, A.D. Aerial Color Infrared Photography for Determining Early In-Season Nitrogen Requirements in Corn. Agron. J. 2006, 98, 968–977. [Google Scholar] [CrossRef]
- Tassi, A.; Vizzari, M. Object-Oriented LULC Classification in Google Earth Engine Combining SNIC, GLCM, and Machine Learning Algorithms. Remote Sens. 2020, 12, 3776. [Google Scholar] [CrossRef]
- Kaiser, H.F. The Application of Electronic Computers to Factor Analysis. Educ. Psychol. Meas. 1960, 20, 141–151. [Google Scholar] [CrossRef]
- Kiani, A.; Sahebi, M.R. Edge detection based on the Shannon Entropy by piecewise thresholding on remote sensing images. IET Comput. Vis. 2015, 9, 758–768. [Google Scholar] [CrossRef]
- Deribew, K.T. Spatiotemporal analysis of urban growth on forest and agricultural land using geospatial techniques and Shannon entropy method in the satellite town of Ethiopia, the western fringe of Addis Ababa city. Ecol. Process. 2020, 9, 46. [Google Scholar] [CrossRef]
- Patra, P.K.; Behera, D.; Goswami, S. Relative Shannon’s Entropy Approach for Quantifying Urban Growth Using Remote Sensing and GIS: A Case Study of Cuttack City, Odisha, India. J. Indian Soc. Remote Sens. 2022, 50, 747–762. [Google Scholar] [CrossRef]
- Yulianto, F.; Fitriana, H.L.; Sukowati, K.A.D. Integration of remote sensing, GIS, and Shannon’s entropy approach to conduct trend analysis of the dynamics change in urban/built-up areas in the Upper Citarum River Basin, West Java, Indonesia. Model. Earth Syst. Environ. 2020, 6, 383–395. [Google Scholar] [CrossRef]
- Shannon, C.E. A Mathematical Theory of Communication. Bell Syst. Tech. J. 1948, 27, 379–423, 623–656. [Google Scholar] [CrossRef]
- Aldwaik, S.Z.; Pontius, R.G., Jr. Map errors that could account for deviations from a uniform intensity of land change. Int. J. Geogr. Inf. Sci. 2013, 27, 1717–1739. [Google Scholar] [CrossRef]
- Aldwaik, S.Z.; Pontius, R.G. Intensity analysis to unify measurements of size and stationarity of land changes by interval, category, and transition. Landsc. Urban Plan. 2012, 106, 103–114. [Google Scholar] [CrossRef]
- Pontius, R.G.; Santacruz, A. Quantity, exchange, and shift components of difference in a square contingency table. Int. J. Remote Sens. 2014, 35, 7543–7554. [Google Scholar] [CrossRef]
- Huang, B.; Huang, J.; Gilmore Pontius, R.; Tu, Z. Comparison of Intensity Analysis and the land use dynamic degrees to measure land changes outside versus inside the coastal zone of Longhai, China. Ecol. Indic. 2018, 89, 336–347. [Google Scholar] [CrossRef]
- Meyer, H.; Milà, C.; Ludwig, M.; Linnenbrink, J. CAST: “Caret” Applications for Spatial-Temporal Models. Available online: https://CRAN.R-project.org/package=CAST (accessed on 20 July 2023).
- R Core Team. R: A Language and Environment for Statistical Computing. Available online: https://www.R-project.org/ (accessed on 15 June 2023).
- Pontius, R.G., Jr.; Santacruz, A. diffeR-package: Metrics of Difference for Comparing Pairs of Maps or Pairs of Variables. Available online: https://CRAN.R-project.org/package=diffeR (accessed on 1 September 2023).
- Saeed, M.; Ahmad, A.; Mohd, O. Optimal Land-cover Classification Feature Selection in Arid Areas based on Sentinel-2 Imagery and Spectral Indices. Int. J. Adv. Comput. Sci. Appl. 2023, 14, 106–112. [Google Scholar] [CrossRef]
- Silver, M.; Tiwari, A.; Karnieli, A. Identifying Vegetation in Arid Regions Using Object-Based Image Analysis with RGB-Only Aerial Imagery. Remote Sens. 2019, 11, 2308. [Google Scholar] [CrossRef]
- Wainwright, J. Desert Ecogeomorphology. In Geomorphology of Desert Environments; Parsons, A.J., Abrahams, A.D., Eds.; Springer: Dordrecht, The Netherlands, 2009; pp. 21–66. [Google Scholar]
- Foody, G.M. Harshness in image classification accuracy assessment. Int. J. Remote Sens. 2008, 29, 3137–3158. [Google Scholar] [CrossRef]
- Motohka, T.; Nasahara, K.N.; Oguma, H.; Tsuchida, S. Applicability of Green-Red Vegetation Index for Remote Sensing of Vegetation Phenology. Remote Sens. 2010, 2, 2369–2387. [Google Scholar] [CrossRef]
- Xu, X.; Liu, L.; Han, P.; Gong, X.; Zhang, Q. Accuracy of Vegetation Indices in Assessing Different Grades of Grassland Desertification from UAV. Int. J. Environ. Res. Public Health 2022, 19, 16793. [Google Scholar] [CrossRef] [PubMed]
- Chen, J.; Yang, H.; Jin, T.; Wu, K. Assessment of terrestrial ecosystem sensitivity to climate change in arid, semi-arid, sub-humid, and humid regions using EVI, LAI, and SIF products. Ecol. Indic. 2024, 158, 111511. [Google Scholar] [CrossRef]
- Palanisamy, P.A.; Jain, K.; Bonafoni, S. Machine Learning Classifier Evaluation for Different Input Combinations: A Case Study with Landsat 9 and Sentinel-2 Data. Remote Sens. 2023, 15, 3241. [Google Scholar] [CrossRef]


| Vegetation and Land Cover Classes | No. Ref. Polygons | No. Ref. Pixels (10 × 10 m2) | Total Ref. Area (m2) |
|---|---|---|---|
| Class 1—Open Vachellia raddiana woodland (OVRW) | 38 | 121 | 11,748.3 |
| Class 2—Bare rock (BR) | 5 | 99 | 9762.1 |
| Class 3—Open mixed shrubland of sandstone slopes (OMSSS) | 14 | 45 | 4328.3 |
| Class 4—Haloxylon salicornicum shrubland (HSS) | 20 | 63 | 6183.3 |
| Class 5—Dwarf shrubland sand dune community (DSSDC) | 16 | 49 | 4946.7 |
| Class 6—Vachellia tortilis woodland (VTW) | 11 | 36 | 3400.8 |
| Class 7—Mixed herb community of the talus slopes (MHCTS) | 12 | 37 | 3709.9 |
| Farms/Orchards (FO) | 84 | 1441 | 153,520.5 |
| Roads (R) | 60 | 114 | 4637.5 |
| Bare ground/Urban (BGU) | 106 | 200 | 1310.9 |
| PC Layer | Explained Variance (%) | Cumulative Variance (%) |
|---|---|---|
| PC1 | 87.17 | 87.17 |
| PC2 | 7.64 | 94.81 |
| PC3 | 2.53 | 97.35 |
| PC4 | 1.33 | 98.67 |
| PC5 | 0.57 | 99.25 |
| Symbol | Meaning |
|---|---|
| i | index for a category at the interval’s initial time point |
| j | index for a category at the interval’s final time point |
| J | number of categories, i.e., eleven for this study |
| t | index for the time point |
| T | number of time points |
| Mt | map at time point t |
| Ctij | number of pixels that are category i at Mt and category j at Mt+1, i.e., the total number of pixels that transition from category i to j |
| Gtj | intensity of gain of category j during map interval [Mt, Mt+1] relative to the size of category j at Mt+1 |
| Lti | intensity of loss of category i during map interval [Mt, Mt+1] relative to the size of category i at Mt |
| Wtj | uniform intensity of the transition from all non-j categories to category j during interval [Mt, Mt+1] relative to the size of all non-j categories at Mt |
| Rtij | intensity of the transition from category i to category j during interval [Mt, Mt+1] relative to the size of category i at Mt |
| St | total change percentage during interval [Mt, Mt+1] |
| Categories in Map Mt+1 | |||||||
|---|---|---|---|---|---|---|---|
| j = 1 | j = 2 | j = 3 | … | j = J | Loss Intensities | ||
| Categories in Map Mt | i = 1 | Rt11 | Rt12 | Rt13 | … | Rt1J | Lt1 |
| i = 2 | Rt21 | Rt22 | Rt23 | … | Rt2J | Lt2 | |
| i = 3 | Rt31 | Rt32 | Rt33 | Rt3J | Lt3 | ||
| … | … | … | … | … | … | … | |
| i = J | RtJ1 | RtJ2 | RtJ3 | … | RtJJ | LtJ | |
| Uniform Transition Intensities | Wt1 | Wt2 | Wt3 | … | WtJ | ||
| Gain Intensities | Gt1 | Gt2 | Gt3 | … | GtJ | ||
| All categories during interval [Mt, Mt+1] | St | ||||||
| PC Model | VI Model | VIPC Model | |
|---|---|---|---|
| Independent Variables | 5 | 5 | 10 |
| Selected Predictors | 5 | 4 | 5 |
| Overall Accuracy (OA) % (95% CI) | 80.32 (78.60, 81.96) | 80.68 (79.97, 82.31) | 82.71 (81.08, 84.28) |
| Kappa % | 65.42 | 65.91 | 69.51 |
| DI Threshold for AOA | 0.261 | 0.076 | 0.172 |
| Class Prediction Statistics | |||
|---|---|---|---|
| Models and Classes | F1-Score | Sensitivity | Specificity |
| PC Model | |||
| BR | 0.7162 | 0.7777 | 0.9814 |
| OVRW | 0.6141 | 0.6446 | 0.9736 |
| OMSSS | 0.3917 | 0.4222 | 0.9847 |
| HSS | 0.3939 | 0.4127 | 0.9799 |
| DSSDC | 0.2278 | 0.1836 | 0.9902 |
| VTW | 0.0638 | 0.0833 | 0.9746 |
| MHCTS | 0.6133 | 0.6216 | 0.9930 |
| FO | 0.9632 | 0.9452 | 0.9673 |
| R | 0.3184 | 0.2807 | 0.9737 |
| BGU | 0.6529 | 0.7100 | 0.9536 |
| VI Model | |||
| BR | 0.6698 | 0.7071 | 0.9810 |
| OVRW | 0.5395 | 0.6198 | 0.9606 |
| OMSSS | 0.2268 | 0.2444 | 0.9810 |
| HSS | 0.3275 | 0.3016 | 0.9841 |
| DSSDC | 0.3703 | 0.3061 | 0.9921 |
| VTW | 0.2195 | 0.2500 | 0.9829 |
| MHCTS | 0.6000 | 0.5675 | 0.9944 |
| FO | 0.9711 | 0.9556 | 0.9764 |
| R | 0.4279 | 0.4035 | 0.9737 |
| BGU | 0.6385 | 0.6800 | 0.9551 |
| VIPC Model | |||
| BR | 0.7336 | 0.7374 | 0.9872 |
| OVRW | 0.5631 | 0.7190 | 0.9515 |
| OMSSS | 0.4634 | 0.4222 | 0.9917 |
| HSS | 0.4000 | 0.4444 | 0.9771 |
| DSSDC | 0.2272 | 0.2041 | 0.9865 |
| VTW | 0.3529 | 0.3333 | 0.9908 |
| MHCTS | 0.6865 | 0.6216 | 0.9968 |
| FO | 0.9732 | 0.9577 | 0.9804 |
| R | 0.4205 | 0.3947 | 0.9737 |
| BGU | 0.7223 | 0.7350 | 0.9701 |
Disclaimer/Publisher’s Note: The statements, opinions and data contained in all publications are solely those of the individual author(s) and contributor(s) and not of MDPI and/or the editor(s). MDPI and/or the editor(s) disclaim responsibility for any injury to people or property resulting from any ideas, methods, instructions or products referred to in the content. |
© 2025 by the author. Licensee MDPI, Basel, Switzerland. This article is an open access article distributed under the terms and conditions of the Creative Commons Attribution (CC BY) license (https://creativecommons.org/licenses/by/4.0/).
Share and Cite
Numbisi, F.N. Minding Spatial Allocation Entropy: Sentinel-2 Dense Time Series Spectral Features Outperform Vegetation Indices to Map Desert Plant Assemblages. Remote Sens. 2025, 17, 2553. https://doi.org/10.3390/rs17152553
Numbisi FN. Minding Spatial Allocation Entropy: Sentinel-2 Dense Time Series Spectral Features Outperform Vegetation Indices to Map Desert Plant Assemblages. Remote Sensing. 2025; 17(15):2553. https://doi.org/10.3390/rs17152553
Chicago/Turabian StyleNumbisi, Frederick N. 2025. "Minding Spatial Allocation Entropy: Sentinel-2 Dense Time Series Spectral Features Outperform Vegetation Indices to Map Desert Plant Assemblages" Remote Sensing 17, no. 15: 2553. https://doi.org/10.3390/rs17152553
APA StyleNumbisi, F. N. (2025). Minding Spatial Allocation Entropy: Sentinel-2 Dense Time Series Spectral Features Outperform Vegetation Indices to Map Desert Plant Assemblages. Remote Sensing, 17(15), 2553. https://doi.org/10.3390/rs17152553