Article

Enhanced Rapid Mangrove Habitat Mapping Approach to Setting Protected Areas Using Satellite Indices and Deep Learning: A Case Study of the Solomon Islands

1
Department of Forest Resources, Kookmin University, Seoul 02707, Republic of Korea
2
Department of Forestry, Environment and Systems, Kookmin University, Seoul 02707, Republic of Korea
3
OJEong Resilience Institute (OJERI), Korea University, Seoul 02841, Republic of Korea
*
Author to whom correspondence should be addressed.
Remote Sens. 2025, 17(14), 2512; https://doi.org/10.3390/rs17142512
Submission received: 30 May 2025 / Revised: 11 July 2025 / Accepted: 17 July 2025 / Published: 18 July 2025

Abstract

Mangroves, as a key component of the blue-carbon ecosystem, have exceptional carbon sequestration capacity and are mainly distributed in tropical coastal regions. In the Solomon Islands, ongoing degradation of mangrove forests, primarily due to land conversion and timber exploitation, highlights an urgent need for high-resolution spatial data to inform effective conservation strategies. The present study introduces an efficient and accurate methodology for mapping mangrove habitats and prioritizing protection areas utilizing open-source satellite imagery and datasets available through the Google Earth Engine platform in conjunction with a U-Net deep learning algorithm. The model demonstrates high performance, achieving an F1-score of 0.834 and an overall accuracy of 0.96, in identifying mangrove distributions. The total mangrove area in the Solomon Islands is estimated to be approximately 71,348.27 hectares, accounting for about 2.47% of the national territory. Furthermore, based on the mapped mangrove habitats, an optimized hotspot analysis is performed to identify regions characterized by high-density mangrove distribution. By incorporating spatial variables such as distance from roads and urban centers, along with mangrove area, this study proposes priority mangrove protection areas. These results underscore the potential for using openly accessible satellite data to enhance the precision of mangrove conservation strategies in data-limited settings. This approach can effectively support coastal resource management and contribute to broader climate change mitigation strategies.

1. Introduction

Recently, the acceleration of climate change has brought various environmental issues to the forefront. Issues such as sea level rise and an increased frequency of extreme climatic events are among the prominent consequences, and are significantly affecting ecological systems [1,2,3]. For example, sea level rise and temperature increases are contributing to elevated salinity in coastal regions, thereby inducing ecological shifts [4,5]. These changes are especially detrimental to mangrove ecosystems, which are highly sensitive to salinity fluctuations. Furthermore, climate change is leading to a progressive reduction in both the abundance and spatial extent of tree species that are native to high-altitude environments [6]. As the effects of climate change intensify, the role of carbon sequestration has gained growing attention as a key mitigation strategy [7,8]. Globally, the significance of carbon sequestration is increasingly acknowledged. Forest, marine, and coastal ecosystems serve as the primary environments for carbon uptake, making critical contributions to both carbon storage and sequestration processes [9]. Notably, marine and coastal ecosystems are especially vital. Mangroves, coral reefs, and seagrasses are now widely seen as key blue-carbon sinks. Protecting these ecosystems has become one of the leading strategies in the fight against climate change [10,11].
Mangroves establish distinct ecological systems and exhibit superior carbon sequestration capabilities compared to many other tree species. As such, they are recognized worldwide as one of the most prominent contributors to blue-carbon storage [12]. At the 2015 United Nations Framework Convention on Climate Change (UNFCCC), several key developing nations formally committed to employing mangrove ecosystem restoration and conservation as a climate change mitigation measure [13]. The total carbon storage of mangroves worldwide is estimated to be approximately 11.7 Pg C, with about 84% of this amount being stored in soil organic carbon [14]. Mangrove ecosystems in tropical regions sequester an average of 1023 Mg of carbon per hectare (ha) in both vegetation and soil, a figure that exceeds the carbon storage capacity of typical tropical forests more than threefold [15]. Furthermore, mangrove ecosystems are integral in mitigating the adverse effects of climate change, serving to protect coastal zones from storm surges and counteracting sea level rise through the accumulation of organic material [16]. Mangrove ecosystems support 790 bird species, 40 mammal species, 20 reptile species, and 3 amphibian species. Of these, 48 bird species, 14 reptile species, 1 amphibian species, and 6 mammal species are heavily reliant on mangroves for their habitat and survival [17]. Mangrove ecosystems are presently facing ongoing degradation. The global extent of mangrove ecosystems was estimated to be approximately 152,604 km2 in 2020. Over the 24-year period from 1996 to 2020, approximately 3.4% of mangrove cover was lost due to coastal erosion, aquaculture expansion, oil palm plantations, logging, and land-use conversion [18]. The degradation of mangrove ecosystems results in reduced carbon storage, a loss of biodiversity, and heightened flood risks from rising sea levels, among other problems, thereby necessitating urgent conservation efforts [19].
However, due to the high density and coastal habitat of mangrove forests, access by humans is often difficult. To overcome this challenge, various remote sensing-based studies have been conducted to analyze mangroves and build spatial data for these ecosystems [20,21,22]. Thus, remote sensing via satellites, drones, and aircraft makes it possible to map the spatial distribution of mangroves over large and often inaccessible areas. However, while high-resolution data are essential for the effective conservation and management of mangrove forests in developing countries, access to costly commercial satellite imagery is often limited [23]. In these situations, open-access satellite imagery datasets such as Landsat and Sentinel-2 are essential tools for researchers and policy developers in developing nations [24]. These open datasets are easy to access, regularly updated, and include past satellite records, thus making it possible to conduct time-series analysis. In addition, new techniques for the enhanced analysis and application of remote sensing data are continually being developed.
Recently, machine learning and deep learning approaches have been widely applied in remote sensing studies, particularly for land cover classification and tree species identification. Machine learning, which uses data-driven algorithms to simulate human iterative learning, has seen significant advances in terms of both accuracy and efficiency over the past few decades. The artificial neural network (ANN) has further developed into deep learning algorithms with remarkable capability in handling large-scale datasets and identifying intricate patterns [25]. Various deep learning architectures have been developed, including the convolutional neural network (CNN), fully convolutional network (FCN), and U-Net. These architectures exhibit unique features and advantages, and the selection of an appropriate model should be guided by the specific analysis goals and data characteristics. For instance, CNNs are particularly effective for feature extraction from images, which makes them suitable for tasks such as classification and detection. They are widely used in image classification and object detection applications. Meanwhile, FCN and U-Net architectures are more adept at pixel-level prediction, which makes them highly effective for image segmentation and satellite image analysis [26].
The present study is aimed at assessing the spatial distribution of mangrove habitats in the Solomon Islands by combining remote sensing and deep learning techniques. By utilizing open-source data, the study aims to provide more accurate information than that found in existing datasets, thereby facilitating the development of more precise protection strategies. In particular, the study utilizes freely available resources such as Sentinel-2 satellite imagery and ESA WorldCover to create mangrove detection data for the Solomon Islands with improved accuracy compared to previous global-scale mangrove detection datasets. The study provides an effective analytical methodology for use in developing countries and delivers essential scientific spatial information for the identification of priority mangrove protection areas via hotspot analysis. The study’s objective is to propose a methodology for the selection of priority mangrove protection areas. It is anticipated that the findings will contribute to mangrove protection policies in the Solomon Islands and other similar Pacific Island nations.

2. Materials and Methods

2.1. Study Area

This study was conducted across the entire Solomon Islands. As shown in Figure 1, the Solomon Islands are located between latitudes of 4 and 13°S and longitudes of 154 and 170°E, with a total area of approximately 28,896 km2 and a population of around 740,000. The Solomon Islands comprise more than 900 small islands and 6 larger islands, and these are divided up into ten provinces. The capital district, Honiara, is situated on Guadalcanal Island, which forms the center of one province. To the east lie the provinces of Malaita, Makira-Ulawa, and Temotu, while the provinces of Rennell and Bellona are found to the south. To the north lie the provinces of Central and Isabel, and to the west lie the provinces of Western and Choiseul. The Solomon Islands are located in a tropical climate zone and experience a clear division between dry and wet seasons due to the influence of the southeast trade winds. The dry season lasts from May to October, while the wet season lasts from November to April [27]. The Solomon Islands experience an average annual temperature of 25.9 °C, with an average of 25.6 °C during the dry season and 26.2 °C during the wet season. The region receives an average annual rainfall of 3178.8 mm, with monthly averages of 226.4 mm during the dry season and 303.4 mm during the wet season. Thus, although seasonal temperature fluctuations are minimal, differences in precipitation between the two seasons are relatively significant [28]. The Solomon Islands are characterized by an exceptionally high coverage of forest, encompassing approximately 90.1% of the total land area. The region supports the growth of diverse mangrove species, including Rhizophora apiculata, Bruguiera spp., Nypa fruticans, and Lumnitzera spp. [29]. Mangrove ecosystems serve as habitats for various reptilian species, including estuarine monitors and Komodo dragons, while Varanus spinulosus is an endemic species that is restricted to Santa Isabel Island. This underscores the critical role that mangrove forests play in supporting ecological diversity [29]. Despite their ecological significance, the Solomon Islands are extremely vulnerable to the impacts of climate change and natural hazards. This is primarily because a large portion of the population resides within 1.5 km of the coastline, and is exacerbated by the country’s location within the Pacific Ring of Fire and a cyclone-prone zone [28].
Due to the coastal distribution of mangroves, there was a concern that the use of administrative boundaries as analysis units in the present study might exclude mangroves from mapping. Therefore, a 1 km buffer based on administrative boundaries was established as the study area. Meanwhile, Ontong Java Atoll and Sikaiana Atoll in Malaita Province, along with Rennell and Bellona Province, were excluded from the analysis due to the absence of mangrove habitats.

2.2. Generating Ground Truth Data Based on Field Survey at Langa Langa Lagoon, Malaita

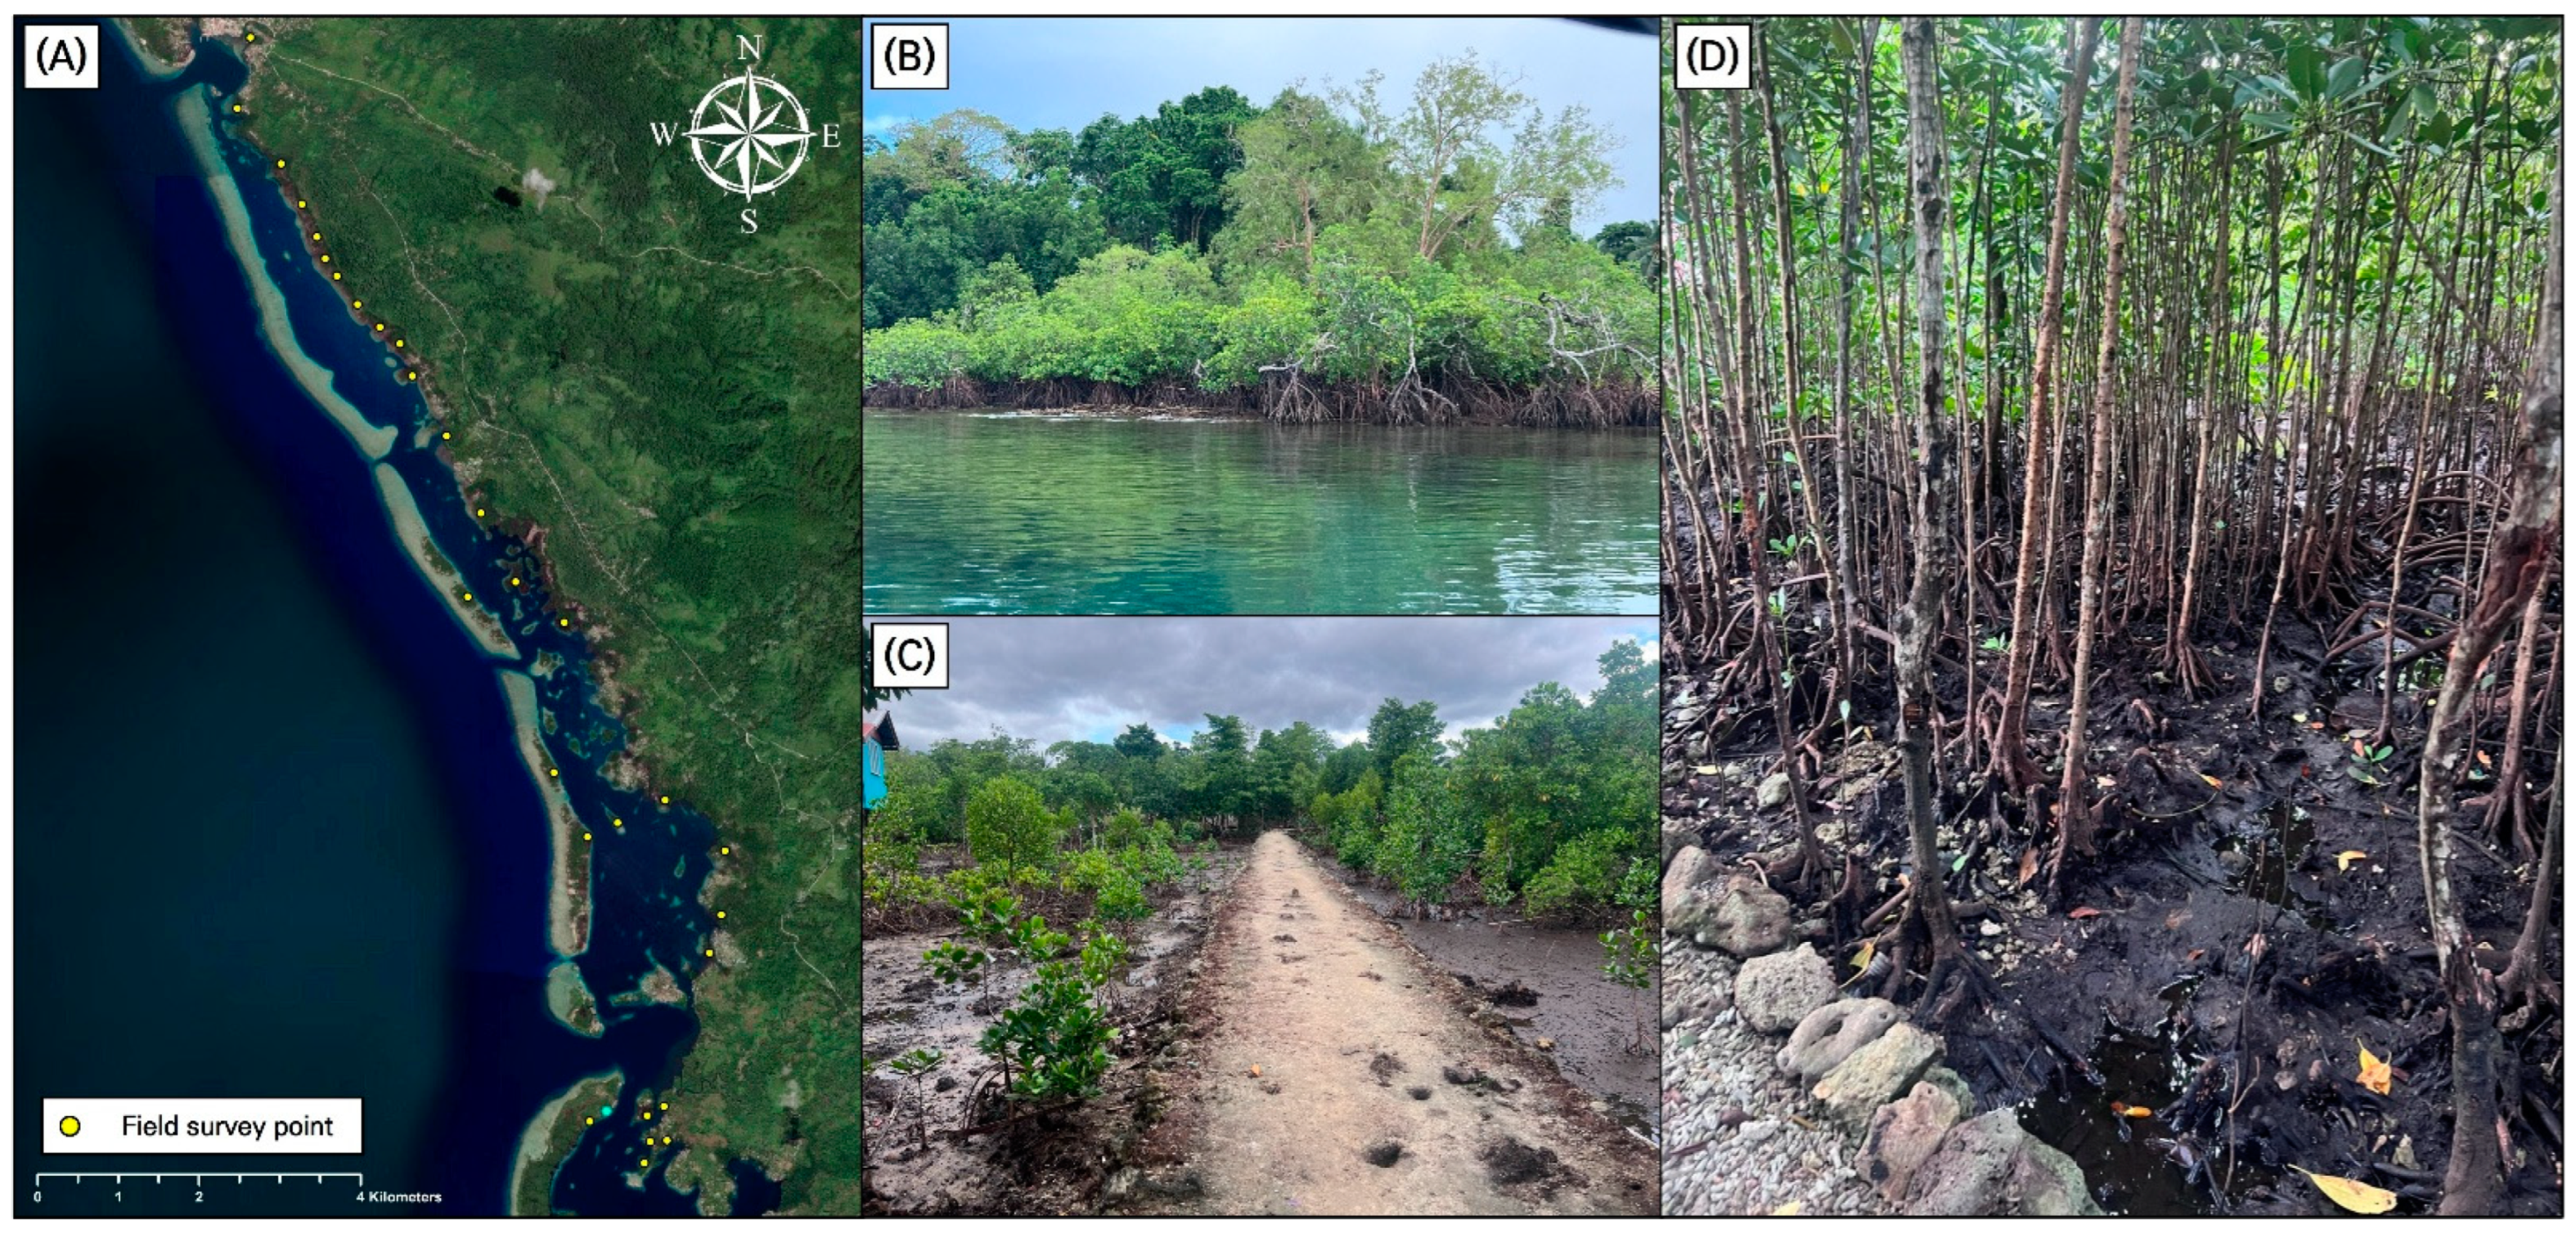
Field surveys were conducted to verify the actual distribution of mangrove habitats in the Solomon Islands, and corresponding ground truth data were established in order to enhance the reliability of the analysis. Although existing datasets such as ESA WorldCover and Global Mangrove Watch provide mangrove distribution information for the Solomon Islands, these datasets are often incomplete. To address these data gaps, field surveys were conducted in the Langa Langa Lagoon area of Malaita Province with the cooperation of the local community, in collaboration with the Solomon Islands National University, targeting mangrove habitats and coastal zones (Table A1). The distance between survey points was set to be over 200 m, and the points were distributed to best represent the entire Langa Langa Lagoon area. This design aimed to avoid overestimation of model accuracy by preventing the concentration of survey points in a limited area. Given the dense distribution of mangroves, several areas were difficult to access. In such cases, visual inspections were conducted from boats on the sea in order to confirm the presence of mangrove stands. Point-based ground truth data generated from the field survey points shown in Figure 2 were used to evaluate the mangrove habitat mapping accuracy of the model.

2.3. Satellite Image Acquisition and Pre-Processing

The present study utilized Sentinel-2 Surface Reflectance (SR) imagery and ESA WorldCover v100 via the Google Earth Engine (GEE). The cloud-based GEE platform offers access to a wide range of open-source satellite imagery datasets, including Landsat, Sentinel, and MODIS. The Sentinel-2 satellite, owned by the European Space Agency (ESA), consists of twin satellites named Sentinel-2A and Sentinel-2B, which capture and provide satellite imagery approximately every 14 days. Additionally, the Sentinel-2 satellite provides shortwave infrared (SWIR) bands and red-edge bands, which exhibit a high response for mangroves and are important bands for the detection of mangrove habitats [30]. The Sentinel-2 satellite has been continuously providing image data since 27 June 2015, with a spatial resolution of 10 m, which is regarded as medium resolution. This is consistent with the resolution of datasets such as ESA WorldCover v100, thus making it suitable for effectively training the mangrove habitat mapping model.
To minimize any interference factors such as clouds and aerosols when training the deep learning model, all of the satellite imagery was processed in the GEE, and the images were subsequently merged to obtain the annual median values. After classifying the satellite imagery with less than 10% cloud cover, a cloud masking process was performed using the Sentinel-2 Cloud Probability Map to remove all pixels with a cloud probability of 20% or more.
To map the mangrove habitats in the Solomon Islands, the present study utilized the annual Sentinel-2 satellite imagery from 2020, 2022, and 2023. The 2020 imagery was specifically extracted to align temporally with the label data provided by ESA WorldCover v100. In 2023, sufficient cloud-free satellite imagery for coastal regions, where mangroves are primarily distributed, was not available for training the deep learning model due to the tropical location of the Solomon Islands. To address this limitation, satellite imagery from 2022 was merged with that from 2023 to generate a combined 2022–2023 dataset, which was subsequently utilized for analysis (Figure 3).

2.4. Indices for Detecting Mangrove Habitats

Mangroves are distributed in coastal wetlands and are subject to periodic submergence and water level fluctuations due to tidal changes [31,32]. Consequently, the spectral values of mangrove forests are more tidally influenced than those of other land cover types, thus resulting in more pronounced variations. This implies that tidal effects can influence the accuracy of mangrove detection based on satellite imagery [33,34]. As a result, the existing satellite-derived index for mangrove detection, known as the mangrove index (MI), is significantly affected by tidal dynamics, such that the specific range of MI values representing mangrove areas differs by region. This indicates the need for an analysis on a regional or country-wide scale [30].
In the present study, the enhanced mangrove index (EMI), mangrove forest index (MFI), and combined mangrove recognition index (CMRI) were used to train the mangrove habitat mapping algorithm and construct the mangrove habitat mapping model. As shown in Table 1, the EMI is calculated using the green, near-infrared (NIR), and SWIR bands. This is effective for mapping mangrove habitats by capturing the spectral contrast between mangroves and understory vegetation in the NIR band, as well as that between mangroves and terrestrial vegetation in the green and SWIR bands [35]. The MFI is constructed using the red, red-edge, and SWIR bands. The red band contributes to mangrove detection due to its high reflectance response associated with strong chlorophyll absorption. The red-edge band is effective in distinguishing submerged mangroves, which show higher reflectance than water, while the SWIR band is used to separate mangroves from water bodies [36]. Meanwhile, the CMRI emphasizes the characteristics of both vegetation and moisture, and is calculated as the difference between the NDVI and the normalized difference wetness index (NDWI). The CMRI has proven effective in enhancing the distinction between mangroves and surrounding coastal vegetation or aquatic environments [37].
The mangrove indices employed in this study incorporate bands such as SWIR and red-edge, which, unlike conventional indices like the NDVI and EVI, commonly used for mangrove detection, more effectively capture the characteristics of mangroves distributed in coastal wetlands. These mangrove indices successfully overcome the limitations of the NDVI and EVI in distinguishing mangroves from other forest types, particularly in areas with high forest biomass. To reflect the spectral bands in which mangroves show high reflectance and significant differences from general forests and water bodies, the EMI, MFI, and CMRI were combined into a composite false-color image, which was then used for model training.

2.5. U-Net-Based Mangrove Habitat Mapping Model

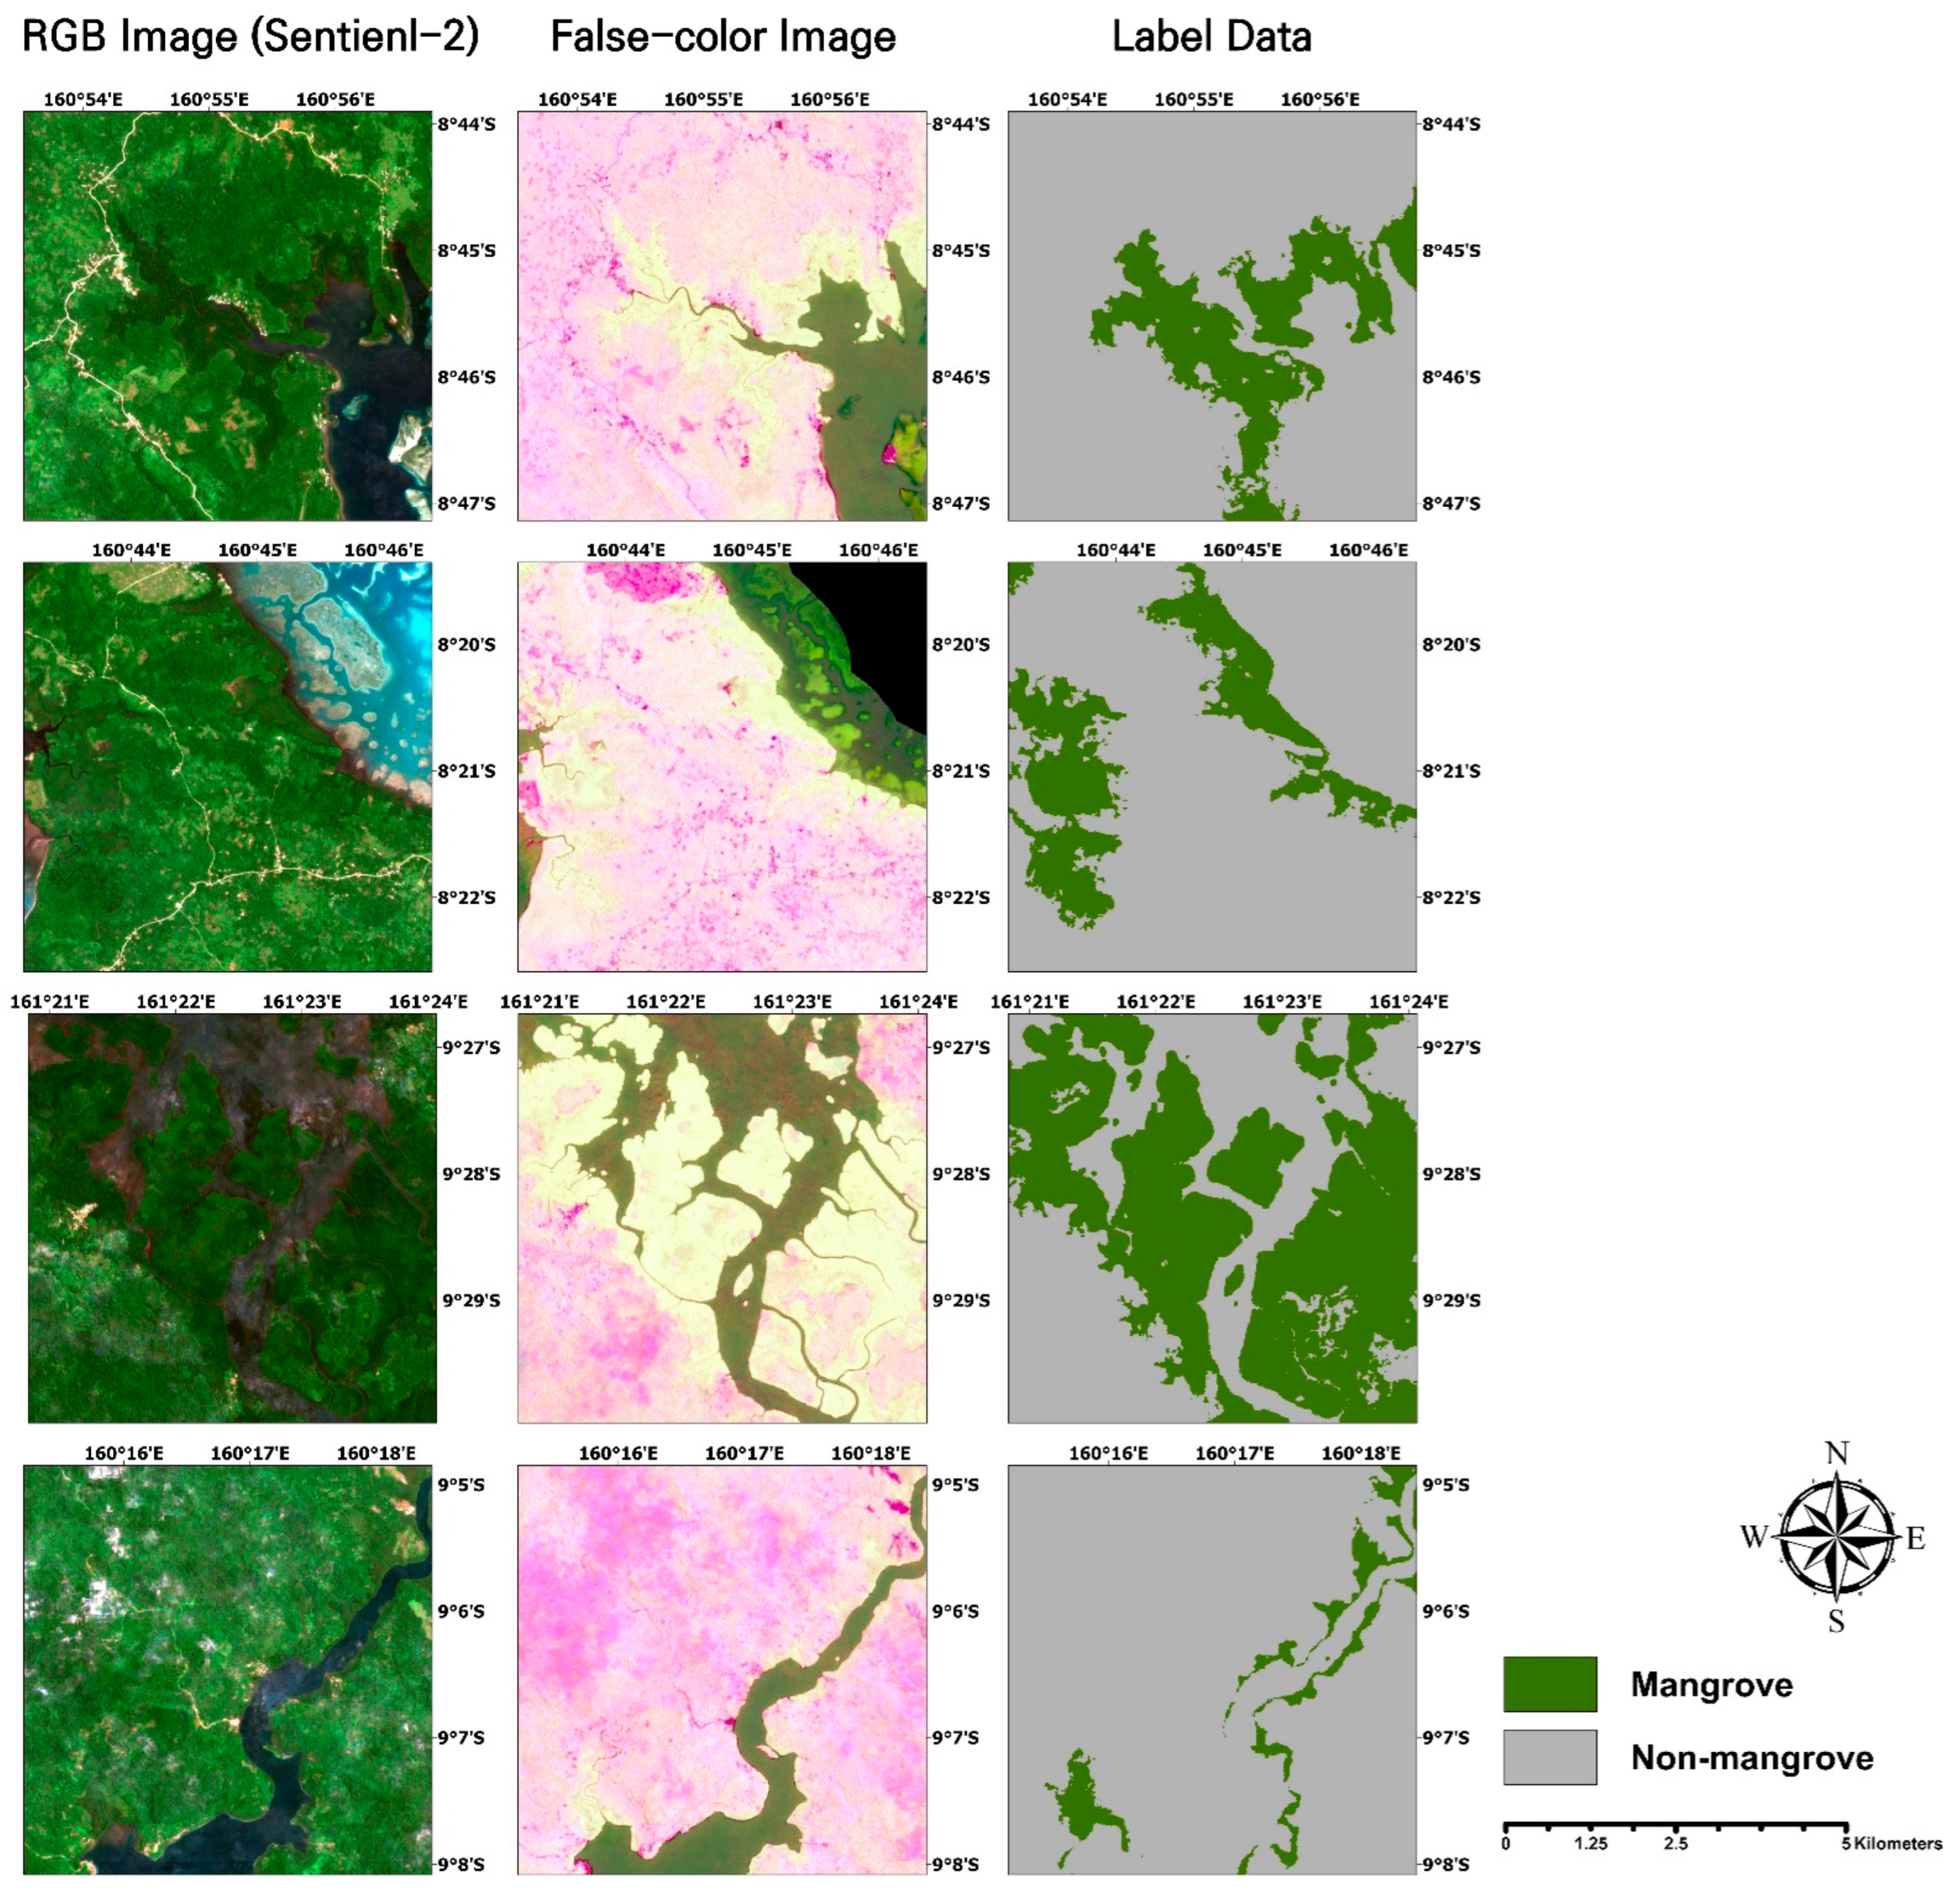
U-Net is a model derived from the application of FCN, and was originally employed in biomedical image segmentation. In recent years, it has been extensively used in satellite image classification research [38,39,40,41]. In this study, the U-Net model was trained using the deep learning library of ArcGIS Pro (version 3.2; ESRI, Redlands, CA, USA). The model was trained and tested on a system equipped with an NVDIA RTX 4070 (12 GB) graphics processing unit (GPU), an Intel i7-13700 central processing unit (CPU), and 32 GB of random access memory (RAM). The U-Net algorithm requires supervised learning and therefore needs both labeled data and training data. In the labeling phase of the deep learning model, mangrove cover classes were extracted from the ESA WorldCover v100 dataset. As shown in Figure 4, the training data used a composite false-color image of the MI, with a patch size of 256 to ensure sufficient learning of the fragmented mangrove regions across the entire Solomon Islands. However, the available training data were insufficient for effective model training. Therefore, a data augmentation technique was used to supplement and increase the diversity of the training data in order to enhance the model’s performance and prevent overfitting. This can be accomplished by applying various transformations, such as translation, rotation, and color modification, to the original images [42,43,44]. Herein, data augmentation methods such as rotation angle, crop, brightness, contrast, zoom, and dihedral affine transformations were applied during model training.
The model validation was conducted by dividing the dataset into training and validation sets with a ratio of 8:2. Precision, recall, and F1-score were used as performance evaluation metrics, as summarized in Table 2. Precision is a measure of the model’s ability to correctly classify the labeled data, while recall assesses its capacity to identify data from regions not included in the training data [45,46,47]. The F1-score is calculated as the harmonic mean of precision and recall, and helps to prevent any overestimation of the classification outcomes due to an imbalance between the other two metrics [47,48].

2.6. Verification of the Mangrove Habitat Model

Herein, a confusion matrix was used to assess the accuracy of the mangrove habitat mapping results. To evaluate the 2023 mapping results, 850 ground truth samples were constructed by randomly selecting locations using high-resolution satellite imagery from Google Earth Pro. These included 200 mangrove and 650 non-mangrove reference points. In addition to precision, recall, and F1-score (Table 2), the overall accuracy, mean intersection over union (IoU), quantity disagreement (QD), and allocation disagreement (AD) were used to evaluate the 2022–2023 mangrove habitat mapping results (Table 3). In particular, the F1-score, mean IoU, QD, and AD were emphasized, as they are relatively less sensitive to class imbalance and therefore provide a more robust evaluation of classification performance. Specifically, the QD and AD serve as performance classification metrics that maintain the reliability of the model under imbalanced dataset conditions by, respectively, assessing the extent of errors in the predicted quantity for each class compared to the actual area, and measuring the spatial misallocation of predicted classes [49]. Meanwhile, the mean IoU is widely used in image segmentation tasks to evaluate the average degree of overlap between predicted regions and corresponding ground truth areas for each class. It is particularly important for assessing the accuracy of boundary predictions in segmentation models [50].
To increase the reliability of the mangrove habitat mapping verification, a field survey was conducted in the Langa Langa Lagoon as a representative mangrove-rich region located in Malaita Province. Based on this fieldwork, 30 ground truth data points specific to mangrove habitats in the Solomon Islands were constructed and employed as reference data for the model validation.

2.7. Hotspot Analysis of the Mangrove Habitat for Assigning Mangrove Protection Areas

Mangrove ecosystems in the Solomon Islands are undergoing continuous degradation and are in urgent need of protection. The establishment of protected areas has been recognized as an effective strategy for preventing mangrove loss, as it enables the conservation of ecologically significant regions and facilitates sustainable management practices [52]. Protected-area designation also plays a critical role in regulating illegal logging and development activities while fostering community-based approaches for sustainable use [53,54]. Moreover, it contributes to climate change mitigation by reducing carbon emissions associated with mangrove degradation.
For the establishment of mangrove protection areas, the present study conducted an optimized hotspot analysis using ArcGIS Pro (version 3.2; ESRI, Redlands, CA, USA) to identify regions of concentrated mangrove distribution that require targeted management and protection efforts. Optimized hotspot analysis is a method of detecting statistically significant clusters within spatial data, and has been widely applied in various research studies [55,56]. Based on the Getis-Ord Gi* statistic, the method analyzes the spatial distribution and clustering of data in order to detect statistically significant clusters with a high concentration of specific values (hot spots) and clusters with a high concentration of low values (cold spots). Furthermore, this approach optimizes the spatial scale and distance threshold in order to conduct an analysis that can effectively reveal patterns within the data. It is a suitable method for identifying areas with high ecological diversity or regions with dense concentrations of particular species, thus making it an effective tool for the establishment of protection areas. This approach has been widely utilized in various research studies [57,58,59].
In the present study, areas identified with 99% confidence as hotspots were classified as regions with high mangrove density. In addition to the size of each mangrove area, the Euclidean distance between mangrove-dense areas and built-up areas, along with that between mangrove-dense areas and roads, was analyzed in order to reflect the likelihood of ecosystem degradation due to human impact. Areas with high accessibility were selected as priority areas that require immediate protection efforts. For the classification of built-up areas, ESA WorldCover v100 was used, while the road data were sourced from OpenStreetMap (OSM) [60]. Each factor was categorized into nine levels, and scores were assigned based on their relative importance. Proximity to built-up areas and roads was regarded as a higher risk factor for mangrove degradation, thus resulting in higher scores, while larger mangrove areas were assigned higher scores due to their greater protection value. The scores for each factor were then combined in order to calculate a composite score, with the highest-scoring regions being selected as priority mangrove protection areas.

3. Results

3.1. Model Evaluation and Verification

3.1.1. Mangrove Habitat Mapping Model Performance

The model performance was evaluated by applying the precision, recall, and F1-score metrics to two distinct classes, namely mangrove and non-mangrove. As summarized in Table 4, the mangrove class achieves precision, recall, and F1 values of 0.888, 0.786, and 0.834, respectively, while the non-mangrove class demonstrates higher values of 0.977, 0.989, and 0.983, respectively. These results indicate that the non-mangrove class is highly accurate, while the mangrove class is effective but exhibits relatively lower performance.

3.1.2. Verification of the Solomon Islands Mangrove Habitat Map

The accuracy of the 2023 mangrove habitat map based on the mangrove classification model was evaluated by constructing the confusion matrix in Table 5. The results indicate high classification performance, with precision, recall, overall accuracy, mean IoU, and F1 values of 0.991, 0.872, 0.960, 0.907, and 0.930, respectively. Additionally, the QD and AD were calculated as 0.0341 and 0.0046, respectively, thus suggesting a low level of disagreement in the classification outputs.

3.2. Enhanced Rapid Mapping of Mangrove Habitat Based on U-Net

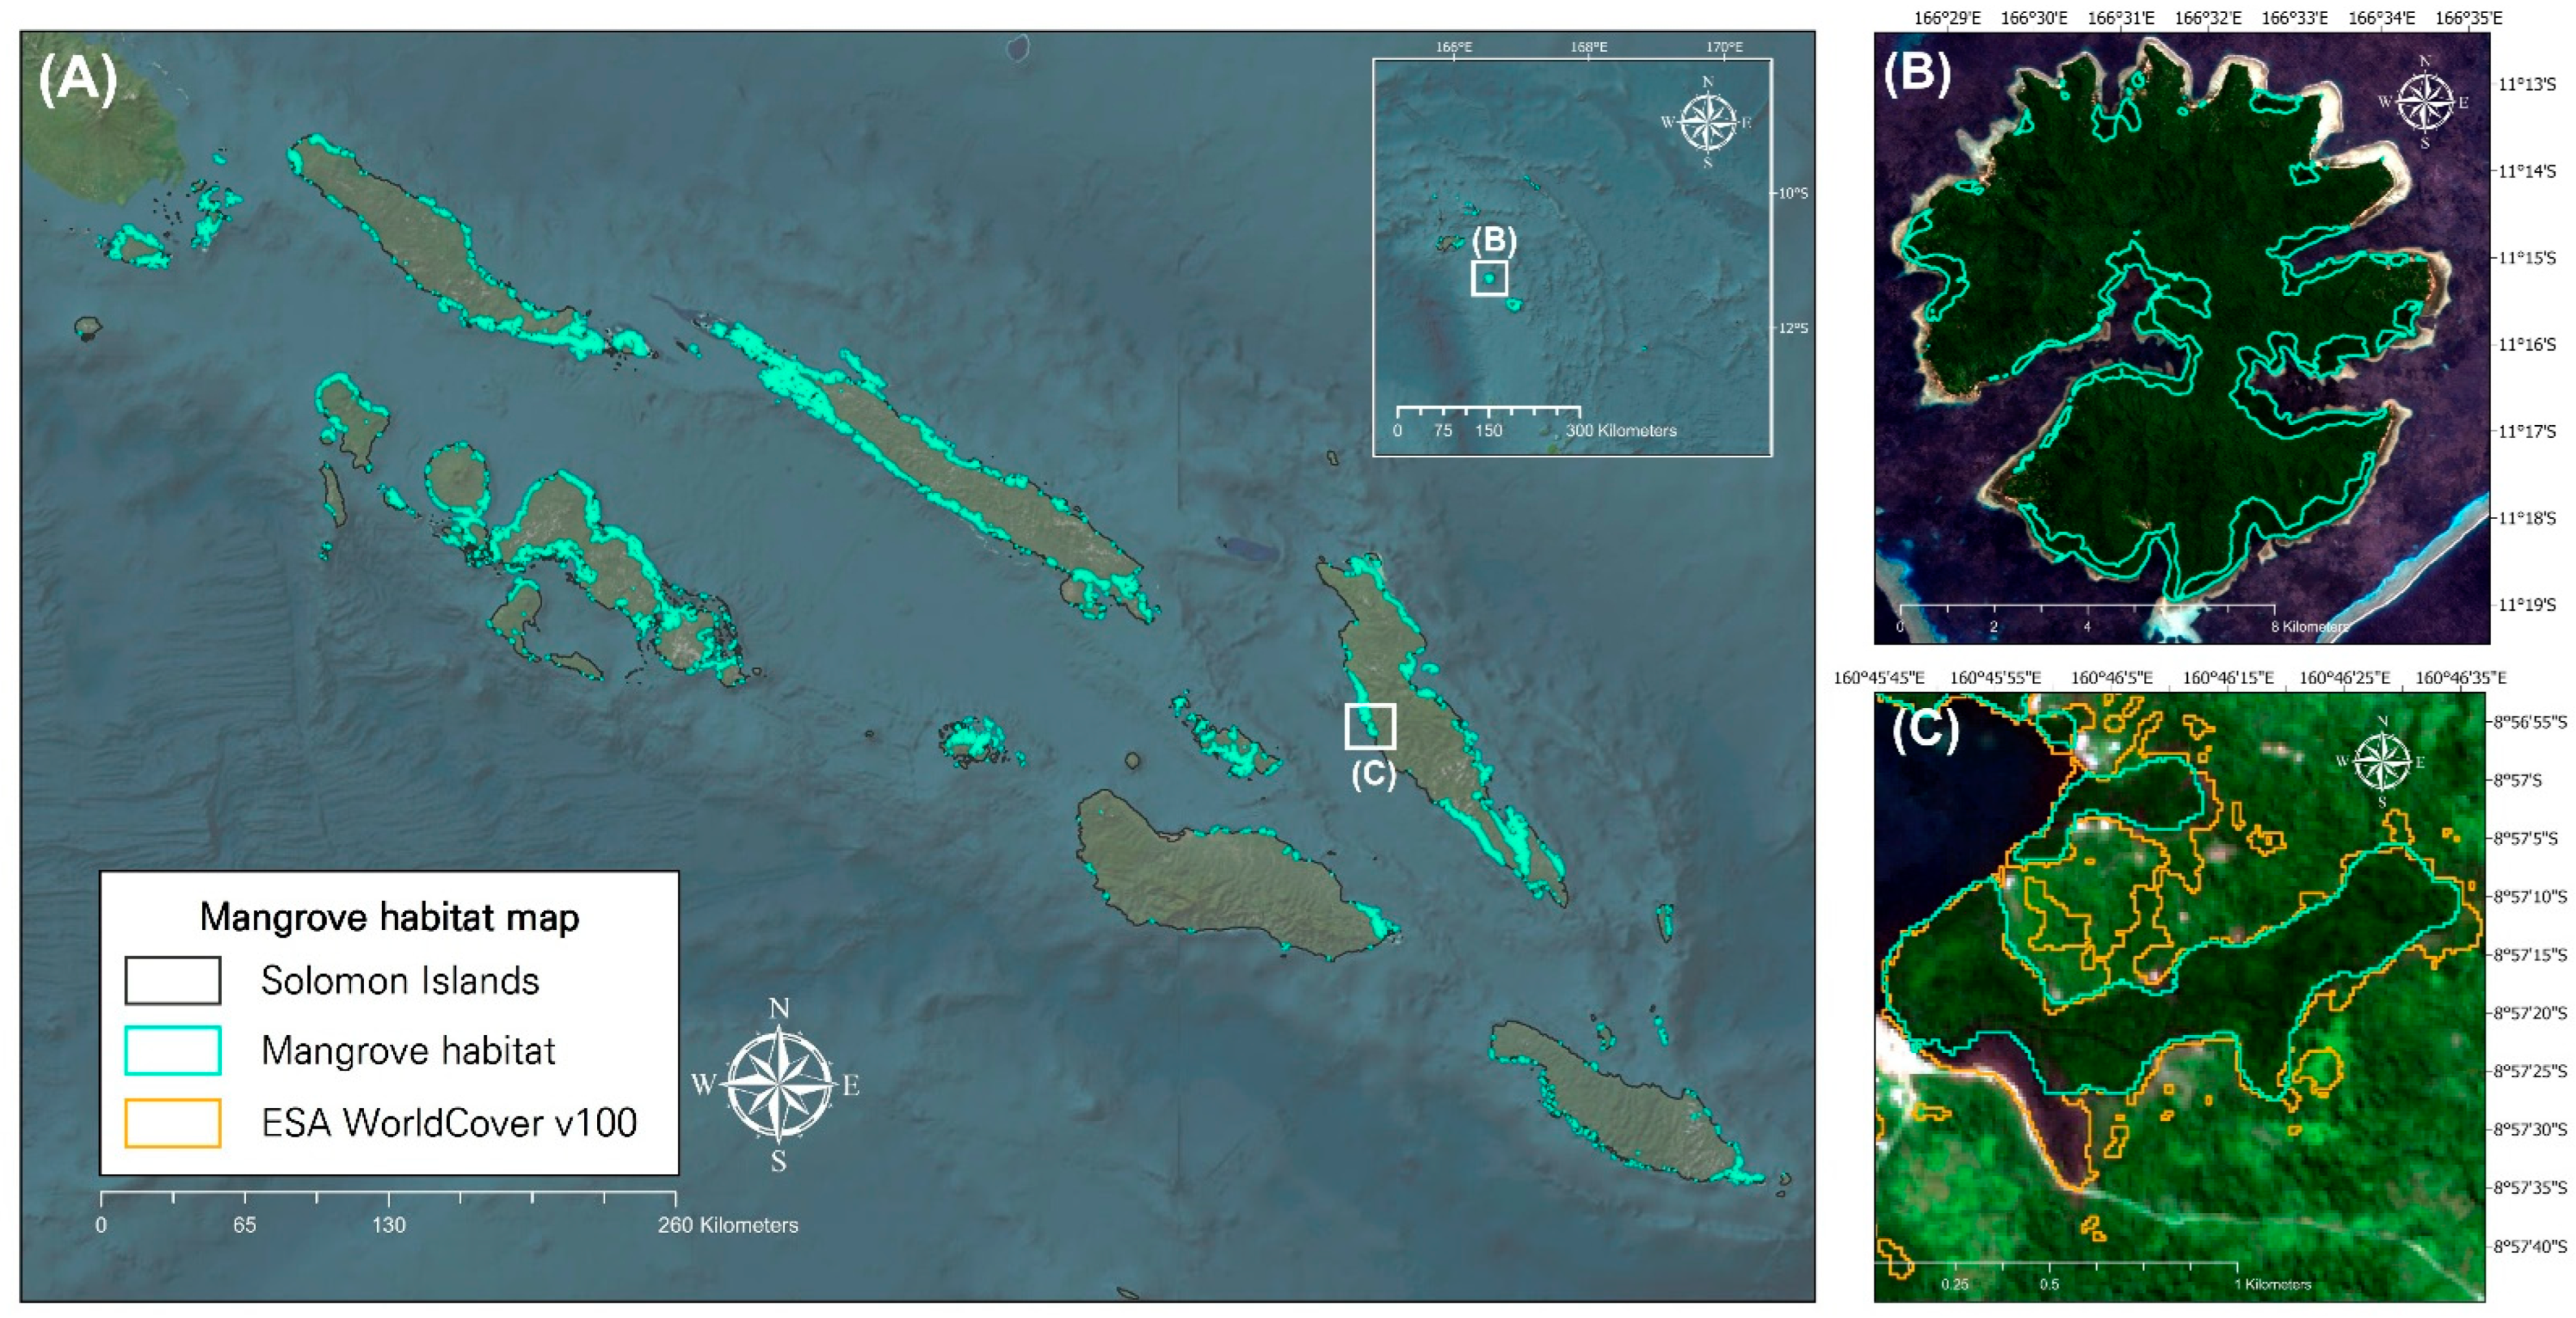
Based on the mangrove habitat mapping model, the mangrove habitat maps for the years 2022–2023 are presented in Figure 5, and the corresponding mangrove areas for the various provinces are summarized in Table 6. Thus, the total mangrove area in the Solomon Islands was estimated to be approximately 71,348.27 ha. Among the provinces containing mangrove habitats, Isabel Province accounts for the largest area at approximately 22,322.25 ha, while Guadalcanal Province has the smallest at around 1205.79 ha. Relative to the total land area of each province, Central Province exhibits the highest proportion of mangrove coverage, while Makira-Ulawa Province has the lowest. By comparison, the ESA WorldCover v100 and Global Mangrove Watch datasets estimated mangrove extents of 85,521.97 and 52,650.57 ha, respectively, for the Solomon Islands in 2020. Thus, the ESA WorldCover v100 overestimated the mangrove coverage by approximately 20% compared to the present study, while Global Mangrove Watch underestimated it by about 26% [18,61]. Notably, the present study successfully captured both undetected mangrove habitats and degraded mangrove areas that were not reflected in the 2020–2021 global datasets.

3.3. Deriving Priority Areas of Mangrove Protection Based on the Mangrove Habitat Hotspot

To determine areas in need of designation as mangrove protection areas, an optimized hotspot analysis was conducted using the mangrove habitat maps from 2022 to 2023, resulting in the development of the mangrove hotspot map presented in Figure 6. This analysis identifies dense mangrove clusters on Komusupa Island, Maroria Island, Uhu Island, and the coastal regions of Areare and Raroisuu in southwestern Malaita Province, as well as on Wagina Island (Choiseul Province) and San Jorge Island (Isabel Province). These findings indicate that the mangrove area and vegetation density in these locations are statistically and spatially significant, exceeding those observed in other regions.
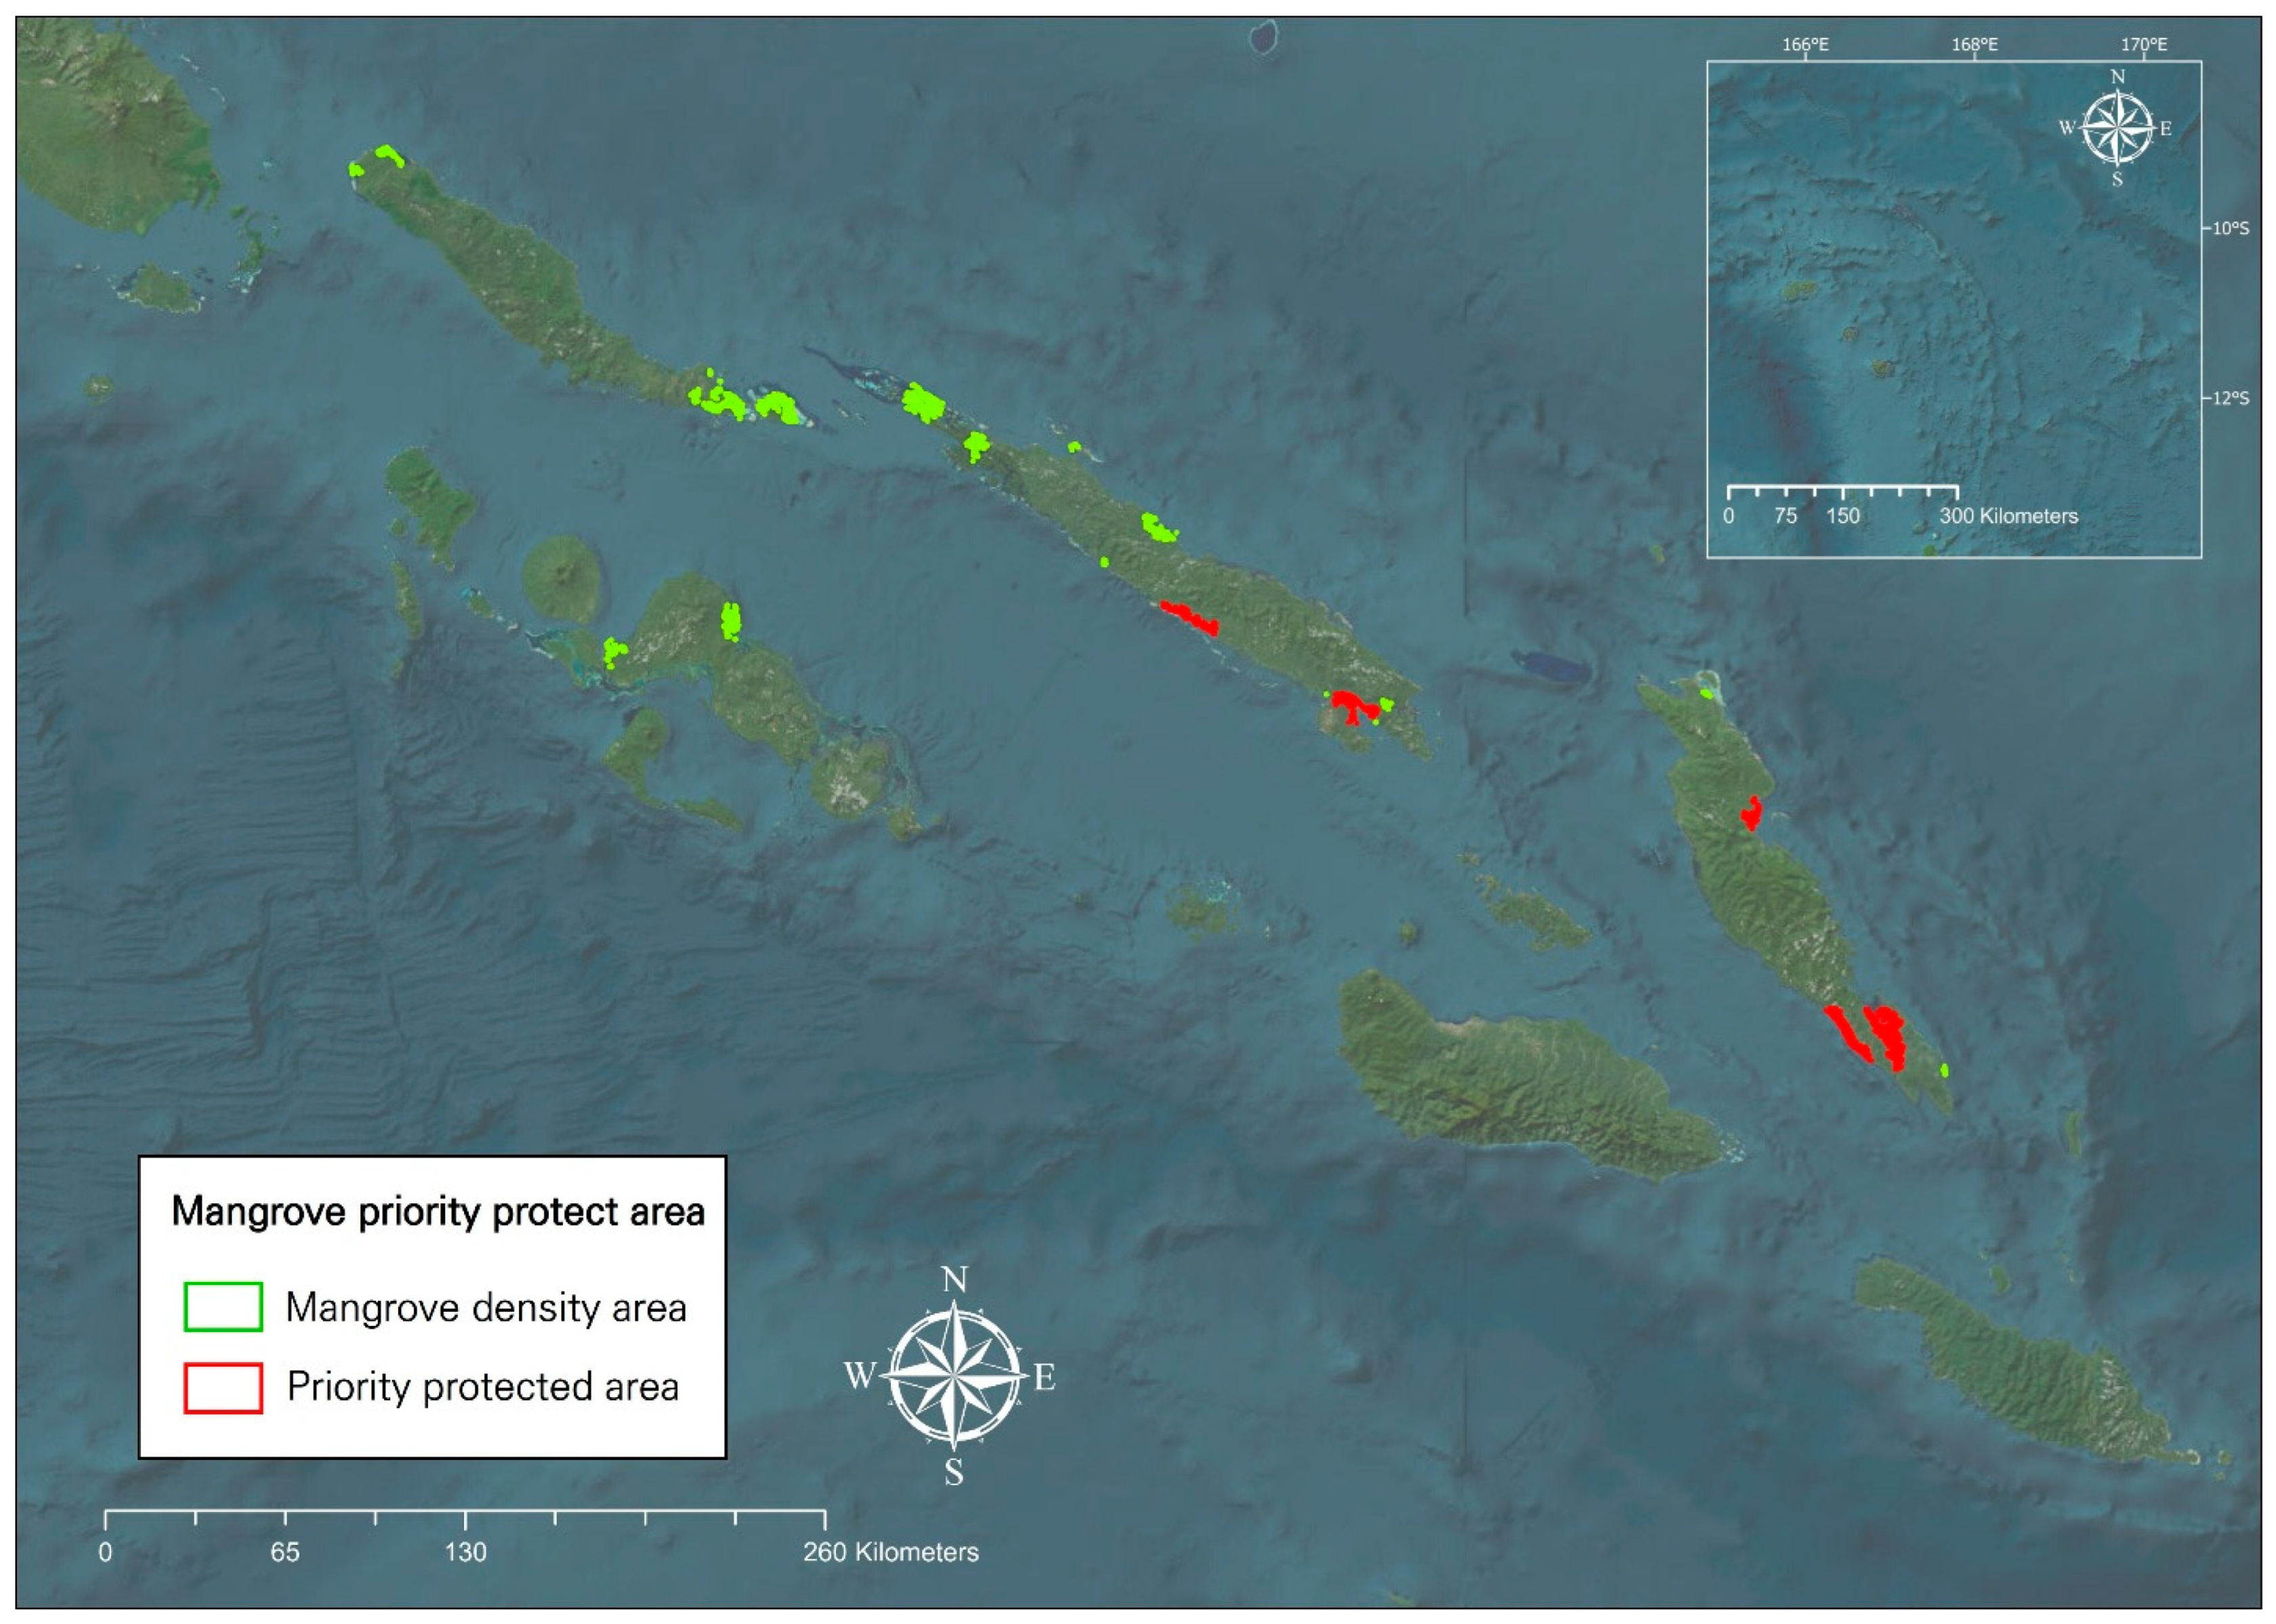
Further, the results of the spatial analysis based on distances from built-up areas and roads are presented in Figure 7. The results show that all of the mangrove-dense areas are connected to roads, thereby indicating high accessibility and a corresponding vulnerability to human-induced degradation. This highlights the urgent need for the designation of priority protection areas. Based on these results, the mangrove-dense areas near Areare, Raroisuu, Nafinua, Komusupa Island, Maroria Island, and Uhu Island in Malaita Province, along with Loalonga, Hurepelo, and Tuarugu in Santa Isabel Province, are identified as requiring priority protection designation. Notably, the mangrove ecosystems near Nafinua and on Komusupa Island, Maroria Island, and Uhu Island are found to be undergoing degradation as a result of development activities such as village and port construction. These findings highlight the critical need for the designation of priority mangrove protection areas in order to mitigate ongoing mangrove degradation.

4. Discussion

The mangrove habitat mapping results obtained through the application of the proposed analytical methodology achieved an overall accuracy of 0.96, thereby outperforming the ESA WorldCover v100 and Global Mangrove Watch v3.0 datasets, which were found to have overall accuracies of 0.744 and 0.931, respectively. Additionally, the proposed model identified mangrove habitat areas that were not detected by ESA WorldCover v100, thus highlighting its superior mapping performance [18,61]. This can be attributed to the integration of open-source satellite data and labeled ground truth data, and the application of mangrove indices that reflect local ecological characteristics.
While ESA WorldCover v100 applies a globally standardized classification framework using a CatBoost-based gradient boosting model trained on over 130 features derived from Sentinel-1 Synthetic Aperture Radar and Sentinel-2 time series, along with additional variables such as DEM, vegetation indices, and ecoregions, the WorldCover product also incorporates expert rules and auxiliary datasets during post-processing to refine its predictions. ESA WorldCover v100 applies a standardized classification algorithm globally, while the present study adopted a localized approach using open-source resources, thereby enabling optimized analysis in data-scarce regions such as developing countries. In contrast, the mangrove habitat detection model is based on a U-Net convolutional neural network trained on false-color composite imagery generated from three mangrove-specific indices, which enhances mangrove-specific spectral signals but does not utilize the same volume of multi-source input data or expert-driven post-processing as WorldCover. These results demonstrate that the proposed methodology provides a cost-efficient and effective tool for environmental management and protection efforts, including mangrove distribution analysis, by leveraging open-source data. Given that it does not rely on expert-driven rule-based post-processing or additional datasets, the approach holds significant potential for application in regions with limited data and resources. However, since this study focused exclusively on the Solomon Islands, additional cross-validation with datasets from other geographic regions and varying ecological conditions is essential to assess the generalizability and robustness of the proposed methodology.
The study utilized multiple evaluation metrics to assess the model performance and classification accuracy. Specifically, precision, recall, and F1-score were applied to evaluate the detection capability of the model, while the mangrove classification map was validated using a comprehensive set of metrics, including the above three along with the overall accuracy, mean IoU, QD, and AD. The adoption of diverse evaluation criteria ensured that the performance assessment was not biased by a single metric, thereby allowing for an objective evaluation of the model’s accuracy.
Despite the overall effectiveness of the proposed model, a notable limitation is its relatively low detection accuracy for mangrove areas compared to non-mangrove areas. This discrepancy is primarily attributed to an imbalance in the training data, as mangrove samples were underrepresented. Specifically, mangrove areas account for only about 2.47% of the total land area in the Solomon Islands, resulting in a significantly smaller proportion of mangrove pixels during the training data generation process. As a result, the model was exposed to far fewer mangrove samples, which likely contributed to the lower model performance observed for the mangrove class. Additionally, the lower performance of the mangrove class compared to the non-mangrove class led to the underestimation of mangrove extent relative to non-mangrove areas.
Although field surveys were conducted to supplement the validation data with ground truth data, the data collection was confined to the Langa Langa Lagoon, and no ground truth data were available for other regions of the Solomon Islands. Furthermore, due to the lack of sufficient field survey data, ground truth could not be incorporated into the training dataset. This limitation hindered our ability to validate the model comprehensively across the entire study area. To date, a comprehensive national-scale vegetation survey has not been conducted in the Solomon Islands, and obtaining sufficient ground truth data remains challenging due to the significant time and resource requirements. To overcome this limitation, local-community-based mapping is proposed as a practical alternative that leverages the knowledge and participation of local communities to facilitate data collection and validation in a cost- and time-efficient manner [62]. This approach is particularly suitable for regions where access to conventional field surveys is limited. Through this approach, it will be necessary to secure additional ground truth data in the future to improve model performance by addressing the imbalance in the training dataset.
To designate mangrove priority protection areas and support policy decision-making processes, the present study conducted an analysis using a scientific approach based on optimized hotspot analysis, including the proximity to roads and built-up areas, and the total mangrove area. The analysis confirmed the presence of densely distributed mangrove regions in specific areas. Notably, all identified high-density mangrove zones were located in close proximity to roads, thereby indicating a heightened vulnerability to human disturbance. Considering that mangrove degradation in the Solomon Islands is predominantly driven by anthropogenic factors, it is imperative that these areas be prioritized for protection in order to mitigate further loss. The outcomes of this research offer valuable insights for the formulation of effective protection strategies and may serve as a baseline for future protection planning and policy development. However, the analysis presented herein relied solely on mangrove classification data, without incorporating additional dimensions such as biodiversity, ecosystem services, or socio-demographic variables, which remains a limitation of the present study.
In recent years, there has been growing interest in the development of simplified and accessible methodologies for rapid environmental assessments in developing countries [63,64,65]. The approach proposed herein does not rely on costly remote sensing sources such as aerial imagery, drones, or high-resolution satellite data; instead, it is based on freely available open-source datasets and utilizes a time-efficient model architecture. This demonstrates the potential for practical application of the methodology in protection planning and coastal management within resource-limited settings. The optimized hotspot analysis conducted herein identified potential mangrove protection areas across the Solomon Islands. Currently, mangroves in the Solomon Islands cover approximately 71,348.27 ha, corresponding to about 2.47% of the country’s territory. These mangrove ecosystems are primarily concentrated in Choiseul, Isabel, and Malaita Provinces, as confirmed by the hotspot analysis. However, there are no designated mangrove protection areas in the Solomon Islands. While mangroves are nominally protected under the Resources and Timber Utilization Act, they are increasingly exploited for firewood, timber, boat construction, fish traps, and roofing materials. This has resulted in ongoing degradation driven by overexploitation and urban expansion [29]. These results suggest the urgent need for the establishment of nationally managed mangrove protection areas and comprehensive coastal management regulations, supported by continuous monitoring and conservation efforts.
Unlike many previous studies that relied on traditional machine learning techniques, this study applied a deep learning-based U-Net model for mangrove habitat detection [66,67,68]. In addition, unlike approaches that used vegetation indices, this study enhanced classification performance by utilizing a composite image derived from three mangrove-specific indices [69,70]. This approach enabled the model to detect mangrove areas more precisely, which are often difficult to identify using global mangrove datasets. Furthermore, rather than relying on expensive data sources such as high-resolution satellite imagery or UAVs, the proposed framework is built on freely accessible open-source datasets [71,72]. This cost-efficient approach provides a practical alternative that is suitable for application in developing countries where technical and financial resources are limited. These methodological distinctions offer a foundation for developing effective conservation strategies even in data- and resource-constrained settings.
Building on the methodology proposed herein, future research may focus on developing more refined conservation strategies for the Solomon Islands by incorporating a climate-change based mangrove habitat suitability analysis. The mid- to long-term designation of mangrove protection areas and the establishment of coastal management policies could be significantly enhanced by accounting for projected sea level rise, temperature variation, and shifts in precipitation patterns under different climate change scenarios. As these environmental factors directly influence the spatial distribution of mangrove habitats, their integration into habitat modeling frameworks will be crucial for informed decision-making processes. The prediction of future mangrove distributions based on climate change projections and the tailoring of protection strategies to regional conditions will be essential for effective and sustainable conservation planning.

5. Conclusions

Herein, a structured approach was proposed for the mapping of mangrove habitats and the designation of priority protection areas in the Solomon Islands by utilizing open-source datasets and a combination of mangrove-specific indices. A deep learning-based mangrove habitat mapping model was developed and trained on satellite imagery, and was successfully used to detect mangrove distributions. The model achieved a high mangrove detection accuracy, effectively separating mangrove habitats from other forest areas. The total mangrove area was estimated to be approximately 71,348.27 ha, with major distributions observed in Isabel, Western, and Malaita Provinces. Using an optimized hotspot analysis, the study identified high-density mangrove regions, and by analyzing the spatial proximity to roads and urban centers, the study delineated specific zones that require urgent conservation efforts. These findings provide scientific justification for establishing national-scale mangrove protection areas in response to the ongoing degradation of mangrove ecosystems. The proposed framework highlights the utility of open-source satellite data and deep learning in producing high-accuracy mangrove maps and supporting evidence-based conservation planning. Furthermore, this study offers practical insights that may be adapted for mangrove conservation in other tropical regions, particularly in data-scarce developing countries. The proposed methodology also contributes to global climate change mitigation strategies by enhancing the monitoring and protection of blue-carbon ecosystems such as mangroves.

Author Contributions

Conceptualization: H.K.A., S.K., C.S. and C.-H.L.; methodology: H.K.A., S.K., C.S. and C.-H.L.; validation: H.K.A.; formal analysis: H.K.A. and S.K.; investigation: H.K.A.; data curation: H.K.A. and S.K.; writing—original draft preparation: H.K.A.; writing—review and editing: H.K.A. and C.-H.L.; visualization: H.K.A.; supervision: C.-H.L. All authors have read and agreed to the published version of the manuscript.

Funding

This research was funded by a National Research Foundation of Korea grant provided by the Ministry of Science and ICT (No. 2022R1C1C1008489), Korea Forest Service Government as “Graduate School specialized in Carbon Sink” and UN Climate Technology Centre and Network.

Data Availability Statement

The original contributions presented in this study are included in the article. Further inquiries can be directed to the corresponding author.

Acknowledgments

We appreciate the cooperation of Solomon Islands National University in Honiara, Solomon Islands, who provided the regional information and field campaign opportunity.

Conflicts of Interest

The authors declare no conflicts of interest.

Abbreviations

The following abbreviations are used in this manuscript:
ANNArtificial neural network
CNNConvolutional neural network
FCNFully convolutional neural network
GEEGoogle Earth Engine
NIRNear-infrared
SWIRShortwave infrared
EMIEnhanced mangrove index
MFIMangrove forest index
CMRICombined mangrove recognition index
QDQuantity disagreement
ADAllocation disagreement

Appendix A

Table A1. Field survey point locations in Solomon Islands.
Point IDLongitudeLatitudeClass
1160.7013−8.77367Mangrove
2160.6998−8.78145
3160.7047−8.78756
4160.707−8.79202
5160.7109−8.7999
6160.7157−8.80553
7160.7193−8.81089
8160.727−8.82596
9160.7231−8.81748
10160.7308−8.83353
11160.7422−8.86005
12160.7537−8.87016
13160.7524−8.87437
14160.7455−8.89226
15160.7473−8.89123
16160.7477−8.89499
17160.7451−8.89739
18160.7388−8.86159
19160.7541−8.86313
20160.7351−8.85451
21160.7255−8.83519
22160.7087−8.79558
23160.7096−8.79799
24160.718−8.80734
25160.7132−8.80303
26160.7362−8.838
27160.7475−8.85755
28160.7458−8.8951
29160.7391−8.89287
30160.7409−8.89174

References

  1. Sweet, W.V.; Kopp, R.E.; Weaver, C.P.; Obeysekera, J.; Horton, R.M.; Thieler, E.R.; Zervas, C. Global and Regional Sea Level Rise Scenarios for the United States. 2017. Available online: https://repository.library.noaa.gov/view/noaa/18399 (accessed on 8 April 2025).
  2. Masson-Delmotte, V.; Zhai, P.; Pörtner, H.-O.; Roberts, D.; Skea, J.; Shukla, P.R.; Pirani, A.; Moufouma-Okia, W.; Péan, C.; Pidcock, R.; et al. Global Warming of 1.5 °C. In An IPCC Special Report on the Impacts of Global Warming of 1.5 °C Above Pre-Industrial Levels and Related Global Greenhouse Gas Emission Pathways, in the Context of Strengthening the Global Response to the Threat of Climate Change, Sustainable Development, and Efforts to Eradicate Poverty; IPCC: Geneva, Switzerland, 2018. [Google Scholar]
  3. Bouwer, L.M. Observed and Projected Impacts from Extreme Weather Events: Implications for Loss and Damage. In Loss and Damage from Climate Change; Mechler, R., Bouwer, L.M., Schinko, T., Surminski, S., Linnerooth-Bayer, J., Eds.; Springer International Publishing: Cham, Switzerland, 2019; pp. 63–82. ISBN 978-3-319-72026-5. [Google Scholar]
  4. Zamrsky, D.; Oude Essink, G.H.P.; Bierkens, M.F.P. Global Impact of Sea Level Rise on Coastal Fresh Groundwater Resources. Earth’s Future 2024, 12, e2023EF003581. [Google Scholar] [CrossRef]
  5. Newman, E.D.; Rowland, J.B.; Hammer, T.G.; Frost, L.A.; Lumibao, C.Y.; Henning, J.A. Trade-Offs in Arbuscular Mycorrhizal Fungal Responses to Drought and Salinity Stress in Panicum amarum (United States Gulf Coast). J. Coast. Res. 2024, 40, 51–63. [Google Scholar] [CrossRef]
  6. Friess, D.A.; Adame, M.F.; Adams, J.B.; Lovelock, C.E. Mangrove forests under climate change in a 2 C world. WIRES Clim. Change 2022, 13, e792. [Google Scholar] [CrossRef]
  7. Liu, Z.; He, N.; Wang, C.; Qu, C. Analysis of the Cutting Strategy of Five Different Tree Species Targeting Carbon Sequestration. Forests 2023, 14, 238. [Google Scholar] [CrossRef]
  8. Cherinet, A.; Lemi, T. The role of forest ecosystems for carbon sequestration and poverty alleviation in Ethiopia. Int. J. For. Res. 2023, 2023, 3838404. [Google Scholar] [CrossRef]
  9. Malhi, Y.; Meir, P.; Brown, S. Forests, carbon and global climate. Philos. Trans. R. Soc. A Math. Phys. Eng. Sci. 2002, 360, 1567–1591. [Google Scholar] [CrossRef] [PubMed]
  10. Hilmi, N.; Chami, R.; Sutherland, M.D.; Hall-Spencer, J.M.; Lebleu, L.; Benitez, M.B.; Levin, L.A. The role of blue carbon in climate change mitigation and carbon stock conservation. Front. Clim. 2021, 3, 710546. [Google Scholar] [CrossRef]
  11. Pendleton, L.; Donato, D.C.; Murray, B.C.; Crooks, S.; Jenkins, W.A.; Sifleet, S. Estimating Global “Blue Carbon” Emissions from Conversion and Degradation of Vegetated Coastal Ecosystems. PLoS ONE 2012, 7, e43542. [Google Scholar] [CrossRef]
  12. Macreadie, P.I.; Costa, M.D.P.; Atwood, T.B.; Friess, D.A.; Kelleway, J.J.; Kennedy, H.; Lovelock, C.E.; Serrano, O.; Duarte, C.M. Blue carbon as a natural climate solution. Nat. Rev. Earth Environ. 2021, 2, 826–839. [Google Scholar] [CrossRef]
  13. Friess, D.A.; Rogers, K.; Lovelock, C.E.; Krauss, K.W.; Hamilton, S.E.; Lee, S.Y.; Lucas, R.; Primavera, J.; Rajkaran, A.; Shi, S. The state of the world’s mangrove forests: Past, present, and future. Annu. Rev. Environ. Resour. 2019, 44, 89–115. [Google Scholar] [CrossRef]
  14. Kauffman, J.B.; Adame, M.F.; Arifanti, V.B.; Schile-Beers, L.M.; Bernardino, A.F.; Bhomia, R.K.; Donato, D.C.; Feller, I.C.; Ferreira, T.O.; del Carmen Jesus Garcia, M.; et al. Total Ecosystem Carbon Stocks of Mangroves across Broad Global Environmental and Physical Gradients. Ecol. Monogr. 2020, 90, e01405. [Google Scholar] [CrossRef]
  15. Donato, D.C.; Kauffman, J.B.; Murdiyarso, D.; Kurnianto, S.; Stidham, M.; Kanninen, M. Mangroves among the most carbon-rich forests in the tropics. Nat. Geosci. 2011, 4, 293–297. [Google Scholar] [CrossRef]
  16. Ward, R.D.; Friess, D.A.; Day, R.H.; Mackenzie, R.A. Impacts of climate change on mangrove ecosystems: A region by region overview. Ecosyst. Health Sustain. 2016, 2, e01211. [Google Scholar] [CrossRef]
  17. Luther, D.A.; Greenberg, R. Mangroves: A global perspective on the evolution and conservation of their terrestrial vertebrates. BioScience 2009, 59, 602–612. [Google Scholar] [CrossRef]
  18. Bunting, P.; Rosenqvist, A.; Hilarides, L.; Lucas, R.M.; Thomas, N.; Tadono, T.; Worthington, T.A.; Spalding, M.; Murray, N.J.; Rebelo, L.-M. Global Mangrove Extent Change 1996–2020: Global Mangrove Watch Version 3.0. Remote Sens. 2022, 14, 3657. [Google Scholar] [CrossRef]
  19. Temmerman, S.; Meire, P.; Bouma, T.J.; Herman, P.M.; Ysebaert, T.; De Vriend, H.J. Ecosystem-based coastal defence in the face of global change. Nature 2013, 504, 79–83. [Google Scholar] [CrossRef]
  20. Giri, C.; Ochieng, E.; Tieszen, L.L.; Zhu, Z.; Singh, A.; Loveland, T.; Masek, J.; Duke, N. Status and distribution of mangrove forests of the world using earth observation satellite data. Glob. Ecol. Biogeogr. 2011, 20, 154–159. [Google Scholar] [CrossRef]
  21. Giri, C.; Pengra, B.; Zhu, Z.; Singh, A.; Tieszen, L.L. Monitoring mangrove forest dynamics of the Sundarbans in Bangladesh and India using multi-temporal satellite data from 1973 to 2000. Estuar. Coast. Shelf Sci. 2007, 73, 91–100. [Google Scholar] [CrossRef]
  22. Wang, L.; Jia, M.; Yin, D.; Tian, J. A Review of Remote Sensing for Mangrove Forests: 1956–2018. Remote Sens. Environ. 2019, 231, 111223. [Google Scholar] [CrossRef]
  23. Zhu, Z.; Wulder, M.A.; Roy, D.P.; Woodcock, C.E.; Hansen, M.C.; Radeloff, V.C.; Healey, S.P.; Schaaf, C.; Hostert, P.; Strobl, P.; et al. Benefits of the Free and Open Landsat Data Policy. Remote Sens. Environ. 2019, 224, 382–385. [Google Scholar] [CrossRef]
  24. Wulder, M.A.; Coops, N.C. Satellites: Make Earth observations open access. Nature 2014, 513, 30–31. [Google Scholar] [CrossRef]
  25. Janiesch, C.; Zschech, P.; Heinrich, K. Machine learning and deep learning. Electron. Mark. 2021, 31, 685–695. [Google Scholar] [CrossRef]
  26. Yuan, X.; Shi, J.; Gu, L. A review of deep learning methods for semantic segmentation of remote sensing imagery. Expert Syst. Appl. 2021, 169, 114417. [Google Scholar] [CrossRef]
  27. FAO. Country Report: The State of the Solomon Island’s Biodiversity for Food and Agriculture; FAO: Rome, Italy, 2019. [Google Scholar]
  28. World Bank Climate Change Knowledge Portal: Solomon Islands. Available online: https://climateknowledgeportal.worldbank.org/country/solomon-islands/climate-data-historical (accessed on 8 April 2025).
  29. Spalding, M.; Kainuma, M.; Collins, L. World Atlas of Mangroves (Version 3); Routledge: London, UK, 2010. [Google Scholar]
  30. Tran, T.V.; Reef, R.; Zhu, X. A review of spectral indices for mangrove remote sensing. Remote Sens. 2022, 14, 4868. [Google Scholar] [CrossRef]
  31. Nagelkerken, I.; Blaber, S.J.M.; Bouillon, S.; Green, P.; Haywood, M.; Kirton, L.G.; Meynecke, J.-O.; Pawlik, J.; Penrose, H.M.; Sasekumar, A.; et al. The Habitat Function of Mangroves for Terrestrial and Marine Fauna: A Review. Aquat. Bot. 2008, 89, 155–185. [Google Scholar] [CrossRef]
  32. Collins, D.S.; Avdis, A.; Allison, P.A.; Johnson, H.D.; Hill, J.; Piggott, M.D.; Hassan, M.H.A.; Damit, A.R. Tidal dynamics and mangrove carbon sequestration during the Oligo-Miocene in the South China Sea. Nat. Commun. 2017, 8, 15698. [Google Scholar] [CrossRef]
  33. Xia, Q.; Qin, C.-Z.; Li, H.; Huang, C.; Su, F.-Z. Mapping Mangrove Forests Based on Multi-Tidal High-Resolution Satellite Imagery. Remote Sens. 2018, 10, 1343. [Google Scholar] [CrossRef]
  34. Prihantono, J.; Nakamura, T.; Nadaoka, K.; Wirasatriya, A.; Adi, N.S. Rainfall Variability and Tidal Inundation Influences on Mangrove Greenness in Karimunjawa National Park, Indonesia. Sustainability 2022, 14, 8948. [Google Scholar] [CrossRef]
  35. Prayudha, B.; Ulumuddin, Y.I.; Siregar, V.; Agus, S.B.; Prasetyo, L.B.; Avianto, P.; Ramadhani, M.R. Enhanced mangrove index: A spectral index for discrimination understorey, nypa, and mangrove trees. MethodsX 2024, 12, 102778. [Google Scholar] [CrossRef]
  36. Jia, M.; Wang, Z.; Wang, C.; Mao, D.; Zhang, Y. A New Vegetation Index to Detect Periodically Submerged Mangrove Forest Using Single-Tide Sentinel-2 Imagery. Remote Sens. 2019, 11, 2043. [Google Scholar] [CrossRef]
  37. Gupta, K.; Mukhopadhyay, A.; Giri, S.; Chanda, A.; Majumdar, S.D.; Samanta, S.; Mitra, D.; Samal, R.N.; Pattnaik, A.K.; Hazra, S. An Index for Discrimination of Mangroves from Non-Mangroves Using LANDSAT 8 OLI Imagery. MethodsX 2018, 5, 1129–1139. [Google Scholar] [CrossRef]
  38. Ronneberger, O.; Fischer, P.; Brox, T. U-net: Convolutional networks for biomedical image segmentation. In Proceedings of the Medical Image Computing and Computer-Assisted Intervention–MICCAI 2015: 18th International Conference, Munich, Germany, 5–9 October 2015; Proceedings, Part III 18. Springer: Cham, Switzerland, 2015; pp. 234–241. [Google Scholar]
  39. Kim, J.; Lim, C.-H.; Jo, H.-W.; Lee, W.-K. Phenological Classification Using Deep Learning and the Sentinel-2 Satellite to Identify Priority Afforestation Sites in North Korea. Remote Sens. 2021, 13, 2946. [Google Scholar] [CrossRef]
  40. Pan, Z.; Xu, J.; Guo, Y.; Hu, Y.; Wang, G. Deep Learning Segmentation and Classification for Urban Village Using a Worldview Satellite Image Based on U-Net. Remote Sens. 2020, 12, 1574. [Google Scholar] [CrossRef]
  41. Solórzano, J.V.; Mas, J.F.; Gao, Y.; Gallardo-Cruz, J.A. Land Use Land Cover Classification with U-Net: Advantages of Combining Sentinel-1 and Sentinel-2 Imagery. Remote Sens. 2021, 13, 3600. [Google Scholar] [CrossRef]
  42. Perez, L.; Wang, J. The effectiveness of data augmentation in image classification using deep learning. arXiv 2017, arXiv:1712.04621. [Google Scholar] [CrossRef]
  43. Mikołajczyk, A.; Grochowski, M. Data augmentation for improving deep learning in image classification problem. In Proceedings of the 2018 International Interdisciplinary PhD Workshop (IIPhDW), Swinoujscie, Poland, 9–12 May 2018; pp. 117–122. [Google Scholar]
  44. Shorten, C.; Khoshgoftaar, T.M. A survey on Image Data Augmentation for Deep Learning. J. Big Data 2019, 6, 60. [Google Scholar] [CrossRef]
  45. Juba, B.; Le, H.S. Precision-Recall versus Accuracy and the Role of Large Data Sets. Proc. AAAI Conf. Artif. Intell. 2019, 33, 4039–4048. [Google Scholar] [CrossRef]
  46. Zhang, H.; Rogozan, A.; Bensrhair, A. An enhanced N-point interpolation method to eliminate average precision distortion. Pattern Recogn. Lett. 2022, 158, 111–116. [Google Scholar] [CrossRef]
  47. Yacouby, R.; Axman, D. Probabilistic extension of precision, recall, and f1 score for more thorough evaluation of classification models. In Proceedings of the First Workshop on Evaluation and Comparison of NLP Systems, Online, 20 November 2020; pp. 79–91. [Google Scholar] [CrossRef]
  48. Hicks, S.A.; Strumke, I.; Thambawita, V.; Hammou, M.; Riegler, M.A.; Halvorsen, P.; Parasa, S. On evaluation metrics for medical applications of artificial intelligence. Sci. Rep. 2022, 12, 5979. [Google Scholar] [CrossRef]
  49. Pontius, R.G.; Millones, M. Death to Kappa: Birth of quantity disagreement and allocation disagreement for accuracy assessment. Int. J. Remote Sens. 2011, 32, 4407–4429. [Google Scholar] [CrossRef]
  50. Lingwal, S.; Bhatia, K.K.; Singh, M. Semantic segmentation of landcover for cropland mapping and area estimation using Machine Learning techniques. Data Intell. 2023, 5, 370–387. [Google Scholar] [CrossRef]
  51. Alberg, A.J.; Park, J.W.; Hager, B.W.; Brock, M.V.; Diener-West, M. The use of “overall accuracy” to evaluate the validity of screening or diagnostic tests. J. Gen. Intern. Med. 2004, 19, 460–465. [Google Scholar] [CrossRef]
  52. Miteva, D.A.; Murray, B.C.; Pattanayak, S.K. Do protected areas reduce blue carbon emissions? A quasi-experimental evaluation of mangroves in Indonesia. Ecol. Econ. 2015, 119, 127–135. [Google Scholar] [CrossRef]
  53. Albert, J.A.; Warren-Rhodes, K.; Schwarz, A.J.; Duke, N.C. Mangrove Ecosystem Services and Payments for Blue Carbon in Solomon Islands; The World Fish Center: Honiara, Solomon Islands, 2012. [Google Scholar]
  54. Warren-Rhodes, K.; Schwarz, A.-M.; Boyle, L.N.; Albert, J.; Agalo, S.S.; Warren, R.; Bana, A.; Paul, C.; Kodosiku, R.; Bosma, W.; et al. Mangrove ecosystem services and the potential for carbon revenue programmes in Solomon Islands. Environ. Conserv. 2011, 38, 485–496. [Google Scholar] [CrossRef]
  55. Zerbe, K.; Polit, C.; McClain, S.; Cook, T. Optimized Hot Spot and Directional Distribution Analyses Characterize the Spa-tiotemporal Variation of Large Wildfires in Washington, USA, 1970−2020. Int. J. Disaster Risk Sci. 2022, 13, 139–150. [Google Scholar] [CrossRef]
  56. Diao, Y.X.; Wang, J.J.; Yang, F.L.; Wu, W.; Zhou, J.; Wu, R.D. Identifying optimized on-the-ground priority areas for species conservation in a global biodiversity hotspot. J. Environ. Manag. 2021, 290, 112630. [Google Scholar] [CrossRef]
  57. Li, Y.; Zhang, L.; Yan, J.; Wang, P.; Hu, N.; Cheng, W.; Fu, B. Mapping the hotspots and coldspots of ecosystem services in conservation priority setting. J. Geogr. Sci. 2017, 27, 681–696. [Google Scholar] [CrossRef]
  58. Abolmaali, S.M.R.; Tarkesh, M.; Mousavi, S.A.; Karimzadeh, H.; Pourmanafi, S.; Fakheran, S. Identifying priority areas for conservation: Using ecosystem services hotspot mapping for land-use/land-cover planning in central of Iran. Environ. Manag. 2024, 73, 1016–1031. [Google Scholar] [CrossRef]
  59. Güneyli, H.; Ahmed, S.M.S. Detecting abnormal seismic activity areas of Anatolian plate and deformation directions using Python Geospatial libraries. Heliyon 2023, 9, e14394. [Google Scholar] [CrossRef]
  60. Haklay, M.; Weber, P. Openstreetmap: User-generated street maps. IEEE Pervasive Comput. 2008, 7, 12–18. [Google Scholar] [CrossRef]
  61. Tsendbazar, N.E.; Li, L.L.; Koopman, M.; Carter, S.; Herold, M.; Georgieva, I.; Lesiv, M.; Van De Kerchove, R.; Arino, O. ESA WorldCover Product Validation Report. Zenodo, v1.0. 2021. Available online: https://esa-worldcover.org/en/data-access (accessed on 8 April 2025).
  62. Song, C.; Lim, C.H.; Choi, H.A.; Kim, W.; Han, D.; Paia, M.T.; Ahn, H.K.; Kang, S.; Lee, W.K. Mapping ecosystem services based on citizen science for integrated coastal zone management in the Solomon Islands. Ecol. Inform. 2025, 88, 103142. [Google Scholar] [CrossRef]
  63. Cho, W.; Lim, C.-H. Simplified and High Accessibility Approach for the Rapid Assessment of Deforestation in Developing Countries: A Case of Timor-Leste. Remote Sens. 2023, 15, 4636. [Google Scholar] [CrossRef]
  64. Choi, H.A.; Song, C.; Lim, C.H.; Kang, S.; Paia, M.T.; Han, D. Rapid ecosystem services assessment to support integrated coastal zone management mangroves management plan in Solomon Islands. J. Ecol. Environ. 2025, 49, 9. [Google Scholar] [CrossRef]
  65. Chang, B.; Ahn, H.K.; Lim, C.H.; Cho, W. Pioneering approach for mangrove forest monitoring: Enhancing accessibility and assessment methodology in developing countries. Heliyon 2025, in press. [Google Scholar]
  66. Jiang, Y.; Zhang, L.; Yan, M.; Qi, J.; Fu, T.; Fan, S.; Chen, B. High-Resolution Mangrove Forests Classification with Machine Learning Using Worldview and UAV Hyperspectral Data. Remote Sens. 2021, 13, 1529. [Google Scholar] [CrossRef]
  67. Mondal, P.; Liu, X.; Fatoyinbo, T.E.; Lagomasino, D. Evaluating Combinations of Sentinel-2 Data and Machine-Learning Algorithms for Mangrove Mapping in West Africa. Remote Sens. 2019, 11, 2928. [Google Scholar] [CrossRef]
  68. Liu, X.; Fatoyinbo, T.E.; Thomas, N.M.; Guan, W.W.; Zhan, Y.; Mondal, P.; Lagomasino, D.; Simard, M.; Trettin, C.C.; Deo, R.; et al. Large-Scale High-Resolution Coastal Mangrove Forests Mapping Across West Africa with Machine Learning Ensemble and Satellite Big Data. Front. Earth Sci. 2021, 8, 560933. [Google Scholar] [CrossRef]
  69. Pujiono, E.; Kwak, D.-A.; Lee, W.-K.; Sulistyanto; Kim, S.-R.; Lee, J.Y.; Lee, S.-H.; Park, T.; Kim, M.-I. RGB-NDVI Color Composites for Monitoring the Change in Mangrove Area at the Maubesi Nature Reserve, Indonesia. For. Sci. Technol. 2013, 9, 171–179. [Google Scholar] [CrossRef]
  70. Zhang, X.; Treitz, P.M.; Chen, D.; Quan, C.; Shi, L.; Li, X. Mapping Mangrove Forests Using Multi-Tidal Remotely-Sensed Data and a Decision-Tree-Based Procedure. Int. J. Appl. Earth Obs. Geoinf. 2017, 62, 201–214. [Google Scholar] [CrossRef]
  71. Yang, Y.; Meng, Z.; Zu, J.; Cai, W.; Wang, J.; Su, H.; Yang, J. Fine-Scale Mangrove Species Classification Based on UAV Multispectral and Hyperspectral Remote Sensing Using Machine Learning. Remote Sens. 2024, 16, 3093. [Google Scholar] [CrossRef]
  72. Sun, Z.; Jiang, W.; Ling, Z.; Zhong, S.; Zhang, Z.; Song, J.; Xiao, Z. Using Multisource High-Resolution Remote Sensing Data (2 m) with a Habitat–Tide–Semantic Segmentation Approach for Mangrove Mapping. Remote Sens. 2023, 15, 5271. [Google Scholar] [CrossRef]
Figure 1. Maps of the study area showing the political boundaries (sources: Esri, TomTom, Garmin, FAO, NOAA, USGS, © OpenStreetMap contributors, and the GIS User Community).
Remotesensing 17 02512 g001
Figure 2. (A) A map showing the field survey points for the mangrove ground truth data in the Langa Langa Lagoon area of Malaita Province (sources: ESA, Esri, Maxar, Earthstar Geographics, and the GIS User Community). (B,C) Photographs from the visual surveys conducted by boat (B) and during field trips (C). (D) A photographic image showing the local-community-based mangrove afforestation area.
Remotesensing 17 02512 g002
Figure 3. A conceptual flow chart of the model development and mangrove habitat mapping process for the selection of priority mangrove protection areas.
Remotesensing 17 02512 g003
Figure 4. Exemplary RGB satellite images and their corresponding false-color images and label data for training the mangrove habitat detection model.
Remotesensing 17 02512 g004
Figure 5. The mangrove habitat detection results for 2022–2023 (sources: ESA, Esri, Maxar, Earthstar Geographics, and the GIS User Community): (A) a full map of the Solomon Islands, along with an inset showing Temotu Province; (B) the island of Utupua under Temotu Province; (C) the damaged Mangrove area under Langa Langa Lagoon, Malaita Province.
Remotesensing 17 02512 g005
Figure 6. A distribution map of mangrove hotspots in the Solomon Islands (sources: Esri, Maxar, Earthstar Geographics, and the GIS User Community). (A) A full map of the Solomon Islands, where the blue and yellow outlined areas correspond to (B) the Malaita hotspot area and (C) the Wagina Island hotspot area under Choiseul Province.
Remotesensing 17 02512 g006
Figure 7. A map of priority mangrove protection areas in the Solomon Islands produced in this study (sources: Esri, Maxar, Earthstar Geographics, and the GIS User Community).
Remotesensing 17 02512 g007
Table 1. The mangrove indices used in the present study for the mapping of mangrove habitats. In the MFI, λ1, λ2, λ3, and λ4 represent the bands of 5, 6, 7, and 8A, respectively.
IndexFormulaReference
EMI E M I = ( N I R S W I R ) ( N I R + g r e e n ) [31]
MFI M F I = [ ( R e d   E d g e   1 ρ B λ 1 ) + ( R e d   E d g e   2 ρ B λ 2 ) + ( R e d   E d g e   3 ρ B λ 3 ) + ( R e d   E d g e   4 ρ B λ 4 ) ] /4
ρ B λ i = S W I R 2 + ( R e d S W I R 2 ) × ( 2190 λ i ) / ( 2190 665 )
[32]
CMRI C M R I = N D V I N D W I [33]
Table 2. The key metrics used herein for validating the mangrove habitat detection model.
MetricFormulaReference
Precision P r e c i s i o n = T P ( T P + F P ) [45,46,47]
Recall R e c a l l = T P ( T P + F N ) [45,46,47]
F1-score F 1 s c o r e = 2 × ( p r e c i s i o n × r e c a l l ) ( p r e c i s o n + r e c a l l ) [47,48]
Table 3. The additional key metrics for the verification of the mangrove habitat map in this study.
MetricFormulaReference
QD Q D = g = 1 J q g 2
q g = i = 1 J p i g j = 1 J p g j
[49]
AD A D = g = 1 J a g 2
a g = 2   m i n i = 1 J p i g p g g , j = 1 J p g j p g g
Mean IoU I o U ( C l a s s   k ) = T P k T P k + F P k + F N k
M e a n   I o U = 1 N k = 1 N I o U ( C l a s s   k )
[50]
Overall accuracy O v e r a l l   a c c u r a c y = T P + T N T P + T N + F P + F N [51]
J: Total number of classes used in mapping. g: Specific class currently being analyzed. i: Class in predicted class. j: Class in reference data.
Table 4. The results for the key evaluation metrics upon evaluating the mangrove habitat mapping model.
ClassPrecisionRecallF1-Score
Mangrove0.8880.7860.834
Non-mangrove0.9770.9890.983
Table 5. The confusion matrix and evaluated key metrics of the 2022–2023 mangrove classification map.
2022–2023 Mangrove MapClassTotalPrecision
MangroveNon-Mangrove
PredictionMangrove24822500.992
Non-mangrove325986300.949
Total280600880
Recall0.8860.997
AccuracyOverall accuracy: 0.961; F1-score: 0.936
Mean IoU: 0.913; QD: 0.0341; AD: 0.0046
Table 6. Mangrove habitat areas of the Solomon Islands at the province level.
ProvinceMangrove Area (ha)Ratio of Mangrove Area to Total Land Area (%)
Central3478.635.24
Choiseul10,609.833.19
Guadalcanal1205.790.22
Isabel22,322.255.23
Makira-Ulawa1330.590.41
Malaita13,680.043.19
Temotu3306.463.70
Western15,414.682.75
Solomon Islands71,348.272.47
Disclaimer/Publisher’s Note: The statements, opinions and data contained in all publications are solely those of the individual author(s) and contributor(s) and not of MDPI and/or the editor(s). MDPI and/or the editor(s) disclaim responsibility for any injury to people or property resulting from any ideas, methods, instructions or products referred to in the content.