
Robust Optical and SAR Image Matching via Attention-Guided Structural Encoding and Confidence-Aware Filtering


Abstract
1. Introduction
- (1)
- A novel feature extraction network, RS2FNet, is proposed, which for the first time integrates the multi-scale residual structure (Res2Net) [22] with the region-aware sparse attention mechanism (BRA) [23] for optical–SAR image matching. This integration enhances cross-modal feature representation and structural robustness.
- (2)
- The ACAMatcher module is developed, incorporating a context-guided bidirectional attention mechanism and a confidence-driven dynamic pruning strategy. This design improves matching accuracy while significantly reducing computational overhead.
- (3)
- A match-aware multi-task loss function is formulated to jointly optimize keypoint detection, descriptor learning, and structural consistency, contributing to a unified and systematic cross-modal matching framework.
- (4)
- Extensive experiments on multiple public optical–SAR datasets validate the superiority of ACAMatch in terms of the number of correct matches, matching accuracy, and registration precision compared to existing state-of-the-art methods.
2. Related Works
2.1. Traditional Remote Sensing Image Matching Methods
2.2. Deep Learning-Based Matching Methods
3. Methodology
3.1. RS2FNett Feature Extraction Network
3.1.1. Dual-Stage Res2Net Backbone
3.1.2. Bi-Level Routing Attention (BRA)
3.1.3. Lightweight Decoding Module
3.1.4. Multi-Level Loss Function for Feature Extraction
3.2. ACAMatcher Feature Matching Network
3.2.1. Context-Guided Bidirectional Attention Matching
3.2.2. Confidence-Aware Layer-Wise Pruning Inference
3.2.3. Matching-Aware Multi-Task Loss Function
4. Experiments
4.1. Datasets
4.2. Evaluation Metrics and Implementation Details
4.2.1. Evaluation Metrics
4.2.2. Implementation Details
4.3. Experimental Results and Analysis
5. Discussion
5.1. Effectiveness of Core Modules
- (a)
- The dual-stage Res2Net hierarchical feature extractor.
- (b)
- The BRA bi-branch attention fusion module.
- (c)
- Context-guided bidirectional attention in ACAMatcher.
- (d)
- Confidence-based dynamic pruning mechanism.
5.2. Contribution of Loss Function Components
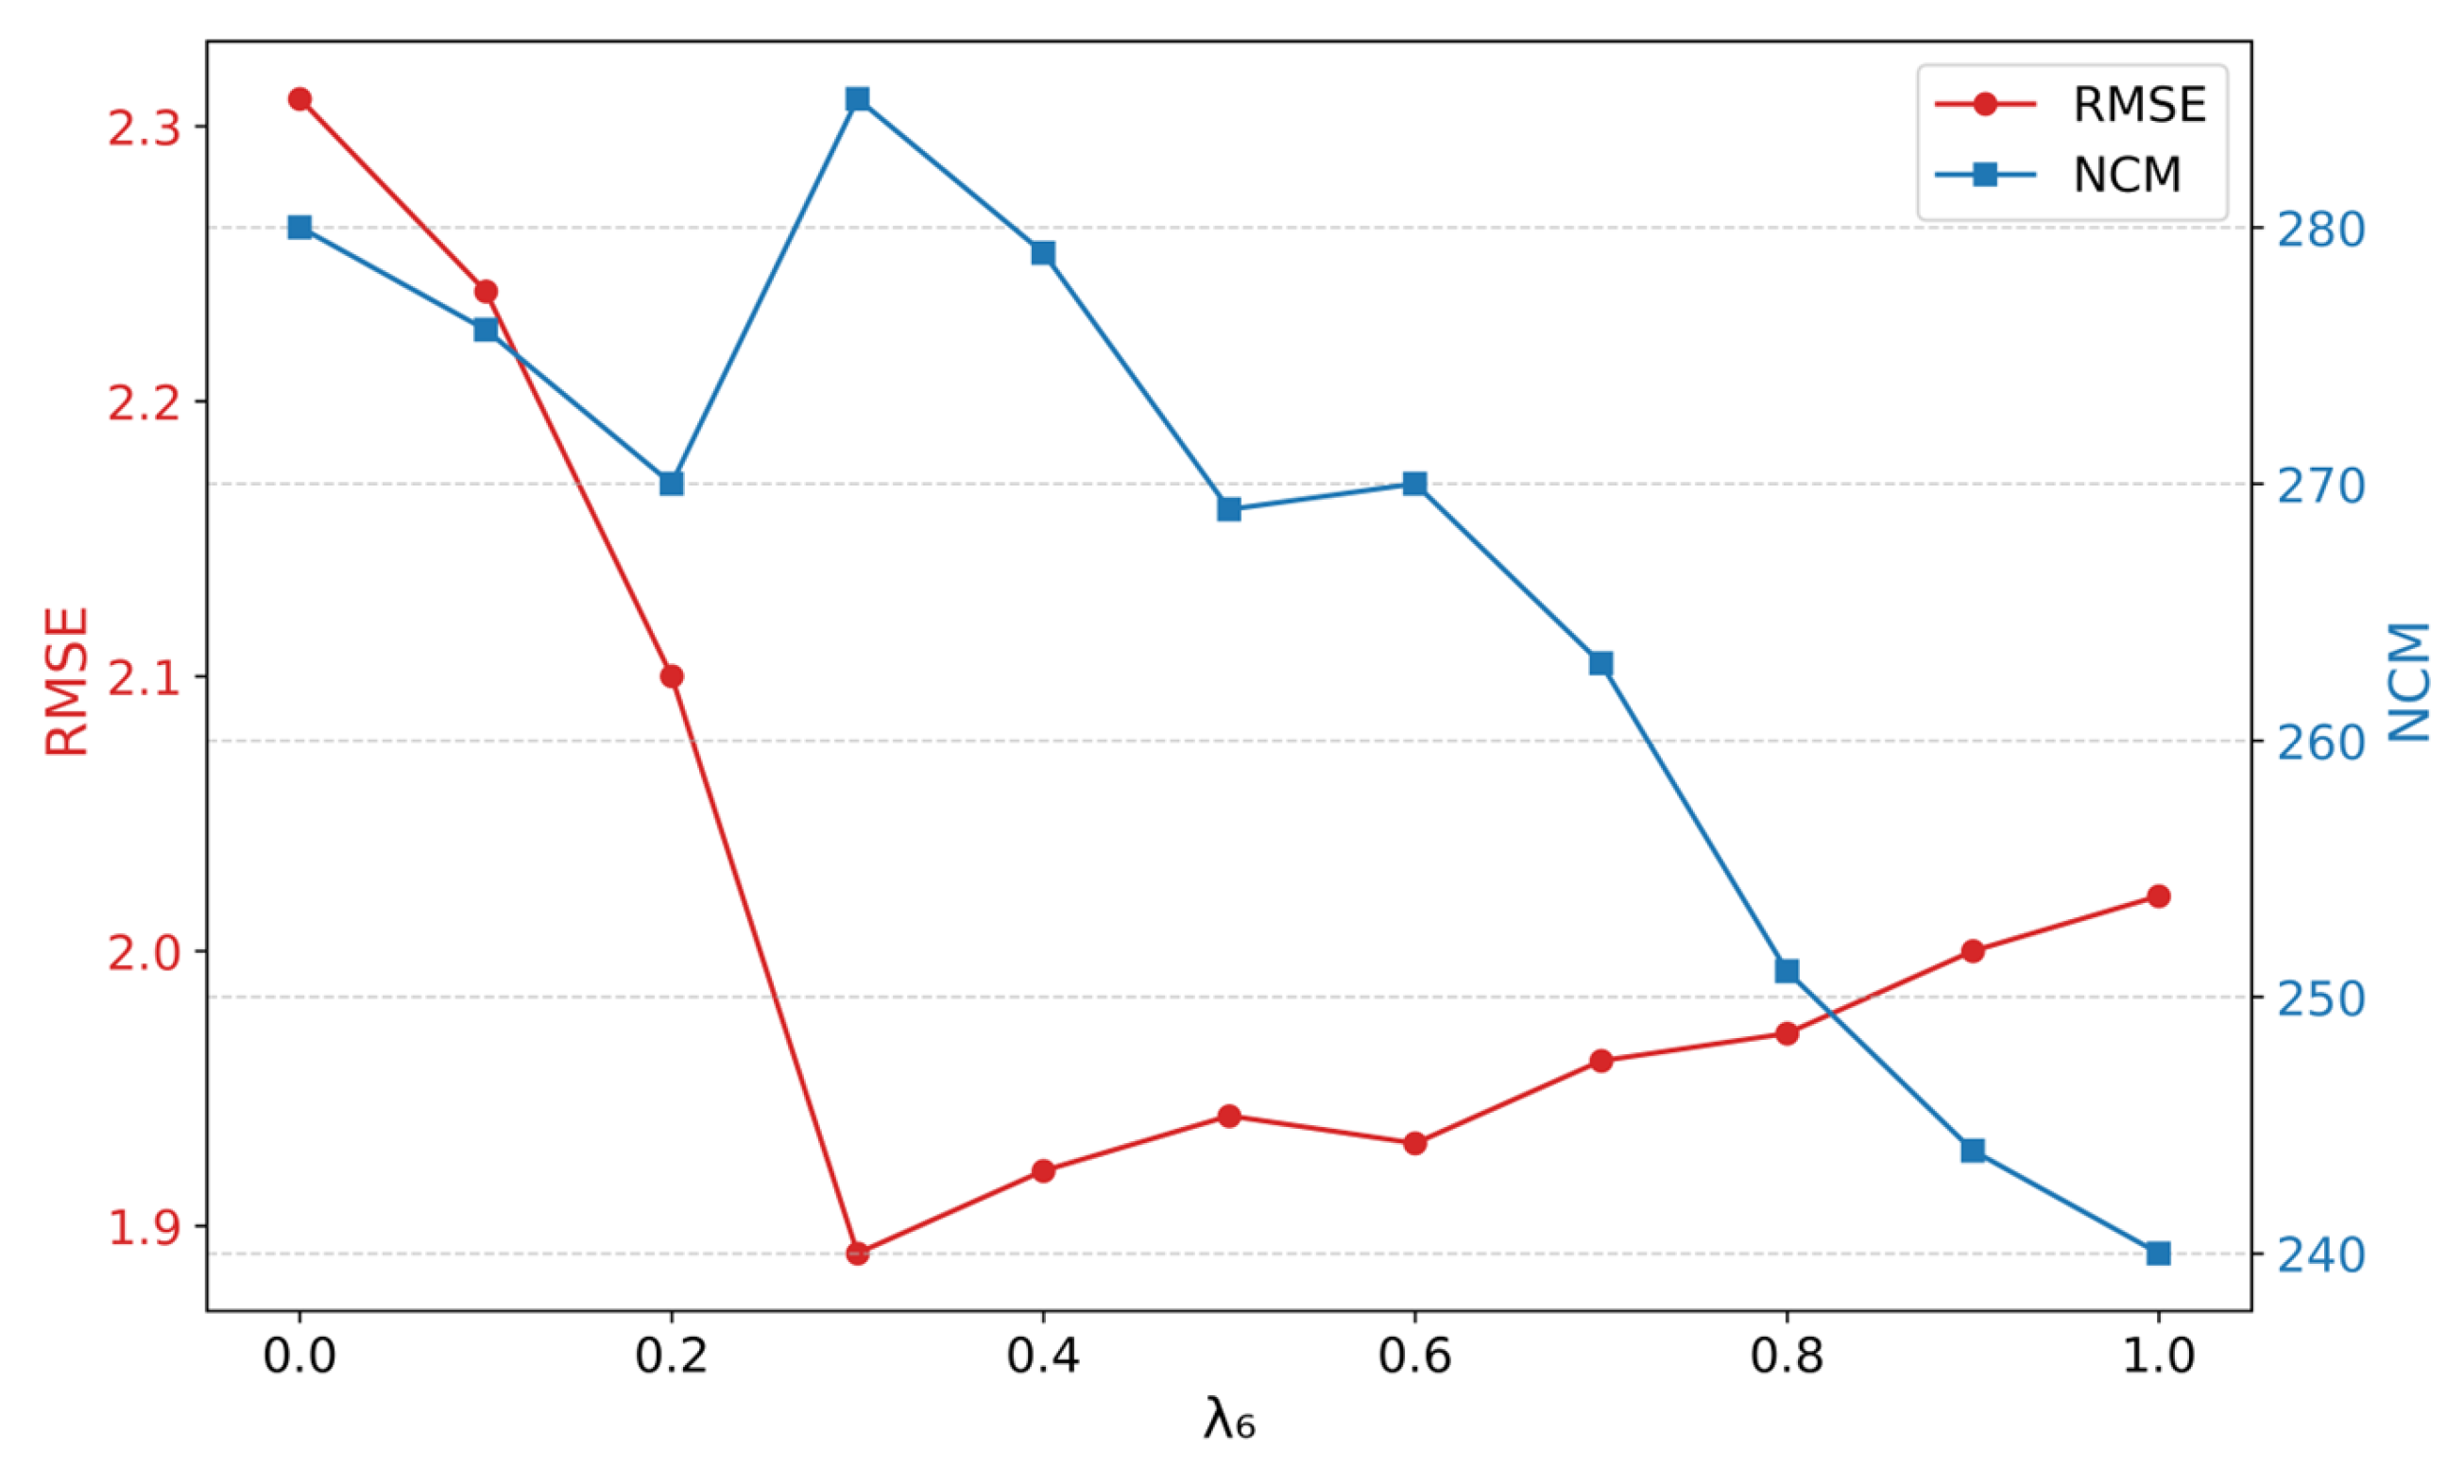
5.3. Sensitivity of Key Hyperparameters
6. Conclusions
Author Contributions
Funding
Data Availability Statement
Conflicts of Interest
References
- Lu, S.; Guo, J.; Zimmer-Dauphinee, J.R.; Nieusma, J.M.; Wang, X.; van Valkenburgh, P.; Wernke, S.A.; Huo, Y. Vision Foundation Models in Remote Sensing: A Survey. IEEE Geosci. Remote Sens. Mag. 2025, 2–27. [Google Scholar] [CrossRef]
- Peng, D.; Liu, X.; Zhang, Y.; Guan, H.; Li, Y.; Bruzzone, L. Deep Learning Change Detection Techniques for Optical Remote Sensing Imagery: Status, Perspectives and Challenges. Int. J. Appl. Earth Obs. Geoinf. 2025, 136, 104282. [Google Scholar] [CrossRef]
- Jiang, X. A Review of Multimodal Image Matching: Methods and Applications. Inf. Fusion 2021, 73, 22–71. [Google Scholar] [CrossRef]
- Zhang, W.; Mei, J.; Wang, Y. DMDiff: A Dual-Branch Multimodal Conditional Guided Diffusion Model for Cloud Removal Through SAR-Optical Data Fusion. Remote Sens. 2025, 17, 965. [Google Scholar] [CrossRef]
- Zhu, Q.; Guo, X.; Li, Z.; Li, D. A Review of Multi-Class Change Detection for Satellite Remote Sensing Imagery. Geo-Spa. Inf. Sci. 2022, 27, 1–15. [Google Scholar] [CrossRef]
- Gao, F.; Jin, X.; Zhou, X.; Dong, J.; Du, Q. MSFMamba: Multiscale Feature Fusion State Space Model for Multisource Remote Sensing Image Classification. IEEE Trans. Geosci. Remote Sens. 2025, 63, 5504116. [Google Scholar] [CrossRef]
- Zhu, B.; Zhou, L.; Pu, S.; Fan, J.; Ye, Y. Advances and Challenges in Multimodal Remote Sensing Image Registration. IEEE J. Miniaturiz. Air Space Syst. 2023, 4, 165–174. [Google Scholar] [CrossRef]
- Cole-Rhodes, A.A.; Johnson, K.L.; LeMoigne, J.; Zavorin, I. Multiresolution Registration of Remote Sensing Imagery by Optimization of Mutual Information Using a Stochastic Gradient. IEEE Trans. Image Process. 2003, 12, 1495–1511. [Google Scholar] [CrossRef]
- Martinez, A.; Garcia-Consuegra, J.; Abad, F. A Correlation-Symbolic Approach to Automatic Remotely Sensed Image Rectification. In Proceedings of the IEEE 1999 International Geoscience and Remote Sensing Symposium. IGARSS’99 (Cat. No.99CH36293), Hamburg, Germany, 28 June–2 July 1999; Volume 1, pp. 336–338. [Google Scholar]
- Ye, Y.; Shen, L. HOPC: A Novel Similarity Metric Based on Geometric Structural Properties for Multi-Modal Remote Sensing Image Matching. ISPRS Ann. Photogramm. Remote Sens. Spat. Inf. Sci. 2016, III–1, 9–16. [Google Scholar] [CrossRef]
- Ye, Y.; Bruzzone, L.; Shan, J.; Bovolo, F.; Zhu, Q. Fast and Robust Matching for Multimodal Remote Sensing Image Registration. IEEE Trans. Geosci. Remote Sens. 2019, 57, 9059–9070. [Google Scholar] [CrossRef]
- Lowe, D.G. Distinctive Image Features from Scale-Invariant Keypoints. Int. J. Comput. Vision 2004, 60, 91–110. [Google Scholar] [CrossRef]
- Bay, H.; Ess, A.; Tuytelaars, T.; Van Gool, L. Speeded-Up Robust Features (SURF). Comput. Vis. Image Underst. 2008, 110, 346–359. [Google Scholar] [CrossRef]
- Li, J.; Hu, Q.; Ai, M. RIFT: Multi-Modal Image Matching Based on Radiation-Variation Insensitive Feature Transform. IEEE Trans. Image Process. 2020, 29, 3296–3310. [Google Scholar] [CrossRef] [PubMed]
- Xiang, Y.; Wang, F.; You, H. OS-SIFT: A Robust SIFT-Like Algorithm for High-Resolution Optical-to-SAR Image Registration in Suburban Areas. IEEE Trans. Geosci. Remote Sens. 2018, 56, 3078–3090. [Google Scholar] [CrossRef]
- Han, X.; Leung, T.; Jia, Y.; Sukthankar, R.; Berg, A.C. MatchNet: Unifying Feature and Metric Learning for Patch-Based Matching. In Proceedings of the IEEE Conference on Computer Vision and Pattern Recognition (CVPR), Boston, MA, USA, 7–12 June 2015; pp. 3279–3286. [Google Scholar]
- Mishchuk, A.; Mishkin, D.; Radenovic, F.; Matas, J. Working Hard to Know Your Neighbor’ s Margins: Local Descriptor Learning Loss. In Proceedings of the Advances in Neural Information Processing Systems, Long Beach, CA, USA, 4–9 December 2017; Curran Associates, Inc.: New York, NY, USA, 2017; Volume 30. [Google Scholar]
- Lan, C.; Lu, W.; Yu, J.; Xu, Q. Deep Learning Algorithm for Feature Matching of Cross Modality Remote Sensing Images. Cehui Xuebao/Acta Geod. Cartogr. Sin. 2021, 50, 189–202. [Google Scholar]
- Xiao, Y.; Zhang, C.; Chen, Y.; Jiang, B.; Tang, J. ADRNet: Affine and Deformable Registration Networks for Multimodal Remote Sensing Images. IEEE Trans. Geosci. Remote Sens. 2024, 62, 1–13. [Google Scholar] [CrossRef]
- Quan, D.; Wang, S.; Liang, X.; Wang, R.; Fang, S.; Hou, B.; Jiao, L. Deep Generative Matching Network for Optical and SAR Image Registration. In Proceedings of the IGARSS 2018–2018 IEEE International Geoscience and Remote Sensing Symposium, Valencia, Spain, 22–27 July 2018; IEEE: Piscataway, NJ, USA, 2018; pp. 6215–6218. [Google Scholar]
- Du, W.-L.; Zhou, Y.; Zhao, J.; Tian, X. K-Means Clustering Guided Generative Adversarial Networks for SAR-Optical Image Matching. IEEE Access 2020, 8, 217554–217572. [Google Scholar] [CrossRef]
- Gao, S.-H.; Cheng, M.-M.; Zhao, K.; Zhang, X.-Y.; Yang, M.-H.; Torr, P. Res2Net: A New Multi-Scale Backbone Architecture. IEEE Trans. Pattern Anal. Mach. Intell. 2021, 43, 652–662. [Google Scholar] [CrossRef]
- Zhu, L.; Wang, X.; Ke, Z.; Zhang, W.; Lau, R. BiFormer: Vision Transformer with Bi-Level Routing Attention. In Proceedings of the 2023 IEEE/CVF Conference on Computer Vision and Pattern Recognition (CVPR), Vancouver, BC, Canada, 18–22 June 2023; IEEE: Piscataway, NJ, USA, 2023; pp. 10323–10333. [Google Scholar]
- Brown, L.G. A Survey of Image Registration Techniques. ACM Comput. Surv. 1992, 24, 325–376. [Google Scholar] [CrossRef]
- Shu, L.; Tan, T. SAR and SPOT Image Registration Based on Mutual Information with Contrast Measure. In Proceedings of the 2007 IEEE International Conference on Image Processing, San Antonio, TX, USA, 16–19 September 2007; Volume 5, pp. V-429–V-432. [Google Scholar]
- Fan, X.; Rhody, H.; Saber, E. Automatic Registration of Multisensor Airborne Imagery. In Proceedings of the 34th Applied Imagery and Pattern Recognition Workshop (AIPR’05), Washington, DC, USA, 19 October–21 December 2005; pp. 6–86. [Google Scholar]
- Dalal, N.; Triggs, B. Histograms of Oriented Gradients for Human Detection. In Proceedings of the 2005 IEEE Computer Society Conference on Computer Vision and Pattern Recognition (CVPR’05), San Diego, CA, USA, 20–26 June 2005; Volume 1, pp. 886–893. [Google Scholar]
- Liu, X.; Chen, S.; Zhuo, L.; Li, J.; Huang, K. Multi-Sensor Image Registration by Combining Local Self-Similarity Matching and Mutual Information. Front. Earth Sci. 2018, 12, 779–790. [Google Scholar] [CrossRef]
- Li, S.; Wang, Q.; Li, J. Improved ORB Matching Algorithm Based on Adaptive Threshold. J. Phys. Conf. Ser. 2021, 1871, 012151. [Google Scholar] [CrossRef]
- Dellinger, F.; Delon, J.; Gousseau, Y.; Michel, J.; Tupin, F. SAR-SIFT: A SIFT-Like Algorithm for SAR Images. IEEE Trans. Geosci. Remote Sens. 2015, 53, 453–466. [Google Scholar] [CrossRef]
- Sobel, I. Neighborhood Coding of Binary Images for Fast Contour Following and General Binary Array Processing. Comput. Graph. Image Process. 1978, 8, 127–135. [Google Scholar] [CrossRef]
- Fjortoft, R.; Lopes, A.; Marthon, P.; Cubero-Castan, E. An Optimal Multiedge Detector for SAR Image Segmentation. IEEE Trans. Geosci. Remote Sens. 1998, 36, 793–802. [Google Scholar] [CrossRef]
- Burns, J.B.; Hanson, A.R.; Riseman, E.M. Extracting Straight Lines. IEEE Trans. Pattern Anal. Mach. Intell. 1986, PAMI-8, 425–455. [Google Scholar] [CrossRef]
- Xu, G.; Wu, Q.; Cheng, Y.; Yan, F.; Li, Z.; Yu, Q. A Robust Deformed Image Matching Method for Multi-Source Image Matching. Infrared Phys. Technol. 2021, 115, 103691. [Google Scholar] [CrossRef]
- Sui, H.; Xu, C.; Liu, J.; Hua, F. Automatic Optical-to-SAR Image Registration by Iterative Line Extraction and Voronoi Integrated Spectral Point Matching. IEEE Trans. Geosci. Remote Sens. 2015, 53, 6058–6072. [Google Scholar] [CrossRef]
- Teague, M.R. Image Analysis via the General Theory of Moments. JOSA 1980, 70, 920–930. [Google Scholar] [CrossRef]
- Matas, J.; Chum, O.; Urban, M.; Pajdla, T. Robust Wide-Baseline Stereo from Maximally Stable Extremal Regions. Image Vision Comput. 2004, 22, 761–767. [Google Scholar] [CrossRef]
- DeTone, D.; Malisiewicz, T.; Rabinovich, A. SuperPoint: Self-Supervised Interest Point Detection and Description. In Proceedings of the 2018 IEEE/CVF Conference on Computer Vision and Pattern Recognition Workshops (CVPRW), Salt Lake City, UT, USA, 18–22 June 2018; IEEE: Piscataway, NJ, USA, 2018. [Google Scholar]
- Liao, Y.; Di, Y.; Zhou, H.; Li, A.; Liu, J.; Lu, M.; Duan, Q. Feature Matching and Position Matching Between Optical and SAR with Local Deep Feature Descriptor. IEEE J. Sel. Top. Appl. Earth Obs. Remote Sens. 2022, 15, 448–462. [Google Scholar] [CrossRef]
- Ye, Y.; Yang, C.; Gong, G.; Yang, P.; Quan, D.; Li, J. Robust Optical and SAR Image Matching Using Attention-Enhanced Structural Features. IEEE Trans. Geosci. Remote Sens. 2024, 62, 1–12. [Google Scholar] [CrossRef]
- Li, Y.; Wu, D.; Cui, Y.; He, P.; Zhang, Y.; Wang, R. A Robust Multisource Remote Sensing Image Matching Method Utilizing Attention and Feature Enhancement Against Noise Interference. arXiv 2024, arXiv:2410.11848. [Google Scholar] [CrossRef]
- Lv, C.; Wang, W.; Quan, D.; Wang, S.; Dong, L.; Jiang, X.; Gu, Y.; Jiao, L. Fourier Domain Adaptive Multi-Modal Remote Sensing Image Template Matching Based on Siamese Network. In Proceedings of the IGARSS 2024–2024 IEEE International Geoscience and Remote Sensing Symposium, Athens, Greece, 7–12 July 2024; pp. 7325–7329. [Google Scholar]
- Han, Q.; Zhi, X.; Jiang, S.; Chen, W.; Huang, Y.; Yu, L.; Zhang, W. A Siamese Network via Cross-Domain Robust Feature Decoupling for Multi-Source Remote Sensing Image Registration. Remote Sens. 2025, 17, 646. [Google Scholar] [CrossRef]
- Quan, D.; Wang, Z.; Lv, C.; Wang, S.; Li, Y.; Ren, B.; Chanussot, J.; Jiao, L. LM-Net: A Lightweight Matching Network for Remote Sensing Image Matching and Registration. IEEE Trans. Geosci. Remote Sens. 2024, 62, 1–13. [Google Scholar] [CrossRef]
- Quan, D.; Wang, Z.; Wang, S.; Li, Y.; Ren, B.; Kang, M.; Chanussot, J.; Jiao, L. F3Net: Adaptive Frequency Feature Filtering Network for Multimodal Remote Sensing Image Registration. IEEE Trans. Geosci. Remote Sens. 2024, 62, 1–13. [Google Scholar] [CrossRef]
- Sarlin, P.-E.; DeTone, D.; Malisiewicz, T.; Rabinovich, A. SuperGlue: Learning Feature Matching with Graph Neural Networks. In Proceedings of the 2020 IEEE/CVF Conference on Computer Vision and Pattern Recognition (CVPR), Seattle, WA, USA, 14–19 June 2020; IEEE: Piscataway, NJ, USA, 2020; pp. 4937–4946. [Google Scholar]
- Lindenberger, P.; Sarlin, P.-E.; Pollefeys, M. LightGlue: Local Feature Matching at Light Speed. In Proceedings of the 2023 IEEE/CVF International Conference on Computer Vision (ICCV), Paris, France, 1–6 October 2023; IEEE: Piscataway, NJ, USA, 2023. [Google Scholar]
- van den Oord, A.; Li, Y.; Vinyals, O. Representation Learning with Contrastive Predictive Coding. arXiv 2019, arXiv:1807.03748. [Google Scholar] [CrossRef]
- Zhang, H.; Lei, L.; Ni, W.; Tang, T.; Wu, J.; Xiang, D.; Kuang, G. Optical and SAR Image Matching Using Pixelwise Deep Dense Features. IEEE Geosci. Remote Sens. Lett. 2022, 19, 1–5. [Google Scholar] [CrossRef]
- Goodfellow, I.J.; Pouget-Abadie, J.; Mirza, M.; Xu, B.; Warde-Farley, D.; Ozair, S.; Courville, A.; Bengio, Y. Generative Adversarial Nets. In Proceedings of the Advances in Neural Information Processing Systems, Montreal, QC, Canada, 8–13 December 2014; Curran Associates, Inc.: New York, NY, USA, 2014; Volume 27. [Google Scholar]
- Wu, B.; Wang, H.; Zhang, C.; Chen, J. Optical-to-SAR Translation Based on CDA-GAN for High-Quality Training Sample Generation for Ship Detection in SAR Amplitude Images. Remote Sens. 2024, 16, 3001. [Google Scholar] [CrossRef]
- Bai, X.; Xu, F. Accelerating Diffusion for SAR-to-Optical Image Translation via Adversarial Consistency Distillation. arXiv 2024, arXiv:2407.06095. [Google Scholar]
- Luo, Q.; Li, H.; Chen, Z.; Li, J. ADD-UNet: An Adjacent Dual-Decoder UNet for SAR-to-Optical Translation. Remote Sens. 2023, 15, 3125. [Google Scholar] [CrossRef]
- Revaud, J.; De Souza, C.; Humenberger, M.; Weinzaepfel, P. R2D2: Reliable and Repeatable Detector and Descriptor. In Proceedings of the Advances in Neural Information Processing Systems, Vancouver, BC, Canada, 8–14 December 2019; Curran Associates, Inc.: New York, NY, USA, 2019; Volume 32. [Google Scholar]
- Tyszkiewicz, M.; Fua, P.; Trulls, E. DISK: Learning Local Features with Policy Gradient. In Proceedings of the Advances in Neural Information Processing Systems, Vancouver, BC, Canada, 6–12 December 2020; Curran Associates Inc.: New York, NY, USA, 2020; Volume 33, pp. 14254–14265. [Google Scholar]
- Sun, J.; Shen, Z.; Wang, Y.; Bao, H.; Zhou, X. LoFTR: Detector-Free Local Feature Matching with Transformers. In Proceedings of the 2021 IEEE/CVF Conference on Computer Vision and Pattern Recognition (CVPR), Nashville, TN, USA, 19–25 June 2021; IEEE: Piscataway, NJ, USA, 2021; pp. 8918–8927. [Google Scholar]
- Chen, X.; Fan, H.; Girshick, R.; He, K. Improved Baselines with Momentum Contrastive Learning. arXiv 2020, arXiv:2003.04297. [Google Scholar] [CrossRef]
- Schmitt, M.; Hughes, L.H.; Zhu, X.X. The Sen1-2 Dataset for Deep Learning in Sar-Optical Data Fusion. ISPRS Ann. Photogramm. Remote Sens. Spat. Inf. Sci. 2018, IV–1, 141–146. [Google Scholar] [CrossRef]
- Li, X.; Zhang, G.; Cui, H.; Hou, S.; Wang, S.; Li, X.; Chen, Y.; Li, Z.; Zhang, L. MCANet: A Joint Semantic Segmentation Framework of Optical and SAR Images for Land Use Classification. Int. J. Appl. Earth Obs. Geoinf. 2022, 106, 102638. [Google Scholar] [CrossRef]


| Group | RIFT | MatchosNet | Superpoint+Lightglue | ACAMatch | ||||||||||||
|---|---|---|---|---|---|---|---|---|---|---|---|---|---|---|---|---|
| NCM | CMR | RMSE | T | NCM | CMR | RMSE | T | NCM | CMR | RMSE | T | NCM | CMR | RMSE | T | |
| 1 | 29 | 0.56 | 2.45 | 3.65 | 32 | 0.58 | 2.43 | 2.56 | 60 | 0.64 | 2.19 | 2.34 | 87 | 0.76 | 1.91 | 1.79 |
| 2 | 17 | 0.49 | 2.49 | 3.66 | 65 | 0.67 | 2.37 | 2.57 | 67 | 0.63 | 2.29 | 2.34 | 90 | 0.85 | 1.98 | 1.79 |
| 3 | 60 | 0.66 | 2.33 | 2.99 | 71 | 0.68 | 2.30 | 2.52 | 163 | 0.71 | 2.11 | 2.01 | 202 | 0.81 | 1.89 | 1.76 |
| 4 | - | - | - | - | 169 | 0.69 | 1.77 | 5.11 | 367 | 0.72 | 1.70 | 4.02 | 878 | 0.83 | 1.54 | 4.34 |
| 5 | - | - | - | - | 82 | 0.70 | 2.15 | 5.01 | 289 | 0.71 | 2.34 | 4.77 | 677 | 0.81 | 2.01 | 4.81 |
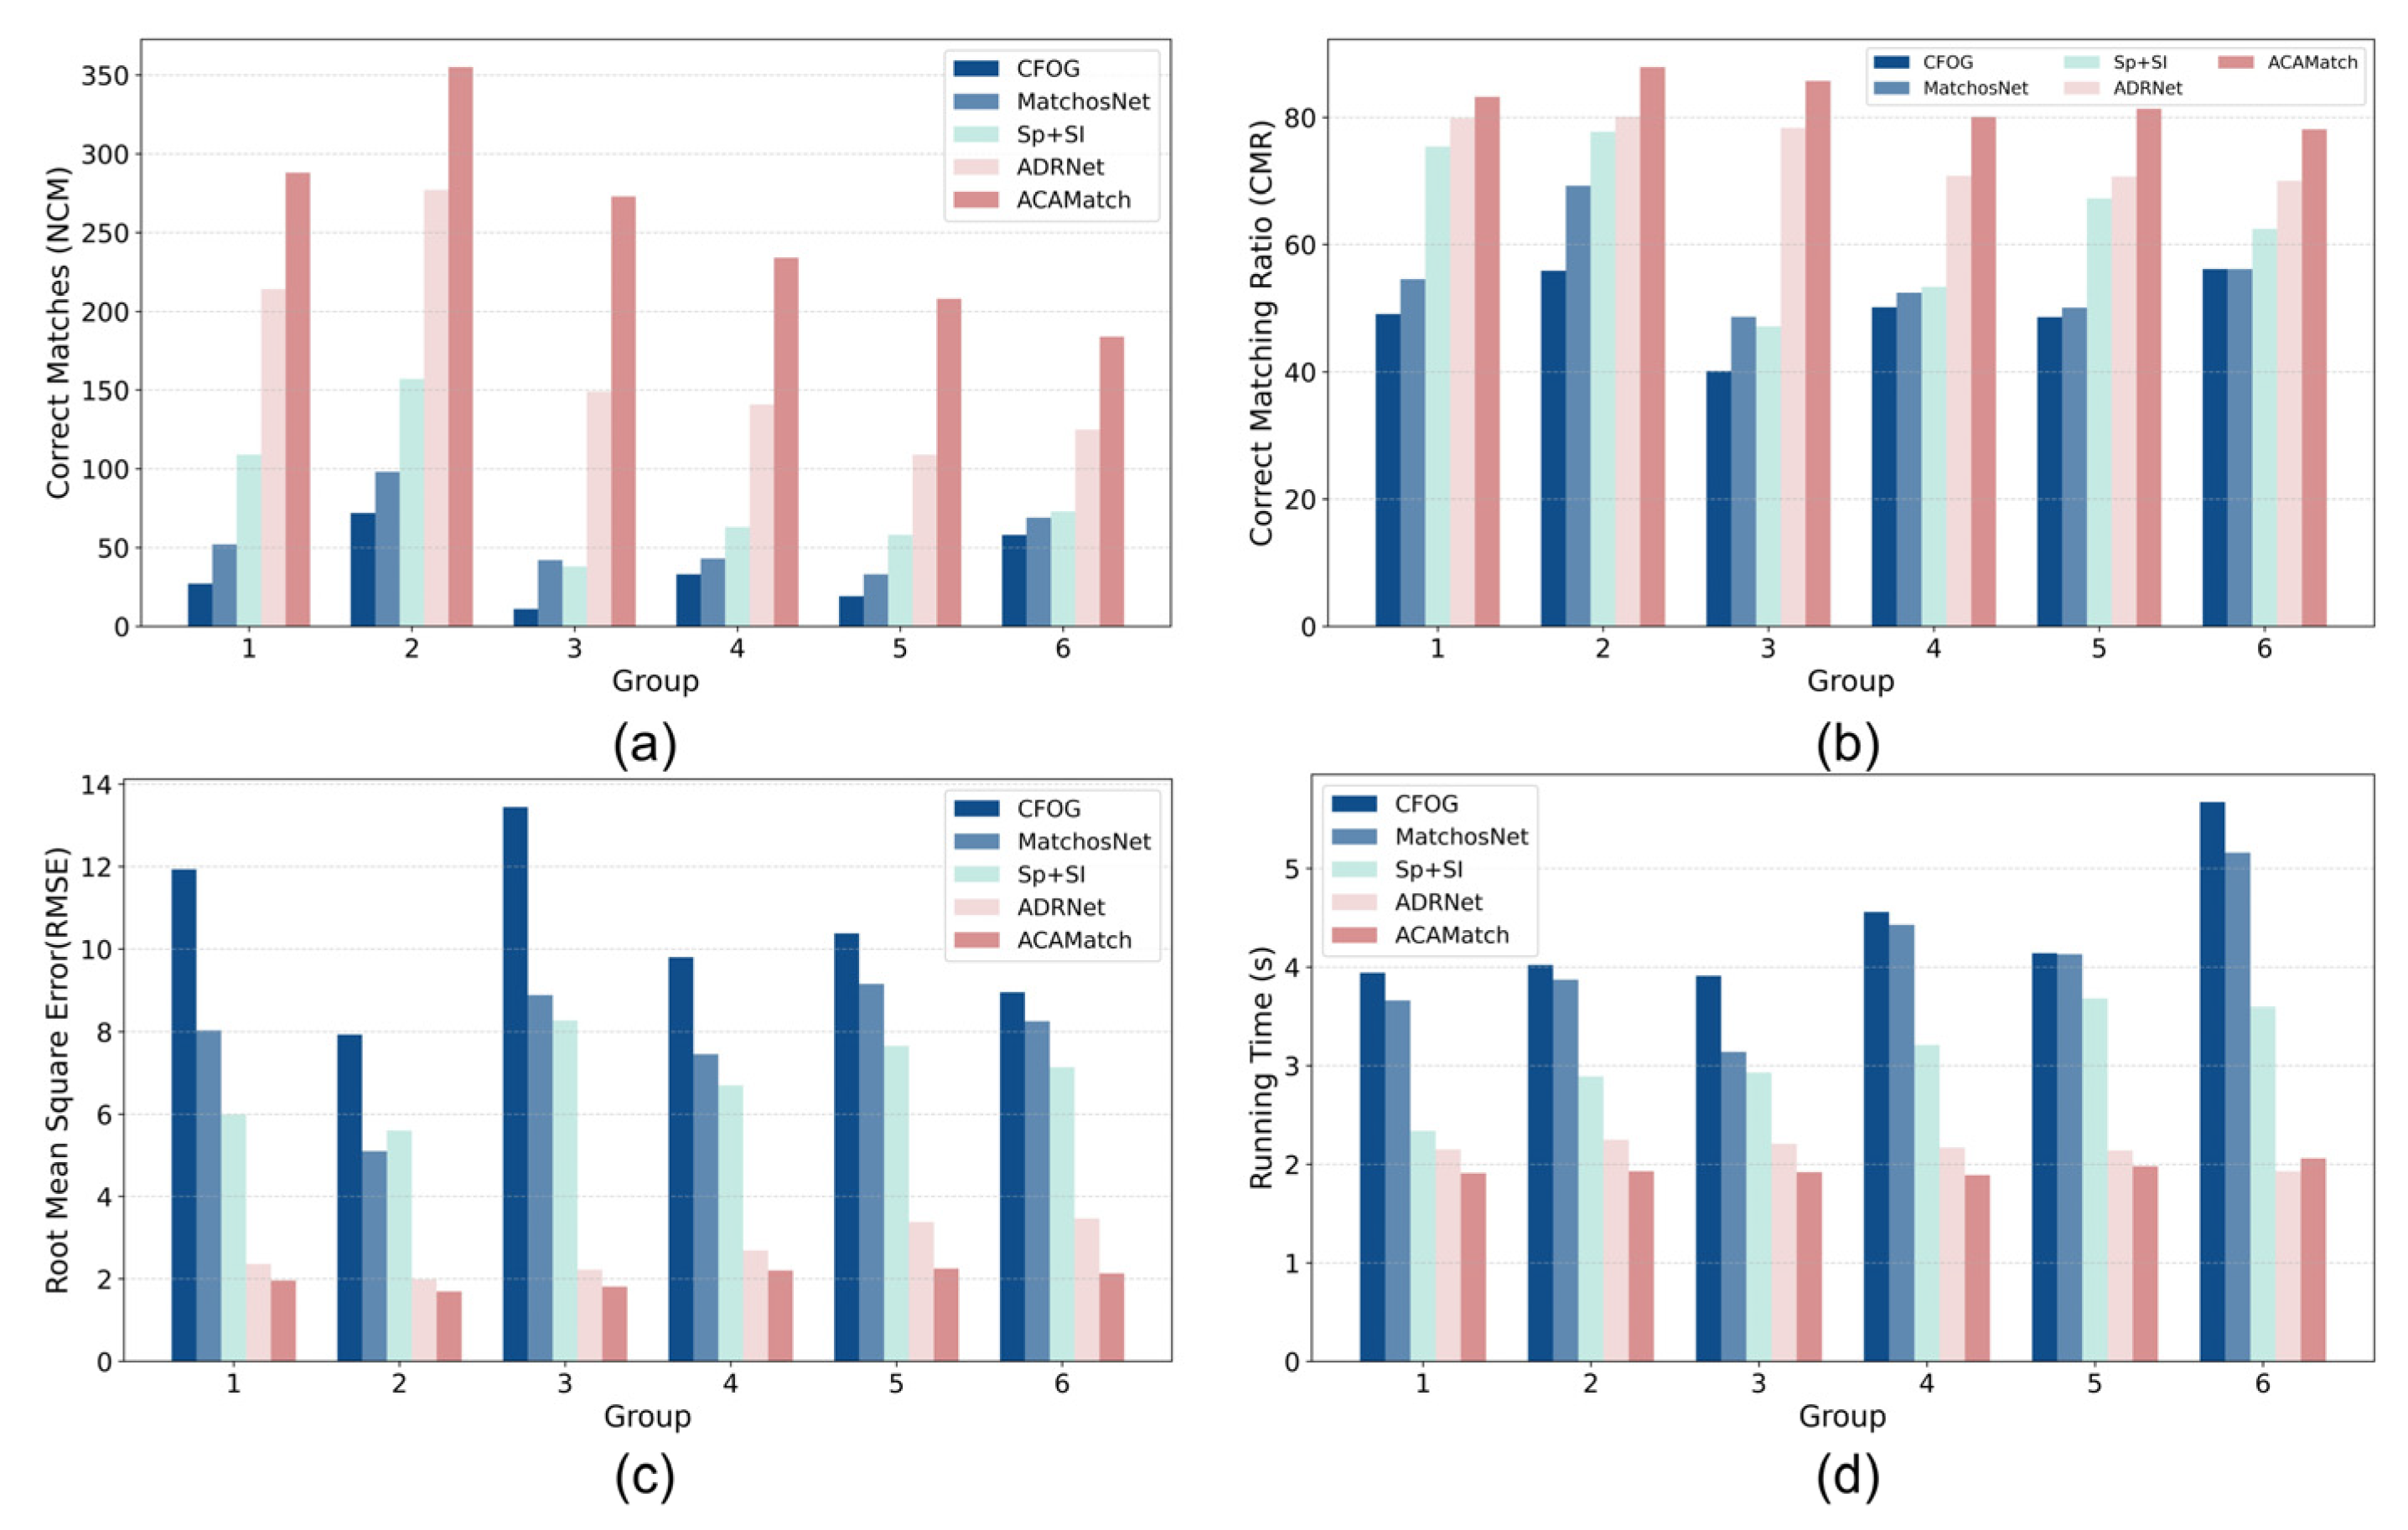
| Group | CFOG | MatchosNet | Sp+Sl | ADRNet | ACAMatch | |||||
|---|---|---|---|---|---|---|---|---|---|---|
| NCM | CMR | NCM | CMR | NCM | CMR | NCM | CMR | NCM | CMR | |
| 1 | 27 | 0.49 | 52 | 0.55 | 109 | 0.75 | 214 | 0.80 | 288 | 0.83 |
| 2 | 72 | 0.56 | 98 | 0.69 | 157 | 0.78 | 277 | 0.80 | 355 | 0.88 |
| 3 | 11 | 0.40 | 42 | 0.49 | 38 | 0.47 | 149 | 0.78 | 273 | 0.86 |
| 4 | 33 | 0.50 | 43 | 0.52 | 63 | 0.53 | 141 | 0.71 | 234 | 0.80 |
| 5 | 19 | 0.49 | 33 | 0.50 | 58 | 0.67 | 109 | 0.71 | 208 | 0.81 |
| 6 | 58 | 0.56 | 69 | 0.56 | 73 | 0.62 | 125 | 0.70 | 184 | 0.78 |
| Group | CFOG | MatchosNet | Sp+Sl | ADRNet | ACAMatch | |||||
|---|---|---|---|---|---|---|---|---|---|---|
| RMSE | T | RMSE | T | RMSE | T | RMSE | T | RMSE | T | |
| 1 | 11.93 | 3.94 | 8.03 | 3.66 | 5.99 | 2.34 | 2.36 | 2.15 | 1.96 | 1.91 |
| 2 | 7.93 | 4.02 | 5.10 | 3.87 | 5.60 | 2.89 | 1.98 | 2.25 | 1.69 | 1.93 |
| 3 | 13.45 | 3.91 | 8.88 | 3.14 | 8.27 | 2.93 | 2.22 | 2.21 | 1.81 | 1.92 |
| 4 | 9.80 | 4.56 | 7.45 | 4.43 | 6.69 | 3.21 | 2.69 | 2.17 | 2.20 | 1.89 |
| 5 | 10.38 | 4.14 | 9.15 | 4.13 | 7.65 | 3.68 | 3.38 | 2.14 | 2.25 | 1.98 |
| 6 | 8.95 | 5.67 | 8.25 | 5.16 | 7.13 | 3.59 | 3.47 | 1.93 | 2.13 | 2.06 |
| Model Variant | RMSE | NCM | T(ms) |
|---|---|---|---|
| Full model | 1.89 | 285 | 90 |
| —Res2Net | 2.34 | 198 | 85 |
| —BAR Attention | 2.11 | 170 | 88 |
| —Context Attention | 2.59 | 164 | 86 |
| —Dynamic Pruning | 2.07 | 258 | 118 |
| RS2FNet | ACAMather | ||||
|---|---|---|---|---|---|
| Loss Combination | RMSE | NCM | Loss Combination | RMSE | NCM |
| Full Loss | 1.89 | 285 | Full Loss | 1.89 | 285 |
| –Affine Consistency | 2.17 | 266 | –Matchability Loss | 2.06 | 255 |
| –Spatial Consistency | 2.25 | 252 | –Loop Consistency Regularizer | 2.13 | 242 |
| Heatmap Supervision Only | 2.42 | 220 | Matching Similarity Only | 2.31 | 211 |
| Empirical Value | RMSE | NCM | T(ms) | |
|---|---|---|---|---|
| 0.3 | 1.93 | 289 | 98 | |
| 0.5 | 1.89 | 285 | 90 | |
| 0.7 | 1.85 | 269 | 92 | |
| Top-k | 300 | 2.04 | 257 | 78 |
| 500 | 1.89 | 285 | 90 | |
| 800 | 1.87 | 309 | 147 |
Disclaimer/Publisher’s Note: The statements, opinions and data contained in all publications are solely those of the individual author(s) and contributor(s) and not of MDPI and/or the editor(s). MDPI and/or the editor(s) disclaim responsibility for any injury to people or property resulting from any ideas, methods, instructions or products referred to in the content. |
© 2025 by the authors. Licensee MDPI, Basel, Switzerland. This article is an open access article distributed under the terms and conditions of the Creative Commons Attribution (CC BY) license (https://creativecommons.org/licenses/by/4.0/).
Share and Cite
Kang, Q.; Zhang, J.; Huang, G.; Liu, F. Robust Optical and SAR Image Matching via Attention-Guided Structural Encoding and Confidence-Aware Filtering. Remote Sens. 2025, 17, 2501. https://doi.org/10.3390/rs17142501
Kang Q, Zhang J, Huang G, Liu F. Robust Optical and SAR Image Matching via Attention-Guided Structural Encoding and Confidence-Aware Filtering. Remote Sensing. 2025; 17(14):2501. https://doi.org/10.3390/rs17142501
Chicago/Turabian StyleKang, Qi, Jixian Zhang, Guoman Huang, and Fei Liu. 2025. "Robust Optical and SAR Image Matching via Attention-Guided Structural Encoding and Confidence-Aware Filtering" Remote Sensing 17, no. 14: 2501. https://doi.org/10.3390/rs17142501
APA StyleKang, Q., Zhang, J., Huang, G., & Liu, F. (2025). Robust Optical and SAR Image Matching via Attention-Guided Structural Encoding and Confidence-Aware Filtering. Remote Sensing, 17(14), 2501. https://doi.org/10.3390/rs17142501