Article

The Long-Term Surface Deformation Monitoring and Prediction of Hutubi Gas Storage Reservoir in Xinjiang Based on InSAR and the GWO-VMD-GRU Model

1
College of Civil Engineering and Architecture, Xinjiang University, Urumqi 830046, China
2
Xinjiang Pamir Intercontinental Subduction National Field Observation and Research Station, Beijing 830011, China
3
Xinjiang Oilfield Gas Storage Co., Ltd., PetroChina, Karamay 834099, China
4
Institute of Seismology, China Earthquake Administration, Wuhan 430071, China
5
Earthquake Agency of Xinjiang Uygur Autonomous Region, Urumqi 830011, China
*
Author to whom correspondence should be addressed.
These authors contributed equally to this work.
Remote Sens. 2025, 17(14), 2480; https://doi.org/10.3390/rs17142480
Submission received: 3 June 2025 / Revised: 9 July 2025 / Accepted: 15 July 2025 / Published: 17 July 2025
(This article belongs to the Special Issue Advances in Remote Sensing for Land Subsidence Monitoring)

Abstract

Natural gas storage is an effective solution to address the energy supply–demand imbalance, and underground gas storage (UGS) is a primary method for storing natural gas. The overarching goal of this study is to monitor and analyze surface deformation at the Hutubi underground gas storage facility in Xinjiang, China, which is the largest gas storage facility in the country. This research aims to ensure the stable and efficient operation of the facility through long-term monitoring, using remote sensing data and advanced modeling techniques. The study employs the SBAS-InSAR method, leveraging Synthetic Aperture Radar (SAR) data from the TerraSAR and Sentinel-1 sensors to observe displacement time series from 2013 to 2024. The data is processed through wavelet transformation for denoising, followed by the application of a Gray Wolf Optimization (GWO) algorithm combined with Variational Mode Decomposition (VMD) to decompose both surface deformation and gas pressure data. The key focus is the development of a high-precision predictive model using a Gated Recurrent Unit (GRU) network, referred to as GWO-VMD-GRU, to accurately predict surface deformation. The results show periodic surface uplift and subsidence at the facility, with a notable net uplift. During the period from August 2013 to March 2015, the maximum uplift rate was 6 mm/year, while from January 2015 to December 2024, it increased to 12 mm/year. The surface deformation correlates with gas injection and extraction periods, indicating periodic variations. The accuracy of the InSAR-derived displacement data is validated through high-precision GNSS data. The GWO-VMD-GRU model demonstrates strong predictive performance with a coefficient of determination (R2) greater than 0.98 for the gas well test points. This study provides a valuable reference for the future safe operation and management of underground gas storage facilities, demonstrating significant contributions to both scientific understanding and practical applications in underground gas storage management.

1. Introduction

Underground gas storage (UGS) plays a crucial role in regulating the supply–demand balance of natural gas. As the largest underground gas storage facility currently in operation in China, the Hutubi UGS boasts several advantages, including large storage capacity, substantial gas regulation volumes, high safety standards, and low operational costs. The Hutubi UGS, located in a depleted oil and gas field in Xinjiang, officially began operations in June 2013. By August 2024, the total gas injected into the facility surpassed 23.4 billion cubic meters. The facility plays a vital role in China’s West-to-East Gas Transmission Project, as well as in achieving seasonal natural gas peak shaving and emergency dispatching in the northern Xinjiang region. The regulation of gas volumes at the UGS consists of both gas injection and extraction processes. The periodic injection and extraction of gas within the storage facility result in significant pressure differentials inside the reservoir, which in turn affect both horizontal and vertical surface movements. These changes lead to surface deformation and can potentially trigger seismic activity in the surrounding areas [1]. Therefore, to ensure the stable and safe operation of the Hutubi UGS, the long-term monitoring of surface deformation is essential.
Several studies have employed different techniques to monitor surface deformation at the Hutubi UGS and analyze the seismic hazards associated with its operations. Li et al. analyzed the vertical surface deformation at Hutubi UGS using seven sessions of second-order leveling data from 2013 to 2015 [2]. Qiao et al. utilized partial GPS data from the Hutubi UGS along with TerraSAR data from 2013 to 2015 to monitor surface deformation and assess the seismic risks induced by the gas storage operations [3]. Tang et al. explored the seismic triggering effects during the gas injection and extraction processes using seismic wave data and operational information from the UGS [4]. Jiang et al. conducted a geomechanical analysis of the seismic activity induced by the UGS using partial GPS and leveling data from 2013 to 2017 and developed a two-dimensional geomechanical model [5]. Wang et al. obtained time-series surface deformation information at Hutubi UGS based on SBAS-InSAR technology using Sentinel-1A data from 2017 to 2019 [6]. In a subsequent study, Wang et al. further extended their research by employing multi-source SAR data and the improved time-series InSAR technique (IPTA-InSAR). This study systematically monitored and inverted the long-term surface deformation process (2003–2020) at Hutubi UGS, and using geological parameters, quantitatively analyzed the deformation characteristics and their spatiotemporal evolution during gas injection and extraction processes through a composite dislocation model (CDM) [7].
The previous studies on surface deformation at the Hutubi UGS have predominantly relied on traditional geodetic techniques, such as leveling or GNSS measurements. These methods often have short time spans and limited spatial resolution. Since the commencement of gas injection and extraction at the Hutubi UGS in June 2013, there has been limited research on the long-term surface deformation, with some studies using InSAR techniques lacking validation through other monitoring methods. Furthermore, as InSAR technology has seen increasing applications in surface deformation monitoring, the integration of InSAR with machine learning and deep learning approaches for accurate surface deformation prediction has emerged as a promising new direction in research. The Small Baseline Subset InSAR (SBAS-InSAR) technique was first introduced by Berardino et al. [8]. in 2002, aiming to address the issues of temporal and spatial decorrelation that arise in monitoring large-scale and long-term surface deformation using traditional Differential Synthetic Aperture Radar Interferometry (D-InSAR) techniques. SBAS-InSAR utilizes multiple SAR image pairs with small spatial and temporal baselines to enhance the spatial-temporal resolution and reliability of surface deformation monitoring [8]. Unlike Persistent Scatterer InSAR (PS-InSAR), SBAS-InSAR does not rely on a single reference image; instead, each image is treated as the reference, maximizing the number of interferometric pairs and improving the spatial–temporal sampling density. The SBAS-InSAR technique offers a relatively low demand on the number of SAR acquisitions, making it particularly suitable for monitoring surface deformation in low-coherence regions, such as vegetated areas or urban fringes. Owing to its dense spatiotemporal baseline network configuration, SBAS-InSAR demonstrates substantial advantages in mitigating atmospheric delay effects and eliminating residual DEM errors. These strengths have enabled its widespread application in various fields, including geological hazard monitoring, land subsidence assessment, deformation analysis of reservoir slopes, and stability evaluation of urban infrastructure systems [9,10,11].
Currently, deep learning models commonly used for InSAR surface deformation trend prediction include Long Short-Term Memory (LSTM), Recurrent Neural Network (RNN), and Multilayer Perceptron (MLP). Among these, the Gated Recurrent Unit (GRU), as an improved version of the RNN, offers advantages over LSTM in terms of its simpler structure, fewer parameters, and higher computational efficiency. GRU has demonstrated unique advantages in learning the features of time series data and has been widely applied in time series prediction tasks. However, despite the application of deep learning models such as LSTM, RNN, and GRU for surface deformation trend prediction, the existing research is largely focused on improving the accuracy of the models themselves, while neglecting the impact of deformation feature factors on the prediction results. Additionally, many models still face shortcomings in extracting time series information features, leading to limitations in prediction accuracy and generalization ability. To overcome these limitations, this study proposes a novel GWO-VMD-GRU hybrid prediction model. The model first uses the Gray Wolf Optimization (GWO) algorithm to optimize the Variational Mode Decomposition (VMD) method, adaptively selecting the optimal decomposition layer number and penalty factor to precisely decompose the InSAR signal, extracting more accurate trend and periodic components. These components are then input into a GRU network for time series prediction, with a grid search optimization algorithm used to obtain the best hyperparameter settings, further enhancing the model’s prediction accuracy and generalization ability. Compared with traditional deep learning models such as LSTM and RNN, the innovation of the GWO-VMD-GRU hybrid model lies in its use of the GWO-optimized VMD method, which enables more accurate signal decomposition, avoiding errors caused by neglecting deformation feature factors in traditional models. Additionally, the GRU model, compared to LSTM, offers a simpler structure and higher computational efficiency, while the combination with GWO-VMD further enhances the model’s ability to learn from complex time series data, improving prediction accuracy and generalization.
To address this gap, this study employs the SBAS-InSAR technique, using multi-source SAR datasets, including TerraSAR-X data (2013–2015) and Sentinel-1 data (2015–2024), to obtain long-term surface deformation information at the Hutubi UGS. The reliability of the obtained displacement time series is validated through cross-comparison with GNSS measurement data. The proposed wavelet denoising and GWO-VMD-GRU hybrid prediction model has been successfully applied to the time series prediction of InSAR data and atmospheric pressure data from gas storage fields. It effectively predicts future surface deformation of certain gas wells in the Hutubi UGS, enabling integrated monitoring and prediction, and providing a more accurate forecasting tool for the management and decision-making of underground gas storage.

2. Study Area and Data Used

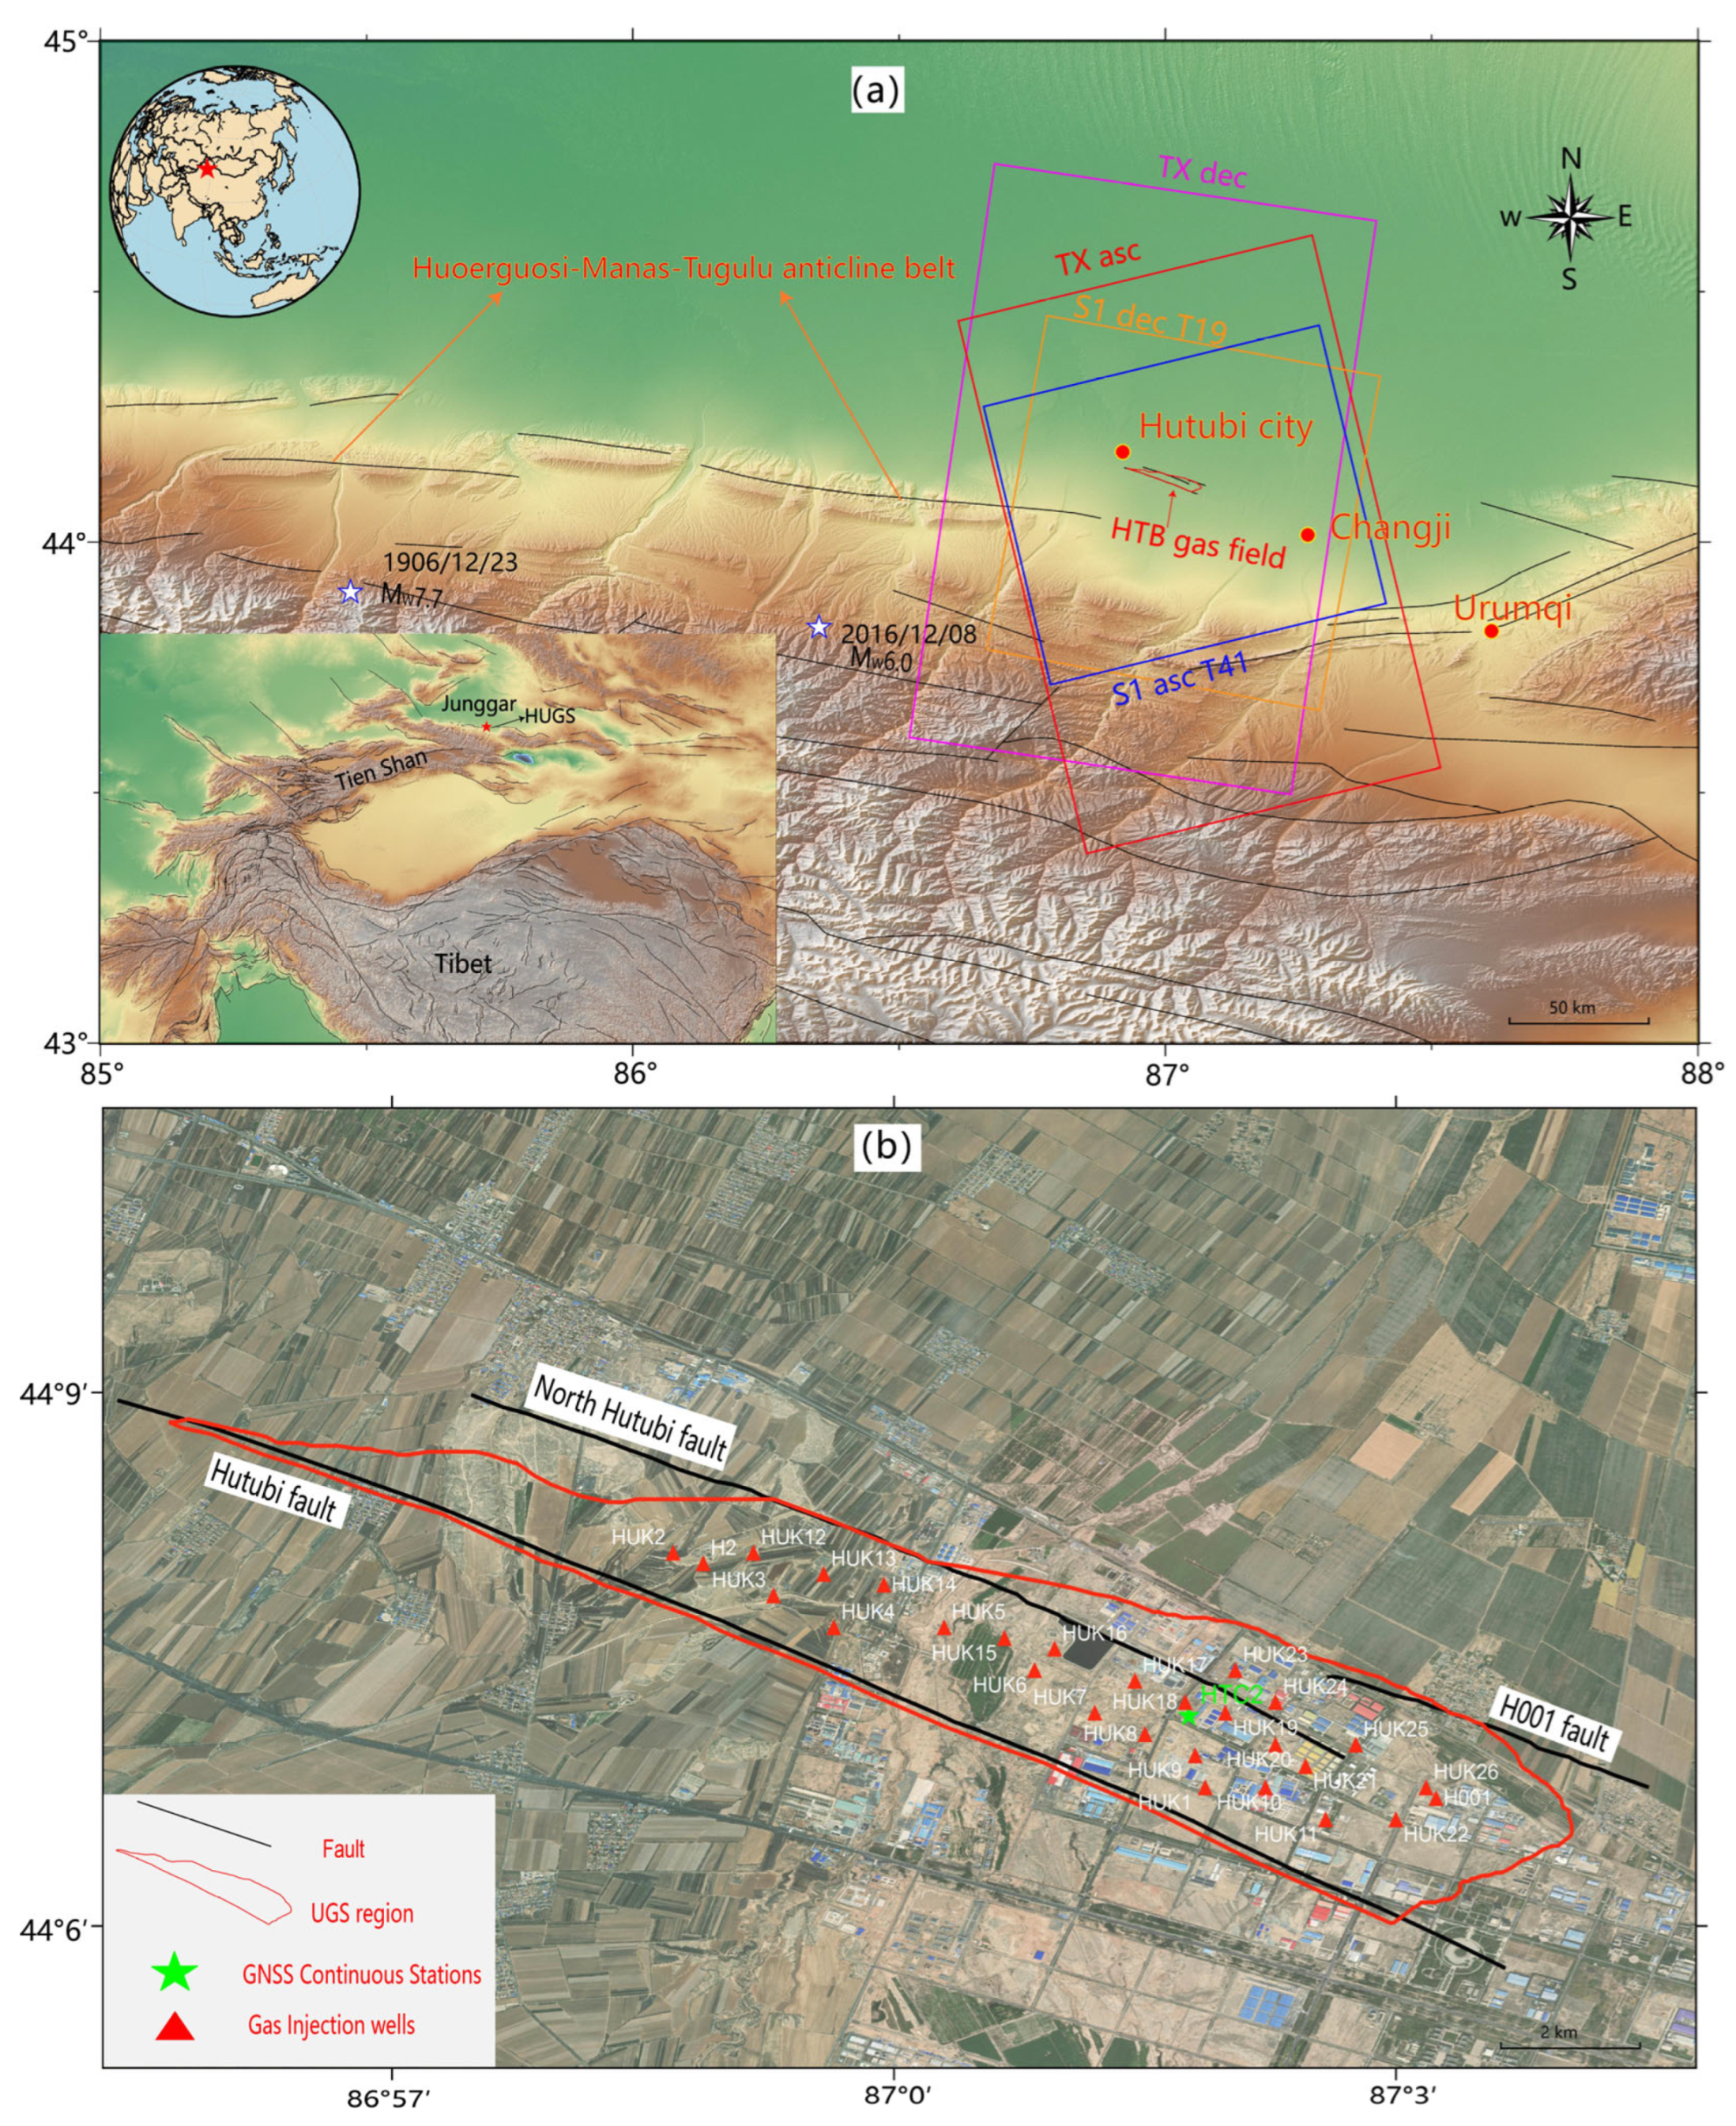
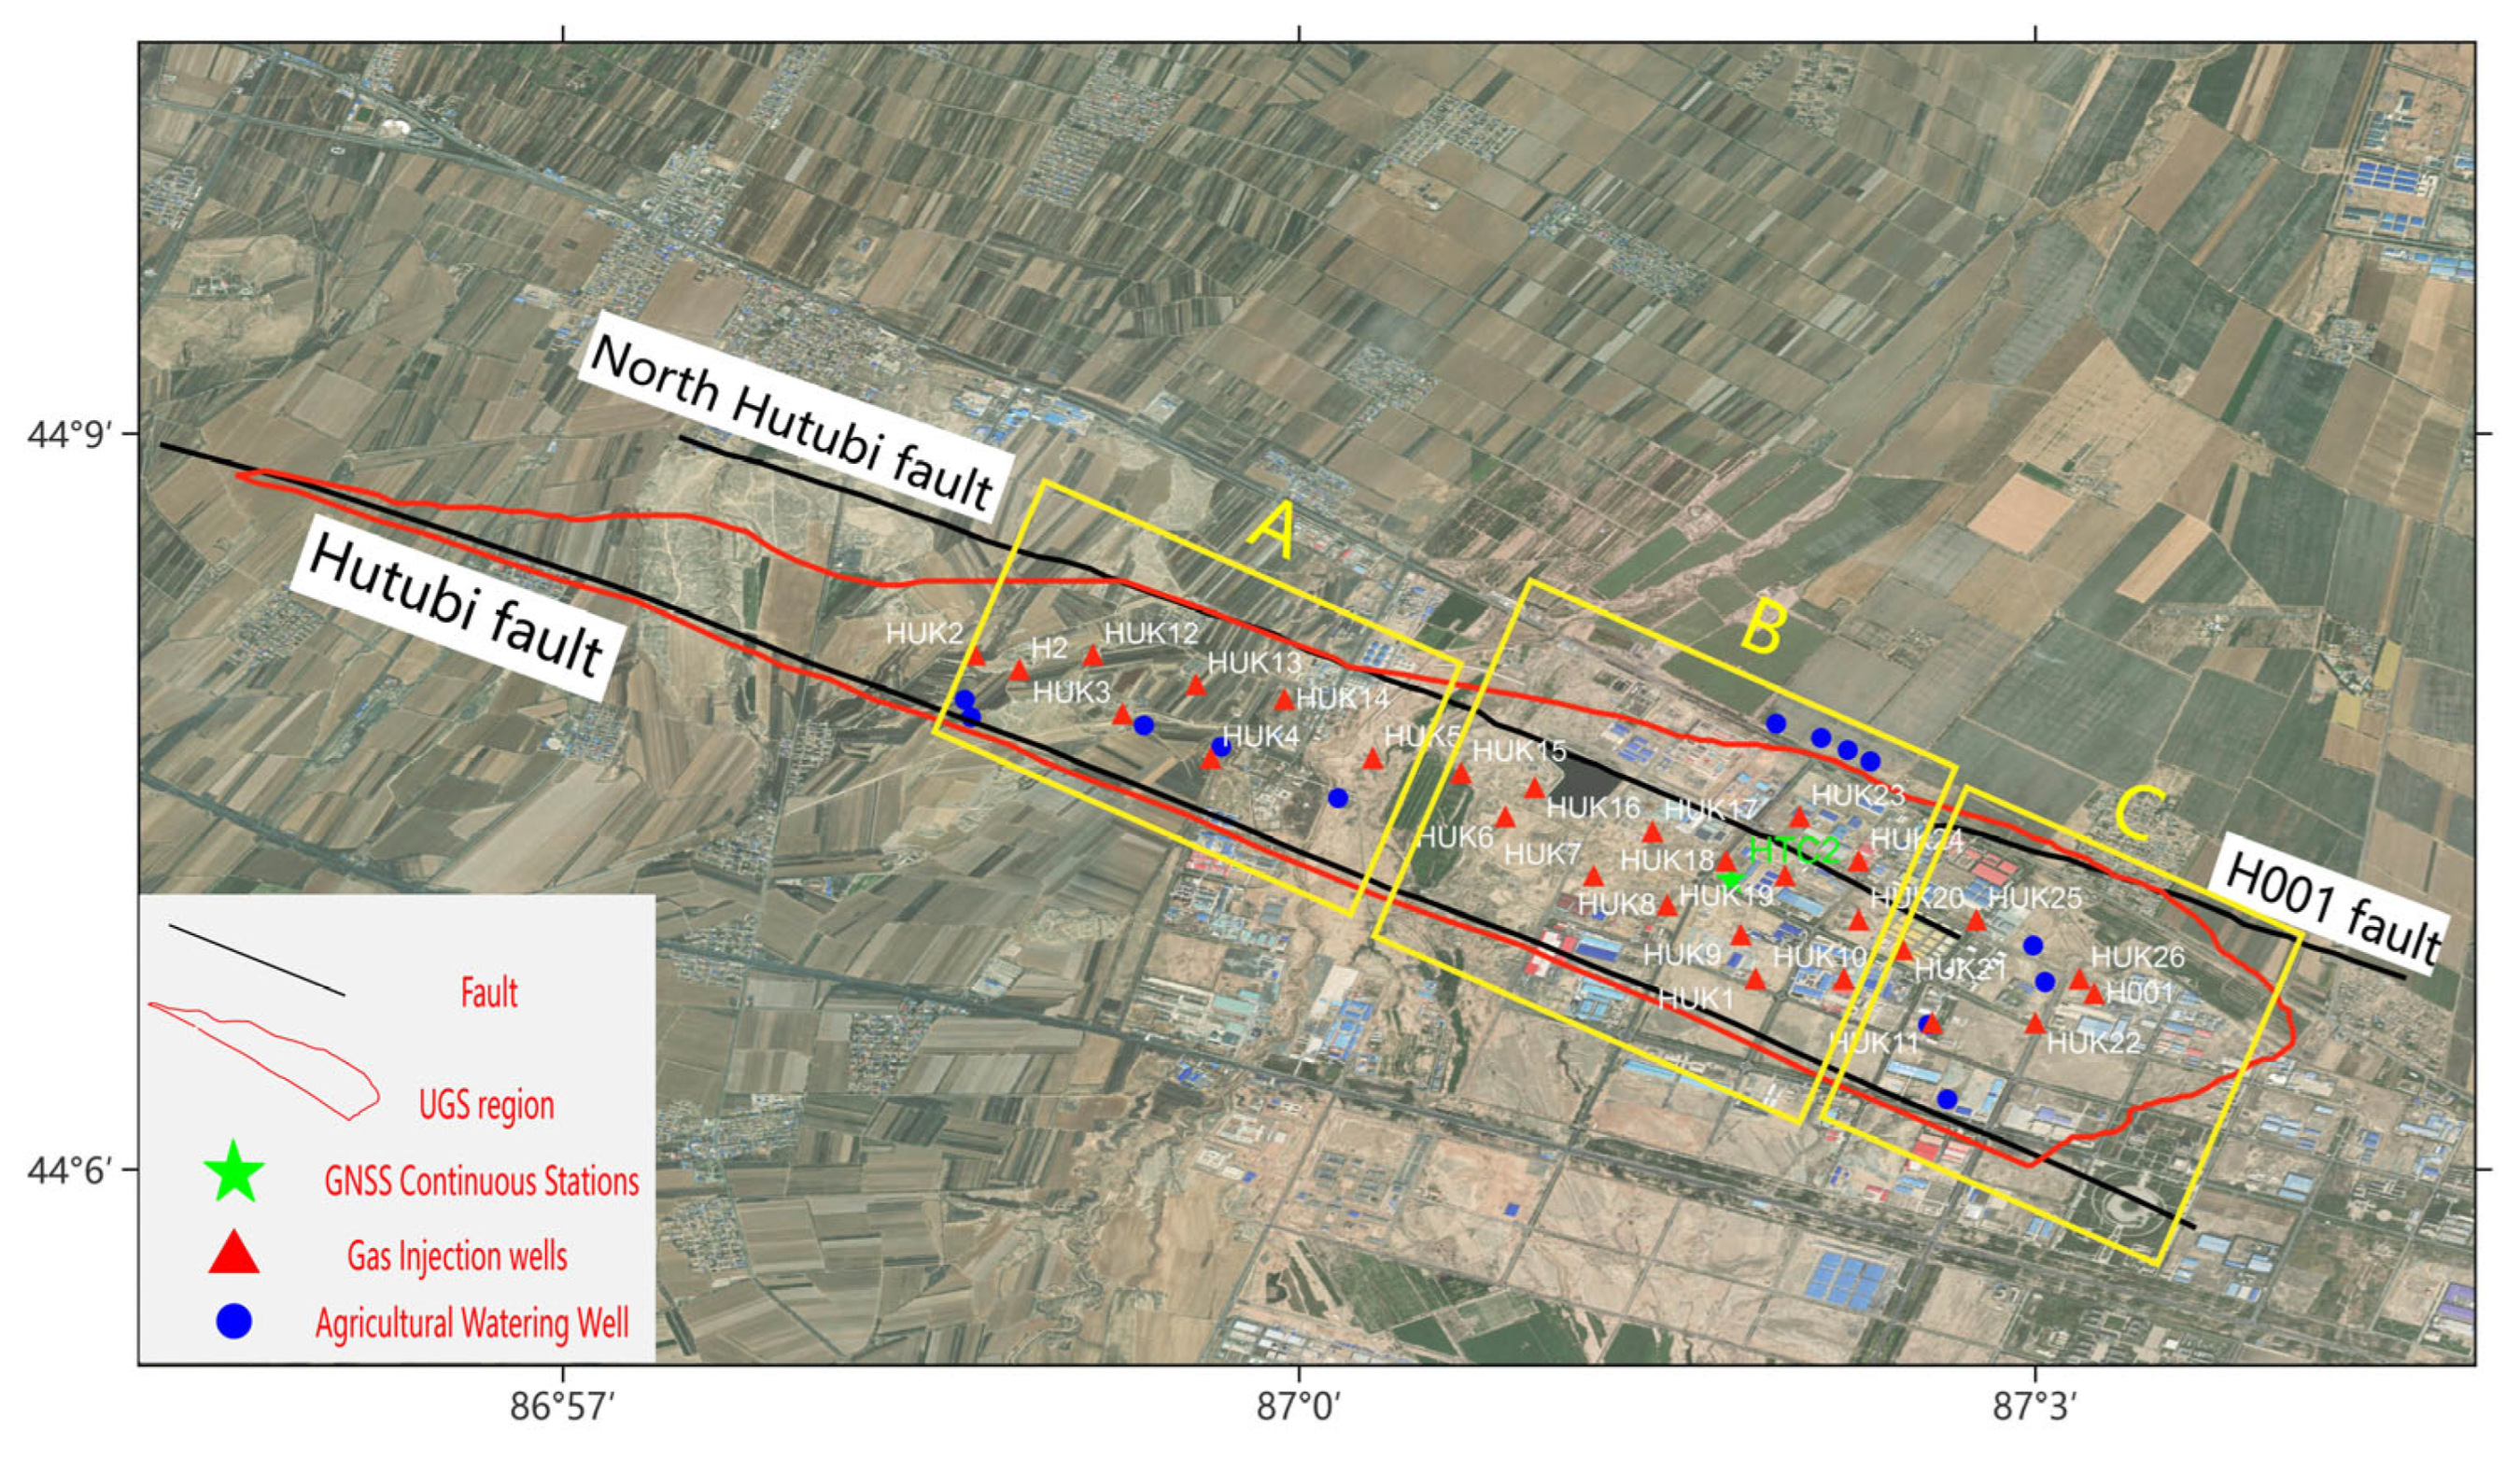
2.1. Background of the Study Area

The Hutubi UGS is located approximately 4.5 km east of Hutubi County in the Xinjiang Uygur Autonomous Region of China, at geographic coordinates near 43°N and 86°E. The facility is situated about 78 km southeast of the regional capital, Urumqi. It lies at the mid-section of the northern foothills of the Tianshan Mountains and the southern edge of the Junggar Basin, within the mountain-front alluvial–depression transition zone. The regional topography is generally characterized by a southward rise, with an elevation range from 360 to 460 m above sea level [12], as shown in Figure 1. The storage facility extends about 20 km along an east–west direction and spans approximately 3.5 km from north to south. The depth of the reservoir is around 3585 m, with the original formation pressure at approximately 33.96 MPa, exhibiting typical deep-buried, closed-structure characteristics [13]. This gas storage facility was transformed from the original Hutubi gas field, serving multiple functions such as gas storage, peak regulation, emergency response, and strategic reserves. The total storage capacity of the facility is 10.7 billion cubic meters, with 4.51 billion cubic meters available for production use. It is the first large-scale gas storage facility integrated with the “West-to-East Gas Transmission” main pipeline system and also the first large underground storage facility in the West-to-East Gas Transmission Phase II project. During its initial two-month operation starting in 2013, several minor seismic events occurred during the gas injection process, a phenomenon similar to seismic events triggered by gas storage in many facilities worldwide [14,15]. From a geological perspective, the Hutubi UGS is located within the Tianshan foreland alluvial basin. The geological structure in this region is complex and shaped significantly during the Himalayan orogenic period, when intense tectonic activity in the northern Tianshan Mountains triggered the development of multiple folds and reverse faulting in the mountain-front plain area. This resulted in significant differences between the deep and shallow structural patterns [16]. The Hutubi anticline is situated at the eastern end of the third structural belt of the Tianshan Mountain fold zone and is a product of Himalayan folding activities. The major gas-bearing formation in this region is the Zimiquanzi Group, which was formed in the late Quaternary period. The structure of the reservoir is a long-axis anticline trending near east–west, which is segmented by the Hutubi Fault into two fault-block units. The northern fault of Hutubi and the main fault together create a strip-like structural pattern in the western part of the region. The stratigraphy developed in the Hutubi gas storage reservoir area, from top to bottom, includes the following formations: Quaternary Xiyu Formation (Q1x), Neogene Dushanzi Formation (N2d), Tashihe Formation (N1t), Shawan Formation (N1s), Paleogene Anjihaihe Formation (E2-3a), Ziniquanzi Formation (E1-2z), and the Upper Cretaceous Donggou Formation (K2d). The target reservoir layer, the Ziniquanzi Formation, is in conformable contact with the overlying Anjihaihe Formation (E2-3a) and the underlying Donggou Formation (K2d). The cap rock above the upper part of the Ziniquanzi Formation mainly consists of mudstone, which is dense, and has low permeability and high compressive strength, providing a well-sealed cap layer for gas storage, ensuring the safe and efficient operation of the gas storage reservoir [17,18]. Furthermore, three major faults have been identified surrounding the Hutubi gas storage facility: the HTB Fault, the HTB North Fault, and the H001 Fault. The development of these faults plays a crucial role in the structural integrity and gas storage security of the facility. The activity and permeability of these faults should be thoroughly assessed and monitored throughout the long-term dynamic operation of the storage facility. The HTB fault is the main fault in this region. This fault is a reverse-thrust fault, with a steep upper block and a gentle lower block. It extends for a length of 20 km, with a strike direction of northwest and a dip to the south. The fault displacement ranges from 60 to 200 m, causing a repetition of strata in the target layer of the Ziniquanzi Formation. Compared to the HTB fault, the HTB North fault and H001 fault have smaller vertical displacements and shorter horizontal extents. Specifically, the HTB fault extends for 12 km, with a displacement of 20–40 m, while the H001 fault extends for 8.5 km, with a displacement of 20–40 m as well. The stratigraphic repetition in the hanging wall and footwall of these faults is minimal [19].

2.2. Datasets

This study employs multi-source SAR data to conduct long-term surface deformation monitoring of the Hutubi UGS area in Xinjiang, China. The monitoring period spans from August 2013 to December 2024, covering over 11 years of data. The study achieves comprehensive spatial coverage of the research area. The multi-source dataset includes 23 ascending-track TerraSAR X-band images and 267 ascending-track Sentinel-1 T41 SAR images in the C-band. Detailed information about the dataset is provided in Table 1.

3. Methodology

The data processing and model prediction process of this paper is shown in Figure 2.

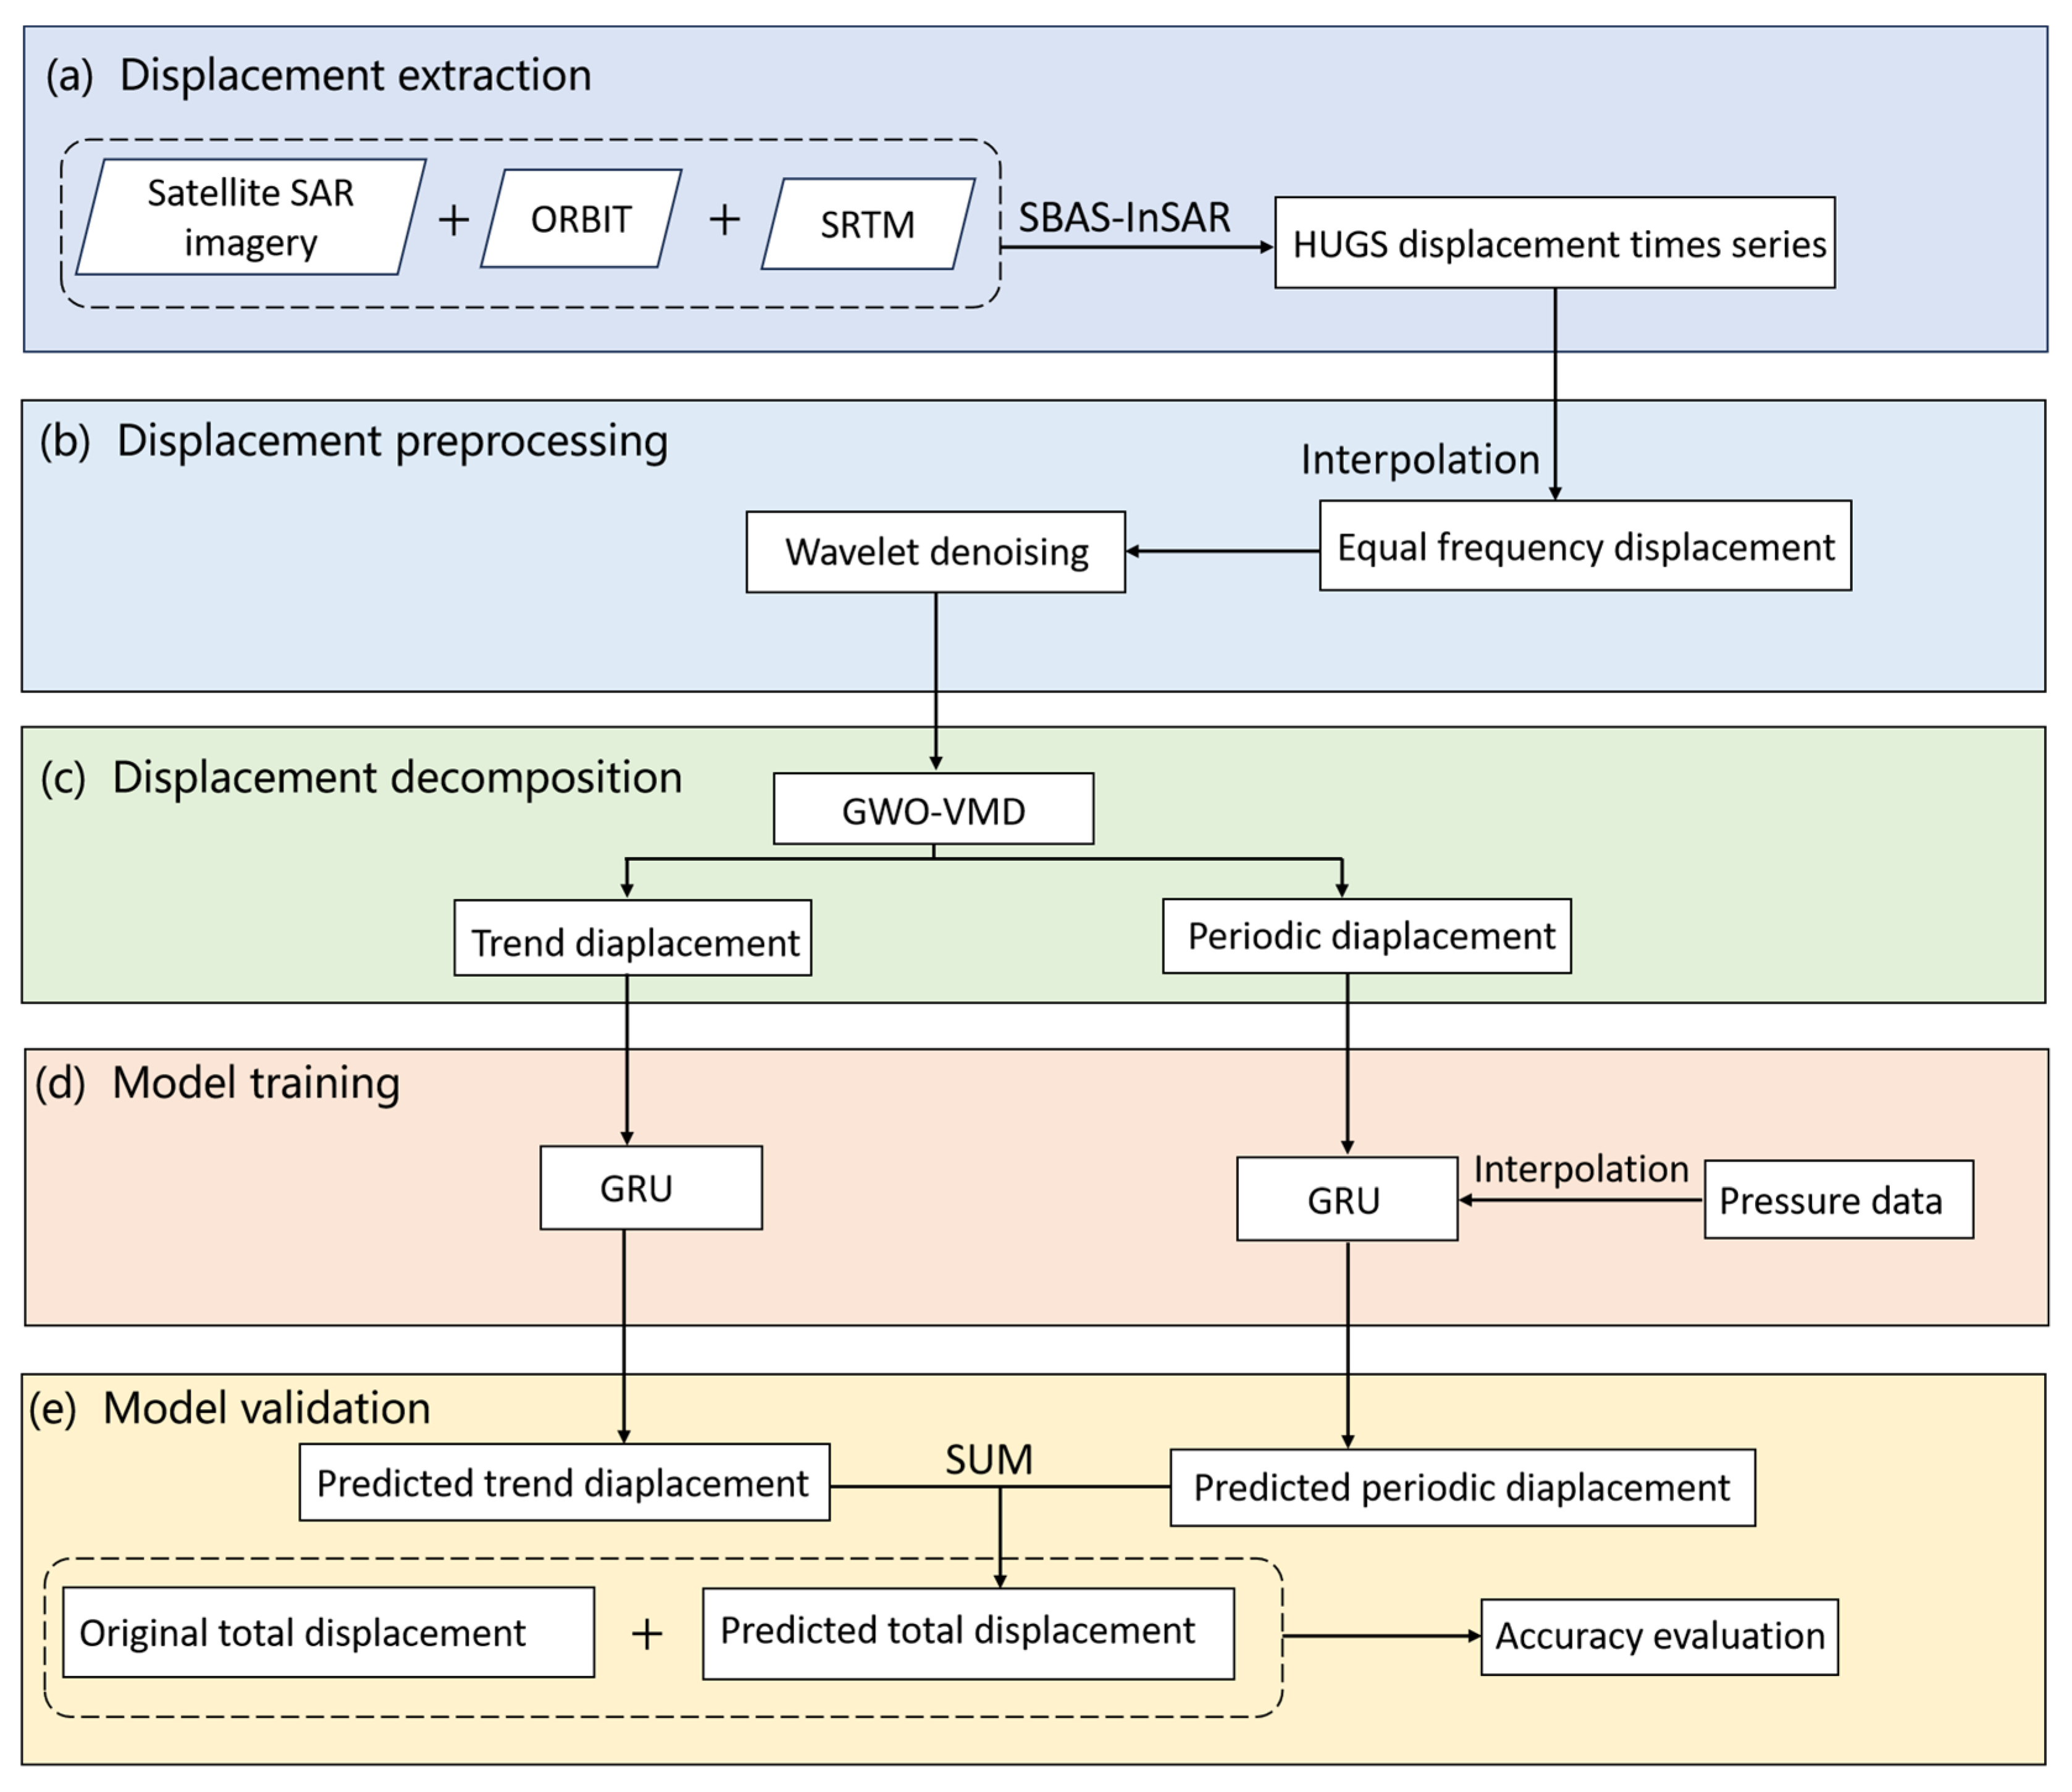
3.1. SBAS-InSAR Method and Processing

The core idea of this SBAS-InSAR is to pair images from the sequence based on reasonable spatial and temporal baseline thresholds, constructing multiple interferogram pairs that satisfy the small baseline condition. For a time series of N + 1 multi-temporal SAR images, the total number of differential interferograms ( M ) that can be generated is given by the following range:
N + 1 2 M N N + 1 2
where M represents the number of interferogram pairs that meet the small baseline criteria. After generating the interferograms, high-precision Precise Orbit Determination (POD) data are used to remove orbit errors, and external Digital Elevation Models (DEMs) such as Shuttle Radar Topography Mission (SRTM) or TanDEM-X are employed to eliminate topographic phase contributions. To further enhance the interferogram quality, the Goldstein filter is typically applied for phase smoothing, improving the signal-to-noise ratio. Next, coherent points (pixels with high coherence) are extracted based on the coherence coefficient of the interferograms. These points exhibit good coherence throughout the time series, making them suitable for subsequent phase time-series inversion. For each interferometric pair k , the phase difference can be expressed as follows:
δ φ k x , r = φ k t i , x , r φ k t j , x , r + δ φ k , d e f x , r + δ φ k , a t o m x , r + δ φ k , n o i s e x , r  
where δ φ k , d e f   represents the phase difference caused by surface deformation, δ φ k , a t o m   represents atmospheric delay errors, and δ φ k , n o i s e accounts for system noise and processing errors. To obtain physically meaningful deformation time series, the phase difference is converted to the average velocity over the unit time:
v i j | = | φ j φ i t j t i
This allows for the construction of the following integral relation to invert the long-term deformation:
k = i j t k t k 1 v k = δ φ
This equation can be rearranged into a linear algebraic form:
B v = δ φ
where B is the M × N coefficient matrix formed by the temporal baselines, v is the deformation rate vector to be solved, and δ φ is the vector of phase differences from the interferograms. Since this system is often underdetermined or ill-conditioned, singular value decomposition (SVD) or least squares methods are commonly used to solve for v [20]. The resulting velocity vector v can then be integrated to obtain the complete deformation time series.
The data processing in this study was carried out using the open-source software GMTSAR 6.5. GMTSAR is unique in that it utilizes precise orbital data to optimize the InSAR processing workflow. Compared to other similar InSAR processing systems, such as ROI_PAC, Gamma, and DORIS, GMTSAR offers significant advantages by incorporating precise orbital data, which greatly reduces the complexity of the InSAR processing algorithms. More importantly, GMTSAR is capable of automatically processing large volumes of SAR images without the need for manual intervention [21,22]. To improve the quality of the SAR results, different parameters were selected for the Sentinel-1 and TerraSAR datasets. For the Sentinel-1 data, interferometric pairs with a maximum spatial baseline of 250 m and a maximum temporal baseline of 90 days were selected, as shown in Figure 3b. The Goldstein method was applied for filtering, followed by phase unwrapping using the Snaphu package. For the TerraSAR data, interferometric pairs with a maximum spatial baseline of 1000 m and a maximum temporal baseline of 150 days were selected, as shown in Figure 3a. Similarly, the Goldstein method and Snaphu package were used for filtering and phase unwrapping. Additionally, the SRTM1 digital elevation model (DEM) with a resolution of 30 m and the ESA-provided AUX_POEORB precise orbit parameters were employed for georeferencing, simulating the topographic phase, and removing topographic effects. After processing, the results were geo-coded to obtain the line-of-sight (LOS) deformation data for the study area.

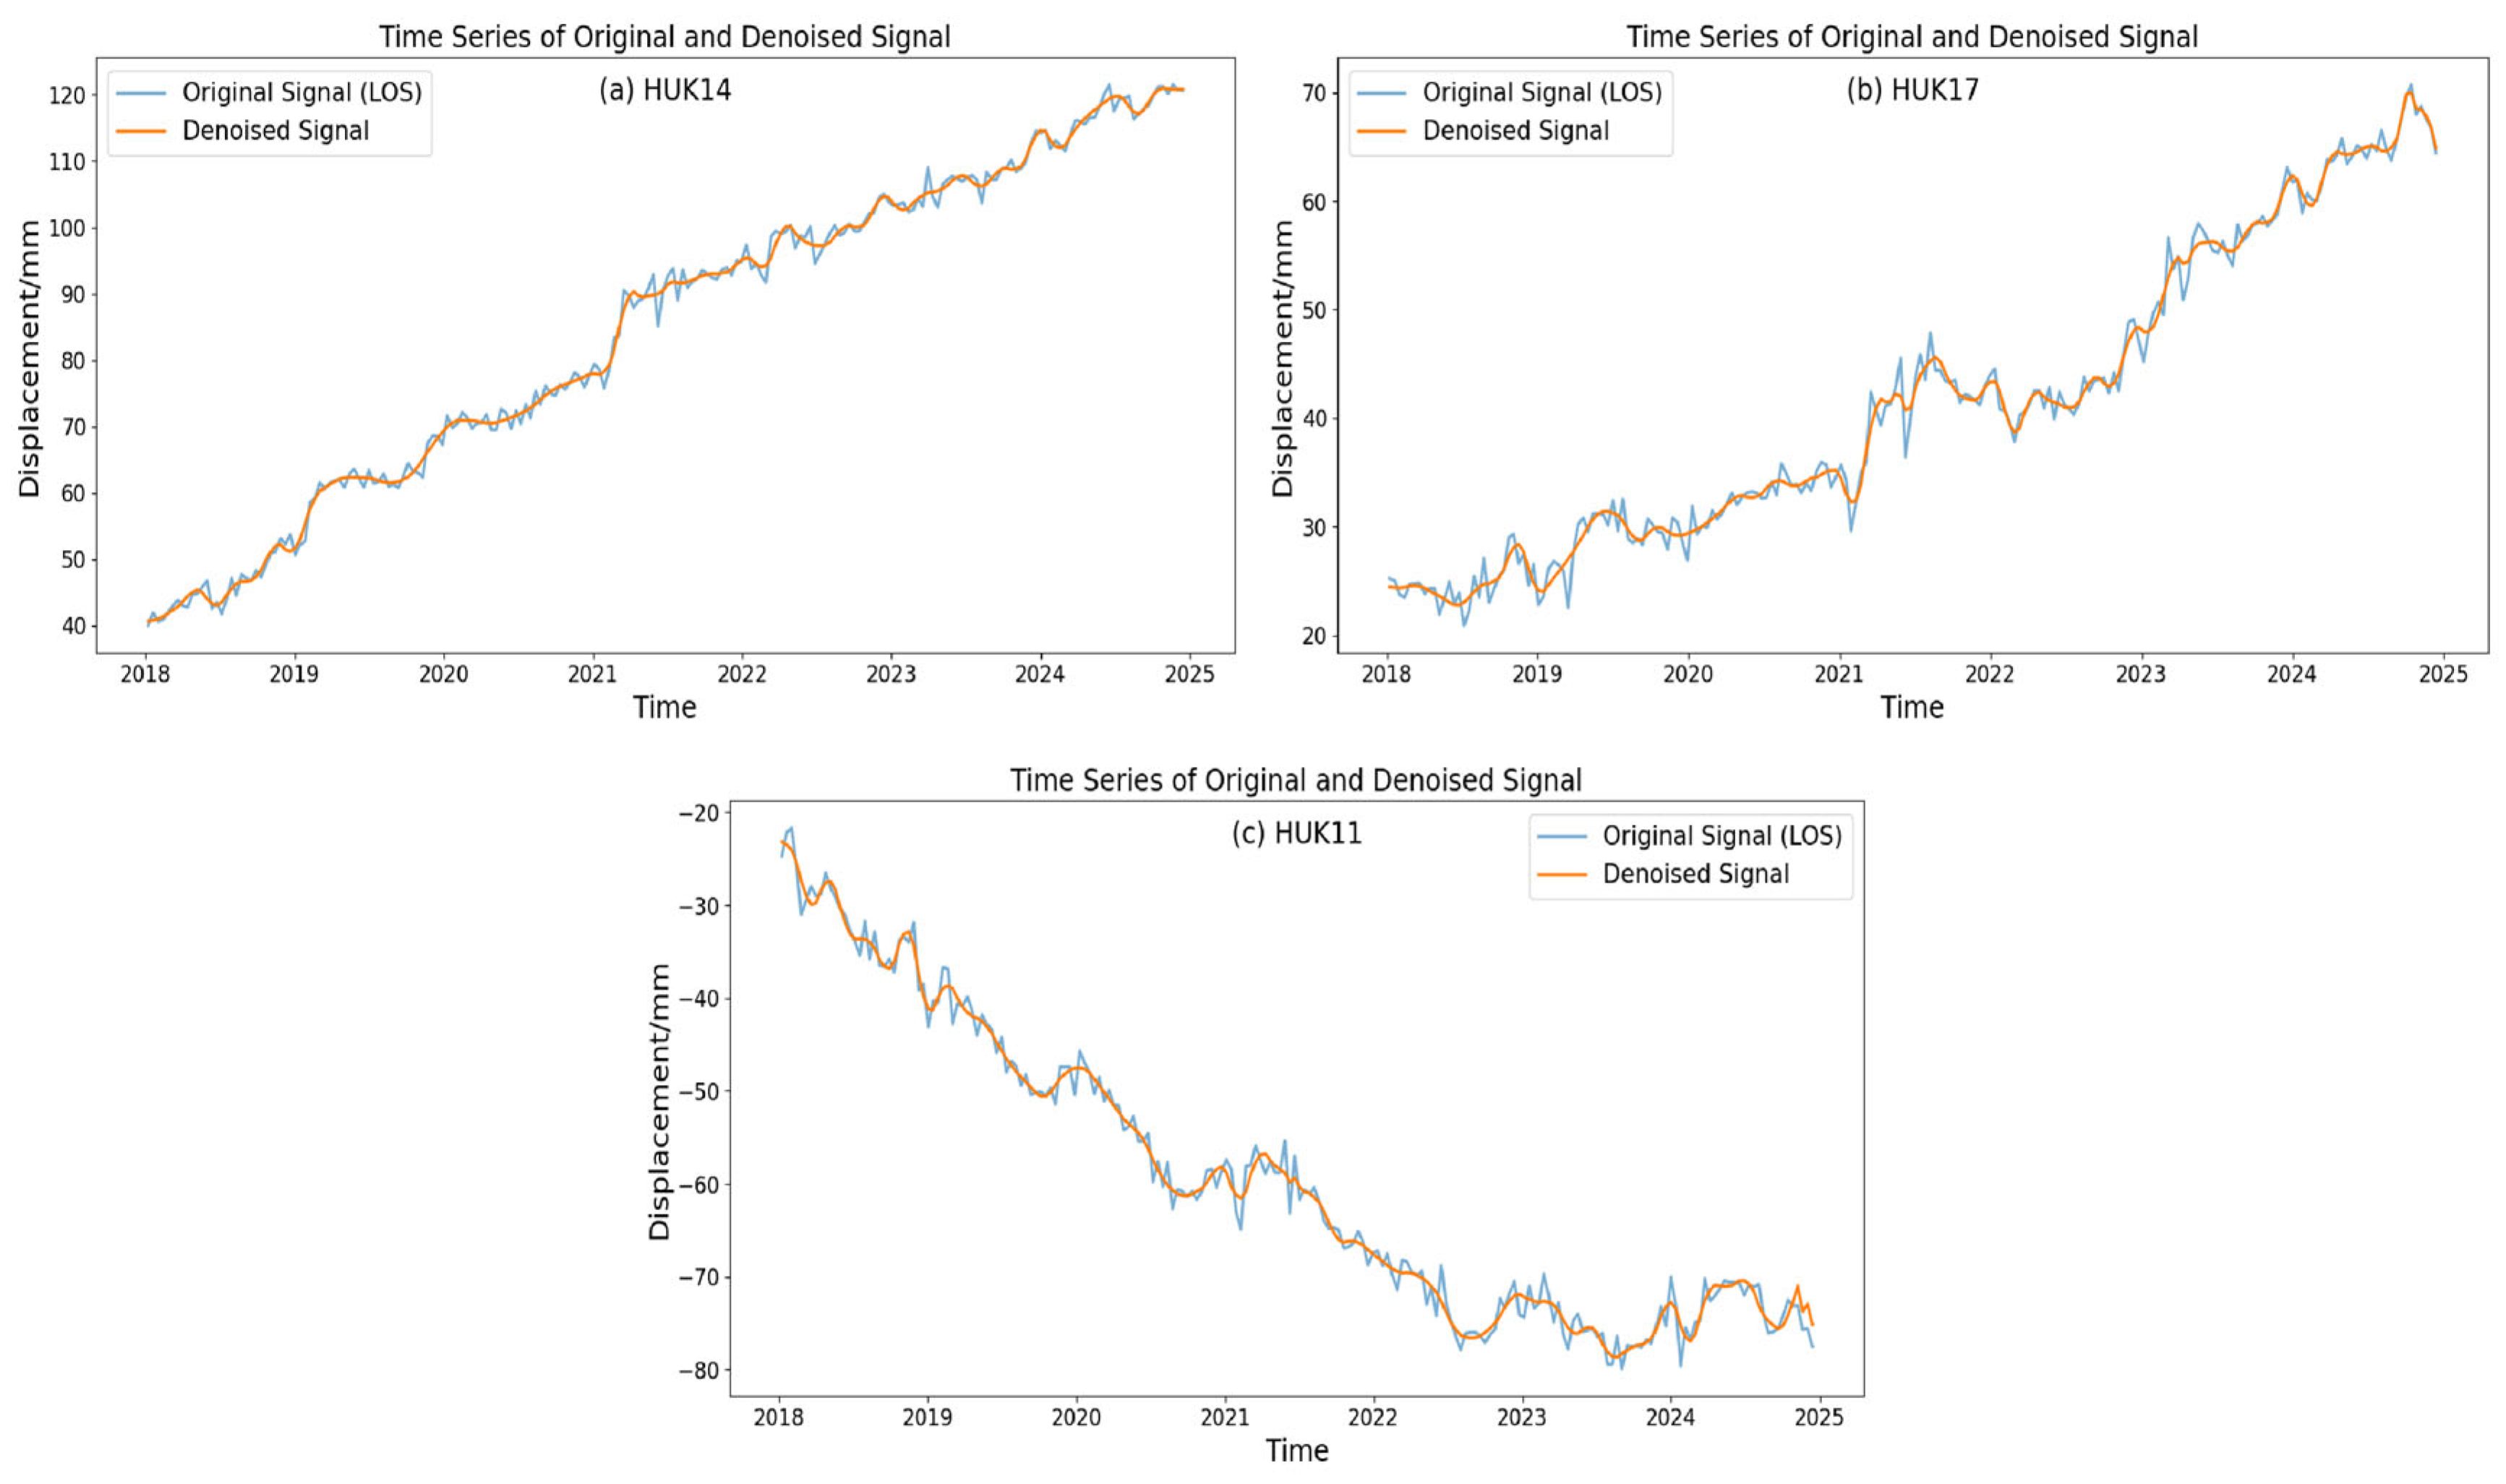
3.2. Wavelet Denoising of Raw Time Series

Wavelet denoising is a commonly used preprocessing technique in the analysis of InSAR time series. It aims to suppress noise and enhance the signal-to-noise ratio, thereby enabling the more accurate retrieval of surface deformation signals [23]. InSAR time series data are often contaminated by various sources of error, including atmospheric delays, orbital inaccuracies, and spatial variations in coherence. Wavelet-based methods are particularly effective in preserving meaningful geophysical signals while attenuating high-frequency noise components [24]. In a typical InSAR processing workflow, an appropriate wavelet basis function and decomposition level are first selected. The original time series signal is then decomposed into different frequency bands using discrete wavelet transform (DWT), resulting in low-frequency approximation components and high-frequency detail components. The low-frequency part generally captures the long-term deformation trends, whereas the high-frequency components are rich in random noise. To mitigate the influence of noise, thresholding techniques—such as soft or hard thresholding—are applied to the high-frequency detail components. These methods aim to suppress noise while retaining key features of surface deformation. Finally, inverse wavelet transform is performed to reconstruct the denoised time series from the modified components. This process enhances the overall signal quality and improves the accuracy of deformation detection in InSAR applications [25].

3.3. GWO-VMD-GRU Model

The GWO-VMD-GRU time series forecasting model combines the strengths of the Gray Wolf Optimizer (GWO), Variational Mode Decomposition (VMD), and Gated Recurrent Unit (GRU). This hybrid model leverages the GWO algorithm to determine optimal VMD parameters for decomposing the original time series data. Subsequently, a grid search is employed on the decomposed data to find the best GRU parameters, followed by GRU-based prediction. This combined approach demonstrates high predictive accuracy and flexibility when handling complex time series data. The individual components of this model are introduced as follows:
Variational Mode Decomposition (VMD) is an adaptive signal decomposition method used in signal processing [26]. VMD decomposes a complex signal into a set of intrinsic mode functions (IMFs) with limited bandwidth. This process is achieved by formulating a variational optimization problem, ensuring that each mode has finite bandwidth and that the modes do not overlap, unlike Empirical Mode Decomposition (EMD), which suffers from mode mixing. VMD can effectively decompose signals in noisy environments, and the decomposition can be optimized by adjusting parameters such as the number of modes ( K ), providing better mathematical definition and robustness [27,28,29]. The performance of Variational Mode Decomposition (VMD) largely depends on the setting of two key parameters: one is the decomposition level K , which determines how many intrinsic mode functions (IMFs) the signal is decomposed into; the other is the penalty factor α , which controls the bandwidth convergence speed of the mode functions. To avoid subjective settings, we employ the Gray Wolf Optimization (GWO) algorithm to automatically search for the optimal combination of K and α . Let the original time series be x ( t ) , and the IMFs obtained after VMD processing are
V M D ( x ( t ) ; K , α ) { u k ( t ) } k = 1 K
In this paper, the Shannon entropy of IMF2 is used as the fitness function to minimize. The smaller the entropy, the higher the concentration of information and the better the demodulation effect. The fitness function is
F ( K , α ) = H ( u 2 ( t ) )
where H ( u ) represents the Shannon entropy, defined as
H ( u ) = i = 1 N p i l o g 2 ( p i ) , p i = | u ( i ) | 2 j = 1 N   | u ( j ) | 2
Gray Wolf Optimizer (GWO) is a population-based optimization algorithm inspired by the social hierarchy and hunting behaviors of gray wolves. Proposed by Mirjalili et al. in 2014, [30]. GWO simulates the cooperation mechanism of wolves at different hierarchical levels to search for optimal solutions. With a simple structure, few parameters, and ease of implementation, GWO has been widely applied in engineering optimization, machine learning, and combinatorial optimization [31,32]. In this study, GWO is used to optimize the VMD parameters (e.g., the number of modes, secondary penalty factor, and iteration count), eliminating the need for manual parameter tuning. This approach enhances the model’s generalization ability and ensures strong global search capability, making it well-suited for solving the non-convex optimization problem in VMD and avoiding local optima. Specifically, the Gray Wolf Optimization (GWO) algorithm uses the leader wolf α , deputy leader wolf β , and secondary leader wolf δ as guiding directions to lead the rest of the pack in searching for the optimal solution. The position vector of each search individual represents a set of candidate Κ and α values, and optimization is performed through position update formulas. The position vector of an individual is represented as:
X i = [ α i , K i ] , α i [ α m i n , α m a x ] , K i [ K m i n , K m a x ]
Since K must be an integer, rounding is required in each iteration:
K i i n t = r o u n d ( K i )
The position update formula for a search individual is
X ( t + 1 ) = 1 3 X α + X β + X δ
The distance between an individual and the leader wolf α is calculated as
D α = | C 1 X α X ( t ) | , X 1 = X α A 1 D α
Here, A 1   and C 1 are coefficients for position updates, calculated as
A = 2 a r 1 a , C = 2 r 2 , a [ 0,2 ] , r 1 , r 2 [ 0,1 ]
where a is a parameter that linearly decreases with the number of iterations, controlling the reduction in the search range, and r 1 and r 2 are random vectors that control the randomness in the search process.
Gated Recurrent Unit (GRU) is an advanced variant of the Recurrent Neural Network (RNN), specifically designed to address the vanishing and exploding gradient problems encountered when modeling long sequences [33]. By introducing a gating mechanism—comprising an update gate and a reset gate—GRU effectively regulates the flow of information, enabling the network to capture long-term dependencies more efficiently, as illustrated in Figure 4. Compared with the Long Short-Term Memory (LSTM) network, GRU features a more streamlined architecture with fewer parameters, leading to faster training convergence, better scalability, and competitive predictive performance. These characteristics make GRU particularly advantageous for time series forecasting tasks [34]. GRU simplifies the traditional LSTM architecture by combining the input gate and forget gate into a single update gate, which determines the extent to which the previous hidden state h t 1 is retained or updated. The update gate z t is computed as
z t = σ ( W z [ h t 1 , x t ] )
The updated hidden state h t is then calculated as
h t = ( 1 z t ) h t 1 + z t h ~ t
Here, h t denotes the candidate hidden state, and ⊙ represents element-wise multiplication. A higher value of z t implies that more new information h t is incorporated, while less of the previous state is preserved. This mechanism enhances the model’s ability to capture long-range dependencies in sequential data. The reset gate r t ∈(0,1) controls how much of the previous hidden state h t 1 contributes to the candidate hidden state h ~ t , facilitating the learning of short-term patterns. The reset gate operates through two key steps:
r t = σ ( W r [ h t 1 , x t ] )
h ~ t = σ ( W o [ r t h t 1 , x t ] + b o )
In this formulation, a smaller r t leads to greater forgetting of past information, enabling the GRU to focus on recent inputs. The joint action of the update and reset gates allows GRU to dynamically balance short- and long-term dependencies, making it highly effective for modeling complex time series data [35,36].

4. Results

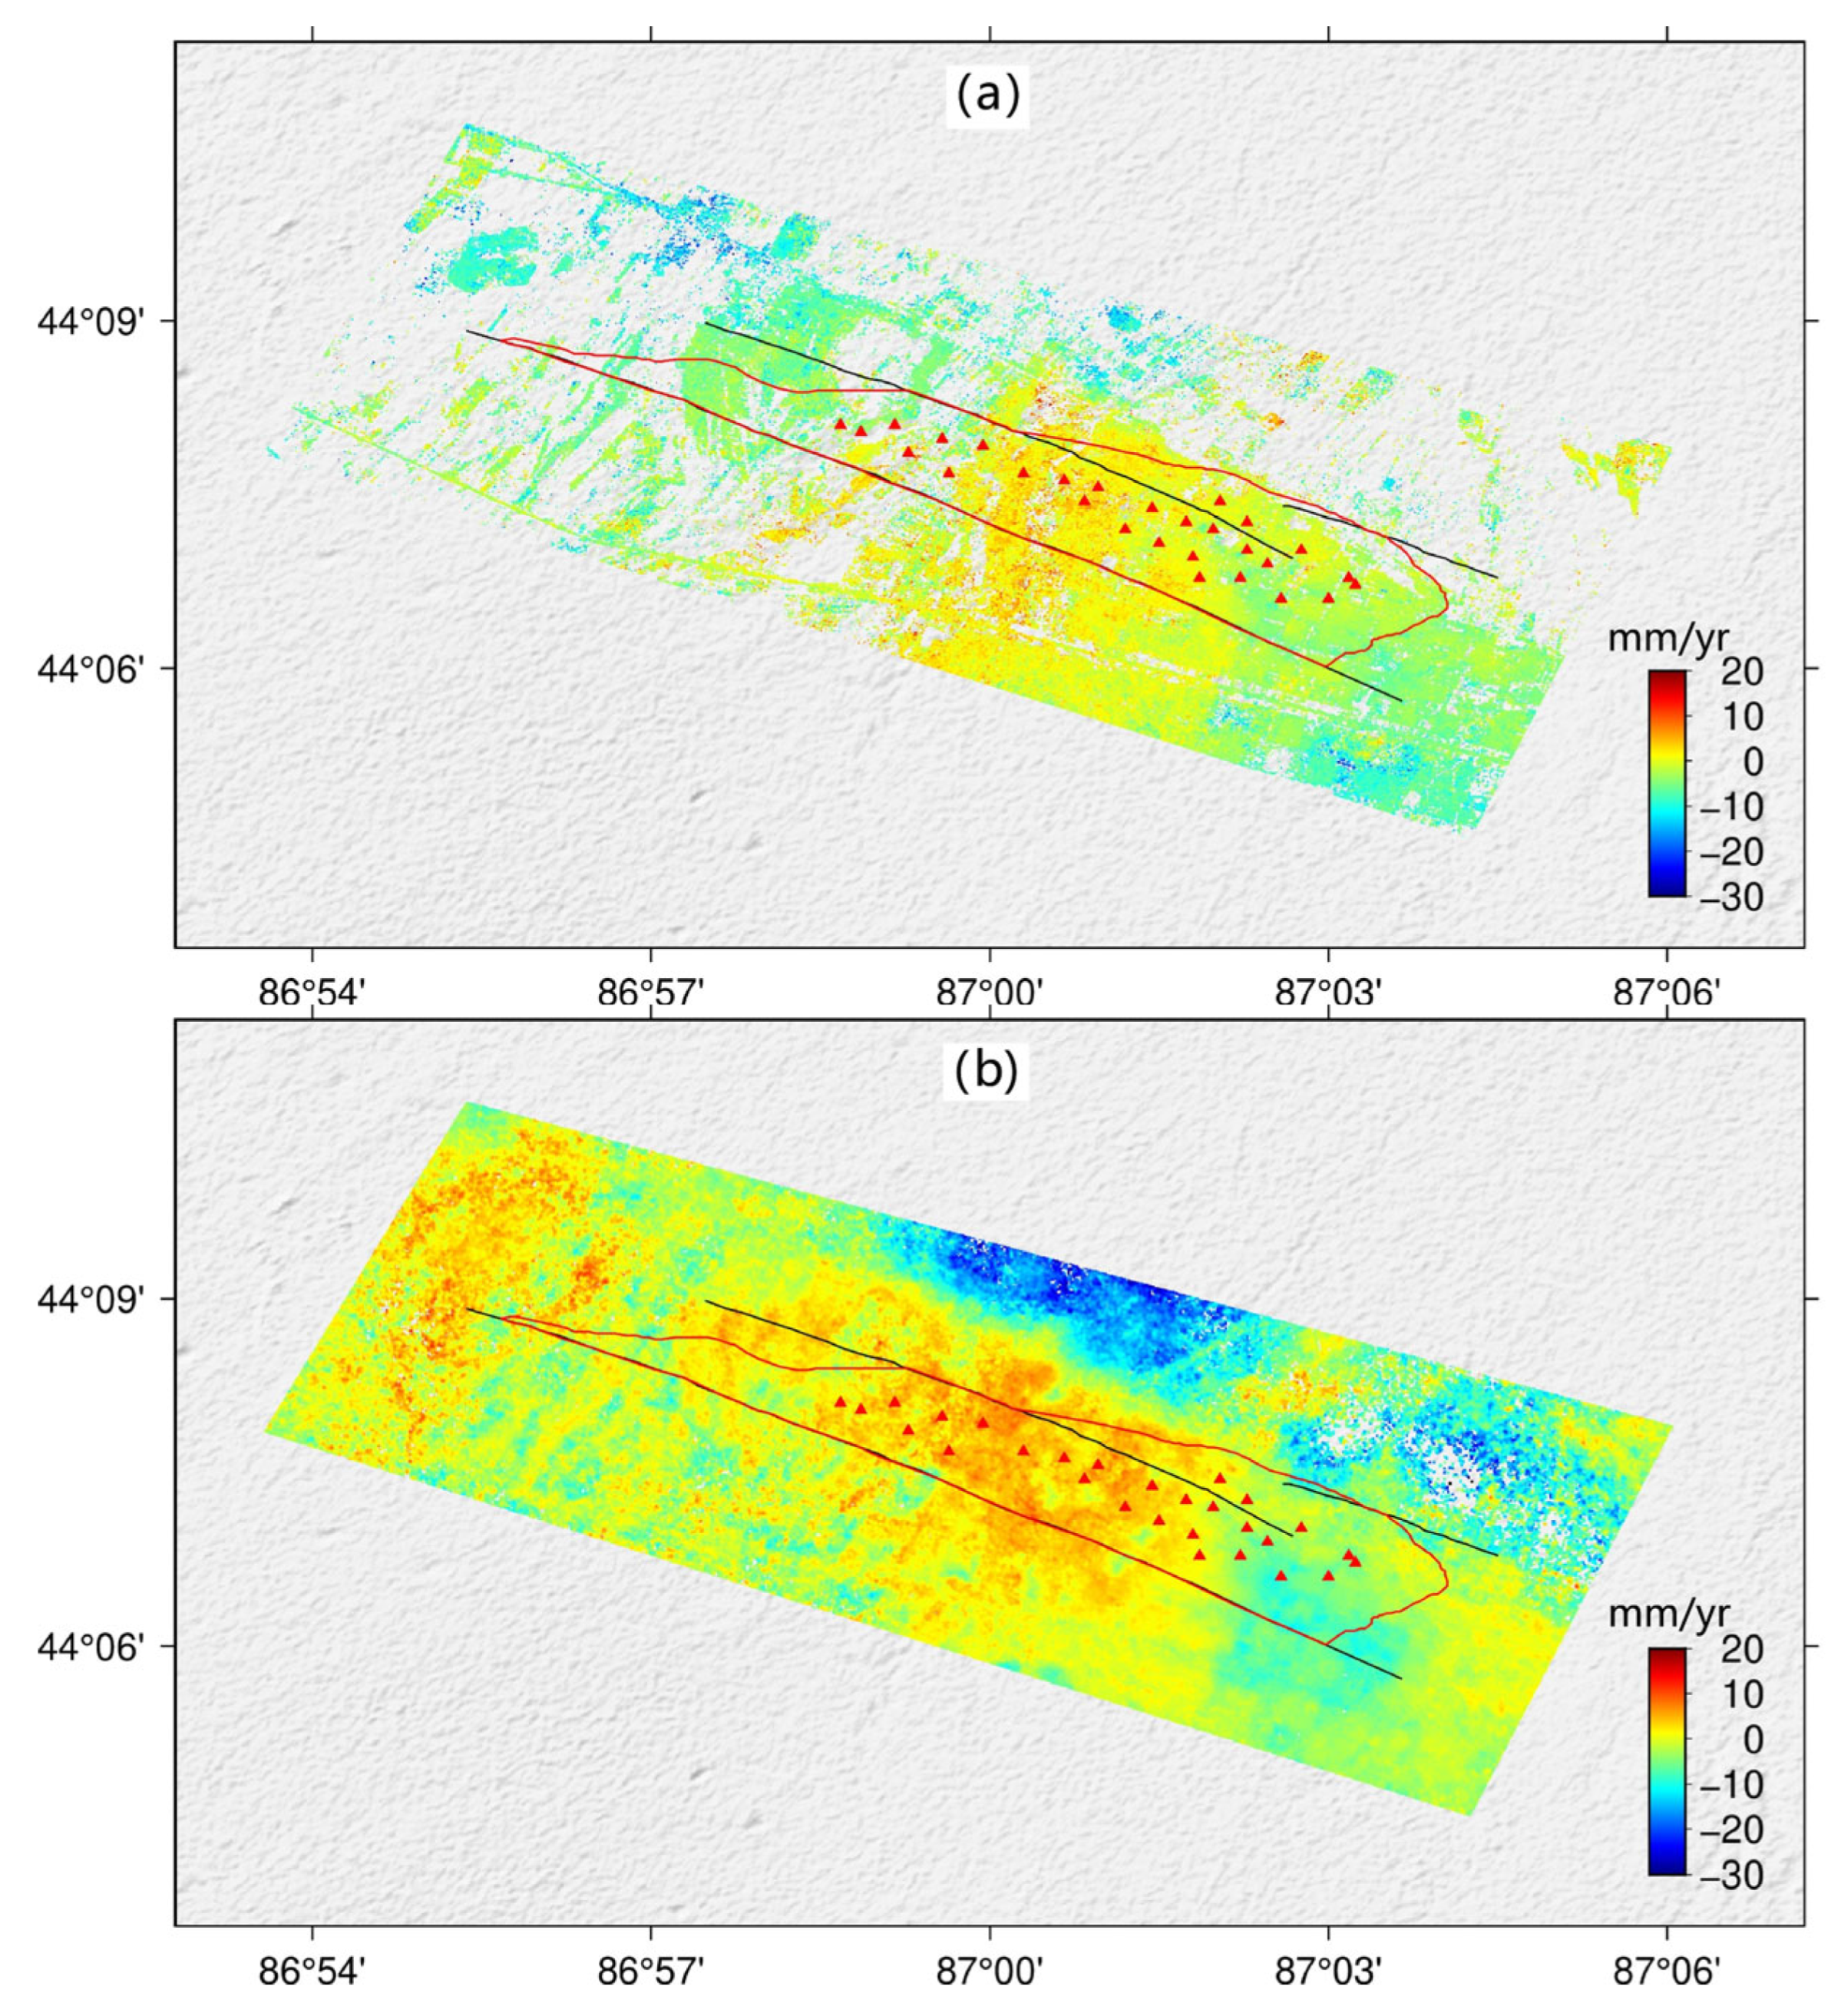
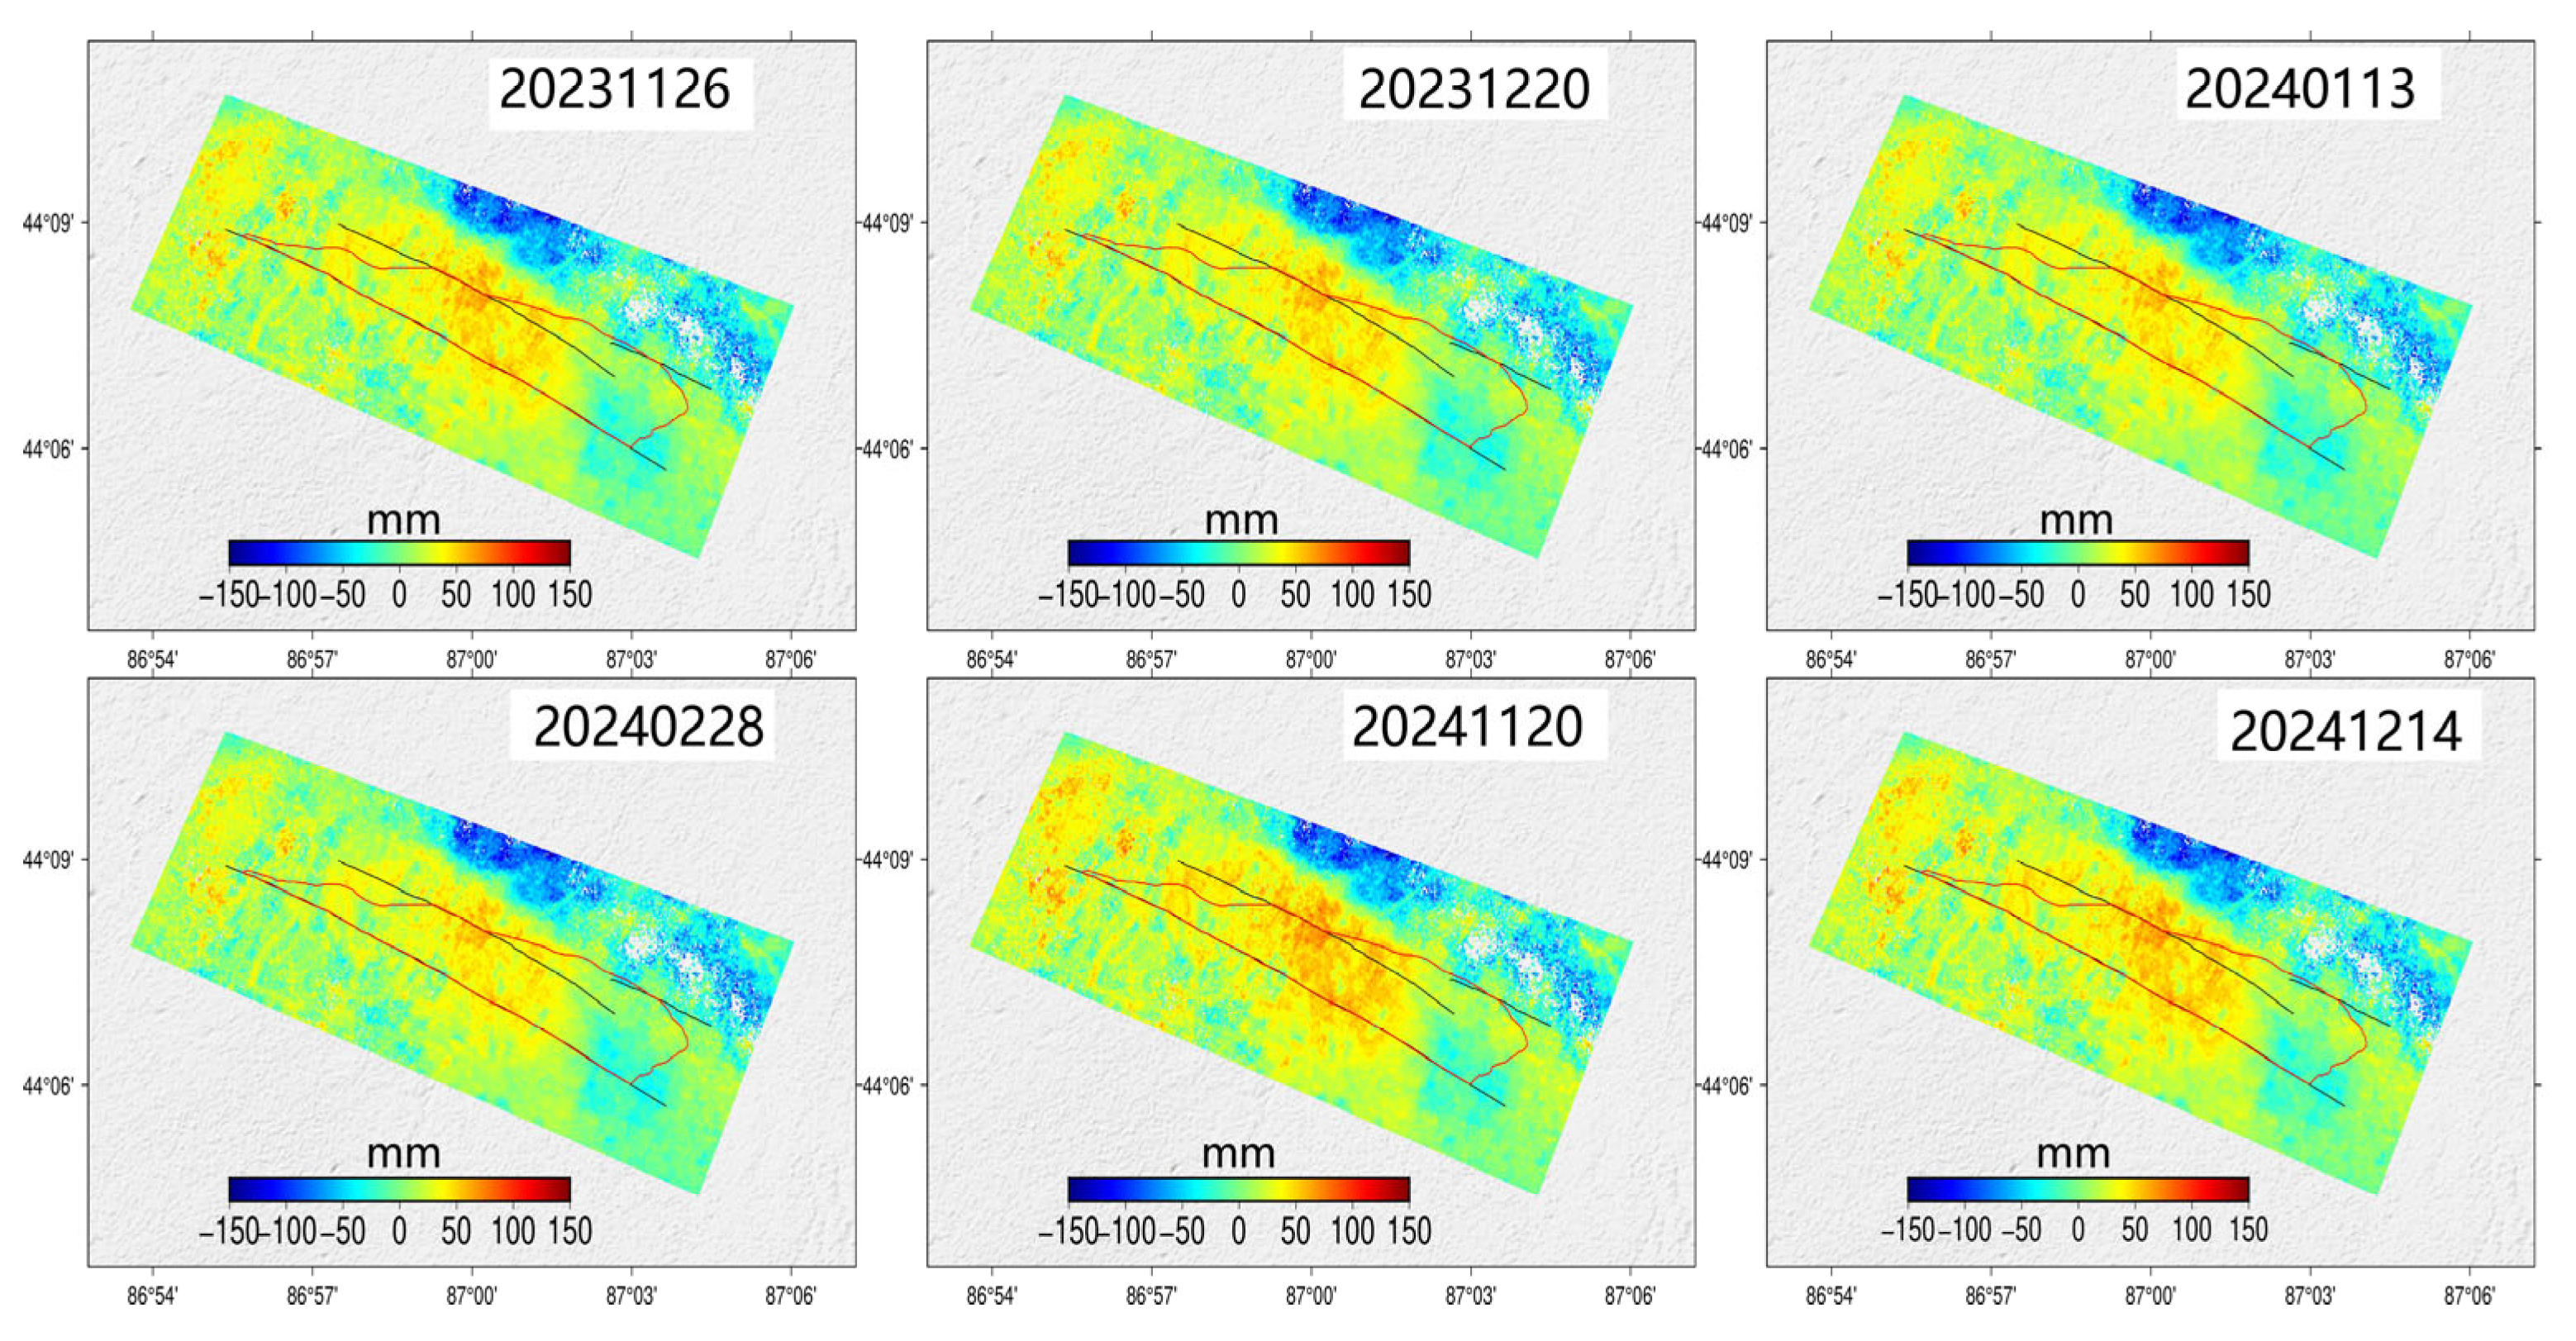
4.1. Deformation Rate

This study utilizes the SBAS-InSAR technique to extract surface deformation rates of the Hutubi UGS field from TerraSAR-X (August 2013 to March 2015) and Sentinel-1 (January 2015 to December 2024) SAR imagery (Figure 5). The results reveal significant ground uplift at the center of the Hutubi UGS. From August 2013 to March 2015, the uplift rate in the western region of the storage field was approximately 6 mm/year, while from January 2015 to December 2024, the rate increased to around 12 mm/year. The observed ground uplift is attributed to the transition of the Hutubi UGS reservoir from oil and gas extraction to gas storage in June 2013. During the early stages of gas storage development, the volume of injected natural gas exceeded the volume of extracted gas, leading to an increase in reservoir pressure. This, in turn, caused the stress within the strata to propagate toward the surface, resulting in ground uplift. As shown in the figure, the deformation center detected by Sentinel-1 is consistent with that observed by TerraSAR-X, but the deformation area observed by Sentinel-1 has expanded to the northwest, indicating an increase in the extent of deformation. Significant ground subsidence is observed in the southeast region of the entire storage field, with a subsidence rate of approximately −6 mm/year. A noticeable deformation difference exists between the eastern and western parts of the field, which is primarily related to the construction and development phases of the gas storage facility. As the injection and extraction processes continue and the volume of stored gas increases, the porosity of the reservoir medium will continue to develop and eventually stabilize.

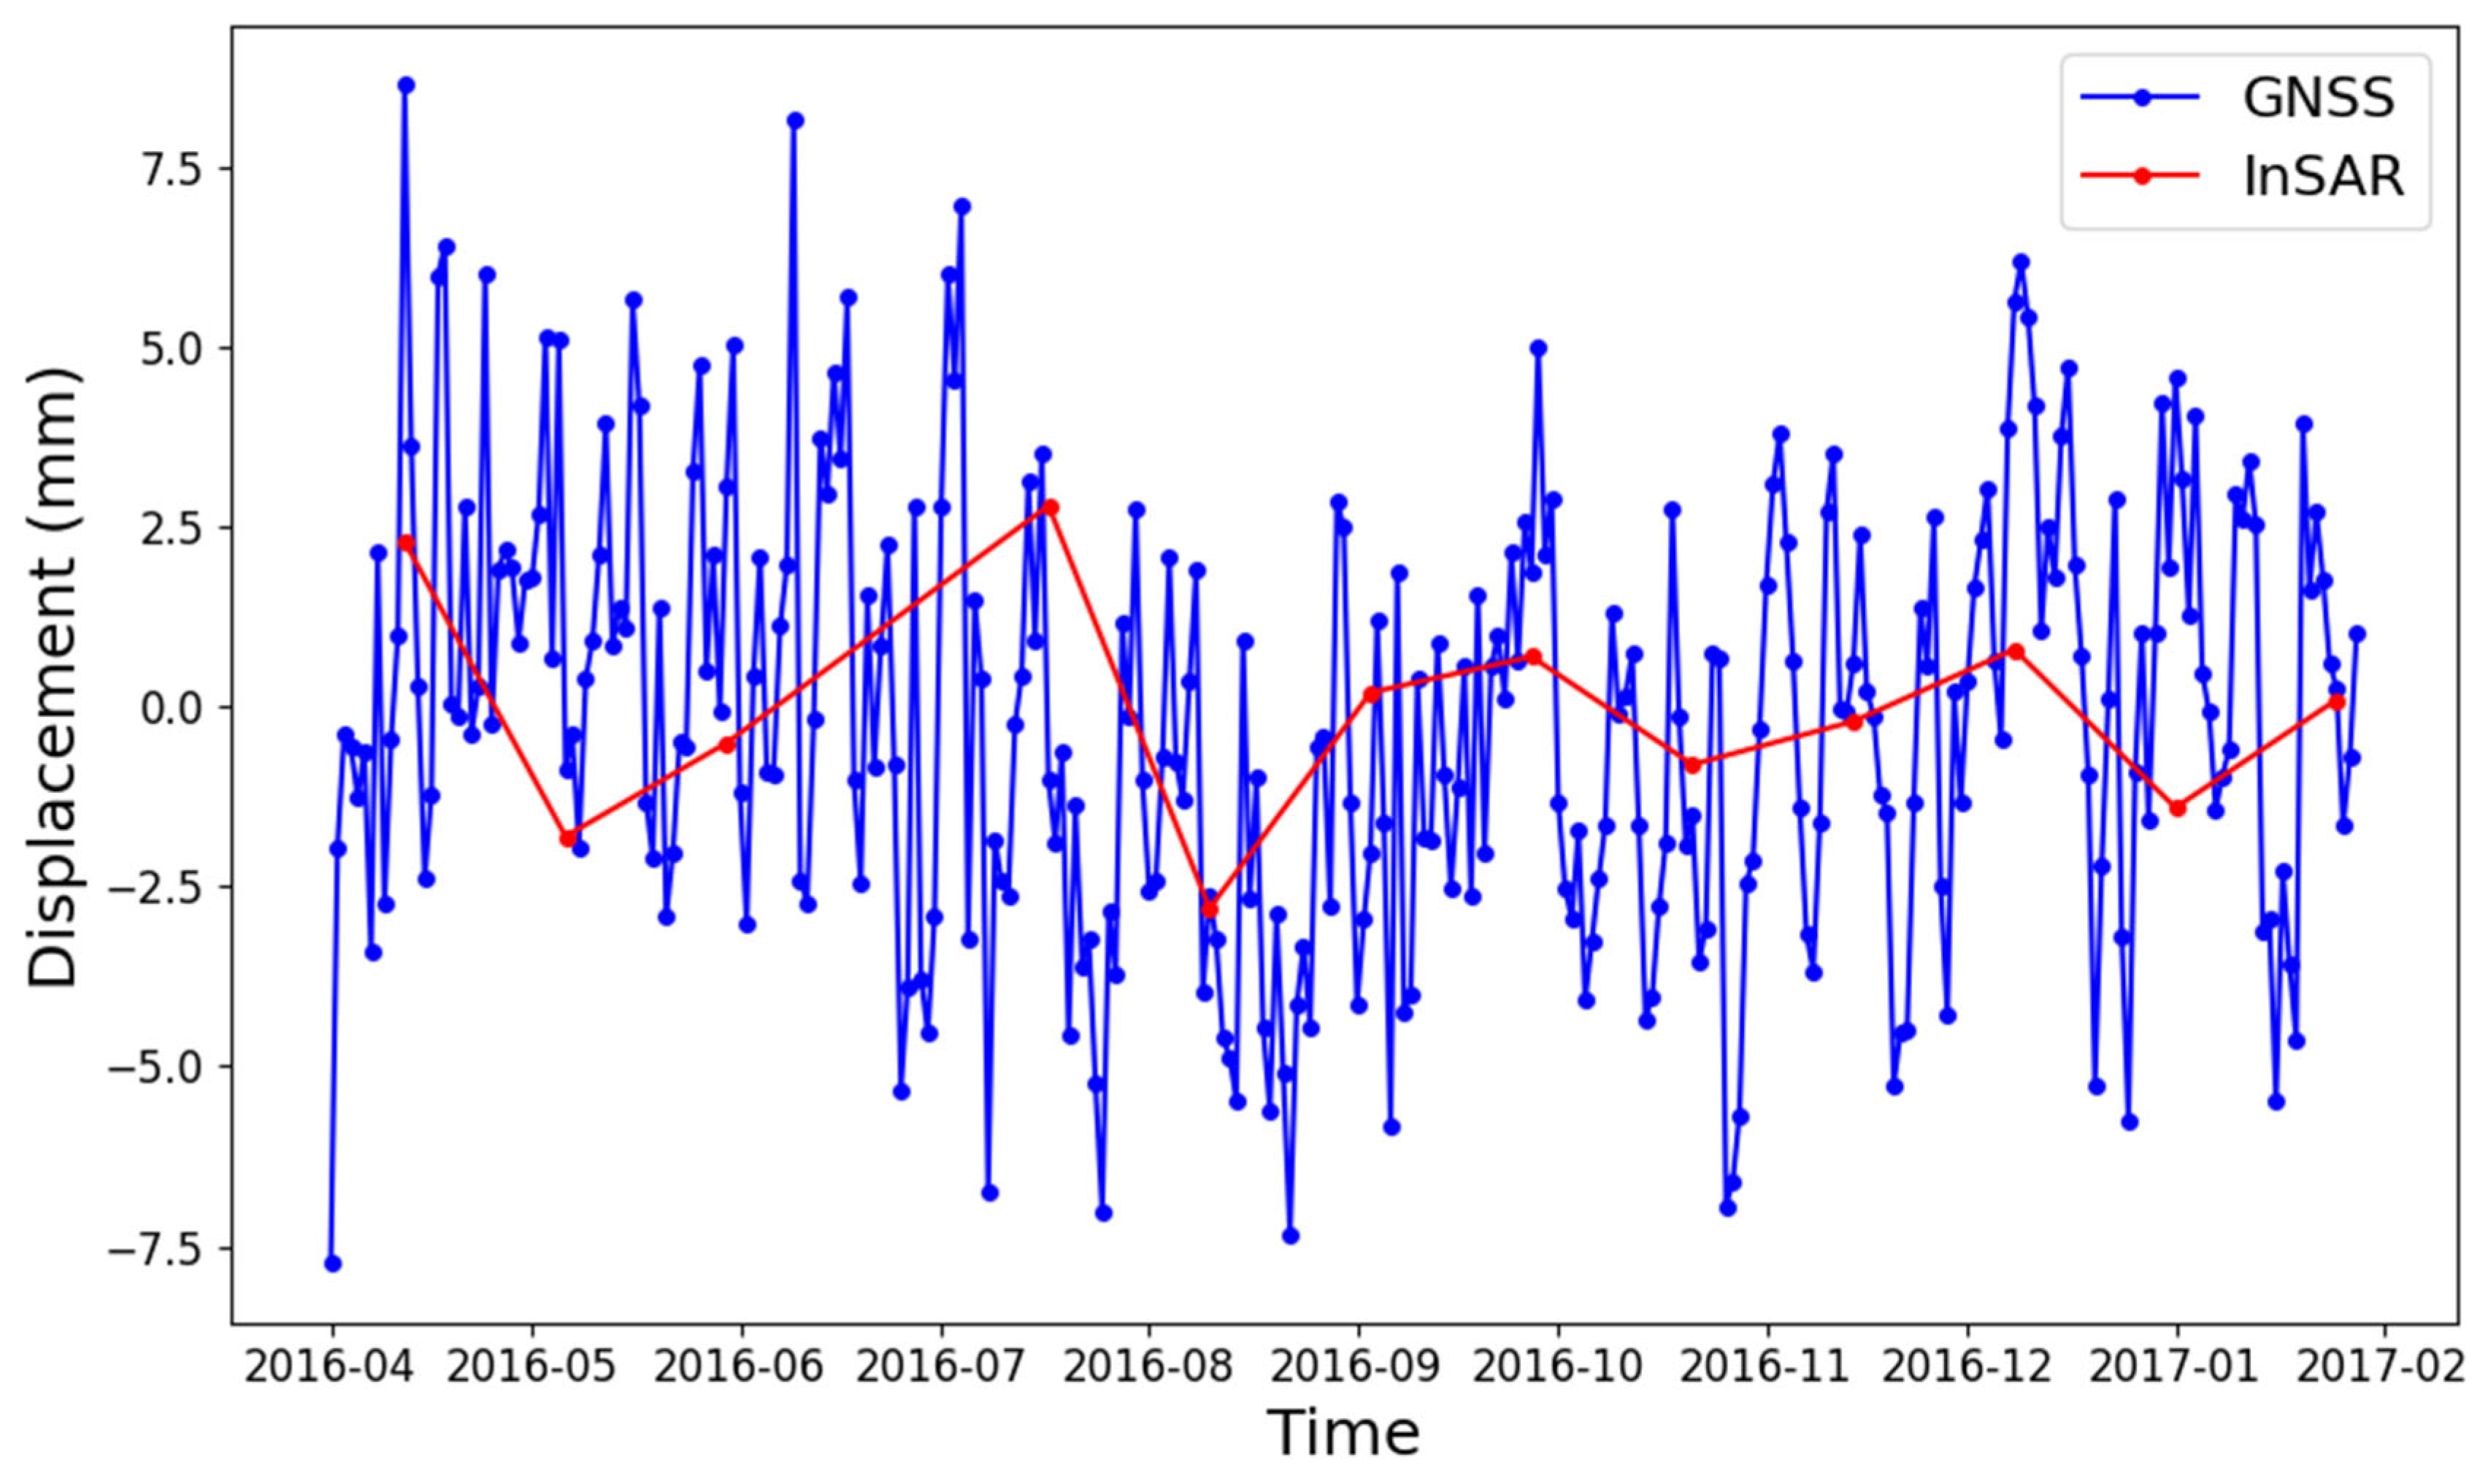
4.2. Accuracy Verification

To validate the reliability of the SBAS-InSAR results, we compared the three-dimensional time series deformation data from the GNSS continuous station (HTC 2) inside the Hutubi UGS with the line-of-sight (LOS) displacement from the InSAR results and the Sentinel-1 dataset (Orbit T41, LOS). Figure 6 shows the displacement variations observed from April 2016 to January 2017 by both GNSS and InSAR. The GNSS data, represented by a high temporal resolution blue line, is contrasted with the InSAR data, shown as a red line with lower sampling frequency. The two datasets exhibit good overall agreement in terms of the general trend of displacement, particularly in the seasonal variation patterns. InSAR data are smoother, reflecting the technique’s ability to effectively capture slow surface deformation processes despite the lower temporal sampling frequency. On the other hand, GNSS provides higher-frequency dynamic changes. The displacement amplitude of GNSS data is notably larger than that of InSAR, which may be attributed to the higher sensitivity of GNSS in detecting vertical and high-frequency variations. In contrast, InSAR is influenced by factors such as radar sensor observation geometry, spatiotemporal coherence, and atmospheric delay, which can lead to slightly lower displacement magnitudes during certain periods compared to GNSS results. Overall, the discrepancies between InSAR and GNSS data are mainly observed in short-term local disturbances. The overall error level remains within an acceptable range, confirming the reliability of the results presented in this study.

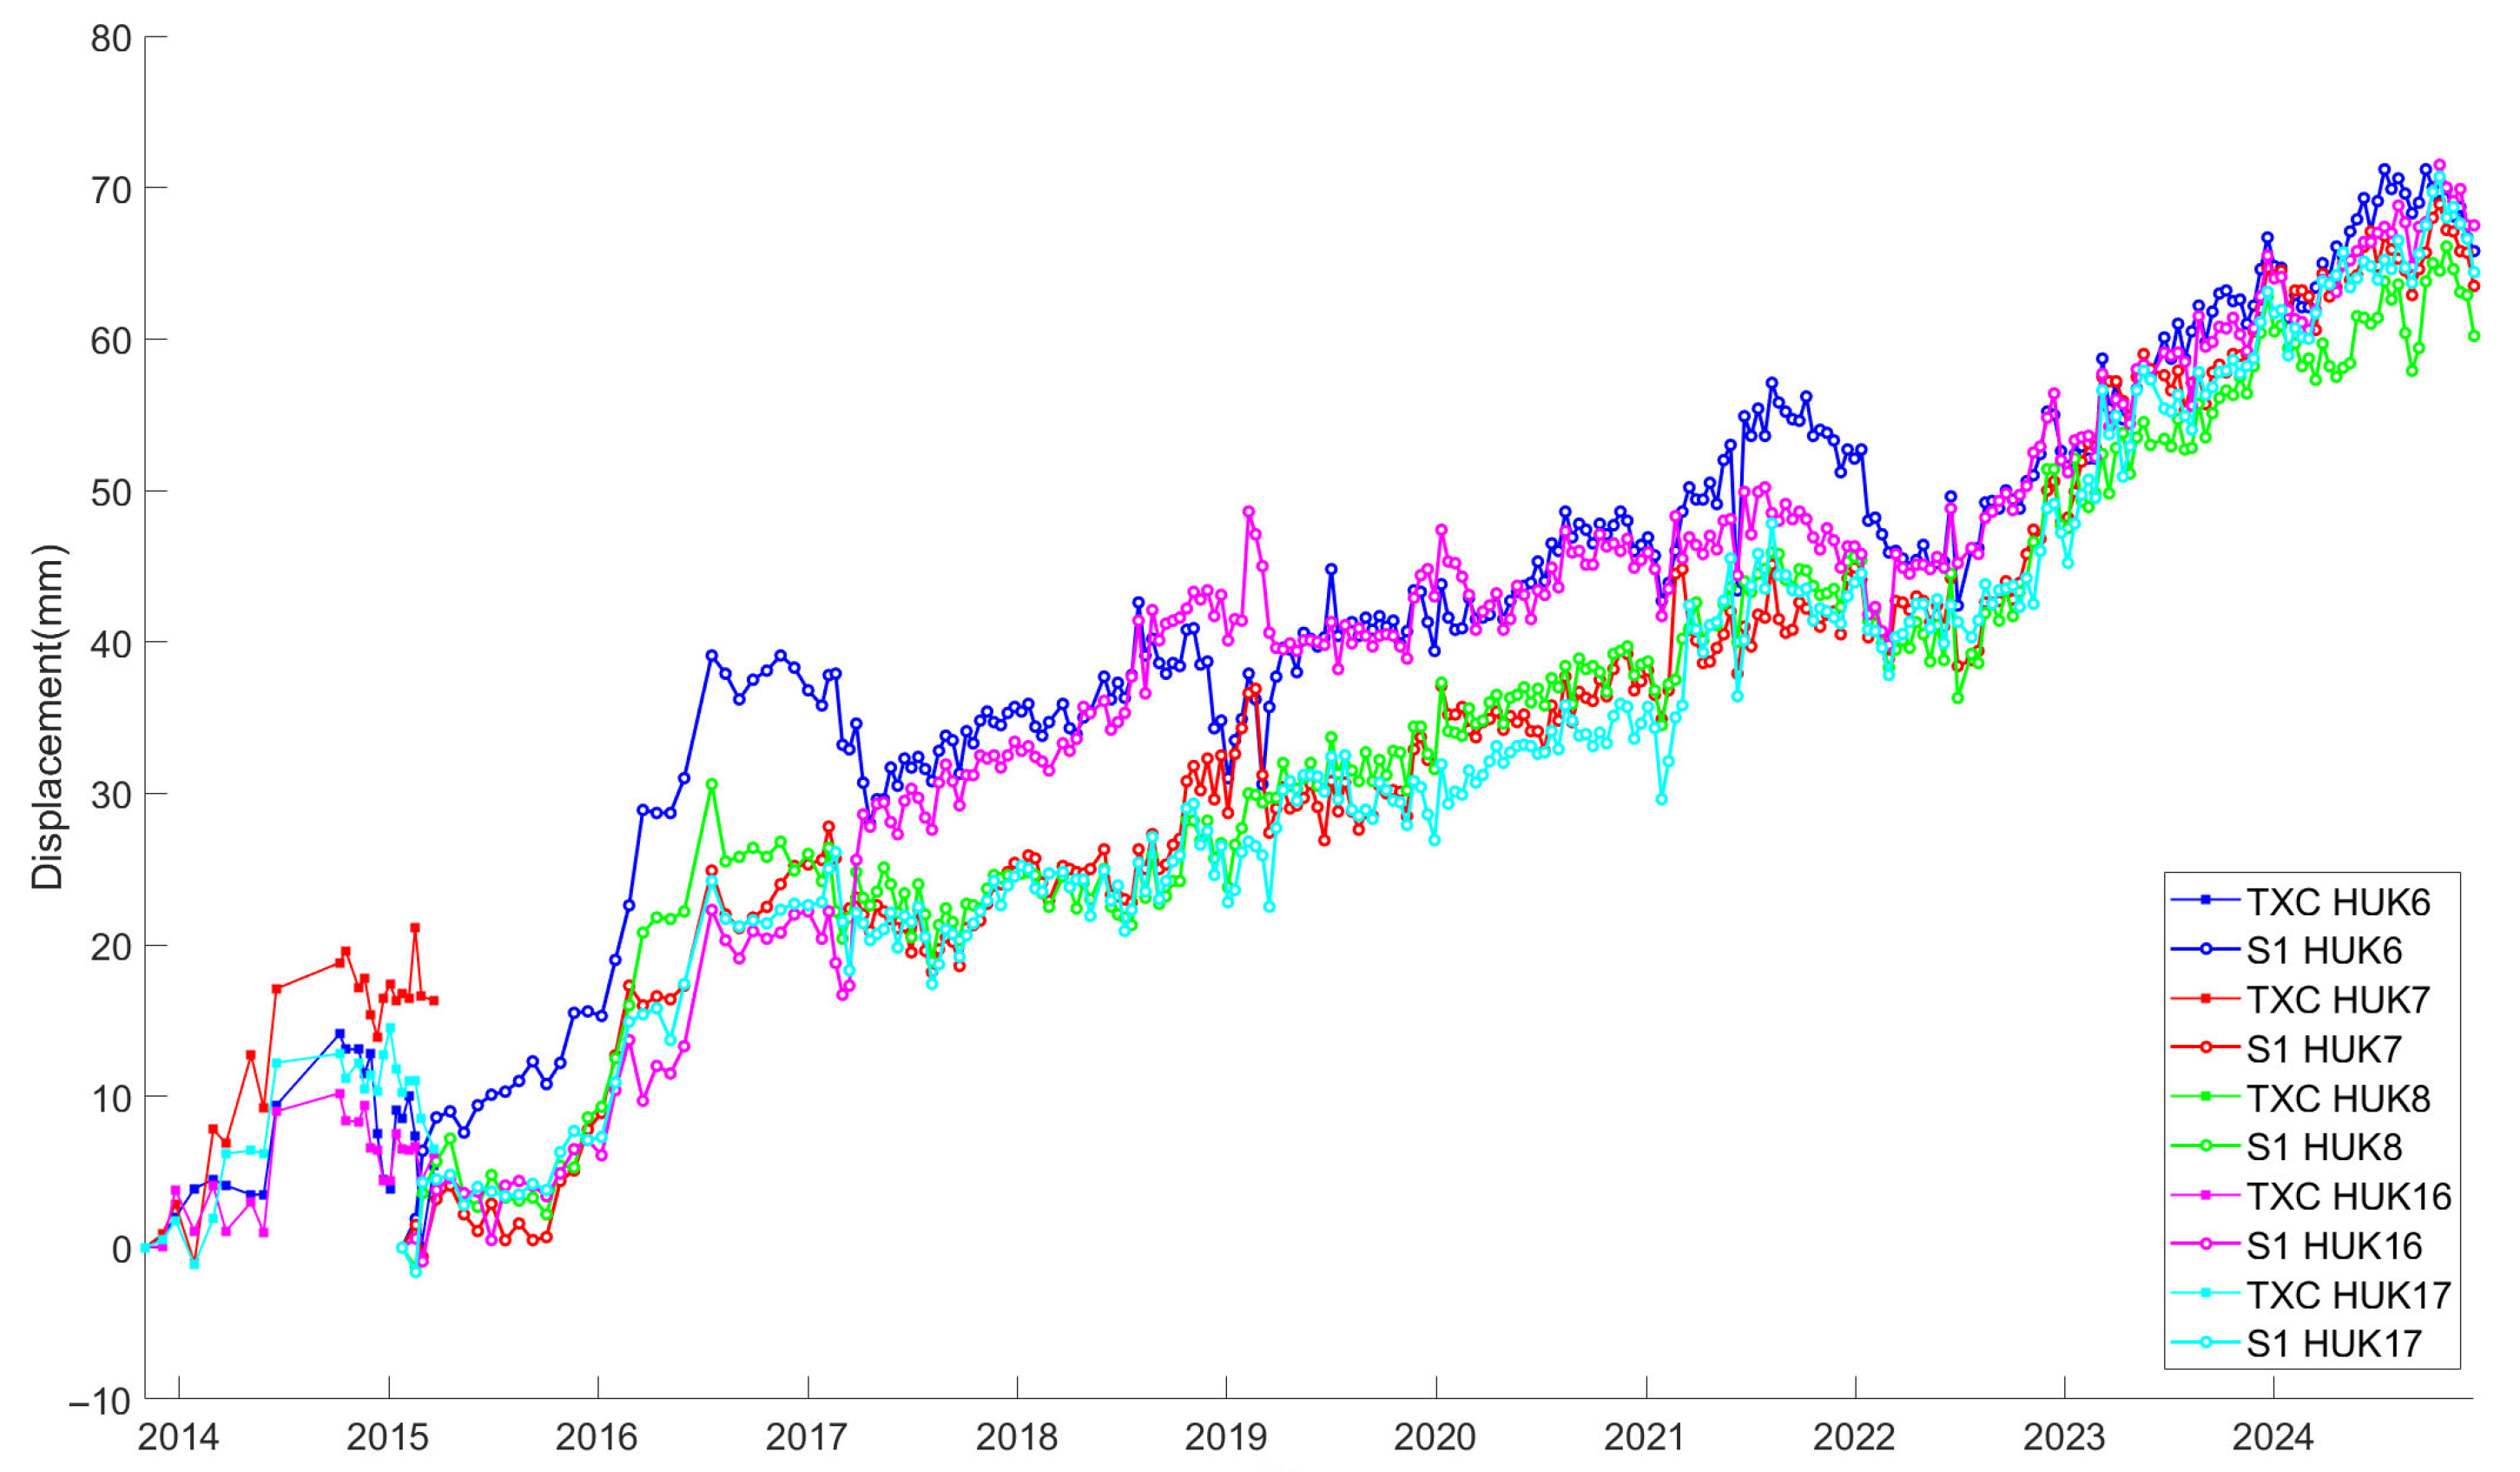
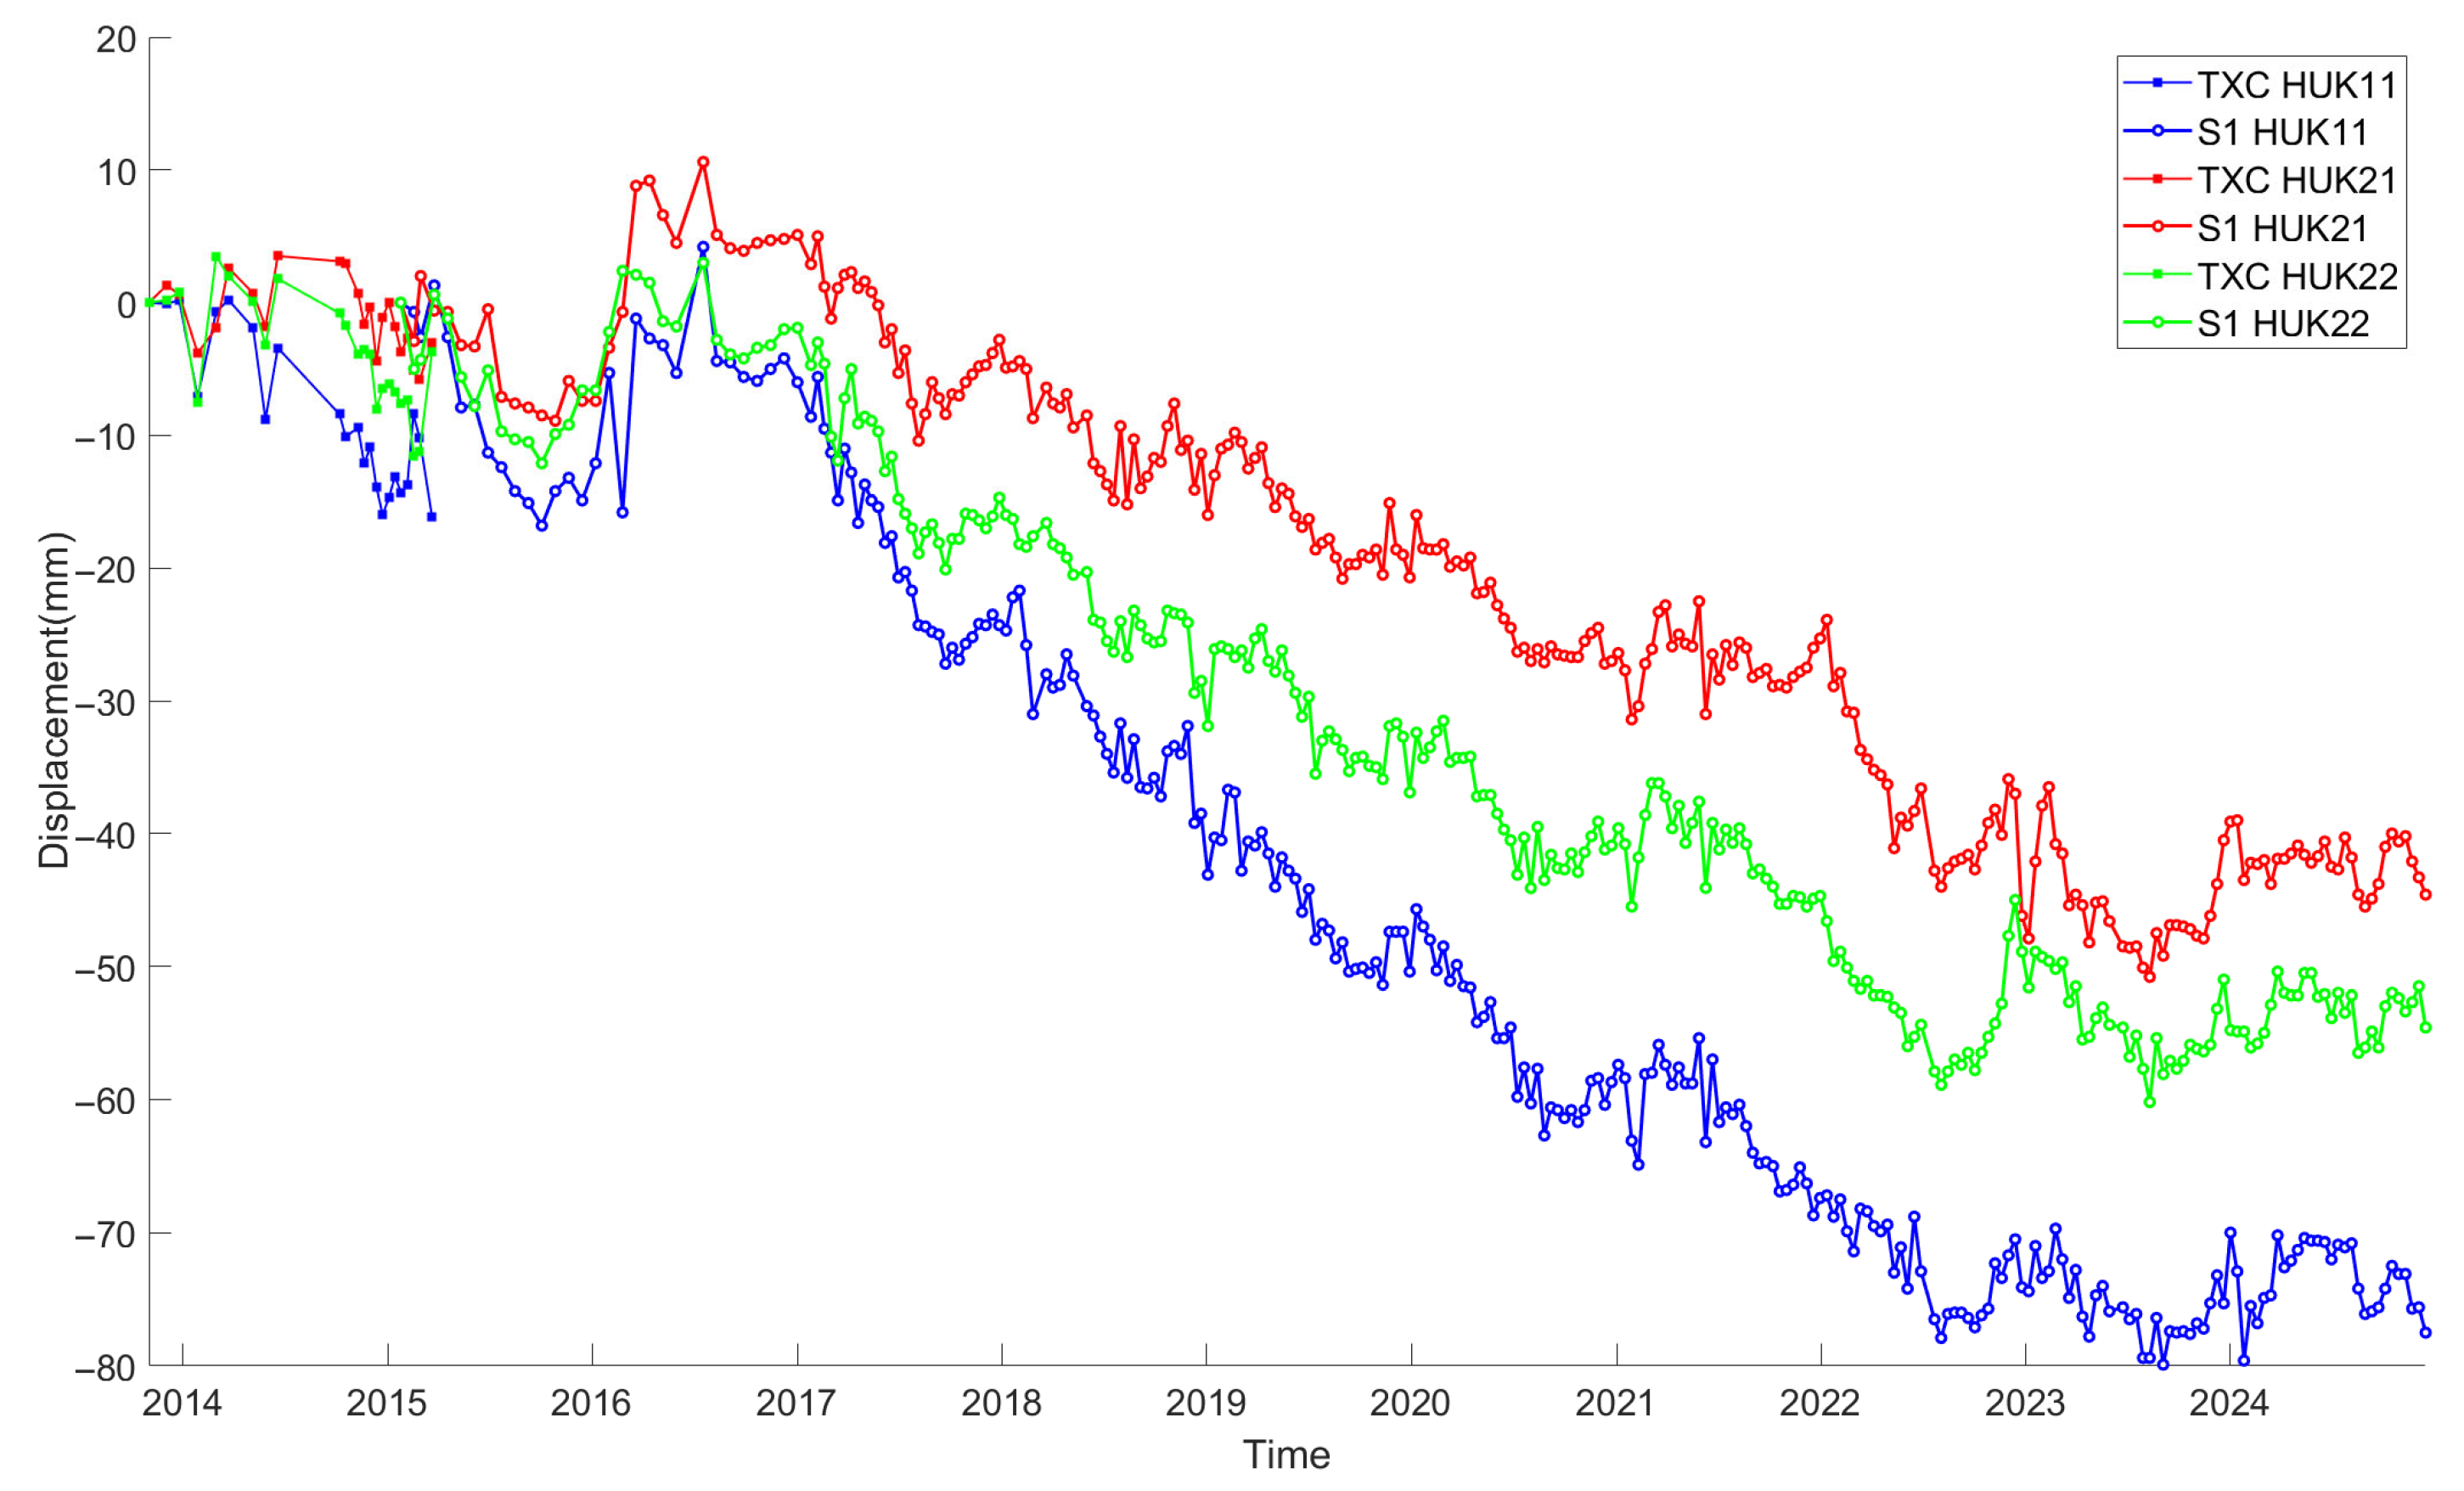
4.3. Time Series Analysis

To provide a more intuitive representation of the deformation patterns at the Hutubi UGS, this study presents the surface deformation time-series for the most recent two years (2023–2024), corresponding to the gas injection phases of the 11th and 12th cycles, as well as the gas extraction phase of the 11th cycle. The monitoring image sequences for the gas injection phases of the 11th and 12th cycles are from March 2023 to October 2023 and March 2024 to October 2024, respectively. As shown in Figure 7 and Figure 8, the surface uplift during the injection phases exhibits spatial variation. Specifically, the central region of the storage field and areas surrounding it experience increasing surface uplift, which reaches a peak in September 2023 and September 2024, before gradually decreasing. In contrast, the southeast region of the storage field shows negligible surface uplift throughout the entire gas injection cycle. The image sequence corresponding to the gas extraction phase of the 11th cycle is from November 2023 to February 2024. During this period, the surface of the gas storage field generally undergoes slow subsidence, with the maximum subsidence occurring in February 2024, followed by a gradual reduction in subsidence. Unlike the uplift caused by the gas injection process, the subsidence during the extraction phase primarily occurs in the northern and southeastern regions of the storage field, while the central and northwestern areas do not show significant subsidence. To further analyze the gas storage behavior, a monitoring point, HUK5, located in the central region of the storage field, was selected. The gas injection and extraction pressure data were superimposed onto the InSAR displacement time series (Figure 9). A strong temporal correlation was observed between the well pressure changes and surface deformation. During the injection phase (March to October each year), the well pressure increases, leading to higher formation pressure and accelerating ground uplift. For every 1 MPa increase in well pressure, surface deformation increases by approximately 0.35 mm. In contrast, during the extraction phase (November to February each year), the well pressure decreases, causing a reduction in formation pressure and slow ground subsidence. For every 1 MPa decrease in well pressure, surface deformation decreases by approximately 0.28 mm. However, since the volume of gas injected in each cycle exceeds the volume of gas extracted, some surface uplift is also observed during the extraction phase. Overall, the surface subsidence during the extraction phase is significantly smaller than the surface uplift observed during the injection phase.
The results derived from different satellite platforms, such as TerraSAR-X and Sentinel-1, exhibit good spatial consistency in terms of surface deformation distribution. Given that the spatial distribution of deformation tends to align along the longitudinal axis of the underground gas storage facility, the injection and extraction wells within the reservoir are categorized into three zones for analysis, namely northwestern (A), central (B), and southeastern (C) regions, as illustrated in Figure 10. To assess the vertical displacement inside the gas storage reservoir more accurately, the LOS (line-of-sight) direction displacement data obtained from InSAR technology are used. Since InSAR data are typically measured along the LOS direction, and there is an angle difference between the LOS and vertical directions, it is necessary to convert the displacement in the LOS direction to the vertical direction. To achieve this, the following formula is applied:
Δ Z = Δ L O S / c o s ( θ )
where Δ Z is the vertical displacement, Δ L O S is the displacement measured along the LOS direction from InSAR, and θ is the angle between the radar and the ground normal. By using this formula, we can obtain the true vertical deformation in the gas storage reservoir regions.
Five gas wells (HUK12, HUK13, HUK14, HUK4, and HUK5) in Region A were selected for analysis, with their time-series deformation data presented in Figure 11. The TerraSAR-X data from 2013 to 2015 indicate that during this period, which corresponds to the initial operation phase of the gas storage facility, the displacement changes were relatively small. This limited deformation may be attributed to a more conservative gas injection strategy or lower operational intensity. The operations during this period were stable, resulting in minimal surface deformation. However, after 2015, the Sentinel-1 data show more significant deformation, indicating that the region likely experienced more frequent and intense gas injection and extraction cycles, leading to faster ground displacement. The cumulative deformation at the five gas wells in the region shows an upward trend. Specifically, the cumulative deformation at HUK12 reached 96 mm, at HUK13 it was 69 mm, at HUK14 it was 120 mm, at HUK4 it was 56 mm, and at HUK5 it was 67 mm. The cumulative deformation varies notably across these wells, with HUK12 and HUK14 exhibiting higher uplift compared to the other three wells from 2019 onward. Analyzing the gas pressure data for each well, it is observed that from March 2019 to December 2024, the gas pressure at HUK12 and HUK14 remained consistently between 26 MPa and 35 MPa, while at HUK4, HUK5, and HUK13, the pressure fluctuated between 23 MPa and 35 MPa. The higher and more consistent gas pressure at HUK12 and HUK14, combined with frequent injection and extraction cycles, is one of the key factors contributing to the greater cumulative deformation observed at these two wells compared to the others. Future operations at the gas storage facility should carefully manage the gas injection and extraction schedules for these two wells to optimize performance and minimize deformation.
Five gas wells in Region B were selected for analysis, as shown in Figure 12. The cumulative maximum deformation at the five gas wells (HUK6, HUK7, HUK8, HUK16, and HUK17) located in the central area of the gas storage field exceeds 65 mm. Compared to the wells in Region A, the deformation in this area shows a more concentrated upward trend with relatively uniform displacement values. The gas well distribution in Region B is notably denser than in Regions A and C, and the gas injection and extraction operations during the same cycle result in more significant underground pressure variations within this region. Due to the higher density of gas wells, pressure fluctuations have a more pronounced effect, creating a cumulative effect across the region. This superimposed effect may lead to more significant surface deformation compared to other regions. As a result, the cumulative deformation values in the central region are generally higher, closely correlating with the higher well density in this area. The deformation differences among the gas wells are also notable, particularly with HUK6 and HUK16, which show significantly higher displacement between 2017 and 2022 compared to the other wells. This variation may be linked to the specific geological conditions of these wells. For example, wells located in areas with higher pressure or stronger groundwater flow tend to exhibit more pronounced displacement changes.
In Region C, three gas wells were selected for analysis. As shown in Figure 13, this region has exhibited a continuous subsidence trend since the start of the gas storage facility’s operation, indicating ongoing ground settlement. The calculated subsidence rates for HUK11, HUK21, and HUK22 are −8.54 mm/year, −5.72 mm/year, and −6.35 mm/year, respectively. The corresponding standard deviations are 23.90 mm, 16.12 mm, and 17.70 mm. Notably, the subsidence rate and standard deviation for HUK11 are both higher than for HUK21 and HUK22, suggesting that this well experiences greater fluctuations and is more sensitive to gas pressure changes and external factors. Examining the gas pressure data from 2016 to 2024 for these three wells, it was found that the total gas pressure change for HUK11 was 59.462 MPa, for HUK22 it was 72.347 MPa, and for HUK21 it was 80.934 MPa. In the subsiding region, wells with lower cumulative gas injection show smaller ground uplift, leading to more significant subsidence. Thus, the degree of subsidence at each well is inversely related to the total gas injection volume, with wells experiencing less gas injection, demonstrating greater ground subsidence.
However, the observed surface deformation distribution cannot be fully explained by gas injection and extraction activities alone, as numerous factors influence surface deformation, including both natural and anthropogenic factors (such as groundwater, snowmelt, and large-scale construction projects). The Hutubi UGS is located in the interior of the Eurasian continent, a region characterized by a typical temperate continental arid and semi-arid climate with cold winters, hot summers, and significant annual temperature variations. The annual precipitation is less than 200 mm, while the annual evaporation exceeds 2000 mm, with rainfall being unevenly distributed throughout the year. Approximately 80% of the annual rainfall occurs during the summer months. The total annual sunshine duration is 3090 h, with an average daily sunshine duration of 10 h from May to August, reaching over 11 h in July and August [37]. Given the extreme imbalance between annual precipitation and evaporation, agricultural production around the gas storage facility mainly relies on groundwater extraction. As shown in Figure 9, there are several irrigation wells in the northwest (Region A), southeast (Region C), and north of the storage field. The surface deformation in these regions during the summer months is caused by a combination of gas injection and groundwater extraction activities. This also explains the significant differences in cumulative deformation values across the gas wells in Regions A and C. For example, the wells in the uplift area, such as HUK4, and those in the subsidence area, such as HUK11, are located closest to the agricultural irrigation wells. As a result, surface deformation at these wells is most strongly influenced by groundwater extraction, in comparison to other wells in the same region. On the other hand, agricultural irrigation wells in Region B are primarily concentrated along the northern edge, and the gas wells in the central part of Region B experience less impact from groundwater withdrawal, leading to more stable deformation values. This analysis suggests that both gas injection/extraction and groundwater withdrawal jointly contribute to the surface deformation of the gas storage field, resulting in differences in spatiotemporal distribution patterns.

4.4. GWO-VMD-GRU Model Prediction Results

This study selected three gas wells—HUK14 in Region A, HUK17 in Region B, and HUK11 in Region C—as prediction points. Gas pressure data and time-series cumulative deformation data were used as input variables. Due to irregular surface deformation during the early stages of gas injection and extraction (2013–2016) and the more pronounced deformation observed after the injection pressures stabilized in 2017, the data from 2018 to 2022 were selected as the training set, with the data from 2023 to 2024 used as the test set. The ratio of the training set to the test set was 8:2. The sym5 wavelet function with two decomposition levels was chosen for processing the data. This approach retained the primary deformation characteristics while significantly reducing the impact of high-frequency noise on model training, achieving the best denoising effect, as shown in Figure 14.
Following wavelet-based denoising, the processed deformation data were further decomposed using the Gray Wolf Optimizer–Variational Mode Decomposition (GWO-VMD) algorithm. After extensive testing, the initial population size for the GWO was set to 20, with a maximum of 150 iterations. To effectively extract multiscale features from the time-series data, VMD was applied to decompose the denoised sequences into trend and periodic components. The performance of VMD is highly dependent on two key parameters: the number of decomposition modes K and the penalty factor α. To avoid the subjectivity associated with manually tuning these parameters, the GWO algorithm was employed to iteratively optimize them based on the input data. Through this process, the GWO algorithm identified the alpha wolf and beta wolf, guiding the search toward the optimal values. The resulting optimal parameter combination was determined to be K = 2 and α = 0.1, which enabled effective separation of the original time series into periodic and trend displacement components. In this study, data from 8 January 2018 to 17 July 2023 were used as the training set, while data from 29 July 2023 to 14 December 2024 formed the prediction set. The decomposition results are illustrated in Figure 15.
To further enhance prediction accuracy, a grid search algorithm was employed to identify the optimal hyperparameter configuration within a predefined search space. The final parameters for the Gated Recurrent Unit (GRU) model were determined as follows: the number of hidden units was set to 128, the learning rate to 0.001, batch size to 1, and the number of training epochs to 100. A sliding time window approach was used for sample construction, with a prediction step size of 10. Separate GRU models were trained to predict both the trend and periodic components of the decomposed displacement series. In the case of periodic component prediction, gas pressure data were additionally incorporated to enable a more comprehensive analysis. To quantitatively evaluate the predictive performance of the proposed model, three widely used metrics were adopted: root mean square error (RMSE), mean absolute error (MAE), and the coefficient of determination (R2).

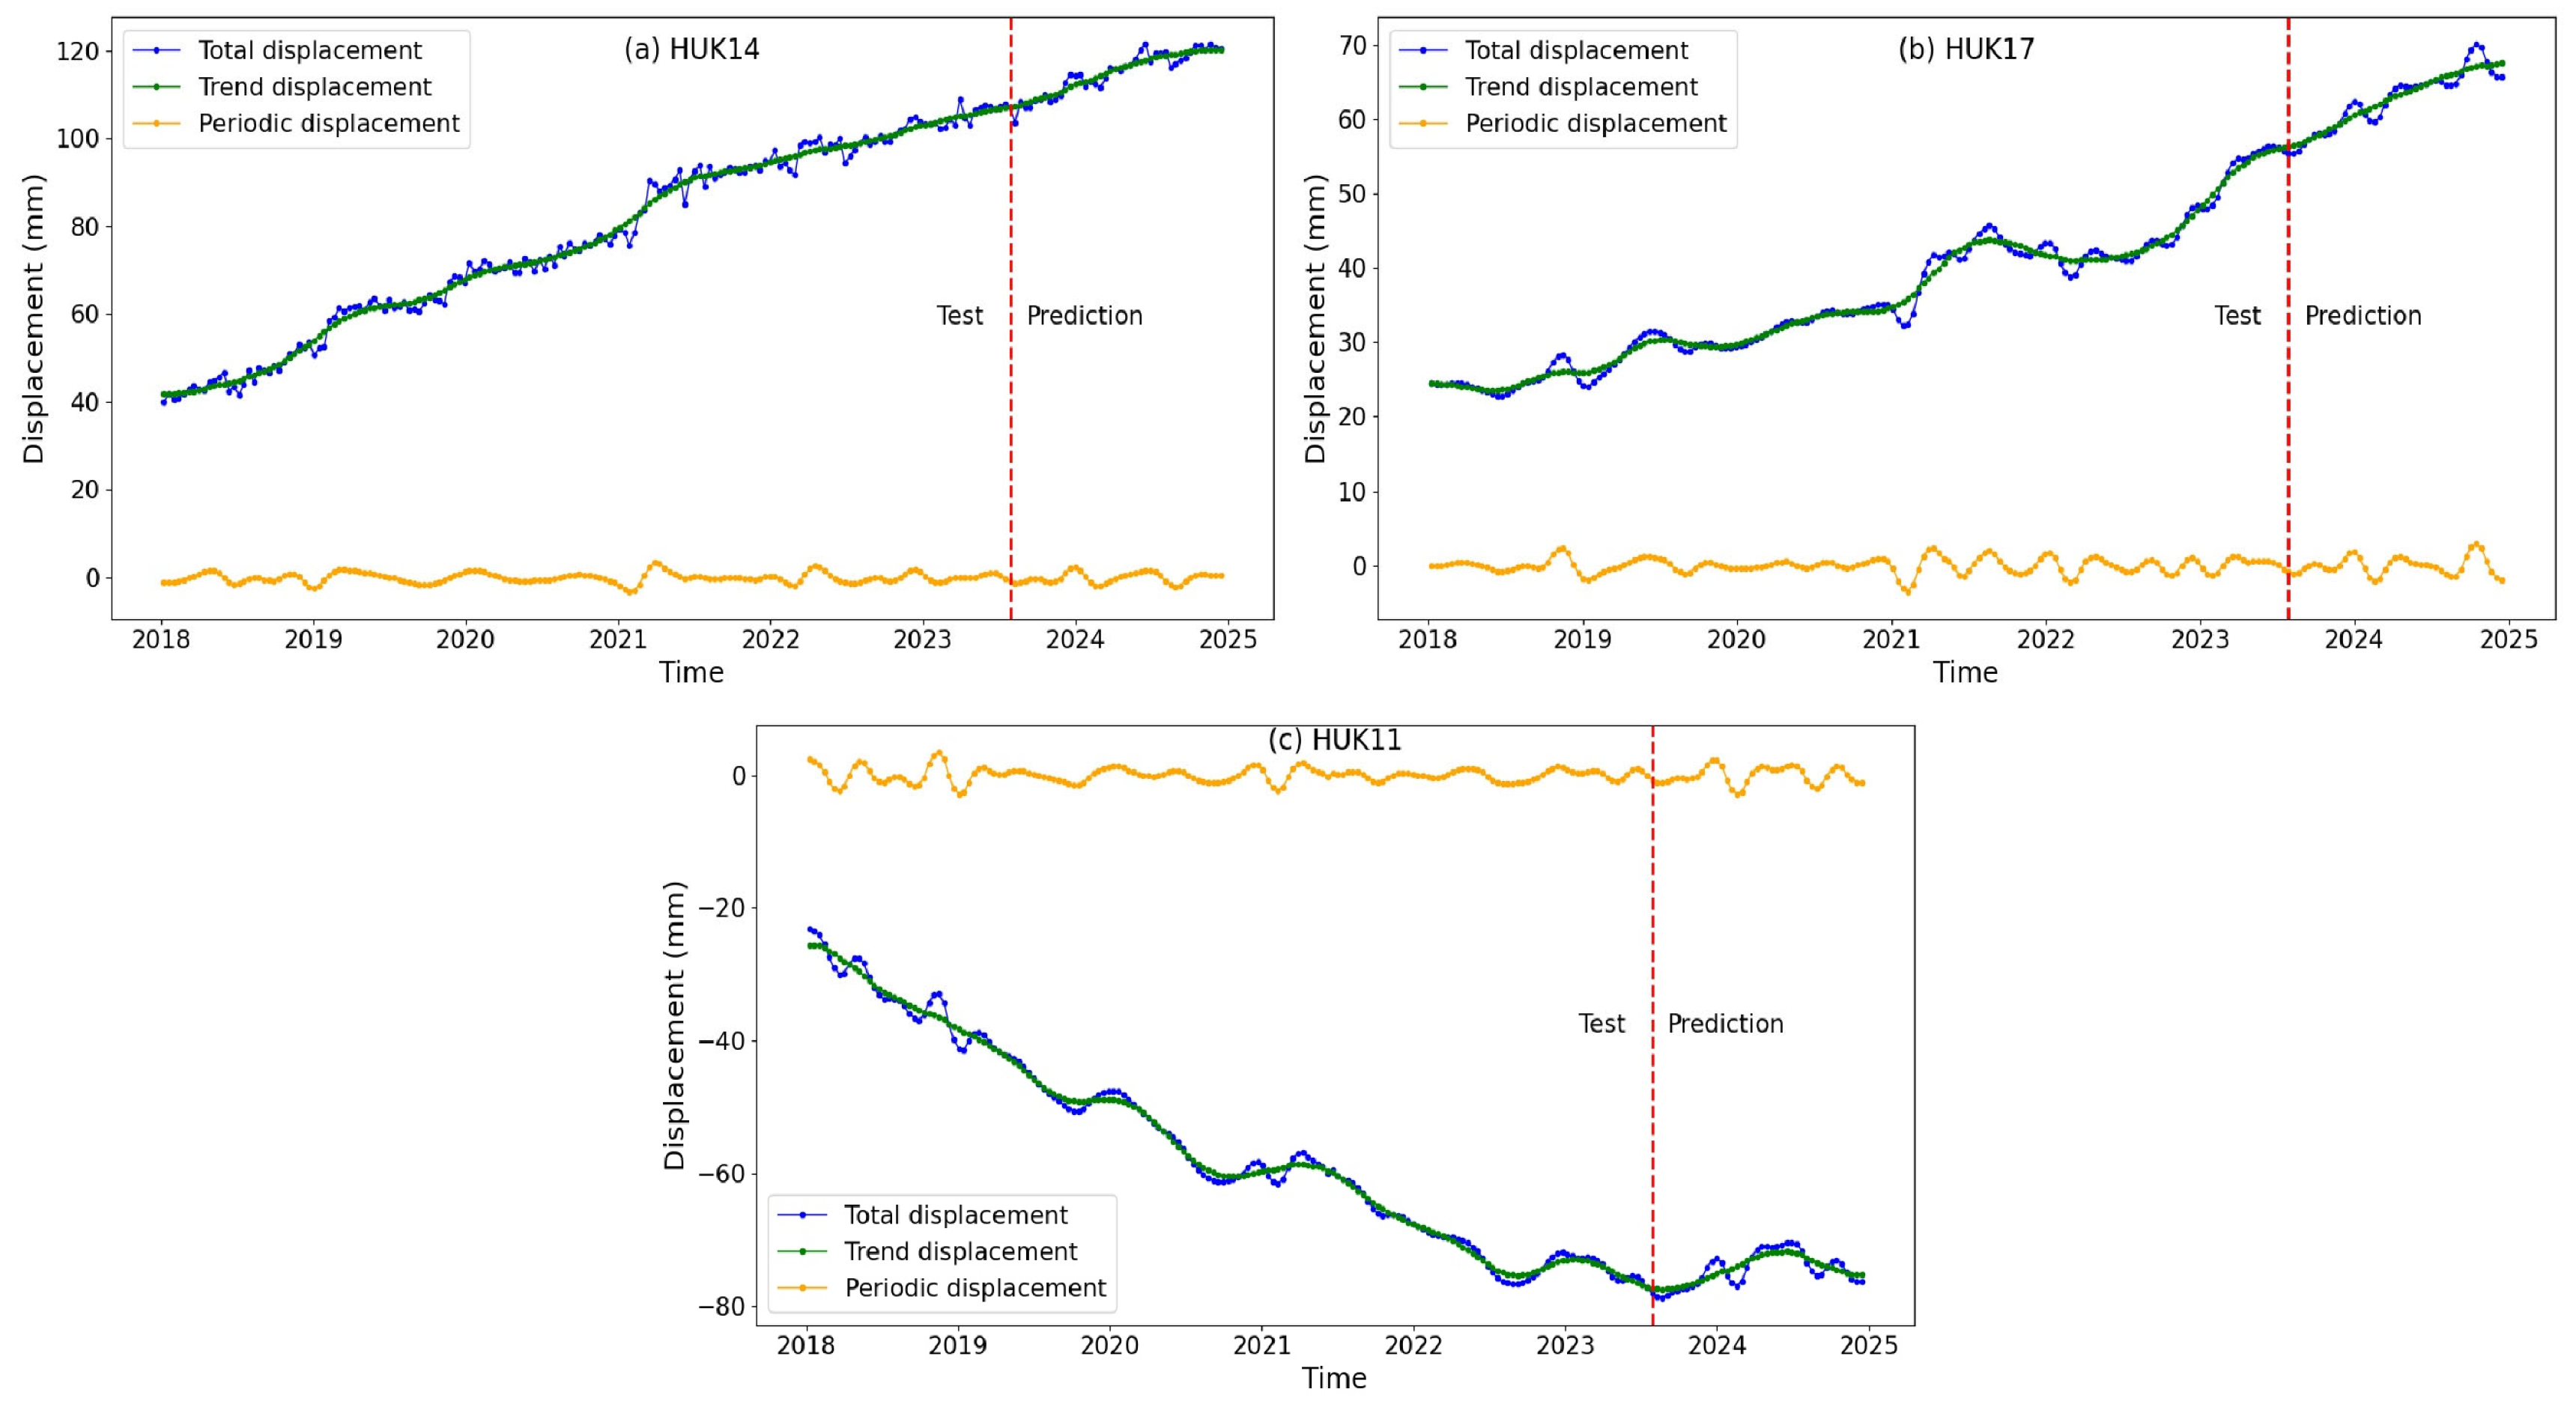
4.4.1. Trend Component Displacement Prediction

The surface deformation at the Hutubi UGS is primarily dominated by trend-based deformation. Therefore, accurately modeling and predicting the trend component is crucial for deformation monitoring. In this study, we applied data from 43 periods of the test set to the proposed model. The predicted results are shown in Figure 16. As summarized in Table 2, the R2, RMSE, and MAE values for the monitoring points at the HUK14, HUK17, and HUK11 wells are as follows: for HUK14, R2 = 0.9935, RMSE = 0.3512, and MAE = 0.297; for HUK17, R2 = 0.9975, RMSE = 0.1765, and MAE = 0.1503; and for HUK11, R2 = 0.9818, RMSE = 0.2521, and MAE = 0.2101. The results demonstrate that the model effectively captures the trend-based displacement variations, with the predicted results aligning closely with the actual measurements. This reflects the model’s excellent generalization capability and stability. Notably, at the HUK17 point, the model achieved a particularly high fit and low error, indicating exceptional performance in identifying and modeling displacement trends at locations with clear deformation patterns. Although the model’s performance at HUK11, where the deformation fluctuations are more pronounced, resulted in slightly higher errors, it still maintained a high level of prediction accuracy. This suggests that the GWO-VMD-GRU model possesses strong time-series feature extraction capabilities and can effectively capture the trend-based deformation signals induced by the injection–withdrawal switching process in underground gas storage.

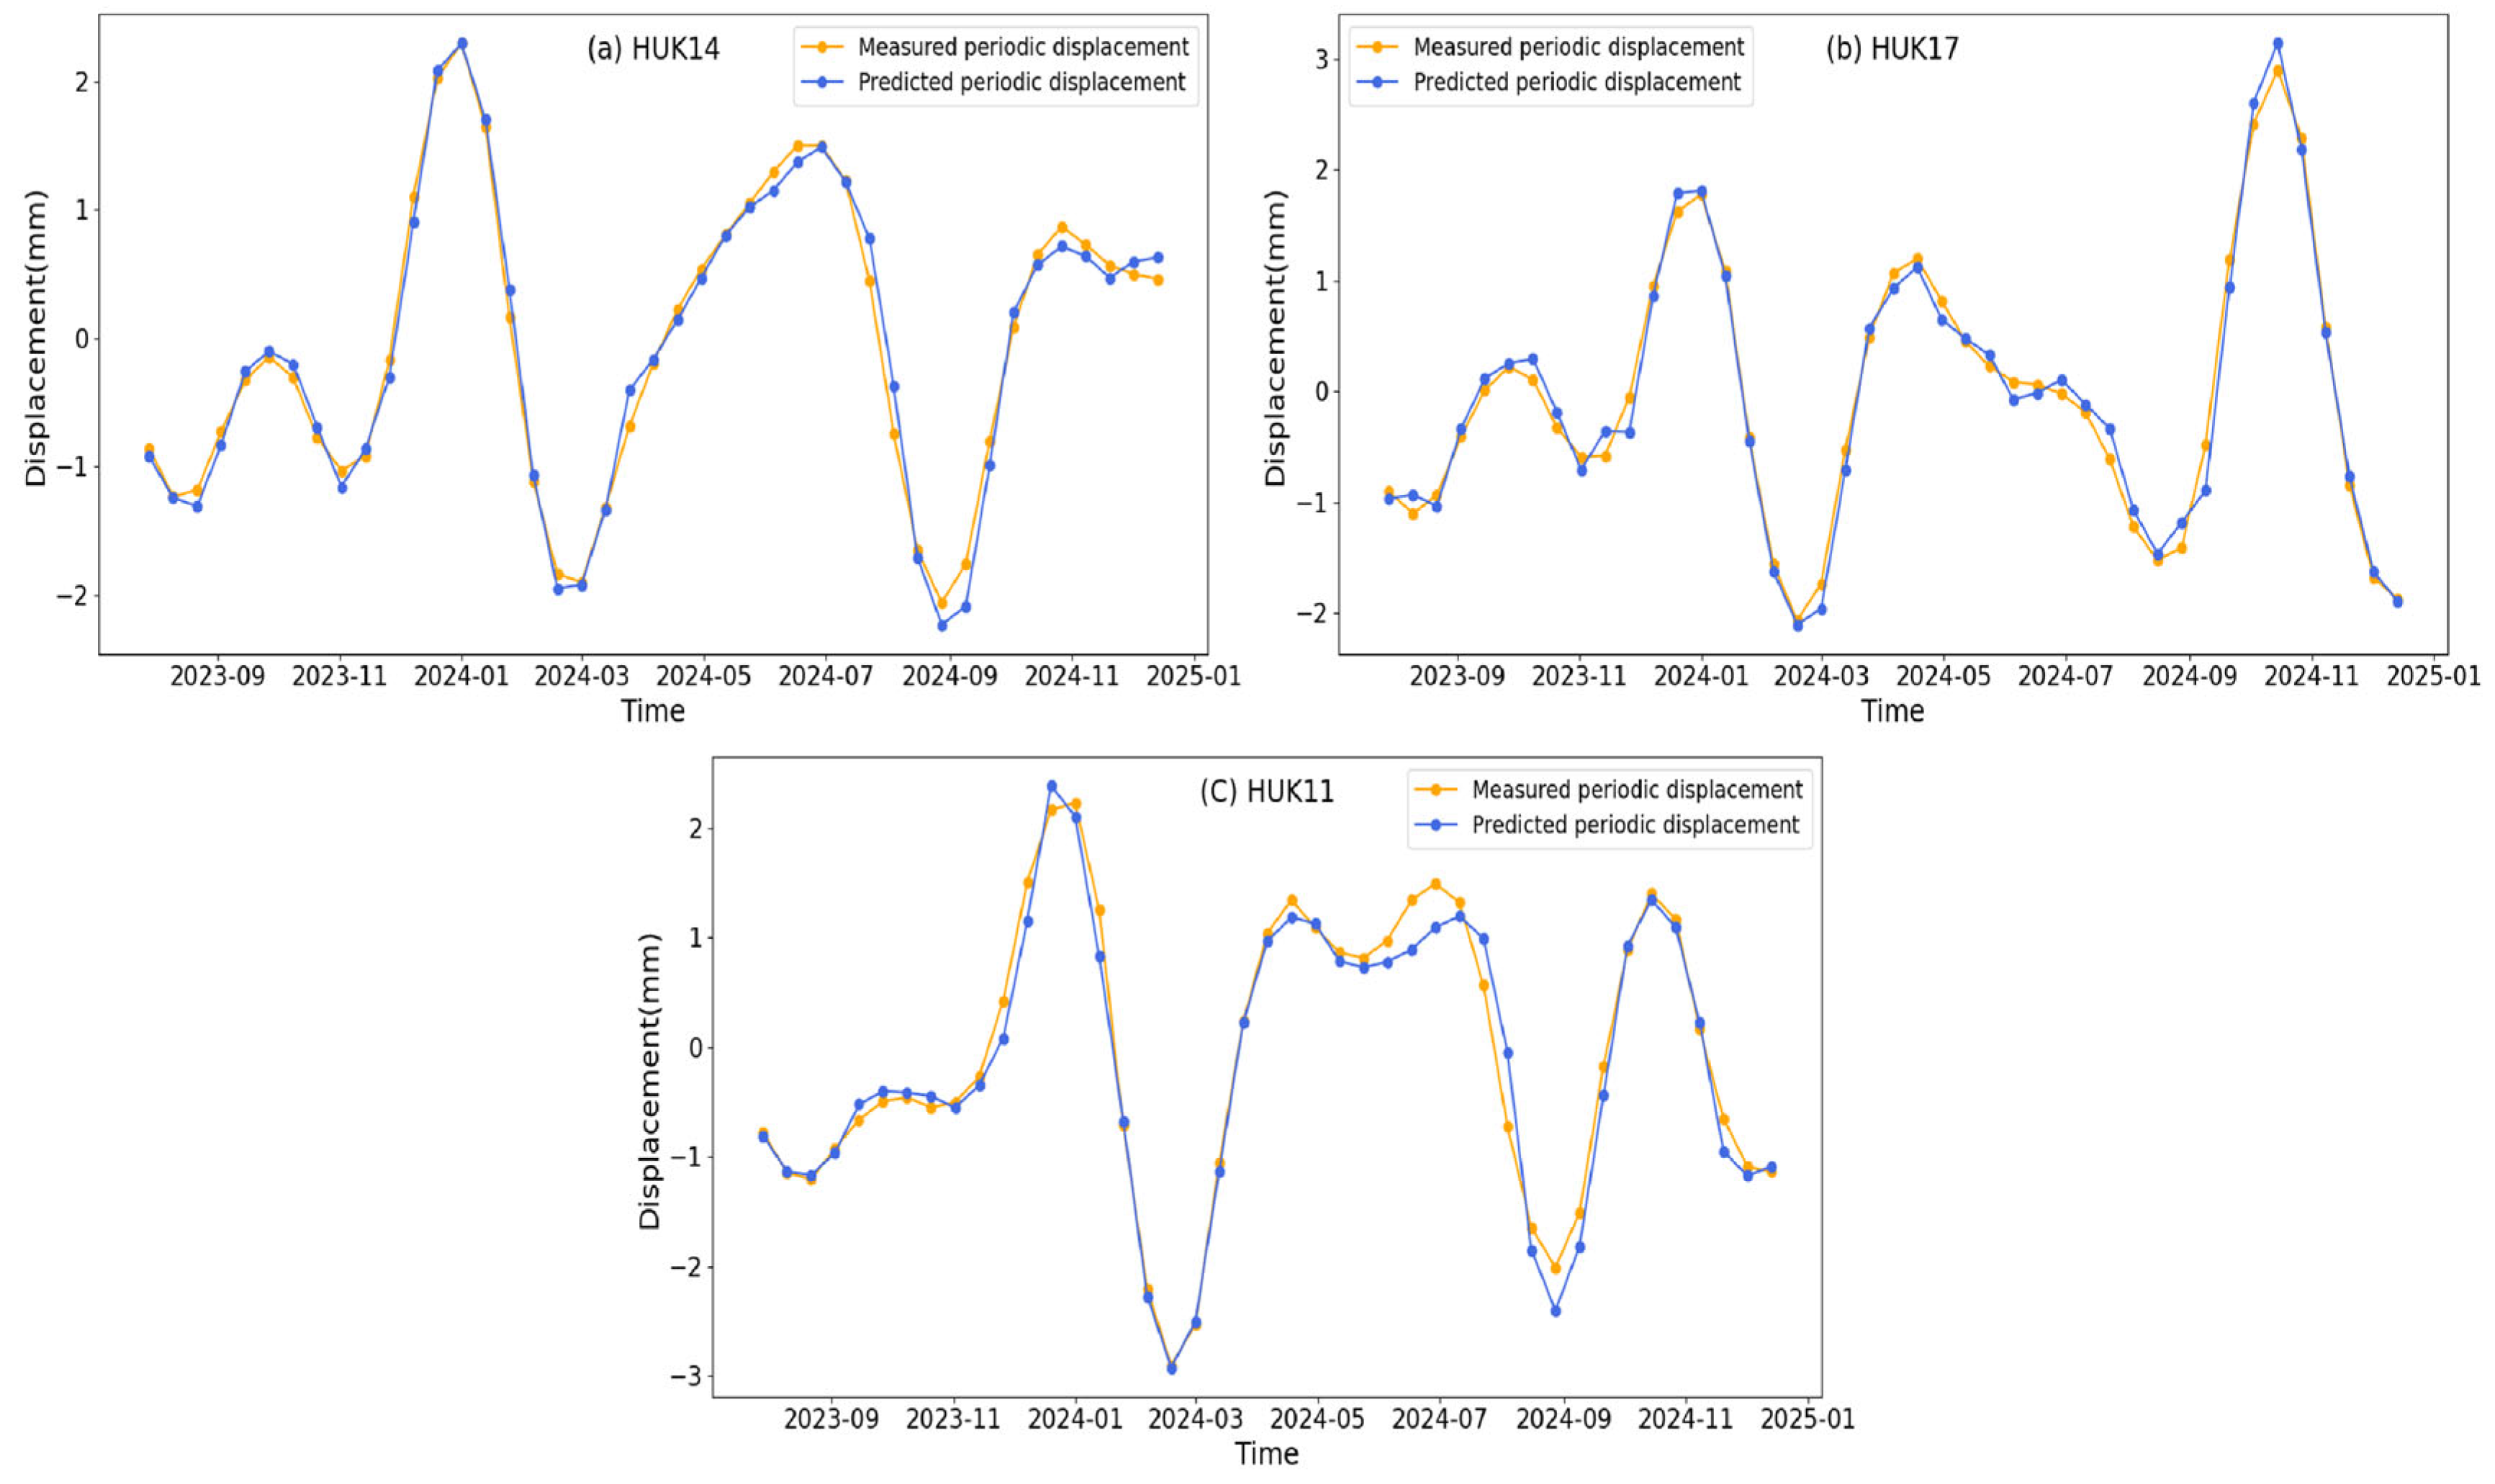
4.4.2. Periodic Component Displacement Prediction

The periodic surface deformation at the Hutubi UGS is closely related to the periodic gas injection and extraction operations of the storage facility, which induce changes in the underground pore pressure. The positive feedback mechanism between pore pressure variations and reservoir rock deformation plays a key role in driving surface displacement. To accurately predict the periodic deformation behavior, gas pressure data from the storage facility were integrated into the model. The results are presented in Figure 17, where the orange curve represents the observed periodic displacement, and the blue curve represents the model’s predicted results. Both curves exhibit a high degree of agreement over multiple time periods, demonstrating the model’s strong ability to capture periodic displacement trends. Quantitative evaluation metrics, as shown in Table 3, indicate that the R2 for the HUK11 monitoring point is 0.9695, with a root mean square error (RMSE) of 0.2222 mm and a mean absolute error (MAE) of 0.1594 mm, suggesting that the proposed model offers high fitting accuracy and robustness. A comparison with the performance at other monitoring points reveals that the prediction at HUK14 is the best (R2 = 0.9842, RMSE = 0.1409 mm, MAE = 0.1091 mm), followed by HUK17 (R2 = 0.9829, RMSE = 0.1548 mm, MAE = 0.1285 mm). These results indicate that the GWO-VMD-GRU model exhibits excellent generalization capability for periodic deformation prediction across different monitoring points, making it highly suitable for periodic deformation prediction tasks under the complex geological conditions of underground gas storage sites.

4.4.3. Total Displacement Prediction

In this study, the total displacement prediction is derived by summing the periodic and trend-based displacement predictions. The predicted total displacement is shown in Figure 18. In panel (a) for HUK14, the prediction results from all three models closely match the observed displacement data. Specifically, the GWO-VMD-GRU and GRU models demonstrate superior fitting of the displacement trend between mid-2024 and early 2025, while the LSTM model shows slight deviations during certain time periods. Overall, the GWO-VMD-GRU model exhibits the smallest deviation from the observed data, showcasing the best predictive capability. For the prediction results at HUK17 in panel (b), the models also exhibit strong fitting ability, with the prediction curves from all three models closely tracking the observed data. The GWO-VMD-GRU model continues to perform excellently, with smaller overall fluctuations in the fitted curve. While the GRU and LSTM models show minor deviations, their predictions remain within acceptable ranges for most time periods, highlighting the models’ strong generalization ability. At the HUK11 monitoring point, shown in panel (c), the displacement data exhibits more complex fluctuations, increasing the prediction difficulty. Nevertheless, the GWO-VMD-GRU model still performs well, with the predicted values closely aligning with the observed data. The GRU model demonstrates moderate performance with slight fluctuations, while the LSTM model experiences significant deviations around mid-2024, suggesting a decline in its prediction accuracy under complex trends. All three prediction models (GWO-VMD-GRU, GRU, and LSTM) demonstrate some degree of displacement prediction capability. A comprehensive comparison of these models is presented in Table 4. The GWO-VMD-GRU model consistently shows the smallest errors and the best trend fitting across all cases, indicating its superior predictive performance. This is attributed to its hybrid model structure, combining the Gray Wolf Optimization (GWO) algorithm, Variational Mode Decomposition (VMD), and Gated Recurrent Unit (GRU), which better captures the latent features in the time series. In comparison, the GRU model, while slightly less effective, still maintains good predictive performance. The LSTM model, however, performs less effectively than the other two models when dealing with highly nonlinear data with large variations, leading to relatively lower accuracy.

5. Discussion

This study integrates SBAS-InSAR technology with the GWO-VMD-GRU prediction model to thoroughly analyze the surface deformation process and its predictive outcomes at the Hutubi UGS in Xinjiang. Under the periodic influence of gas injection and extraction activities, the surface deformation of the gas storage facility exhibits complex spatiotemporal characteristics, with significant differences observed across various regions. By utilizing multi-source SAR data, high-precision GNSS data, and gas pressure data, we have provided an accurate surface deformation monitoring and prediction model. This model offers valuable insights and strong support for the safe operation and management of underground gas storage facilities in the future.

5.1. Spatiotemporal Distribution Characteristics of Surface Deformation at the Underground Gas Storage Facility

The results of this study indicate that the surface deformation at the underground gas storage facility is primarily influenced by the periodic gas injection and extraction operations. Notably, the surface exhibits clear uplift in the central and northwestern regions, while significant subsidence occurs in the southeastern region. The uplift rate in the central area has varied over time, increasing from 6 mm/year between 2013 and 2015 to 12 mm/year from January 2015 to December 2024, reflecting the significant impact of pressure changes during the gas injection process on surface deformation. However, considerable differences in surface deformation across different regions are observed, which are closely related to the geological structure of the storage facility, the gas injection and extraction strategy, and groundwater extraction. Particularly in Areas A and C, surface deformation is influenced not only by gas injection and extraction activities, but also by agricultural water use, leading to noticeable differences in surface deformation between the two regions. The cumulative deformation values in Areas A and C suggest that the combined effects of groundwater extraction and gas injection are key drivers of surface deformation.

5.2. Combined Effects of Gas Injection, Extraction, and Groundwater Extraction on Surface Deformation

The surface deformation at the Hutubi UGS facility exhibits complex spatiotemporal distribution characteristics under the combined influence of gas injection, extraction, and groundwater extraction. This is especially pronounced in summer when precipitation is low, and agricultural irrigation exacerbates groundwater extraction, further intensifying surface subsidence. The surface deformation differences in Areas A and C primarily stem from the dual-driving forces of gas extraction and groundwater extraction. In Area A, the surface deformation around gas wells HUK4 and HUK11 exhibits a pronounced gradient, indicating a significant influence of groundwater extraction on surface deformation. In contrast, the B area experiences relatively stable surface deformation as the agricultural irrigation wells are mainly concentrated at the northern edge, resulting in minimal interference from groundwater extraction. This phenomenon indicates that the distribution density of gas wells and their relative positions to groundwater extraction points significantly affect surface deformation.

5.3. Application of the GWO-VMD-GRU Model in Deformation Prediction

In this study, the GWO-VMD-GRU hybrid model successfully predicted both the trend-based and periodic components of surface deformation at the gas storage facility. Through the decomposition and prediction of time-series data, the model demonstrated high predictive accuracy, particularly in fitting the trend component, with R2 values exceeding 0.98. This validates the model’s effectiveness and stability in handling complex time-series data. Compared to traditional GRU and LSTM models, the GWO-VMD-GRU model exhibited superior prediction accuracy, particularly at monitoring points with significant deformation fluctuations, such as HUK11, where it still provided relatively accurate predictions. Additionally, the GWO-VMD-GRU model showed strong performance in predicting periodic deformation, effectively capturing the cyclical impacts of gas injection and extraction activities on surface deformation. By incorporating gas pressure data with deformation data, the model was able to offer more accurate predictions, helping forecast future surface deformation trends. Overall, the GWO-VMD-GRU model outperformed traditional prediction models across multiple test wells, demonstrating its broad applicability in complex environments.

5.4. Model Limitations and Future Directions

Despite the strong performance of the GWO-VMD-GRU model in this study, several limitations remain. First, the prediction accuracy is influenced by the quality of the input data, especially the spatiotemporal resolution and signal-to-noise ratio of the InSAR data, which may affect the final results. Secondly, the model currently only considers the combination of gas pressure and deformation data. Future research could incorporate additional environmental factors, such as temperature variations, groundwater level fluctuations, crustal changes, and other anthropogenic factors, to further enhance the model’s generalization capabilities. Future studies could also explore multi-physical field coupling models that comprehensively consider the impacts of gas pressure, geological characteristics, and groundwater flow on surface deformation. Furthermore, the use of higher-resolution SAR data and denser GNSS monitoring data could improve the precision of monitoring and prediction, providing more comprehensive data support for the intelligent regulation and management of underground gas storage facilities.

5.5. Model Scalability and Potential Applications in Other Locations

Although this study focuses on underground gas storage facilities, the successful application of the model provides a solid foundation for its use in other types of underground storage facilities. Specifically, the GWO-VMD-GRU model can be effectively extended to fields such as carbon dioxide storage, compressed air energy storage (CAES), and liquefied natural gas (LNG) storage. By integrating gas pressure, injection volume, and surface deformation data, the model can accurately predict surface deformation during the storage process. Additionally, the model exhibits strong adaptability to different geological conditions, particularly in complex regions such as reservoir deformation monitoring, landslide displacement monitoring, or urban subsidence monitoring, where related data can be incorporated to enhance prediction accuracy. In cross-domain applications, the model can integrate meteorological and environmental data to further improve the comprehensive prediction of surface deformation. Future research can explore ways to enhance the model’s computational efficiency, ensuring it remains efficient and accurate in large-scale underground storage facility monitoring. In conclusion, the GWO-VMD-GRU hybrid model not only has broad application prospects, but also provides precise surface deformation predictions in various underground storage facilities and in surface deformation monitoring across different domains, demonstrating significant scalability.

5.6. Implications for Underground Gas Storage Operation and Management

This study not only provides comprehensive monitoring and prediction of long-term surface deformation at the Hutubi UGS in Xinjiang but also offers valuable scientific support for the management and operation of underground gas storage facilities. The findings highlight the need to consider the combined effects of gas injection, extraction, groundwater extraction, and other natural and anthropogenic factors in ensuring the safe operation of gas storage facilities. By regulating gas pressure and gas volume distribution, especially at wells with high deformation, the risk of surface deformation can be effectively reduced, ensuring the stability of the storage facility. Additionally, future research could extend the application of this model to other types of underground gas storage facilities and even carbon dioxide sequestration sites for surface stability assessment, providing further theoretical support and technical solutions for underground space development in the global energy transition.

6. Conclusions

This study focuses on the surface deformation monitoring and prediction of the Hutubi UGS in Xinjiang. Based on SBAS-InSAR technology and using multi-source SAR data from TerraSAR-X and Sentinel-1, the deformation evolution process in the gas storage area from 2013 to 2024 was systematically analyzed. Building upon InSAR monitoring, a high-precision and robust GWO-VMD-GRU prediction model was developed through wavelet denoising. The specific conclusions are as follows:
(1)
Surface deformation at the storage facility is characterized by noticeable uplift in the central and northwestern regions, while subsidence occurs in the southeastern region. From the cumulative displacement of various gas wells, it is evident that deformation in the central area is relatively stable, while significant variations are observed in the northwestern and southeastern regions. Notably, the cumulative uplift at HUK14 and HUK12 exceeds 90 mm, which is substantially greater than the deformation at other wells. For these wells, it is recommended to adjust the gas injection and extraction pressure in the next phase, with appropriate pressure reduction or redistribution of injection volumes to wells with smaller deformation.
(2)
Surface deformation at the Hutubi UGS is primarily driven by the combined effects of gas injection and groundwater extraction. In particular, summer surface deformation in the northwestern, southeastern, and northern sides of the facility results from the interaction of natural gas injection and agricultural groundwater extraction. The cumulative deformation differences between the northwest and southeast gas wells can be attributed to the combined effects of these two driving forces. Wells such as HUK4 (uplift region) and HUK11 (subsidence region) exhibit significant gradient effects of groundwater extraction, with HUK11 showing the most noticeable deformation due to its proximity to agricultural irrigation wells. In contrast, the central area remains relatively stable because the agricultural wells are concentrated at the northern edge, and gas injection wells in this region are minimally affected by groundwater extraction. Overall, the combined influence of gas injection and groundwater extraction results in distinct spatiotemporal deformation patterns across the storage facility.
(3)
The GWO-VMD-GRU hybrid model proposed in this study integrates the strengths of the Gray Wolf Optimization (GWO) algorithm, Variational Mode Decomposition (VMD), and Gated Recurrent Unit (GRU) to accurately extract and predict trends and periodic components in deformation sequences. The R2 values for all three gas well monitoring points exceeded 0.98, and the model maintained stable prediction performance even in scenarios with complex deformation characteristics and large fluctuations. Compared to traditional models such as GRU and LSTM, the GWO-VMD-GRU model significantly outperforms in terms of prediction accuracy, particularly in modeling nonlinear and nonstationary geological time series data, confirming its adaptability and robustness.
In conclusion, the “SBAS-InSAR + GWO-VMD-GRU” integrated deformation monitoring and prediction framework developed in this study has been validated through its application at the Hutubi UGS. The method demonstrated strong applicability and prediction accuracy in complex geological environments, offering a new solution for the digitalization and safe operation of underground gas storage facilities. Furthermore, this methodology exhibits strong scalability and transferability, making it highly suitable for application in other types of underground engineering monitoring scenarios.

Author Contributions

Methodology, J.L.; Formal analysis, J.L.; Data curation, W.L. and X.Q.; Writing—original draft, W.H.; Writing—review & editing, W.H., S.Y., A.Y., X.L. and S.Z.; Funding acquisition, J.L. All authors have read and agreed to the published version of the manuscript.

Funding

This research was funded by the National Natural Science Foundation of China (42274014, 41874015), the National Key Research and Development Program of China (2022YFC300370), the Key Research and Development Special Project of Xinjiang Uygur Autonomous Region (2022B03001-1), the State Administration of Foreign Experts Affairs Intelligence Introduction Program of China (G2022045013L), the Third Scientific Expedition to Xinjiang (2022xjkk1305), the Study on Surface and Crustal Deformation Patterns of the Hutubi Underground Gas Storage (HTBCQK-2024-033), the Tianshan Talent Science and Technology Innovation Team Project, Xinjiang Uygur Autonomous Region (2024TSYCTD0014).

Data Availability Statement

The data presented in this study are available on request from the corresponding author. The data are not publicly available due to privacy and ethical reasons.

Conflicts of Interest

Authors Wei Liao, Xinlu Li and Shijie Zhang were employed by the Xinjiang Oilfield Gas Storage Co., Ltd., PetroChina. The remaining authors declare that the research was conducted in the absence of any commercial or financial relationships that could be construed as a potential conflict of interest.

References

  1. Hu, B.; Li, H.; Zhang, X.; Fang, L. Oil and Gas Mining Deformation Monitoring and Assessments of Disaster: Using Interferometric Synthetic Aperture Radar Technology. IEEE Geosci. Remote Sens. Mag. 2020, 8, 108–134. [Google Scholar] [CrossRef]
  2. Li, J.; Li, R.; Wang, X.; Shi, X.; Zheng, L.; Abudutayier·, Y.; Sun, X.; Chen, S.; Fang, W.; Cheng, R. Study on the Vertical Surface Deformation Mechanism of the Hutubi Underground Gas Storage in Some Areas. Chin. J. Seismol. 2016, 32, 407–416. [Google Scholar]
  3. Qiao, X.J.; Chen, W.; Wang, D.; Nie, Z.; Chen, Z.; Li, J.; Wang, X.; Li, Y.; Wang, T.; Feng, G. Crustal Deformation in the Hutubi Underground Gas Storage Site in China Observed by GPS and InSAR Measurements. Seismol. Res. Lett. 2018, 89, 1467–1477. [Google Scholar]
  4. Tang, L.; Lu, Z.; Zhang, M.; Sun, L.; Wen, L. Seismicity Induced by Simultaneous Abrupt Changes of Injection Rate and Well Pressure in Hutubi Gas Field. J. Geophys. Res. Solid Earth 2018, 123, 5929–5944. [Google Scholar] [CrossRef]
  5. Jiang, G.Y.; Qiao, X.J.; Wang, X.Q.; Lu, R.Q.; Liu, L.; Yang, H.F.; Su, Y.D.; Song, L.L.; Wang, B.S.; Wong, T.-F. GPS Observed Horizontal Ground Extension at the Hutubi (China) Underground Gas Storage Facility and Its Application to Geomechanical Modeling for Induced Seismicity. Earth Planet. Sci. Lett. 2019, 530, 115943. [Google Scholar] [CrossRef]
  6. Wang, Z.; Dou, K.; Yang, Y. Study on Surface Deformation Patterns and Mechanisms of the Hutubi Underground Gas Storage. J. Southwest Petro. Univ. (Nat. Sci. Ed.) 2022, 44, 79–90. [Google Scholar]
  7. Wang, Y.; Feng, G.; Li, Z.; Xu, W.; Zhu, J.; He, L.; Xiong, Z.; Qiao, X. Retrieving the Displacements of the Hutubi (China) Underground Gas Storage During 2003–2020 from Multi-Track InSAR. Remote Sens. Environ. 2022, 268, 112768. [Google Scholar] [CrossRef]
  8. Berardino, P.; Fornaro, G.; Lanari, R.; Sansosti, E. A New Algorithm for Surface Deformation Monitoring Based on Small Baseline Differential SAR Interferograms. IEEE Trans. Geosci. Remote Sens. 2002, 40, 2375–2383. [Google Scholar] [CrossRef]
  9. Bai, D.; Lu, G.; Hu, H.; Lin, H.; Chen, C.; Wang, X. Deformation Analysis and Reinforcement Effect Evaluation for the No. 65 Slope on the Shangsan Expressway Based on SBAS-InSAR. Buildings 2024, 14, 3582. [Google Scholar] [CrossRef]
  10. Zhang, P.; Guo, Z.; Guo, S.; Xia, J. Land Subsidence Monitoring Method in Regions of Variable Radar Reflection Characteristics by Integrating PS-InSAR and SBAS-InSAR Techniques. Remote Sens. 2022, 14, 3265. [Google Scholar] [CrossRef]
  11. Chen, K.; Wang, B. Monitoring and Predictive Analysis of Surface Deformation Using Combined SBAS-InSAR Technology and CS-Elman Neural Network: A Case Study of Wenchuan County, Sichuan Province, China. Photogramm. Eng. Remote Sens. 2025, 91, 53–63. [Google Scholar] [CrossRef]
  12. Dou, K. Study on Surface Deformation of the Hutubi Underground Gas Storage in Xinjiang Based on SBAS-InSAR. Master’s Thesis, Southwest Petroleum University, Chengdu, China, 2020. [Google Scholar]
  13. Wang, Y. Study and Application of Wide-Area InSAR Deformation Monitoring Method. Doctoral Dissertation, Central South University, Changsha, China, 2023. [Google Scholar]
  14. Wang, D.; Li, Y.; Nie, Z.; Wang, T.; Qiao, X.; Li, J.; Yu, P.; Cheng, R. GPS Study of Surface Cap Layer Deformation at the Hutubi Underground Gas Storage. Chin. J. Seismol. 2016, 32, 397–406. [Google Scholar]
  15. Zhang, Z.; Wei, B.; Shen, Z.; Wunier; Wang, T.; Wang, B.; Ruan, Y. Impact of the Hutubi Underground Natural Gas Storage on Surrounding Micro-Seismic Activity in 2016. Chin. J. Geophys. 2020, 63, 3387–3397. [Google Scholar]
  16. Zhao, R.; Yang, Z.; Zhou, W.; Guo, F. Cenozoic Tectonic Features and Earthquakes in the Piedmont Depression Zones on the Northern and Southern Flanks of the Tianshan Mountains. Seismol. Geol. 2000, 22, 295–304. [Google Scholar]
  17. Cao, X. Study on the Characteristics of In-situ Stress in an Underground Gas Storage Converted from a Depleted Gas Reservoir in Xinjiang. Doctoral Dissertation, China University of Geosciences (Beijing), Beijing, China, 2013. [Google Scholar]
  18. Zhang, P. Late Cenozoic Tectonic Deformation of the Tianshan Mountains and Its Foreland Basins. Sci. Bull. 2003, 48, 2499–2500. [Google Scholar]
  19. Pang, J.; Qian, G.; Wang, B.; Yang, Z.; Wei, Y.; Li, Y. Evaluation of Sealing Ability of the Underground Gas Storage Converted from the Xinjiang H Gas Field. Nat. Gas Ind. 2012, 32, 83–85. [Google Scholar]
  20. Yuan, M.; Li, M.; Liu, H.; Lv, P.; Li, B.; Zheng, W. Subsidence Monitoring Based on SBAS-InSAR and Slope Stability Analysis Method for Damage Analysis in Mountainous Mining Subsidence Regions. Remote Sens. 2021, 13, 3107. [Google Scholar] [CrossRef]
  21. Chen, R.; Li, J.; Liu, D. InSAR Study of Current Tectonic Deformation and Seismic Hazard Analysis of the Pargyirelazhang System in the Northeastern Pamirs. Geod. Bull. 2024, 8, 79–83, 89. [Google Scholar]
  22. Chen, R.; Li, J.; Liu, D.; Yushan, A.; Li, R.; Kong, X. InSAR coseismic deformation and seismogenic structure of the 2023 MW6.9 Tajikistan earthquake. J. Geod. Geodyn. 2024, 12, 1674–9847. [Google Scholar] [CrossRef]
  23. Cai, G.; Li, Y.; Liu, G. A Combined Wavelet-Wiener Filtering Algorithm and Its Application in InSAR Interferogram Denoising. J. Remote Sens. 2009, 13, 129–136. [Google Scholar]
  24. Ma, Z.; Yang, G.; Liu, T.; Wei, X.; Shi, S.; Chen, H. InSAR-based Subsidence Prediction Method Optimized by Wavelet-GRU-ARMA. Bull. Surv. Mapp. 2024, 12, 33–39. [Google Scholar]
  25. Qian, J.; Wu, A.; Ji, J.; Cheng, L.; Xu, W. Nonlinear Time Series Prediction in Geotechnical Engineering Based on a Wavelet-Optimized LSTM-ARMA Model. J. Tongji Univ. (Nat. Sci. Ed.) 2021, 49, 1107–1115. [Google Scholar]
  26. Dragomiretskiy, K.; Zosso, D. Variational Mode Decomposition. IEEE Trans. Signal Process. 2014, 62, 531–544. [Google Scholar] [CrossRef]
  27. Yang, F.; Zhi, M.; An, Y. Revealing Large-Scale Surface Subsidence in Jincheng City’s Mining Clusters Using MT-InSAR and VMD-SSA-LSTM Time Series Prediction Model. Sci. Rep. 2025, 15, 5726. [Google Scholar] [CrossRef] [PubMed]
  28. Wen, C.; Tian, H.; Zeng, X.; Xia, X.; Hu, X.; Pang, B. Landslide Deformation Analysis and Prediction with a VMD-SA-LSTM Combined Model. Water 2024, 16, 2945. [Google Scholar] [CrossRef]
  29. Jin, B.; Zeng, T.; Yang, T.; Gui, L.; Yin, K.; Guo, B.; Zhao, B.; Li, Q. The Prediction of Transmission Towers’ Foundation Ground Subsidence in the Salt Lake Area Based on Multi-Temporal Interferometric Synthetic Aperture Radar and Deep Learning. Remote Sens. 2023, 15, 4805. [Google Scholar] [CrossRef]
  30. Mirjalili, S.; Mirjalili, M.S.; Lewis, A. Grey Wolf Optimizer. Adv. Eng. Software 2014, 69, 46–61. [Google Scholar] [CrossRef]
  31. Li, J.; Li, B.; Peng, Y.; Tang, S.; Chen, Y.; Pei, W. Monitoring and Prediction of Ground Surface Settlement in Kunming Urban Area by Building GWO-LSTM Model Based on TS-InSAR. Appl. Sci. 2024, 14, 6036. [Google Scholar] [CrossRef]
  32. Cheng, R.; Li, S.; Han, Z.; Mao, J.; Li, Y. Surface Subsidence Prediction Based on the Combination of Time-Series InSAR and GWO-VMD. J. Guizhou Univ. (Nat. Sci. Ed.) 2023, 40, 78–85. [Google Scholar]
  33. Chao, Z.; Ying, C.; Lu, G.; Yue, W.; Motagh, M.; Roessner, S.; Hu, X.; Yin, K. A Novel Framework for Landslide Displacement Prediction Using MT-InSAR and Machine Learning Techniques. Eng. Geol. 2024, 334, 107497. [Google Scholar]
  34. Xiao, Y.; Tao, Q.; Hu, L.; Liu, R.; Li, X. A Deep Learning-Based Combination Method of Spatio-Temporal Prediction for Regional Mining Surface Subsidence. Sci. Rep. 2024, 14, 19139. [Google Scholar] [CrossRef] [PubMed]
  35. Jiang, Y.; Luo, H.; Xu, Q.; Lu, Z.; Liao, L.; Li, H.; Hao, L. A Graph Convolutional Incorporating GRU Network for Landslide Displacement Forecasting Based on Spatiotemporal Analysis of GNSS Observations. Remote Sens. 2022, 14, 1016. [Google Scholar] [CrossRef]
  36. Zhang, Y.; Tang, J.; He, Z.; Tan, J.; Li, C. A Novel Displacement Prediction Method Using Gated Recurrent Unit Model with Time Series Analysis in the Erdaohe Landslide. Nat. Hazards 2020, 105, 783–813. [Google Scholar] [CrossRef]
  37. Chen, W. InSAR Deformation Monitoring and Simulation Study of the Hutubi Underground Gas Storage in Xinjiang. Master’s Thesis, Institute of Seismology, China Earthquake Administration, Wuhan, China, 2016. [Google Scholar]
Figure 1. Hutubi UGS area. (a) Location of the Hutubi UGS, its geological context, and the coverage of SAR data. (b) Green pentagons represent the GNSS continuous stations, while red triangles indicate the distribution of gas wells at the Hutubi UGS.
Remotesensing 17 02480 g001
Figure 2. Displacement prediction and accuracy evaluation process for the gas storage facility.
Remotesensing 17 02480 g002
Figure 3. The spatial-temporal baseline of the (a) TerraSAR and (b) Sentinel-1 interferometric pairs.
Remotesensing 17 02480 g003
Figure 4. Basic structure of the GRU model. The circle represents element-wise multiplication within the matrix, while the “+” sign indicates matrix addition. The arrows represent the transmission paths of various vectors during different computational steps.
Remotesensing 17 02480 g004
Figure 5. (a) Deformation rate results from the ascending-track TerraSAR-X data for the period 2013–2015. (b) Deformation rate results from the ascending-track Sentinel-1 data for the period 2015–2024.
Remotesensing 17 02480 g005
Figure 6. Comparison of displacement changes along the line-of-sight (LOS) direction between GNSS and InSAR data.
Remotesensing 17 02480 g006
Figure 7. Cumulative displacement results during the gas extraction phase of the 11th cycle and part of the 12th cycle at the gas storage facility.
Remotesensing 17 02480 g007
Figure 8. Cumulative displacement results during the gas injection phase of the 12th cycle at the gas storage facility.
Remotesensing 17 02480 g008
Figure 9. The blue line represents the variation in gas pressure, while the red line indicates the cumulative deformation in the time series.
Remotesensing 17 02480 g009
Figure 10. Schematic of the division of gas injection and extraction well areas in the Hutubi UGS.
Remotesensing 17 02480 g010
Figure 11. Cumulative deformation time series for selected gas injection and extraction wells within Area A.
Remotesensing 17 02480 g011
Figure 12. Cumulative deformation time series for selected gas injection and extraction wells within Area B.
Remotesensing 17 02480 g012
Figure 13. Cumulative deformation time series for selected gas injection and extraction wells within Area C.
Remotesensing 17 02480 g013
Figure 14. Comparison between raw data and wavelet denoised Data.
Remotesensing 17 02480 g014
Figure 15. Displacement decomposition results for HUK14, HUK7, and HUK11.
Remotesensing 17 02480 g015
Figure 16. Predicted results of trend component displacement.
Remotesensing 17 02480 g016
Figure 17. Predicted results of periodic component displacement.
Remotesensing 17 02480 g017
Figure 18. Predicted results of total displacement.
Remotesensing 17 02480 g018
Table 1. Detailed parameters of the SAR images for this experiment.
SensorTerraSARSentienl-1
OrbitAscendingAscending
Repeat cycle (d)1112
Incidence angle (degrees)30.9733.83
Image resolution (m)3 × 35 × 20
Wavelength (cm)3.25.5
Number of images23267
Acquisition dates11 November 2013–21 March 201524 January 2015–24 December 2024
Table 2. Accuracy of the trend component displacement prediction results.
Gas WellR2RMSEMAE
HUK140.99350.35190.2970
HUK170.99750.17650.1503
HUK110.98180.25210.2101
Table 3. The accuracy of the periodic component displacement prediction results.
Gas WellR2RMSEMAE
HUK140.98420.14090.1091
HUK170.98290.15480.1285
HUK110.96950.22220.1594
Table 4. The accuracy of the total displacement prediction results.
Gas WellModelR2RMSEMAE
HUK14GWO-VMD-GRU0.99410.36750.3052
GRU0.98850.50770.4147
LSTM0.98350.60760.4946
HUK17GWO-VMD-GRU0.99690.21730.1748
GRU0.98530.47670.3645
LSTM0.97700.59540.4970
HUK11GWO-VMD-GRU0.98190.34230.2686
GRU0.96070.50620.3933
LSTM0.95030.57120.4514
Disclaimer/Publisher’s Note: The statements, opinions and data contained in all publications are solely those of the individual author(s) and contributor(s) and not of MDPI and/or the editor(s). MDPI and/or the editor(s) disclaim responsibility for any injury to people or property resulting from any ideas, methods, instructions or products referred to in the content.

