


Monthly Urban Electricity Power Consumption Prediction Using Nighttime Light Remote Sensing: A Case Study of the Yangtze River Delta Urban Agglomeration

Abstract

1. Introduction
- (1)
- A novel method for predicting monthly urban EPC was proposed. The interaction between temperature and NTL, as well as the nonlinear impact of temperature on EPC were explicitly incorporated in the proposed method. This methodological innovation enables accurate temporal and spatial variations in monthly urban EPC.
- (2)
- The proposed method was validated across different types of NTL remote sensing data, which were constructed from NPP/VIIRS data and SDGSAT-1. Based on NPP/VIIRS satellite imagery, the model successfully generated monthly EPC distribution maps at a spatial resolution of 400 m. Moreover, annual EPC estimates derived from the monthly predictions achieved a Mean Absolute Relative Error (MARE) of 7.13%, demonstrating the method’s effectiveness in supporting both monthly and annual EPC monitoring.
- (3)
- Moreover, the proposed method was further validated using the SDGSAT-1 satellite dataset, demonstrating its robustness and generalizability across diverse sensor platforms. Notably, under identical evaluation conditions, the results of SDGSAT-1 dataset exhibited higher overall accuracy compared to those obtained from the NPP/VIIRS data. This enabled the generation of high-resolution (40 m) monthly EPC spatial distribution maps, facilitating the detailed identification and analysis of EPC zones.
2. Materials and Methods
2.1. Study Area and Basic Data
2.1.1. Study Area
2.1.2. EPC and Other Related Basic Data
2.2. NPP/VIIRS Dataset
2.2.1. NPP/VIIRS Data
2.2.2. NPP/VIIRS Images Outlier Processing and NTL Extraction
2.3. SDGSAT-1 Dataset
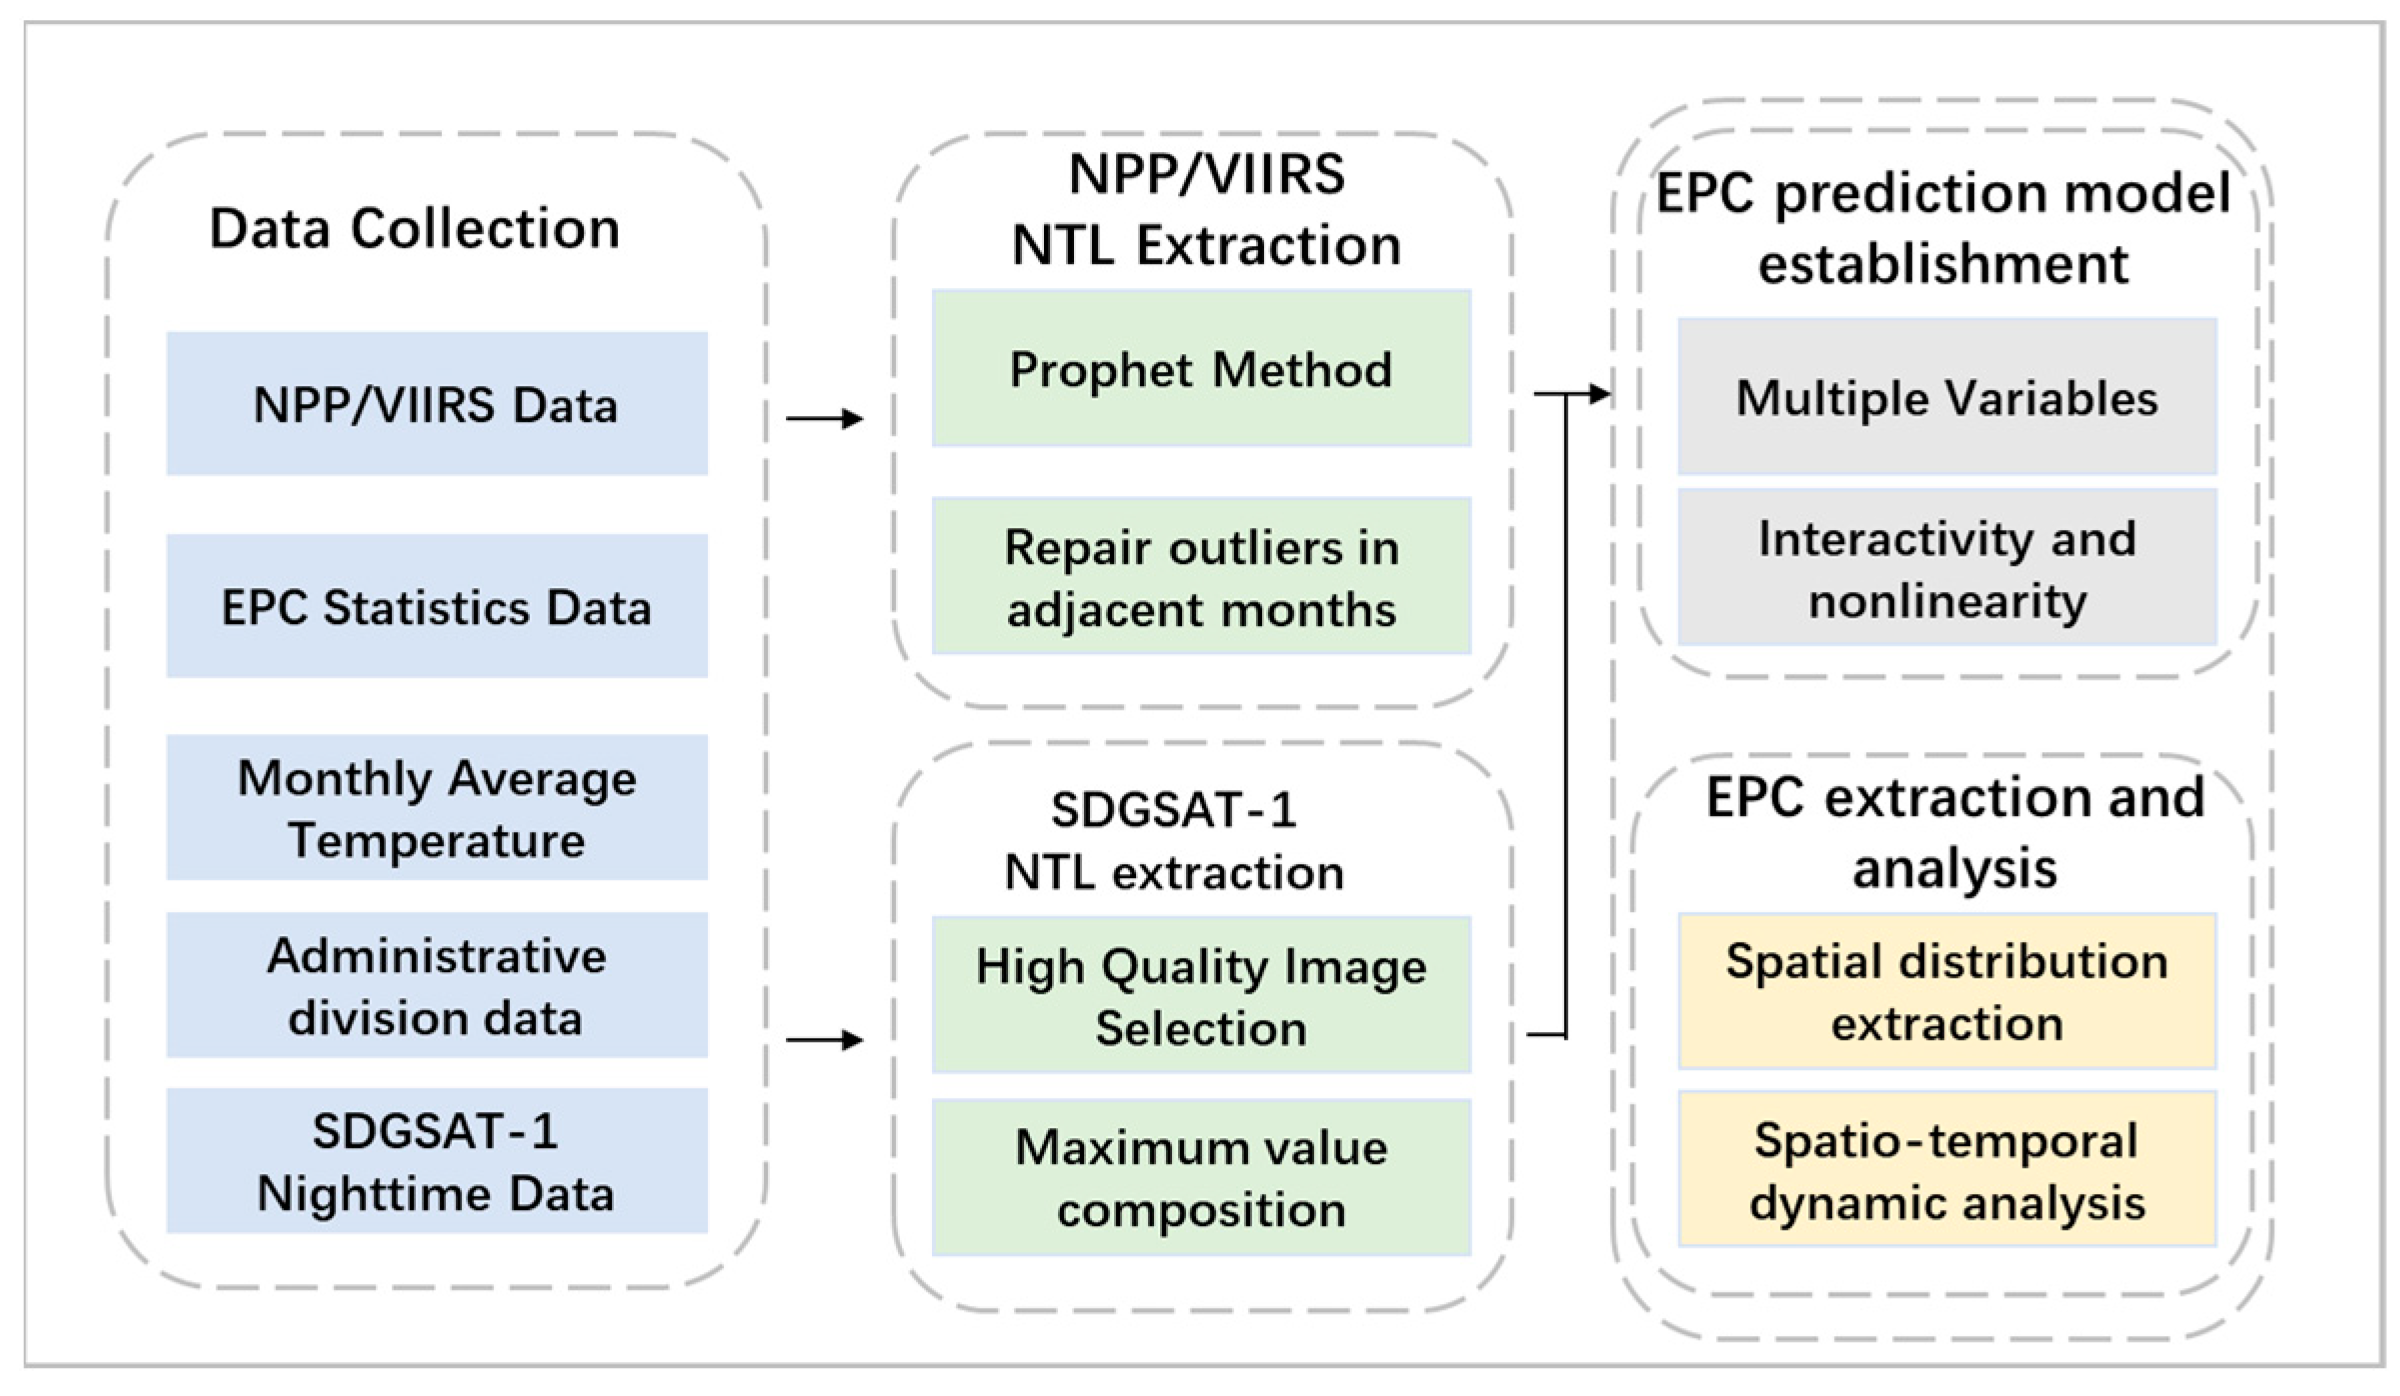
2.4. Method
2.4.1. Proposed Method
2.4.2. Comparison Methods
2.4.3. Experiment Settings
3. Results
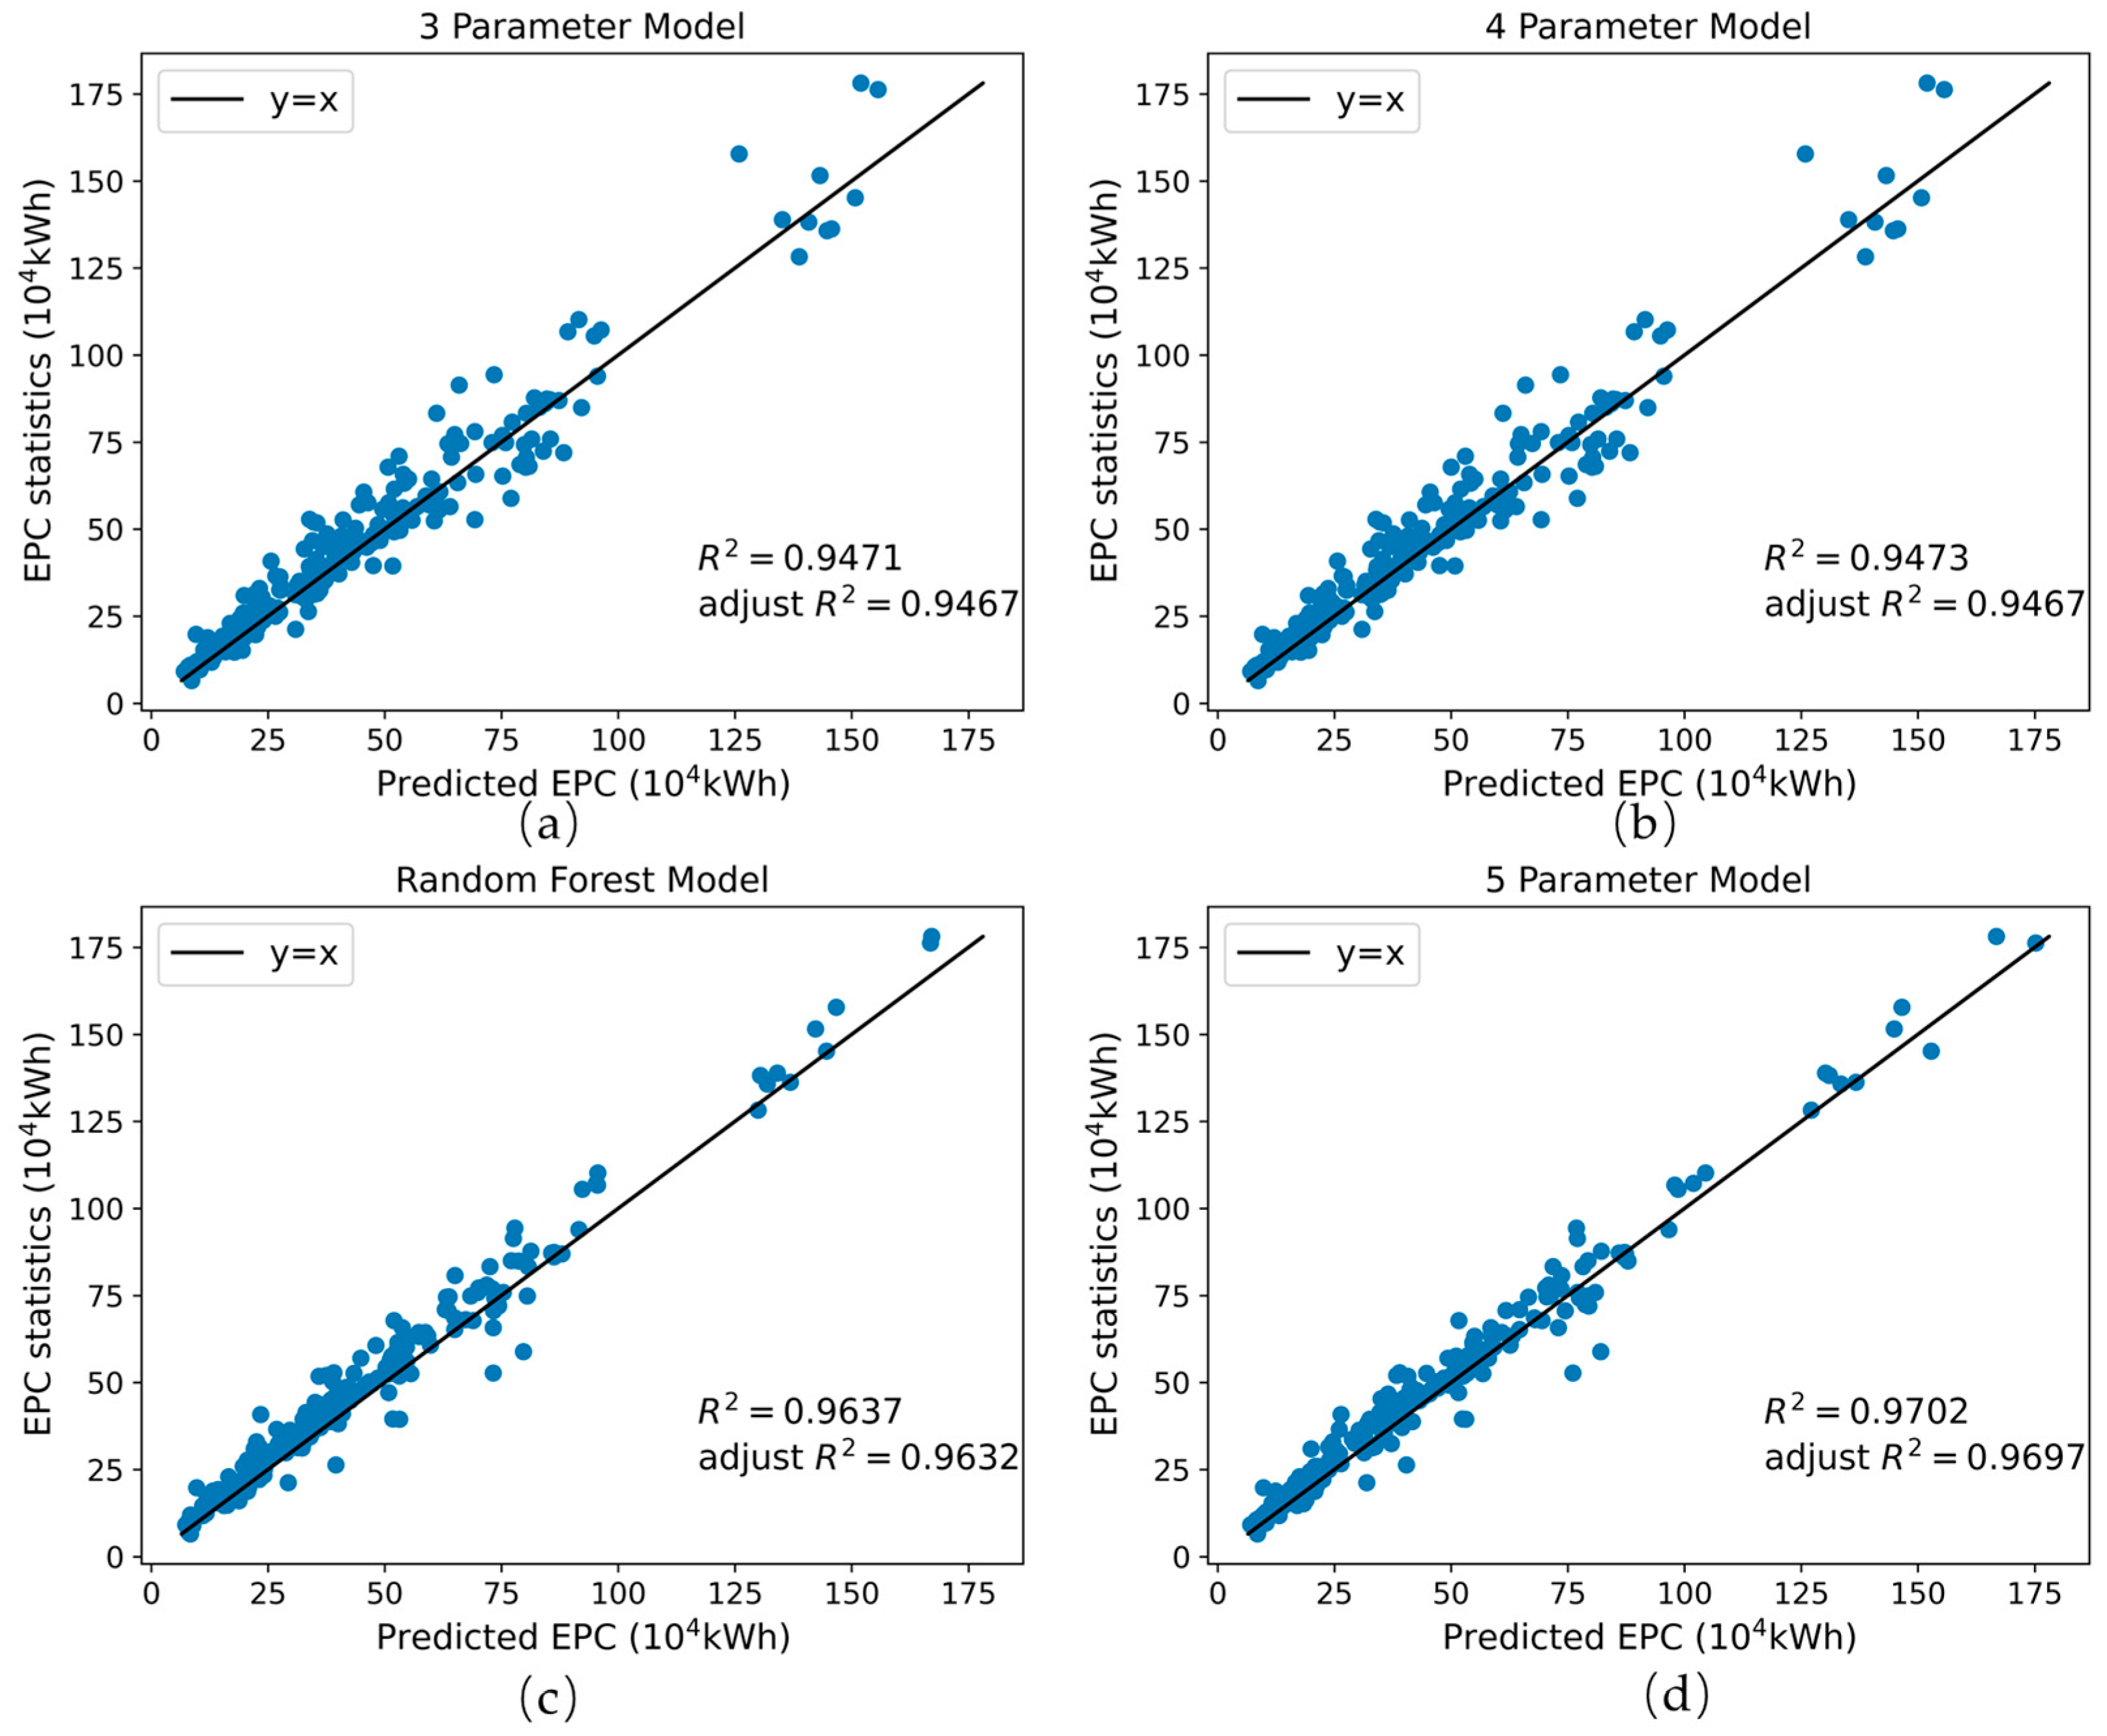
3.1. Modeling Effects on NPP/VIIRS Dataset
3.2. Monthly Prediction on NPP/VIIRS Dataset
3.3. 2017–2023 Annual EPC on NPP/VIIRS Dataset
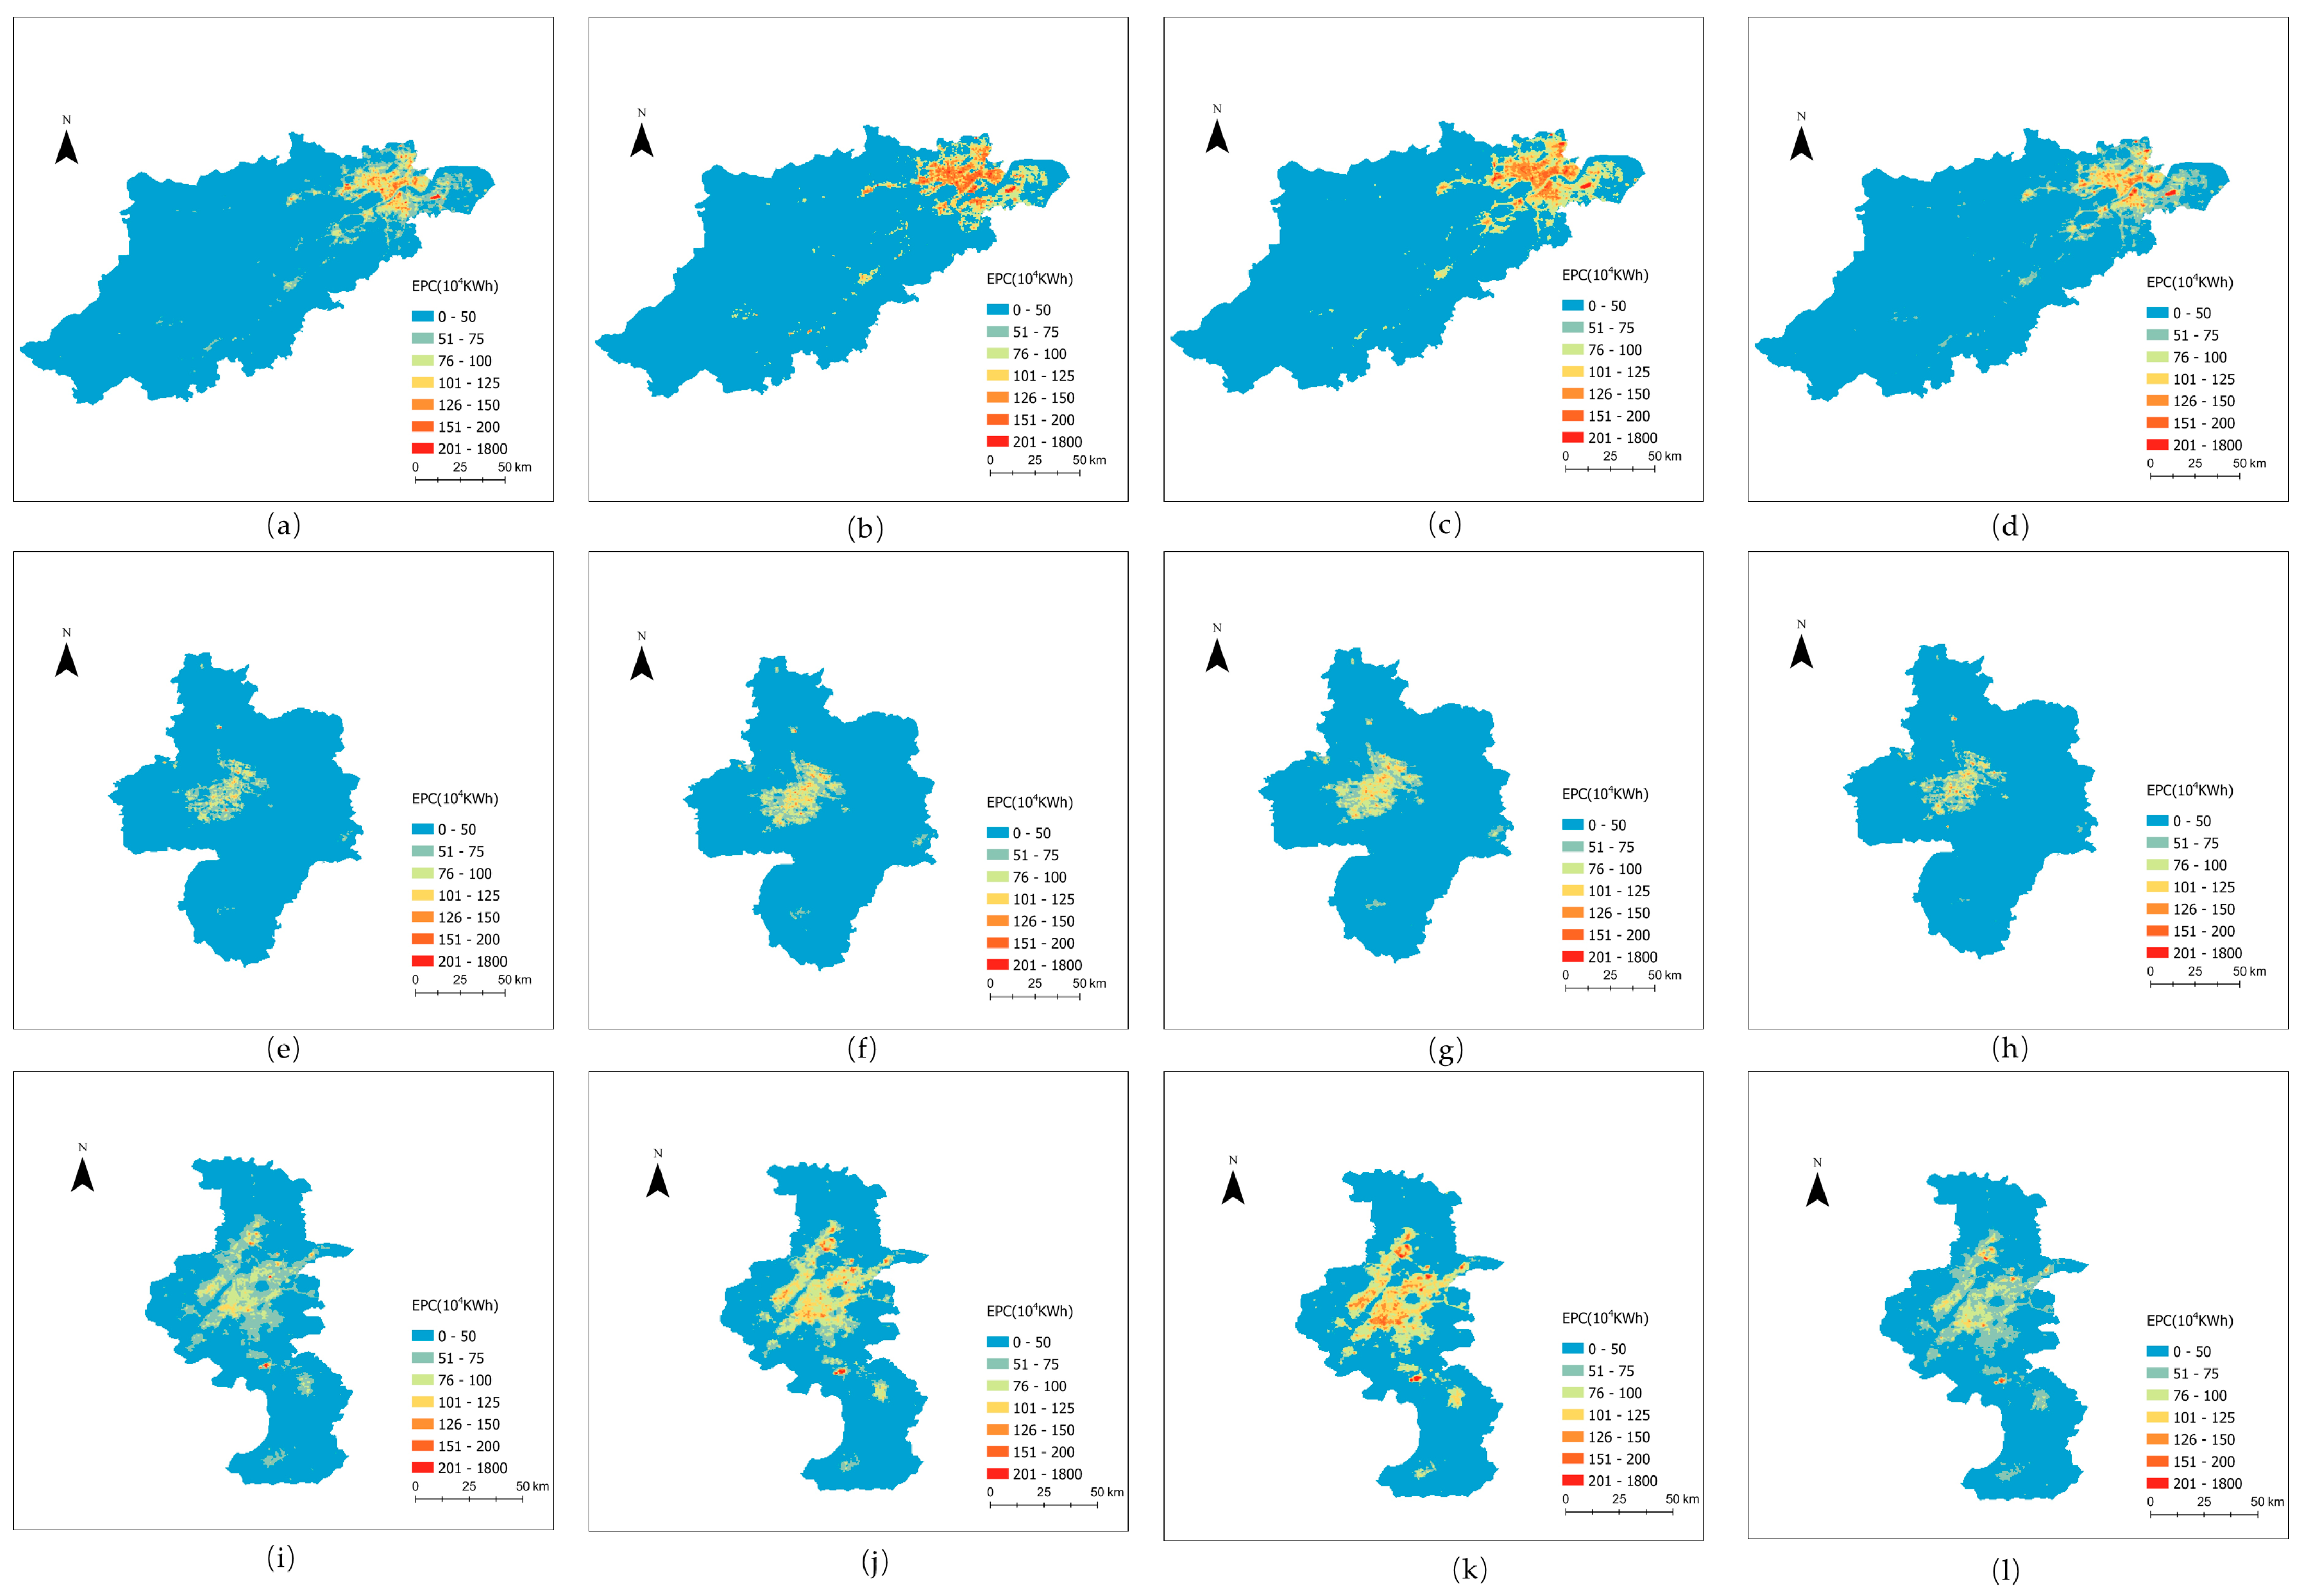
3.4. EPC Distribution Maps and Analysis Based on NPP/VIIRS Dataset
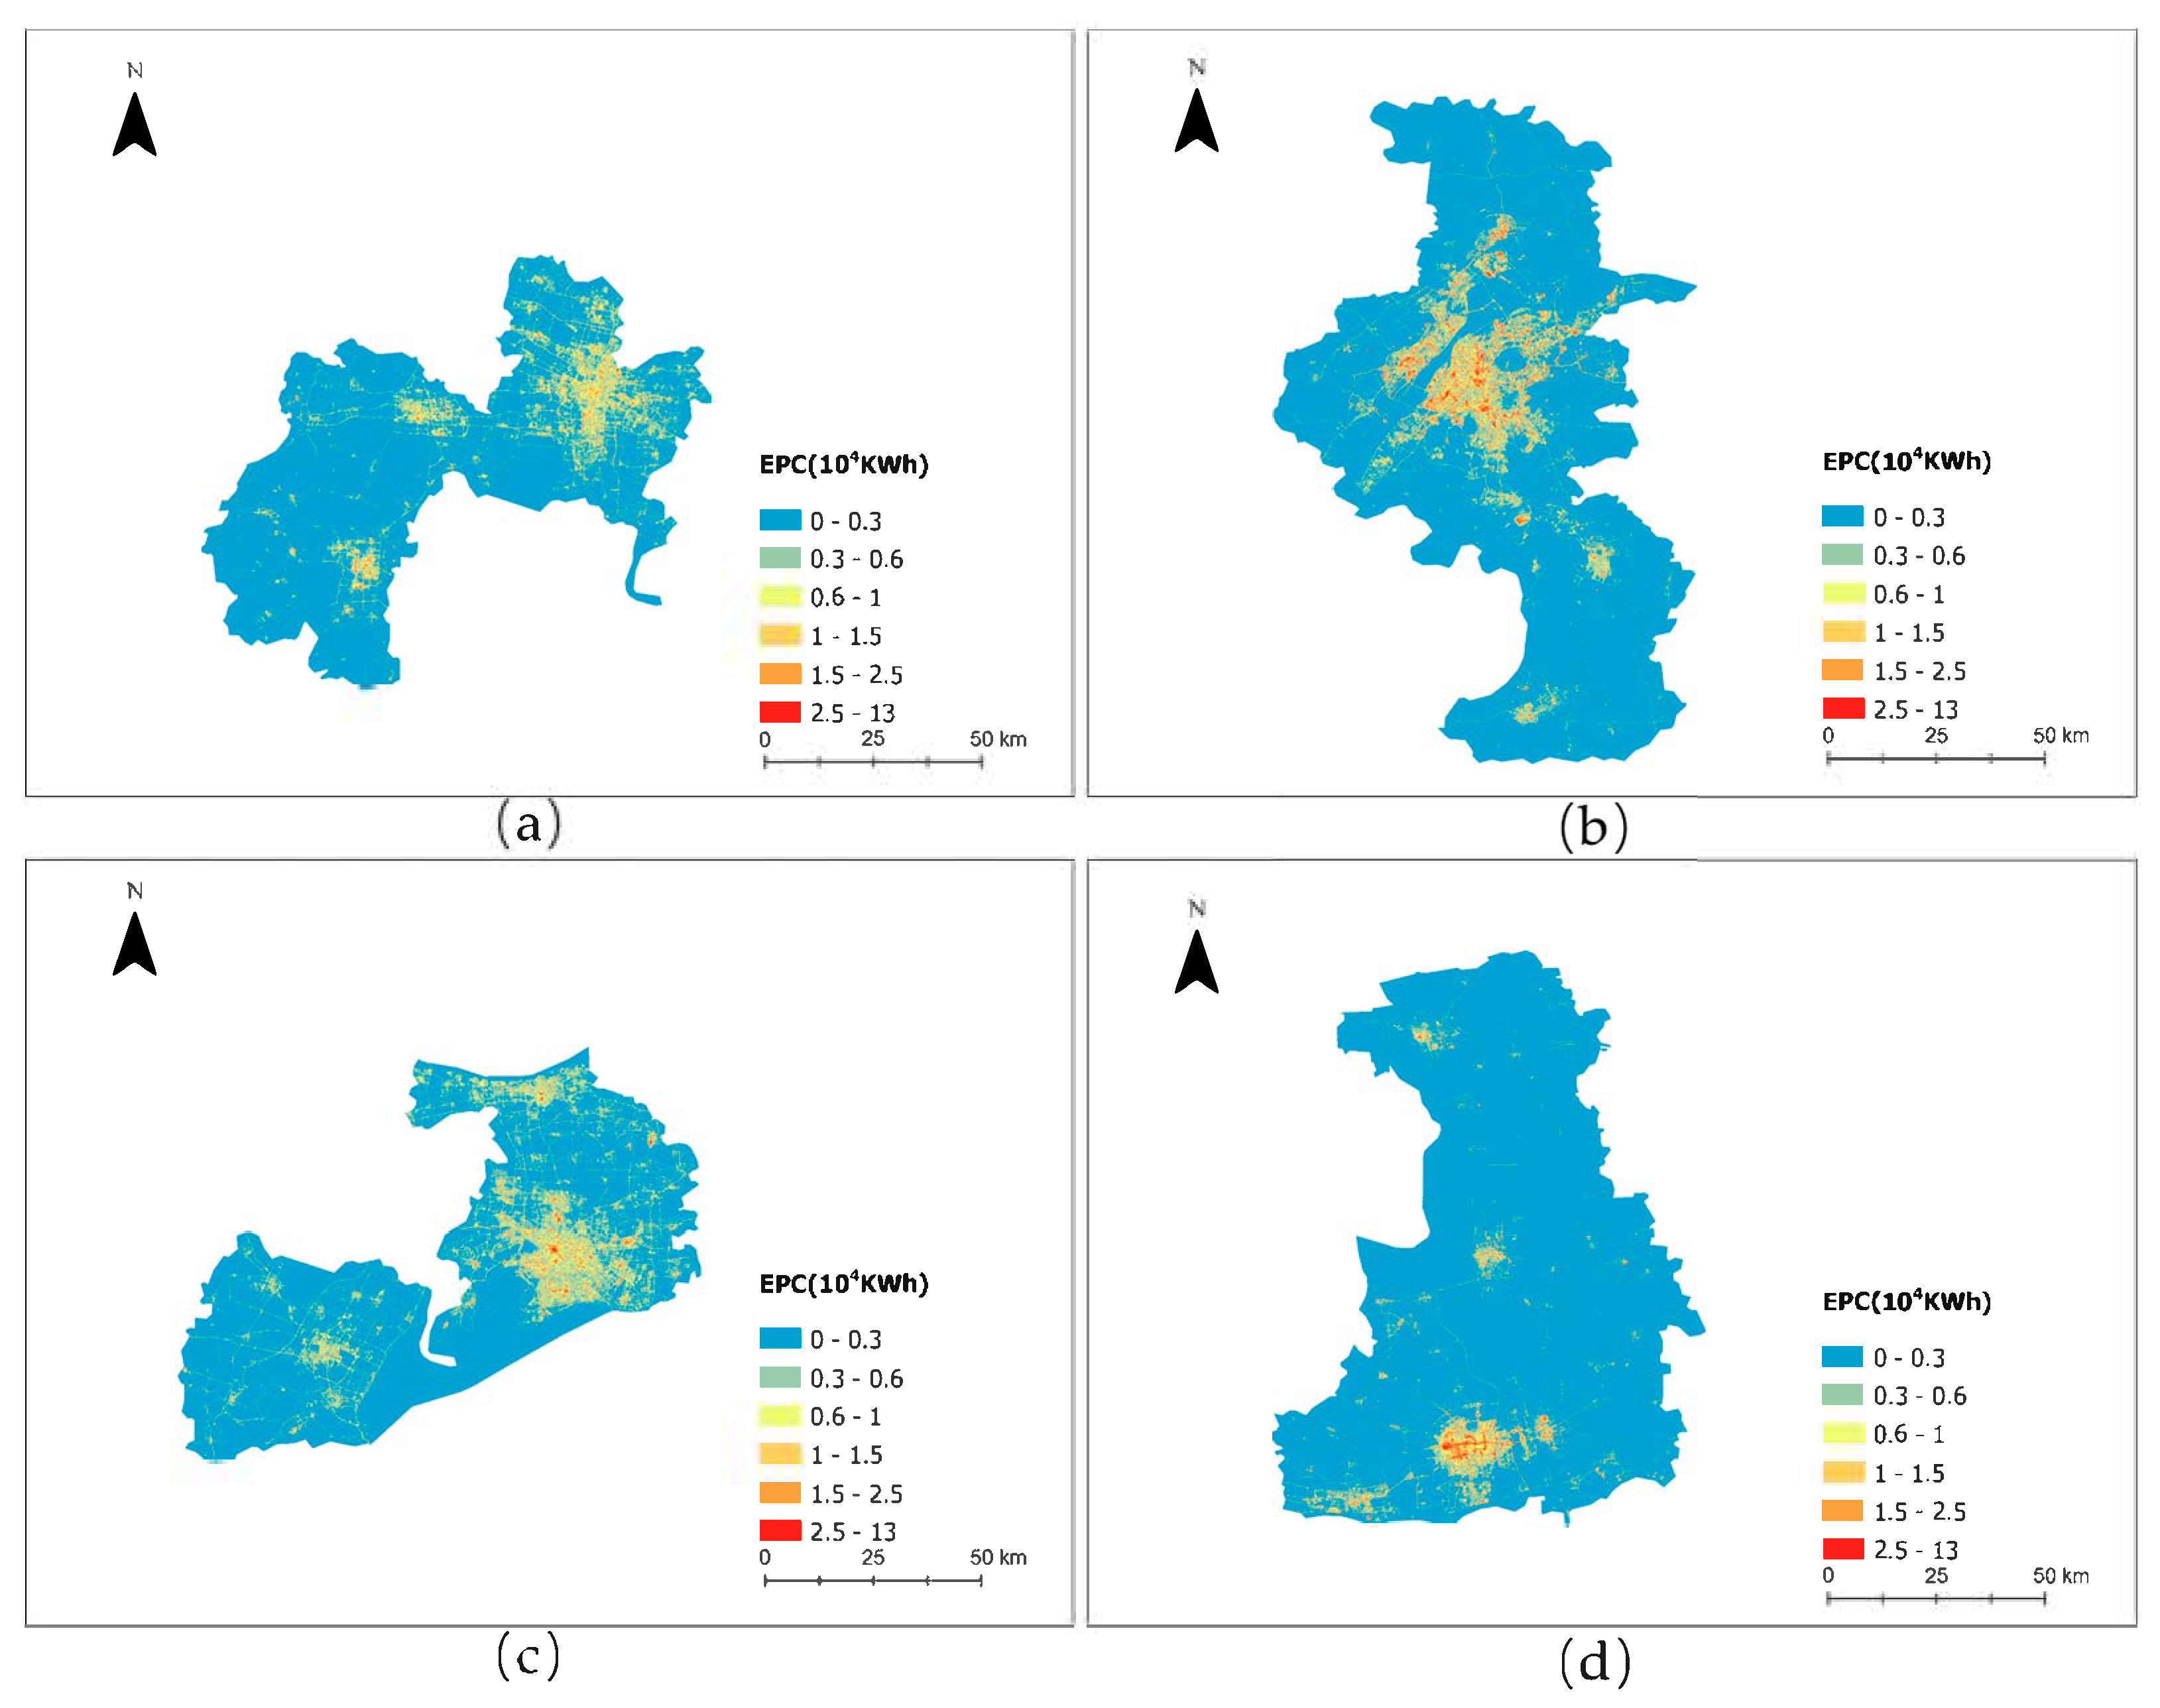
3.5. Results on SDGSAT-1 Dataset
4. Discussion
5. Conclusions
Author Contributions
Funding
Data Availability Statement
Conflicts of Interest
References
- He, C.Y.; Ma, Q.; Liu, Z.F.; Zhang, Q.F. Modeling the spatiotemporal dynamics of electric power consumption in Mainland China using saturation-corrected DMSP/OLS nighttime stable light data. Int. J. Digit. Earth 2014, 7, 993–1014. [Google Scholar] [CrossRef]
- Levin, N.; Kyba, C.C.M.; Zhang, Q.; Sánchez de Miguel, A.; Román, M.O.; Li, X.; Portnov, B.A.; Molthan, A.L.; Jechow, A.; Miller, S.D.; et al. Remote sensing of night lights: A review and an outlook for the future. Remote Sens. Environ. 2020, 237, 111443. [Google Scholar] [CrossRef]
- Zheng, Q.M.; Seto, K.C.; Zhou, Y.Y.; You, S.X.; Weng, Q.H. Nighttime light remote sensing for urban applications: Progress, challenges, and prospects. ISPRS J. Photogramm. Remote Sens. 2023, 202, 125–141. [Google Scholar] [CrossRef]
- Zhao, F.; Ding, J.Y.; Zhang, S.J.; Luan, G.Z.; Song, L.; Peng, Z.Y.; Du, Q.Y.; Xie, Z.Q. Estimating Rural Electric Power Consumption Using NPP-VIIRS Night-Time Light, Toponym and POI Data in Ethnic Minority Areas of China. Remote Sens. 2020, 12, 2836. [Google Scholar] [CrossRef]
- Xie, Y.; Weng, Q. World energy consumption pattern as revealed by DMSP-OLS nighttime light imagery. GIScience Remote Sens. 2015, 53, 265–282. [Google Scholar] [CrossRef]
- Townsend, A.C.; Bruce, D.A. The use of night-time lights satellite imagery as a measure of Australia’s regional electricity consumption and population distribution. Int. J. Remote Sens. 2010, 31, 4459–4480. [Google Scholar] [CrossRef]
- Jasinski, T. Modeling electricity consumption using nighttime light images and artificial neural networks. Energy 2019, 179, 831–842. [Google Scholar] [CrossRef]
- Doll, C.N.H.; Pachauri, S. Estimating rural populations without access to electricity in developing countries through night-time light satellite imagery. Energy Policy 2010, 38, 5661–5670. [Google Scholar] [CrossRef]
- Chen, Y.; He, C.; Guo, W.; Zheng, S.; Wu, B. Mapping Urban Functional Areas Using Multisource Remote Sensing Images and Open Big Data. IEEE J. Sel. Top. Appl. Earth Obs. Remote Sens. 2023, 16, 7919–7931. [Google Scholar] [CrossRef]
- Chen, L.J.; Zhang, H.P.; Wang, Z.Q. Township Development and Transport Hub Level: Analysis by Remote Sensing of Nighttime Light. Remote Sens. 2023, 15, 1056. [Google Scholar] [CrossRef]
- Zhou, Y.Y.; Smith, S.J.; Elvidge, C.D.; Zhao, K.G.; Thomson, A.; Imhoff, M. A cluster-based method to map urban area from DMSP/OLS nightlights. Remote Sens. Environ. 2014, 147, 173–185. [Google Scholar] [CrossRef]
- Ullah, I.; Li, W.D.; Meng, F.Q.; Nadeem, M.I.; Ahmed, K. GDP Spatialization in City of Zhengzhou Based on NPP/VIIRS Night-time Light and Socioeconomic Statistical Data Using Machine Learning. Photogramm. Eng. Remote Sens. 2024, 90, 233–240. [Google Scholar] [CrossRef]
- Cao, J.P.; Chen, Y.M.; Wilson, J.P.; Tan, H.Y.; Yang, J.X.; Xu, Z.Q. Modeling China’s Prefecture-Level Economy Using VIIRS Imagery and Spatial Methods. Remote Sens. 2020, 12, 839. [Google Scholar] [CrossRef]
- Li, C.; Huo, Z.H.; Wang, X.Y.; Wu, Y.J. Study on spatio-temporal modelling between NPP-VIIRS night-time light intensity and GDP for major urban agglomerations in China. Int. J. Remote Sens. 2022, 45, 7878–7901. [Google Scholar] [CrossRef]
- Gong, X.; Li, T.Q.; Wang, R.; Hu, S.; Yuan, S. Beyond the Remote Sensing Ecological Index: A Comprehensive Ecological Quality Evaluation Using a Deep-Learning-Based Remote Sensing Ecological Index. Remote Sens. 2025, 17, 558. [Google Scholar] [CrossRef]
- Xu, Y.C.; Chen, S.B.; Wang, Z.B.; Liu, B.; Wang, L.F. Multi-Scale Dynamics and Spatial Consistency of Economy and Population Based on NPP/VIIRS Nighttime Light Data and Population Imagery: A Case Study of the Yangtze River Delta. Remote Sens. 2024, 16, 2806. [Google Scholar] [CrossRef]
- Zhuo, L.; Ichinose, T.; Zheng, J.; Chen, J.; Shi, P.J.; Li, X. Modelling the population density of China at the pixel level based on DMSP/OLS non-radiance-calibrated night-time light images. Int. J. Remote Sens. 2009, 30, 1003–1018. [Google Scholar] [CrossRef]
- Wang, L.T.; Wang, S.X.; Zhou, Y.; Liu, W.L.; Hou, Y.F.; Zhu, J.F.; Wang, F.T. Mapping population density in China between 1990 and 2010 using remote sensing. Remote Sens. Environ. 2018, 210, 269–281. [Google Scholar] [CrossRef]
- Del Castillo, M.F.P.; Fujimi, T.; Tatano, H. Spatiotemporal economic impact analysis of the Taal Volcano eruption using electricity consumption and nighttime light data. Geomat. Nat. Hazards Risk 2025, 16, 2445626. [Google Scholar] [CrossRef]
- Barton-Henry, K.; Wenz, L. Nighttime light data reveal lack of full recovery after hurricanes in Southern US. Environ. Res. Lett. 2022, 17, 114015. [Google Scholar] [CrossRef]
- Elvidge, C.D.; Erwin, E.H.; Baugh, K.E.; Ziskin, D.; Tuttle, B.T.; Ghosh, T.; Sutton, P.C. Overview of DMSP nightime lights and future possibilities. In Proceedings of the 2009 Joint Urban Remote Sensing Event, Shanghai, China, 20–22 May 2009; pp. 1–5. [Google Scholar]
- Miller, S.D.; Mills, S.P.; Elvidge, C.D.; Lindsey, D.T.; Lee, T.F.; Hawkins, J.D. Suomi satellite brings to light a unique frontier of nighttime environmental sensing capabilities. Proc. Natl. Acad. Sci. USA 2012, 109, 15706–15711. [Google Scholar] [CrossRef]
- Li, X.; Li, X.; Li, D.; He, X.; Jendryke, M. A preliminary investigation of Luojia-1 night-time light imagery. Remote Sens. Lett. 2019, 10, 526–535. [Google Scholar] [CrossRef]
- Guo, H.; Dou, C.; Chen, H.; Liu, J.; Fu, B.; Li, X.; Zou, Z.; Liang, D. SDGSAT-1: The world’s first scientific satellite for sustainable development goals. Sci. Bull. 2023, 68, 34–38. [Google Scholar] [CrossRef]
- Wang, C.; Chen, Z.; Yang, C.; Li, Q.; Wu, Q.; Wu, J.; Zhang, G.; Yu, B. Analyzing parcel-level relationships between Luojia 1-01 nighttime light intensity and artificial surface features across Shanghai, China: A comparison with NPP-VIIRS data. Int. J. Appl. Earth Obs. Geoinf. 2020, 85, 101989. [Google Scholar] [CrossRef]
- Zhang, C.; Chen, Z.; Luo, L.; Zhu, Q.; Fu, Y.; Gao, B.; Hu, J.; Cheng, L.; Lv, Q.; Yang, J.; et al. Mapping urban construction sites in China through geospatial data fusion: Methods and applications. Remote Sens. Environ. 2024, 315, 114441. [Google Scholar] [CrossRef]
- Li, C.; Chen, F.; Wang, N.; Yu, B.; Wang, L. SDGSAT-1 nighttime light data improve village-scale built-up delineation. Remote Sens. Environ. 2023, 297, 113764. [Google Scholar] [CrossRef]
- Li, L.; Hu, T.; Yang, G.; He, W.; Zhang, H. High-resolution comprehensive regional development mapping using multisource geographic data. Sustain. Cities Soc. 2024, 113, 105670. [Google Scholar] [CrossRef]
- Wu, B.; Wang, Y.; Huang, H. Downscaling NPP–VIIRS Nighttime Light Data Using Vegetation Nighttime Condition Index. IEEE J. Sel. Top. Appl. Earth Obs. Remote Sens. 2024, 17, 18291–18302. [Google Scholar] [CrossRef]
- Samadzadegan, F.; Toosi, A.; Dadrass Javan, F. Automatic built-up area extraction by feature-level fusion of Luojia 1–01 nighttime light and Sentinel satellite imageries in Google Earth Engine. Adv. Space Res. 2023, 72, 1052–1069. [Google Scholar] [CrossRef]
- Bennett, M.M.; Smith, L.C. Advances in using multitemporal night-time lights satellite imagery to detect, estimate, and monitor socioeconomic dynamics. Remote Sens. Environ. 2017, 192, 176–197. [Google Scholar] [CrossRef]
- Welch, R. Monitoring urban-population and energy-utilization patterns from satellite data. Remote Sens. Environ. 1980, 9, 1–9. [Google Scholar] [CrossRef]
- Shi, K.; Chen, Y.; Yu, B.; Xu, T.; Yang, C.; Li, L.; Huang, C.; Chen, Z.; Liu, R.; Wu, J. Detecting spatiotemporal dynamics of global electric power consumption using DMSP-OLS nighttime stable light data. Appl. Energy 2016, 184, 450–463. [Google Scholar] [CrossRef]
- Letu, H.; Hara, M.; Yagi, H.; Naoki, K.; Tana, G.; Nishio, F.; Shuhei, O. Estimating energy consumption from night-time DMPS/OLS imagery after correcting for saturation effects. Int. J. Remote Sens. 2010, 31, 4443–4458. [Google Scholar] [CrossRef]
- Min, B.; Gaba, K.M.; Sarr, O.F.; Agalassou, A. Detection of rural electrification in Africa using DMSP-OLS night lights imagery. Int. J. Remote Sens. 2013, 34, 8118–8141. [Google Scholar] [CrossRef]
- Gao, X.M.; Wu, M.Q.; Gao, J.; Han, L.; Niu, Z.; Chen, F. Modelling Electricity Consumption in Cambodia Based on Remote Sensing Night-Light Images. Appl. Sci. Basel 2022, 12, 3971. [Google Scholar] [CrossRef]
- Hu, T.; Wang, T.; Yan, Q.; Chen, T.; Jin, S.; Hu, J. Modeling the spatiotemporal dynamics of global electric power consumption (1992–2019) by utilizing consistent nighttime light data from DMSP-OLS and NPP-VIIRS. Appl. Energy 2022, 322, 119473. [Google Scholar] [CrossRef]
- Zhong, L.; Lin, Y.; Yang, P.; Liu, X.; He, Y.; Xie, Z.; Yu, P. Quantifying the inequality of urban electric power consumption and its evolutionary drivers in countries along the belt and road: Insights from satellite perspective. Energy 2024, 312, 133425. [Google Scholar] [CrossRef]
- Guo, X.; Wang, Y. Estimation of Regional Electricity Consumption Using National Polar-Orbiting Partnership’s Visible Infrared Imaging Radiometer Suite Night-Time Light Data with Gradient Boosting Regression Trees. Remote Sens. 2024, 16, 3841. [Google Scholar] [CrossRef]
- Zhao, N.Z.; Ghosh, T.; Samson, E.L. Mapping spatio-temporal changes of Chinese electric power consumption using night-time imagery. Int. J. Remote Sens. 2012, 33, 6304–6320. [Google Scholar] [CrossRef]
- Xiao, H.; Ma, Z.; Mi, Z.; Kelsey, J.; Zheng, J.; Yin, W.; Yan, M. Spatio-temporal simulation of energy consumption in China’s provinces based on satellite night-time light data. Appl. Energy 2018, 231, 1070–1078. [Google Scholar] [CrossRef]
- Xie, Y.; Weng, Q. Detecting urban-scale dynamics of electricity consumption at Chinese cities using time-series DMSP-OLS (Defense Meteorological Satellite Program-Operational Linescan System) nighttime light imageries. Energy 2016, 100, 177–189. [Google Scholar] [CrossRef]
- Lin, J.; Shi, W. Statistical Correlation between Monthly Electric Power Consumption and VIIRS Nighttime Light. ISPRS Int. J. Geo Inf. 2020, 9, 32. [Google Scholar] [CrossRef]
- Lu, W.; Zhang, D.; He, C.; Zhang, X. Modeling the spatiotemporal dynamics of electric power consumption in China from 2000 to 2020 based on multisource remote sensing data and machine learning. Energy 2024, 308, 132971. [Google Scholar] [CrossRef]
- Wang, J.; Lu, F. Modeling the electricity consumption by combining land use types and landscape patterns with nighttime light imagery. Energy 2021, 234, 121305. [Google Scholar] [CrossRef]
- Li, X.; Xue, X. Estimation Method of Nighttime Light Images’ Electric Power Consumption Based on the Boston Matrix. Geomat. Inf. Sci. Wuhan Univ. 2018, 43, 1994–2002. [Google Scholar] [CrossRef]
- Li, S.; Cheng, L.; Liu, X.; Mao, J.; Wu, J.; Li, M. City type-oriented modeling electric power consumption in China using NPP-VIIRS nighttime stable light data. Energy 2019, 189, 116040. [Google Scholar] [CrossRef]
- Cheng, L.; Feng, R.; Wang, L.; Yan, J.; Liang, D. An Assessment of Electric Power Consumption Using Random Forest and Transferable Deep Model with Multi-Source Data. Remote Sens. 2022, 14, 1469. [Google Scholar] [CrossRef]
- Shouzhang, P. 1-km Monthly Mean Temperature Dataset for China (1901–2023); National Tibetan Plateau Data Center: Beijing, China, 2024. [Google Scholar] [CrossRef]
- Peng, S.Z.; Ding, Y.X.; Liu, W.Z.; Li, Z. 1 km monthly temperature and precipitation dataset for China from 1901 to 2017. Earth Syst. Sci. Data 2019, 11, 1931–1946. [Google Scholar] [CrossRef]
- Peng, S.Z.; Ding, Y.X.; Wen, Z.M.; Chen, Y.M.; Cao, Y.; Ren, J.Y. Spatiotemporal change and trend analysis of potential evapotranspiration over the Loess Plateau of China during 2011–2100. Agric. For. Meteorol. 2017, 233, 183–194. [Google Scholar] [CrossRef]
- Taylor, S.J.; Letham, B. Forecasting at Scale. Am. Stat. 2018, 72, 37–45. [Google Scholar] [CrossRef]
- Breiman, L. Random forests. Mach. Learn. 2001, 45, 5–32. [Google Scholar] [CrossRef]
- Li, C.T.; Yan, D.M.; Chen, S.; Yan, J.; Wu, W.R.; Wang, X.W. Electric Power Consumption Forecasting Models and Spatio-Temporal Dynamic Analysis of China’s Mega-City Agglomerations Based on Low-Light Remote Sensing Imagery Incorporating Social Factors. Remote Sens. 2025, 17, 865. [Google Scholar] [CrossRef]


| City | 2017–2022 | 2023 | City | 2017–2022 | 2023 | City | 2017–2022 | 2023 |
|---|---|---|---|---|---|---|---|---|
| Chizhou | 72 | 12 | Hangzhou | 63 | 10 | Yancheng | 30 | 10 |
| Tongling | 72 | 12 | Suzhou | 48 | 10 | Changzhou | 68 | 12 |
| Hefei | 72 | 7 | Zhoushan | 20 | 12 | Jinhua | 34 | 12 |
| Jiaxing | 72 | 12 | Zhenjiang | 64 | 10 | Wenzhou | 33 | 10 |
| Chuzhou | 72 | 12 | Huzhou | 58 | 10 | Nantong | 10 | 0 |
| Wuhu | 72 | 12 | Yangzhou | 40 | 10 | Wuxi | 17 | 12 |
| Ma’anshan | 72 | 12 | Taizhou 1 | 10 | 0 | Nanjing | 30 | 10 |
| Xuancheng | 72 | 12 | Taizhou 2 | 56 | 12 | Ningbo | 54 | 12 |
| Anqing | 72 | 7 | Shaoxing | 21 | 10 |
| City | Month | City | Month |
|---|---|---|---|
| Yangzhou | October 2023 | Nanjing | March 2023 |
| Zhenjiang | October 2023 | Tongling | April 2023 |
| Changzhou | January 2023 | Tongling | November 2023 |
| Jiaxing | February 2023 | Wuxi | January 2023 |
| Jiaxing | September 202309 | Hefei | January 2023 |
| City | 3 Parameter Model | 4 Parameter Model | RF Model | Proposed | ||||
|---|---|---|---|---|---|---|---|---|
| MARE (%) | RMSE (104 KWh) | MARE (%) | RMSE (104 KWh) | MARE (%) | RMSE (104 KWh) | MARE (%) | RMSE (104 KWh) | |
| Chizhou | 13.43 | 10,847 | 13.43 | 10,847 | 8.33 | 6726 | 13.40 | 10,744 |
| Tongling | 8.20 | 8505 | 8.20 | 8505 | 5.57 | 5584 | 7.59 | 7673 |
| Hefei | 14.38 | 56,576 | 14.38 | 56,576 | 6.55 | 24,716 | 9.91 | 38,583 |
| Jiaxing | 9.13 | 50,825 | 9.19 | 50,708 | 3.81 | 21,667 | 8.77 | 45,808 |
| Chuzhou | 10.78 | 23,312 | 10.55 | 23,026 | 5.38 | 11,611 | 9.15 | 21,646 |
| Wuhu | 10.39 | 22,422 | 10.39 | 22,422 | 6.36 | 13,144 | 8.97 | 19,719 |
| Ma’anshan | 8.77 | 19,697 | 8.77 | 19,697 | 5.65 | 12,408 | 8.24 | 18,532 |
| Xuancheng | 16.92 | 24,150 | 16.92 | 24,150 | 13.01 | 17,531 | 16.69 | 24,018 |
| Anqing | 10.56 | 13,993 | 10.55 | 13,786 | 4.84 | 5748 | 7.75 | 10,071 |
| Changzhou | 9.23 | 50,113 | 9.23 | 50,113 | 5.29 | 28,949 | 6.57 | 36,206 |
| Zhenjiang | 10.22 | 28,717 | 10.22 | 28,717 | 6.44 | 16,916 | 7.52 | 20,828 |
| Hangzhou | 11.23 | 101,350 | 11.23 | 101,350 | 2.80 | 25,870 | 6.84 | 61,494 |
| Huzhou | 8.39 | 32,681 | 8.39 | 32,647 | 2.85 | 11,977 | 5.94 | 28,068 |
| Taizhou 1 | 13.39 | 44,436 | 13.39 | 44,436 | 9.39 | 30,700 | 13.00 | 42,933 |
| Ningbo | 9.94 | 81,613 | 9.94 | 81,613 | 3.49 | 33,003 | 8.53 | 71,934 |
| Suzhou | 7.36 | 117,596 | 7.36 | 117,596 | 1.17 | 20,089 | 3.18 | 55,868 |
| Yangzhou | 10.25 | 31,128 | 10.25 | 31,128 | 3.66 | 13,209 | 6.54 | 21,838 |
| Jinhua | 13.17 | 61,056 | 13.17 | 61,056 | 5.56 | 23,922 | 10.88 | 48,159 |
| Wenzhou | 10.12 | 52,375 | 10.12 | 52,375 | 3.52 | 18,098 | 7.76 | 39,561 |
| Yancheng | 11.85 | 47,611 | 11.85 | 47,611 | 6.17 | 26,174 | 8.00 | 32,759 |
| Nanjing | 10.37 | 72,499 | 10.37 | 72,499 | 3.71 | 24,848 | 3.66 | 24,533 |
| Shaoxing | 5.73 | 29,354 | 5.73 | 29,354 | 1.57 | 10,497 | 3.19 | 17,665 |
| Zhoushan | 6.83 | 11,691 | 6.83 | 11,691 | 5.77 | 9252 | 5.97 | 9780 |
| Wuxi | 8.00 | 68,962 | 8.00 | 68,962 | 2.80 | 23,126 | 3.01 | 24,548 |
| Taizhou 2 | 7.95 | 25,094 | 7.95 | 25,094 | 6.16 | 21,474 | 2.19 | 6685 |
| Nantong | 7.87 | 38,437 | 7.87 | 38,437 | 7.41 | 38,369 | 2.89 | 14,614 |
| Average | 10.17 | 43,271 | 10.17 | 43,246 | 5.28 | 19,062 | 7.54 | 29,010 |
| City | 3 Parameter Model | 4 Parameter Model | RF Model | Proposed | ||||
|---|---|---|---|---|---|---|---|---|
| MARE (%) | RMSE (104 KWh) | MARE (%) | RMSE (104 KWh) | MARE (%) | RMSE (104 KWh) | MARE (%) | RMSE (104 KWh) | |
| Chizhou | 13.52 | 14,034 | 13.49 | 14,010 | 18.89 | 19,433 | 12.81 | 13,536 |
| Tongling | 13.46 | 15,205 | 13.46 | 15,205 | 12.34 | 14,131 | 13.71 | 14,689 |
| Hefei | 8.80 | 68,121 | 8.80 | 68,121 | 9.81 | 62,553 | 10.00 | 62,507 |
| Jiaxing | 8.72 | 74,767 | 8.48 | 72,843 | 11.55 | 84,423 | 8.15 | 68,405 |
| Chuzhou | 14.12 | 55,000 | 13.94 | 54,055 | 16.81 | 57,532 | 14.29 | 51,665 |
| Wuhu | 8.73 | 29,013 | 8.73 | 29,013 | 8.95 | 28,689 | 7.93 | 24,417 |
| Ma’anshan | 13.62 | 33,532 | 13.62 | 33,532 | 14.22 | 33,359 | 13.23 | 32,187 |
| Xuancheng | 17.17 | 41,796 | 17.17 | 41,796 | 23.71 | 47,550 | 17.62 | 41,223 |
| Anqing | 8.11 | 17,278 | 9.63 | 19,245 | 12.29 | 18,989 | 10.13 | 18,033 |
| Changzhou | 8.89 | 58,355 | 8.89 | 58,355 | 9.30 | 54,065 | 7.88 | 51,600 |
| Zhenjiang | 11.03 | 39,626 | 11.03 | 39,626 | 12.01 | 33,602 | 12.36 | 34,573 |
| Hangzhou | 11.32 | 126,788 | 11.32 | 126,788 | 6.07 | 76,936 | 5.47 | 62,883 |
| Huzhou | 10.82 | 43,391 | 10.87 | 43,504 | 8.09 | 35,920 | 7.35 | 29,612 |
| Taizhou 1 | 13.75 | 65,988 | 13.75 | 65,988 | 12.72 | 66,254 | 13.67 | 65,482 |
| Ningbo | 8.98 | 98,789 | 8.98 | 98,789 | 10.64 | 108,768 | 9.17 | 95,263 |
| Suzhou | 8.22 | 159,211 | 8.22 | 159,211 | 3.89 | 72,460 | 3.82 | 70,315 |
| Yangzhou | 7.54 | 31,387 | 7.54 | 31,387 | 10.98 | 35,265 | 8.40 | 27,084 |
| Jinhua | 16.52 | 92,867 | 16.52 | 92,867 | 18.64 | 93,472 | 15.82 | 77,992 |
| Wenzhou | 9.88 | 74,757 | 9.88 | 74,757 | 11.82 | 75,971 | 9.47 | 56,764 |
| Yancheng | 13.54 | 71,117 | 13.54 | 71,117 | 14.84 | 64,064 | 14.37 | 64,324 |
| Nanjing | 12.08 | 90,933 | 12.08 | 90,933 | 8.03 | 56,522 | 7.10 | 52,538 |
| Shaoxing | 7.21 | 52,886 | 7.21 | 52,886 | 8.18 | 45,637 | 7.07 | 42,465 |
| Zhoushan | 9.26 | 19,718 | 9.26 | 19,718 | 6.31 | 12,809 | 10.28 | 19,148 |
| Wuxi | 14.52 | 117,400 | 14.52 | 117,400 | 8.58 | 79,155 | 9.12 | 87,285 |
| Average | 11.24 | 62,165 | 11.29 | 62,131 | 11.61 | 53,232 | 10.38 | 48,500 |
| City | Annual Model | 3 Parameter Model | 4 Parameter Model | RFModel | Proposed |
|---|---|---|---|---|---|
| Chizhou | 4.69% | 9.52% | 9.52% | 5.63% | 9.55% |
| Tongling | 8.11% | 5.40% | 5.40% | 3.50% | 5.29% |
| Hefei | 14.64% | 3.95% | 3.95% | 2.94% | 3.78% |
| Jiaxing | 4.44% | 2.67% | 2.73% | 1.95% | 2.59% |
| Chuzhou | 5.53% | 3.75% | 3.59% | 2.04% | 3.69% |
| Wuhu | 2.93% | 5.50% | 5.50% | 3.59% | 5.75% |
| Ma’anshan | 28.09% | 6.95% | 6.95% | 3.96% | 6.86% |
| Xuancheng | 9.08% | 11.44% | 11.44% | 9.74% | 11.42% |
| Anqing | 36.96% | 3.15% | 3.07% | 1.67% | 2.35% |
| Hangzhou | 6.59% | 7.36% | 7.36% | 6.16% | 6.71% |
| Suzhou | 1.68% | 2.02% | 2.02% | 4.26% | 5.16% |
| Zhoushan | 52.30% | 4.23% | 3.35% | 71.96% | 3.93% |
| Zhenjiang | 9.09% | 7.03% | 7.03% | 6.34% | 7.47% |
| Huzhou | 6.81% | 3.69% | 3.69% | 5.54% | 6.73% |
| Yangzhou | 13.94% | 1.54% | 1.54% | 6.11% | 5.45% |
| Taizhou 1 | 5.42% | 3.24% | 3.24% | 9.81% | 5.88% |
| Taizhou 2 | 11.01% | 2.49% | 2.49% | 2.91% | 2.61% |
| Shaoxing | 8.55% | 11.32% | 11.32% | 15.43% | 14.48% |
| Yancheng | 9.81% | 13.91% | 13.91% | 18.66% | 15.92% |
| Changzhou | 5.68% | 2.08% | 2.08% | 2.19% | 1.59% |
| Jinhua | 6.30% | 17.95% | 17.95% | 13.79% | 13.45% |
| Wenzhou | 8.25% | 3.48% | 3.48% | 2.22% | 3.39% |
| Nantong | 13.48% | 4.55% | 4.55% | 13.24% | 8.82% |
| Wuxi | 1.84% | 1.89% | 1.89% | 9.45% | 5.92% |
| Nanjing | 2.83% | 10.85% | 10.85% | 8.28% | 5.05% |
| Ningbo | 6.45% | 6.06% | 6.06% | 5.45% | 6.02% |
| MARE | 10.94% | 6.00% | 5.96% | 9.11% | 6.53% |
| RMSE | 364,147 | 281,084 | 281,062 | 350,473 | 304,378 |
| City | Annual Model | 3 Parameter Model | 4 Parameter Model | RFModel | Proposed |
|---|---|---|---|---|---|
| Chizhou | 2.78% | 4.86% | 4.83% | 13.99% | 4.64% |
| Tongling | 11.15% | 13.87% | 13.87% | 12.68% | 14.00% |
| Hefei | 16.49% | 11.35% | 11.35% | 13.25% | 10.48% |
| Jiaxing | 12.38% | 2.97% | 2.78% | 7.23% | 2.78% |
| Chuzhou | 16.41% | 15.21% | 14.95% | 17.23% | 15.13% |
| Wuhu | 0.90% | 4.45% | 4.45% | 6.51% | 5.04% |
| Ma’anshan | 30.56% | 13.23% | 13.23% | 13.75% | 13.17% |
| Xuancheng | 20.07% | 17.29% | 17.29% | 24.82% | 17.40% |
| Anqing | 28.12% | 11.98% | 11.45% | 14.45% | 11.31% |
| Hangzhou | 4.53% | 3.24% | 3.24% | 2.21% | 1.11% |
| Suzhou | 3.07% | 1.64% | 1.64% | 0.06% | 1.25% |
| Zhoushan | 11.75% | 6.01% | 6.01% | 2.20% | 5.95% |
| Zhenjiang | 9.24% | 10.21% | 10.21% | 9.00% | 9.06% |
| Huzhou | 12.42% | 2.51% | 2.23% | 4.00% | 3.81% |
| Yangzhou | 1.78% | 4.39% | 4.39% | 8.04% | 5.12% |
| Taizhou 1 | 15.47% | 7.76% | 7.76% | 13.79% | 7.57% |
| Taizhou 2 | 18.32% | 6.64% | 6.64% | 7.13% | 6.93% |
| Shaoxing | 18.11% | 2.69% | 2.69% | 3.29% | 1.93% |
| Yancheng | 19.72% | 13.21% | 13.21% | 12.96% | 11.51% |
| Changzhou | 9.49% | 1.60% | 1.60% | 2.99% | 0.26% |
| Jinhua | 20.81% | 14.28% | 14.28% | 13.35% | 8.56% |
| Wenzhou | 2.70% | 7.14% | 7.14% | 7.34% | 4.27% |
| Nantong | 17.66% | 18.24% | 18.24% | 22.39% | 17.57% |
| Wuxi | 1.98% | 5.09% | 5.09% | 0.65% | 0.84% |
| Nanjing | 3.09% | 3.07% | 3.07% | 5.83% | 4.88% |
| Ningbo | 3.26% | 1.28% | 1.28% | 4.83% | 0.92% |
| MARE | 12.01% | 7.85% | 7.80% | 9.38% | 7.13% |
| RMSE | 617,072 | 412,490 | 411,589 | 480,417 | 361,064 |
| City | Month | SDGSAT-1 | NPP/VIIRS | ||||
|---|---|---|---|---|---|---|---|
| 3 Parameter Model | 4 Parameter Model | Proposed | 3 Parameter Model | 4 Parameter Model | Proposed | ||
| Yangzhou | October 2023 | 30.36% | 19.66% | 12.85% | 43.63% | 38.97% | 27.15% |
| Zhenjiang | October 2023 | 9.98% | 23.86% | 25.98% | 18.57% | 14.80% | 20.59% |
| Changzhou | January 2023 | 43.55% | 25.43% | 14.94% | 27.14% | 8.10% | 3.48% |
| Jiaxing | February 2023 | 9.77% | 9.79% | 13.94% | 31.12% | 22.17% | 25.52% |
| Jiaxing | September 2023 | 37.12% | 22.85% | 7.67% | 45.22% | 34.43% | 20.68% |
| Nanjing | March 2023 | 14.06% | 21.91% | 20.73% | 11.42% | 31.69% | 23.59% |
| Tongling | April 2023 | 69.26% | 10.07% | 16.02% | 99.84% | 0.62% | 17.63% |
| Tongling | November 2023 | 10.69% | 98.66% | 85.89% | 20.11% | 92.05% | 70.37% |
| Wuxi | January 2023 | 13.54% | 20.28% | 17.38% | 21.80% | 24.01% | 19.22% |
| Hefei | January 2023 | 44.41% | 28.71% | 55.56% | 69.06% | 50.27% | 72.72% |
| MARE (%) | 28.27% | 28.12% | 27.09% | 38.79% | 31.71% | 30.09% | |
| RMSE (104 KWh) | 118,969 | 94,148 | 95,842 | 153,389 | 130,069 | 124,700 | |
Disclaimer/Publisher’s Note: The statements, opinions and data contained in all publications are solely those of the individual author(s) and contributor(s) and not of MDPI and/or the editor(s). MDPI and/or the editor(s) disclaim responsibility for any injury to people or property resulting from any ideas, methods, instructions or products referred to in the content. |
© 2025 by the authors. Licensee MDPI, Basel, Switzerland. This article is an open access article distributed under the terms and conditions of the Creative Commons Attribution (CC BY) license (https://creativecommons.org/licenses/by/4.0/).
Share and Cite
Chen, S.; Yan, D.; Li, C.; Chen, J.; Yan, J.; Zhang, Z. Monthly Urban Electricity Power Consumption Prediction Using Nighttime Light Remote Sensing: A Case Study of the Yangtze River Delta Urban Agglomeration. Remote Sens. 2025, 17, 2478. https://doi.org/10.3390/rs17142478
Chen S, Yan D, Li C, Chen J, Yan J, Zhang Z. Monthly Urban Electricity Power Consumption Prediction Using Nighttime Light Remote Sensing: A Case Study of the Yangtze River Delta Urban Agglomeration. Remote Sensing. 2025; 17(14):2478. https://doi.org/10.3390/rs17142478
Chicago/Turabian StyleChen, Shuo, Dongmei Yan, Cuiting Li, Jun Chen, Jun Yan, and Zhe Zhang. 2025. "Monthly Urban Electricity Power Consumption Prediction Using Nighttime Light Remote Sensing: A Case Study of the Yangtze River Delta Urban Agglomeration" Remote Sensing 17, no. 14: 2478. https://doi.org/10.3390/rs17142478
APA StyleChen, S., Yan, D., Li, C., Chen, J., Yan, J., & Zhang, Z. (2025). Monthly Urban Electricity Power Consumption Prediction Using Nighttime Light Remote Sensing: A Case Study of the Yangtze River Delta Urban Agglomeration. Remote Sensing, 17(14), 2478. https://doi.org/10.3390/rs17142478