Article

AFNE-Net: Semantic Segmentation of Remote Sensing Images via Attention-Based Feature Fusion and Neighborhood Feature Enhancement

1
School of Urban Design, Wuhan University, Wuhan 430072, China
2
School of Earth and Space Science and Technology, Wuhan University, Wuhan 430072, China
3
School of Information Management, Wuhan University, Wuhan 430072, China
*
Author to whom correspondence should be addressed.
Remote Sens. 2025, 17(14), 2443; https://doi.org/10.3390/rs17142443 (registering DOI)
Submission received: 2 May 2025 / Revised: 27 June 2025 / Accepted: 11 July 2025 / Published: 14 July 2025
(This article belongs to the Section AI Remote Sensing)

Abstract

Understanding remote sensing imagery is vital for object observation and planning. However, the acquisition of optical images is inevitably affected by shadows and occlusions, resulting in local discrepancies in object representation. To address these challenges, this paper proposes AFNE-Net, a general network architecture for remote sensing image segmentation. First, the model introduces an attention-based feature fusion module. Through the use of weighted fusion of multi-resolution features, this effectively expands the receptive field and enhances semantic associations between categories. Subsequently, a feature enhancement module based on the consistency of neighborhood semantic representation is introduced. This aims to improve the feature representation and reduce segmentation errors caused by local perturbations. Finally, evaluations are conducted on the ISPRS Potsdam, UAVid, and LoveDA datasets to verify the effectiveness of the proposed model.

1. Introduction

As remote sensing technology has developed rapidly, the methods of acquiring remote sensing images have become increasingly diverse [1]. Nowadays, remote sensing images are widely used in many fields, such as land use classification [2,3], urban planning [4,5,6], ecological monitoring [7], disaster assessment [8,9], and agricultural monitoring [10,11]. In this context, accurately identifying semantic categories has become a significant focus of current research.
Conventional visual images are typically characterized by high resolution and clear targets [12,13]. In recent years, with the rapid development of deep learning, various vision tasks based on such images have achieved remarkable results. As a result, researchers in the field of remote sensing have begun to adopt these methods to automate remote sensing tasks. However, unlike conventional images, remote sensing imagery exhibits a wider coverage and more diverse semantic categories within a fixed pixel matrix [14,15]. To address these challenges, Transformer-based architectures [16] have been introduced. This model leverage self-attention mechanisms to capture long-range dependencies. Additionally, some studies explore hybrid approaches by combining CNNs with Transformers. For example, DBSANet [8] effectively balances local feature extraction and global context analysis, achieving significant performance improvements. Similar results have been demonstrated with RingMoE [17].
Meanwhile, frequency domain methods have also been introduced into segmentation tasks. FAENet [18] decomposes features using the discrete wavelet transform (DWT) and constructs global relationships based on frequency components. This enhances the representation of features. In contrast, FDNet [19] separates features into components of high and low frequencies, which strengthens the representation of features by compressing redundant information.These approaches significantly alleviate the problem of ambiguous semantic boundaries. However, despite the promising results achieved in the intelligent understanding of remote sensing imagery, there are still several challenges.
Firstly, remote sensing imagery covers large spatial areas and contains objects of various scales. These characteristics make it difficult for a single-scale receptive field to effectively recognize targets of different categories. Although existing methods have introduced Transformer mechanisms to capture global and local relationships, the perceptual scope remains fixed. This hinders the accurate interpretation of targets, especially in regions with densely distributed semantic categories.To address this issue, this study presents an attention multi-scale feature fusion module. This module introduces an attention similarity matrix and a feature confidence matrix. The attention similarity matrix captures global semantic relationships, and the feature confidence matrix identifies stable and ambiguous regions. These two components collaborate to provide global-to-local feature guidance, which effectively corrects ambiguous representations and enhances the stability and discriminative power of the features.
Secondly, existing methods primarily focus on overall semantic relationships, overlooking local regions. Therefore, they still present challenges in addressing complex issues, such as shadow interference and local pixel variations. Due to the relatively low spatial resolution of remote sensing imagery, each pixel often corresponds to a broad area, which leads to ambiguity in representing surface features. In the presence of multiple texture variations within a target, local regions are susceptible to inconsistent pixel representations, which can lead to inaccurate segmentation.To address this issue, the study designs a neighborhood feature enhancement module. This module integrates contextual correlations and spatial semantics from multiple neighborhoods to enhance the perception of local structures, effectively mitigating segmentation errors caused by pixel inconsistency.
Overall, the main contributions of this study are as follows:
  • An attention multi-scale feature fusion (AF) module is proposed. This module captures global information from the image and constructs a confidence map based on the differences between multi-scale feature. This improves the maintenance of information and enables effective fusion of multi-scale information.
  • A novel neighborhood feature enhancement (NE) module is designed. This uses semantic representations from neighboring regions to reduce the network’s sensitivity to local pixel variations. This helps the network better capture local expressions of semantic classes.
  • The AFNE-Net model is introduced for the semantic segmentation of remote sensing images. This model achieves state-of-the-art performance on all publicly available benchmark datasets.

2. Related Works

2.1. Deep Learning for Image Segmentation

Image semantic segmentation using deep learning has made significant progress in recent years [20,21,22]. The initial research in neural networks was characterized by the development of fully convolutional networks (FCNs) [23], which overcame the limitations of traditional methods by employing an end-to-end prediction mechanism. However, due to their limited capacity to capture contextual information, the resulting segmentation is characterized by a coarse resolution. Subsequently, U-Net [24] was proposed, with a layer-by-layer expansion and fusion architecture, which effectively supplemented contextual information to a certain extent. This innovation has played a crucial role in semantic segmentation tasks. Furthermore, PSPNet [25] enhances the ability to capture contextual information through a pyramid scene parsing structure, effectively addressing the multi-scale characteristics of objects. SeNet [26] employs dilated convolutions to extend the receptive field, facilitating the efficient capture of multi-scale scene information and enhancing the image representation capability of the network. AMSNet [7] employs a multi-modal data fusion method that dynamically weights optical and LiDAR features using spatial scale-adaptive fusion. This approach addresses the lack of multi-scale information caused by differences in sensor resolution. LOGCAN++ [3] utilizes an adaptive local–global aware module to optimize performance in complex scenes.

2.2. Transformer Mechanism

The powerful global processing capabilities of attention mechanisms has led to their widespread interest in the field of image segmentation. The utilization of independent CNN imposes constraints on the capacity to discern long-range spatial dependencies. Vaswani et al. [16] proposed a sequence modeling method based on the Transformer architecture, which replaces traditional recurrent and convolutional structures with multi-head self-attention. This approach addresses challenges such as long-range dependency modeling and limited parallel computation. SCA-CNN [27] employs a novel dual attention mechanism that combines spatial and channel information to dynamically adjust multi-layer feature maps. This mechanism effectively utilizes contextual information and enhances feature representation. BETAM [28] introduces a triple attention mechanism, which integrates positional, spatial, and channel attention to improve the recognition of semantic class boundaries. Axial-UNet++ [29] introduces an axial-channel local normalization module, addressing the problem of long-range dependencies in images. TDBAN [30] employs a cross-branch collaborative approach and utilizes data correlation to integrate global and local features.

2.3. Multi-Scale Feature Fusion

High-resolution remote sensing data often face challenges such as target scale variability and environmental diversity [31]. To address these issues, researchers have proposed a series of innovative network architectures. These designs enhance the model’s ability to represent ground objects through multi-level feature interaction mechanisms.
AFENet [32] integrates local and global information to enhance feature extraction. This strategy has been demonstrated to enhance the representation of both global context and fine-grained details, ensuring the completeness of object boundaries. GLFFNet [33] learns adaptive parameters to provide adequate representation of each semantic class. FA-HRNet [34] employs a similar strategy, utilizing an adaptive attention mechanism to provide scale information pertinent to distinct semantic categories. FAENet [18] decomposes features into the frequency domain using the discrete wavelet transform (DWT), enabling multi-scale feature interaction in the frequency space and enhancing sensitivity to pixel variations. However, this approach invariably increases the sensitivity of the network to noise, which can compromise the stability of the model. DFF-Unet [35] extracts semantic and edge features to interpret image semantics from dual perspectives, aiming to meet the feature requirements of different regions. Nevertheless, the method still suffers from shadow interference and pixel ambiguity, which may lead to local mis-segmentation.

3. Methods

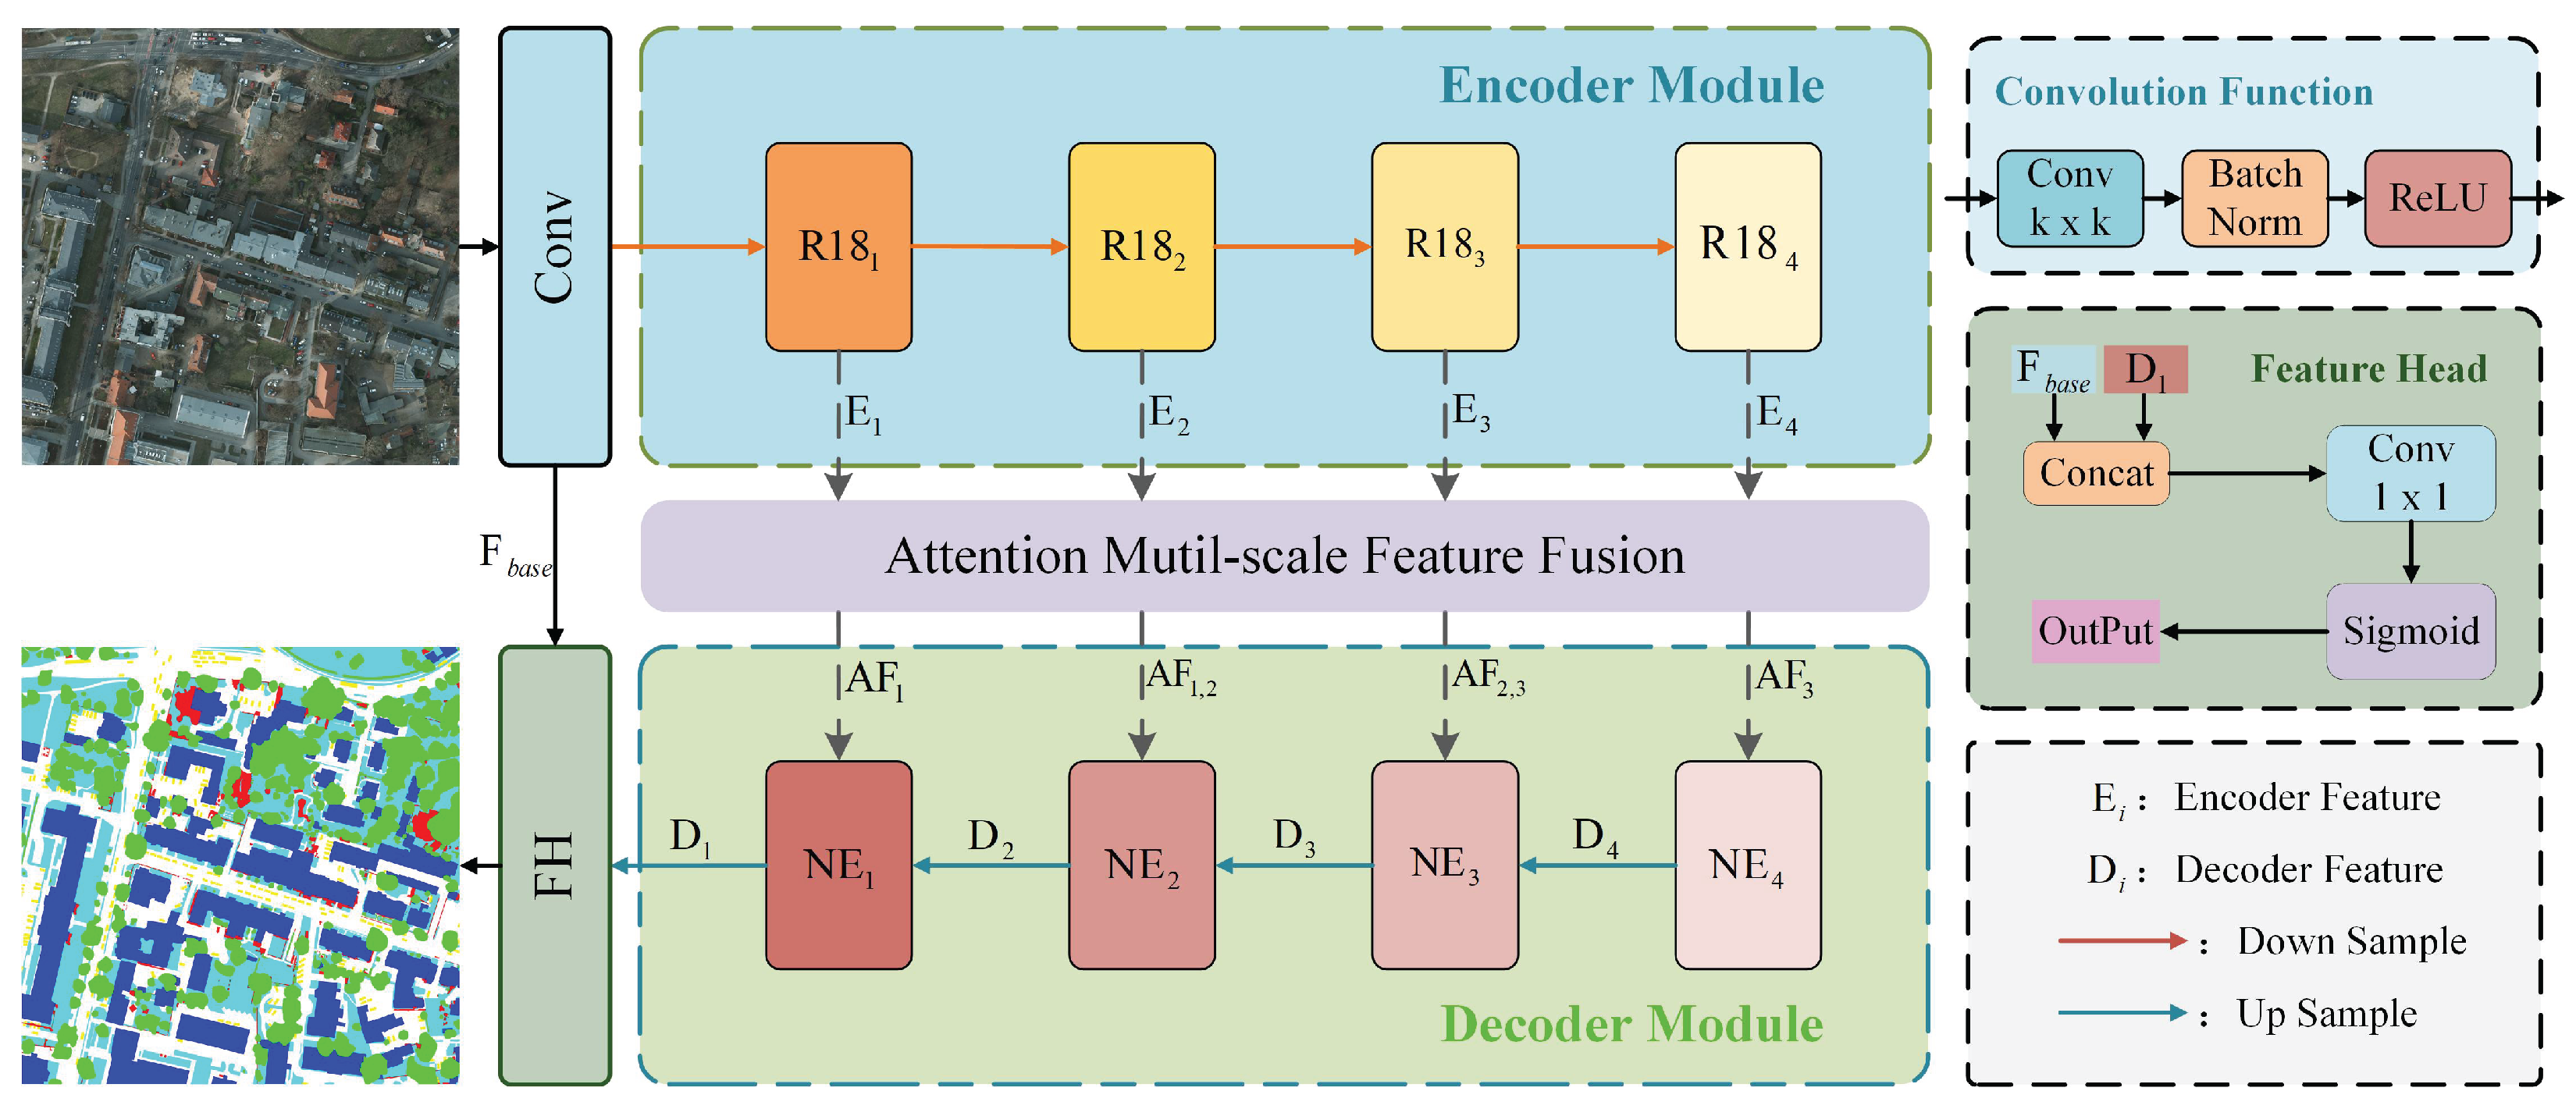
The study utilizes the U-Net architecture and is designed to efficiently perform semantic segmentation of remote sensing images. As illustrated in Figure 1, the proposed AFNE-Net is composed of three primary components: an encoder module, an feature fusion module, and a decoder module. The decoder incorporates three neighborhood feature enhancement modules, which focus on feature refinement and the enhancement of spatial semantic representation. The input is a remote sensing image P R 3 × H × W . ResNet-18(R18) [36] is used to extract feature vectors { E i } i = 1 4 at different resolutions. The AF module fuses features from neighboring resolutions, enhancing interactions between layers and improving semantic relevance. The fused features are finally passed to the decoder, which strengthens the feature representations based on neighborhood expression consistency. This effectively reduces mis-segmentation caused by local pixel interference. Each component will be described in detail in the following subsections.

3.1. Encoder Module

The encoder is able to project low-variance RGB information into a high-dimensional space, enabling the discriminative representation of different semantic categories in the image. This study uses the U-Net backbone to build the encoder, which consists of four feature encoding modules. Each feature encoding module performs downsampling at a rate that is twice that of the preceding layer. This process is intended to expand the receptive field of the network and establish the foundation for capturing semantic correlations between categories.
R18 is a residual-based feature encoding network, showing high efficiency and accuracy in semantic segmentation tasks. This study adopts ResNet-18 as the feature encoder, aiming to extract deep feature vectors from multi-resolution images.

3.2. Attention Feature Fusion Module

Remote sensing images cover large areas and contain various object types with inconsistent sizes. To effectively represent target features at different scales, it is essential to enhance the feature representation capability of the network from a multi-scale perspective. This helps deal with challenges like feature blurring and semantic ambiguity caused by scale variations. The proposed module introduces diverse weighting matrices to increase the saliency of feature vectors. Additionally, a residual structure is incorporated to preserve fine-grained details. These improvements collectively enhance the precision of the model in segmentation tasks.
As shown in Figure 2, the multi-scale feature fusion module proposed in this paper consists of three AF modules, which are designed to replace traditional feature fusion and transmission mechanisms. Feature maps { E i } i = 1 , , 5 from different levels are input to the corresponding AF module. In order to achieve multi-scale feature fusion, the low-resolution features are first upsampled to match the spatial dimensions of the high-resolution features. Subsequently, these elements are amalgamated as inputs to the fusion process. Finally, the fused feature maps are transmitted to the NE module.
As shown on the right side of Figure 2, a detailed view of the AF module is presented. The low-resolution map E i + 1 and the high-resolution feature map E i capture different scale representations of the image. Multi-resolution features help build semantic connections and improve the accuracy of feature descriptions. Firstly, a convolution operation is applied to project the input features into a unified feature space, as shown in the following equation:
f Q = C o n v 1 × 1 ( U S ( E i + 1 ) ) ;
f K = C o n v 1 × 1 ( U S ( E i + 1 ) ) ;
f V = C o n v 1 × 1 ( E i )
where U S ( · ) denotes the upsampling operation used to match the spatial dimensions. C o n v 1 × 1 ( · ) represents a convolution operation with a 1 × 1 kernel. f Q and f K are the feature maps after matching the channel dimensions.
Then, a feature similarity matrix is computed to enhance the global perception of the features. Meanwhile, the differences among multi-level features are used to estimate the confidence, reducing the weights of features with large representation differences. The following is a detailed description of the process:
W i = S o f t m a x ( f Q × f K T ) ;
W j = S o f t m a x ( f V · f K )
where S o f t m a x ( · ) is the vector normalization function, W i is the attention score matrix, W j is the confidence matrix, ( × ) denotes matrix multiplication, and ( · ) denotes the dot product.
Subsequently, the low-resolution feature is multiplied by the attention score matrix to obtain the feature association vector. Meanwhile, the high-resolution feature is point-wise multiplied by the confidence matrix, weighting the features based on the similarity across multiple scales. This promotes consistent expression across layers and reduces feature diversity. Next, the two types of features are concatenated and fused through a convolution operation. A residual connection is introduced to combine the fused result with the high-resolution feature map, preserving fine-grained details and further enhancing multi-scale feature fusion. More information is provided below:
f i = W i × f Q ;
f j = f V W j ;
A F i = C o n v 1 × 1 ( C o n c a t ( f i , f j ) ) + E i
where C o n c a t ( · ) is the feature concatenation function, and ( ) denotes the Hadamard product.

3.3. Feature Enhance Decoder

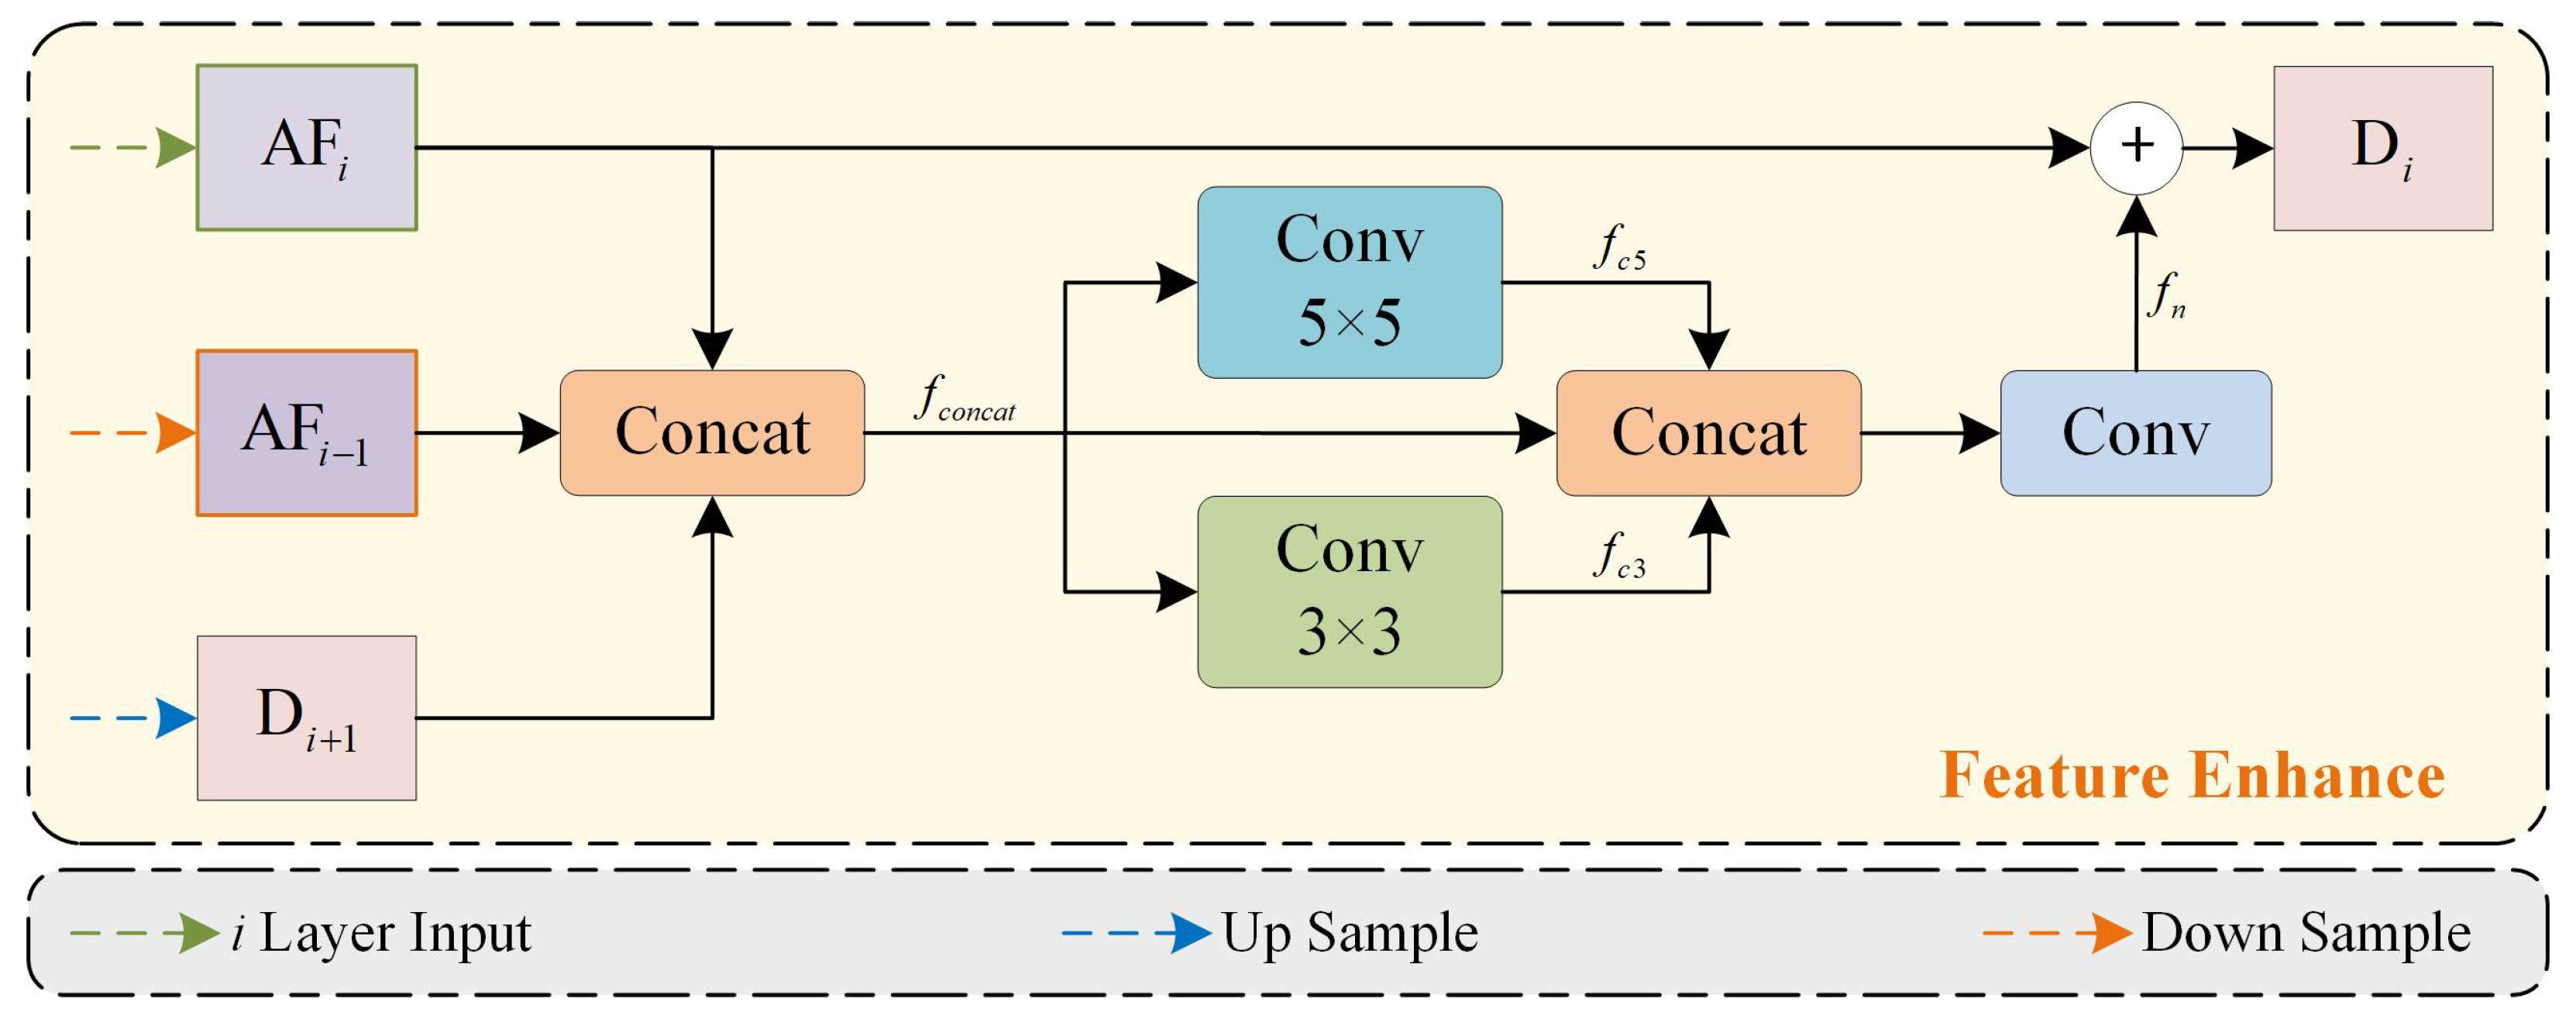
Due to the wide coverage of images, factors such as surface aging, lighting variations, and shadows can cause significant local differences in the same object at the different images. Convolution operations have been demonstrated to be effective in capturing the spatial relationships between neighbors. This capability contributes to enhancing the modeling of neighborhood consistency. In this study, a feature enhancement method is proposed. This method is based on the principle of neighborhood consistency, which helps mitigate the impact of local disturbances on results.
As shown in Figure 3, this module uses neighborhood consistency based on multi-scale features to smooth local differences and avoid interference from local noise. Additionally, residual operations maintain strong high-resolution representations, which ensure clear segmentation boundaries.
Firstly, the low-resolution decoding feature D n 1 is concatenated with the adjacent multi-scale features A F n and A F n + 1 . This is expressed as follows:
f c o n c a t = C o n c a t ( A F i , A F i + 1 , D i + 1 )
Then, f c o n c a t is passed through different kernel sizes for feature smoothing. This considers neighborhood feature representations under different receptive fields and helps mitigate feature ambiguity caused by noise interference. This process can be expressed as follows:
f c 3 = C o n v 3 × 3 ( f c o n c a t ) ;
f c 5 = C o n v 5 × 5 ( f c o n c a t )
where C o n v 3 × 3 denotes a convolution operation with a 3 × 3 kernel, and C o n v 5 × 5 represents a convolution operation with a 5 × 5 kernel.
Next, adjacent expressions are used as guidance. Multi-neighborhood features are then integrated to correct local errors. Finally, residual operations are applied to ensure accurate segmentation boundaries. The specific operations are as follows:
f n = C o n v 1 × 1 ( C o n c a t ( f c o n c a t , f c 3 , f c 5 ) ) ;
D i = A F i + f n

3.4. Loss Function

This study uses cross-entropy [37] and Dice loss [38] to measure the difference between the predictions of the model and the ground truth. In this paper, the weights α and β are both set to 1. This can be expressed as follows:
L L o s s = α L C E + β L D i c e
The goal of cross-entropy loss is to minimize the negative log difference between the true labels and the predicted probabilities of the model. Cross-entropy loss for multi-class classification is defined as follows:
L C E = i = 1 C y i log ( p i )
where C represents the number of classes in the dataset. p i is the predicted probability for the i-th class at a given pixel. y i is the corresponding ground truth.
The purpose of Dice loss is to make the predicted semantic area closely match the ground truth (GT). This helps effectively address the class imbalance issue in the scene. Dice loss is defined as follows:
L D i c e = 1 C i = 1 C 1 2 p i y i p i + y i
where p i represents the total area of the predicted semantic class, and y i is the corresponding ground truth.

4. Experiments

4.1. Experiment Settings

All experiments were implemented using PyTorch 2.0 and trained on a single NVIDIA RTX 4090 GPU (NVIDIA Corporation, Santa Clara, CA, USA). The Adam [39] optimizer was adopted with an initial learning rate of 1 × 10 3 , and the weight decay parameter was set to 0.01. Convolution operations used default settings, with a kernel size of 1 and a stride of 1. The proposed method is evaluated on three datasets: ISPRS Potsdam, UAVid, and LoveDA. During training, all datasets underwent data augmentation techniques, including random rotation, vertical flipping, cropping, and scaling [40]. Each dataset was trained for 100 epochs with a batch size of 4. For performance evaluation, we employed the F1-score, intersection over union (IoU), and overall accuracy (OA) as evaluation metrics.

4.2. Dataset Description

4.2.1. ISPRS Potsdam Dataset

The ISPRS Potsdam dataset [41] consists of 38 aerial remote sensing images of the city of Potsdam, Germany. Each image has a resolution of 0.05 m and a pixel size of 6000 × 6000 . The training set consists of 23 images, while the remaining images are used as the test set. The images cover a wide area with different land cover categories, which are classified into six types: pavement, trees, low vegetation, buildings, cars, and clutter. The dataset contains a digital surface model (DSM) and true orthophoto (TOP) images with three spectral channel combinations: IR-R-G, R-G-B, and R-G-B-IR. In this study, only RGB channel images are used, while other spectral channels and DSM data are excluded. All images are divided into patches of size 1024 × 1024 for model training and testing.

4.2.2. UAVid Dataset

The UAVid dataset [42] contains images of urban environments captured by UAVs from an oblique perspective. The samples cover typical urban elements, and include six semantic categories: buildings, transportation networks, vegetation, vehicles, pedestrians, and urban facilities. Among them, 200 images are used for training, 70 for validation, and 120 for testing. The images are in 3840 × 2160 and 4096 × 2160 pixel formats. In this study, they are uniformly divided into 1024 × 1024 pixel patches as input. Compared to top-view images, this dataset provides more detailed descriptions of small-scale samples in urban environments and more diverse structural representations of urban scenes, making it suitable for testing the generalization of networks.

4.2.3. LoveDA Dataset

The LoveDA dataset [43] represents the geomorphic characteristics of major Chinese cities such as Nanjing, Changzhou, and Wuhan. It consists of satellite remote sensing images with a resolution of 0.3 m, with a total of 5987 images. Among them, 2522 images are used for training, 1669 for validation, and 1796 for testing. Each image has a size of 1024 × 1024 pixels. The dataset is mainly divided into two categories: urban and rural areas. Urban regions contain dense human-made structures with diverse colors, but the object sizes are generally small. In contrast, rural areas include natural environments with more uniform color tones and larger object scales. This distribution creates significant challenges for network stability. Thus, the dataset can effectively tests the model’s adaptability and robustness in different environments.

4.3. Results and Analysis

4.3.1. Experimental Results on the ISPRS Potsdam Dataset

Figure 4 shows the visualization results on the Potsdam dataset, illustrating the effectiveness of the proposed method in understanding urban scenes. Building rooftops often exhibit color inconsistencies due to material differences and lighting variations, which pose challenges for semantic segmentation. As shown in the second row of Figure 4a, the left image depicts texture inconsistencies on the rooftop. AerialFormer incorrectly classifies this area as clutter. In contrast, the proposed method accurately segments this region. It benefits from multi-scale feature representation and neighborhood constraint mechanisms, which effectively address intra-class texture interference. A similar phenomenon is observed in Figure 4b. The building rooftop on the left of the second row displays red and gray colors. Due to lighting differences, a dark region appears at the boundary between the two colors. AerialFormer misclassifies this region as low vegetation. In contrast, the proposed method correctly identifies this area, demonstrating the effectiveness and robustness of the strategy for addressing local texture variations.
Table 1 demonstrates that the proposed method achieves new state-of-the-art (SoTA) performance across multiple evaluation metrics on the ISPRS Potsdam dataset. Compared to the AerialFormer method [44] in 2024, the proposed method shows improvements of 0.3% in mF1, 0.4% in mIoU, and 0.8% in OA. In particular, the proposed method shows significant advantages in the imp. surf., building, and low veg. categories, with F1 score improvements of 0.3%, 0.2%, and 0.2%, respectively. Similarly, other categories achieve excellent results. Compared to the classic DeepLab v3 [45], the proposed method achieves improvements of 2.0% and 2.7% in the tree and clutter categories, respectively. These results fully validate the effectiveness of the proposed method in urban remote sensing scenarios, demonstrating that the network design is reasonable and has great application potential.

4.3.2. Experimental Results on the UAVid Dataset

To verify the effectiveness of our model for handling oblique photogrammetry tasks, we evaluated it on the UAVid dataset. Figure 5 illustrates the visual comparison between our method and AerialFormer. As shown in Figure 5a, several different semantic classes are distributed near the billboard. This phenomenon causes AerialFormer to misclassify them. A similar issue occurs in Figure 5c, showing that the vehicles are misclassified as buildings. Due to the high texture similarity and spatial proximity between vehicles and walls, it is difficult for models based on a single receptive field to accurately capture associations between different semantic categories. This hinders the ability to effectively address similar situations. In contrast, the proposed AF module enhances the interaction of scale-aware information, effectively alleviating issues. In Figure 5b, the tunnel area has shadows that result in local texture variations. With the incorporation of the NE module, shadow effects are significantly reduced. As a result, our method is closer to the ground truth. These results further validate the effectiveness and robustness of the method in handling complex urban remote sensing scenarios.
As shown in Table 2, the proposed method performs excellently on this dataset. Compared to the classic DeepLabv3+, the mIoU is improved by 3.2%. With respect to the current AerialFormer method, the mIoU is increased by 0.4%. Similarly, the performance on the building, road, and tree categories increases by 0.8%, 0.7%, and 0.4%, respectively. This result is consistent with the performance on the Potsdam dataset, demonstrating that the proposed method has strong recognition capabilities for large objects.

4.3.3. Experimental Results on the LoveDA Dataset

As shown in Figure 6a within the red box, shadows makes the textures of the barren and agricultural areas appear darker. This reduces the distinction in color between these highly similar categories, which poses a significant challenge for the segmentation task. In this case, AerialFormer has poor discriminative capability and misclassifies the barren as agricultural. In contrast, the proposed method effectively perceives multi-scale contextual information, addressing this issue. Similarly, in Figure 6d, where buildings are adjacent to shadows, the proposed model is able to accurately capture the adjacency relationship and achieve accurate segmentation, successfully avoiding mis-segmentation. In Figure 6b,c, the proposed method shows clearer boundary details and more complete contours. These results further validate the stable generalization ability of the method across different datasets, fully demonstrating its strong practicality and robustness. To further verify the generalization and robustness, this study compares the proposed method with several excellent methods based on the LoveDA dataset. As shown in Table 3, the classical method UNet++ [63] achieves 48.2% in mIoU, while the proposed method reaches 54.8%, representing an improvement of 6.6%. Compared to the recent AerialFormer, the proposed method shows an increase of 0.7%. In this dataset, the building category still achieves the highest score. In particular, the proposed method achieves a score of 25.0% in the barren category, which is at least 4% higher than other methods. This improvement benefits from the interaction of contextual information and attention to neighborhood relationships. Surprisingly, the proposed method also achieves the best performance in the background category. This may be due to the large number of shaded areas in satellite images. These shadows reduce the representation of pixel-level detail, which decreases the complexity and variability of the background class and increases its dependence on neighborhood information. The proposed method focuses on the representation of the neighborhood and achieves a higher score as a result.

4.4. Ablation Study

To verify the effectiveness of each proposed module, ablation experiments were conducted on the ISPRS Potsdam and LoveDA datasets. Specifically, ablations were performed on the AF module and the NE module. The settings of each ablation model are described below:
  • Baseline: U-Net [24] is used as the backbone network, and the encoder is replaced by ResNet-18. The AF module is replaced by the dense skip connections of U-Net++, and the NE module is replaced by a 1 × 1 convolution operation. This method serves as the baseline model for the ablation experiments, which aim to verify the effectiveness of each module proposed in this study.
  • Only-AF: The skip connections in the baseline model is replaced with the AF module. The objective is to verify that the introduction of neighborhood graph relationships can enhance the positive representation of features within the same semantic class, improving the ability of the network to recognize objects.
  • Only-NE: The decoder module in the baseline is replaced with the NE module. The objective is to demonstrate that the incorporation of neighborhood graph relationships can augment the positive representation of features within the same semantic class, enhancing the capacity of the network to recognize objects.
  • Ours: The objective of this experiment is to verify that the proposed AF and NE are functionally complementary, demonstrating their ability to enhance the overall model performance collaboratively, rather than being functionally redundant.
To effectively evaluate the performance of each method, mIoU is used as the evaluation metric. As shown in Table 4, the Only-AF model achieved a score of 79.4% on the Potsdam dataset, reflecting improvements of 2.1% and 1.2% over the baseline and Only-NE, respectively. On the LoveDA dataset, Only-AF’s score increased by 5.6% and 2.3% compared to the baseline and Only-NE, respectively. These results demonstrate the effectiveness of the proposed modules in addressing specific challenges and improving the accuracy of semantic segmentation tasks. Moreover, Only-AF achieves a faster inference speed, which is primarily the result of removing redundant skip connections in U-Net++. Experimental results show that Only-NE performs slightly worse than Only-AF. However, combining both modules improves performance by 0.7% and 1.1%, respectively. This shows that the two modules focus on different, non-overlapping problems and work together to improve segmentation accuracy.

5. Discussion

5.1. Discussion on Computational Efficiency

To demonstrate the effectiveness of the proposed method, we conducted comparative experiments on the Potsdam and LoveDA datasets. Table 5 show that our method works well across different evaluation metrics. It achieves mIoU scores of 80.1% and 54.8% on the two datasets, respectively. These results outperform those of the classical CNN-based UNet and Transformer-based TransUnet. Compared to AerialFormer-B, our method achieves a 0.7% improvement on the LoveDA dataset. Furthermore, it offers faster inference speed. These findings strongly support the superiority of the proposed method for semantic segmentation tasks.

5.2. Discussion on Loss

In this study, a combined loss function is used. To verify the effectiveness of this combined loss, a comparative experiment was conducted using different loss function configurations:
  • Only-CE: Uses only cross-entropy loss (CE loss), which constrains the classification results of each individual pixel.
  • Only-Dice: Uses only Dice loss, which focuses on the overall region matching.
  • Ours: Uses the combined loss function, which integrates the cross-entropy loss and Dice loss, to constrain network training at both the pixel and region level.
Table 6 presents the experimental results on the Potsdam dataset. Only-CE achieves high accuracy in overall segmentation. It performs especially well on categories with many samples and consistent color patterns in the images, such as low veg. (79.7%) and tree (81.4%). However, its performance on clutter is 2.0% lower than that of Only-Dice due to fewer samples and more diverse color features. This suggests that CE loss has certain limitations when dealing with small sample sizes and complex feature classes. In contrast, Dice loss shows advantages in identifying these difficult targets and improves recognition of the clutter class due to its direct constraint on region overlap, although its overall mIoU performance is relatively lower, while the combination of CE loss and Dice loss does not achieve the highest scores for individual semantic categories, it yields the best overall segmentation performance. The combined method improves mIoU by 0.1% compared to Only-CE, and by 0.6% compared to Only-Dice. This suggests that a combined loss function improves the overall representational ability of the model. It is well suited for semantic recognition tasks in large-scale remote sensing imagery.
To further validate the above conclusions, we conducted additional experiments using the LoveDA dataset. As shown in Table 7, our method continues to perform well, achieving mIoU improvements of 0.5% and 1.1% over Only-CE and Only-Dice, respectively. It is worth noting that Only-Dice performs particularly well in the water, barren, and agriculture categories. These categories generally exhibit low texture distinctiveness in the LoveDA dataset, which often leads to weak feature representation. In such cases, the pixel-level supervision mechanism of CE loss is affected by noise and inconsistencies. In contrast, the region-level constraint of Dice loss better handles such cases and enhances segmentation performance. Conversely, pixel-level supervision is more effective for categories like forest, which exhibit distinct texture features. These findings align with the results on the Potsdam dataset and further confirm the complementary strengths of CE and Dice losses. Thus, a joint optimization strategy combining both is beneficial for improving overall semantic segmentation performance.

5.3. Discussion on Loss Hyperparameters

The weight settings of each component in the combined loss function have a significant impact on the accuracy of the network. Thus, we systematically investigate this hyperparameters in this study. Specifically, the parameter α controls the weight of the CE loss, while the parameter β represents the weight of the Dice loss. In the comparative experiments, α + β was consistently kept at 1.
As shown in Table 8 and Table 9, we analyze the impact of various weight settings on model performance. To ensure consistency and generalizability, the analysis is conducted on both the Potsdam and LoveDA datasets. On the Potsdam dataset, as the weight of β increases, the IoU scores of different semantic categories exhibit a consistent trend: the score for the clutter category gradually decreases, while the score for the low veg. category steadily increases. This trend is consistent with the analysis presented in Section 5.2. With α = 0.7 and β = 0.3 , the model achieves an mIoU of 80.6%, indicating an effective balance between CE loss and Dice loss. In contrast, on the LoveDA dataset, the optimal hyperparameter configuration is found at α = 0.6 and β = 0.4 . This difference may be attributed to the large proportion of water, barren, and agriculture categories in the dataset, which benefit more from supervision based on Dice loss. This result is also supported by the conclusions in Section 5.2. Although the configuration with α = β = 1 does not produce optimal results for each dataset, it demonstrates stable performance across multiple datasets. Therefore, this setting is adopted for the experiments in this study.

6. Conclusions

This paper proposes AFNE-Net, a novel neural network model for understanding remote sensing images. To address the challenges posed by variations in object scale and insufficient attention to local regions, the AF module is designed. This module uses a multi-resolution feature fusion strategy to create multi-scale feature representations. It also incorporates an attention mechanism to fuse global and local features, enhancing local perception. Additionally, the NE module is introduced to address local texture inconsistency caused by lighting variations, shadow interference, and internal texture differences. This module employs the principle of neighborhood consistency. By leveraging spatial similarity among pixels, the module effectively mitigates mis-segmentation caused by local texture inconsistencies, enhancing the understanding and robustness of the model in large-scale remote sensing scenes.
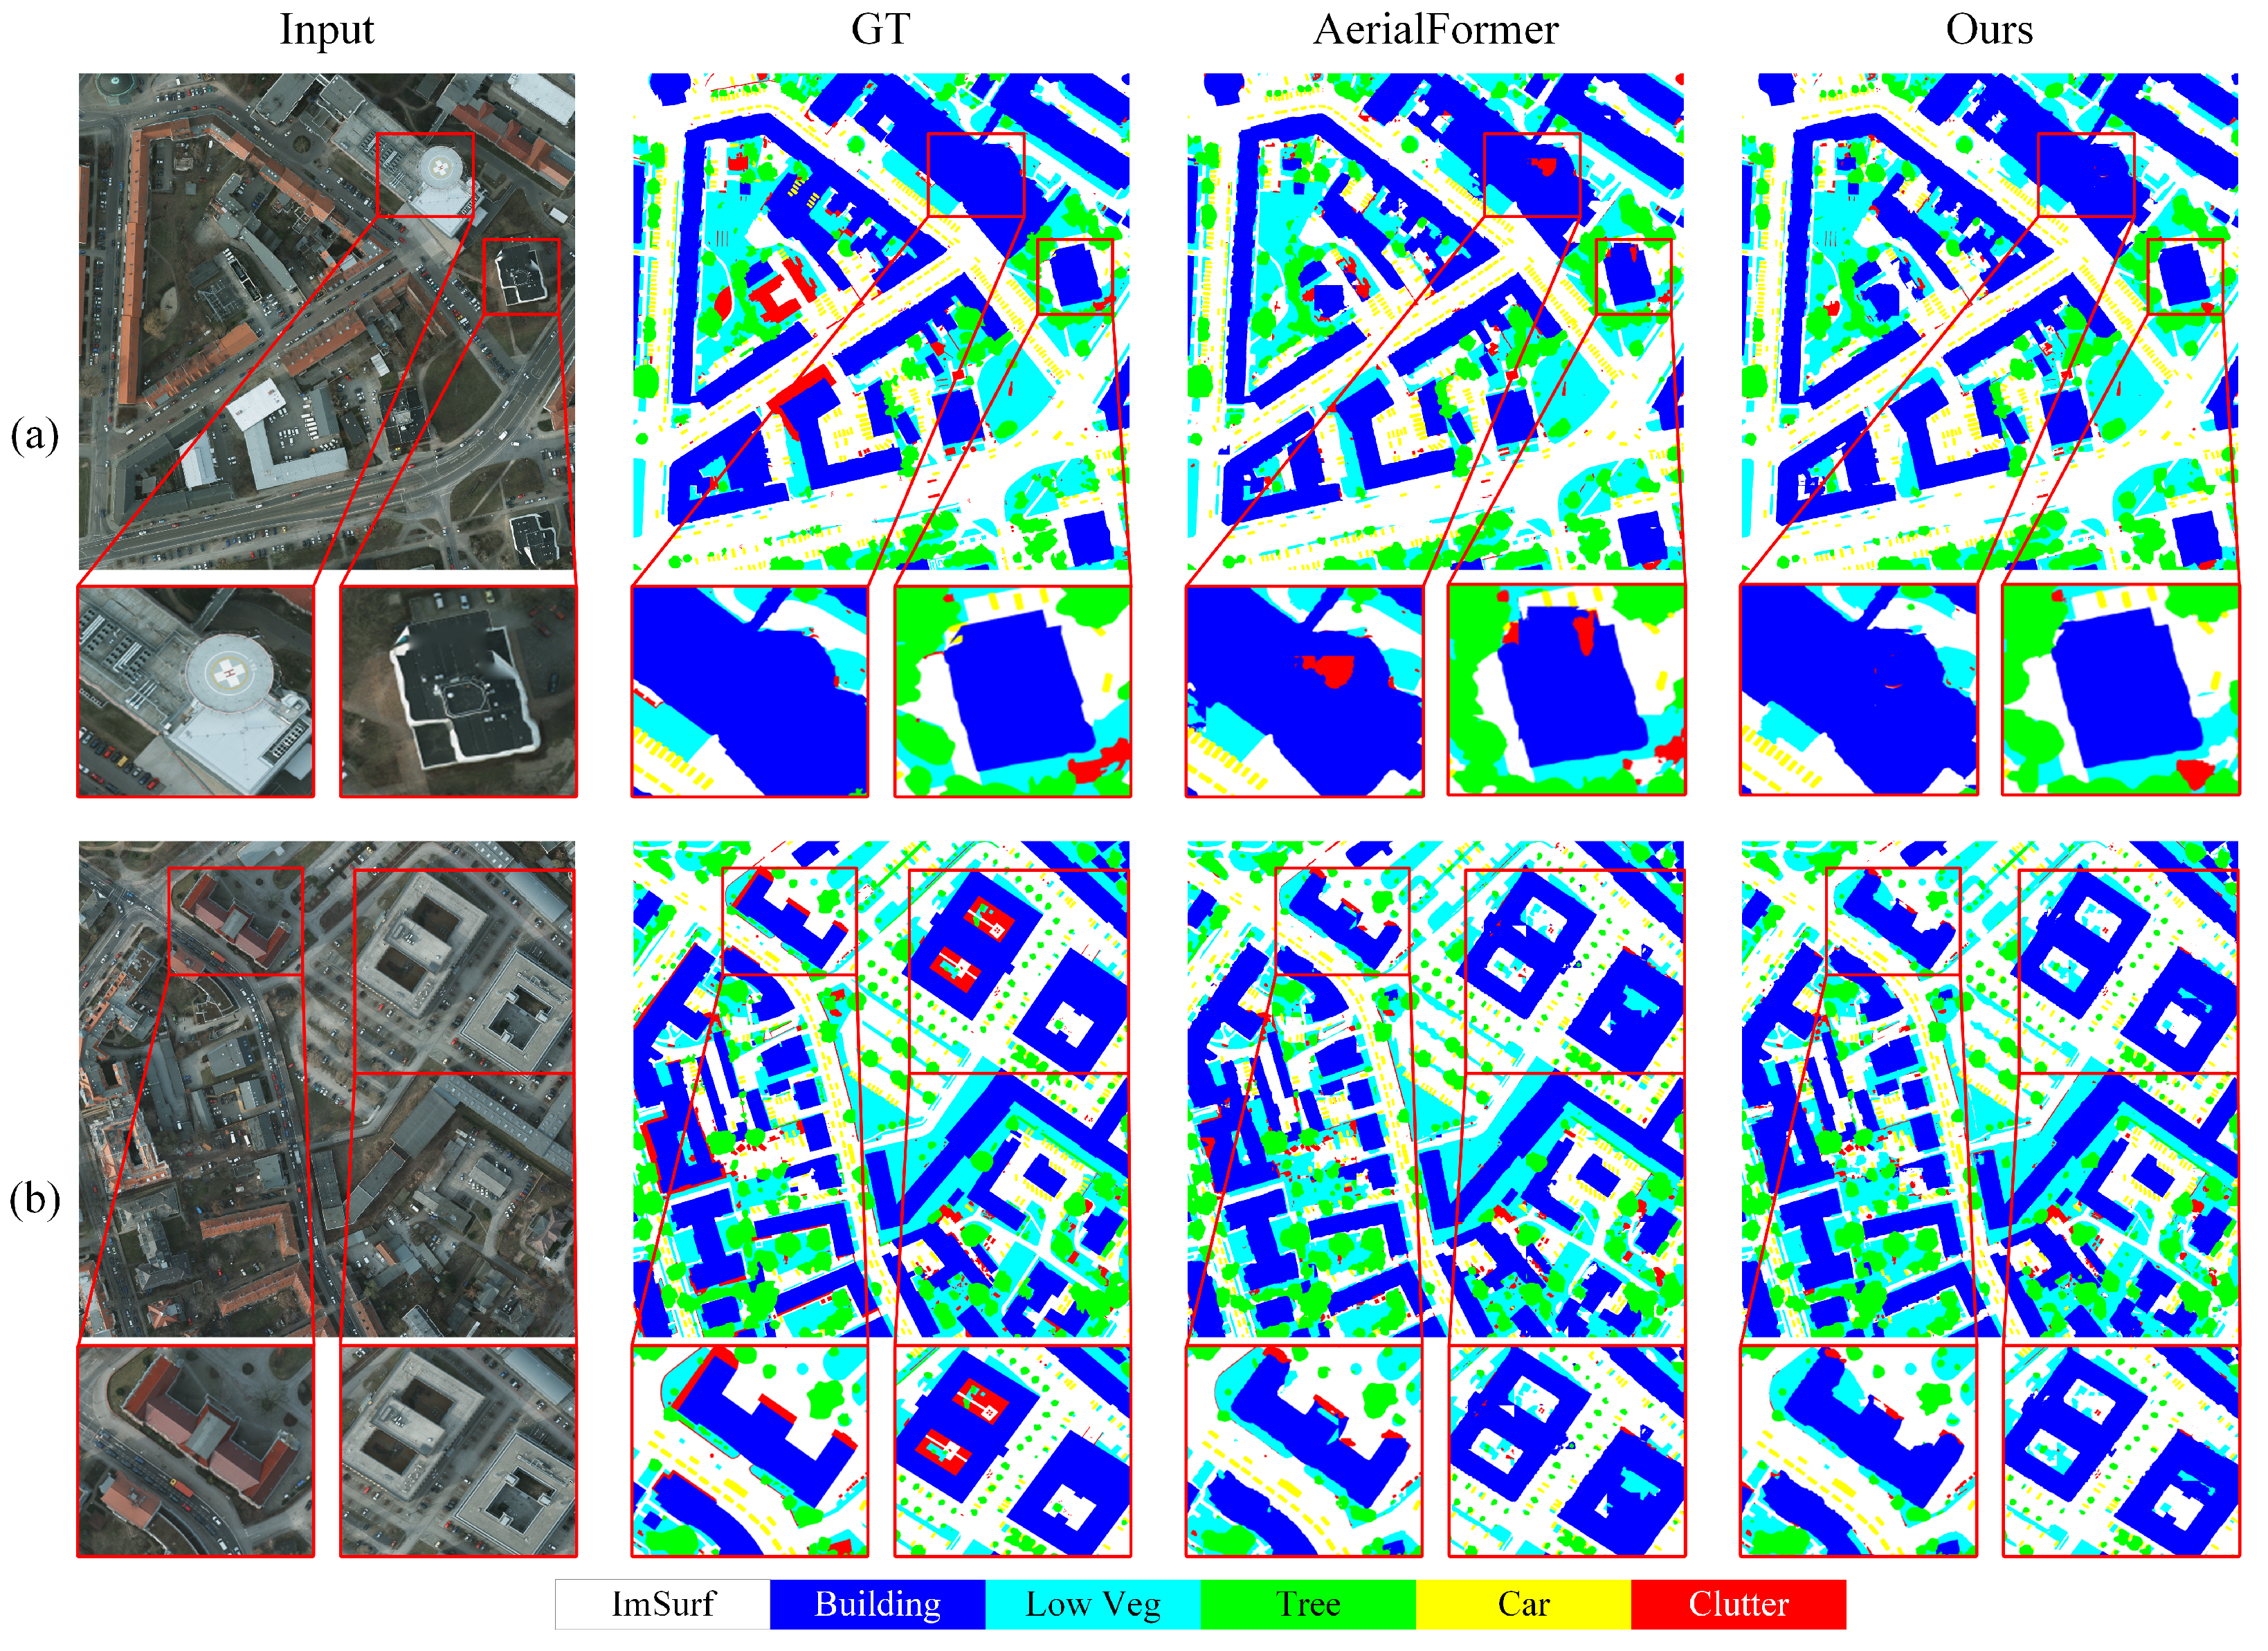
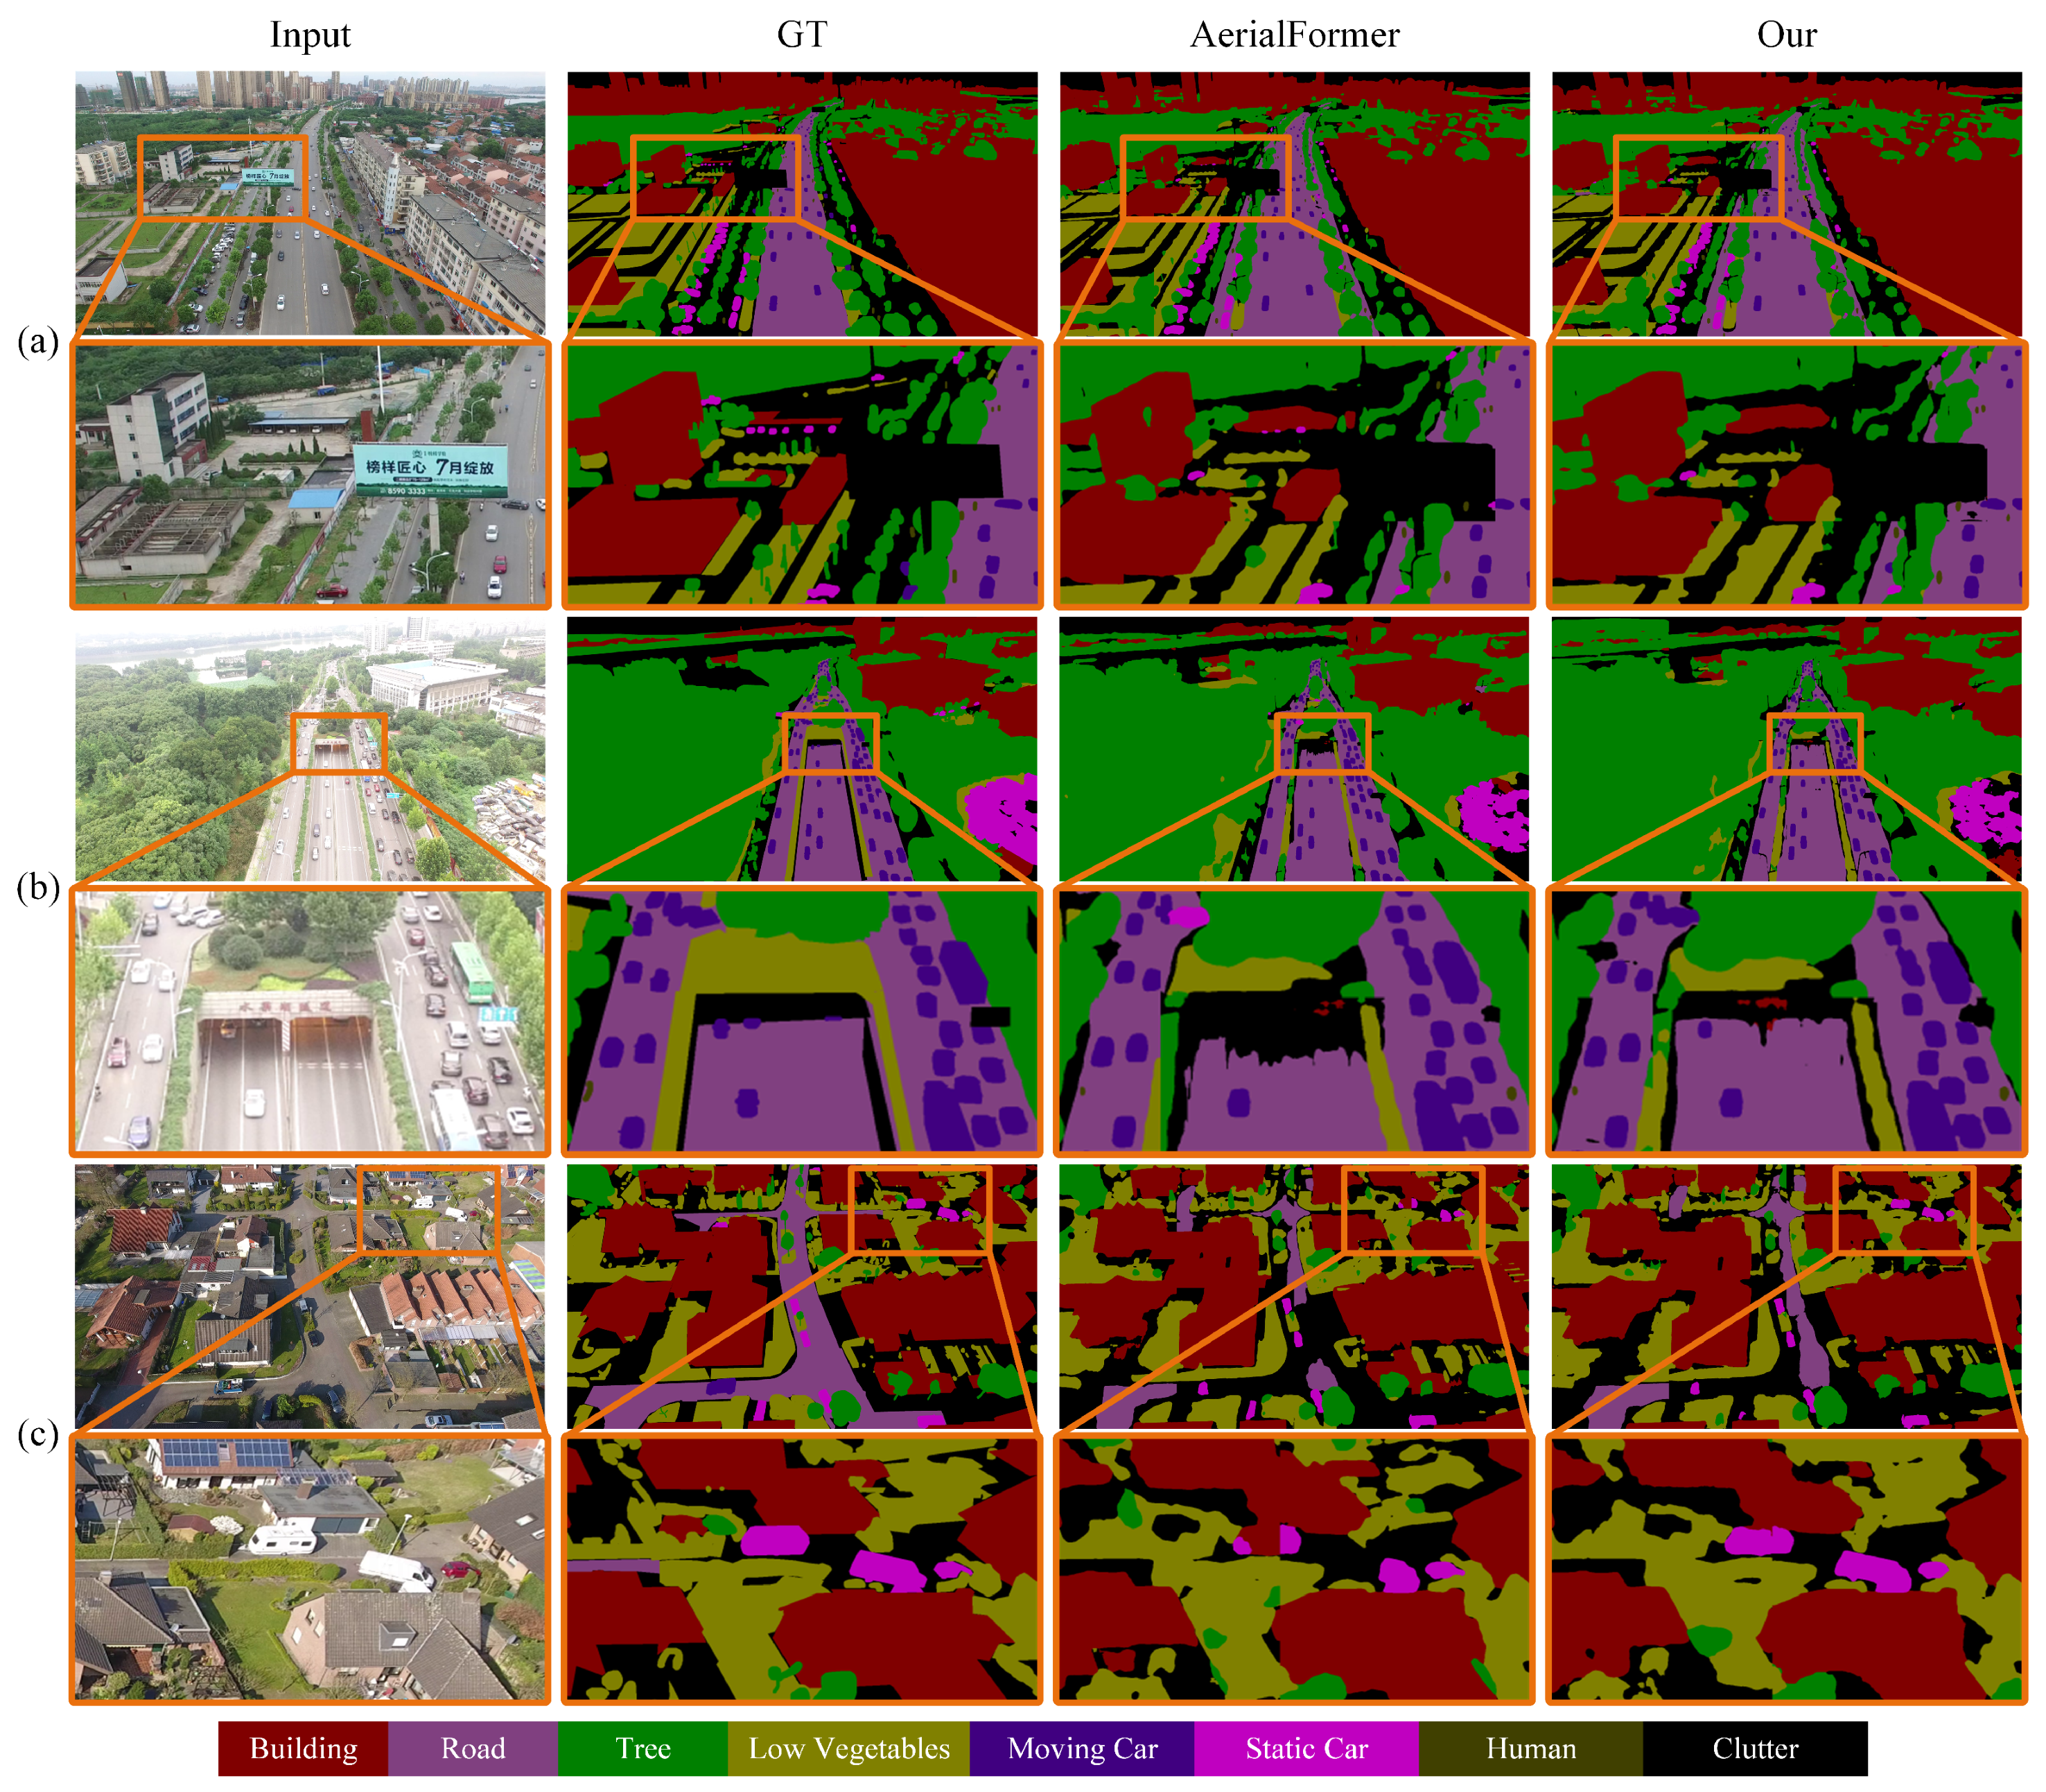
A comprehensive evaluation of AFNE-Net was conducted using three datasets: Potsdam, UAVID and LoveDA. The experimental results demonstrate that the proposed method achieves high accuracy and stability in addressing multi-class semantic regions and local mis-segmentation issues. This highlights the potential and practical value of the method in remote sensing image segmentation tasks.
In future work, we will explore lightweight improvements and introduce new strategies to expand the model’s applicability to shadow-heavy problems. These improvements will enable the model to adapt more effectively to large-scale, multi-source, heterogeneous remote sensing scenarios, expanding its range of practical applications.

Author Contributions

Conceptualization, K.L., H.J. and Z.L.; methodology, K.L., H.J. and Z.L.; software, K.L., Z.C. and C.L.; validation, K.L. and Z.C.; writing—original draft preparation, K.L. and C.L.; writing—review and editing, H.J. and Z.L.; supervision, K.L., H.J. and Z.L.; project administration, H.J. and Z.L. All authors have read and agreed to the published version of the manuscript.

Funding

This work is supported by the National Key Research and Development Program of China (NO. 2021YFC2802502).

Data Availability Statement

In this study, we used three datasets: Potsdam, UAVid, and LoveDA. The Potsdam dataset is available at the following link: https://www.isprs.org/resources/datasets/benchmarks/UrbanSemLab/2d-sem-label-potsdam.aspx (accessed on 1 May 2025). The UAVid dataset can be accessed at: https://uavid.nl/ (accessed on 1 May 2025). The LoveDA dataset is publicly available at: https://zenodo.org/records/5706578 (accessed on 1 May 2025).

Conflicts of Interest

The authors declare no conflicts of interest.

References

  1. Bastani, F.; Wolters, P.; Gupta, R.; Ferdinando, J.; Kembhavi, A. Satlaspretrain: A large-scale dataset for remote sensing image understanding. In Proceedings of the IEEE/CVF International Conference on Computer Vision, Paris, France, 2–3 October 2023; pp. 16772–16782. [Google Scholar]
  2. Hansen, M.C.; Defries, R.S.; Townshend, J.R.G.; Sohlberg, R. Global land cover classification at 1 km spatial resolution using a classification tree approach. Int. J. Remote Sens. 2000, 21, 1331–1364. [Google Scholar] [CrossRef]
  3. Ma, X.; Lian, R.; Wu, Z.; Guo, H.; Yang, F.; Ma, M.; Wu, S.; Du, Z.; Zhang, W.; Song, S. LOGCAN++: Adaptive Local-Global Class-Aware Network for Semantic Segmentation of Remote Sensing Images. IEEE Trans. Geosci. Remote Sens. 2025, 63, 4404216. [Google Scholar] [CrossRef]
  4. Li, Y.; Liu, S.; Wu, J.; Sun, W.; Wen, Q.; Wu, Y.; Qin, X.; Qiao, Y. Multi-Scale Kolmogorov-Arnold Network (KAN)-Based Linear Attention Network: Multi-Scale Feature Fusion with KAN and Deformable Convolution for Urban Scene Image Semantic Segmentation. Remote Sens. 2025, 17, 802. [Google Scholar] [CrossRef]
  5. Li, R.; Zheng, S.; Duan, C.; Wang, L.; Zhang, C. Land cover classification from remote sensing images based on multi-scale fully convolutional network. Geo-Spatial Inf. Sci. 2022, 25, 278–294. [Google Scholar] [CrossRef]
  6. Marcos, D.; Volpi, M.; Kellenberger, B.; Tuia, D. Land cover mapping at very high resolution with rotation equivariant CNNs: Towards small yet accurate models. ISPRS J. Photogramm. Remote Sens. 2018, 145, 96–107. [Google Scholar] [CrossRef]
  7. Ye, Z.; Li, Y.; Li, Z.; Liu, H.; Zhang, Y.; Li, W. Attention Multiscale Network for Semantic Segmentation of Multimodal Remote Sensing Images. IEEE Trans. Geosci. Remote Sens. 2025, 63, 5610315. [Google Scholar] [CrossRef]
  8. Li, Y.; Zhu, W.; Wu, J.; Zhang, R.; Xu, X.; Zhou, Y. DBSANet: A Dual-Branch Semantic Aggregation Network Integrating CNNs and Transformers for Landslide Detection in Remote Sensing Images. Remote Sens. 2025, 17, 807. [Google Scholar] [CrossRef]
  9. Zhao, L.; Ye, L.; Zhang, M.; Jiang, H.; Yang, Z.; Yang, M. DPSDA-Net: Dual-Path Convolutional Neural Network with Strip Dilated Attention Module for Road Extraction from High-Resolution Remote Sensing Images. Remote Sens. 2023, 15, 3741. [Google Scholar] [CrossRef]
  10. Chakraborty, D.; Deka, B. UAV sensing-based semantic image segmentation of litchi tree crown using deep learning. In Proceedings of the 2023 IEEE Applied Sensing Conference (APSCON), Bengaluru, India, 23–25 January 2023; pp. 1–3. [Google Scholar]
  11. Li, Y.; Liu, W.; Ge, Y.; Yuan, S.; Zhang, T.; Liu, X. Extracting Citrus-Growing Regions by Multiscale UNet Using Sentinel-2 Satellite Imagery. Remote Sens. 2024, 16, 36. [Google Scholar] [CrossRef]
  12. Wang, J.; Sun, K.; Cheng, T.; Jiang, B.; Deng, C.; Zhao, Y.; Liu, D.; Mu, Y.; Tan, M.; Wang, X.; et al. Deep High-Resolution Representation Learning for Visual Recognition. IEEE Trans. Pattern Anal. Mach. Intell. 2021, 43, 3349–3364. [Google Scholar] [CrossRef]
  13. Ma, J.; Liang, P.; Yu, W.; Chen, C.; Guo, X.; Wu, J.; Jiang, J. Infrared and visible image fusion via detail preserving adversarial learning. Inf. Fusion 2020, 54, 85–98. [Google Scholar] [CrossRef]
  14. Yin, P.; Zhang, D.; Han, W.; Li, J.; Cheng, J. High-Resolution Remote Sensing Image Semantic Segmentation via Multiscale Context and Linear Self-Attention. IEEE J. Sel. Top. Appl. Earth Obs. Remote Sens. 2022, 15, 9174–9185. [Google Scholar] [CrossRef]
  15. Qi, X.; Zhu, P.; Wang, Y.; Zhang, L.; Peng, J.; Wu, M.; Chen, J.; Zhao, X.; Zang, N.; Mathiopoulos, P.T. MLRSNet: A multi-label high spatial resolution remote sensing dataset for semantic scene understanding. ISPRS J. Photogramm. Remote Sens. 2020, 169, 337–350. [Google Scholar] [CrossRef]
  16. Vaswani, A.; Shazeer, N.; Parmar, N.; Uszkoreit, J.; Jones, L.; Gomez, A.N.; Kaiser, Ł.; Polosukhin, I. Attention is all you need. In Proceedings of the Annual Conference on Neural Information Processing Systems 2017, Long Beach, CA, USA, 4–9 December 2017; Volume 30. [Google Scholar]
  17. Bi, H.; Feng, Y.; Tong, B.; Wang, M.; Yu, H.; Mao, Y.; Chang, H.; Diao, W.; Wang, P.; Yu, Y.; et al. RingMoE: Mixture-of-Modality-Experts Multi-Modal Foundation Models for Universal Remote Sensing Image Interpretation. arXiv 2025, arXiv:2504.03166. [Google Scholar]
  18. Zhong, J.; Zeng, T.; Xu, Z.; Wu, C.; Qian, S.; Xu, N.; Chen, Z.; Lyu, X.; Li, X. A Frequency Attention-Enhanced Network for Semantic Segmentation of High-Resolution Remote Sensing Images. Remote Sens. 2025, 17, 402. [Google Scholar] [CrossRef]
  19. Li, X.; Xu, F.; Yu, A.; Lyu, X.; Gao, H.; Zhou, J. A Frequency Decoupling Network for Semantic Segmentation of Remote Sensing Images. IEEE Trans. Geosci. Remote Sens. 2025, 63, 5607921. [Google Scholar] [CrossRef]
  20. Wan, S.; Gong, C.; Zhong, P.; Du, B.; Zhang, L.; Yang, J. Multiscale dynamic graph convolutional network for hyperspectral image classification. IEEE Trans. Geosci. Remote Sens. 2019, 58, 3162–3177. [Google Scholar] [CrossRef]
  21. Wang, S.; Wang, Y.; Yue, J.; Liang, H.; Zhang, Z.; Li, B. UniU-Net: A Unified U-Net Deep Learning Approach for High-Precision Areca Palm Segmentation in Remote Sensing Imagery. Appl. Sci. 2025, 15, 4813. [Google Scholar] [CrossRef]
  22. Tian, X.; Bai, L.; Mo, D. A Garbage Detection and Classification Model for Orchards Based on Lightweight YOLOv7. Sustainability 2025, 17, 3922. [Google Scholar] [CrossRef]
  23. Shelhamer, E.; Long, J.; Darrell, T. Fully Convolutional Networks for Semantic Segmentation. IEEE Trans. Pattern Anal. Mach. Intell. 2017, 39, 640–651. [Google Scholar] [CrossRef]
  24. Ronneberger, O.; Fischer, P.; Brox, T. U-net: Convolutional networks for biomedical image segmentation. In Proceedings of the Medical Image Computing and Computer-Assisted Intervention—MICCAI 2015, 18th International Conference, Munich, Germany, 5–9 October 2015; Proceedings, Part III 18. Springer: Berlin/Heidelberg, Germany, 2015; pp. 234–241. [Google Scholar]
  25. Zhao, H.; Shi, J.; Qi, X.; Wang, X.; Jia, J. Pyramid scene parsing network. In Proceedings of the IEEE Conference on Computer Vision and Pattern Recognition, Honolulu, HI, USA, 21–26 July 2017; pp. 2881–2890. [Google Scholar]
  26. Hu, J.; Shen, L.; Sun, G. Squeeze-and-Excitation Networks. In Proceedings of the 2018 IEEE/CVF Conference on Computer Vision and Pattern Recognition, Salt Lake City, UT, USA, 18–23 June 2018; pp. 7132–7141. [Google Scholar]
  27. Chen, L.; Zhang, H.; Xiao, J.; Nie, L.; Shao, J.; Liu, W.; Chua, T.S. Sca-cnn: Spatial and channel-wise attention in convolutional networks for image captioning. In Proceedings of the IEEE Conference on Computer Vision and Pattern Recognition, Honolulu, HI, USA, 21–26 July 2017; pp. 5659–5667. [Google Scholar]
  28. Wang, G.; Chen, J.; Mo, L.; Wu, P.; Yi, X. Border-Enhanced Triple Attention Mechanism for High-Resolution Remote Sensing Images and Application to Land Cover Classification. Remote Sens. 2024, 16, 2814. [Google Scholar] [CrossRef]
  29. Hu, D.; Zheng, Z.; Liu, Y.; Liu, C.; Zhang, X. Axial-UNet++ Power Line Detection Network Based on Gated Axial Attention Mechanism. Remote Sens. 2024, 16, 4585. [Google Scholar] [CrossRef]
  30. Du, B.; Shan, L.; Shao, X.; Zhang, D.; Wang, X.; Wu, J. Transform Dual-Branch Attention Net: Efficient Semantic Segmentation of Ultra-High-Resolution Remote Sensing Images. Remote Sens. 2025, 17, 540. [Google Scholar] [CrossRef]
  31. Zhang, L.; Zhang, L. Artificial intelligence for remote sensing data analysis: A review of challenges and opportunities. IEEE Geosci. Remote Sens. Mag. 2022, 10, 270–294. [Google Scholar] [CrossRef]
  32. Li, J.; Cheng, S. AFENet: An Attention-Focused Feature Enhancement Network for the Efficient Semantic Segmentation of Remote Sensing Images. Remote Sens. 2024, 16, 4392. [Google Scholar] [CrossRef]
  33. Zhu, S.; Zhao, L.; Xiao, Q.; Ding, J.; Li, X. GLFFNet: Global–Local Feature Fusion Network for High-Resolution Remote Sensing Image Semantic Segmentation. Remote Sens. 2025, 17, 1019. [Google Scholar] [CrossRef]
  34. He, B.; Wu, D.; Wang, L.; Xu, S. FA-HRNet: A New Fusion Attention Approach for Vegetation Semantic Segmentation and Analysis. Remote Sens. 2025, 16, 4194. [Google Scholar] [CrossRef]
  35. Wang, X.; Fan, Z.; Jiang, Z.; Yan, Y.; Yang, H. EDFF-Unet: An Improved Unet-Based Method for Cloud and Cloud Shadow Segmentation in Remote Sensing Images. Remote Sens. 2025, 17, 1432. [Google Scholar] [CrossRef]
  36. He, K.; Zhang, X.; Ren, S.; Sun, J. Deep residual learning for image recognition. In Proceedings of the IEEE Conference on Computer Vision and Pattern Recognition, Las Vegas, NV, USA, 27–30 June 2016; pp. 770–778. [Google Scholar]
  37. Mao, A.; Mohri, M.; Zhong, Y. Cross-entropy loss functions: Theoretical analysis and applications. In Proceedings of the International Conference on Machine Learning, PMLR, Edmonton, AB, Canada, 30 June–3 July 2023; pp. 23803–23828. [Google Scholar]
  38. Li, X.; Sun, X.; Meng, Y.; Liang, J.; Wu, F.; Li, J. Dice Loss for Data-imbalanced NLP Tasks. In Proceedings of the 58th Annual Meeting of the Association for Computational Linguistics (ACL 2020), Online, 5–10 July 2020; Association for Computational Linguistics: Stroudsburg, PA, USA, 2020; pp. 465–476. [Google Scholar]
  39. Kingma, D.P.; Ba, J. Adam: A Method for Stochastic Optimization. arXiv 2014, arXiv:1412.6980. [Google Scholar]
  40. Pradeep Reddy, G.; Rohan, D.; Kareem, S.M.A.; Venkata Pavan Kumar, Y.; Purna Prakash, K.; Janapati, M. A Custom Convolutional Neural Network Model-Based Bioimaging Technique for Enhanced Accuracy of Alzheimer’s Disease Detection. Eng. Proc. 2025, 87, 47. [Google Scholar]
  41. Interational Society for Photogrammetry and Remote Sensing. 2D Semantic Labeling Contest-Potsdam. 2018. Available online: https://www.isprs.org/education/benchmarks/UrbanSemLab/ (accessed on 9 January 2025).
  42. Lyu, Y.; Vosselman, G.; Xia, G.S.; Yilmaz, A.; Yang, M.Y. UAVid: A semantic segmentation dataset for UAV imagery. ISPRS J. Photogramm. Remote Sens. 2020, 165, 108–119. [Google Scholar] [CrossRef]
  43. Wang, J.; Zheng, Z.; Ma, A.; Lu, X.; Zhong, Y. LoveDA: A Remote Sensing Land-Cover Dataset for Domain Adaptive Semantic Segmentation. In Proceedings of the Neural Information Processing Systems Track on Datasets and Benchmarks, Online, 6–14 December 2021; Vanschoren, J., Yeung, S., Eds.; Zenodo: Meyrin, Switzerland, 2021; Volume 1. Available online: https://github.com/Junjue-Wang/LoveDA (accessed on 10 July 2025).
  44. Hanyu, T.; Yamazaki, K.; Tran, M.; McCann, R.A.; Liao, H.; Rainwater, C.; Adkins, M.; Cothren, J.; Le, N. AerialFormer: Multi-Resolution Transformer for Aerial Image Segmentation. Remote Sens. 2024, 16, 2930. [Google Scholar] [CrossRef]
  45. Chen, L.C.; Papandreou, G.; Kokkinos, I.; Murphy, K.; Yuille, A.L. DeepLab: Semantic Image Segmentation with Deep Convolutional Nets, Atrous Convolution, and Fully Connected CRFs. IEEE Trans. Pattern Anal. Mach. Intell. 2018, 40, 834–848. [Google Scholar] [CrossRef]
  46. Chen, L.C.; Papandreou, G.; Schroff, F.; Adam, H. Rethinking Atrous Convolution for Semantic Image Segmentation. arXiv 2017, arXiv:1706.05587. [Google Scholar]
  47. Xiao, T.; Liu, Y.; Zhou, B.; Jiang, Y.; Sun, J. Unified Perceptual Parsing for Scene Understanding. In Proceedings of the Computer Vision—ECCV 2018, 15th European Conference, Munich, Germany, 8–14 September 2018; Proceedings, Part V. Springer: Cham, Switzerland, 2018; pp. 432–448. [Google Scholar]
  48. Chen, L.C.; Zhu, Y.; Papandreou, G.; Schroff, F.; Adam, H. Encoder-Decoder with Atrous Separable Convolution for Semantic Image Segmentation. In Proceedings of the Computer Vision—ECCV 2018, 15th European Conference, Munich, Germany, 8–14 September 2018; Proceedings, Part V. Ferrari, V., Hebert, M., Sminchisescu, C., Weiss, Y., Eds.; Springer: Cham, Switzerland, 2018; pp. 833–851. [Google Scholar]
  49. Yang, M.; Yu, K.; Zhang, C.; Li, Z.; Yang, K. DenseASPP for Semantic Segmentation in Street Scenes. In Proceedings of the 2018 IEEE/CVF Conference on Computer Vision and Pattern Recognition, Salt Lake City, UT, USA, 18–23 June 2018; pp. 3684–3692. [Google Scholar]
  50. Fu, J.; Liu, J.; Tian, H.; Li, Y.; Bao, Y.; Fang, Z.; Lu, H. Dual Attention Network for Scene Segmentation. In Proceedings of the 2019 IEEE/CVF Conference on Computer Vision and Pattern Recognition (CVPR), Long Beach, CA, USA, 15–20 June 2019; pp. 3141–3149. [Google Scholar]
  51. Li, X.; Zhong, Z.; Wu, J.; Yang, Y.; Lin, Z.; Liu, H. Expectation-Maximization Attention Networks for Semantic Segmentation. In Proceedings of the 2019 IEEE/CVF International Conference on Computer Vision (ICCV), Seoul, Republic of Korea, 27 October–2 November 2019; pp. 9166–9175. [Google Scholar]
  52. Huang, Z.; Wang, X.; Wei, Y.; Huang, L.; Shi, H.; Liu, W.; Huang, T.S. CCNet: Criss-Cross Attention for Semantic Segmentation. IEEE Trans. Pattern Anal. Mach. Intell. 2023, 45, 6896–6908. [Google Scholar] [CrossRef]
  53. Li, H.; Qiu, K.; Chen, L.; Mei, X.; Hong, L.; Tao, C. SCAttNet: Semantic Segmentation Network With Spatial and Channel Attention Mechanism for High-Resolution Remote Sensing Images. IEEE Geosci. Remote Sens. Lett. 2021, 18, 905–909. [Google Scholar] [CrossRef]
  54. Huang, Z.; Yu, Y.; Xu, J.; Ni, F.; Le, X. PF-Net: Point Fractal Network for 3D Point Cloud Completion. In Proceedings of the 2020 IEEE/CVF Conference on Computer Vision and Pattern Recognition (CVPR), Seattle, WA, USA, 13–19 June 2020; pp. 7659–7667. [Google Scholar]
  55. Xie, E.; Wang, W.; Yu, Z.; Anandkumar, A.; Alvarez, J.M.; Luo, P. SegFormer: Simple and Efficient Design for Semantic Segmentation with Transformers. In Proceedings of the Advances in Neural Information Processing Systems 34, Annual Conference on Neural Information Processing Systems 2021, NeurIPS 2021, Online, 6–14 December 2021; Ranzato, M., Beygelzimer, A., Dauphin, Y., Liang, P., Vaughan, J.W., Eds.; Curran Associates, Inc.: New York, NY, USA, 2021; Volume 34, pp. 12077–12090. [Google Scholar]
  56. Sun, L.; Zou, H.; Wei, J.; Cao, X.; He, S.; Li, M.; Liu, S. Semantic Segmentation of High-Resolution Remote Sensing Images Based on Sparse Self-Attention and Feature Alignment. Remote Sens. 2023, 15, 1598. [Google Scholar] [CrossRef]
  57. Wang, T.; Xu, C.; Liu, B.; Yang, G.; Zhang, E.; Niu, D.; Zhang, H. MCAT-UNet: Convolutional and Cross-Shaped Window Attention Enhanced UNet for Efficient High-Resolution Remote Sensing Image Segmentation. IEEE J. Sel. Top. Appl. Earth Obs. Remote Sens. 2024, 17, 9745–9758. [Google Scholar] [CrossRef]
  58. Huang, G.; Chen, D.; Li, T.; Wu, F.; van der Maaten, L.; Weinberger, K. Multi-Scale Dense Networks for Resource Efficient Image Classification. In Proceedings of the International Conference on Learning Representations, Vancouver, BC, Canada, 30 April–3 May 2018. [Google Scholar]
  59. Liu, Y.; Chen, H.; Shen, C.; He, T.; Jin, L.; Wang, L. ABCNet: Real-Time Scene Text Spotting With Adaptive Bezier-Curve Network. In Proceedings of the IEEE/CVF Conference on Computer Vision and Pattern Recognition (CVPR), Seattle, WA, USA, 13–19 June 2020. [Google Scholar]
  60. Wang, L.; Li, R.; Wang, D.; Duan, C.; Wang, T.; Meng, X. Transformer Meets Convolution: A Bilateral Awareness Network for Semantic Segmentation of Very Fine Resolution Urban Scene Images. Remote Sens. 2021, 13, 3065. [Google Scholar] [CrossRef]
  61. Wang, L.; Li, R.; Zhang, C.; Fang, S.; Duan, C.; Meng, X.; Atkinson, P.M. UNetFormer: A UNet-like transformer for efficient semantic segmentation of remote sensing urban scene imagery. ISPRS J. Photogramm. Remote Sens. 2022, 190, 196–214. [Google Scholar] [CrossRef]
  62. Li, Y.; Li, X.; Dai, Y.; Hou, Q.; Liu, L.; Liu, Y.; Cheng, M.M.; Yang, J. LSKNet: A Foundation Lightweight Backbone for Remote Sensing. Int. J. Comput. Vis. 2025, 133, 1410–1431. [Google Scholar] [CrossRef]
  63. Zhou, Z.; Rahman Siddiquee, M.M.; Tajbakhsh, N.; Liang, J. Unet++: A nested u-net architecture for medical image segmentation. In Proceedings of the Deep Learning in Medical Image Analysis and Multimodal Learning for Clinical Decision Support, 4th International Workshop, DLMIA 2018, and 8th International Workshop, ML-CDS 2018, Held in Conjunction with MICCAI 2018, Granada, Spain, 20 September 2018; Proceedings 4. Springer: Cham, Switzerland, 2018; pp. 3–11. [Google Scholar]
  64. Chaurasia, A.; Culurciello, E. LinkNet: Exploiting encoder representations for efficient semantic segmentation. In Proceedings of the 2017 IEEE Visual Communications and Image Processing (VCIP), St. Petersburg, FL, USA, 10–13 December 2017; pp. 1–4. [Google Scholar]
  65. Badrinarayanan, V.; Kendall, A.; Cipolla, R. SegNet: A Deep Convolutional Encoder-Decoder Architecture for Image Segmentation. IEEE Trans. Pattern Anal. Mach. Intell. 2017, 39, 2481–2495. [Google Scholar] [CrossRef] [PubMed]
  66. Zheng, Z.; Zhong, Y.; Wang, J.; Ma, A. Foreground-Aware Relation Network for Geospatial Object Segmentation in High Spatial Resolution Remote Sensing Imagery. In Proceedings of the 2020 IEEE/CVF Conference on Computer Vision and Pattern Recognition (CVPR), Seattle, WA, USA, 13–19 June 2020; pp. 4095–4104. [Google Scholar]
  67. Strudel, R.; Garcia, R.; Laptev, I.; Schmid, C. Segmenter: Transformer for Semantic Segmentation. In Proceedings of the 2021 IEEE/CVF International Conference on Computer Vision (ICCV), Online, 11–17 October 2021; pp. 7242–7252. [Google Scholar]
  68. Ma, A.; Wang, J.; Zhong, Y.; Zheng, Z. FactSeg: Foreground Activation-Driven Small Object Semantic Segmentation in Large-Scale Remote Sensing Imagery. IEEE Trans. Geosci. Remote Sens. 2022, 60, 5606216. [Google Scholar] [CrossRef]
  69. Xu, R.; Wang, C.; Zhang, J.; Xu, S.; Meng, W.; Zhang, X. RSSFormer: Foreground Saliency Enhancement for Remote Sensing Land-Cover Segmentation. IEEE Trans. Image Process. 2023, 32, 1052–1064. [Google Scholar] [CrossRef]
  70. Chen, Y.; Fang, P.; Zhong, X.; Yu, J.; Zhang, X.; Li, T. Hi-ResNet: Edge Detail Enhancement for High-Resolution Remote Sensing Segmentation. IEEE J. Sel. Top. Appl. Earth Obs. Remote Sens. 2024, 17, 15024–15040. [Google Scholar] [CrossRef]
  71. Wang, L.; Dong, S.; Chen, Y.; Meng, X.; Fang, S.; Fei, S. MetaSegNet: Metadata-Collaborative Vision-Language Representation Learning for Semantic Segmentation of Remote Sensing Images. IEEE Trans. Geosci. Remote Sens. 2024, 62, 5644211. [Google Scholar] [CrossRef]
  72. Yu, X.; Dai, P.; Li, W.; Ma, L.; Shen, J.; Li, J.; Qi, X. Towards Efficient and Scale-Robust Ultra-High-Definition Image Demoiréing. In Proceedings of the Computer Vision—ECCV 2022, 17th European Conference, Tel Aviv, Israel, 23–27 October 2022; Proceedings, Part XVIII. Springer: Cham, Switzerland, 2022; pp. 646–662. [Google Scholar]
  73. Chen, J.; Lu, Y.; Yu, Q.; Luo, X.; Adeli, E.; Wang, Y.; Lu, L.; Yuille, A.L.; Zhou, Y. Transunet: Transformers make strong encoders for medical image segmentation. arXiv 2021, arXiv:2102.04306. [Google Scholar]
  74. Cao, H.; Wang, Y.; Chen, J.; Jiang, D.; Zhang, X.; Tian, Q.; Wang, M. Swin-Unet: Unet-Like Pure Transformer for Medical Image Segmentation. In Proceedings of the Computer Vision—ECCV 2022, 17th European Conference, Tel Aviv, Israel, 23–27 October 2022; Proceedings, Part XVIII. Springer: Cham, Switzerland, 2023; pp. 205–218. [Google Scholar]
Figure 1. Overall architecture of our network, AFNE-Net. The network consists of four layers with feature dimensions of (32, H/4, W/4), (48, H/8, W/8), (136, H/16, W/16), and (384, H/32, W/32), respectively.
Remotesensing 17 02443 g001
Figure 2. The proposed dilated attention-based multi-scale feature fusion (AF) module.
Remotesensing 17 02443 g002
Figure 3. The proposed dilated neighborhood feature enhancement (NE) module.
Remotesensing 17 02443 g003
Figure 4. Visual comparison of AerialFormer and our method on ISPRS Potsdam. (a,b) show the selected representative samples.
Remotesensing 17 02443 g004
Figure 5. Visual comparison of AerialFormer and our method on UAVid. (ac) show the selected representative samples.
Remotesensing 17 02443 g005
Figure 6. Visual comparison of AerialFormer and our method on LoveDA. (ad) show the selected representative samples.
Remotesensing 17 02443 g006
Table 1. Quantitative comparison results on the ISPRS Potsdam dataset (%). The best results are presented in bold.
MethodYear ↑OAmIoUmF1F1
Imp. Surf.BuildingLow Veg.TreeCarClutter
FCN [23]201564.275.987.691.677.884.673.540.3
PSPNet [25]201790.177.185.692.696.282.687.593.555.4
DeepLabv3 [46]201790.077.285.692.496.082.087.194.356.7
UPerNet [47]201891.077.885.692.696.183.087.894.958.0
DeepLabv3+ [48]201890.777.185.692.296.482.687.894.855.1
DenseASPP [49]201889.673.983.090.694.480.285.091.343.2
DANet [50]201965.677.188.592.778.585.772.348.9
EMANet [51]201965.677.788.292.578.085.772.748.9
CCNet [52]201966.377.988.392.678.385.573.249.1
SCAttNet [53]202088.068.378.481.893.278.886.575.630.2
PFNet [54]202190.575.484.892.596.482.488.593.441.5
Segformer [55]202191.377.586.793.596.786.688.995.350.1
LOGCAN++ [3]202378.686.687.595.887.388.396.451.2
SAANet [56]202388.278.386.292.696.485.887.293.243.1
MCAT-UNet [57]202488.375.484.892.594.382.574.386.841.5
AerialFormer-B [44]202491.479.787.693.597.288.189.395.761.9
Ours-92.280.187.993.897.488.389.197.959.4
Table 2. Quantitative comparison results on the UAVid dataset (%). The best results are presented in bold.
MethodYear ↑mIoUBuildingRoadTreeVegetationMoving CarStatic CarHumanClutter
MSDNet [58]201857.057.079.874.074.455.962.932.119.7
DeepLabv3+ [48]201867.466.787.680.079.562.071.768.622.8
DANet [50]201964.958.977.968.361.559.647.49.160.6
ABCNet [59]202067.486.481.279.963.169.848.413.963.8
BANet [60]202166.785.480.778.962.169.352.821.064.6
SegFormer [55]202166.686.380.179.662.372.552.528.566.0
UNetFormer [61]202268.487.481.580.263.573.656.431.067.8
LSKNet-S [62]202470.084.882.980.965.576.864.931.869.6
AerialFormer [44]202470.289.082.780.864.677.567.530.770.4
Ours70.690.283.481.264.876.967.229.870.5
Table 3. Quantitative comparison results on the LoveDA dataset (%). The best results are presented in bold.
MethodYear ↑mIoUBackgroundBuildingRoadWaterBarrenForestAgriculture
FCN [23]201546.742.649.548.173.111.843.558.3
UNet [24]201547.843.152.752.873.110.343.159.9
LinkNet [64]201748.543.652.152.576.912.245.157.3
SegNet [65]201747.341.851.851.874.510.942.956.7
UNet++ [63]201848.242.952.652.874.511.444.458.8
DeeplabV3+ [48]201847.643.050.952.074.410.444.258.5
FarSeg [66]202048.243.451.853.376.110.843.258.6
Segmenter [67]202147.138.050.748.777.413.343.558.2
Segformer [55]202149.142.256.450.778.517.245.253.8
FactSeg [68]202248.942.653.652.876.916.242.957.5
UNetFormer [61]202352.444.758.854.979.620.146.062.5
RSSFormer [69]202352.452.460.755.276.318.745.458.3
LOGCAN++ [3]202353.447.458.456.580.118.447.964.8
Hi-ResNet [70]202352.546.758.355.980.117.046.762.7
MetaSegNet [71]202352.244.057.958.179.918.247.759.4
ESDNet [72]202450.141.653.854.878.719.544.258.0
AerialFormer-B [44]202454.147.860.759.381.517.947.964.0
Ours54.852.464.157.181.625.044.560.1
Table 4. Ablation study of AF and NE on the ISPRS Potsdam and LoveDA datasets.
MethodAFNEParams (M)Inference Time (s)mIoU
PotsdamLoveDA
Baseline50.60.03677.349.5
Only-AF98.30.03279.453.7
Only-NE71.40.04678.251.4
Ours106.30.04480.154.8
Table 5. A comparative analysis of model complexity and performance for different semantic segmentation methods on the Potsdam dataset is conducted. The table lists the number of model parameters (Params), computational cost (GFLOPs), inference time, and mIoU scores.
MethodYear ↑Params (M)FLOPs (GB)Inference Time (s)mIoU
PotsdamLoveDA
Unet [24]201531.0184.60.02065.547.8
TransUnet [73]202190.7233.70.02370.349.0
SwinUNet [74]202241.4237.40.02178.650.2
AerialFormer-B [44]2024113.8126.80.04779.754.1
Ours-106.3122.80.04480.154.8
Table 6. Comparison of Different Loss Functions on the ISPRS Potsdam Dataset.
MethodCEDiceImp. Surf.BuildingLow Veg.TreeCarCluttermIoU
Only-CE×87.395.179.781.495.141.080.0
Only-Dice×86.794.577.780.294.643.079.5
Ours88.394.979.080.395.942.280.1
Table 7. Comparison of Different Loss Functions on the LoveDA Dataset.
MethodCEDiceBackgroundBuildingRoadWaterBarrenForestAgriculturemIoU
Only-CE×51.263.359.279.320.847.459.554.3
Only-Dice×49.261.254.682.226.342.660.553.7
Ours52.464.157.181.625.044.560.154.8
Table 8. Comparison of Different Loss Weight Settings on the ISPRS Potsdam Dataset.
Method α β Imp.SurfBuildingLow Veg.TreeCarCluttermIoU
Method-10.60.488.094.578.680.996.642.780.2
Method-20.70.388.294.679.981.396.242.580.6
Method-30.80.286.995.179.581.193.941.879.8
Ours1.01.088.394.979.080.395.942.280.1
Table 9. Comparison of different loss weight settings on the LoveDA Dataset.
Method α β BackgroundBuildingRoadWaterBarrenForestAgriculturemIoU
Method-10.60.452.663.958.282.123.147.759.555.2
Method-20.70.350.360.858.981.622.347.260.454.6
Method-30.80.251.863.258.381.521.946.359.254.5
Ours1.01.052.464.157.181.625.044.560.154.8
Disclaimer/Publisher’s Note: The statements, opinions and data contained in all publications are solely those of the individual author(s) and contributor(s) and not of MDPI and/or the editor(s). MDPI and/or the editor(s) disclaim responsibility for any injury to people or property resulting from any ideas, methods, instructions or products referred to in the content.

