Article

Global Validation of the Version F Geophysical Data Records from the TOPEX/POSEIDON Altimetry Satellite Mission

by
Linda Forster
1,*,
Jean-Damien Desjonquères
1,†,
Matthieu Talpe
1,‡,
Shailen D. Desai
1,
Hélène Roinard
2,
François Bignalet-Cazalet
3,
Philip S. Callahan
1,
Josh K. Willis
1,
Nicolas Picot
3,
Glenn M. Shirtliffe
1 and
Thierry Guinle
3
1
Jet Propulsion Laboratory, California Institute of Technology, Pasadena, CA 91109, USA
2
Collecte Localisation Satellites (CLS), 31520 Ramonville Saint-Agne, France
3
Centre National d’Etudes Spatiales (CNES), 31401 Toulouse, France
*
Author to whom correspondence should be addressed.
Current address: European Space Agency, European Space Research and Technology Centre (ESTEC), 2201 AZ Noordwijk, The Netherlands.
Current address: Spire Global, L-2763 Luxembourg, Luxembourg.
Remote Sens. 2025, 17(14), 2418; https://doi.org/10.3390/rs17142418
Submission received: 10 May 2025 / Revised: 13 June 2025 / Accepted: 16 June 2025 / Published: 12 July 2025

Abstract

We present the validation of the latest version F Geophysical Data Records (GDR-F) for the TOPEX/POSEIDON (T/P) altimetry satellite mission. The GDR-F products represent a major evolution with respect to the preceding version B Merged Geophysical Data Records (MGDR-B) that were released more than two decades ago. Specifically, the numerical retracking of the altimeter waveforms significantly mitigates long-standing issues in the TOPEX altimeter measurements, such as drifts and hemispherical biases in the altimeter range and significant wave height. Additionally, GDR-F incorporates updated geophysical model standards consistent with current altimeter missions, improved sea state bias corrections, end-of-mission calibration for the microwave radiometer, and refined orbit ephemeris solutions. These enhancements notably decrease the variance of the Sea Surface Height Anomaly (SSHA) measurements, with along-track SSHA variance reduced by 26 cm2 compared to MGDR-B and crossover SSHA variance lowered by 1 cm2. GDR-F products also demonstrate improved consistency with Jason-1 measurements during their tandem mission phase, reducing the standard deviation of differences from 6 cm to 4 cm when compared to Jason-1 GDR-E data. These results confirm that GDR-F products offer a more accurate and consistent T/P data record, enhancing the quality of long-term sea level studies and supporting inter-mission altimetry continuity.

1. Introduction

TOPEX/POSEIDON (T/P) was the “first space mission specifically designed and conducted for studying the circulation of the world’s oceans” [1]. Its launch on 10 August 1992 marked the beginning of a continuous sea surface height (SSH) data record from space and provided sea level altimetry measurements over more than 13 years until 9 October 2005. Developed jointly by the United States National Aeronautics and Space Administration (NASA) and French Centre National d’Études Spatiales (CNES), this collaboration has continued into the most recent reprocessing and release of the version F Geophysical Data Record (GDR-F) science data products [2]. The success of T/P has led to a series of successor missions that have been launched over the past three decades, starting with Jason-1 (2001–2013) [3] and followed by Ocean Surface Topography Mission/Jason-2 (2008–2019) [4], Jason-3 (2016–present) [5], and Sentinel-6 Michael Freilich (2020–present) [6]. The next successor, Sentinel-6 B, is currently planned for launch in 2025. Each of these successor missions has been launched onto the exact same ground track established by the T/P mission, thereby providing a continuous record of sea surface height data since 1992.
The T/P mission carried the redundant (referred to as sides A and B) dual-frequency (Ku- and C-band) TOPEX altimeter as well as the single-frequency (Ku-band) POSEIDON solid state altimeter. The TOPEX and POSEIDON altimeters shared the same antenna and so were never active at the same time. The TOPEX altimeter was considered primary, while the POSEIDON altimeter was intended to demonstrate the capability of a low power and mass technology for future missions. Indeed, newer versions of the POSEIDON altimeter have been used on each of the successor missions. As a demonstration, the POSEIDON altimeter was typically active for approximately 10 percent of the time. The TOPEX side A altimeter was activated from launch and started to show signs of degradation by early 1997. This degradation was initially observed as a drift in the time series of Significant Wave Height (SWH) measurements. As noted in the GDR-F user handbook [2], a jump in the TOPEX side A calibration was observed on 1 April 1996 (cycle 130). As such, the handbook advises treating the side A data as two separate time series, “A1” from launch through 1 April 1996 and “A2” from 1 April 1996 to 10 February 1999. Comparisons with POSEIDON data reinforce the different behavior of side A before and after cycle 130, which will be shown in this study. The TOPEX side A altimeter was subsequently deactivated on 10 February 1999 and side B was used thereafter. Nevertheless, the quality of T/P SSH measurements far exceeded expectations, demonstrating the capability to observe global sea level trends from space (e.g., [7,8]). The T/P SSH measurements now serve as the anchor for over three decades of continuous global mean sea level observations from space. However, the degradation in the almost 6 years of measurements from TOPEX side A has been a source of much debate in sea level studies (e.g., [9,10]), especially as the three decades of altimetric SSH measurements are used to interpret the acceleration of the global sea level.
Until recently, the best available altimeter data from the T/P mission was released in the so-called version B Merged Geophysical Data Record (MGDR-B) (e.g., [11]). The MGDR-B products were based upon on-board estimates for the altimeter range, SWH, and backscatter coefficient (sigma0). For TOPEX, these on-board estimates were particularly impacted by the instrument degradation of the side A altimeter. Recently, the TOPEX and POSEIDON altimeter waveforms have been reprocessed on ground using the latest standards on numerical retracking algorithms for TOPEX and analytical retracking algorithms (MLE-3/MLE-4) for POSEIDON [12,13]. These new TOPEX and POSEIDON altimeter data have served as the motivation for the NASA and CNES teams to collaborate with the 2023 release of the GDR-F products. This release also takes advantage of various evolutions in the processing standards of satellite altimetry data that have occurred over the last three decades. In particular, the GDR-F products apply empirical non-parametric sea state bias models for the TOPEX altimeter that are self-consistent with the recently retracked altimeter data [14,15], the end-of-mission microwave radiometer calibrations [16] and near-land wet troposphere delay algorithm [17], recent orbit ephemeris solutions for T/P from the Goddard Space Flight Center (GSFC) (F. Lemoine, personal communication, 2023) and CNES (A. Couhert, personal communication, 2023), and the version F geophysical model standards that were applied to most of the T/P successor missions that were active at the time of the release.
The objective of this paper is to provide results from the validation of the T/P GDR-F products, with particular emphasis on the various evolutions with respect to the preceding MGDR-B products that are now almost 20 years old. We focus on quantifying the impact of each of the evolutions from the MGDR-B to the GDR-F products. The remainder of this paper is organized as follows: Section 2 provides context for our validation approach by summarizing the primary updates applied to the GDR-F product with respect to MGDR-B. Section 3 provides the validation results by assessing the impact of each of the product evolutions, including the following:
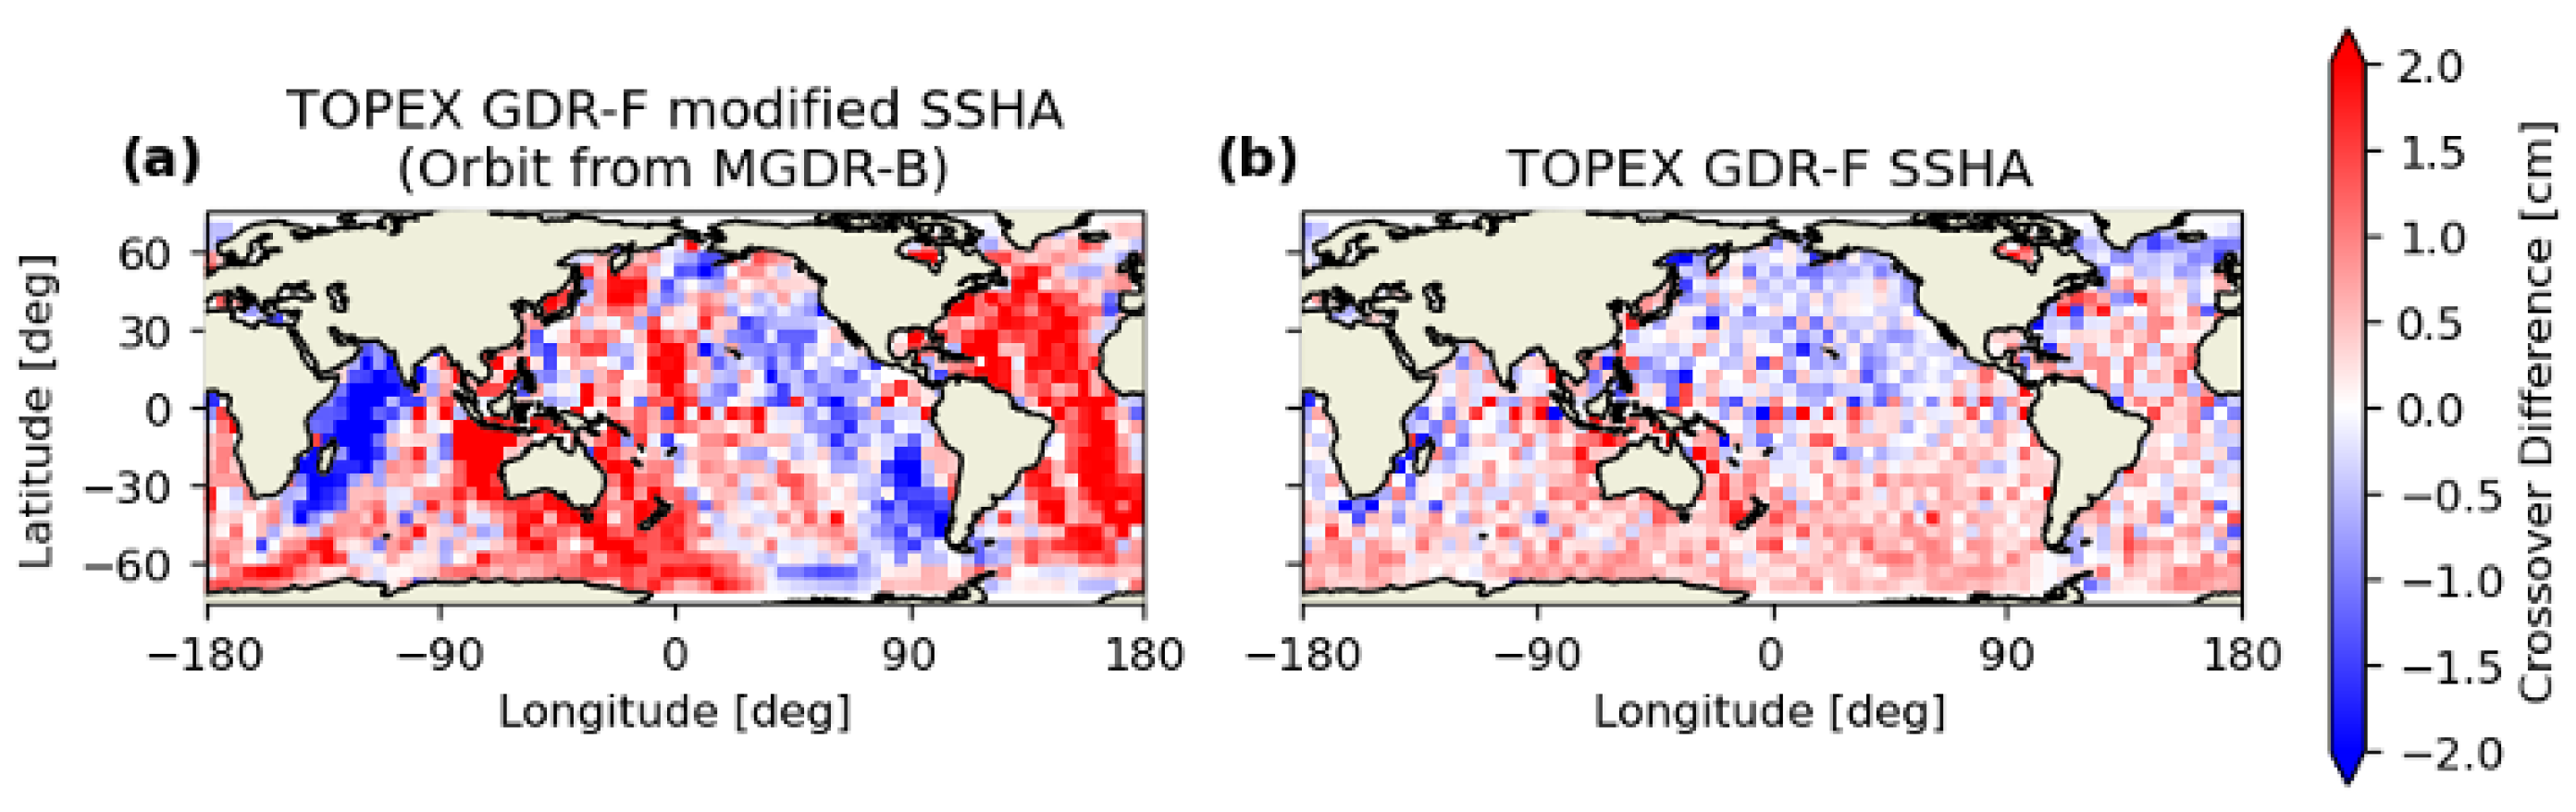
  • Sea Surface Height Anomaly (SSHA) crossover performance (Section 3.1.1);
  • SSHA along-track performance, including the impact of upgrades to modern geophysical models (Section 3.1.2);
  • Consistency of TOPEX and Jason-1 during the tandem mission (Section 3.1.3);
  • Impact of the numerical retracking on the altimeter parameters (Section 3.2);
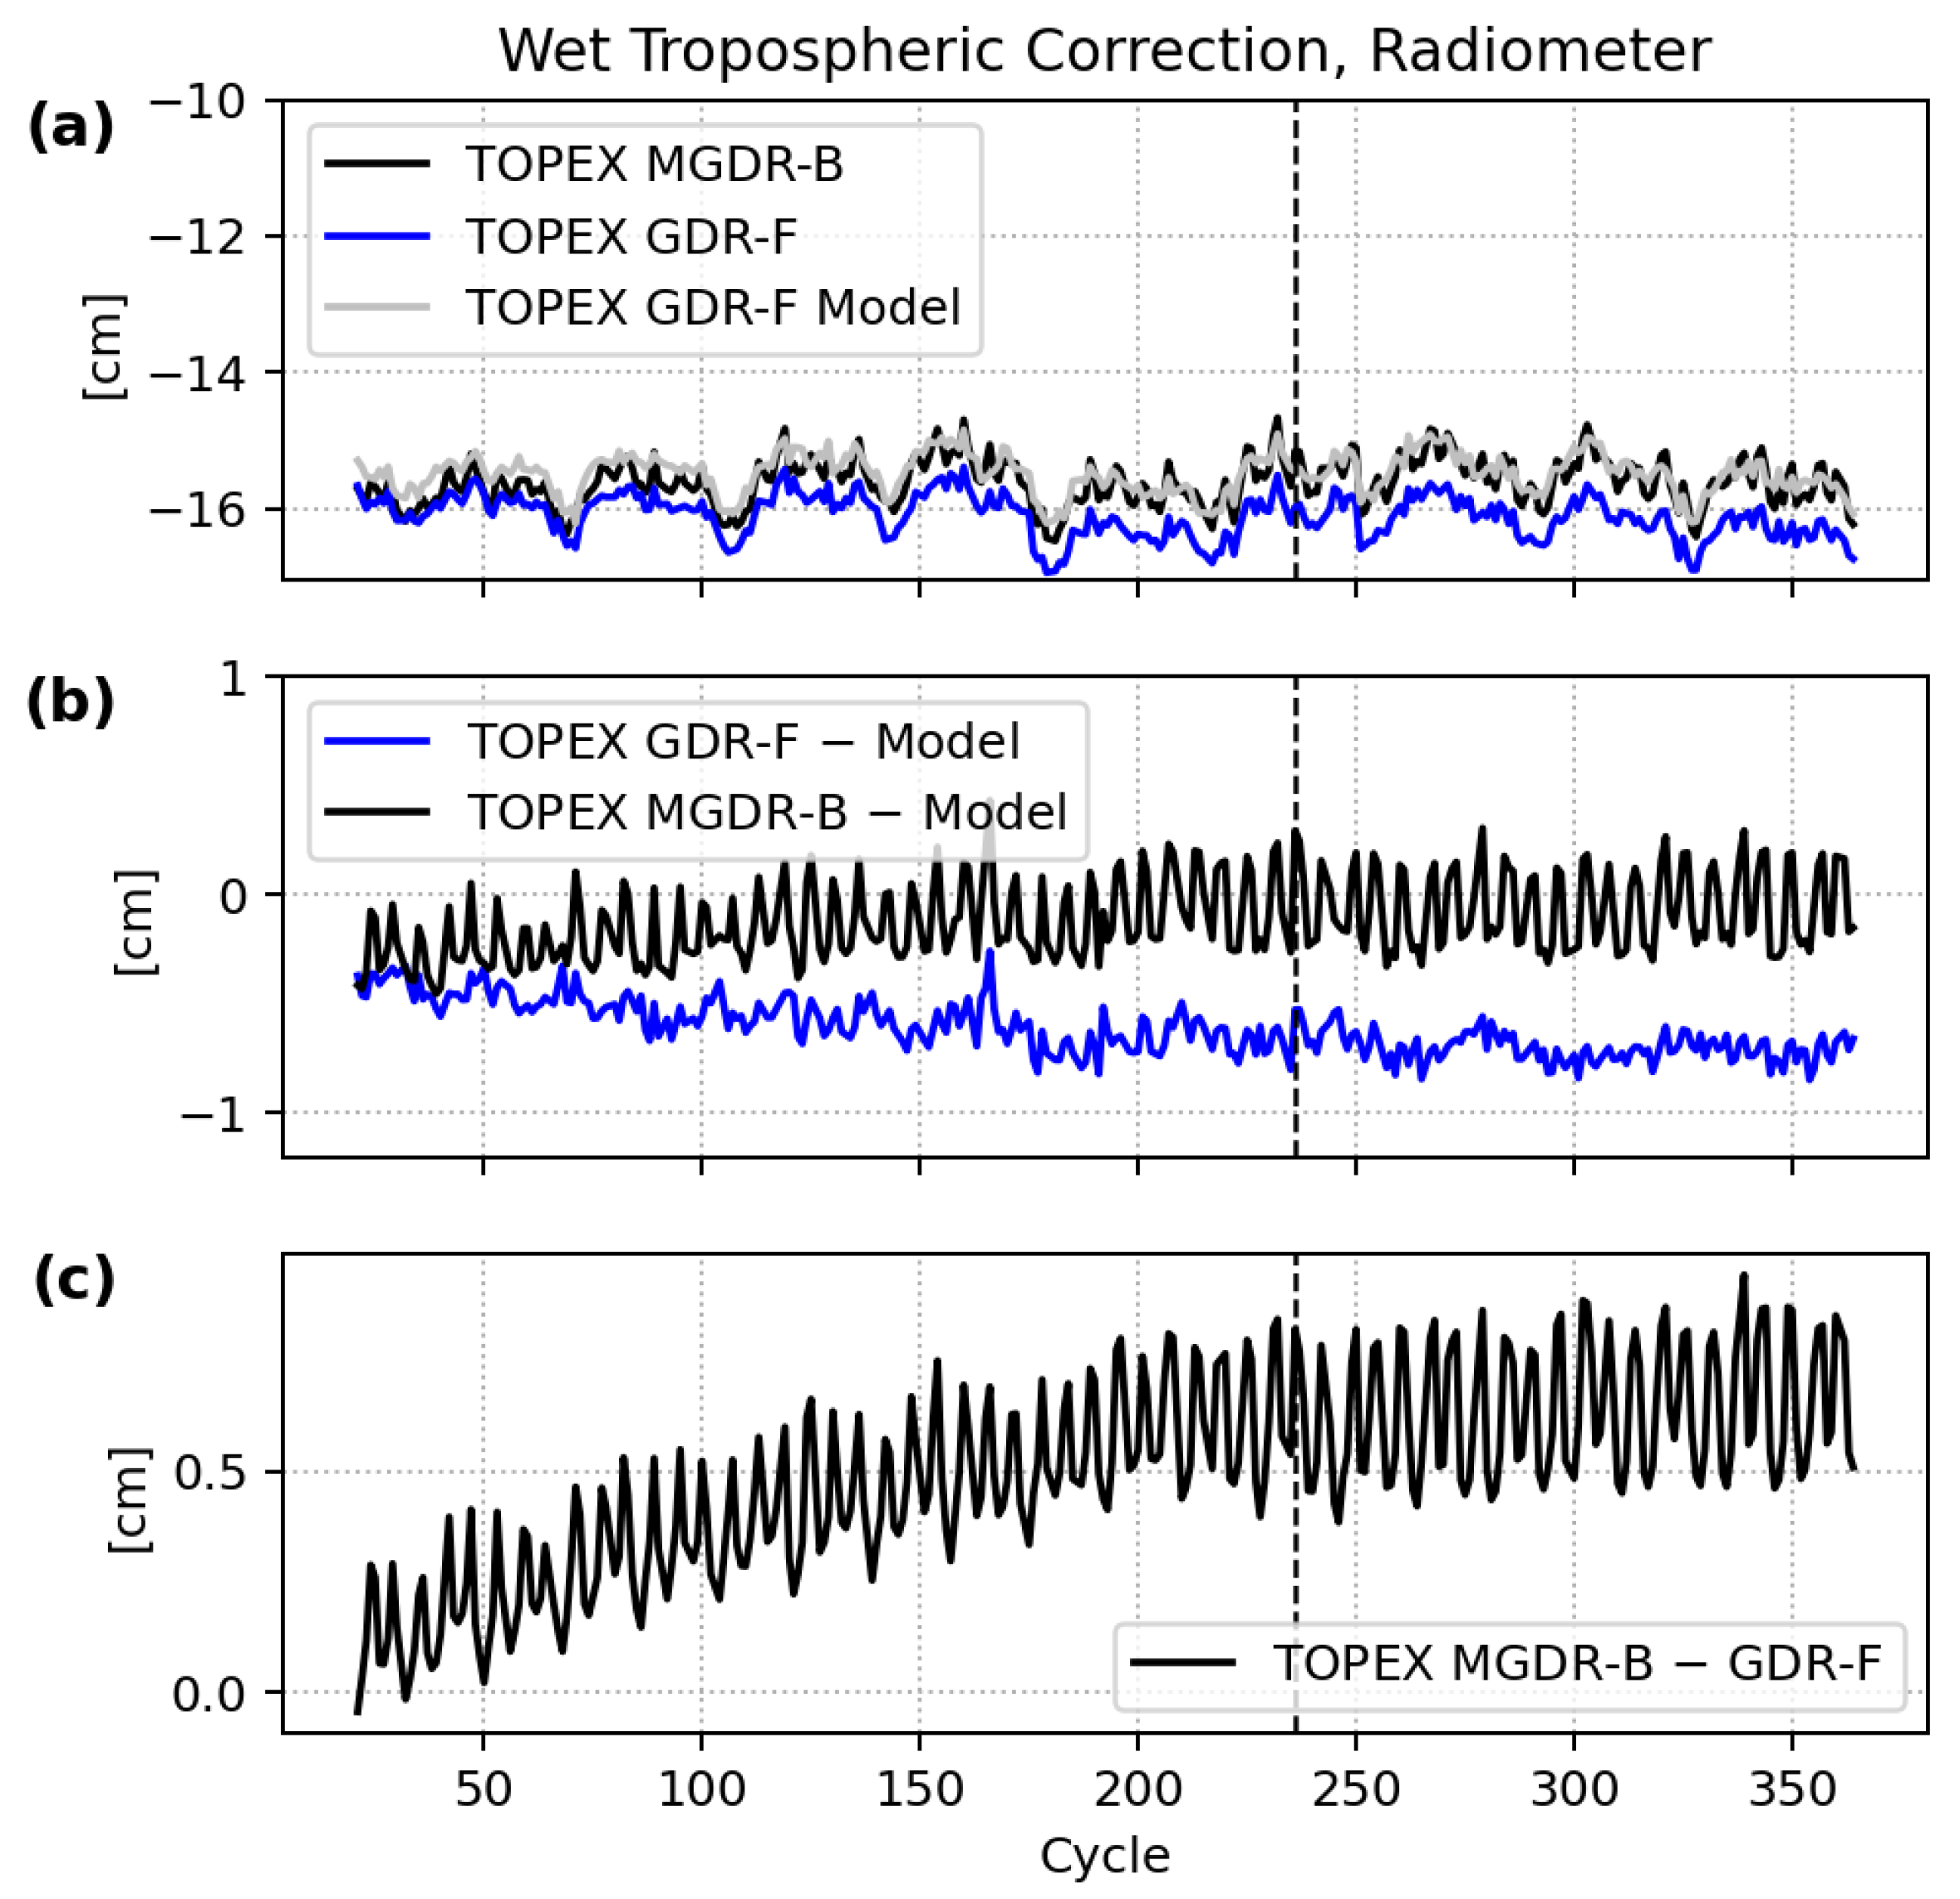
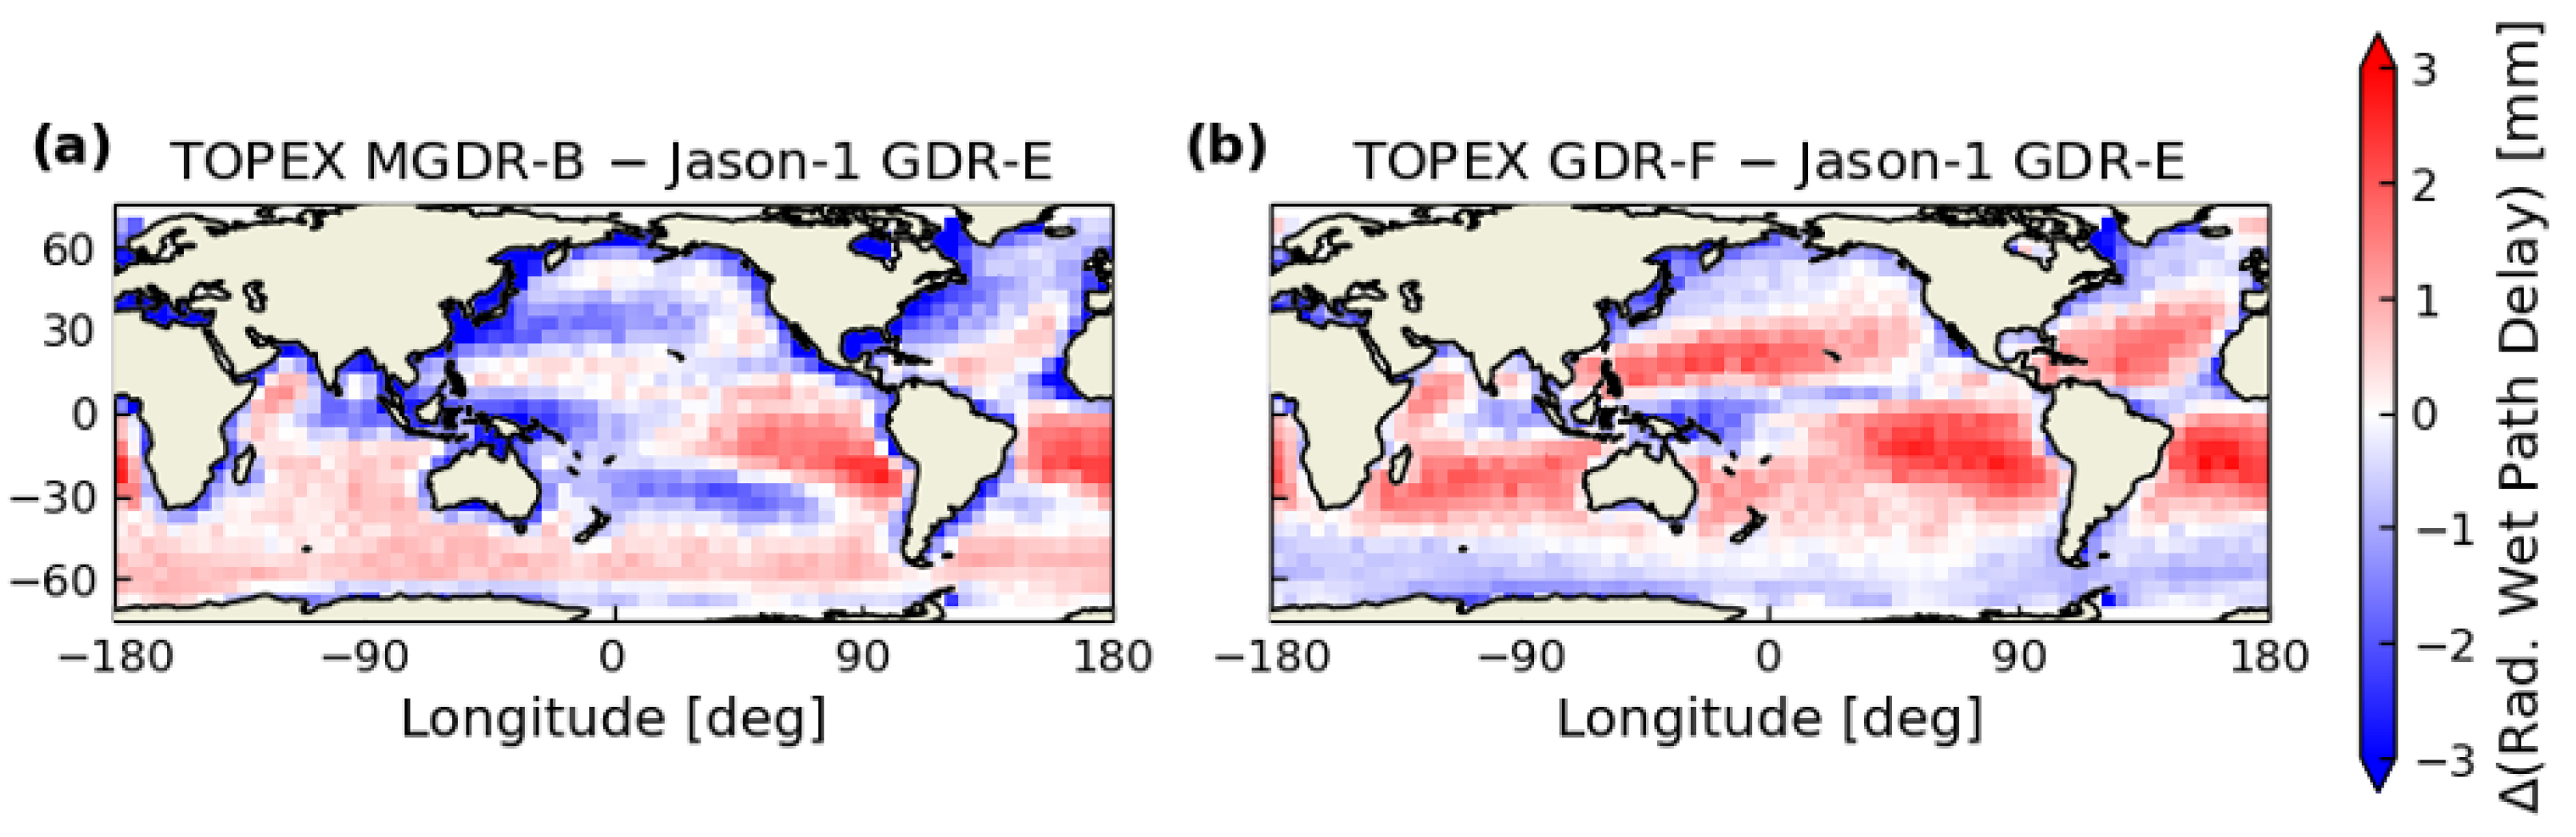
  • Impact of the re-calibrated radiometer measurements on the wet tropospheric delay correction (Section 3.4);
  • Impact of precise orbit ephemeris solutions on the SSHA performance (Section 3.5).
Section 4 summarizes the conclusions of this study.

2. The Geophysical Data Record Reprocessing and Product Updates

2.1. Geophysical Data Record–Updates and Coverage

The T/P mission was launched into an orbit whose ground track exactly repeated (to ±1 km) every 9.9156 days, with each repeat referred to as a cycle. In this study, we focus on the period after cycle 21 (9 April 1993) until Jason-1 replaced T/P in the reference ground track (11 August 2002). The first 20 cycles were affected by post-launch calibrations, periods of satellite pointing tests, and frequent switches between the TOPEX and POSEIDON altimeters. Nevertheless, the GDR-F products are available from cycle 3 onward and through the end of the mission in October 2005. These post-launch activities negatively impacted the overall data quality and caused significant gaps in the data. After cycle 21, TOPEX side A was the primary altimeter, while POSEIDON was used for approximately one complete cycle every 10 cycles. Once the drift in TOPEX side A SSHA was deemed too problematic, the redundant TOPEX side B altimeter became the primary instrument from cycle 236 onward (11 February 1999). In addition, the onset of the side A altimeter degradation split the time series into side A1 and A2 at cycle 130. Starting with cycle 344 (15 January 2002), a tandem phase with T/P’s successor Jason-1 commenced, lasting 21 cycles until the end of cycle 364 (11 August 2002). Around mid-cycle 365 (18 August 2002), T/P was maneuvered away from its historic ground track to an interleaved ground track as Jason-1 took over as the new reference mission on the historic ground track. T/P reached its interleaved orbit around mid-cycle 368 (14 September 2002), where it remained for another 113 cycles until the end of the mission on cycle 481 in October 2005.
The GDR-F product was generated from TOPEX and POSEIDON Sensor Data Records (SDRs), which encapsulate data downlinked from the satellite. The data include waveforms and onboard estimates of Ku- and C-band 20 Hz ranges, as well as altimeter calibrations Cal-1 and Cal-2, which were used to retrack the echoes. Compared to the previous MGDR-B product, the GDR-F product benefits from the following:
  • Waveform retracking:
    (a)
    Ground reprocessing of the TOPEX altimeter data based on a numerical retracking of the echoes [12], with MLE-4 and MLE-3 solutions for the Ku-band and an MLE-3 solution for the C-band. This approach mitigates the impact of the altimeter degradation (especially for TOPEX side A) on the data record.
    (b)
    Ground processing of the POSEIDON altimeter data based on the retracking of the echoes, with MLE-4 and MLE-3 solutions for the Ku-band [13].
  • New orbit ephemeris solutions: Two precise orbit ephemeris (POE) solutions were computed based on best available processing standards in the 2014 International Terrestrial Reference Frame (ITRF). One POE solution was provided by NASA GSFC (F. Lemoine, personal communication, 2023) and the second was provided by CNES (A. Couhert, personal communication, 2023).
  • TOPEX microwave radiometer (TMR) data reprocessing using the best available end-of-mission calibration [16] and including a near-land wet troposphere delay algorithm [17], and more recent algorithms for atmospheric attenuation of sigma0 and associated surface type, sea ice, and rain flags.
  • New Sea State Bias (SSB): Non-parametric SSB models for the TOPEX altimeter that are self-consistent with the reprocessed data products. These include a 2-D model from [14] and a 3-D model from [15]. The parametric SSB model from [18] for the POSEIDON altimeter uses reprocessed data products as input.
  • Updated models for the geophysical and environmental corrections consistent with the GDR-F standards used by other altimeter missions when the T/P GDR-F product was released.
The individual updates from MGDR-B to GDR-F are summarized in the Appendix A in Table A1. Additional details are provided in the TOPEX/POSEIDON GDR-F Product Handbook [2]. In this study, we evaluate the impact of each of these major evolutions to the TOPEX/POSEIDON science data record.

2.2. Reprocessing Approach of the TOPEX/POSEIDON Altimetry Data Record

The new reprocessing approach of the TOPEX altimetry data features (1) the use of a numerical retracker that directly accounts for the Point Target Response (PTR) waveforms in the echo models and (2) an enhanced approach for the Cal-2 calibration echo corrections. In this section, we present a summary of this new retracking approach. A detailed description is provided in [12].
The legacy MGDR-B product relied on onboard tracking of the waveforms to extract information about the altimeter range, the Significant Wave Height (SWH), and the normalized radar reflectivity cross-section (sigma0). This approach used look-up tables for instrument corrections, which made the derived altimetry parameters prone to errors such as altimeter drift or mispointing. In contrast, the reprocessed GDR-F product uses state-of-the-art numerical retracking algorithms (e.g., [19]) that provide accurate estimates of range, SWH, and sigma0. The retracking is performed in ground post-processing directly using the waveforms available in the SDRs.
The TOPEX GDR-F product follows similar conventions as other ocean altimeter products where MLE-4 retracking is used to process the Ku-band and MLE-3 retracking is used to process both Ku- and C-band waveforms [20]. As noted in the TOPEX GDR-F User Handbook [2], the Ku-band MLE-4 parameters are recommended for most scientific studies, while the Ku-band MLE-3 parameters are provided only for specialized studies. The C-band parameters are only computed with MLE-3 retracking as the sensitivity to mispointing is reduced compared to the Ku-band.
The altimeter relies on two onboard calibration modes (Cal-1 and Cal-2) to measure, in-flight, the evolution of the instrument characteristics, which could have an impact on altimetry estimates. The idea of numerical retracking is to fully exploit the information from the altimeter calibrations and thereby better account for instrument variations as captured by the PTRs. This is a significant advantage over the more conventional retracking approaches that rely on tabulated corrections [21].
While the SWH is derived from the waveform retracking alone, the range is derived from the waveform retracking and the tracker range information from the SDR along with calibration and other instrumental corrections, such as the oscillator drift range correction and Doppler correction. The sigma0 is derived from the waveform retracking and the tracker gain information (Automatic Gain Control, or AGC) from the SDR along with the calibration and other corrections, such as the height correction to account for the influence of the satellite’s altitude on the backscatter coefficient. Furthermore, in the MLE-4 approach, the mispointing is also estimated from waveform retracking.
The first calibration mode (Cal-1) assesses the radar instrument’s measured signal corresponding to a virtual target with infinitely small dimensions (Point Target Response). The transmitted signal travels directly to the receiving path (without reflecting off the ocean) in order to measure the internal path delay, gain, and PTR waveforms. In the TOPEX altimeter reprocessing, the applied PTR is distinct for each pass and frequency band. In contrast, the legacy MGDR-B product did not use either the PTR waveforms or the Cal-1 gain for the altimetry parameter estimation.
There are two types of Cal-1 measurements: the routine Cal-1 providing PTR waveforms with a resolution of 1 point per gate and the sweep Cal-1 allowing measurements of PTR waveforms with a resolution of 64 points per gate. Cal-1 routine PTRs were performed twice a day, while sweep Cal-1 PTRs were initially not intended to be performed in-flight. Once the side A PTR degradation became noticeable, three sweep PTR measurements were performed on 7 October 1998, 15 December 1998, and 9 February 1999 before switching from the side A to the side B altimeter. After the switch to side B, sweep PTRs were collected more regularly, with a frequency of one per month until cycle 363 (1 August 2002) and one per cycle thereafter. To compensate for the lack of sweep PTRs for side A, ref. [12] reconstructed sweep PTRs combined data from the available sweep calibrations to derive PTR models and used the routine Cal-1 PTRs for interpolation.
The second calibration mode (Cal-2) assesses the transfer function filter for the instrument’s receiving path. In previous retracking efforts of TOPEX waveforms, the echo waveforms were corrected using a unique dedicated filter for sides A and B, which was averaged over the entire mission for each side. Instead, the MLE-3/4 solutions in the GDR-F product use three different time-varying filters depending on measurement conditions. Specifically, a different filter is applied to three different regimes of the altitude rate: >0 m/s when the satellite is traveling away from the equator and toward the poles and <0 m/s when it is traveling away from the poles and toward the equator. The third filter is used over the equator and at the transition between ascending and descending ground tracks near 66°N and S when the altitude rate is approximately 0 m/s. These updates resolve longstanding hemispheric discrepancies observed in MGDR-B products, especially for the altimeter’s Ku-band.
As a result of the numerical retracking, the TOPEX GDR-F product provides a larger number of good quality data points compared to the MGDR-B product, as shown in Figure 1. See the figure caption for details on defining “good quality” data points. The GDR-F product gains about 2.5% good quality altimeter data compared to MGDR-B for side A1 and 1.5% for side A2 (after cycle 130). Meanwhile, for TOPEX side B, GDR-F has approximately 1.9% more good quality data compared to MGDR-B. There are about 1003 passes where GDR-F has no available product while MGDR-B does and 68 passes where GDR-F has fewer available data records than MGDR-B. These cases are due to missing Sensor Data Records (SDRs) in the project archives.

3. Assessment of Performance Improvement for TOPEX Geophysical Data Record and Consistency with Jason-1

This section shows the performance improvement of the GDR-F product with respect to the MGDR-B product, specifically focusing on the Sea Surface Height Anomaly (SSHA) [Section 3.1], altimeter parameters derived directly from the numerical retracking [Section 3.2], comparison between TOPEX and POSDEIDON SSHA performance [Section 3.3], TMR [Section 3.4], and impact of the updated orbit ephemeris solutions [Section 3.5]. This analysis uses “good quality” data points as those over open ocean with the respective altimeter quality flags applied in each product, as described in the caption of Figure 1. In addition, thresholds based on the product values were applied according to the recommendations in the TOPEX/POSEIDON Product Handbook [2] and outliers were edited using a 5- σ confidence interval.

3.1. Performance of TOPEX Sea Surface Height Anomaly

The SSHA is derived from the orbit altitude, h Orbit , as computed from orbit ephemeris computations, the corrected altimeter range, r corr , the geophysical models, Δ h Geo , and the Mean Sea Surface, MSS.
SSHA = h Orbit r corr Δ h Geo MSS ,
where r corr is the measured altimeter range, r, corrected for delays due to the wet and dry troposphere and ionosphere ( Δ r wet , Δ r dry , Δ r iono ) as well as the Sea State Bias, SSB:
r corr = r + Δ r wet + Δ r dry + Δ r iono SSB .
The geophysical models account for the solid Earth tide ( Δ h SolidEarthTide ), the sum of the ocean tide and load tide ( Δ h OceanTide ), the internal ocean tide ( Δ h InternalTide ), the pole tide ( Δ h PoleTide ), and the dynamic atmosphere correction ( Δ h DAC ). Here, Δ h OceanTide represents the sum of the ocean and load tide and Δ h PoleTide is the sum of the body, ocean, and load pole tide, as is typically provided in ocean altimeter products.
Δ h Geo = Δ h SolidEarthTide + Δ h OceanTide + Δ h InternalTide + Δ h PoleTide + Δ h DAC ,

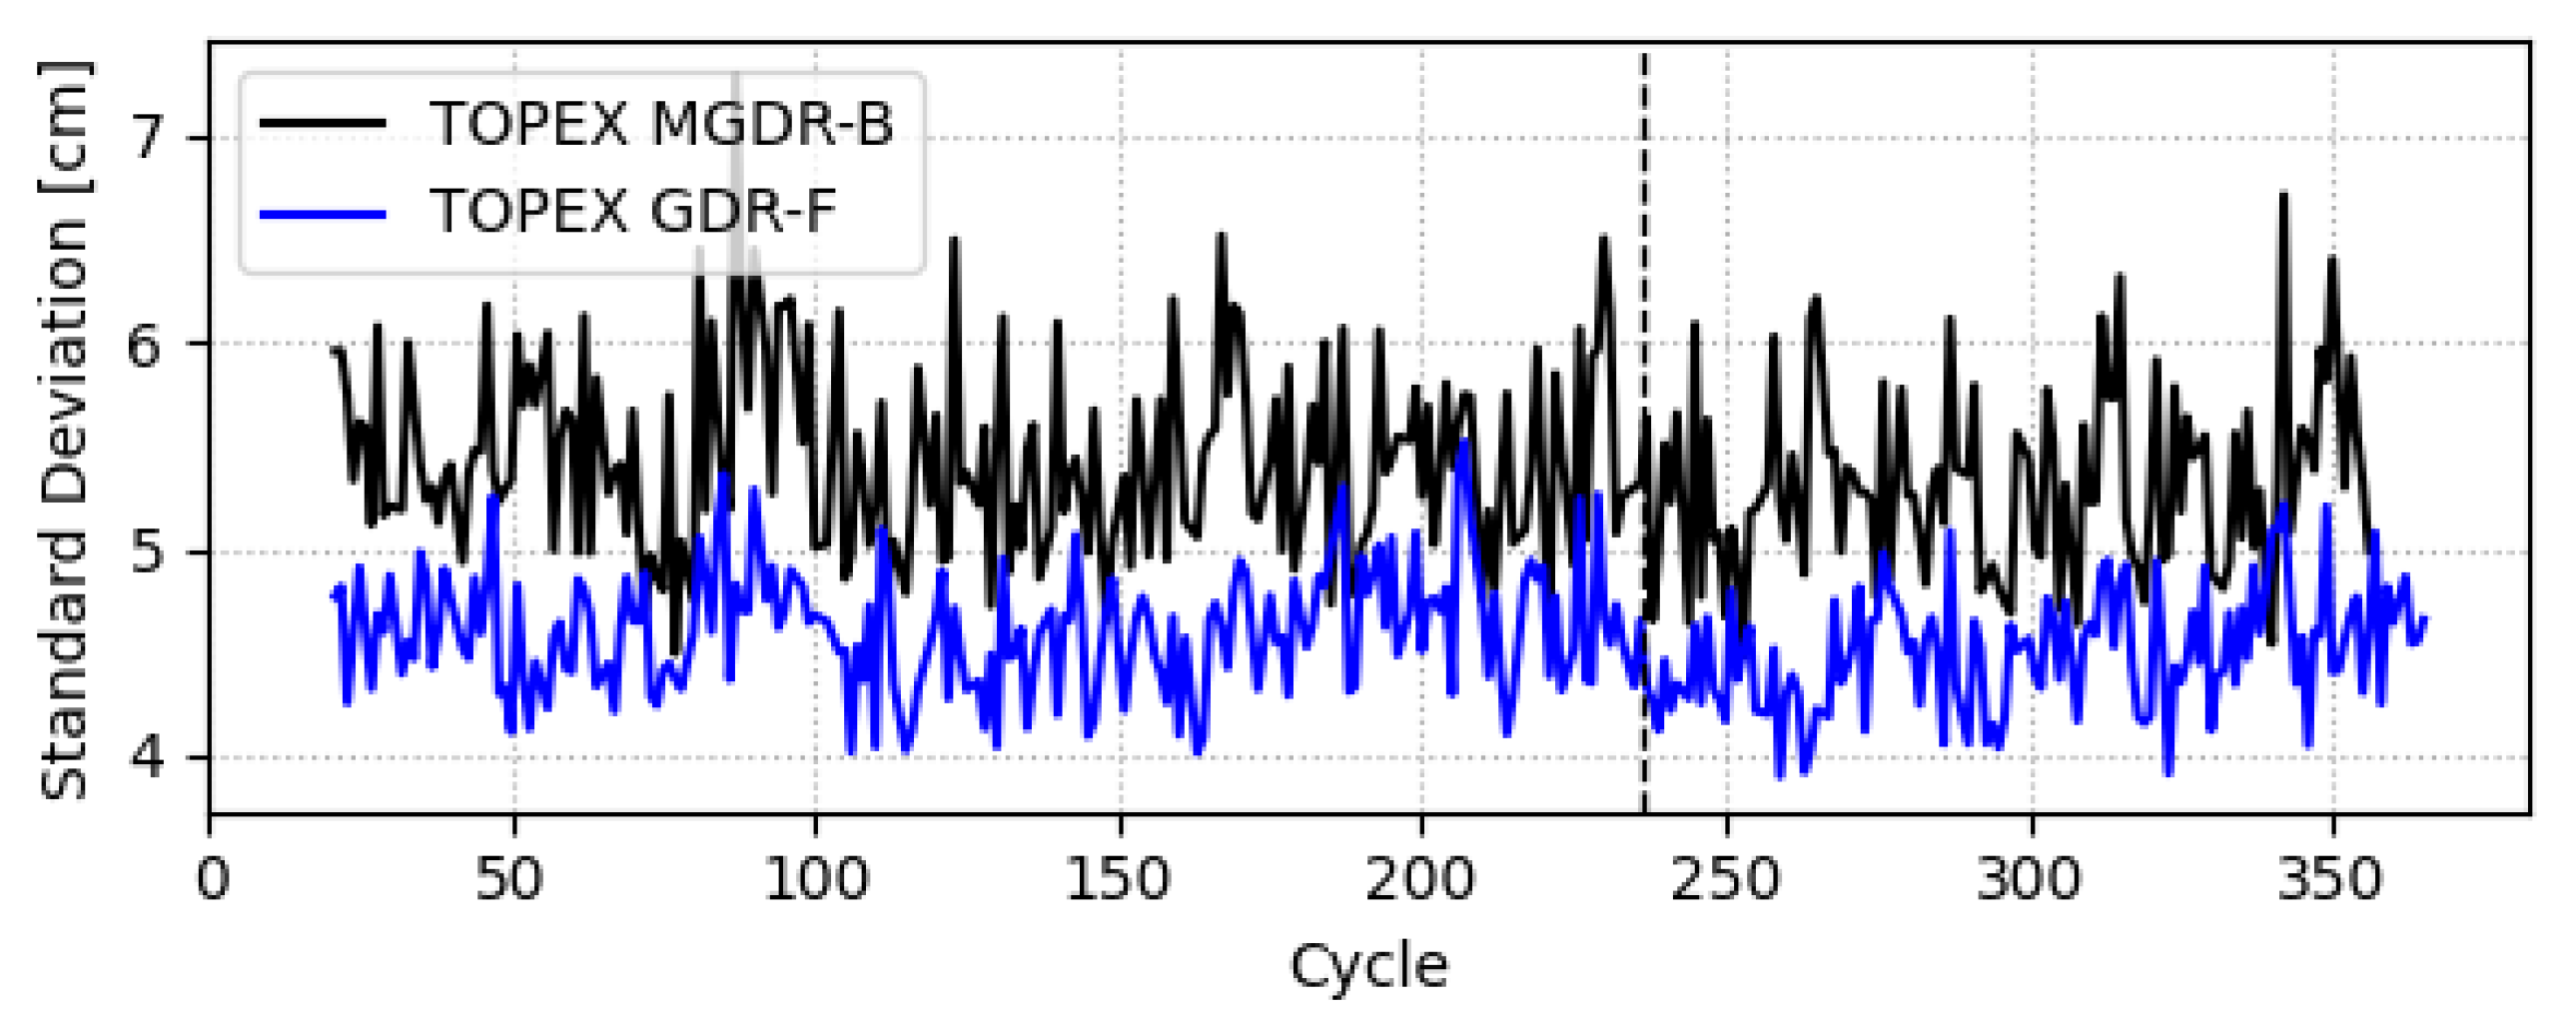
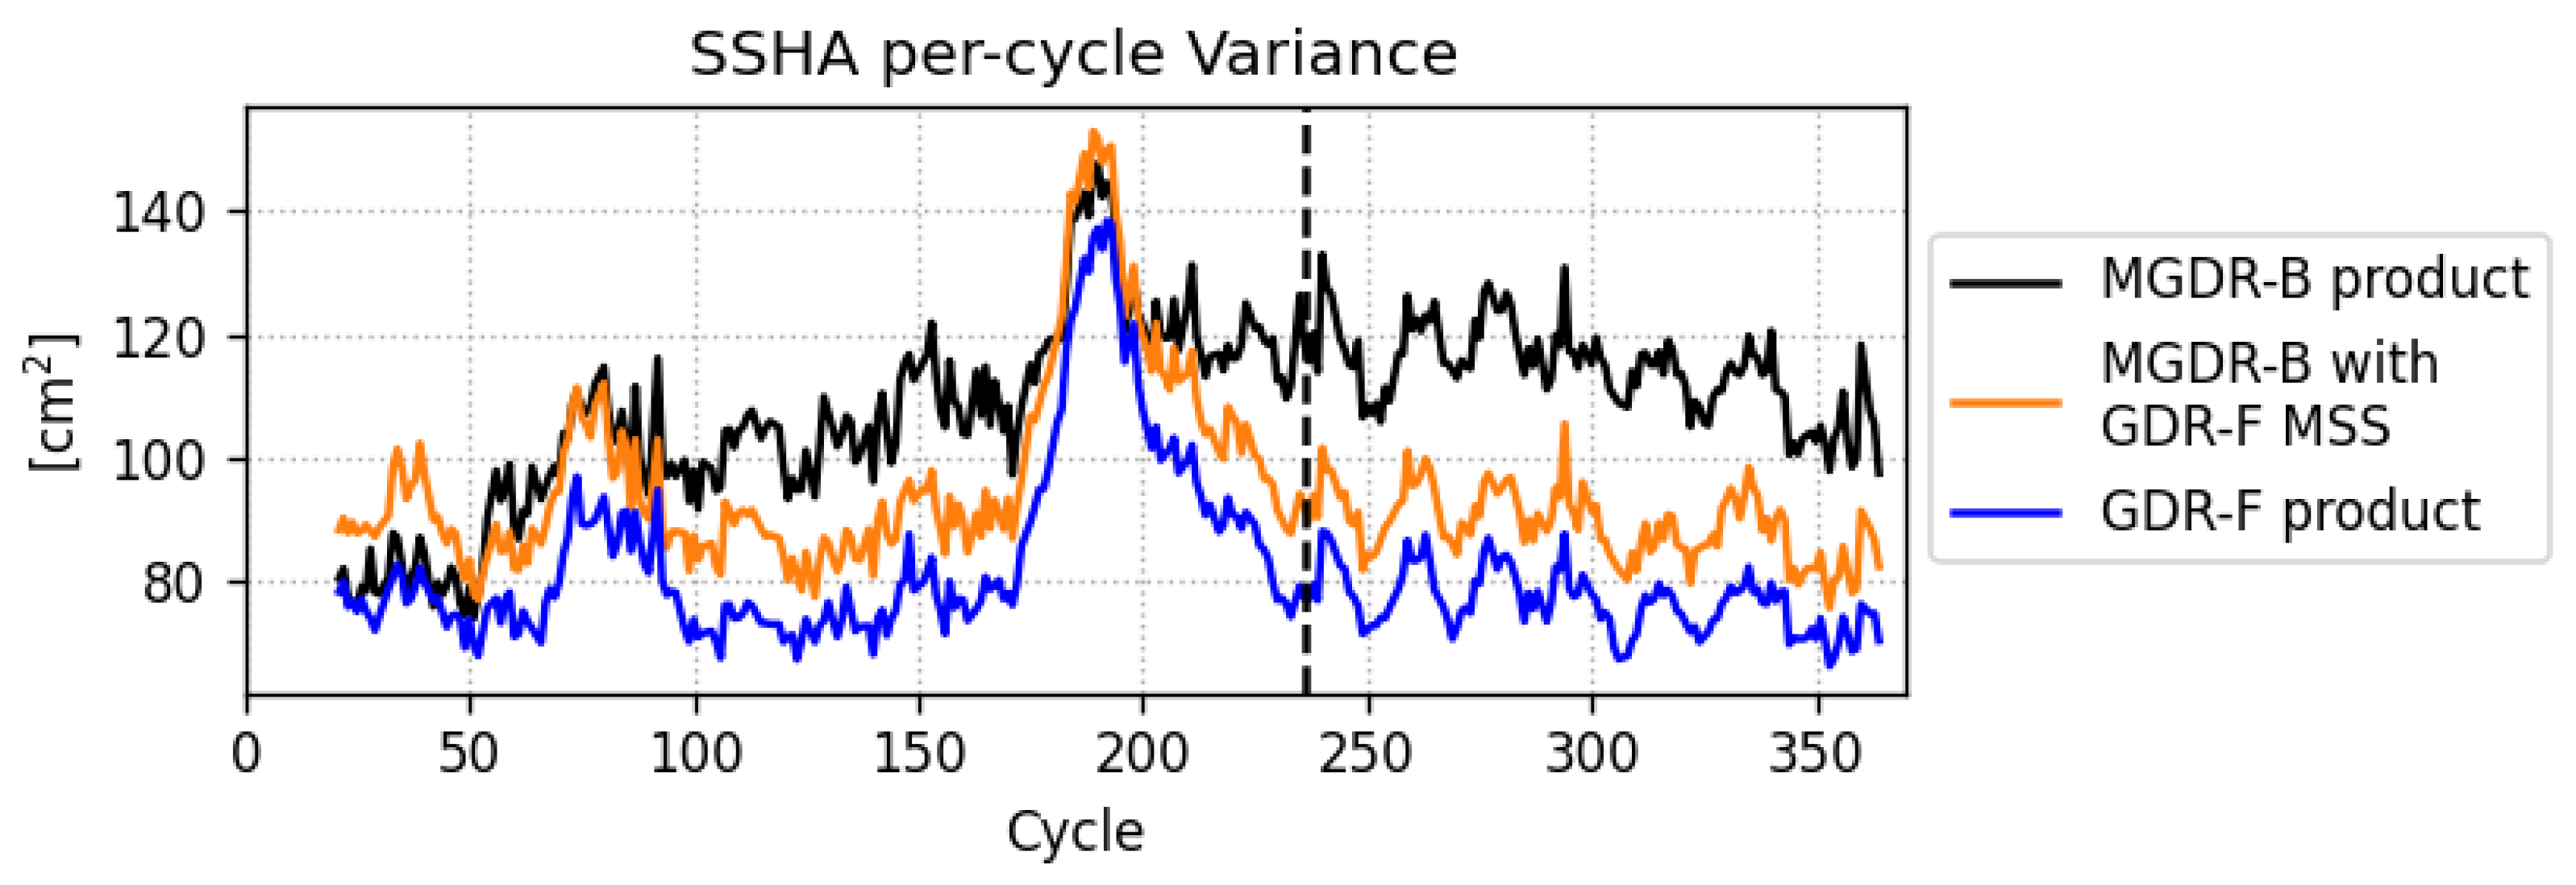
3.1.1. Crossover Analysis of Sea Surface Height Anomaly

An effective technique to assess the global performance of SSHA observations without the need for external data is to compute differences at crossover points between ascending and descending satellite tracks. Filtering these crossover points for small enough time differences, Δt, between the ascending and descending measurements reduces the impact of slowly varying ocean dynamics to facilitate the evaluation of the impact of the various product evolutions. Here, we computed the standard deviation of SSHA crossover differences with Δ t 10 days to evaluate relative performance.
As shown in Figure 2, the SSHA from GDR-F has significant improvements over the MGDR-B. Overall, the GDR-F reduces the global RMS of SSHA crossover differences by about 0.82 cm, from 5.39 cm for MGDR-B to 4.57 cm for GDR-F. Note that the TOPEX GDR-F metrics are now of similar magnitude as those from currently flying missions such as Jason-3 and Sentinel-6 MF (e.g., [22,23]). Furthermore, GDR-F shows a significant reduction of geographically correlated patterns, as illustrated in Figure 3a,b.

3.1.2. Evolution of Along-Track Sea Surface Height Anomaly

Another commonly used method to assess the performance of SSHA observations is the along-track analysis of the time series. Figure 4 shows a significant reduction of the per-cycle standard deviation for the along-track SSHA of GDR-F compared with MGDR-B. This reduction of up to 2 cm implies a significant performance improvement for the SSHA measurements. The peaks in the standard deviation around cycles 17–53 and 170–235 correspond to El Niño events. Here, again, the TOPEX GDR-F performance is comparable to metrics from the currently flying Jason-3 (e.g., [24]) and Sentinel-6 MF missions.
The SSHA consists of several components (cf. Equation (3)). The remainder of this section highlights the contribution of updating each SSHA component to the total performance improvement of GDR-F with respect to MGDR-B. The contribution of each SSHA component x is quantified by computing a modified SSHA, swapping out the GDR-F version for the legacy MGDR-B version:
SSHA modified , x = SSHA MGDR B + x MGDR B x GDR F .
Note that the sign convention here is consistent with using the MGDR-B parameter instead of the GDR-F parameter for SSHA. For example, the modified SSHA for the Mean Sea Surface (MSS) is computed according to
SSHA modified , MSS = SSHA MGDR B + MSS MGDR B MSS GDR F .
As shown in Figure 5, the use of a modern model of the MSS provided a significant improvement, as observed by a lower per-cycle standard deviation, to almost the entire time series of TOPEX SSHA measurements. The primary exception is the early time period before cycle 50. This is explained by the fact that the OSUM95 MSS model, which was applied to MGDR-B, was derived from only a limited time series of data. The OSUM95 model included TOPEX data for cycles 17 to 53, which were affected by the 1993/1994 El Niño event. The OSUM95 MSS is therefore not representative of the entire TOPEX mission and favores the early cycles from which it was derived. In contrast, the CNES-CLS15 MSS model [25] based on the GDR-F was derived from 19 years (1993–2012) of satellite altimetry data from a variety of missions. The standard deviation of the GDR-F SSHA is more stable over time, leading to a more prominent El Niño signal around cycles 17 to 53.
After assessing the performance of the GDR-F SSHA across the entire T/P mission on the reference ground track (cycles 21–365), we focused on quantifying the contribution of each SSHA component to the overall performance improvement using side B (cycles 236–365). Figure 6 highlights the contribution of updating each SSHA component to the total performance improvement of GDR-F with respect to MGDR-B. The performance was measured by the relative along-track SSHA variance, Δp, which was calculated by
Δ p = σ SSHA , modified 2 σ SSHA , MGDR B 2 ,
where · denotes the average across all side B cycles (236–364) and σ SSHA 2 represents the SSHA per-cycle variance. The blue bar in Figure 6 represents the total performance improvement, which was calculated by σ SSHA , GDR F 2 σ SSHA , MGDR B 2 . The GDR-F SSHAs represents a significant improvement over those from MGDR-B, with the along-track variance reduced by 26 cm2. As might be expected, the application of modern standards for the various geophysical models provided the most significant improvements. In particular, the modern MSS represents the largest contribution to the performance improvement of GDR-F SSHA with respect to MGDR-B, followed by updates of the tide models and the dynamic atmospheric correction (DAC). Note that the MGDR-B only provides an inverse barometer correction, while the GDR-F provides the DAC including the inverse barometer correction to capture the high-frequency response to atmospheric wind and pressure forcing. Nevertheless, it is noteworthy that the new retracking also improves the SSHA performance for TOPEX side B, as shown by a reduced SSHA variance from the SSB, the ionospheric correction, and the Ku-band range. The reason for this is described in Section 3.2. The use of the ECMWF reanalysis (ERA) interim model for the dry troposphere correction and the end-of-mission radiometer calibration for the wet troposphere correction also provides a small reduction of the SSHA variance, as do the more recent orbit ephemeris solutions.

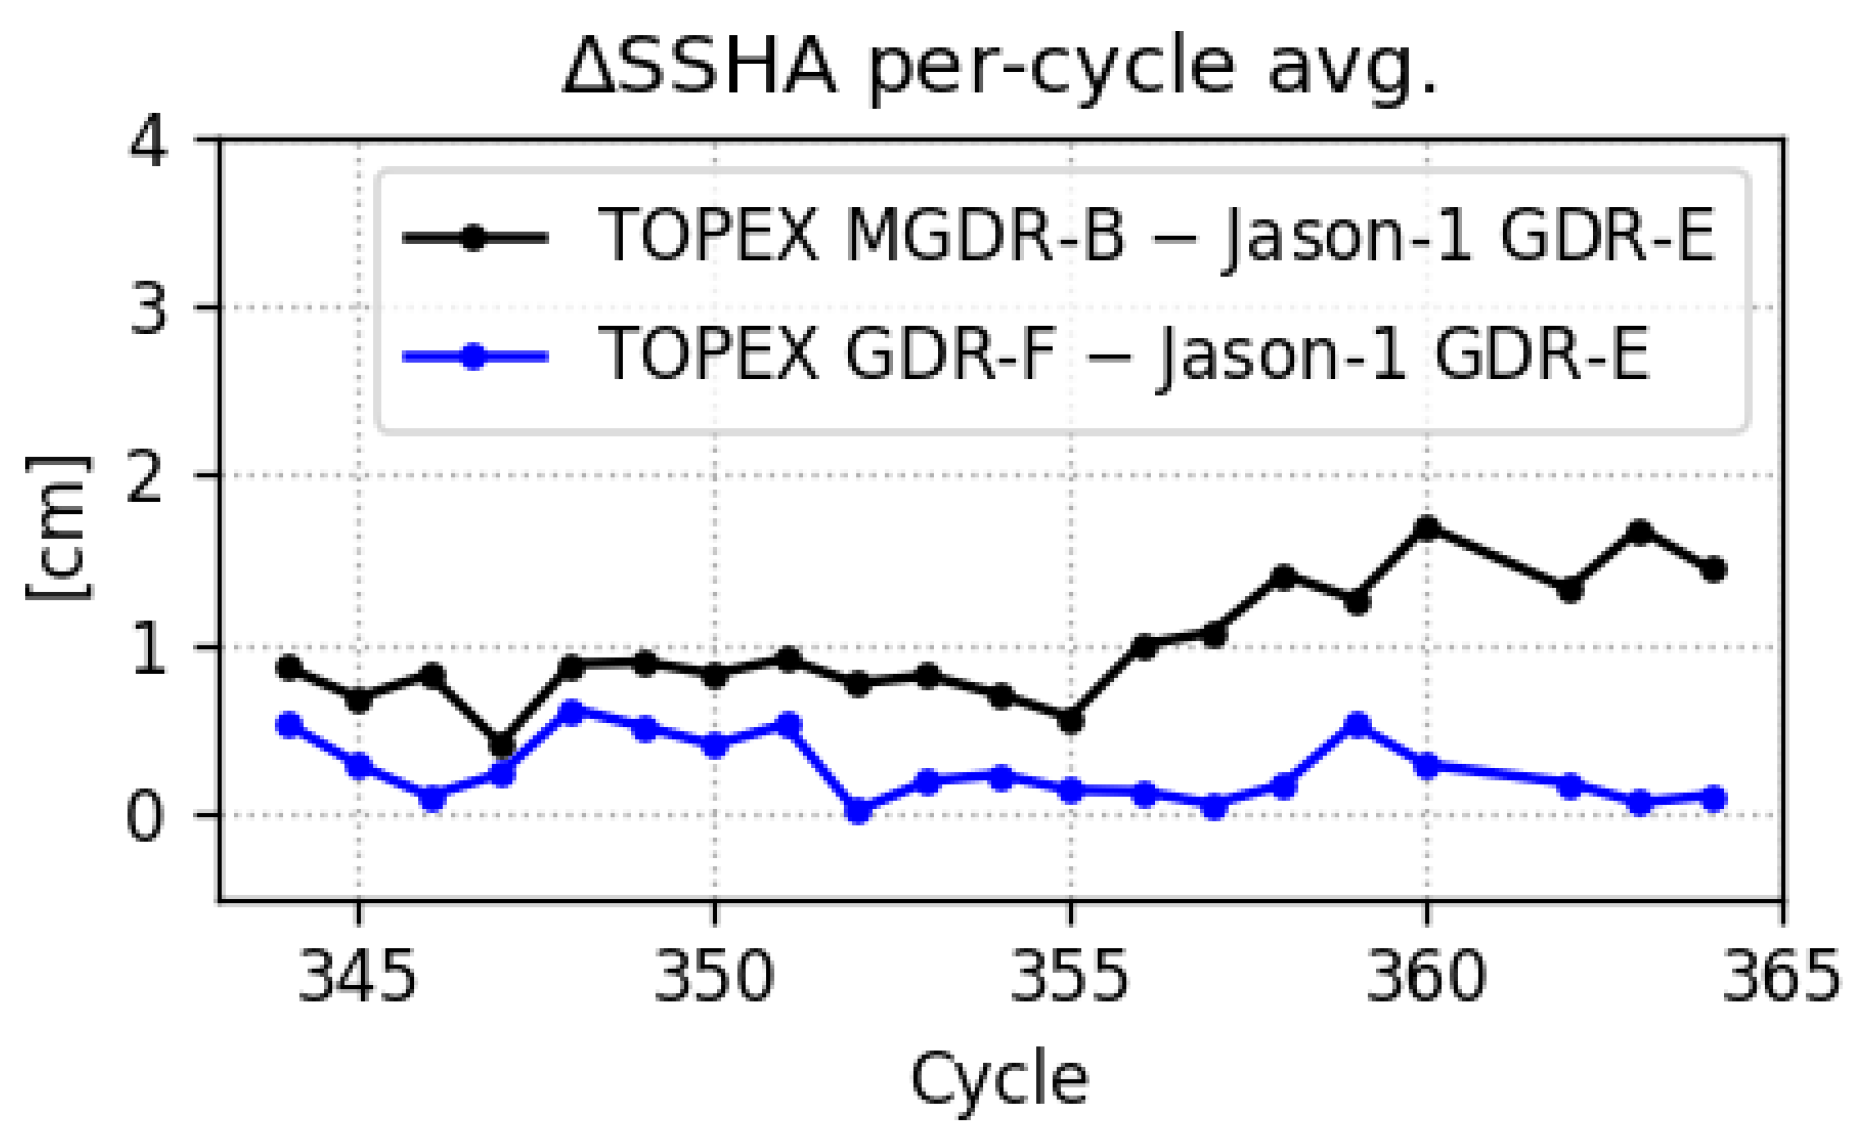
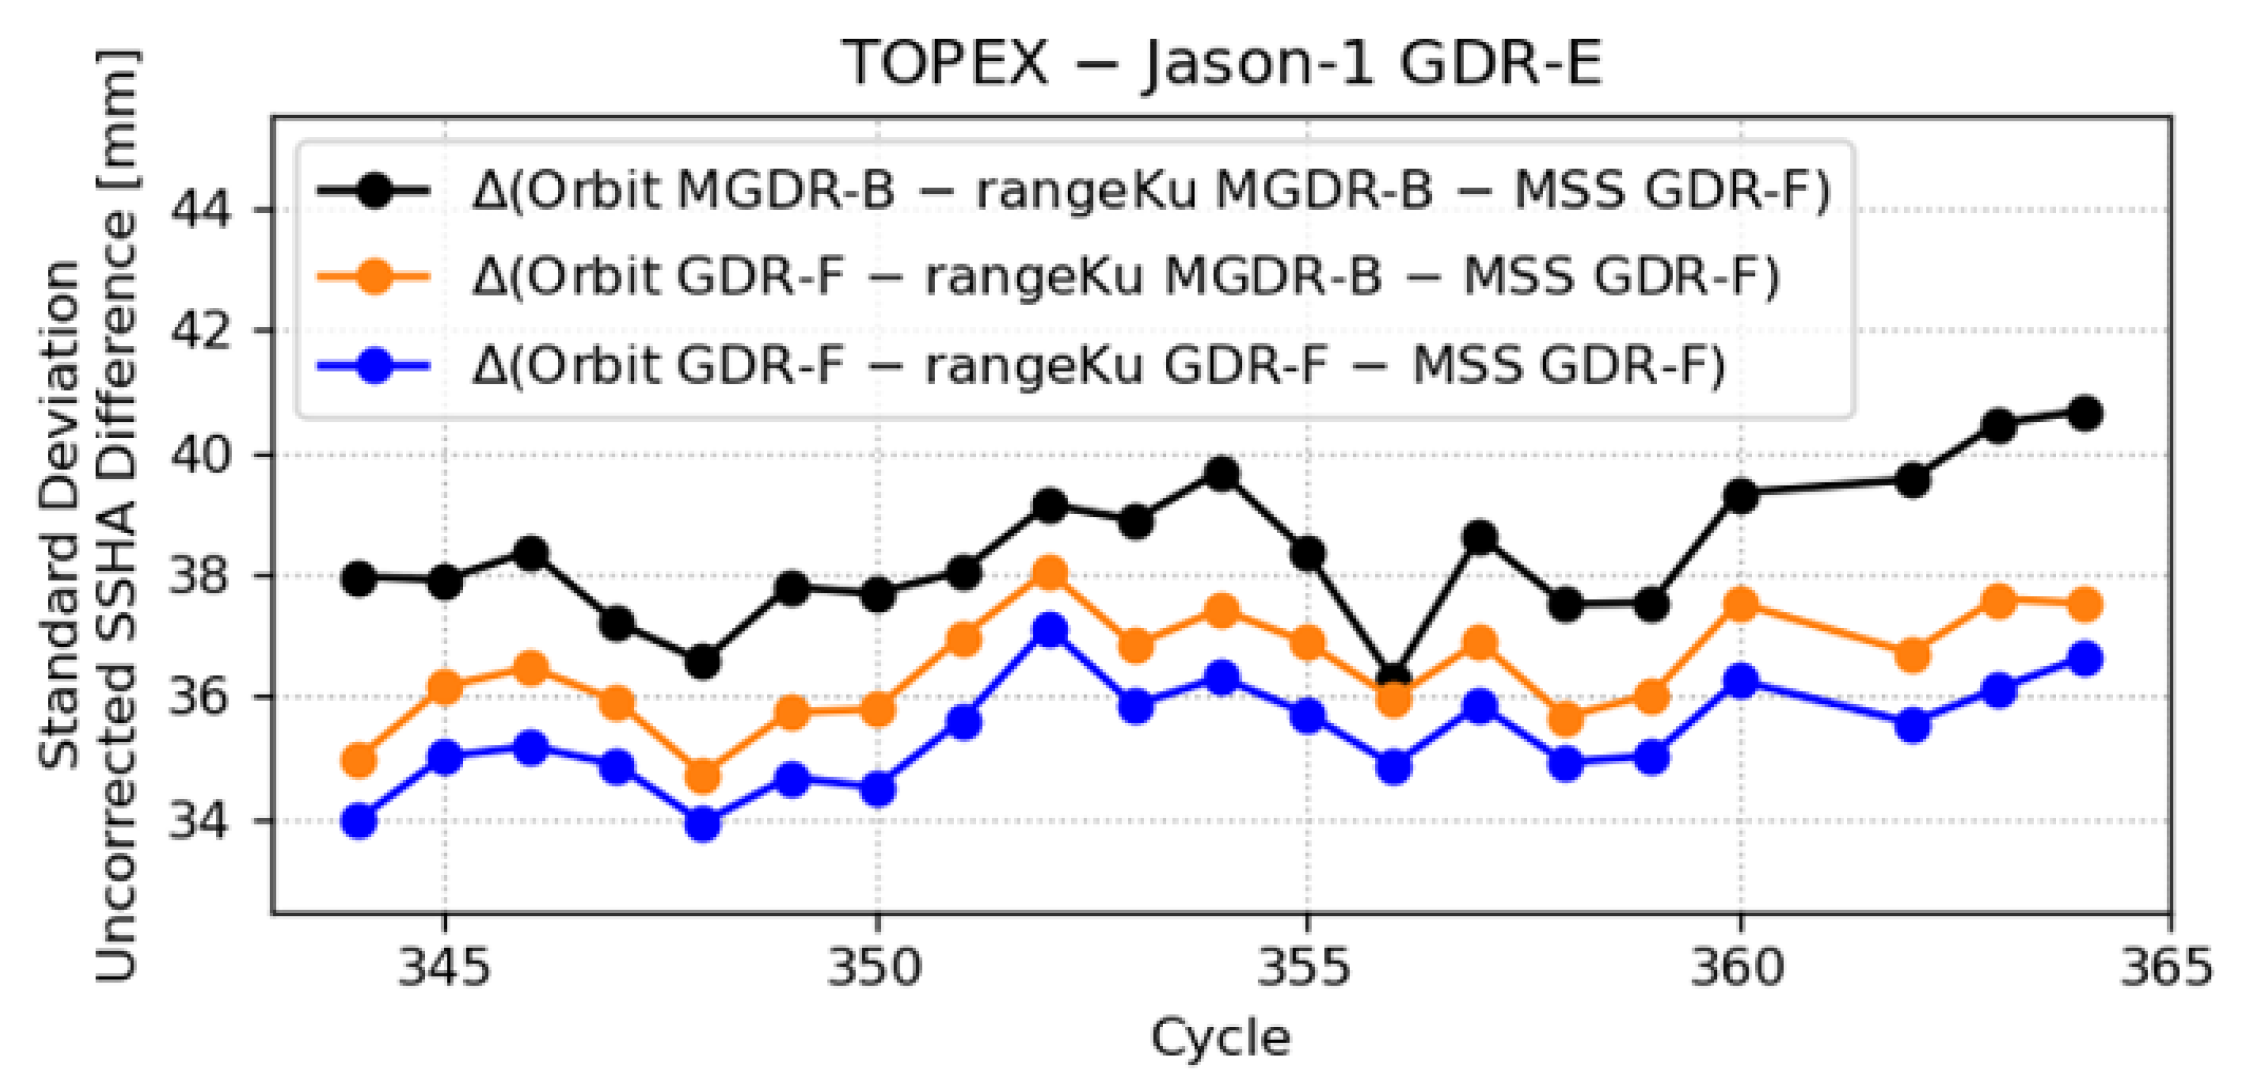
3.1.3. Comparison of the Sea Surface Height Anomaly Between TOPEX and Jason-1

Toward the end of the T/P mission, before Jason-1 took over as a new reference mission, both missions were flying in tandem formation for 21 repeat cycles. The two satellites were flying just approximately 70 s apart on exactly the same ground track. As such, this tandem phase provides another valuable dataset to assess the performance improvement of the T/P GDR-F reprocessing, with Jason-1’s GDR-E data product as a reference. For the subsequent analysis, the closest Jason-1 and TOPEX data points were differenced.
Figure 7 shows the improved consistency between the TOPEX GDR-F and Jason-1 GDR-E SSHA measurements compared to TOPEX MGDR-B versus Jason-1 GDR-E. The reprocessing resulted in a significantly reduced standard deviation by 2.30 cm, from 6.28 cm for MGDR-B (black) to 3.98 cm for GDR-F (blue). Moreover, differences between TOPEX and Jason-1 now have significantly smaller geographically correlated patterns, as highlighted in Figure 8.
As noted above, the tandem period between T/P and Jason-1 provides an opportunity to evaluate the consistency of the altimeter measurements themselves. All of the geophysical phenomena can be considered to be in common when the two independent measurement systems observe the same sea surface just 70 s apart. Although the two satellites were flying on the same ground track to ±1 km, they could be up to 2 km apart in cross-track. As such, a model of the MSS is best applied to account for cross-track geoid gradients. Of course, each satellite also has independent orbit altitudes, so the best available orbit ephemeris needs to be used for each satellite.
Figure 9 shows the consistency in uncorrected SSHA from TOPEX GDR-F and Jason-1 version E Geophysical Data Records. The same MSS model (CNES-CLS15) was applied to both measurements. In the first step, the orbit was updated to the GDR-F GSFC solution, shown by the orange line, which improved the per-cycle standard deviation of the TOPEX vs. Jason-1 differences by 1.88 mm, from 38.38 to 36.50 mm on average. Second, the Ku-band range estimates were updated from the MGDR-B to the GDR-F version, shown by the blue curve, resulting in an additional improvement of 1.09 mm to a per-cycle standard deviation of 35.41 mm. Both updates resulted in a significant reduction in the standard deviation of the differences of 2.97 mm, highlighting the improved consistency between TOPEX and Jason-1 across the tandem phase. Here, again, the GDR-F differences are now significantly more consistent with similar differences between current successor missions. For example, similar differences between Jason-3 and its successor Sentinel-6 MF amount to approximately 33 mm [23].

3.2. Numerical Retracking and Impact on Derived Altimeter Parameters

This section focuses on assessing the impact of the reprocessing on the parameters derived directly from the Ku- and C-band altimeter measurements. First, in Section 3.2.1, we illustrate how the new Cal-1 processing and direct use of the Point Target Response (PTR) mitigate long-standing issues related to the degradation of the TOPEX altimeter toward the end of side A. In Section 3.2.2 we demonstrate that the new Cal-2 processing significantly mitigates hemispheric biases, which are another documented feature of the TOPEX MGDR-B products.

3.2.1. Mitigation of Altimeter Drift Using Cal-1 Point Target Response

The so-called “Wallops” range correction [26,27] was applied to the TOPEX altimeter ranges reported on the MGDR-B product. This correction was designed with the assumption that the PTR waveform would remain stable over the course of the mission. Especially for side A, this assumption did not hold due to the degradation of the altimeter. The numerical retracking approach uses the Point Target Response (PTR) directly, without the need for tabulated instrument corrections to derive range, SWH, and sigma0 from the measured waveforms. Since the PTR is continuously measured during Cal-1 and accounted for in the numerical retracking approach, theoretically, any drift in the altimeter and its potential impact on range, SWH, and sigma0 can be accounted for. The numerical retracking results in an improved temporal stability of GDR-F altimeter parameters compared to those from MGDR-B are shown below.
Significant Wave Height. The degradation of the side A altimeter caused a drift in the MGDR-B SWH measurements, which is shown in Figure 10a in black. This drift, which is especially visible after cycle 150, amounts to a 20 cm difference between the beginning and the end of side A. The new TOPEX altimeter reprocessing led to a more stable time series for the GDR-F SWH. For the Ku-band, Figure 10a illustrates the successful mitigation of the SWH drift in the GDR-F product, with variability reduced to less than 10 cm across side A. An important by-product of the improvements in SWH stability is the resulting improvement in SSB, which, in turn, improves the stability of the SSHA measurements. The impact of the improved SSB on the SSHA performance will be discussed in more detail at the end of this section (cf. Figure 14). For side B, the difference between MGDR-B and GDR-F remains stable around 7 cm. Figure 10b also highlights that the GDR-F differences with the model have significantly reduced noise and therefore an improved agreement across cycles. Comparison between TOPEX minus Jason-1 GDR-E SWH measurements showed a bias of −2 cm for TOPEX GDR-F and 5 cm for TOPEX MGDR-B over the tandem phase (not shown here, see [12] for details). For the C-band SWH shown in Figure 10c,d, the drift across side A was reduced from 38.5 cm (MGDR-B) to 15 cm for GDR-F. Similar to the Ku-band estimates, the C-band SWH bias with respect to the model is now stable across side B and amounts to 4 cm for MGDR-B and −15 cm for GDR-F.
Sigma0. The normalized radar reflectivity cross-section sigma0 is derived from the amplitude of the echo waveforms, taking into account the altitude of the satellite with respect to the measured surface as well as the gain and losses that affect the signal in the altimeter subsystem.
The MGDR-B sigma0 was corrected using the so-called “Wallops” sigma0 calibration, which is a climatological correction applied to stabilize the time series. The GDR-F version of the sigma0 product benefits from the new numerical retracking approach described in [12], which does not require any post-processing for calibration purposes. Three effects are illustrated in Figure 11 for GDR-F sigma0 in comparison with MGDR-B:
  • The GDR-F sigma0 ranges within ±0.2 dB for side A, similar to MGDR-B.
  • At the beginning of side B, a change in the altimeter configuration generated a drop in the sigma0 values, which spread across multiple cycles up to cycle 270 due to the smoothing window applied in the calibration for GDR-F.
  • After cycle 270, the sigma0 timeseries stabilizes but shows small (0.2 dB) oscillations with an approximate 20-cycle period. These are related to the scheduled sweep PTR calibrations, which were performed monthly at the beginning of the mission and later once every cycle (starting from cycle 363), combined with applying a smoothing window to the calibration in the GDR-F processing [12].
Wind speed. The long-term wind speed evolution was assessed by comparing TOPEX wind speed estimates against ERA-Interim re-analysis data, as shown in Figure 12. Overall, the GDR-F estimates matches within 0.5 m/s with the ERA-Interim data (referred to as “model” in the figure). The slightly better agreement between the MGDR-B and ERA5 model wind speeds is likely the result of MGDR-B wind speeds being intentionally stabilized by applying empirical, climatological sigma0 corrections. The small instability in the GDR-F wind estimates can be traced back to the sigma0 limitations described above (cf. Figure 11). The behavior of the wind speed at the beginning of the side B time series up to cycle 270 can be traced back to the configuration change affecting sigma0. The following three 0.5 m/s oscillations between cycles 290 and 350 in Figure 12b stem from 0.2–0.4 dB oscillations in sigma0 due to poor temporal sampling of sweep PTR calibrations. The total inherent error envelope of the GDR-F wind speed estimates is on the order of 0.5 m/s. This uncertainty in the wind speed translates to an uncertainty on the order of 2 mm in the SSB and, as a result, the SSHA. Except for the first 30 cycles on side B, no significant drift was detected across the mission on the reference orbit.
Range. The TOPEX ranges for both the Ku- and C-bands combine several components: the raw estimate of range (from either the onboard estimates or ground retracking), the net instrument corrections, and biases. The analytic range estimation algorithm in the original MGDR-B processing used a look-up table of corrections as a function of SWH and mispointing angle. The new GDR-F reprocessing relies on numerical retracking, which estimates epoch, the range position inside the measurement window for each echo. The range is derived by adding the estimated echo’s epoch information and the corresponding onboard range tracker information. Because of anomalies detected in the onboard calibration, it has not been applied to side A ranges, and range estimates can therefore be affected by a potential drift of the instrument internal path delay.
Dual-range altimeter ionospheric correction. Ionospheric correction accounts for the presence of electrons and the subsequent delay of a radar pulse as it travels back and forth to the ocean surface. The correction leverages the dual-frequency measurements of range, corrected by the SSB, as described in [28].
Figure 13 shows the evolution of the Ku-band ionospheric correction across the TOPEX reference mission. The clear increase in the magnitude of the correction from 2 to 12 cm in Figure 13a corresponds to an increase in solar activity and subsequent Total Electron Content (TEC). In Figure 13b, we compare this altimeter estimate against the Global Ionosphere Model (GIM) [29], which shows a similar behavior for MGDR-B and GDR-F. Two oscillation patterns occur, similarly for MGDR-B and GDR-F: (1) a 1–5 mm, 60-day oscillation on side A and (2) a 3–5 mm, 180-day periodic pattern on side B. These patterns are not fully explained but may indicate the dependence of the altimeter-model differences on local time. Figure 13c reveals a 3 mm drift in the differences between MGDR-B and GDR-F across side A (cycles 21–235), whereas no significant trend was detected for the difference across side B. The differences show a discontinuity of 3.5 mm at the transition between the side A and B altimeters, indicated here by the black dashed line at cycle 235. The MGDR-B products were corrected with two different biases for the Ku- and C-bands in order to enforce continuity in the ionospheric correction from the altimeter, whereas, for GDR-F, no alignment corrections were applied.
Figure 14 summarizes the impact of the numerical retracking on the TOPEX side A and side B altimeter parameters that affect SSHA and their combined effect, starting with the Ku-band range (black), which does not include the Wallops correction for GDR-F, and adding the Ku-band ionospheric correction (blue) and the sea state bias (orange). While the effect of updating the individual contributions from MGDR-B to GDR-F and therefore the impact of the numerical retracking is significant, their combined effect on the SSHA from the start to end of side A canceled and the impact on the sea level over those six years is therefore negligible.
It is particularly noteworthy that the impact of the updated estimates of the Ku-band range and the ionosphere correction from the numerical retracking appears as an overall trend in the side A time series from launch through approximately cycle 150, which peaks at 1 cm, as shown in Table 1. However, accounting for the significant drift in the SWH (cf. Figure 10) and subsequently the SSB after cycle 150 results in an SSHA drift of the opposite sign after cycle 150, as shown by the blue curve, which represents this drift. As shown in Table 1, the difference in relative change for the combined effect of the numerical retracking (e.g., update of range, ionospheric correction, and SSB) results in 0.0 cm between the first and last cycle of side A (Table 1 “End”). Nevertheless, there are significant temporal effects during side A. It should be mentioned that the “net effect” between the first and last cycle of side A increases from 0.0 to 0.7 cm when adding the contribution of the wet tropospheric correction on top of the combined effect of the numerical retracking (not shown here).

3.2.2. Reduction of Hemispheric Bias by Cal-2 Correction of Waveforms

Cal-2 mode waveforms correspond to the output signal measured when the altimeter input is a white noise signal (thermal noise) and provides the equivalent altimeter distortion signature, called filter. Prior to processing through the numerical retracker, the echo waveforms are therefore simply corrected using the Cal-2 mode waveform filters. The vertical velocity of the satellite is positive going from the equator to the extreme latitude and negative going from the maximum latitude to the equator. It is zero around the equator as well as the extreme latitudes of the satellite orbit. The hemispheric bias is significantly improved by applying a dedicated Cal-2 filter depending on the sign of the vertical velocity. The improvement is particularly noticeable for side B, which benefits from better instrument calibrations and measurement quality of waveform echoes.
Figure 15 illustrates the mitigated hemispheric bias by updating the Ku-band range from MGDR-B to GDR-F. Figure 15a shows the SSHA from GDR-F, but with the Ku-band range from the old MGDR-B. Figure 15b uses SSHA from the GDR-F version only. Overall, the reprocessing yielded a reduction in the peak-to-peak hemispheric bias from about 4 cm when using MGDR-B ranges (a) to less than 1 cm for GDR-F ranges (b).
Comparisons with Jason-1, shown in Figure 16, also highlights the mitigation of this hemispherical bias in SSHA with an improved agreement with the Jason-1 GDR-E product. The remaining patterns visible in Figure 16 likely stem from geographically correlated errors in the respective orbit solutions. The Cal-2 processing also helped mitigate the hemispheric bias for SWH and sigma0, which is described in detail in [12].

3.3. Performance of POSEIDON Sea Surface Height Anomaly Compared to TOPEX

The POSEIDON altimeter was only active for approximately one complete cycle every 10 cycles (see Figure 1). The number of valid over-ocean measurements is equivalent for POSEIDON and TOPEX cycles except for some cycles, with instrumental events (for example, a DORIS anomaly on cycle 174, not shown here).

3.3.1. POSEIDON Performance from Along-Track and Crossover Analysis

The standard deviation of along-track SSHA (Figure 17a) and from SSHA differences at crossover points (Figure 17b) per cycle for POSEIDON is slightly higher compared to TOPEX. This is primarily explained by the lower precision of the DORIS ionospheric correction used to compute SSHA [30]. POSEIDON is a single-frequency altimeter, so the ionosphere correction was computed from a model. This is visible when comparing the standard deviation of SSHA differences at crossovers between TOPEX and POSEIDON: the standard deviation of POSEIDON crossover differences is higher than TOPEX before 1994 and after 2000, matching solar activity peaks. Another contribution to the increased standard deviation of crossover differences for POSEIDON is the higher noise level compared to the TOPEX altimeter.

3.3.2. Biases Between TOPEX and POSEIDON Sea Surface Height Anomaly

As mentioned earlier, the T/P serves as the anchor to the Global Mean Sea Level (GMSL) record. The stability of this reference mission can therefore be critical for climate science applications (e.g., [9,10]). The availability of two independent altimeters on the platform provides an opportunity to evaluate relative biases and drifts. Monitoring the global mean SSHA over time for both TOPEX and POSEIDON altimeters (Figure 18a) exposes differences in the observed SSHA variability. The POSEIDON time series for per-cycle averages of SSHA in Figure 18a shows a significantly lower trend compared to TOPEX. The POSEIDON record has a positive SSHA trend of (1 ± 0.4) mm/yr over the full record shown in Figure 18a, while TOPEX shows an SSHA trend of (3.2 ± 0.2) mm/yr over the side A period, followed by (4.4 ± 0.2) mm/yr over side B, when limited to the nominal ground track period.
Figure 18b shows the difference in global mean SSHA between TOPEX and POSEIDON. The difference was computed by interpolating TOPEX to the POSEIDON cycles. For each POSEIDON cycle (C), the corresponding TOPEX value was computed by averaging the global mean SSHA from cycles C − 1 and C + 1. The comparison between POSEIDON and TOPEX average SSHA provides an estimate of the relative bias between the end of TOPEX side A and the start of side B of 3.4 cm. This value is consistent with an independent estimate of the same bias from [31], which included a comparison to the ERS-2 mission. As advised by the user handbook [2], when comparing TOPEX and POSEIDON data in Figure 18, we treated TOPEX side A as two separate time series. We refer to them as sides A1 and A2, respectively corresponding to before and after 1 April 1996. A significant relative drift of 2.6 mm/year was observed over side A1 (ending at cycle 130), while no significant drift was observed during side A2 and all of side B. As all geophysical corrections are homogeneous for TOPEX and POSEIDON data, differences in SSHA arise from altimeter-related differences through the range, SSB, and ionospheric corrections.

3.4. TOPEX Microwave Radiometer

The TOPEX Microwave Radiometer’s (TMR) main objective is to correct for the propagation path delay and atmospheric attenuation of sigma0 of the altimeter radar signal due to water vapor and non-precipitating liquid water in the atmosphere. For details on the TMR instrument design and measurement principle, see [16].
A drift in the 18 GHz brightness temperature measurements caused the wet tropospheric delay to drift, with an estimated rate of 2 mm/year for the first 7 years [16,32]. The GDR-F product uses a dedicated end-of-mission recalibration of the TMR from [16] that aims to eliminate drifts in all three channels. This is visible in Figure 19c across the first 252 cycles. A remaining drift of −0.5 mm/year with respect to the ERA-Interim model is apparent in Figure 19b (blue curve). Considering the successful mitigation of the radiometer drift [16], this might indicate a drift in the model. The 5 mm peak-to-peak oscillations visible in the difference between the MGDR-B radiometer and the GDR-F model differences in Figure 19b (black curve) are due to an error that depends on the TMR instrument temperature [16]. The modulation of the instrument’s physical temperature followed a 60-day repeat pattern caused by the varying relative sun angles and yaw steering modes of the satellite. The T/P GDR-F product applies a calibration correction to successfully mitigate the error related to instrument temperature variations, as shown by the blue curve in Figure 19b.
A comparison between TOPEX and Jason-1 radiometer wet path delay during the tandem phase shows a systematic negative bias near the coast in Figure 20a. Consistency between TOPEX and Jason-1 was significantly improved with new radiometer processing for GDR-F: the global RMS of the differences with Jason-1 were reduced from 1.54 mm for MGDR-B (Figure 20a) to 1.11 mm for GDR-F (Figure 20b).

3.5. Orbit Ephemeris

The new GDR-F product provides two Precise Orbit Ephemeris (POE) solutions: one generated by CNES and one from the Goddard Space Flight Center (GSFC), both based on the ITRF 2014 frame. The GSFC solutions are used for the SSHA measurements provided in the TOPEX GDR-F product. The upgrade in GSFC orbit solution between MGDR-B and GDR-F products significantly reduces geographically correlated errors with a ±3 cm amplitude, as illustrated in Figure 21. As described in Section 3.1, the recent orbit ephemeris solutions reduce the RMS of SSHA crossover differences by 2.4 mm2.

4. Conclusions

In this study, we assessed the most recently reprocessed TOPEX/POSEIDON (T/P) GDR-F ocean altimetry products, with respect to the previous MGDR-B version, which was released in 1996–1998. The performance improvement of the Sea Surface Height Anomaly (SSHA) as well as other key altimetry parameters was evaluated using statistical analysis along the T/P ground track, at crossover points, and in comparison with Jason-1 during their tandem phase for T/P cycles 344–364. The reprocessed GDR-F product is based on the latest geophysical models, orbit solutions, and modern approaches to retracking the altimeter waveforms.
Overall, the SSHA performance significantly improved for GDR-F compared to the previous MGDR-B version: the standard deviation of SSHA differences at crossover points was reduced by 1 cm, from 5.4 cm for MGDR-B to 4.6 cm for the new GDR-F version. Along-track analysis of SSHA per-cycle standard deviation was reduced from 10 cm to 9 cm on average. Moreover, the drift in the SWH time series derived from the side A altimeter was mitigated by the numerical retracking of the waveforms, specifically by directly employing the altimeter’s Point Target Response (PTR).
We analyzed the contributions of individual SSHA components to the overall performance gain. As expected, the mean sea surface provide the largest improvement, followed by updated tide models, the addition of high-frequency contributions to the dynamic atmospheric correction (DAC), the non-parametric Sea State Bias (SSB), updated ionospheric corrections, improved range estimates, and atmospheric path delays. While the latest ITRF 2014 orbit solutions provide the smallest contribution to the SSHA performance improvement, they significantly mitigate geographically correlated patterns that were present in the MGDR-B product and facilitate improved consistency with the Jason-1 time series.
Comparison of the SSHA measurements during the tandem phase between T/P and Jason-1 GDR-E revealed an improvement in the per-cycle standard deviation of the point-wise differences of about 2 cm, from 6 cm for MGDR-B to 4 cm for GDR-F, commensurate with the system performance, and confirmed that the new GDR-F reprocessing for side B now meets Jason/Sentinel-6 mission requirements. We demonstrated how the numerical retracking (MLE-3 for both the Ku- and C-Bands; MLE-4 for the Ku-Band) mitigates long-standing issues in deriving physical parameters from the measured waveforms. The two main improvements are as follows:
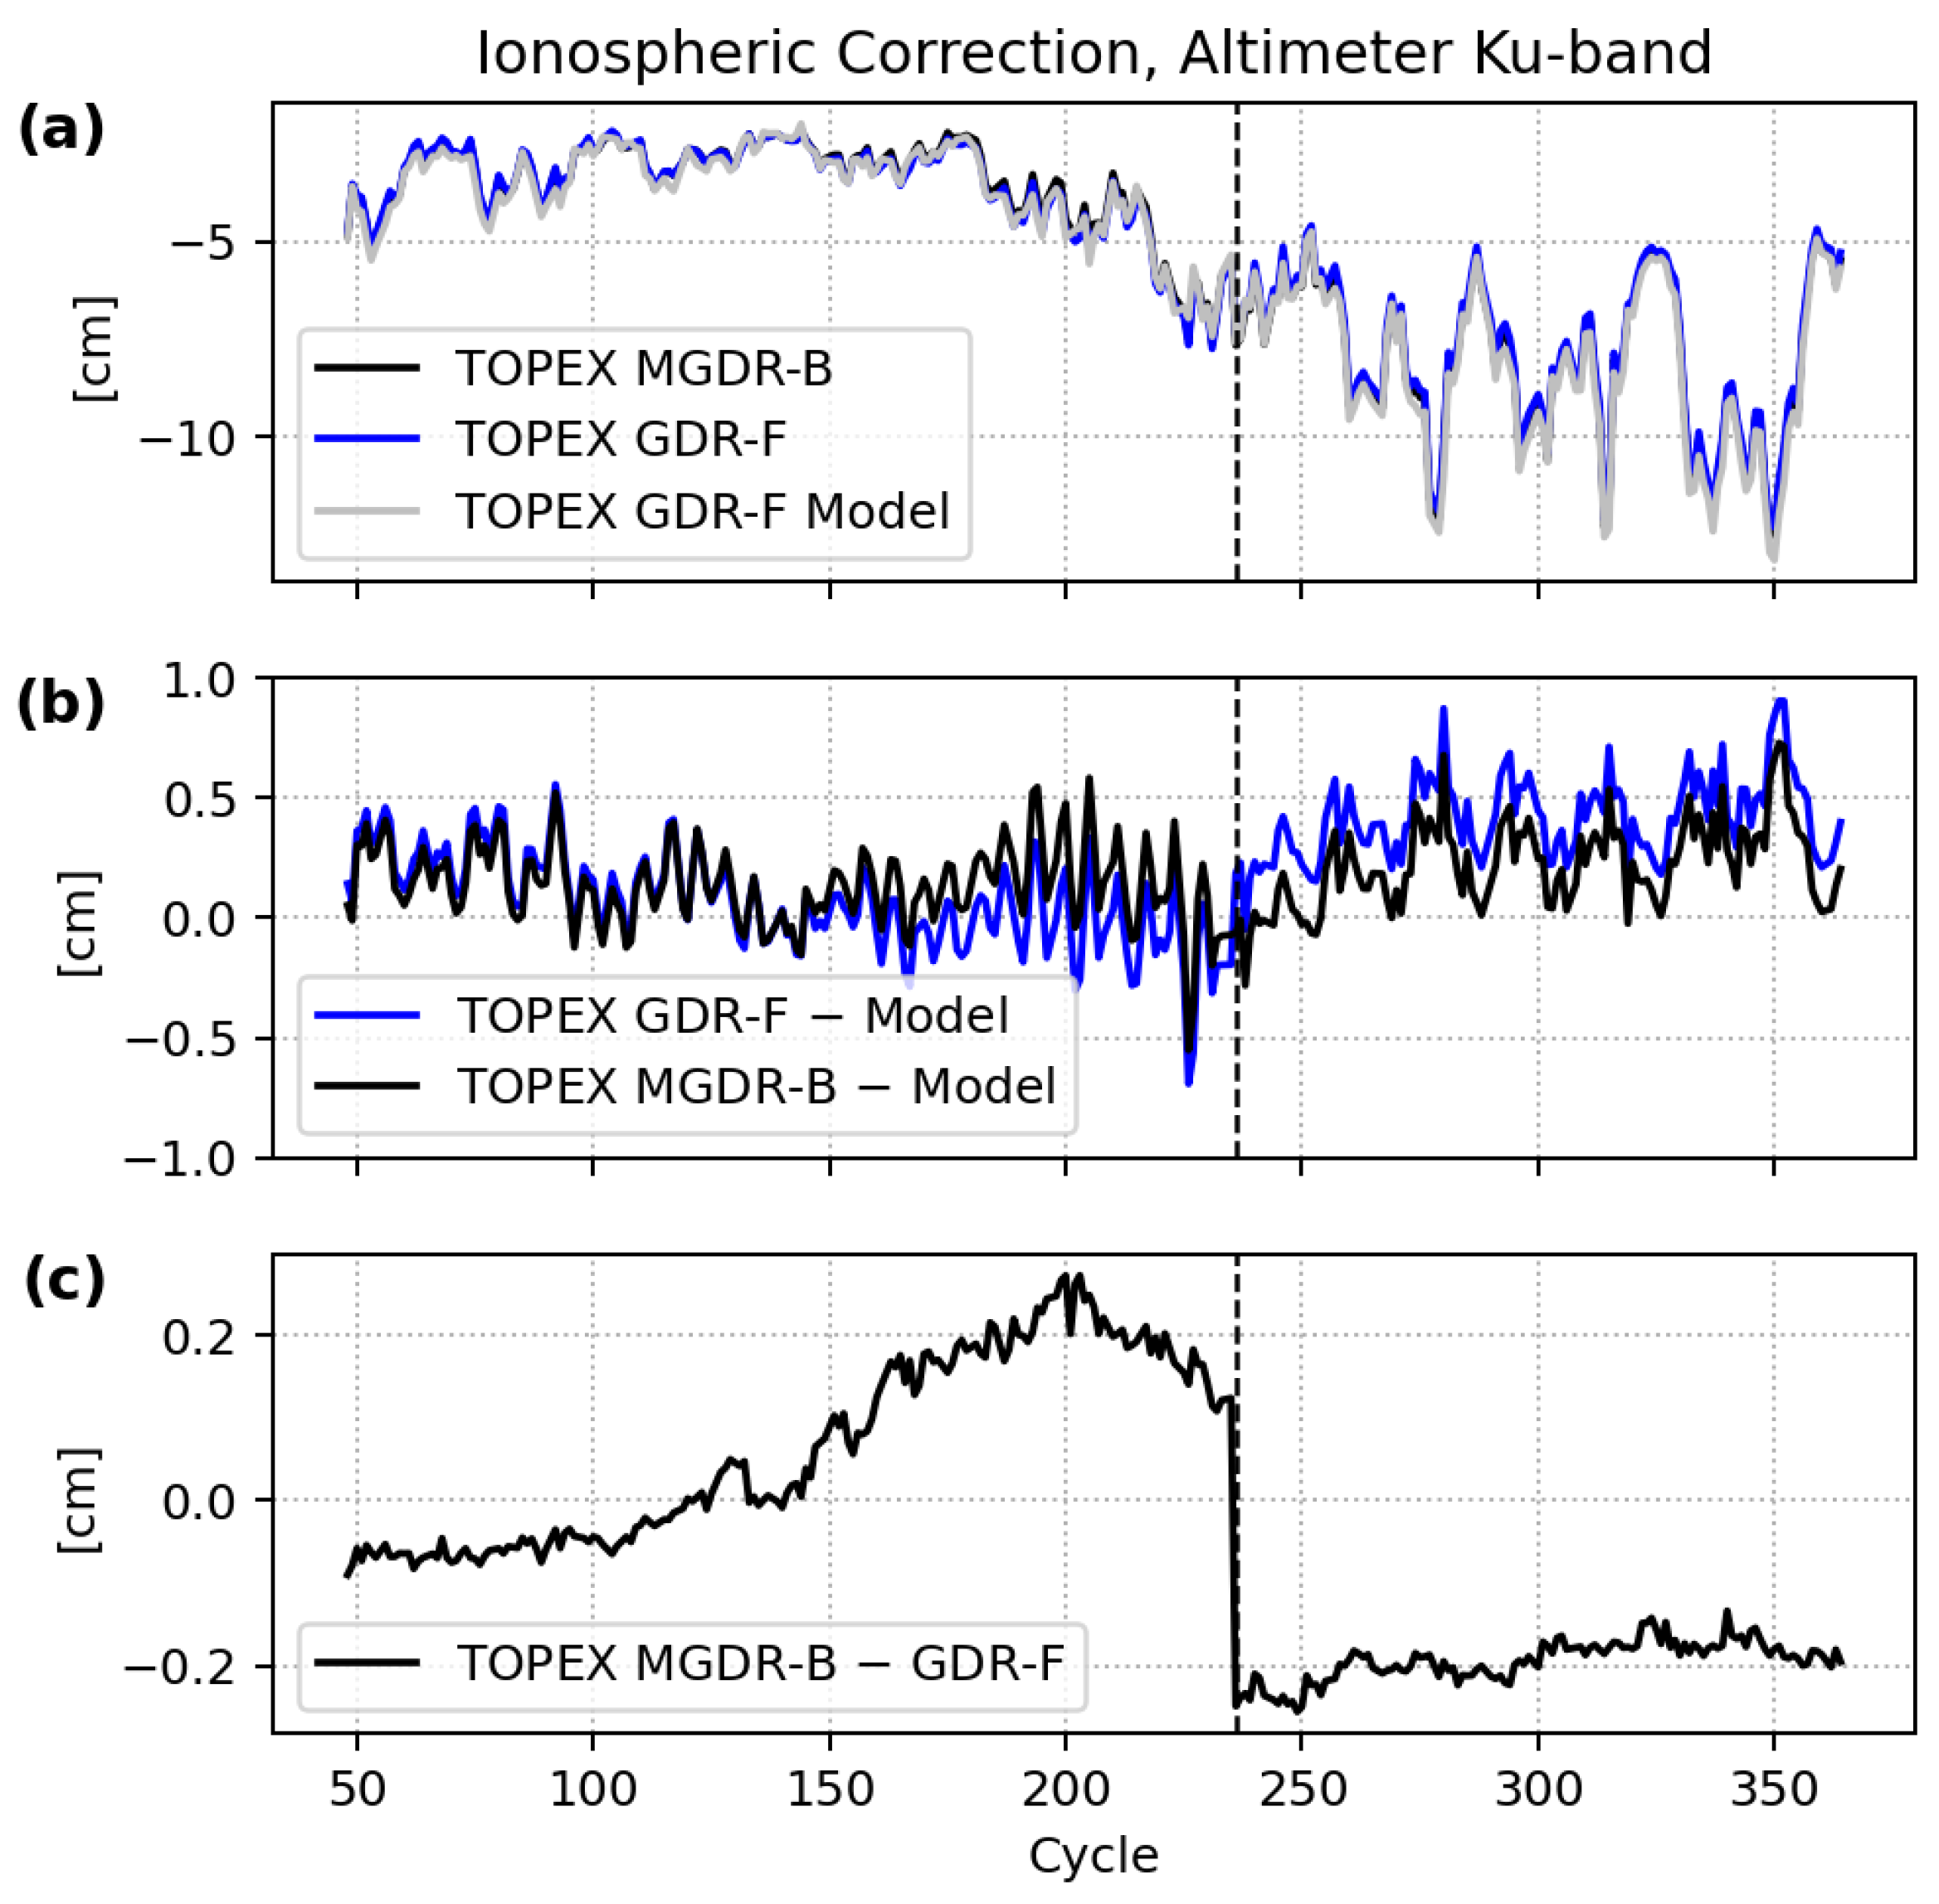
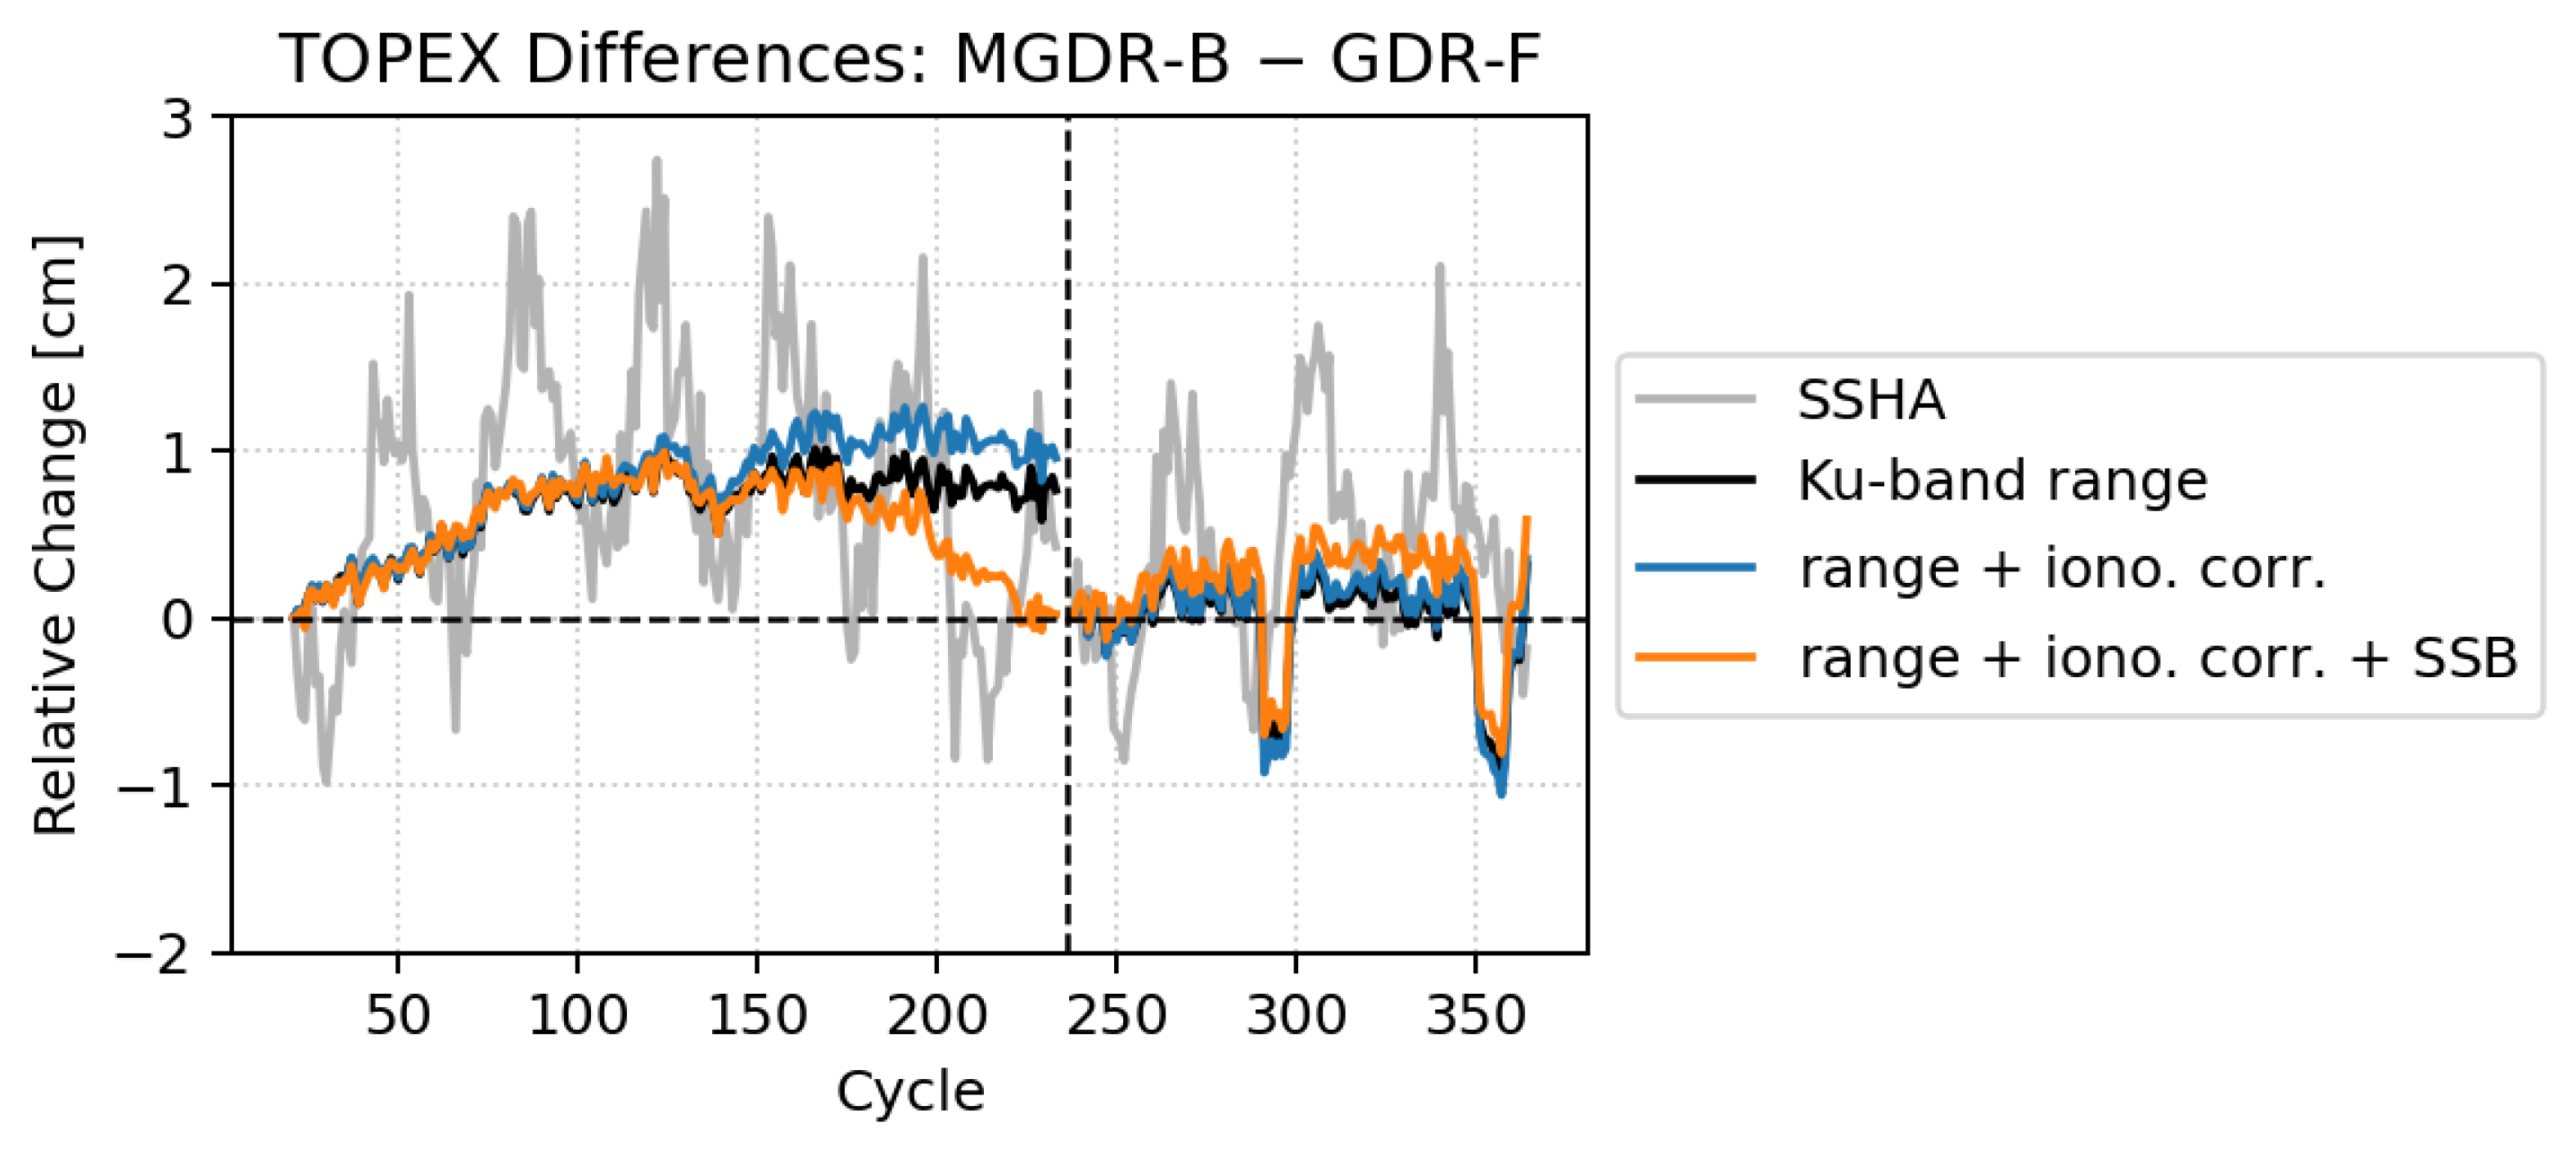
  • Mitigation of the altimeter drift using Cal-1 PTR. This is reflected in improved estimates of range, Significant Wave Height (SWH), and sigma0, which makes the reprocessing independent of external calibrations such as the Wallops correction and yields improved temporal stability. The impact of the numerical retracking on the Ku-band range, ionospheric correction, and SSB (through the SWH) is significant. At the same time, their combined effect on the SSHA from the start to the end of side A cancels, and the impact on the sea level evolution from cycle 21 and 235 is therefore negligible. Accounting for the improved radiometer calibrations results in a net impact of 7 mm from the start to end of side A SSHA.
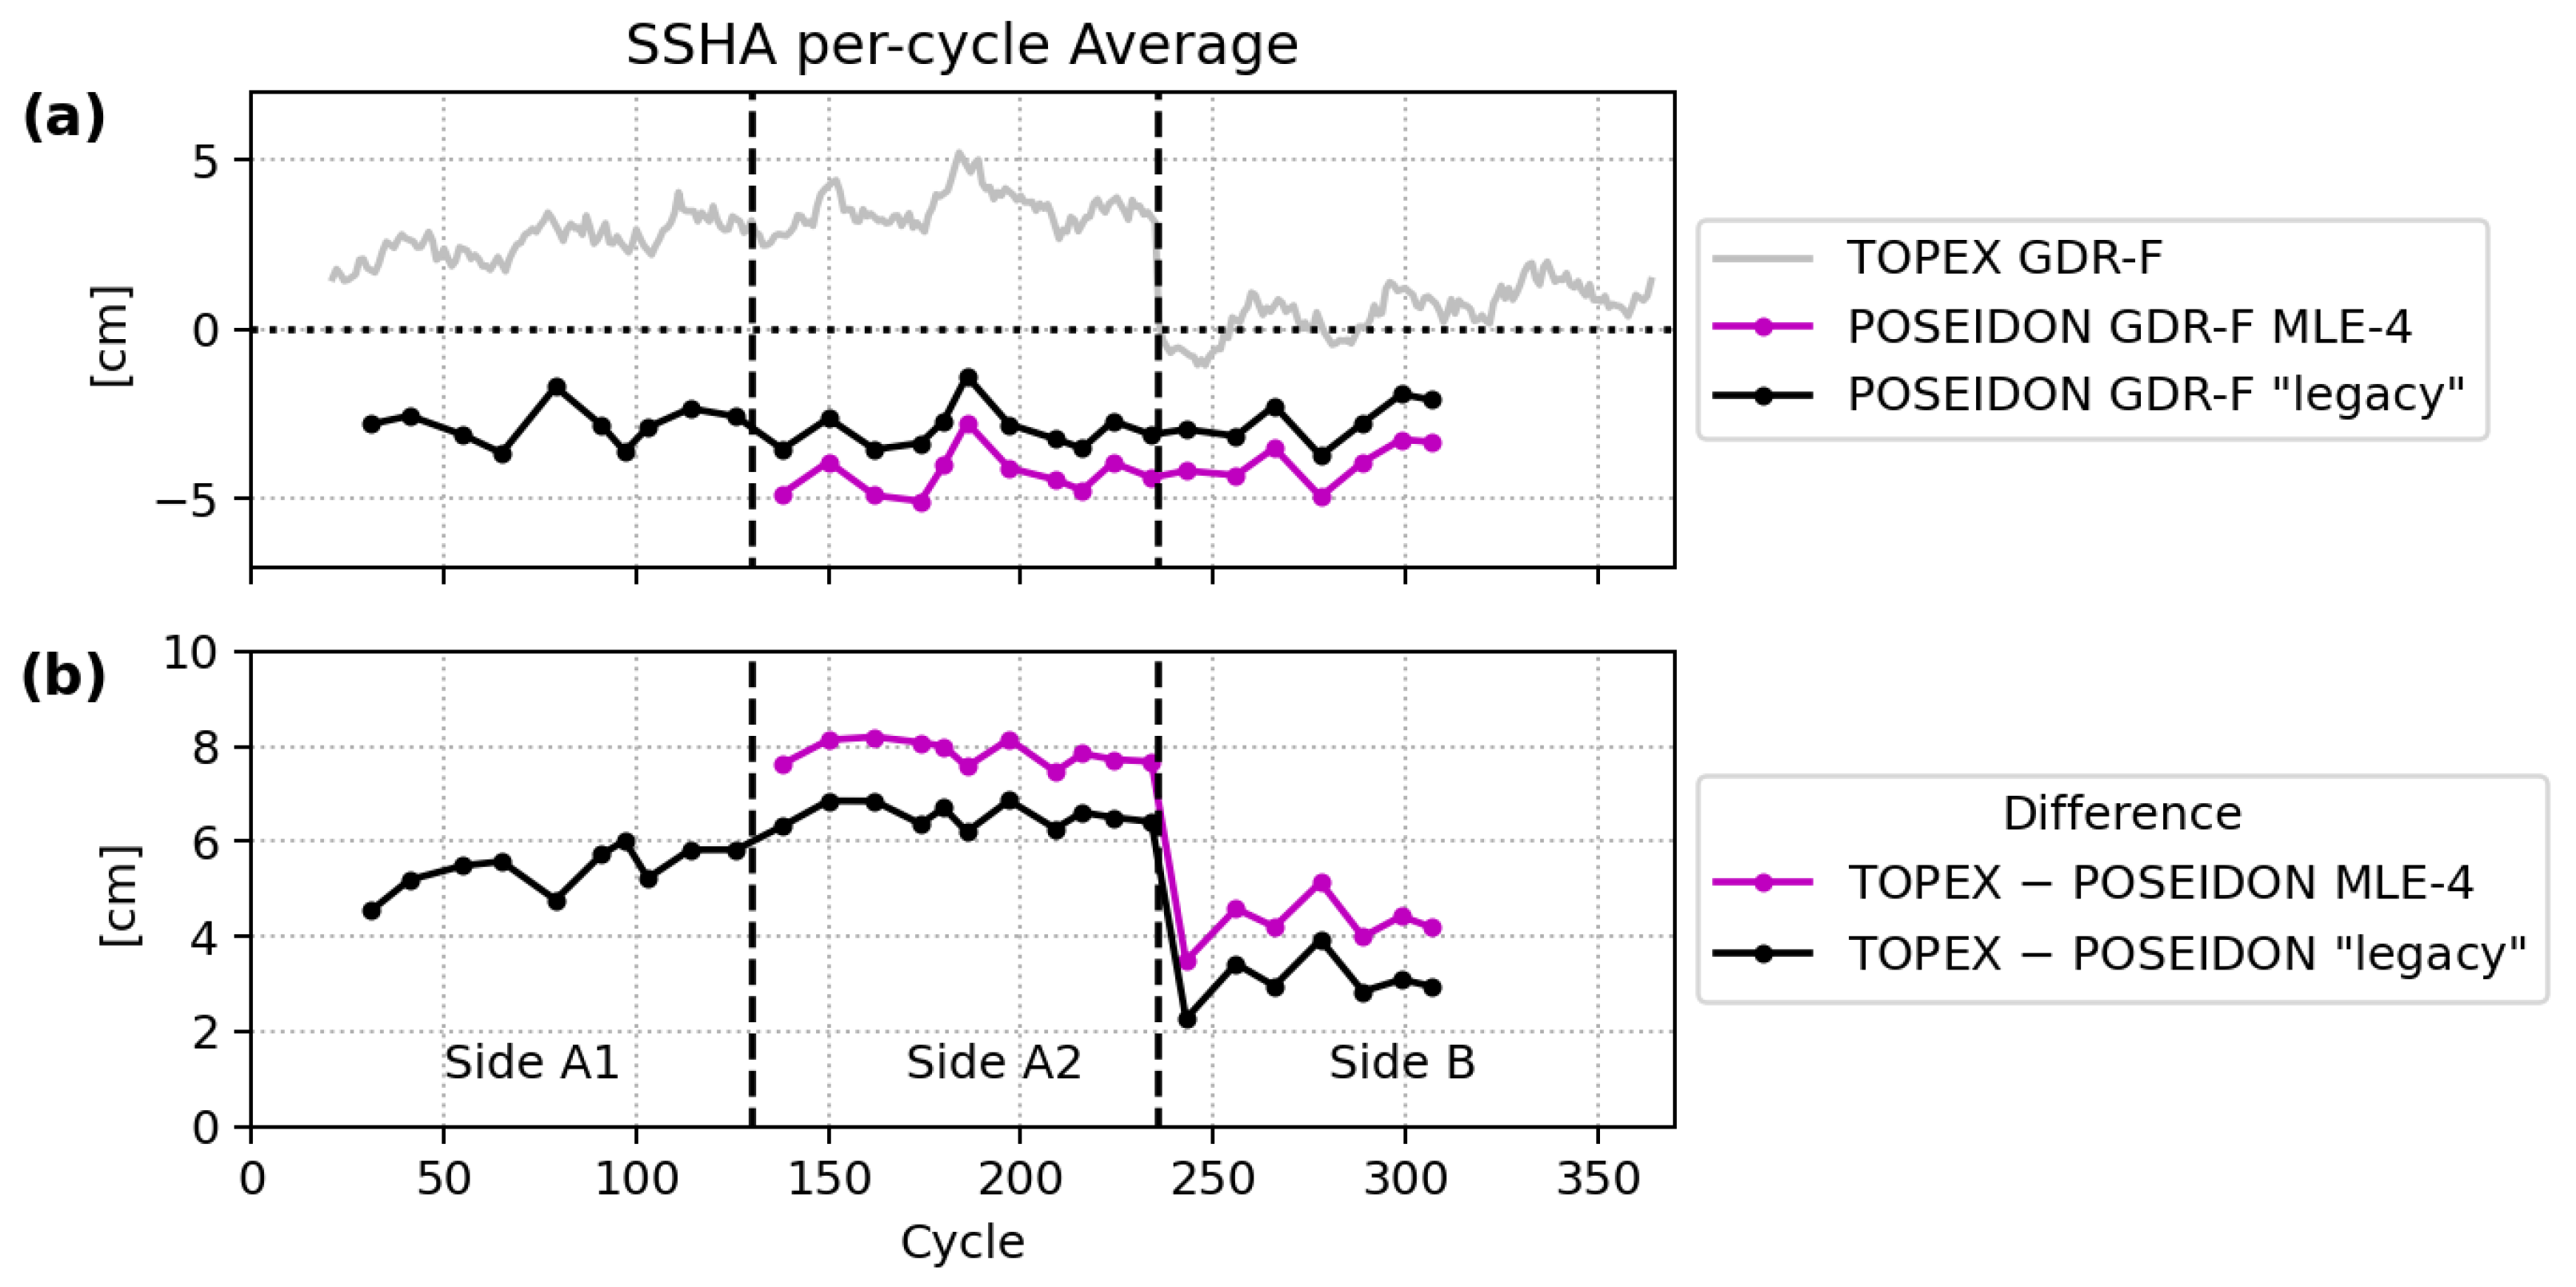
  • Reduction of hemispheric bias by applying dedicated waveform filters during the Cal-2 correction. This significantly reduces hemispheric bias for the derived SWH and altimeter ranges. The impact on SSHA estimates is a reduction of the hemispheric bias of a 4 cm amplitude to less than 1 cm on average. We observed a significant relative drift of 2.6 mm/year between TOPEX and POSEIDON data up to cycle 130. The product handbook cautions users that GDR-F data from TOPEX side A are expected to have larger errors due to scarce Cal-1 sweep calibrations.
The T/P GDR-F product represents a significant step in mitigating known issues with the TOPEX altimeter and microwave radiometer. It provides a dedicated end-of-mission recalibration of the TMR radiometer that eliminates drifts in all three channels, mitigates the 60-day errors related to instrument temperature variations, and applies a near-land path delay algorithm. The GDR-F product also benefits from the significant improvements to the various geophysical models used to generate SSHA that have occurred over the last two decades. While the GDR-F product uses the baseline MLE-3/MLE-4 numerical retracking approach, future studies may find value in investigating the use of alternative retracking approaches on the TOPEX and POSEIDON data. The T/P data record will of course continue to benefit from continued improvements to those geophysical models, such as those used in the most recent GDR-G processing standards that many currently flying altimetry missions are now using.

Author Contributions

Conceptualization: J.-D.D., S.D.D., F.B.-C., P.S.C., J.K.W. and N.P.; Formal Analysis: L.F., M.T. and H.R.; Funding Acquisition: J.K.W., N.P., G.M.S. and T.G.; Investigation: L.F., M.T. and H.R.; Methodology: L.F., M.T., J.-D.D., S.D.D., H.R. and F.B.-C.; Writing—review and editing: L.F., J.-D.D., M.T., S.D.D., H.R., F.B.-C. and J.K.W. All authors have read and agreed to the published version of the manuscript.

Funding

This research was carried out at the Jet Propulsion Laboratory, California Institute of Technology, under a contract with the National Aeronautics and Space Administration (80NM0018D0004). Part of this research was also carried out at the Centre National d’Etudes Spatiales, France, under the SALP infrastructure.

Data Availability Statement

The data presented in this study are openly available in TOPEX/Poseidon. 2023. TOPEX/Poseidon Geophysical Data Record Version F. Ver. F. PO.DAAC, CA, USA. Dataset accessed [28 April 2025] at https://doi.org/10.5067/TPXPS-GDRF1. Topex-Poseidon GDR are produced by JPL and CNES and distributed by POODAC and AVISO. Dataset accessed [28 April 2025] at https://aviso-data-center.cnes.fr/user/ssalto/modules/1874.

Conflicts of Interest

Author Hélène Roinard was employed by the company Collecte Localisation Satellites (CLS). The remaining authors declare that the research was conducted in the absence of any commercial or financial relationships that could be construed as a potential conflict of interest.

Appendix A

Table A1. Summary of updates from MGDR-B to GDR-F version for each parameter of the TOPEX/POSEIDON science data product.
ParameterMGDR-BGDR-F
Significant Wave HeightOnboard (TOPEX), retracked (POSEIDON)Numerical retracking (TOPEX), new MLE-4 retracking for cycles 167–307 (POSEIDON)
Altimeter ProductsRange CorrectionWallops Cal-1 (TOPEX), Point Target Response monitoring (POSEIDON)Numerical retracking (TOPEX), Point Target Response monitoring (POSEIDON)
Sigma0 CorrectionWallops climatological (TOPEX), Point Target Response monitoring (POSEIDON)Numerical retracking (TOPEX), Point Target Response monitoring (POSEIDON)
Altimeter Wind SpeedWitter et al., 1991 [33]Ref. [34] with sigma0 calibration
Sea State Bias CorrectionParametric [18]Non-parametric for TOPEX: 2D SSB [14], 3D SSB [15]. Consistent with GDR-F dataset parametric solution for POSEIDON
Orbit SolutionsOperational GSFC and CNESGSFC (dpod2014v04) (F. Lemoine, pers. comm., 2023), CNES (POE-F) ITRF2014 (A. Couhert, pers. comm., 2023)
Geoid1990s standards (with respect to TOPEX ellipsoid)EGM2008 (with respect to WGS84) [35]
Reference EllipsoidTOPEX ellipsoidWGS84 (height difference with TOPEX ellipsoid provided)
Mean Sea SurfaceOSUMSS95CNES/CLS 2015 [25], DTU18 [36] (with respect to WGS84)
Radiometer (TMR) Wet Path DelayUncalibratedComputed using algorithms from [37], near-land path delay [17], end-of-mission calibration [16]
Atmospheric CorrectionsDynamic Atmospheric CorrectionOnly inverse barometric correction, 1990s standardsComputed using Mog2D model ([38]; Greenberg and Lyard, pers. comm.) forced by ECMWF ERA-Interim [39]
Dry and Wet Troposphere Range CorrectionECMWF operationalECMWF ERA-Interim reanalysis data [39]
Ocean Tide1990s standardsFES2014b [40], GOT4.10c [41]
Geophysical CorrectionsSolid Earth Tide1990s standardsNo change
Internal TideNot availableComputed using model (HRET8.1 [42])
Pole Tide1990s standardsComputed using model [43] with linear mean pole [44]

References

  1. Fu, L.L.; Christensen, E.J.; Yamarone, C.A.J.; Lefebvre, M.L.; Menard, Y.; Dorrer, M.; Escudier, P. TOPEX/POSEIDON mission overview. J. Geophys. Res. 1994, 99, 24369–24381. [Google Scholar] [CrossRef]
  2. Rosmorduc, V.; Roinard, H.; Desai, S.D.; Desjonquères, J.D.; Callahan, P.S.; Bignalet-Cazalet, F. TOPEX/POSEIDON GDR-F Products Handbook. Technical Report. 2023. Available online: https://www.aviso.altimetry.fr/fileadmin/documents/data/tools/hdbk_tpx_grdf.pdf (accessed on 15 June 2025).
  3. Menard, Y.; Fu, L.L.; Escudier, P.; Parisot, F.; Perbos, J.; Vincent, P.; Desai, S.D.; Haines, B.; Kunstmann, G. The Jason-1 Mission Special Issue: Jason-1 Calibration/Validation. Mar. Geod. 2003, 26, 131–146. [Google Scholar] [CrossRef]
  4. Lambin, J.; Morrow, R.; Fu, L.L.; Willis, J.; Bonekamp, H.; Lillibridge, J.; Perbos, J.; Zaouche, G.; Vaze, P.; Bannoura, W.; et al. The OSTM/Jason-2 Mission. Mar. Geod. 2010, 33, 4–25. [Google Scholar] [CrossRef]
  5. Vaze, P.; Neeck, S.; Bannoura, W.; Green, J.; Wade, A.; Mignogno, M.; Zaouche, G.; Couderc, V.; Thouvenout, E.; Parisot, F. The Jason-3 Mission: Completing the Transition of Ocean Altimetry from Research to Operations. In Proceedings of the Sensors, Systems, and Next-Generation Satellites XIV, Toulouse, France, 20–23 September 2010; SPIE: Bellingham, WA, USA, 2010; Volume 7826, pp. 264–268. [Google Scholar]
  6. Donlon, C.J.; Cullen, R.; Giulicchi, L.; Vuilleumier, P.; Francis, C.R.; Kuschnerus, M.; Simpson, W.; Bouridah, A.; Caleno, M.; Bertoni, R.; et al. The Copernicus Sentinel-6 mission: Enhanced continuity of satellite sea level measurements from space. Remote Sens. Environ. 2021, 258, 112395. [Google Scholar] [CrossRef]
  7. Nerem, R. Measuring global mean sea level variations using TOPEX/POSEIDON altimeter data. J. Geophys. Res. 1995, 100, 25135–25151. [Google Scholar] [CrossRef]
  8. Nerem, R.S.; Haines, B.J.; Hendricks, J.; Minster, J.F.; Mitchum, G.T.; White, W.B. Improved determination of global mean sea level variations using TOPEX/POSEIDON altimeter data. Geophys. Res. Lett. 1997, 24, 1331–1334. [Google Scholar] [CrossRef]
  9. Beckley, B.D.; Callahan, P.S.; Hancock, D.W.; Mitchum, G.T.; Ray, R.D. On the “Cal-Mode” correction to TOPEX satellite altimetry and its effect on the global mean sea level time series. J. Geophys. Res. Ocean. 2017, 122, 8371–8384. [Google Scholar] [CrossRef]
  10. Watson, C.S.; White, N.J.; Church, J.A.; King, M.A.; Burgette, R.J.; Legresy, B. Unabated global mean sea-level rise over the satellite altimeter era. Nat. Clim. Change 2015, 5, 565–568. [Google Scholar] [CrossRef]
  11. Benada, J.R. Merged GDR (TOPEX/POSEIDON) Generation B MGDR-B; Technical Report; Physical Oceanography Distributed Active Archive Center: Pasadena, CA, USA, 1997.
  12. Desjonquères, J.D.; Talpe, M.; Callahan, P.; Desai, S.; Willis, J. TOPEX data reprocessing using a numerical retracking approach. In Proceedings of the Ocean Surface Topography Science Team Meeting, Chicago, IL, USA, 21–25 October 2019. [Google Scholar]
  13. Thibaut, P.; Roinard, H.; Picot, N.; Guinle, T. Reprocessing of the Poseidon-1 French Altimeter dataset. In Proceedings of the Ocean Surface Topography Science Team Meeting, Ponta Delgada, Portugal, 24–29 September 2018. [Google Scholar]
  14. Putnam, A.; Desai, S.D.; Nerem, R.S. Estimation of the Sea State Bias Using the Interpolation Method and Applications to Inter-Mission Calibration. Mar. Geod. 2023, 46, 479–495. [Google Scholar] [CrossRef]
  15. Feng, H.; Vandemark, D.; Tran, N.; Desai, S. Sea state bias for retracked TOPEX altimeter data. In Proceedings of the 2019 Ocean Surface Topography Science Team Meeting, Chicago, IL, USA, 21–25 October 2019. [Google Scholar]
  16. Brown, S.; Desai, S.; Keihm, S.; Lu, W. Microwave radiometer calibration on decadal time scales using on-earth brightness temperature references: Application to the TOPEX Microwave Radiometer. J. Atmos. Ocean. Technol. 2009, 26, 2579–2591. [Google Scholar] [CrossRef]
  17. Brown, S. A novel near-land radiometer wet path-delay retrieval algorithm: Application to the Jason-2/OSTM advanced microwave radiometer. IEEE Trans. Geosci. Remote Sens. 2010, 48, 1986–1992. [Google Scholar] [CrossRef]
  18. Gaspar, P.; Ogor, F.; Le Traon, P.Y.; Zanife, O.Z. Estimating the sea state bias of the TOPEX and POSEIDON altimeters from crossover differences. J. Geophys. Res. Ocean. 1994, 99, 24981–24994. [Google Scholar] [CrossRef]
  19. Boy, F.; Desjonquères, J.; Picot, N.; Moreau, T.; Raynal, M. CryoSat-2 SAR-mode over oceans: Processing methods, global assessment, and benefits. IEEE Trans. Geosci. Remote Sens. 2016, 55, 148–158. [Google Scholar] [CrossRef]
  20. Amarouche, L.; Thibaut, P.; Zanife, O.Z.; Dumont, J.P.; Vincent, P.; Steunou, N. Improving the Jason-1 ground retracking to better account for attitude effects. Mar. Geod. 2004, 27, 171–197. [Google Scholar] [CrossRef]
  21. Thibaut, P.; Poisson, J.C.; Bronner, E.; Picot, N. Relative Performance of the MLE3 and MLE4 Retracking Algorithms on Jason-2 Altimeter Waveforms. Mar. Geod. 2010, 33, 317–335. [Google Scholar] [CrossRef]
  22. Bignalet-Cazalet, F.; Maraldi, C.; Cadier, E.; Boy, F.; Guerou, A.; Courcol, B.; Moreau, T.; Dinardo, S.; Martin-Puig, C.; Meloni, M.; et al. Sentinel-6 PDAP products assessment over ocean. In Proceedings of the 2022 Ocean Surface Topography Science Team Meeting, Venice, Italy, 31 October–4 November 2022; p. 275. [Google Scholar] [CrossRef]
  23. Nilsson, J.; Desai, S.D.; Desjonquères, J.D.; Haines, B. Global cross-calibration of the Jason-3 and Sentinel-6 Michael Freilich missions during their tandem period. In Proceedings of the Ocean Surface Topography Science Team Meeting, Venice, Italy, 31 October–4 November 2022. [Google Scholar] [CrossRef]
  24. Roinard, H.; Bignalet-Cazalet, F.; Picot, F.; Piras, F.; Coquelin, J. Jason-3 GDR-F mission performances over ocean. In Proceedings of the Ocean Surface Topography Science Team Meeting, Venice, Italy, 31 October–4 November 2022. [Google Scholar] [CrossRef]
  25. Pujol, M.I.; Schaeffer, P.; Faugère, Y.; Raynal, M.; Dibarboure, G.; Picot, N. Gauging the improvement of recent mean sea surface models: A new approach for identifying and quantifying their errors. J. Geophys. Res. Ocean. 2018, 123, 5889–5911. [Google Scholar] [CrossRef]
  26. Hayne, G.S.; Hancock, D.W., III; Purdy, C.L.; Callahan, P.S. The corrections for significant wave height and attitude effects in the TOPEX radar altimeter. J. Geophys. Res. 1994, 99, 24941–24955. [Google Scholar] [CrossRef]
  27. Hancock, D.W.; Hayne, G.S.; Brooks, R.L.; Lee, J.E.; Lockwood, D.W. TOPEX Radar Altimeter Engineering Assessment Report Update: From Launch to Turn-Off of Side-A on 10 February 1999; Technical Report NASA/TM-2003-213336/Vol.12; NASA Goddard Space Flight Center: Greenbelt, MD, USA, 1999.
  28. Imel, D. Evaluation of the TOPEX dual-frequency ionosphere correction. J. Geophys. Res. 1994, 99, 24895–24905. [Google Scholar] [CrossRef]
  29. Mannucci, A.; Wilson, B.; Yuan, D.; Ho, C.; Lindqwister, U.; Runge, T. A global mapping technique for GPS-derived ionospheric total electron content measurements. Radio Sci. 1998, 33, 565–582. [Google Scholar] [CrossRef]
  30. Ablain, M.; Philipps, S. TOPEX/POSEIDON Validation Activities. 13 Years of T/P Data (GDR-Ms); Technical report; AVISO: Ramonville St-Agne, France, 2006. [Google Scholar]
  31. Quet, V.; Octau, F.; Mangilli, A.; Prandi, P.; Meyssignac, B.; Ablain, M.; Dibarboure, G. Estimation of the TOPEX A/TOPEX B bias—A multi methods approach. In Proceedings of the OSTST 2023, San Juan, Puerto Rico, 7–11 November 2023. [Google Scholar]
  32. Ruf, C. Detection of calibration drifts in spaceborne microwave radiometer using a vicarious cold reference. IEEE Trans. Geosci. Remote Sens. 2000, 38, 44–52. [Google Scholar] [CrossRef]
  33. Witter, D.L.; Chelton, D.B. A Geosat altimeter wind speed algorithm and a method for altimeter wind speed algorithm development. J. Geophys. Res. 1991, 96, 8853–8860. [Google Scholar] [CrossRef]
  34. Collard, F.; Labroue, S. New wind speed algorithms for Jason-1, 2004. In Proceedings of the Ocean Surface Topography Science Team Meeting, St. Petersburg, FL, USA, 4–6 November 2004. [Google Scholar]
  35. Pavlis, N.K.; Holmes, S.A.; Kenyon, S.C.; Factor, J.K. The development and evaluation of the Earth Gravitational Model 2008 (EGM2008). J. Geophys. Res. Solid Earth 2012, 117, B04406. [Google Scholar] [CrossRef]
  36. Andersen, O.A.; Knudsen, P.; Stenseng, L. The DTU18 MSS mean sea surface-technical description. In Proceedings of the 2018 Ocean Surface Topography Science Team Meeting, Ponta Delgada, São Miguel Island, Azores Archipelago, Portugal, 24–28 September 2018. [Google Scholar]
  37. Keihm, S.; Janssen, M.; Ruf, C. TOPEX/POSEIDON microwave radiometer (TMR): III. Wet troposphere range correction algorithm and pre-launch error budget. IEEE Trans. Geosci. Remote Sens. 1995, 33, 147–161. [Google Scholar] [CrossRef]
  38. Lynch, D.; Gray, W. A wave equation model for finite element tidal computations. Comput. Fluids 1979, 7, 207–228. [Google Scholar] [CrossRef]
  39. Dee, D.P.; Uppala, S.M.; Simmons, A.J.; Berrisford, P.; Poli, P.; Kobayashi, S.; Andrae, U.; Balmaseda, M.A.; Balsamo, G.; Bauer, D.P.; et al. The ERA-Interim reanalysis: Configuration and performance of the data assimilation system. Q. J. R. Meteorol. Soc. 2011, 137, 553–597. [Google Scholar] [CrossRef]
  40. Carrère, L.; Lyard, F.; Cancet, M.; Guillot, A.; Picot, N. FES 2014, a new tidal model—Validation results and perspectives for improvements. In Proceedings of the ESA Living Planet Symposium, Prague, Czech Republic, 9–13 May 2016; pp. 9–13. [Google Scholar]
  41. Ray, R. Precise comparisons of bottom-pressure and altimetric ocean tides. J. Geophys. Res. Ocean. 2013, 118, 4570–4584. [Google Scholar] [CrossRef]
  42. Zaron, E.D. Baroclinic tidal sea level from exact-repeat mission altimetry. J. Phys. Oceanogr. 2019, 49, 193–210. [Google Scholar] [CrossRef]
  43. Desai, S.; Wahr, J.; Beckley, B. Revisiting the pole tide for and from satellite altimetry. J. Geod. 2015, 89, 1233–1243. [Google Scholar] [CrossRef]
  44. Ries, J.C.; Desai, S.D. Conventional model update for rotational deformation. In Proceedings of the Fall AGU Meeting, New Orleans, LA, USA, 11–15 December 2017. [Google Scholar]
Figure 1. Relative fraction of good-quality open-ocean TOPEX altimeter data from GDR-F versus MGDR shown by black dots. We define “good quality” here as non-defaulted, open-ocean data points based on the same ocean mask (from GDR-F) and applying the respective altimeter quality flags available in each product (altimeter range, SWH, sigma0, waveform attitude, and echo type quality flags). Vertical white lines correspond to cycles when the POSEIDON altimeter was active instead of TOPEX.
Remotesensing 17 02418 g001
Figure 2. TOPEX SSHA crossover time series: per-cycle standard deviation of SSHA differences between ascending and descending passes for TOPEX MGDR-B (black) and GDR-F (blue), covering cycles 21 to 365. The dashed line represents the time at which the TOPEX altimeter was switched from side A to side B, at cycle 235.
Remotesensing 17 02418 g002
Figure 3. TOPEX SSHA crossover differences displayed as 5-degree-binned averages for MGDR-B (a) and GDR-F (b). These maps cover cycles 344–364, which correspond to TOPEX side B and the tandem period with Jason-1.
Remotesensing 17 02418 g003
Figure 4. Along-track SSHA per-cycle standard deviation with TOPEX MGDR-B (black) and TOPEX GDR-F (blue). The dashed line represents the time at which the TOPEX altimeter was switched from side A to side B, at cycle 235.
Remotesensing 17 02418 g004
Figure 5. SSHA performance along-track: per-cycle variance with MGDR-B in black, GDR-F in blue, and MGDR-B with Mean Sea Surface (MSS) from GDR-F in orange. The dashed line represents the time at which the TOPEX altimeter was switched from side A to side B, at cycle 235.
Remotesensing 17 02418 g005
Figure 6. Average of relative, GDR-F–MGDR-B, along-track SSHA variance for TOPEX side B (cycles 236–365) when substituting GDR-F parameters into MGDR-B SSHA. The blue bar represents the total improvement of the GDR-F SSHA performance relative to MGDR-B. The subsequent bars show the relative improvement for each of the SSHA components: mean sea surface (orange), tides (ocean, solid earth, internal, and pole tide) (green), inverse barometer and dynamic atmospheric correction (red), sea state bias and ionospheric correction (purple), Ku-band range (brown), model dry and radiometer wet tropospheric correction (pink), GSFC orbit (gray).
Remotesensing 17 02418 g006
Figure 7. Performance improvement for TOPEX GDR-F SSHA compared to Jason-1 GDR-E SSHA: panel (a) shows the per-cycle standard deviation of SSHA differences; panels (b,c) show the average of the SSHA differences over cycles 344–364, spanning 209 days from 15 January until 11 August 2002.
Remotesensing 17 02418 g007
Figure 8. Performance improvement for TOPEX GDR-F SSHA compared to Jason-1 GDR-E SSHA: panel (a) shows the per-cycle standard deviation of SSHA differences; panel (b) shows the average of the SSHA differences over cycles 344–364.
Remotesensing 17 02418 g008
Figure 9. Per-cycle standard deviation of the TOPEX vs. Jason-1 uncorrected SSHA differences (orbit–range–MSS). The black curve shows results for the MGDR-B orbit solution and range estimates, while the orange and blue curves show the performance after sequentially applying orbit and range updates from MGDR-B to GDR-F, respectively.
Remotesensing 17 02418 g009
Figure 10. Significant Wave Height (SWH) time series for the Ku-band (a,b) and C-band (c,d): Panel (a,c) shows the per-cycle averages of MGDR-B (black) with GDR-F (blue) and the model (gray). A 30-cycle smoothing window was applied to side A and side B separately. Panels (b,d) show the difference between SWH measured with the altimeter and the SWH from the MFWAM global wave model for each of MGDR-B (black) and GDR-F (blue). No smoothing was applied here. The dashed line represents the time at which the TOPEX altimeter was switched from side A to side B, at cycle 235.
Remotesensing 17 02418 g010
Figure 11. Time series of per-cycle averages for Ku-band sigma0 for TOPEX MGDR-B (black) and GDR-F (blue). The dashed line represents the time at which the TOPEX altimeter was switched from side A to side B, at cycle 235.
Remotesensing 17 02418 g011
Figure 12. Altimeter wind speed (a) for MGDR-B (black), GDR-F (blue), and ERA5 model (gray) showing per-cycle mean values, smoothed by a 30-cycle window along track. (b) Differences between altimeter and model wind speeds for MGDR-B (black) and GDR-F (blue). (c) Difference between MGDR-B and GDR-F. The dashed line represents the time at which the TOPEX altimeter was switched from side A to side B, at cycle 235.
Remotesensing 17 02418 g012
Figure 13. Ku-band ionospheric delay, per-cycle average. (a) MGDR-B in black, GDR-F in blue, and GIM model in gray. (b) Difference between MGDR-B/GDR-F and model (black/blue). (c) Difference between MGDR-B and GDR-F. The GIM model is available starting at cycle 48; differences with the altimeter estimates are therefore limited to this cycle range. The dashed line represents the time at which the TOPEX altimeter was switched from side A to side B, at cycle 235.
Remotesensing 17 02418 g013
Figure 14. Per-cycle averages of differences between TOPEX MGDR-B and GDR-F for Ku-band ranges (black), as well as corrected range estimates by applying the Ku-band ionospheric correction (blue) and sea state bias (orange). For reference, the gray line shows the SSHA difference, here for GDR-F–MGDR-B to match the sign of the components. Offsets were applied to each of these curves, and for sides A and B separately, to align them at zero, as shown in Table 1. The dashed line represents the time at which the TOPEX altimeter was switched from side A to side B, at cycle 235.
Remotesensing 17 02418 g014
Figure 15. TOPEX SSHA crossover differences between ascending and descending passes, averaged over 5 deg latitude/longitude bins. Panel (a) shows the GDR-F SSHA modified with the Ku-band range from MGDR-B and panel (b) shows GDR-F SSHA, both covering cycles 344–365.
Remotesensing 17 02418 g015
Figure 16. Range update mitigates hemispheric bias: SSHA comparison between TOPEX and Jason-1, 5 deg binned average. Difference between ascending and descending passes for cycles 344–365. (a) SSHA TOPEX GDR-F, modified by swapping out the Ku-band range from MGDR-B. (b) SSHA TOPEX GDR-F.
Remotesensing 17 02418 g016
Figure 17. (a) Along-track SSHA per-cycle standard deviation and (b) per-cycle standard deviation of SSHA crossover differences for POSEIDON GDR-F “legacy” (black), GDR-F MLE-4 (magenta), and reference TOPEX GDR-F (gray).
Remotesensing 17 02418 g017
Figure 18. SSHA per-cycle average comparison between TOPEX and POSEIDON. (a) TOPEX GDR-F (gray), POSEIDON GDR-F using the MLE-4 retracker (magenta), and GDR-F using the “legacy” (MGDR) retracker (black). (b) Difference of SSHA per-cycles averages for TOPEX GDR-F – POSEIDON MLE-4 (magenta) and TOPEX GDR-F – POSEIDON "legacy" MGDR (black). The dashed lines separate side A1 from A2 and B. The POSEIDON MLE-4 product (magenta) is available between cycles 138 and 307. Outside of that cycle range, POSEIDON does not provide retracked waveforms.
Remotesensing 17 02418 g018
Figure 19. (a) Radiometer wet path delay per-cycle average for MGDR-B (black), GDR-F (blue), and modeled wet path delay from ERA-Interim reanalysis (gray). (b) Difference between radiometer wet path delays (MGDR-B in black, GDR-F in blue) and re-analysis. (c) Difference between radiometer wet path delays for MGDR-B minus GDR-F. The dashed line represents the time at which the TOPEX altimeter was switched from side A to side B, at cycle 235.
Remotesensing 17 02418 g019
Figure 20. Radiometer wet path delay difference between TOPEX and Jason-1 GDR-E during their tandem phase (cycles 344–365), averaged over 5-degree bins: (a) MGDR-B and (b) GDR-F.
Remotesensing 17 02418 g020
Figure 21. TOPEX SSHA crossover differences between ascending and descending passes, averaged over 5 deg latitude/longitude bins. Panel (a) shows the SSHA modified with the MGDR-B orbit and panel (b) shows GDR-F SSHA, both covering cycles 344–365.
Remotesensing 17 02418 g021
Table 1. Summary of offsets applied to each parameter combination shown in Figure 14 to align them to start at zero, for each of side A and side B. In addition, the side A and side B peak and end values for each of the parameter combinations, after applying the offsets, are provided.
Side A [cm]Side B [cm]
OffsetPeakEndOffsetPeakEnd
SSHA1.42.70.3−1.12.0−0.2
Range2.21.00.80.50.30.3
Range + Iono2.21.31.00.30.30.4
Range + Iono + SSB5.01.00.02.40.60.6
Disclaimer/Publisher’s Note: The statements, opinions and data contained in all publications are solely those of the individual author(s) and contributor(s) and not of MDPI and/or the editor(s). MDPI and/or the editor(s) disclaim responsibility for any injury to people or property resulting from any ideas, methods, instructions or products referred to in the content.

