Article

Beyond Algorithm Updates: A Systematic Validation of GPM DPR-V07 over China’s Multiscale Topography

1
College of Geography and Remote Sensing Science, Xinjiang University, Urumqi 830046, China
2
College of Hydrology and Water Resources, Hohai University, Nanjing 210098, China
3
National Key Laboratory of Water Disaster Prevention, Hohai University, Nanjing 210098, China
4
School of Geographic Information and Tourism, Chuzhou University, Chuzhou 239000, China
5
College of Geography and Environmental Sciences, Zhejiang Normal University, Jinhua 321004, China
*
Author to whom correspondence should be addressed.
These authors contributed equally to this work.
Remote Sens. 2025, 17(14), 2410; https://doi.org/10.3390/rs17142410
Submission received: 16 May 2025 / Revised: 9 July 2025 / Accepted: 10 July 2025 / Published: 12 July 2025

Abstract

The Global Precipitation Measurement (GPM) mission’s Dual-Frequency Precipitation Radar (DPR) serves as a critical benchmark for calibrating satellite-based precipitation products, with its retrieval quality directly governing the accuracy of global precipitation estimates. While the updated version 07 (DPR-V07) algorithm introduces substantial refinements over its predecessor (DPR-V06), systematic evaluations of its operational advancements in precipitation monitoring remain limited. This study utilizes ground-based rain gauge data from Mainland China (2015–2018) to assess improvements of DPR-V07 over its predecessor’s (DPR-V06) effects. The results indicate that DPR-V07 reduces the high-altitude precipitation underestimation by 5% (vs. V06) in the west (W) and corrects the elevation-linked overestimation via an improved terrain sensitivity. The seasonal analysis demonstrates winter-specific advancements of DPR-V07, with a 3–8% reduction in the miss bias contributing to a lower total bias. However, the algorithm updates yield unintended trade-offs: the High-Sensitivity Scan (HS) mode exhibits significant detection performance degradation, particularly in east (E) and midwest (M) regions, with Critical Success Index (CSI) values decreasing by approximately 0.12 compared to DPR-V06. Furthermore, summer error components show a minimal improvement, suggesting unresolved challenges in warm-season retrieval physics. This study establishes a systematic framework for evaluating precipitation retrieval advancements, providing critical insights for future satellite algorithm development and operational applications in hydrometeorological monitoring.

1. Introduction

Precipitation is a critical input for hydrological simulations and flood forecasting, but it exhibits high spatiotemporal variability and heterogeneity. Rain gauges provide point observations and are often considered the “ground truth” for validating precipitation estimates from radar or satellite retrievals [1]. However, the uneven spatial distribution of rain gauges and their high maintenance costs make it impractical to obtain large-scale precipitation data [2]. In addition to direct observations from rain gauges, weather radars can indirectly estimate precipitation through the reflectivity–rainfall rate (Z-R) relationship [3]. Nevertheless, ground-based weather radars have been shown to have many errors due to ground clutter, signal attenuation, and a limited coverage [4].
While spaceborne radars also face limitations, such as near-surface blind zones caused by ground clutter, they overcome many of the spatial constraints of ground-based systems by providing global coverage, particularly over oceans and sparsely populated regions where conventional observations are sparse [5]. The successful launch of the Tropical Rainfall Measuring Mission (TRMM) in 1997 marked a milestone in spaceborne precipitation radar observation, as it carried the first Ku-band precipitation radar (PR) at 14 GHz [6]. The PR has several significant advantages for measuring precipitation, such as accurate calibration, a downward-looking geometry, and an absence of beam blockage, all of which significantly enhance the accuracy of TRMM retrievals [7]. A persistent challenge in satellite precipitation retrieval stems from the inherent uncertainty in the radar reflectivity-to-rain rate (Z-R) conversion, primarily driven by spatiotemporal variations in raindrop size distributions (DSDs) across climatic regimes and seasonal cycles [8].
Building on the TRMM’s legacy, the U.S.–Japan collaborative Global Precipitation Measurement (GPM) mission launched its Core Observatory in 2014, extending the precipitation observation coverage from tropical to mid-latitude regions [9]. As the successor to the TRMM, the GPM has expanded its observational coverage from the tropics to the mid-latitude. More importantly, it is equipped with the first Dual-Frequency Precipitation Radar (DPR), consisting of a Ku-band at 13.6 GHz and an additional Ka-band at 35.5 GHz [10]. This addresses the TRMM’s limitations through three synergistic mechanisms. First, the Ka-band’s enhanced sensitivity to smaller hydrometeors enables direct DSD parameter retrieval, effectively decoupling Z-R relationships from regional precipitation microphysics [10]. Second, differential attenuation characteristics between the two frequencies permit the precise identification of precipitation phase transitions, improving the precipitation classification accuracy compared to TRMM-era retrievals [11]. Third, the Ka-band’s narrow-beam detection extends observational sensitivity to light precipitation (<0.5 mm/h), a fivefold improvement over the TRMM’s detection threshold [12].
As the calibration reference for satellite-based microwave and infrared precipitation measurements in the GPM system, the accuracy of the DPR directly affects the quality of satellite retrieval precipitation data, especially in ungauged regions [13]. The error characteristics and algorithmic structures of spaceborne radars have been the subject of considerable interest, and previous researchers have conducted relevant studies. The early TRMM-PR underwent various validations and generally performed well under conditions of minimal signal attenuation [14,15]. In addition, the DPR exhibits a significantly improved precipitation quantification performance due to the incorporation of Ka-band and algorithmic improvements compared to the PR [16].
The initial version of the DPR (DPR-V03), launched with the GPM Core Observatory in 2014, marked a significant leap from its TRMM-PR predecessor, showing a 21.1% higher detection frequency for precipitation than the PR, and the total precipitation it detects is 1.9% higher than that of the PR [12]. Subsequent iterations further refined these capabilities: V04 introduced multi-scan optimization strategies that achieved 1.7× and 2.53× improvements in total and light precipitation detection rates, respectively, compared to the TRMM-PR, while simultaneously mitigating the high-altitude overestimation through enhanced terrain compensation algorithms [16,17].
Regional evaluations revealed nuanced performance characteristics. In Mediterranean climates, DPR-V04’s Normal Scan (NS) mode outperformed High-Sensitivity (HS) and Match Scan (MS) modes in precipitation quantification accuracy, particularly under orographic precipitation regimes [18]. The DPR-V05 algorithm demonstrated exceptional consistency with ground radar networks in the southeastern United States, achieving correlation coefficients of 0.9 (Ku-band) and 0.85 (Ka-band) through an improved phase discrimination in convective systems [19].
The DPR V06 iteration represents the most balanced performance profile to date, reducing land/ocean precipitation underestimations to 7% and 2%, respectively, through an advanced path-integrated attenuation correction [20]. Building upon these advancements, the latest version of the DPR, version 07 (DPR-V07), was released in 2022 [8]. Compared to the previous version, DPR-V07 exhibits substantial algorithmic improvements, primarily including (1) improved sidelobe suppression, (2) an extension of the application of the dual-frequency technique to the entire swath with 49 angle bins, and (3) an enhanced rain and bright band quantification performance [21]. Recent studies have shown that the DPR-V07 improves the precipitation quantification performance in the United States compared to DPR-V06, effectively reducing the overall average reflectivity bias between WSR-88D and the DPR from 2.4 dB in DPR-V06 to 1.0 dB in DPR-V07 [22]. However, the efficacy of these advancements in regions with sparse calibration infrastructure, particularly high-altitude areas and monsoonal regimes, remains unverified. This knowledge gap underscores the critical need for a systematic evaluation across underrepresented geographies to assess the algorithm’s global robustness.
The DPR underwent rigorous ground validation and the development of a retrieval database development prior to its release [23]. However, this is primarily based on Weather Surveillance Rader 1988-Doppler (WSR-88D) precipitation ground radars in the mid-eastern United States [24], while extensive in situ measurement data from China have not been included in the correction or retrieval process. Moreover, the terrain of Mainland China is more complex and diverse than that of the United States, which better reflects the performance of the DPR in complex terrain. Investigating the improvements of DPR-V07 over DPR-V06 in sparsely corrected regions will provide valuable guidance for the iteration of DPR algorithms. Mainland China is therefore well suited as a validation region for the DPR.
Given the scarcity of comparative studies on DPR precipitation data before and after this improvement, the objectives of this study are twofold: (1) to evaluate the effectiveness and sources of error of the new generation DPR-V07 compared to DPR-V06 in Mainland China and (2) to investigate the influence of altitude on the detection effect before and after the update of the DPR algorithm. It is worth noting that this study compares instantaneous precipitation rate estimates from the DPR with hourly accumulated ground observations, which introduces a temporal scale mismatch. In cases where precipitation events are brief or localized, this mismatch may lead to the underestimation of detection metrics, such as the probability of detection. This limitation is considered in the interpretation of our results and discussed further in Section 4.

2. Datasets and Methods
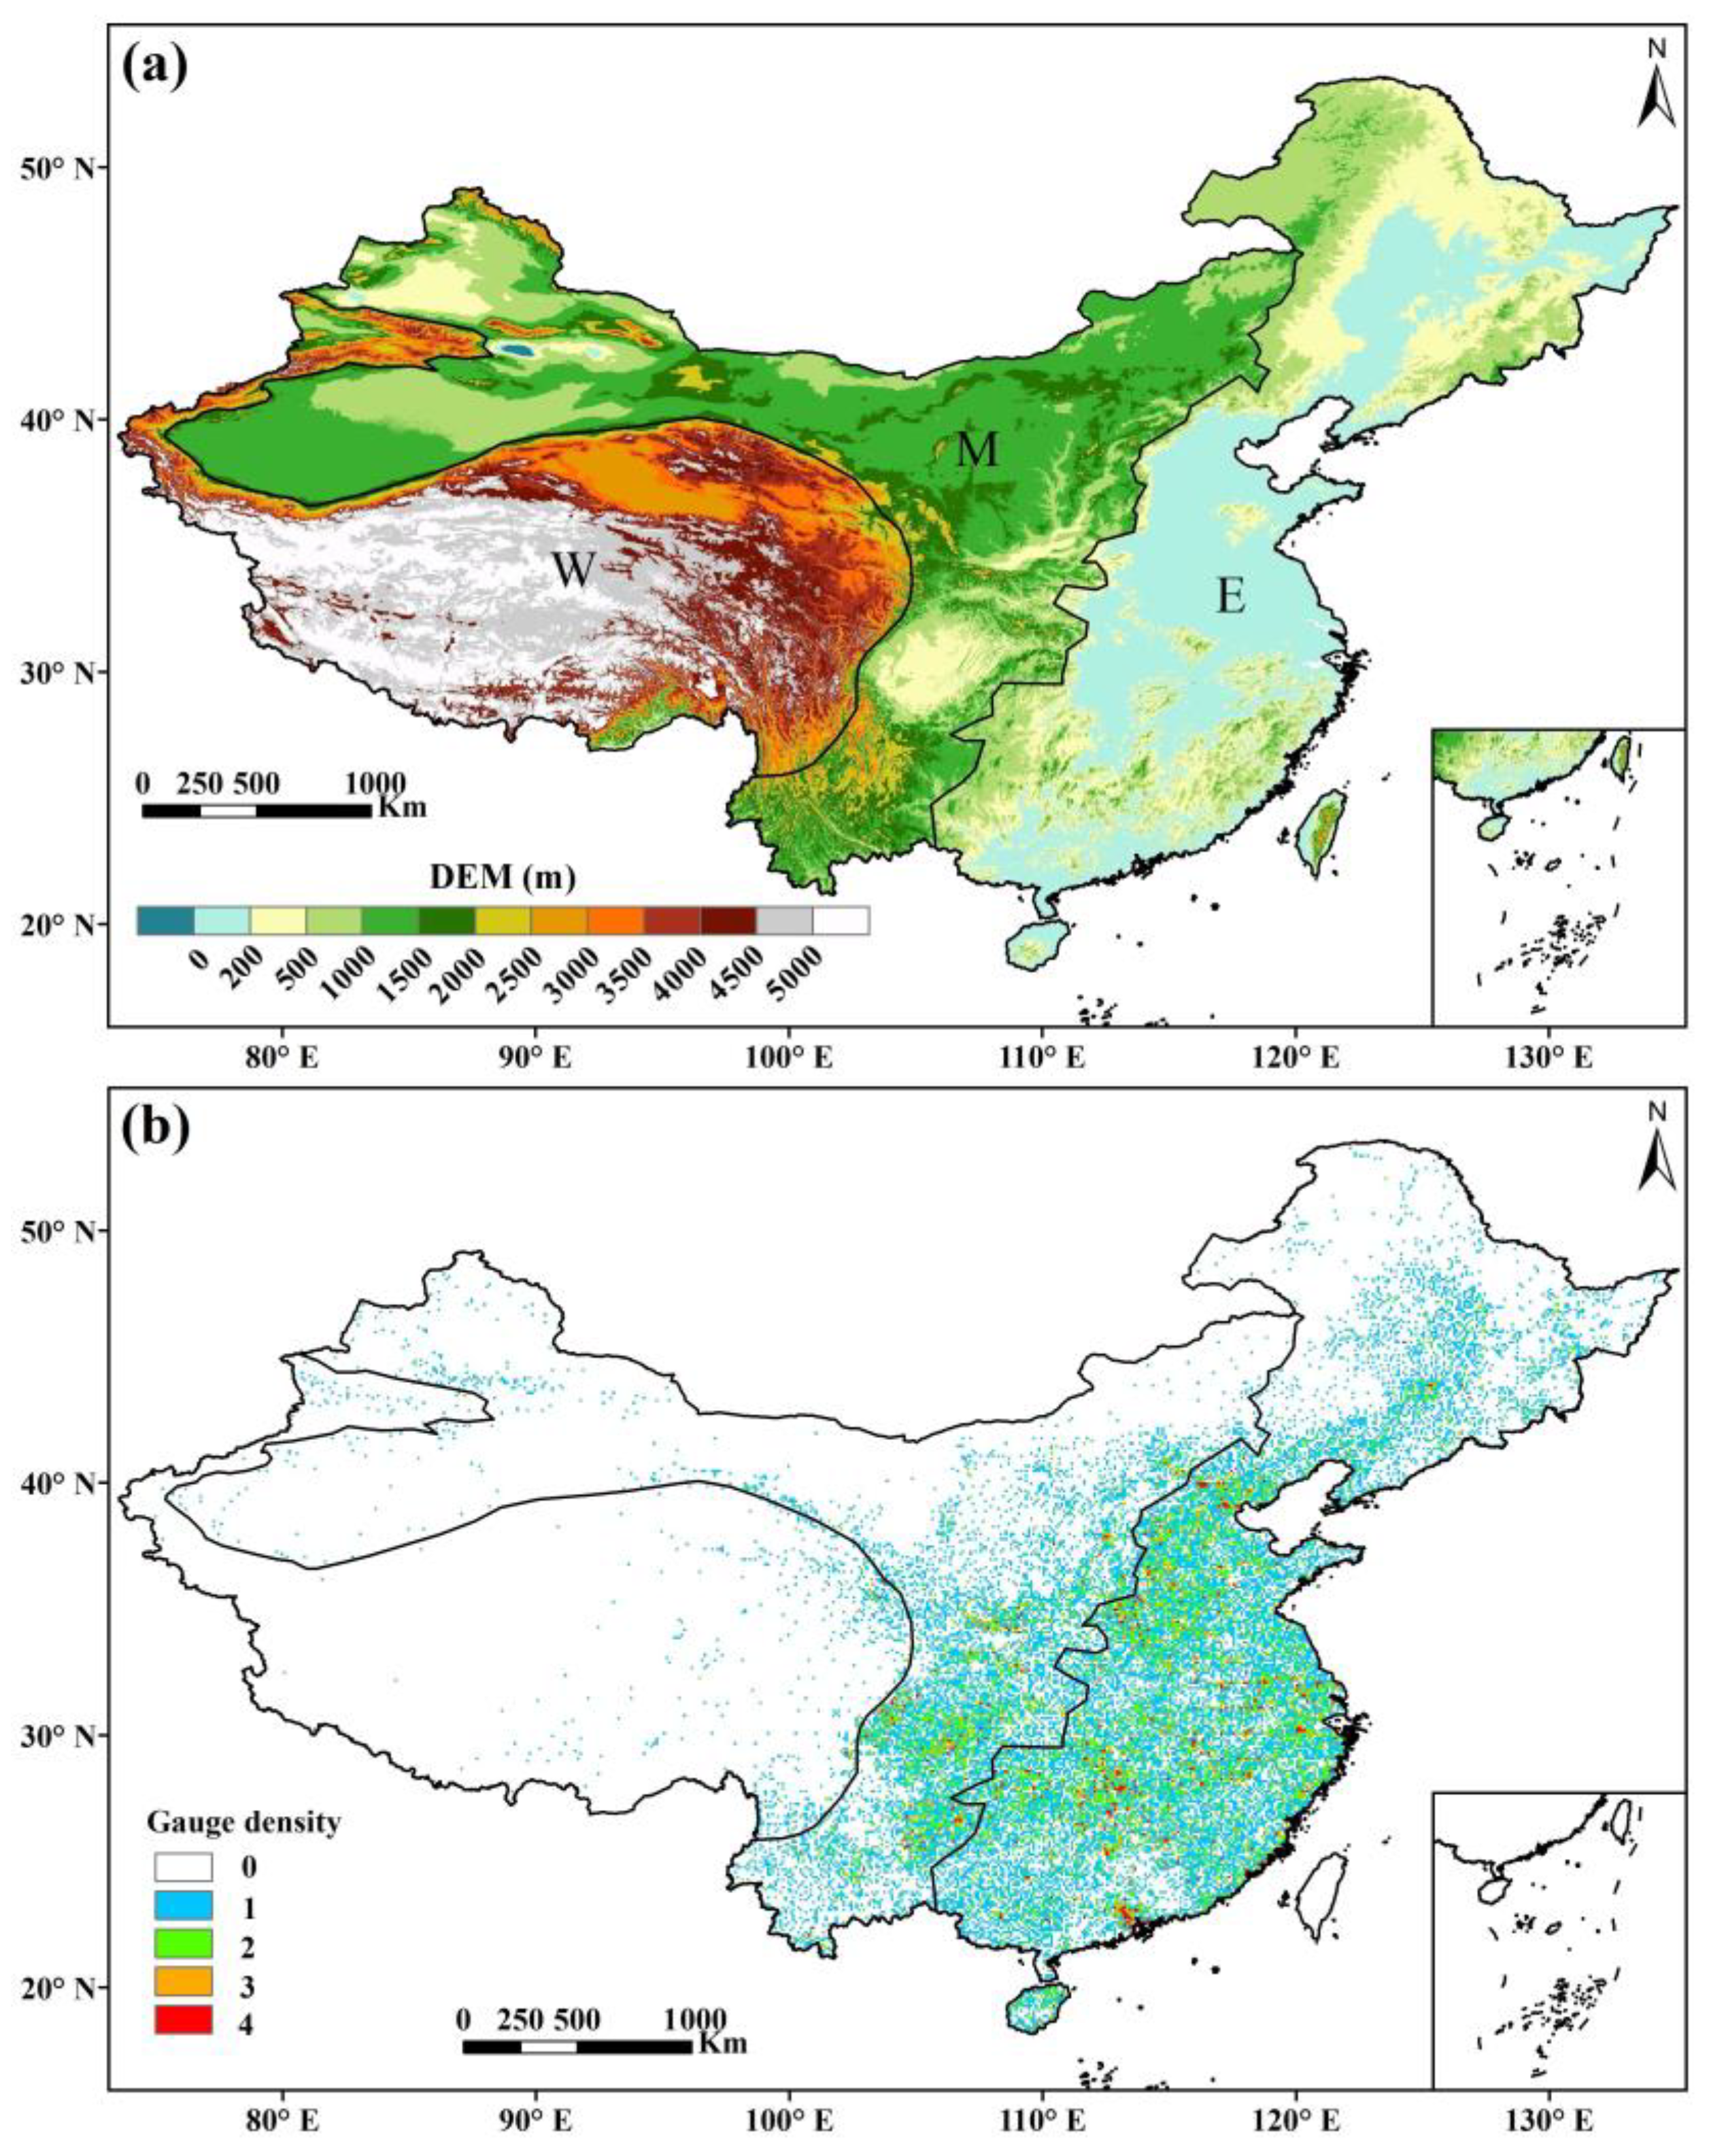
2.1. Study Area

This study focuses on Mainland China, located between 73°~135°E and 18°~53°N, a vast region characterized by complex terrain. Figure 1a illustrates the Digital Elevation Model (DEM) distribution of Mainland China, showing a general decrease in elevation from northwest to southeast. Based on altitude variations, the study area is divided into three regions, west (W, <1000 m), midwest (M, 1000–3000 m), and east (E, >3000 m), following the concept of China’s three-step staircase topography [25]. The aforementioned partitioning strategy facilitates a more comprehensive investigation into the altitudinal attenuation effects on DPR retrieval accuracy. This study utilized high-resolution DEM datasets from the United States Geological Survey EarthExplorer to obtain altitudes (https://earthexplorer.usgs.gov/, accessed on 4 March 2024). The SRTM DEM data has been extensively used as the best digital topographic dataset in many countries and regions [26]. To match the spatial resolution of the precipitation data, the original SRTM data (90 m × 90 m) was resampled to a 0.1° × 0.1° grid using the cubic convolution technique [27].

2.2. Ground Reference

The ground reference data used in this study is the hourly China Merged Precipitation Analysis (CMPA) products, with a spatial resolution of 0.1°. CMPA is a gauge-based dataset containing over 30,000 automatic meteorological stations combined with the Climate Prediction Center (CPC) morphing technique (CMORPH), developed by the National Meteorological Information Center (NMIC) of the China Meteorological Administration [28,29] (CMA). Evaluation results indicate that CMPA exhibits a higher accuracy compared to its international counterparts, particularly for gridded areas containing automatic weather stations [28]. The minimum detectable precipitation rate of automatic gauges in CMPA is 0.1 mm/h [30], and thus a uniform precipitation threshold of 0.1 mm/h is adopted in the subsequent evaluation metrics. CMPA data was publicly available from 2008 to 2018, but access to data after 2018 requires an application and approval (http://data.cma.cn, accessed on 25 July 2018). In this research, only the gauge information from CMPA is used as the ground truth. Figure 1b shows the distribution of CMPA observation stations, revealing dense coverage in region E and sparse coverage in region W.

2.3. GPM DPR

The DPR is widely used to calibrate the quality of global precipitation data, and it includes inversion results for two bands [10]. The Ku-band radar is more sensitive to heavy and moderate precipitation, while the Ka-band radar is more sensitive to light and solid precipitation [31]. The DPR operates in three scanning modes: Normal Scan (NS) in the Ku-band, High-Sensitivity Scan (HS), and Match Scan (MS) in the Ka-band. In version 07, the NS mode was updated to Full Scan (FS), enabling dual-frequency processing across a full swath of approximately 245 km for the first time, compared to the previous algorithms, which were limited to a narrower inner swath of roughly 120 km [8,32]. This study utilized the retrieval results from versions 06 and 07 of all DPR Scanning and Version Configurations (SVCs) at the 2A level, covering the period from 1 January 2015 to 31 December 2018.
Both versions of DPR share the same data source but differ in algorithmic improvements. Compared with the V06 algorithm, the V07 algorithm enhances sidelobe clutter mitigation and introduces a novel three-dimensional precipitation discrimination method. This method leverages signals from vertical, cross-track, and along-track dimensions, significantly improving the detection capability for weak precipitation events in high-latitude region [8].
To match the DPR retrievals with ground-based observations, we first convert the instantaneous precipitation rate (precipRateESurface) from DPR into hourly accumulated precipitation. This assumption of a constant precipitation rate within one hour serves as a fundamental basis for all subsequent analyses in this study. Using the geolocation data (latitude and longitude) of each pixel in the DPR dataset, we spatially aggregate the processed hourly precipitation by assigning it to the nearest 0.1° × 0.1° grid cell through rounding method. The final hourly precipitation for each grid is computed as the mean of all assigned values. To ensure data reliability, we only retain grid cells containing more than two observational gauges in the CMPA and exclude DPR-detected solid precipitation (e.g., snow, hail) from the analysis [33].

2.4. Methodology

This research evaluated the DPR retrieving ability of liquid precipitation from quantification performance, detection performance, and error decomposition. Specifically, quantification performance was assessed using three metrics [34,35]: the correlation coefficient (CC), root mean squared error (RMSE), and relative bias (RB). For detection performance, three indicators were selected: probability of detection (POD), false alarm ratio (FAR), and critical success index (CSI) [36]. To comprehensively examine the error distribution of DPR in Mainland China, this study adopted the error decomposition method of Tian et al. (2009) [37], which decomposes the “total bias” into “hit bias”, “miss bias”, and “false bias”. The calculation equations of the evaluation metrics are provided in Table 1 and Table 2. To ensure consistency between the detection threshold of remote sensing data and that of automatic rain gauges, a threshold of 0.1 mm/h is uniformly adopted in Table 2 to determine the occurrence of precipitation.

3. Results

3.1. Overall Performances

Figure 2 illustrates the sampling frequency distribution for the DPR SVCs over the study period. Notably, the scanning paths and frequencies are identical for the NS mode of DPR-V06 and DPR-V07 (hereafter referred to as DPR-V06-NS and DPR-V07-FS, with similar abbreviations applied for other modes). Among the various DPR scanning modes and versions, DPR-V06-NS and DPR-V07-FS have the highest number of samples, ranging from 300 to 700 (from 1 January 2015 to 31 December 2018), while DPR-V06-HS and DPR-V07-HS have the fewest, ranging from 100 to 300. The difference in sample numbers among the scan modes is due to the number of rays per scan type (HS: 24 rays; MS: 25 rays; FS or NS: 49 rays). The DPR-MS contains slightly more samples than DPR-HS but significantly fewer samples than the DPR-NS. Spatially, the DPR sampling frequency increases with the latitude across all scanning modes, with higher latitudes receiving more samples due to the inherent orbital trajectory.
Surface precipitation rate estimates from the DPR were evaluated using in situ rain gauge network data over Mainland China (Figure 3). In Figure 3, N denotes the number of matched samples between DPR observations and ground stations, with V06-NS and V07-FS exhibiting the largest sample sizes. In DPR-V06, the NS, HS, and MS modes exhibit higher CC values than 0.65, but the HS mode significantly underestimates precipitation and has the highest RMSE, indicating the largest average deviation from estimated rainfall rates. The MS mode has a superior ability to detect precipitation, as evidenced by its higher POD and CSI values. The HS mode performs the worst in both detection and quantification metrics. In the DPR-V07, the FS mode shows a superior detection performance compared to V06-NS and the V07-HS improved the degree of underestimation compared to V06-HS, but it decreases the detection performance compared to V06-HS, possibly due to the removal of the sidelobe clutter in the new DPR-V07 algorithm and the simultaneous elimination of some weak precipitation echoes. The Ka-band used in the HS scanning mode is mainly used to detect low-intensity rainfall. This may have reduced the detection performance of DPR-V07-HS. A more detailed analysis of these results is presented in the following sections.

3.2. Quantification Performance

The spatial distribution of the quantification performance (Figure 4) shows that the improvement of the V07 algorithm over V06 is limited. All DPR SVCs had relatively high CC values between 0.5 and 0.8 against the rain gauges. Among them, the V06-MS product has higher CC values compared to the others. Regions with high CC values were mainly concentrated in the central area of zone E, while other zones showed unstable CC values. The significant underestimation was observed in the HS mode for all DPR SVCs. Specifically, the V07-HS product underestimated precipitation rates by an average of 15%, which is 10% lower than the new corresponding version. In terms of subregions, the spatial variability of precipitation observations across DPR SVCs demonstrated consistent patterns, with a higher variability observed in southern zone E, which can be proved by the spatial distribution of RMSE parameters. This variability degree exhibited a gradual decrease from southeastern to northwestern regions of China.
To ascertain the differences in the precipitation quantification performance among various DPR SVCs across different altitude regions, which can be found in Figure 5, the HS and MS modes outperform the NS and FS modes a little in three subregions. The CC values for the DPR SVCs exhibit little variation among the three subregions, ranging between 0.75 and 0.80. All CCs of DPR SVCs in regions M and W are slightly higher. DPR-V07-HS elevates the RMSE in region E relative to DPR-V06-HS, whereas it reduces the RMSE in region W. It is worth noting that the sample sizes (N) vary considerably across the three regions, with region E having significantly more matched samples than regions M and W. This discrepancy in the sample size may partially influence the stability and representativeness of the statistical metrics, especially in high-altitude areas where observations are sparser.
When comparing the RMSE values of DPR-V06-HS with DPR-V07-HS modes, it is found that the DPR-V07-HS increases the RMSE in region E while decreasing it in region W. In regions M and W, all DPR SVCs except DPR-V06-HS overestimate precipitation, whereas in region W, all DPR SVCs underestimate precipitation. From the RB value, the DPR-V07-FS shows a higher precipitation overestimation in regions E and M compared to DPR-V06-NS, but it alleviates the underestimation observed in DPR-V06-NS for region W. Meanwhile, DPR-V07-HS improves the underestimation in regions M and W compared to DPR-V06-HS. This indicates that, on the one hand, the DPR-V07 algorithm improves the RB value of precipitation at high altitudes more significantly than that at low altitudes. On the other hand, it may be due to the increase in the precipitation rate from V06 to V07, which will reduce the underestimation and increase the overestimation.
Figure 6 shows the boxplots of five DPR SVCs across four seasons over Mainland China at an hourly scale. DPR-V06-HS, DPR-V06-MS, and DPR-V07-HS consistently exhibit high CC and low RMSE values across all seasons, and DPR-V06-HS and DPR-V07-HS always show a higher underestimation. All DPR SVCs show an underestimation of precipitation, with a larger underestimation in summer and autumn and a smaller underestimation in spring and winter. Among them, DPR-V06-HS and DPR-V07-HS exhibit higher levels of precipitation underestimation across all seasons. Compared to DPR-V06-NS, DPR-V07-FS improves the RB during winter slightly. Furthermore, DPR-V07-HS significantly reduces the RMSE value in spring compared to DPR-V06-HS.

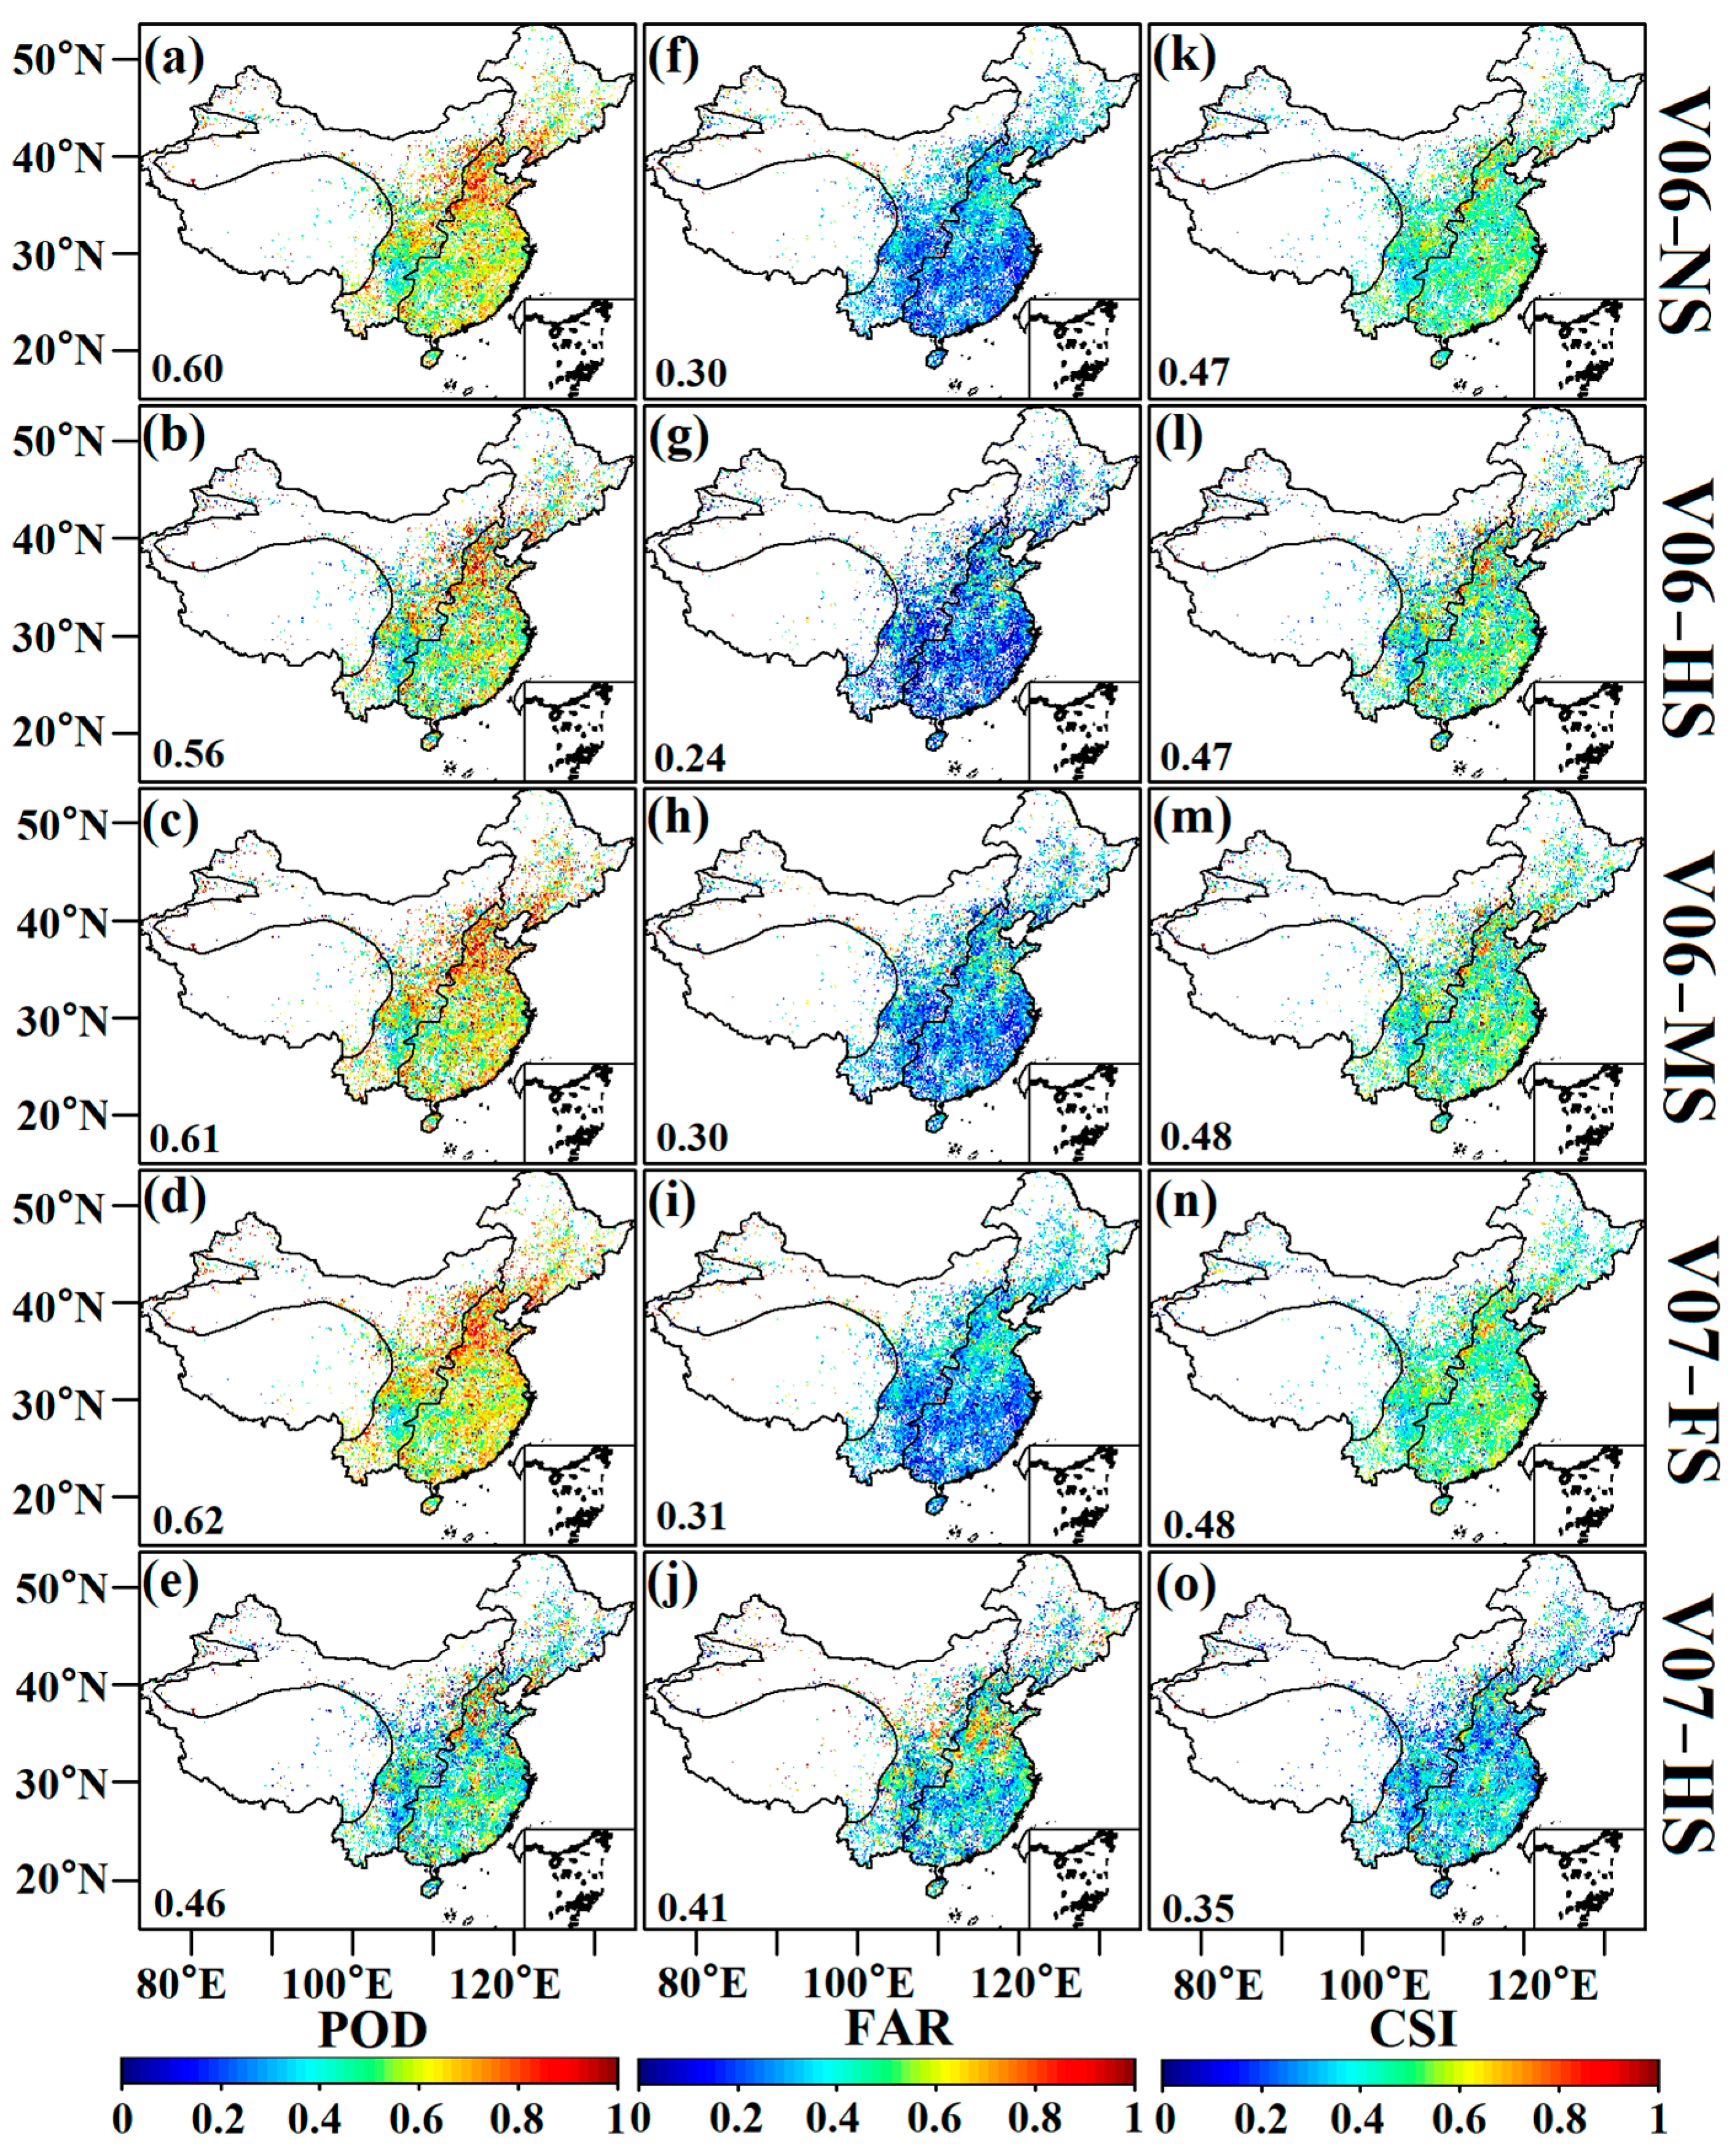
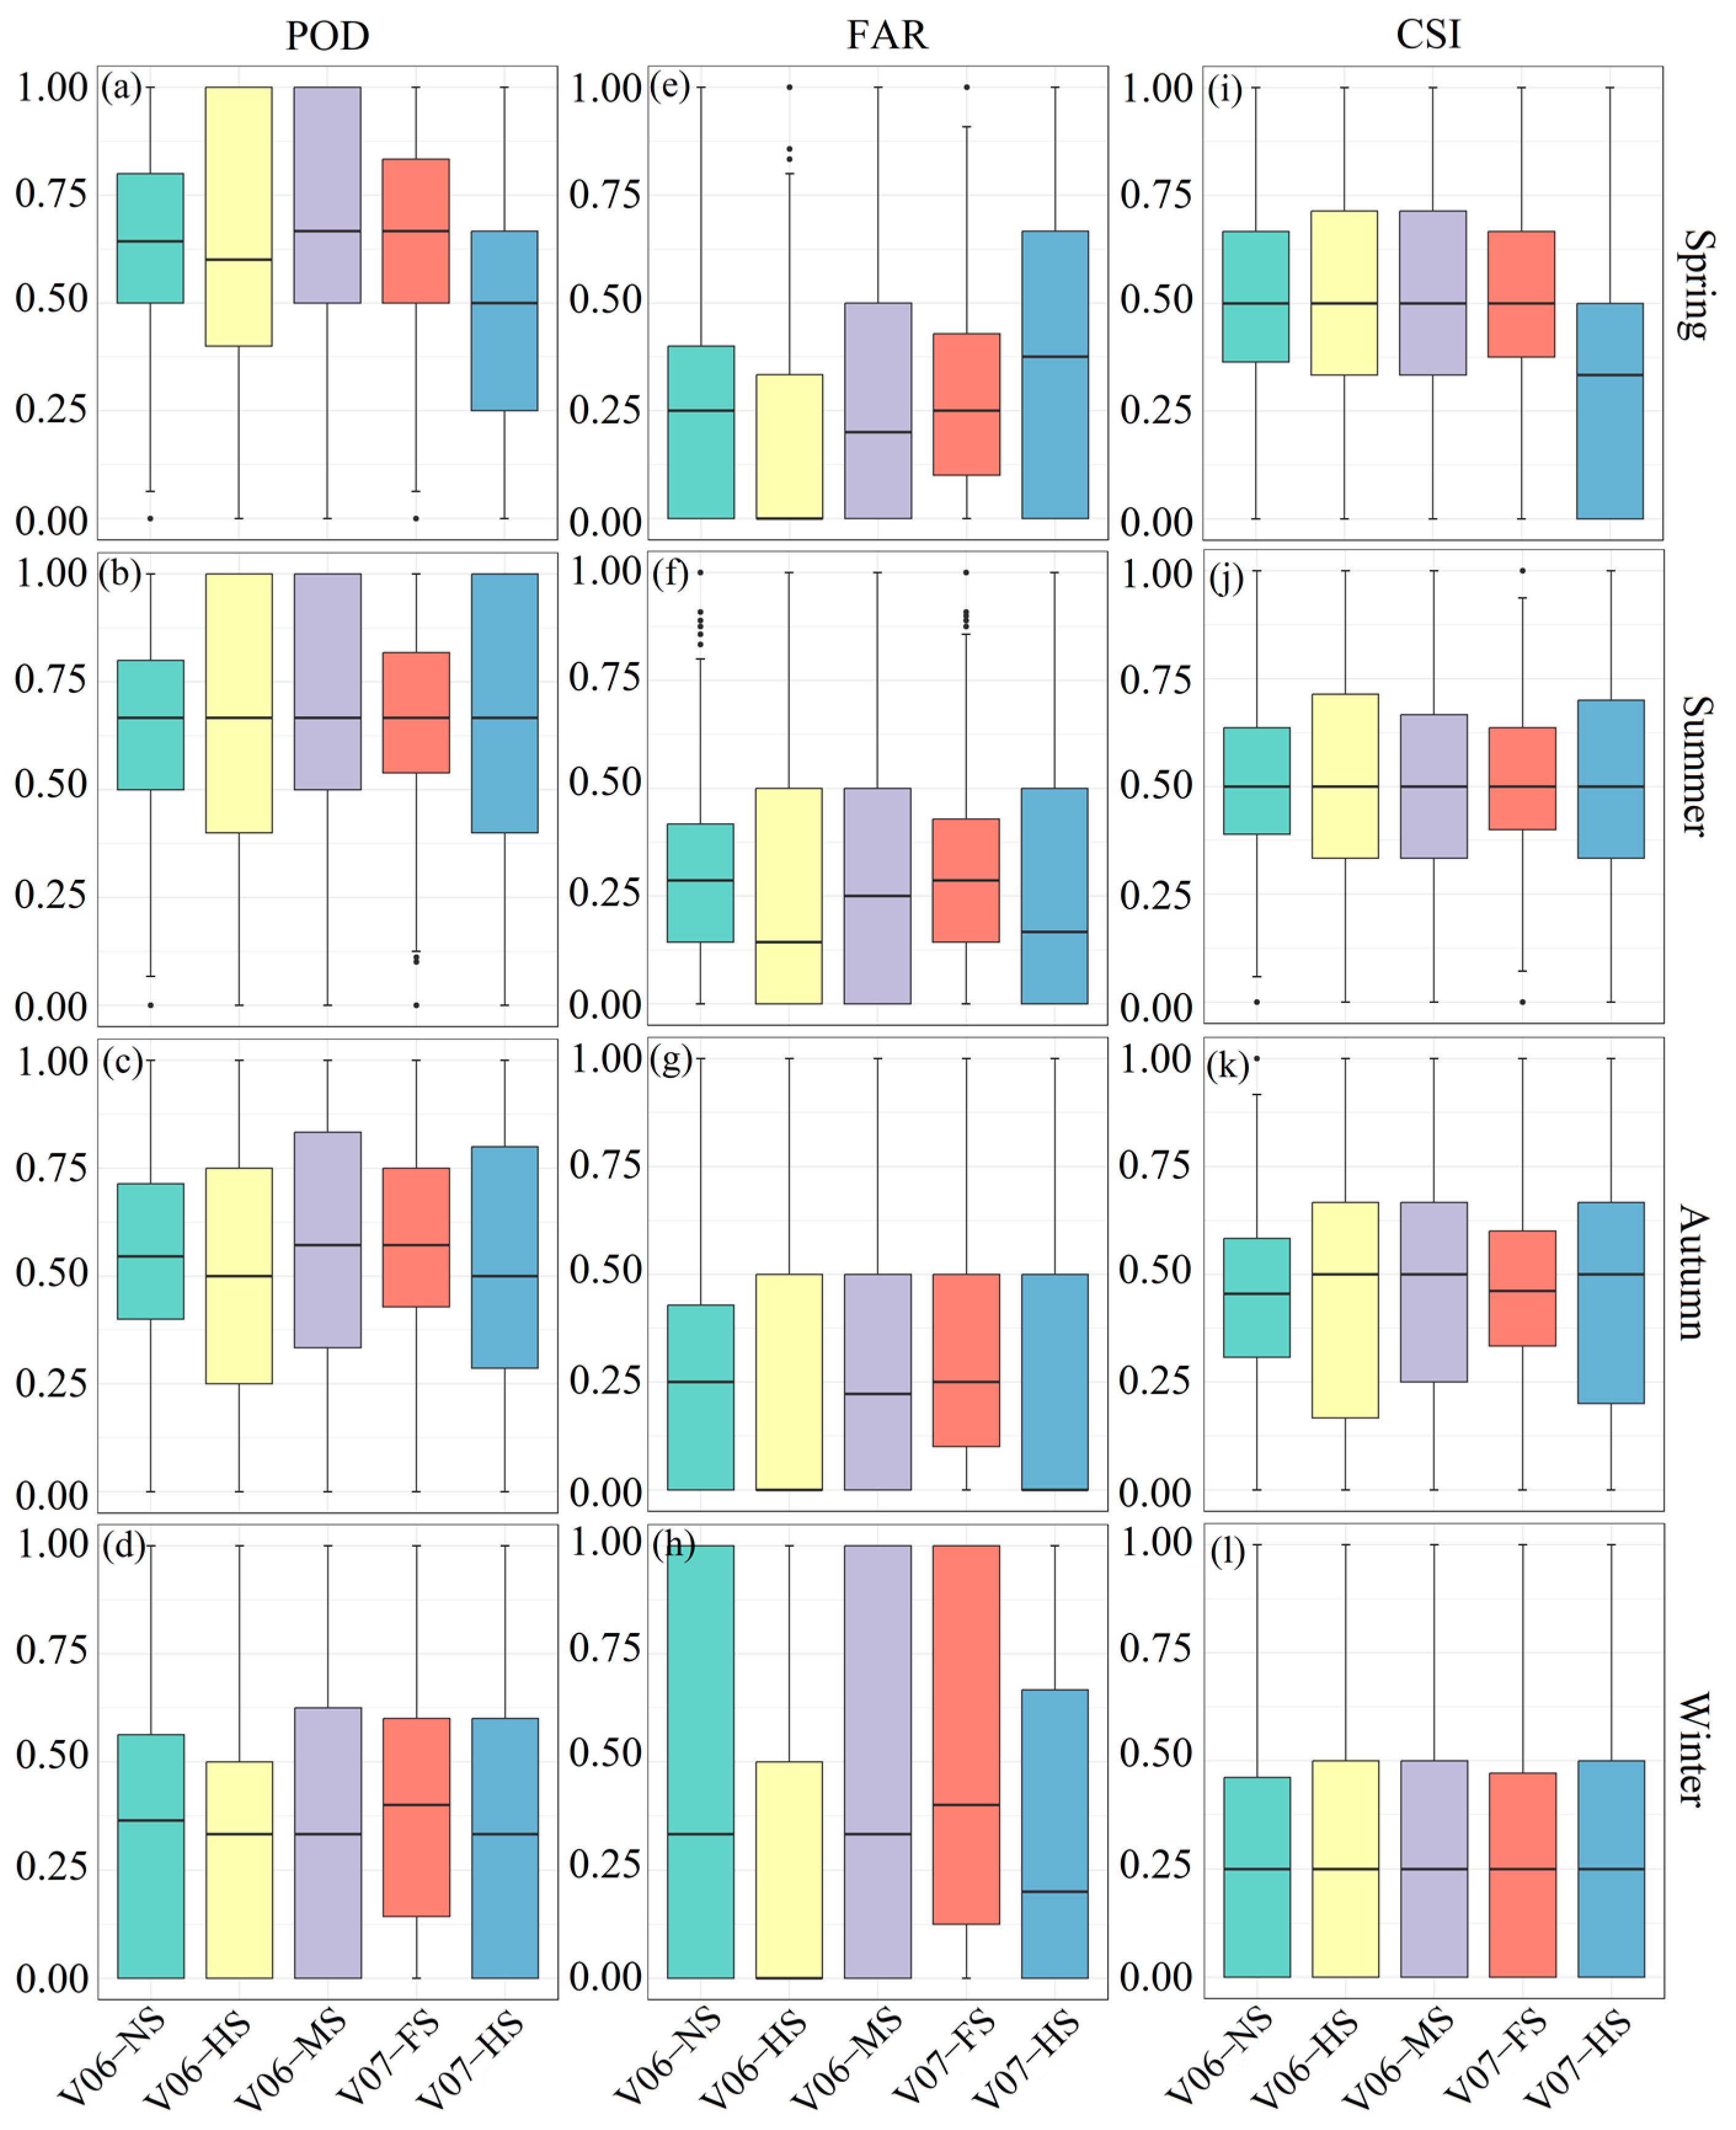
3.3. Detection Performance

Figure 7 illustrates the spatial distribution of the precipitation detection performance for five DPR SVCs across Mainland China. Overall, all SVCs achieve the highest POD values in the central part of region E (Figure 7a–e). The quantitative analysis reveals distinct performance differences between DPR-V06 and DPR-V07 algorithms. In DPR-V06, the MS mode shows a slight advantage in the detection (POD) and critical success index (CSI), while the HS mode achieves a better probability of the false alarm ratio (FAR). For DPR-V07, the FS mode consistently outperforms the HS mode across all metrics (POD, FAR, and CSI). However, the algorithm adjustments in DPR-V07 lead to mixed results: Compared to DPR-V06-NS, DPR-V07-FS improves the POD and CSI in most regions but increases the FAR in central areas. Conversely, DPR-V07-HS exhibits a degraded performance, with a reduced POD, higher FAR, and consequently lower CSI. Table 3 further confirms that DPR-V07 has a higher overall FAR than DPR-V06. In conclusion, the DPR-V07 modifications impair the detection accuracy, particularly for the HS mode, while the FS mode offers limited improvements at the cost of increased false alarms.
The further regional analysis of the detection performance is presented in Figure 8, which compares the POD, FAR, and CSI metrics across three subregions for different DPR SVCs. The results demonstrate a clear spatial variability, with the overall performance being highest in region E and lowest in region W. Among all versions, DPR-V07-HS exhibits the poorest precipitation detection performance, consistently showing the highest FAR and lowest POD and CSI values across all subregions. Compared to DPR-V06-HS, DPR-V07-HS shows a significant degradation, with the CSI decreasing by 24.79% in region E, 26.36% in region M, and 18.84% in region W.
In contrast, the differences among the other four DPR SVCs are relatively minor. When comparing DPR-V07-FS with DPR-V06-NS, a slight increase in the POD is observed, accompanied by a marginal rise in the FAR, resulting in nearly identical CSI values. This suggests that while the FS mode in DPR-V07 maintains a comparable overall performance to DPR-V06-NS, the modifications in the HS mode have substantially reduced its detection accuracy.
The findings indicate that the algorithm adjustments in DPR-V07 have led to divergent outcomes: while the FS mode shows minimal changes across subregions, the HS mode experiences a pronounced performance deterioration, particularly in terms of the increased FAR and the reduced CSI. This degradation is consistent across all three subregions, highlighting the need for the further optimization of the HS mode in future algorithm development.
Figure 9 displays the seasonal variations in the detection performance through boxplots comparing five DPR SVCs across four seasons. All DPR SVCs show distinct seasonal patterns, with POD values peaking in summer (Figure 9b) and reaching their lowest levels in winter. Seasonal comparisons reveal that DPR-V07-FS achieves marginally higher POD values than DPR-V06-NS during winter months (Table 4). The analysis of FAR distributions demonstrates a greater consistency in summer across all DPR SVCs. DPR-V06-HS maintains the lowest FAR values throughout all seasons, while DPR-V07-HS shows particularly elevated FARs in spring, exhibiting a dramatic 95.24% increase compared to its predecessor. A similar but less pronounced trend appears in winter, where DPR-V07-FS shows a 9.30% increase relative to DPR-V06-NS in FAR values (Table 4). CSI values follow the seasonal pattern observed in other metrics, with summer showing both the highest and most consistent performance across DPR SVCs and winter displaying the lowest values. This seasonal consistency suggests a superior precipitation detection capability during summer months. However, the detection performance degradation of DPR-V07-HS is particularly evident in spring, where CSI values decrease by 29.41% compared to DPR-V06-HS, indicating substantial algorithm-related performance deterioration during this season.
The evaluation reveals that the DPR-V07 algorithm fails to enhance the quantification performance for the HS mode while simultaneously degrading its detection capability. Regionally, this performance reduction is most pronounced in regions E and M, with the seasonal analysis showing a particularly significant deterioration during spring.

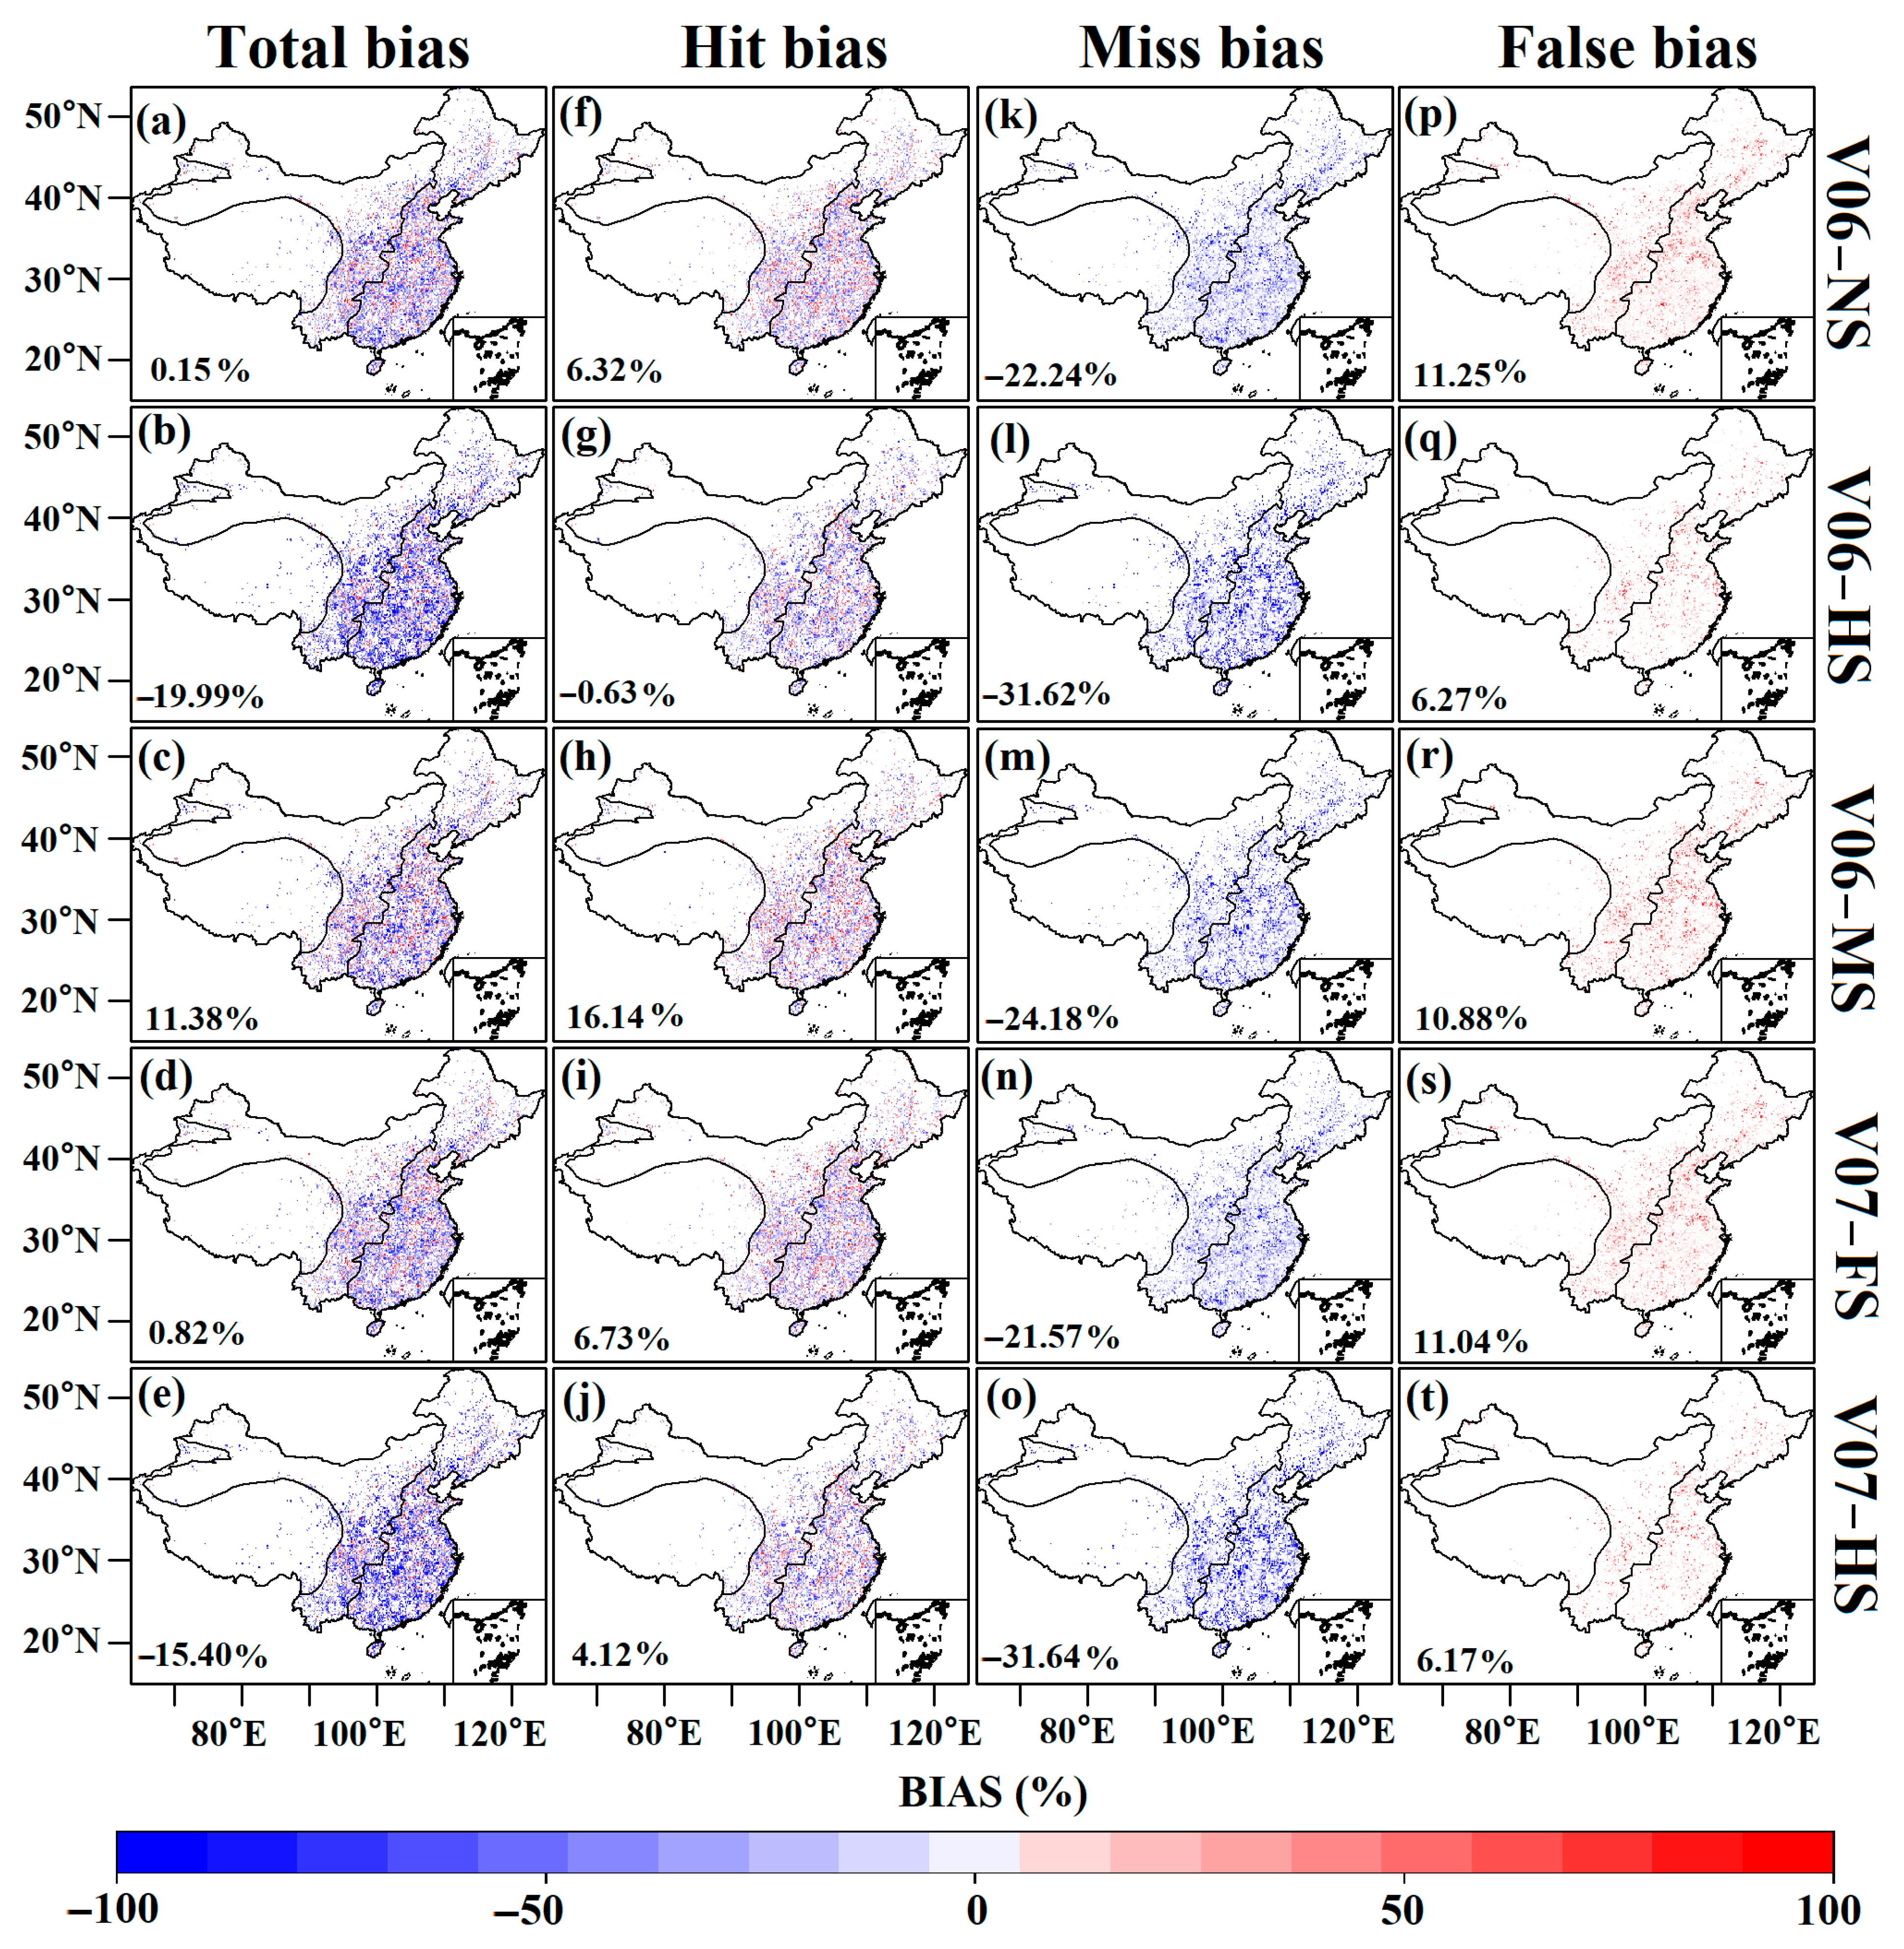
3.4. Error Decomposition

The conventional evaluation metrics present limitations, as evidenced by the RB metric’s susceptibility to cancelation effects between positive and negative values. This underscores the necessity of error decomposition for a meaningful algorithm assessment [38], as implemented in our seasonal analysis of error sources (Figure 10 and Figure 11).
Summer observations demonstrate that DPR-V06-NS achieves the lowest total bias, while DPR-V06-HS shows the highest. The miss bias emerges as the predominant error source across all product combinations, with the HS mode consistently exhibiting the highest miss bias and the FS mode the lowest. The FS mode’s superior performance in high-intensity precipitation regions suggests its enhanced capacity for precipitation capture, though version upgrades yield only marginal improvements in summer error decomposition.
Winter conditions reveal markedly different patterns, with total and miss biases approximately doubling compared to summer values. This substantial increase highlights the algorithms’ reduced precipitation capture capability in colder months. Notably, DPR-V07-FS demonstrates the lowest wintertime biases, with version comparisons showing that DPR-V07’s primary improvement lies in a miss bias reduction, which is an enhancement more pronounced in winter than summer.
The DPR-V07 algorithm shows a limited impact on summer precipitation rate biases relative to DPR-V06. Its winter performance, however, demonstrates meaningful improvements through a reduced miss bias, leading to a lower total bias. Across both seasons, the miss bias remains the dominant contributor to the total error, followed by the false bias, with the hit bias playing a comparatively minor role.
It can be concluded that while the FS mode maintains a superior performance across seasons, the HS mode requires significant algorithm refinement. Future development should prioritize miss bias reductions, particularly for seasonal performance optimization and regional applications in regions E and M.

3.5. Elevation Dependence

The DPR serves as one of the primary tools for observing precipitation in high-altitude mountainous regions where conventional data are sparse [17,39]. To systematically evaluate the altitude-dependent performance of DPR SVCs, we analyzed detection and quantification metrics across elevation gradients in Mainland China (Figure 12). The results reveal pronounced terrain-dependent characteristics in both detection and quantification performances across all product combinations.
Elevation exerts systematic impacts on detection metrics (Figure 12a–c). CC values display an inverse relationship with altitude, decreasing from >0.2 at low elevations (<0.5 km) to <0.2 above 5 km. RB values demonstrate an altitude-dependent amplification, remaining moderate (<15%) below 2 km but increasing sharply (>30%) above 4 km. Notably, DPR-V06-HS shows the most pronounced RB inflation at high altitudes, while DPR-V07 variants exhibit reduced RB values across all elevations. The RMSE peaks in the 0.5–1 km range (likely due to heterogeneous surface interference), then decreases with elevation, but shows an anomalous spike (12–15% increase) at 3–4 km, which is a pattern potentially linked to the topographic complexity in transitional elevation zones.
POD values exhibit a progressive improvement with elevation (Figure 12d–f). Below 3 km, HS-mode products (DPR-V06-HS and DPR-V07-HS) achieve superior POD values (>0.75), whereas DPR-V07-FS demonstrates a reduced performance (POD < 0.8) above 3 km. The FAR shows contrasting behavior, increasing from <0.3 at <0.5 km to peak values (0.35–0.45) at 4–5 km. The HS modes consistently exhibit elevated FAR values (>10% higher than other modes) across all elevations. The CSI reaches maximum values (0.55–0.65) in the 2–3 km range, declines at 4–5 km, and partially recovers (>5 km). Both HS-mode versions underperform in CSI metrics, particularly DPR-V07-HS which shows 8–12% reductions compared to NS/FS modes.
The analysis demonstrates a significant altitude-mediated performance degradation, particularly above 4 km where both the detection and quantification metrics decline markedly. While DPR-V07 effectively mitigates the precipitation overestimation (as evidenced by reduced RB values across elevations), its improvements in quantification accuracy remain limited. The persistent underperformance of HS-mode products, particularly DPR-V07-HS with its elevated FAR and reduced CSI, shows unresolved challenges in high-altitude retrieval algorithms.

4. Discussion

While the assumption of a minimal variation in precipitation rates within an hour is a widely adopted simplification for satellite–ground precipitation matching, it may overlook rapid fluctuations associated with highly transient convective systems. As such, future research should explore more dynamic aggregation strategies and assess their impact on retrieval accuracy, particularly in regions prone to short-lived convective bursts. Additionally, it is worth noting that the DPR scan pattern changed on 21 May 2018, during the latter part of our study period. Although this change was not explicitly analyzed due to its limited temporal coverage (approximately one-eighth of the total period), it may have introduced subtle variations in retrieval characteristics. Future studies should consider this transition when evaluating long-term performance trends.
The observed spatial heterogeneity in the DPR performance across subregions (M, W) stems from fundamental interactions between sensor physics and regional precipitation regimes. At the Ka-band, the enhanced sensitivity to small hydrometeors (<1 mm diameter) provides critical detection advantages for the light stratiform precipitation prevalent in continental interiors [40]. However, this sensitivity becomes a double-edged sword in plateau regions (region W), where mixed-phase precipitation with vertically aligned ice crystals induces non-Rayleigh scattering effects [41]. The resulting cross-polarization signal contamination explains the systematic precipitation underestimation observed in region W retrievals (Figure 5). The paradoxical overestimation in region M despite a similar Ka-band utilization warrants the examination of microphysical assumptions. Current DPR algorithms parameterize particle size distributions (PSDs), which might not adequately represent the precipitation systems in region M [42], and the overestimation in region M may originate from the PSD shape parameters in the dual-frequency ratio (DFR) retrieval module [43]. This bias mirrors findings from recent GPM validation campaigns in semi-arid regions, suggesting an urgent need for regionally adaptive PSD libraries.
The seasonal amplification of the miss bias, particularly in the winter increase (Figure 11), exposes fundamental limitations in current scattering models. Conventional Ku/Ka-band scattering databases assume liquid-phase hydrometeors, causing critical failures during winter mixed-phase precipitation events [44], when supercooled droplets coexist with rimed ice particles, and the DPR’s DFR becomes ambiguous [24], this phase confusion directly contributes to the observed 25% CSI reduction in DPR-V07-HS during winter (Figure 9). The improved RB performance of DPR-V07 in winter likely stems from the enhanced surface clutter suppression rather than microphysical algorithm upgrades. While DPR-V07 represents a meaningful step forward, there are persistent challenges, particularly the HS mode’s degraded quantification performance and elevation-dependent error amplification. This highlights a critical research gap: current DPR V07 retrieval frameworks lack the explicit treatment of the orographically modified precipitation phase, a deficiency particularly detrimental in complex terrain. Future development should prioritize terrain-adaptive retrieval approaches and seasonal calibration to enhance reliability in underrepresented regions like Mainland China.
The elevation-dependent RB variations (Figure 12b) necessitate height-resolved Z-R relationships. Deep learning architectures trained on multi-sensor observations (e.g., FY-4A cloud phase products) could enable real-time Z-R adjustments based on vertical thermodynamical profiles [45]. The FY3G dual-frequency Precipitation Measurement Radar (PMR) launched in 2023 offers unprecedented synergy potential. Preliminary intercomparisons indicate that the PMR exhibits a superior sensitivity to light precipitation, suggesting that PMR-DPR synergistic observations could establish a new benchmark for satellite-based precipitation climatology [46].
The observed 24–29% CSI degradation in high-altitude regions (Figure 12) directly impacts water resource management. The runoff in most Tibetan Plateau basins originates from orographic precipitation [47], but the current DPR’s limited high-altitude detection capability introduces systemic biases into hydrological models, resulting in runoff prediction underestimations that jeopardize downstream water management reliability. To improve the validation reliability in these sparsely gauged regions, future work should incorporate additional data sources such as ground-based radar, mountain observatories, and radiosonde profiles. As next-generation algorithms evolve, the prioritized incorporation of multi-source precipitation radar data (e.g., GPM constellation, FY3G) will be critical for advancing precipitation retrieval accuracy. Future work should particularly focus on cross-validation studies between the DPR and PMR to identify optimal synergy strategies for global precipitation monitoring.

5. Conclusions

This study evaluates the performance of the latest DPR-V07 retrieval algorithms over Mainland China using automated rain gauge observations from 2015 to 2018. The analysis focuses on improvements in the quantification accuracy, detection performance, and error decomposition across spatial, seasonal, and altitudinal dimensions. Key findings are summarized below:
The DPR-V07 algorithm demonstrates measurable advancements over its predecessor. The HS mode in DPR-V07 reduces the precipitation underestimation observed in DPR-V06-HS, particularly in high-altitude regions, with consistent improvements maintained across elevation gradients. Seasonal evaluations reveal an enhanced bias mitigation in winter and spring precipitation retrievals. However, these improvements are counterbalanced by the degraded quantification performance in the HS mode, especially across the east (E) and midwest (M) regions. The error decomposition analysis further highlights DPR-V07’s capacity to reduce the winter miss bias, with the FS mode showing the most pronounced total bias reduction. While DPR-V07 effectively addresses the precipitation overestimation across all elevations compared to DPR-V06, its ability to enhance the quantification accuracy at varying altitudes remains limited.
These findings carry important implications for data applications. The HS mode, leveraging high-sensitivity Ka-band measurements, remains optimal for detecting light precipitation and small-scale hydrometeors. Conversely, the FS mode, with its broader spatial coverage and rapid scanning capability, is better suited for monitoring large-scale precipitation systems. Users should prioritize selections based on observational objectives: the HS mode for sensitivity-driven studies and the FS mode for synoptic-scale analyses.

Author Contributions

J.S.: Conceptualization, Methodology, Software, Visualization, Writing, and Editing. H.Z.: Review, Editing, and Funding acquisition. Y.L.: Writing—Review and Editing. H.W.: Review and Editing. F.Z.: Review and Editing. X.M.: Review and Editing. B.Y.: Review and Editing, Project administration, and Formal analysis. All authors have read and agreed to the published version of the manuscript.

Funding

This research was supported by the Open Research Fund of the Xinjiang Key Laboratory of Water Cycle and Utilization in Arid Zone, Xinjiang Institute of Ecology and Geography, Chinese Academy of Sciences (XJYS0907), the Basic Research Projects for Universities in the Autonomous Region (XJEDU2025P007), and the National Natural Science Foundation of China (U2243229).

Data Availability Statement

The V06 and V07 of the GPM-DPR data are provided by the Goddard Earth Sciences Data and In-formation Services Center, National Aeronautics and Space Administration (https://gpm1.gesdisc.eosdis.nasa.gov/data/, accessed on 25 March 2021), the DEM data are provided by the United States Geological Survey EarthExplorer (https://earthexplorer.usgs.gov/, accessed on 4 March 2024), and the gauge observation data are available at the China Meteorological Administration data website (http://data.cma.cn, accessed on 25 July 2018).

Conflicts of Interest

The authors declare that they have no known competing financial interests or personal relationships that could have appeared to influence the work reported in this paper.

References

  1. Duchon, C.E.; Essenberg, G.R. Comparative rainfall observations from pit and aboveground rain gauges with and without wind shields. Water Resour. Res. 2001, 37, 3253–3263. [Google Scholar] [CrossRef]
  2. Kidd, C.; Becker, A.; Huffman, G.J.; Muller, C.L.; Joe, P.; Skofronick-Jackson, G.; Kirschbaum, D.B. So, how much of the Earth’s surface is covered by rain gauges? Bull. Amer. Meteorol. Soc. 2017, 98, 69–78. [Google Scholar] [CrossRef] [PubMed]
  3. Kim, T.J.; Kwon, H.H.; Kim, K.B. Calibration of the reflectivity-rainfall rate (ZR) relationship using long-term radar reflectivity factor over the entire South Korea region in a Bayesian perspective. J. Hydrol. 2021, 593, 125790. [Google Scholar] [CrossRef]
  4. Song, Y.; Han, D.; Zhang, J. Radar and rain gauge rainfall discrepancies driven by changes in atmospheric conditions. Geophys. Res. Lett. 2017, 44, 7303–7309. [Google Scholar] [CrossRef]
  5. Thies, B.; Bendix, J. Satellite based remote sensing of weather and climate: Recent achievements and future perspectives. Meteorol. Appl. 2011, 18, 262–295. [Google Scholar] [CrossRef]
  6. Huffman, G.J.; Adler, R.F.; Bolvin, D.T.; Nelkin, E.J. The TRMM multi-satellite precipitation analysis (TMPA). In Satellite Rainfall Applications for Surface Hydrology; Gebremichael, M., Hossain, F., Eds.; Springer: Dordrecht, The Netherlands, 2010. [Google Scholar]
  7. Yang, S.; Nesbitt, S.W. Statistical properties of precipitation as observed by the TRMM precipitation radar. Geophys. Res. Lett. 2014, 41, 5636–5643. [Google Scholar] [CrossRef]
  8. Iguchi, T.; Seto, S.; Meneghini, R.; Yoshida, N.; Awaka, J.; Le, M.; Chandrasekar, V.; Brodzik, S.; Kubota, T. GPM/DPR Level-2 Algorithm Theoretical Basis Document. NASA Goddard Space Flight Cent. 2021, 450, 10–13. [Google Scholar]
  9. Skofronick-Jackson, G.; Kirschbaum, D.; Petersen, W.; Huffman, G.; Kidd, C.; Stocker, E.; Kakar, R. The Global Precipitation Measurement (GPM) mission’s scientific achievements and societal contributions: Reviewing four years of advanced rain and snow observations. Q. J. R. Meteorol. Society. 2018, 144, 27–48. [Google Scholar] [CrossRef] [PubMed]
  10. Hou, A.Y.; Kakar, R.K.; Neeck, S.; Azarbarzin, A.A.; Kummerow, C.D.; Kojima, M.; Oki, R.; Nakamura, K.; Iguchi, T. The global precipitation measurement mission. Bull. Amer. Meteorol. Soc. 2014, 95, 701–722. [Google Scholar] [CrossRef]
  11. Seto, S.; Iguchi, T.; Meneghini, R.; Awaka, J.; Kubota, T.; Masaki, T.; Takahashi, N. The precipitation rate retrieval algorithms for the GPM Dual-frequency Precipitation Radar. J. Meteorolog. Soc. Jpn. Ser. II 2021, 99, 205–237. [Google Scholar]
  12. Hamada, A.; Takayabu, Y.N. Improvements in detection of light precipitation with the Global Precipitation Measurement dual-frequency precipitation radar (GPM DPR). J. Atmos. Ocean. Technol. 2016, 33, 653–667. [Google Scholar] [CrossRef]
  13. Skofronick-Jackson, G.; Berg, W.; Kidd, C.; Kirschbaum, D.B.; Petersen, W.A.; Huffman, G.J.; Takayabu, Y.N. Global precipitation measurement (GPM): Unified precipitation estimation from space. Remote Sens. Clouds Precip. 2018, 69, 175–193. [Google Scholar]
  14. Kummerow, C.; Simpson, J.; Thiele, O.; Barnes, W.; Chang, A.T.C.; Stocker, E.; Adler, R.F.; Hou, A.; Kakar, R.; Wentz, F.; et al. The status of the Tropical Rainfall Measuring Mission (TRMM) after two years in orbit. J. Appl. Meteorol. 2000, 39, 1965–1982. [Google Scholar] [CrossRef]
  15. Wang, J.; Wolff, D.B. Comparisons of reflectivities from the TRMM precipitation radar and ground-based radars. J. Atmos. Oceanic. Technol. 2009, 26, 857–875. [Google Scholar] [CrossRef]
  16. Gao, J.; Tang, G.; Hong, Y. Similarities and improvements of GPM dual-frequency precipitation radar (DPR) upon TRMM precipitation radar (PR) in global precipitation rate estimation, type classification and vertical profiling. Remote Sens. 2017, 9, 1142. [Google Scholar] [CrossRef]
  17. Tang, G.; Long, D.; Hong, Y.; Gao, J.; Wan, W. Documentation of multifactorial relationships between precipitation and topography of the Tibetan Plateau using space borne precipitation radars. Remote Sens. Environ. 2018, 208, 82–96. [Google Scholar] [CrossRef]
  18. Petracca, M.; D’Adderio, L.P.; Porcù, F.; Vulpiani, G.; Sebastianelli, S.; Puca, S. Validation of GPM dual-frequency precipitation radar (DPR) rainfall products over Italy. J. Hydrometeorol. 2018, 19, 907–925. [Google Scholar] [CrossRef]
  19. Biswas, S.K.; Chandrasekar, V. Cross-validation of observations between the GPM dual-frequency precipitation radar and ground based dual-polarization radars. Remote Sens. 2018, 10, 1773. [Google Scholar] [CrossRef]
  20. Hirose, M.; Shige, S.; Kubota, T.; Furuzawa, F.A.; Minda, H.; Masunaga, H. Refinement of surface precipitation estimates for the Dual-frequency Precipitation Radar on the GPM Core Observatory using near-nadir measurements. J. Meteorol. Soc. Jpn. Ser. II 2021, 99, 1231–1252. [Google Scholar] [CrossRef]
  21. Seto, S.; Iguchi, T.; Meneghini, R. Correction of path-integrated attenuation estimates considering the soil moisture effect for the GPM Dual-Frequency Precipitation Radar. J. Atmos. Oceanic. Technol. 2022, 39, 803–821. [Google Scholar] [CrossRef]
  22. Li, J.; Yong, B.; Shen, Z.; Wu, H.; Yang, Y. A New Method for Hour-by-Hour Bias Adjustment of Satellite Precipitation Estimates over Mainland China. Remote Sens. 2023, 15, 1819. [Google Scholar] [CrossRef]
  23. Speirs, P.; Gabella, M.; Berne, A. A comparison between the GPM dual-frequency precipitation radar and ground-based radar precipitation rate estimates in the Swiss Alps and Plateau. J. Hydrometeorol. 2017, 18, 1247–1269. [Google Scholar] [CrossRef]
  24. Liao, L.; Meneghini, R. GPM DPR retrievals: Algorithm, evaluation, and validation. Remote Sens. 2022, 14, 843. [Google Scholar] [CrossRef]
  25. Wang, M.; Fu, Y.; Zhao, C.; Zhong, L.; Li, R.; Wang, D.; Qiu, X.; Zhou, S. Characteristics of summer cloud precipitation along latitude 30° N in East Asia derived from Tropical Rainfall Measuring Mission Precipitation Radar and Visible and Infrared Scanner measurements. Int. J. Climatol. 2022, 42, 5373–5392. [Google Scholar] [CrossRef]
  26. Hayakawa, Y.S.; Oguchi, T.; Lin, Z. Comparison of new and existing global digital elevation models: ASTER G-DEM and SRTM-3. Geophys. Res. Lett. 2008, 35, L17404. [Google Scholar] [CrossRef]
  27. Lyu, Y.; Yong, B. A novel Double Machine Learning strategy for producing high-precision multi-source merging precipitation estimates over the Tibetan Plateau. Water Resour. Res. 2024, 60, e2023WR035643. [Google Scholar] [CrossRef]
  28. Shen, Y.; Zhao, P.; Pan, Y.; Yu, J. A high spatiotemporal gauge-satellite merged precipitation analysis over China. J. Geophys. Res.-Atmos. 2014, 119, 3063–3075. [Google Scholar] [CrossRef]
  29. Xie, P.; Xiong, A.Y. A conceptual model for constructing high-resolution gauge-satellite merged precipitation analyses. J. Geophys. Res.-Atmos. 2011, 116, D21106. [Google Scholar] [CrossRef]
  30. Wang, D.; Wang, X.; Liu, L.; Wang, D.; Huang, H.; Pan, C. Evaluation of CMPA precipitation estimate in the evolution of typhoon-related storm rainfall in Guangdong, China. J. Hydroinform. 2016, 18, 1055–1068. [Google Scholar] [CrossRef]
  31. Chandrasekar, V.; Hou, A.; Smith, E.; Bringi, V.N.; Rutledge, S.A.; Gorgucci, E.; Jackson, G.S. Potential role of dual-polarization radar in the validation of satellite precipitation measurements: Rationale and opportunities. Bull. Am. Meteorol. Soc. 2008, 89, 1127–1146. [Google Scholar] [CrossRef]
  32. Awaka, J.; Le, M.; Brodzik, S.; Kubota, T.; Masaki, T.; Chandrasekar, V.; Iguchi, T. Development of precipitation type classification algorithms for a full scan mode of GPM dual-frequency precipitation radar. J. Meteorol. Soc. Jpn. Ser. II 2021, 99, 1253–1270. [Google Scholar] [CrossRef]
  33. Li, Z.; Wen, Y.; Liao, L.; Wolff, D.; Meneghini, R.; Schuur, T. Joint collaboration on comparing NOAA’s ground-based weather radar and NASA–JAXA’s spaceborne radar. Bull. Amer. Meteorol. Soc. 2023, 104, E1435–E1451. [Google Scholar] [CrossRef]
  34. Yong, B.; Ren, L.L.; Hong, Y.; Wang, J.H.; Gourley, J.J.; Jiang, S.H.; Chen, X.; Wang, W. Hydrologic evaluation of Multisatellite Precipitation Analysis standard precipitation products in basins beyond its inclined latitude band: A case study in Laohahe basin, China. Water Resour. Res. 2010, 46, 759–768. [Google Scholar] [CrossRef]
  35. Shen, Z.; Yong, B.; Gourley, J.J.; Qi, W.; Lu, D.; Liu, J.; Ren, L.; Hong, Y.; Zhang, J. Recent global performance of the Climate Hazards group Infrared Precipitation (CHIRP) with Stations (CHIRPS). J. Hydrol. 2020, 591, 125284. [Google Scholar] [CrossRef]
  36. Lasser, M.; O, S.; Foelsche, U. Evaluation of GPM-DPR precipitation estimates with WegenerNet gauge data. Atmos. Meas. Tech. 2019, 12, 5055–5070. [Google Scholar] [CrossRef]
  37. Tian, Y.; Peters-Lidard, C.D.; Eylander, J.B.; Joyce, R.J.; Huffman, G.J.; Adler, R.F.; Hsu, K.; Turk, F.J.; Garcia, M.; Zeng, J. Component analysis of errors in satellite-based precipitation estimates. J. Geophys. Res.-Atmos. 2009, 114, 5055–5070. [Google Scholar] [CrossRef]
  38. Tang, G.; Clark, M.P.; Papalexiou, S.M.; Ma, Z.; Hong, Y. Have satellite precipitation products improved over last two decades? A comprehensive comparison of GPM IMERG with nine satellite and reanalysis datasets. Remote Sens. Environ. 2020, 240, 111697. [Google Scholar] [CrossRef]
  39. Song, J.; Qi, W.; Lyu, Y.; Zhang, H.; Song, Y.; Shi, T.; Wen, Y.; Yong, B. Detecting the Vertical Structure of Extreme Precipitation in the Headwater Area of Yellow River Using the Dual-Frequency Precipitation Radar Onboard the Global Precipitation Measurement Mission. Int. J. Climatol. 2024, 44, 5918–5933. [Google Scholar] [CrossRef]
  40. Yang, B.; Ren, S.; Wang, X.; Niu, N. Precipitation Characteristics at Different Developmental Stages of the Tibetan Plateau Vortex in July 2021 Based on GPM-DPR Data. Remote Sens. 2024, 16, 1947. [Google Scholar] [CrossRef]
  41. Matrosov, S. Polarimetric radar variables in snowfall at Ka-and W-band frequency bands: A comparative analysis. J. Atmos. Ocean. Technol. 2021, 38, 91–101. [Google Scholar] [CrossRef]
  42. Del Castillo-Velarde, C.; Kumar, S.; Valdivia-Prado, J.; Moya-Álvarez, A.; Flores-Rojas, J.; Villalobos-Puma, E.; Martínez, D.; Silva-Vidal, Y. Evaluation of GPM dual-frequency precipitation radar algorithms to estimate drop size distribution parameters, using ground-based measurement over the central Andes of Peru. Earth Syst. Environ. 2021, 5, 597–619. [Google Scholar] [CrossRef]
  43. Peinó, E.; Bech, J.; Polls, F.; Udina, M.; Petracca, M.; Adirosi, E.; Gonzalez, S.; Boudevillain, B. Validation of GPM DPR rainfall and Drop Size Distributions using disdrometer observations in the Western Mediterranean. Remote Sens. 2024, 16, 2594. [Google Scholar] [CrossRef]
  44. Bertoncini, A.; Thériault, J.; Pomeroy, J. A new GPM-DPR algorithm to estimate snowfall in mountain regions. J. Geophys. Res.-Atmos. 2025, 130, e2024JD041481. [Google Scholar] [CrossRef]
  45. Ma, Z.; Zhu, S.; Yang, J. FY4QPE-MSA: An all-day near-real-time quantitative precipitation estimation framework based on multispectral analysis from AGRI onboard Chinese FY-4 series satellites. IEEE Trans. Geosci. Remote Sens. 2022, 60, 1–15. [Google Scholar] [CrossRef]
  46. Liu, B.; Li, H.; Liu, L.; Shang, J.; Kuo, K.S.; Lu, C.; Yuan, M.; Jiang, B. On the detection sensitivities of dual-frequency radars onboard FY-3G and GPM-CO. Atmos. Res. 2025, 316, 107935. [Google Scholar] [CrossRef]
  47. Wei, L.; Zhao, L.; Li, Z.; Li, Y.; Wen, Q.; Ma, Y. Numerical simulation of circulation characteristics of orographic precipitation in Qilian Mountains, Northeastern Tibetan Plateau. Atmos. Res. 2024, 312, 107762. [Google Scholar] [CrossRef]
Figure 1. (a) The DEM distribution of Mainland China, where W, M, and E represent the three subregions of west, midwest, and east, respectively. (b) The spatial distribution of automatic rain gauges in the CMPA with a 0.1° spatial resolution from 1 January 2015 to 31 December 2018.
Remotesensing 17 02410 g001
Figure 2. The spatial distribution of the sampling number of DPR SVCs over Mainland China from 1 January 2015 to 31 December 2018.
Remotesensing 17 02410 g002
Figure 3. Statistical metrics of the DPR SVC retrieval algorithms against the CMPA over Mainland China at hourly time scales (N denotes the number of matched samples).
Remotesensing 17 02410 g003
Figure 4. Spatial distributions of statistical metrics for the DPR SVCs over Mainland China: the CC (ae), RB (fj), and RMSE (ko). The value in the lower left corner is the average of the corresponding indicator.
Remotesensing 17 02410 g004
Figure 5. Histogram comparison of (a) N, (b) CC, (c) RMSE, and (d) RB of DPR SVCs against CMPA under three subregions, i.e., west (W), midwest (M), and east (E).
Remotesensing 17 02410 g005
Figure 6. Boxplots of DPR SVCs in four seasons over Mainland China: CC (ad), RB (eh), and RMSE (il).
Remotesensing 17 02410 g006
Figure 7. Spatial distributions of statistical metrics for DPR SVCs over Mainland China: the POD (ae), FAR (fj), and CSI (ko). The value in the lower left corner is the average of the corresponding indicator.
Remotesensing 17 02410 g007
Figure 8. Histogram comparison of (a) POD, (b) FAR, and (c) CSI of DPR SVCs against CMPA under three subregions, i.e., west (W), midwest (M), and east (E).
Remotesensing 17 02410 g008
Figure 9. Boxplots of spatial categorical metrics for DPR SVCs in four seasons over Mainland China: POD (ad), FAR (eh), and CSI (il).
Remotesensing 17 02410 g009
Figure 10. Spatial distributions of error components of DPR SVCs during the summer months over Mainland China: the total bias (ae), hit bias (fj), miss bias (ko), and false bias (pt). The figure in the lower left corner is the mean of the corresponding indicator.
Remotesensing 17 02410 g010
Figure 11. Spatial distributions of error components of DPR SVCs during the winter months over Mainland China: the total bias (ae), hit bias (fj), miss bias (ko), and false bias (pt). The figure in the lower left corner is the mean of the corresponding indicator.
Remotesensing 17 02410 g011
Figure 12. Elevation distributions of continuous metrics for DPR SVCs over Mainland China: (a) CC, (b) RB, (c) RMSE, (d) POD, (e) FAR, and (f) CSI.
Remotesensing 17 02410 g012
Table 1. The list of the evaluation metrics used in this study.
Statistic MetricsUnitEquationOptimal Value
CCNA C C = i = 1 n ( G i G ¯ ) ( S i S ¯ ) i = 1 n ( G i G ¯ ) 2 × i = 1 n ( S i S ¯ ) 2 1
RMSEmm/h R M S E = 1 n i = 1 n ( S i G i ) 2 0
RB% R B = i = 1 n ( S i G i ) i = 1 n G i × 100 % 0
PODNA P O D = H H + M 1
FARNA F A R = F H + F 0
CSINA C S I = H H + F + M 1
Hit bias%Hit bias = i = 1 n ( S _ H , i G _ H , i ) i = 1 n G i × 100 % 0
Miss bias%Miss bias = i = 1 n ( S _ M , i G _ M , i ) i = 1 n G i × 100 % 0
False bias%False bias = i = 1 n ( S _ F , i G _ F , i ) i = 1 n G i × 100 % 0
Notation: G i refers to the baseline (CMPA) and G ¯ is the average of the baseline, S i and S ¯ mean the satellite precipitation estimates (DPR) and their average, and n refers to the number of samples. H is the number of hit events where the observed rainfall was also detected by the satellite, M is the number of missed events where the observed rainfall was not detected by the satellite, and F is the number of false alarms. Please refer to Table 2 for the corresponding description of H, M, and F.
Table 2. Criteria for judging error component factors.
G i 0.1   m m / h G i < 0.1   m m / h
S i 0.1 mm / h HF
S i < 0.1 mm / h M/
Table 3. Statistical validation results of five DPR SVCs in different partitions.
DPR SVCsEMWMean
CCV06-NS0.770.810.800.78
V06-HS0.800.840.860.81
V06-MS0.800.840.830.81
V07-FS0.800.800.760.78
V07-HS0.790.840.860.81
RB (%)V06-NS10.5819.16−6.177.86
V06-HS−3.48−5.28−27.25−12.00
V06-MS26.5827.34−1.7617.39
V07-FS12.5219.89−2.909.84
V07-HS3.150.14−21.88−6.20
RMSE (mm/h)V06-NS2.881.871.332.03
V06-HS2.211.571.231.67
V06-MS2.911.811.822.00
V07-FS2.941.861.332.04
V07-HS2.341.591.191.71
PODV06-NS0.610.580.520.57
V06-HS0.570.540.450.52
V06-MS0.620.590.550.59
V07-FS0.630.600.560.60
V07-HS0.480.440.390.44
FARV06-NS0.280.310.380.33
V06-HS0.230.250.300.26
V06-MS0.290.310.360.32
V07-FS0.300.330.420.35
V07-HS0.400.420.440.42
CSIV06-NS0.490.450.390.47
V06-HS0.490.450.380.44
V06-MS0.490.460.420.46
V07-FS0.490.450.400.45
V07-HS0.360.330.310.33
Notation: E, M, and W, respectively, represent east, midwest, and west over Mainland China. The “Mean” column represents the overall metric computed from all matched samples across the entire domain, rather than the average of the three subregions.
Table 4. Statistic indicators of five DPR SVCs across different seasons.
DPR SVCsCCRB (%)RMSE(mm/h)PODFARCSI
SpringV06-NS0.8429.372.010.630.270.51
V06-HS0.889.701.610.600.210.51
V06-MS0.8845.772.040.650.270.52
V07-FS0.8431.432.04 0.650.290.51
V07-HS0.8826.251.62 0.470.410.36
SummerV06-NS0.8118.192.730.650.300.51
V06-HS0.8713.212.140.610.250.51
V06-MS0.8540.882.640.660.310.51
V07-FS0.8118.262.750.670.300.51
V07-HS0.8721.802.280.610.250.50
AutumnV06-NS0.8624.411.560.550.290.44
V06-HS0.917.611.390.510.230.44
V06-MS0.9033.921.450.570.290.45
V07-FS0.8625.001.600.570.300.45
V07-HS0.9110.051.440.530.250.44
WinterV06-NS0.8830.440.860.370.430.28
V06-HS0.922.500.770.350.290.30
V06-MS0.9142.810.820.390.400.30
V07-FS0.8835.310.850.400.470.28
V07-HS0.926.320.770.380.350.30
Disclaimer/Publisher’s Note: The statements, opinions and data contained in all publications are solely those of the individual author(s) and contributor(s) and not of MDPI and/or the editor(s). MDPI and/or the editor(s) disclaim responsibility for any injury to people or property resulting from any ideas, methods, instructions or products referred to in the content.

