Article

An Integrated Approach for Emergency Response and Long-Term Prevention for Rainfall-Induced Landslide Clusters

1
School of Earth Sciences, Lanzhou University, Lanzhou 730000, China
2
Gansu Tech Innovation Centre for Environmental Geology and Geohazard Prevention, Lanzhou 730000, China
3
International Science & Technology Cooperation Base for Geohazards Monitoring, Warning & Prevention, Lanzhou 730000, China
4
Gansu Hydrogeological and Engineering Geology Investigation Institute, Lanzhou 730020, China
5
MOE Key Laboratory of Western China’s Environment Systems, College of Earth and Environment Science, Lanzhou University, Lanzhou 730000, China
*
Author to whom correspondence should be addressed.
Remote Sens. 2025, 17(14), 2406; https://doi.org/10.3390/rs17142406 (registering DOI)
Submission received: 4 June 2025 / Revised: 4 July 2025 / Accepted: 8 July 2025 / Published: 12 July 2025

Abstract

Under the background of global climate change, shallow landslide clusters induced by extreme rainfall are occurring with increasing frequency, causing severe casualties and economic losses. To address this challenge, this study proposes an integrated approach to support both emergency response and long-term mitigation for rainfall-induced shallow landslides. The workflow includes (1) rapid landslide detection based on time-series image fusion and threshold segmentation on the Google Earth Engine (GEE) platform; (2) numerical simulation of landslide runout using the R.avaflow model; (3) landslide susceptibility assessment based on event-driven inventories and machine learning; and (4) delineation of high-risk slopes by integrating simulation outputs, susceptibility results, and exposed elements. Applied to Qugaona Township in Zhouqu County, Bailong River Basin, the framework identified 747 landslides. The R.avaflow simulations captured the spatial extent and depositional features of landslides, assisting post-disaster operations. The Gradient Boosting-based susceptibility model achieved an accuracy of 0.870, with 8.0% of the area classified as highly susceptible. In Cangan Village, high-risk slopes were delineated, with 31.08%, 17.85%, and 22.42% of slopes potentially affecting buildings, farmland, and roads, respectively. The study recommends engineering interventions for these areas. Compared with traditional methods, this approach demonstrates greater applicability and provides a more comprehensive basis for managing rainfall-induced landslide hazards.

1. Introduction

Driven by global climate change, the frequency and intensity of extreme rainfall events are increasing [1,2], which significantly increases the risk of clustered landslide hazards in mountainous regions [3,4,5,6]. Landslides triggered by extreme rainfall generally move rapidly [7,8] and are highly destructive to human life and infrastructure [9,10,11]. In different stages after the occurrence of clustered landslides, the demand for hazard mitigation is different. In the hours to weeks following the hazards, here referred to as the emergency response phase, there is a need to identify highly impacted areas to help decision makers prioritize disaster relief efforts, while in the long term, referred to as long-term prevention phase, attention should be paid to hazard zonation to identify potential hazardous regions as a key reference for land-use design. The integration of efficient emergency response and hazard prevention is key to alleviating the losses of life and properties caused by cluster landslides.
The core demands of post-disaster emergency response include (1) rapid delineation of landslide zones and (2) identification of inundated areas. Existing landslide disaster emergency response practices primarily focus on large-scale or earthquake-triggered landslides. For instance, the Aniangzhai (ANZ) landslide triggered by heavy rainfall on 17 June 2020 was addressed through emergency response efforts, including field surveys and deformation monitoring [12]. Similarly, the Shanshucao landslide on 2 September 2014 is another example of a successful multi-party collaborative response [13]. Some studies have applied fuzzy logic methods to rapidly assess the distribution of earthquake-triggered landslides based on existing landslide samples, supporting emergency response efforts [14]. A similar approach includes using earthquake landslide susceptibility maps to assess the distribution of highways [15], thereby providing crucial information for earthquake disaster response. Additionally, there are studies focusing on emergency response strategies for monitoring of earthquake-triggered landslide dams [16]. However, for rainfall-induced landslide disasters, current research mainly addresses individual large-scale landslides, with a lack of comprehensive emergency response plans for clustered shallow landslides. At present, mainstream approaches for landslide identification include field surveys, visual interpretation of remote sensing images [17,18,19,20,21,22], threshold segmentation [23], and supervised classification [24,25,26]. While field surveys and visual interpretation are accurate, they are inefficient when applied to large-scale landslide events. Supervised classification methods, though effective, require advanced technical expertise and reliable training data. Threshold segmentation, by comparison, is rapid and less technically demanding. It is especially effective in vegetated areas, where NDVI change detection enables the identification of landslide activity. Regarding the detection of landslide inundation areas, interpretation based on high-resolution remote sensing imagery is feasible; however, high-resolution images are usually costly and only delineate spatial extent, without providing depth information. Yet, thickness information is vital for post-disaster rescue and debris removal operations, since it determines the allocation of equipment and rescue personnel. Numerical simulations, in contrast, can estimate both the depth and spatial extent of landslide inundation, providing a satisfactory approach to obtain the depositional thickness of landslides. A variety of numerical models are available for use, e.g., RAMMS, FLO-2D, GeoFlow SPH, and R.avaflow, etc. [27,28,29,30]. These models have been widely applied to simulating landslide runout and depositional extents under various geomorphological and climatic conditions, offering essential support for risk zoning, emergency planning, and engineering design in landslide-prone regions.
Long-term landslide mitigation efforts focus on (1) delineating high-risk slopes and (2) identifying potential impact zones. For long-term landslide mitigation, whether triggered by rainfall or earthquakes, the most widely used method is susceptibility assessment. Susceptibility assessment plays a vital role in pinpointing high-risk areas. Such assessments analyze terrain, geological structure, rainfall patterns, vegetation coverage, and other controlling factors to classify regions into distinct hazard levels. Common methods for landslide susceptibility assessment include heuristic methods, deterministic methods, machine learning methods, and hybrid methods. Heuristic methods, such as the Analytic Hierarchy Process (AHP) [31,32,33], the Weighted Sum Method (WSM) [34,35], and Multi-Criteria Decision Analysis (MCDA) [36,37], rely on expert experience and simplified rules. Although these methods are easy to implement, they tend to have lower accuracy, are influenced by subjective judgment, and are less effective at handling complex nonlinear relationships and large-scale data. Deterministic methods, based on physical models (e.g., TRIGRS, SPRIn-SL, Scoops3D) [38,39,40], simulate the landslide process and can provide high predictive accuracy, especially when sufficient data are available. However, these methods typically require high-quality input data and involve large computational loads, resulting in low processing efficiency. Their applicability is often limited by theoretical assumptions and environmental conditions. Machine learning methods, as data-driven techniques, learn from large volumes of historical data and efficiently handle complex nonlinear relationships and large datasets. Common methods include Extra Trees, Random Forests, SVM, and Neural Networks, etc. [41,42,43,44,45,46,47]. Compared to traditional methods, machine learning has the advantage of automatically extracting patterns and relationships from data, making it particularly suitable for landslide susceptibility assessments in the presence of multiple factors and complex geographic, climatic, and anthropogenic influences. In recent years, machine learning has been increasingly applied to susceptibility mapping by integrating large-scale remote sensing and geological datasets [48,49,50]. However, due to limitations in spatial resolutions, many landslides susceptibility assessments fail to accurately locate high-risk hillslopes, thus limiting their utility in targeted slope reinforcement strategies [51]. Moreover, most susceptibility maps highlight potential initiation zones while neglecting landslide runout areas. Under intense rainfall, landslide runout distances can increase significantly, which may transform into debris flows, triggering cascading hazards [52,53,54]. This renders simple overlay methods inadequate and susceptible to misinterpretation [55]. Additionally, not all hazardous slopes pose substantial risks—their impact depends heavily on the spatial distribution of exposed elements. Therefore, it is essential to classify hazardous slopes by their disaster potential and implement hierarchical mitigation strategies.
Significant progress has been made in both post-disaster emergency response and long-term mitigation of landslide hazards. However, few studies have integrated short-term emergency response with long-term hazard mitigation to develop a comprehensive mitigation strategy for rainfall-induced landslide clusters. Ma et al. (2020) proposed a three-phase spatial prediction framework for earthquake-induced landslides, supporting emergency response, mid-term resettlement, and long-term reconstruction [56]. However, a unified approach specifically designed for rainfall-induced landslides remains absent. Therefore, a pressing need exists for a comprehensive framework that targets rainfall-induced landslide clusters, addressing both immediate emergency response and long-term mitigation to achieve effective disaster risk reduction.
To address both post-disaster emergency needs and long-term prevention of rainfall-induced landslide clusters, this study proposes an integrated methodological framework: (1) Emergency response is supported by time-series image fusion and threshold segmentation techniques to enable rapid landslide identification using the GEE platform; subsequently, the R.avaflow model is employed to simulate landslide runout processes, aiding emergency rescue and post-disaster cleanup. (2) For long-term mitigation, landslide susceptibility to extreme rainfall is assessed using machine learning and event-based landslide inventories. High-risk slopes and impact-prone zones are delineated by integrating susceptibility analysis, runout simulations, and spatial exposure data. This forms a scientific basis for long-term hazard mitigation and urban planning. A case study of the rainfall-induced landslide cluster on 17 August 2020, in the Bailong River Basin, China, is used to demonstrate the practical implementation of the framework.

2. Study Area

The Bailong River Basin is situated at the convergence of the Qinghai–Tibet Plateau, Loess Plateau, and Sichuan Basin—an area marked by the intersection of China’s major east–west and north–south seismic belts (Figure 1). This region is among the most severely impacted areas globally in terms of landslides and debris flows. The landscape features complex tectonic structures, steep terrain, deeply incised valleys, extensive soft rock distributions, and frequent intense rainfall—all of which create highly favorable geological and environmental conditions for landslide initiation. The basin is strongly governed by the Asian monsoon system, leading to highly seasonal rainfall predominantly occurring in the summer months. The coupling of concentrated monsoonal precipitation with frequent seismic activity constitutes the principal external trigger for the frequent occurrence of landslides and debris flows throughout the region.
During 10–17 August 2020, three significant rainfall peaks were recorded in the Qugaona region (Figure 1c). The most extreme event lasted from 5:00 on 15 August to 10:00 on 17 August, with a total accumulation of 114.2 mm. The heaviest rainfall occurred from 16:00 on 16 August to 8:00 on 17 August, lasting 16 h, with an average intensity of 4.2 mm/h. An analysis of precipitation data in the Wudu area from 1990 to 2020 shows that such an event has a recurrence probability of less than 1%. This extreme rainfall triggered numerous landslides in the middle reaches of the Bailong River, with Qugaona Township being one of the most severely affected areas by landslides and debris flows.

3. Materials and Methods

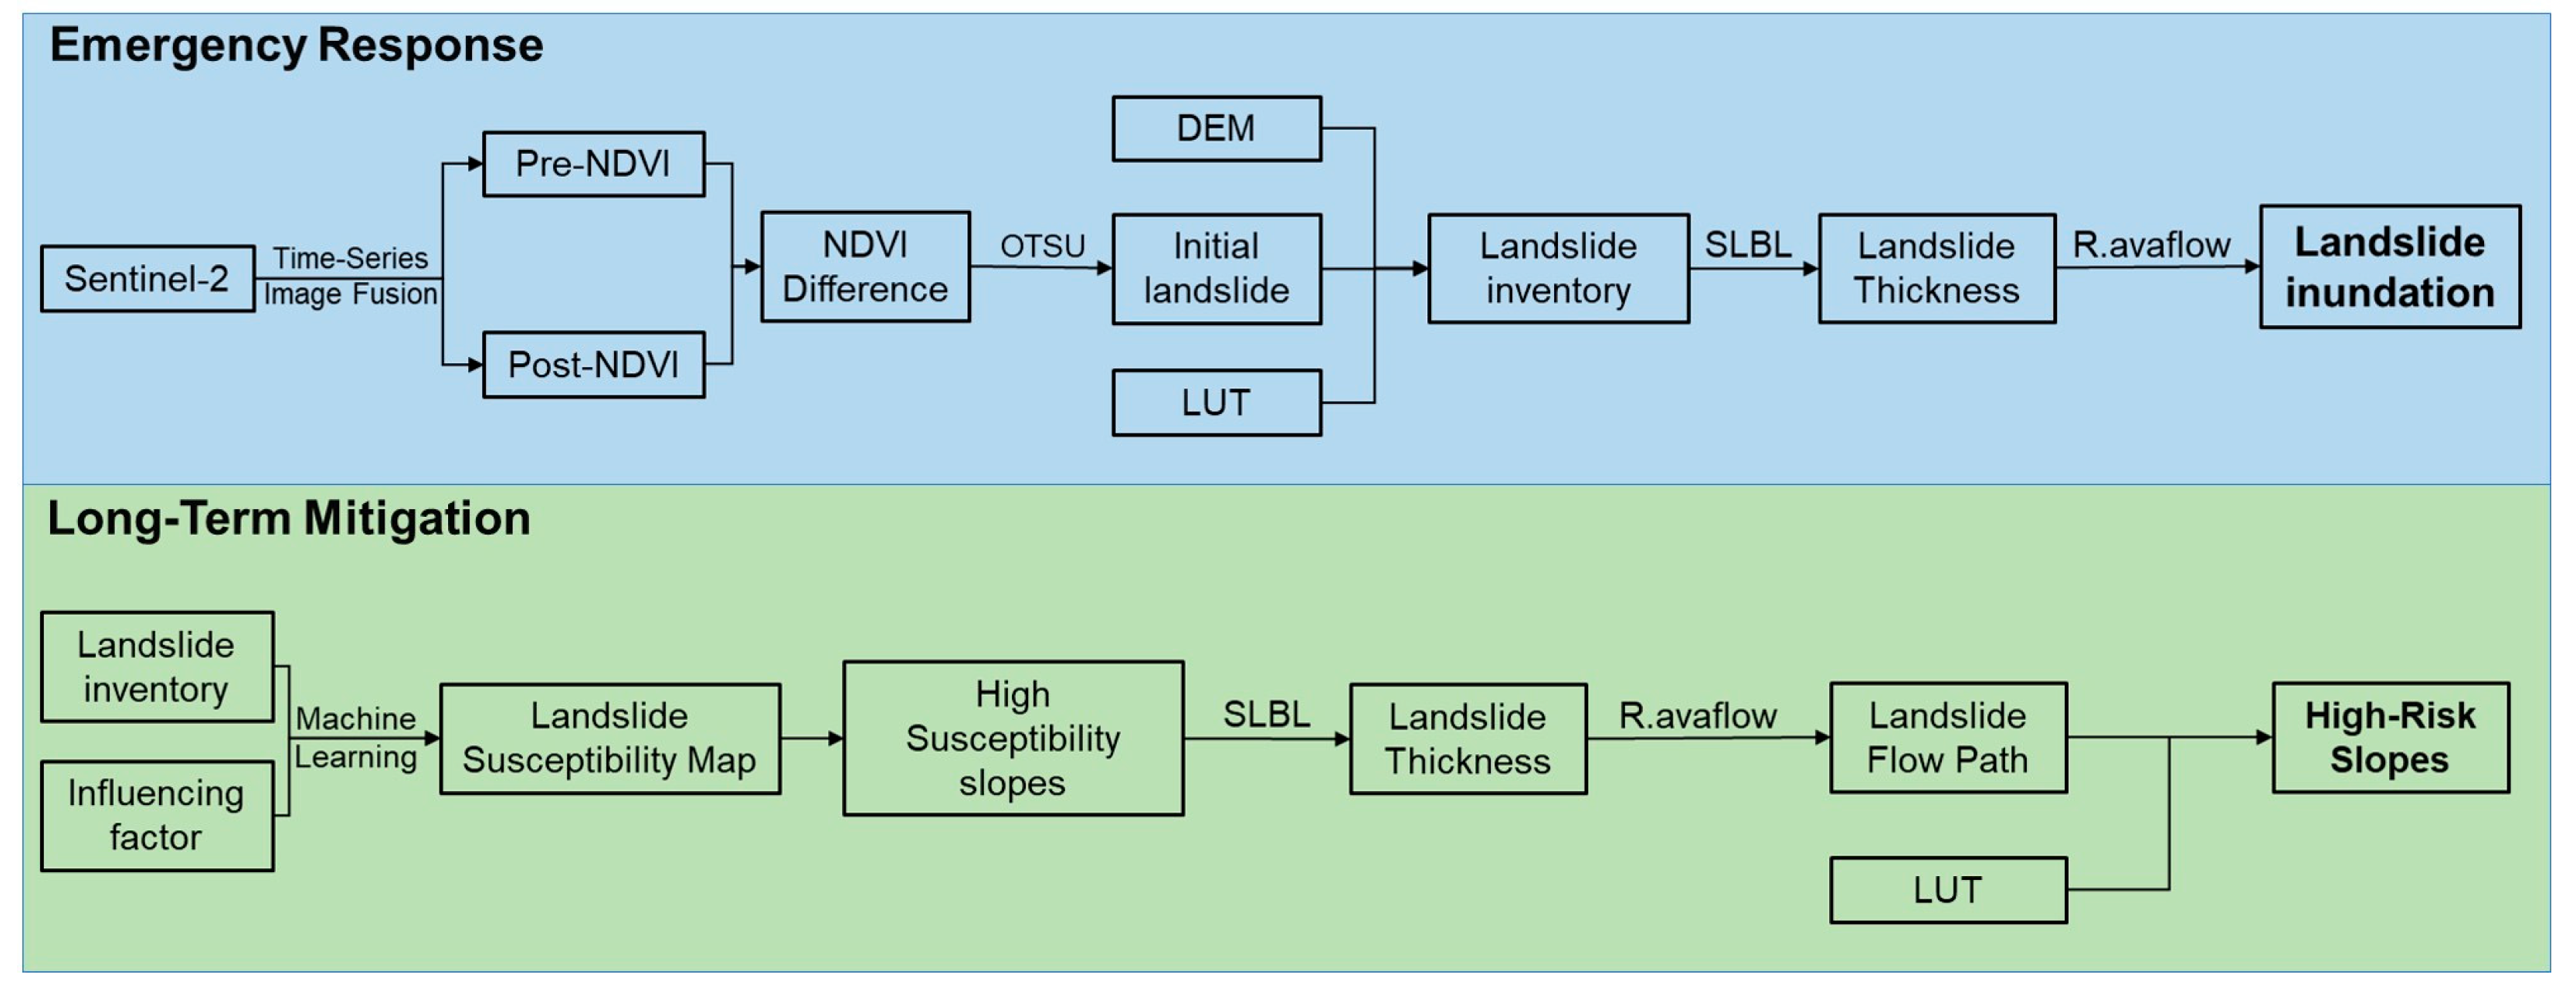
This study proposes an integrated framework for addressing shallow landslides triggered by intense rainfall events. The approach combines the capabilities of the GEE cloud-based geospatial processing platform, OTSU threshold segmentation [57], the Simple Basal Level (SLBL) method for landslide thickness estimation [58], machine learning-based landslide susceptibility assessment, and R.avaflow simulation modeling (Mergili, M., Pudasaini, S.P., 2014–2023. r.avaflow—The mass flow simulation tool. https://www.avaflow.org, accessed on 10 November 2024). The objective is to support both emergency response and long-term mitigation efforts for rainfall-induced landslide hazards. The procedural flow of this study is illustrated in Figure 2.
First, multiple pre- and post-event two-month Sentinel-2 images were acquired from the GEE platform. Cloud masking was applied using the Sentinel-2 cloud probability layer, which is generated by a machine learning model that combines multispectral band information and atmospheric data. The probability values range from 0 to 100, with higher values indicating a greater likelihood of cloud presence. In this study, a threshold of 10 was used; thresholds can be adjusted according to specific application requirements. The cloud-free images were sorted based on their temporal proximity to the rainfall event and mosaicked to ensure high temporal consistency in the resulting composites. Rainfall-induced shallow landslides typically result in vegetation loss. Thus, NDVI differencing is an effective means of detecting landslide-affected areas. By integrating OTSU threshold segmentation with a slope mask, landslide-affected zones can be rapidly delineated.
After landslide areas are identified, the SLBL method is applied to estimate the volume of unstable material. The estimated volumes are subsequently incorporated into the R.avaflow model to simulate runout behavior, facilitating rapid delineation of affected areas and flow severity. This aids in the efficient allocation of emergency personnel and resources. Furthermore, rainfall-induced landslide clusters often deposit substantial volumes of unconsolidated material within channel networks. Subsequent rainfall events may remobilize these deposits into debris flows, and the simulation outcomes provide a scientific basis for post-disaster channel clearance and management.
A suite of machine learning algorithms was employed to assess landslide susceptibility under conditions of intense rainfall. Zones with high and very high susceptibility levels were identified, and the volumes of unstable masses within these zones were estimated using the SLBL method. The potential movement of unstable masses in the very-high-susceptibility zones was simulated using the R.avaflow model to delineate potential impact zones. By integrating local geospatial data on buildings, roads, and agricultural land, hazardous slopes were systematically delineated. This provides a scientific foundation for engineering interventions on high-risk slopes and land use planning.

3.1. OTSU Threshold Segmentation Method

The OTSU thresholding method is a well-established technique in image processing. Its fundamental principle is to determine an optimal threshold that maximizes the between-class variance (or equivalently, minimizes the within-class variance) of the two resulting classes: foreground and background [57]. The between-class variance is calculated as
σ B 2 = ω 0 ω 1 ( μ 0 μ 1 ) 2
Here, μ0 and μ1 represent the mean pixel values of the background and foreground, respectively, while ω0 and ω1 denote the weights (probabilities) of the background and foreground. The optimal threshold is the one that maximizes the between-class variance σB2 across all possible threshold values.
The OTSU method is computationally efficient, non-parametric, and does not require manual intervention. It is particularly well-suited for images with bimodal distributions, which aligns well with our application—since NDVI differencing before and after the event produces a bimodal distribution: areas with significant NDVI change and those with stable vegetation.

3.2. Estimation of Landslide Thickness Using the SLBL Model

The SLBL method is used to estimate the volume of unstable slopes based on a Digital Elevation Model (DEM) [58]. Prior to calculation, potential landslide-affected slopes are delineated using remote sensing imagery. An iterative algorithm is then applied to approximate a plausible three-dimensional failure surface. At the t iteration, the elevation at grid node ( i , j ) of the DEM is represented as z ( t ) i , j , which is derived from the previous iteration z ( t 1 ) i , j as follows:
z ( t ) i , j = z ( t 1 ) i 1 , j + z ( t 1 ) i + 1 , j + z ( t 1 ) i , j 1 + z ( t 1 ) i , j + 1 4 C
where i and j are the column and row indices of each pixel, and C is a constant related to the grid size, involving the second-order numerical derivative with respect to Δ x . If z ( t ) i , j > z ( t 1 ) i , j , then z ( t ) i , j is reset to z ( t 1 ) i , j . The iteration continues until the difference at all grid nodes falls below a specified threshold [59]. Finally, the landslide thickness is determined by comparing the generated 3D failure surface with the original DEM.
Field investigations indicate that rainfall-induced shallow landslides in the region typically have a thickness of less than 1 m. Therefore, a maximum thickness of 1 m is set in the model, and landslide thickness is derived through iteration—this is a key input parameter required for R.avaflow simulation.

3.3. R.avaflow Model

This study employs the R.avaflow v3.0 mass flow simulation tool, developed by Mergili and Pudasaini (Mergili, M., Pudasaini, S.P., 2014–2023. r.avaflow—the mass flow simulation tool. https://www.avaflow.org, accessed on 10 November 2024). The model adopts a NOC-TVD numerical scheme [60] and incorporates a Voellmy-type rheology, while also supporting either an advanced Pudasaini multiphase flow model [61] or a motion balance model for non-ultrarapid flows. R.avaflow simulates erosion, deposition, diffusion, and phase transitions, and includes built-in modules for model validation, parameter tuning, and sensitivity analysis.
R.avaflow integrates four types of entrainment models. The first entrainment model (EM1) is an empirical formulation for erosion, while the second (EM2) represents a simplified mechanical erosion approach. The third model integrates EM1 and EM2, with EM1 governing erosion processes and EM2 governing deposition. The fourth model is based on acceleration–deceleration dynamics, in which acceleration leads to entrainment and deceleration results in deposition. Among these, EM1 and EM2 are most frequently used in practical applications. Their main features are as follows:
In EM1, the erosion depth is calculated by multiplying an entrainment coefficient by the flow momentum. The model follows the equation proposed by Baggio et al. (2021) [62]:
D E = C E M f + M s α E m a x t
where C E (kg−1) is the empirical erosion coefficient, D E (m) is the entrainment depth for fluids or solids, M f and M s (kg·m·s−1) represent the fluid and solid momentum, calculated as the product of mass ratio and mean velocity, and α E m a x is the solid volume fraction of the entrained material (or (1 − α E m a x ) for fluid erosion).
In EM2, the erosion strength is governed by the following formula [63,64]:
E P = g c o s ζ 1 γ m ρ m μ m α m 1 γ b ρ b μ b α b ρ m λ m α m ρ b λ b α b
where E P is the erosion parameter indicating the intensity of erosion, g is gravitational acceleration, ζ is the slope angle, ρ is density, γ = ρ f / ρ s is the fluid-to-solid density ratio, μ is particle velocity, α is the solid volume fraction, λ is defined as the erosion drift, with ( u b = λ b u , u m = λ m u ) , and superscripts m and b refer to the moving debris mixture and the erodible bed, respectively.

3.4. Landslide Susceptibility Assessment

3.4.1. Selection of Evaluation Factors and Data Preprocessing

Landslides are externally triggered geological processes governed by a variety of environmental and anthropogenic factors. Their occurrence and evolution exhibit strong spatial heterogeneity and regional specificity. Based on previous research and site-specific characteristics of the Bailong River Basin, this study identified 17 evaluation factors covering topography, geology, soil texture, vegetation, and anthropogenic disturbance factors (Table 1).
The data sources for each category of evaluation factor are listed below:
(1)
Topographic factors: derived from 5 m resolution DEM;
(2)
Geological factors: obtained from national geological maps at 1:100,000 and 1:50,000 scales;
(3)
Soil texture factors: including sand, silt, and clay content, sourced from national soil texture spatial datasets;
(4)
Vegetation factor (NDVI): derived from 10 m resolution Sentinel-2 imagery;
(5)
Road network factor: interpreted from 1 m resolution Google imagery;
(6)
Land use factor: obtained from the 2020 China National Land Use and Cover Change (CNLUCC) dataset;
(7)
Human activity factors: including human modification intensity and population density, both retrieved from public datasets on the GEE platform.

3.4.2. Susceptibility Mapping Units

Mapping units for landslide susceptibility assessment are typically categorized into grid cells and slope units. Slope units have received increasing attention due to their alignment with geomorphological and geological boundaries, whereas grid cells remain widely adopted for their simplicity, flexibility, and computational efficiency. Considering the spatial resolution of input data and the computational limitations within the study area, this study employed 10 × 10 m grid cells as the primary mapping unit, with environmental factor data resampled to 5 m resolution for model input. This fine-scale discretization enables more precise identification of high-susceptibility zones and offers improved data support for early warning systems and disaster mitigation strategies.

3.4.3. Selection of Machine Learning Algorithms

Machine learning has demonstrated considerable effectiveness in landslide susceptibility assessment due to its ability to capture complex nonlinear relationships. Compared to conventional statistical approaches, machine learning more effectively reveals spatial patterns and dominant controlling factors of landslide occurrence, and quantifies the relative contribution of each factor, thereby offering more interpretable and accurate predictive outcomes. In recent years, numerous studies have applied machine learning techniques to landslide hazard assessment with promising results. However, no single model has demonstrated universal applicability across different geographical settings. Therefore, this study initially selected a set of widely used machine learning algorithms to evaluate their applicability and performance in the Bailong River Basin (Table 2).
To evaluate and optimize model performance in landslide susceptibility classification, appropriate performance metrics are essential. Since landslide susceptibility is a classification task, the following metrics are commonly adopted:
(1) Confusion Matrix
A confusion matrix displays the classification results of the model, including the following:
TP (True Positive): correctly predicted positive samples;
TN (True Negative): correctly predicted negative samples;
FP (False Positive): negative samples incorrectly predicted as positive;
FN (False Negative): positive samples incorrectly predicted as negative.
(2) Accuracy (ACC)
The formula for Accuracy is as follows:
A C C = T P + T N T P + T N + F P + F N
ACC measures the proportion of correctly classified samples among all samples. It is most suitable for balanced datasets.
(3) AUC-ROC Curve (Area Under the Receiver Operating Characteristic Curve)
The ROC curve illustrates the trade-off between recall (true positive rate) and false positive rate under different thresholds. The AUC value represents the area under the ROC curve, with values closer to 1 indicating better discrimination capability between classes.

4. Results

4.1. Landslide Identification

4.1.1. Landslide Distribution

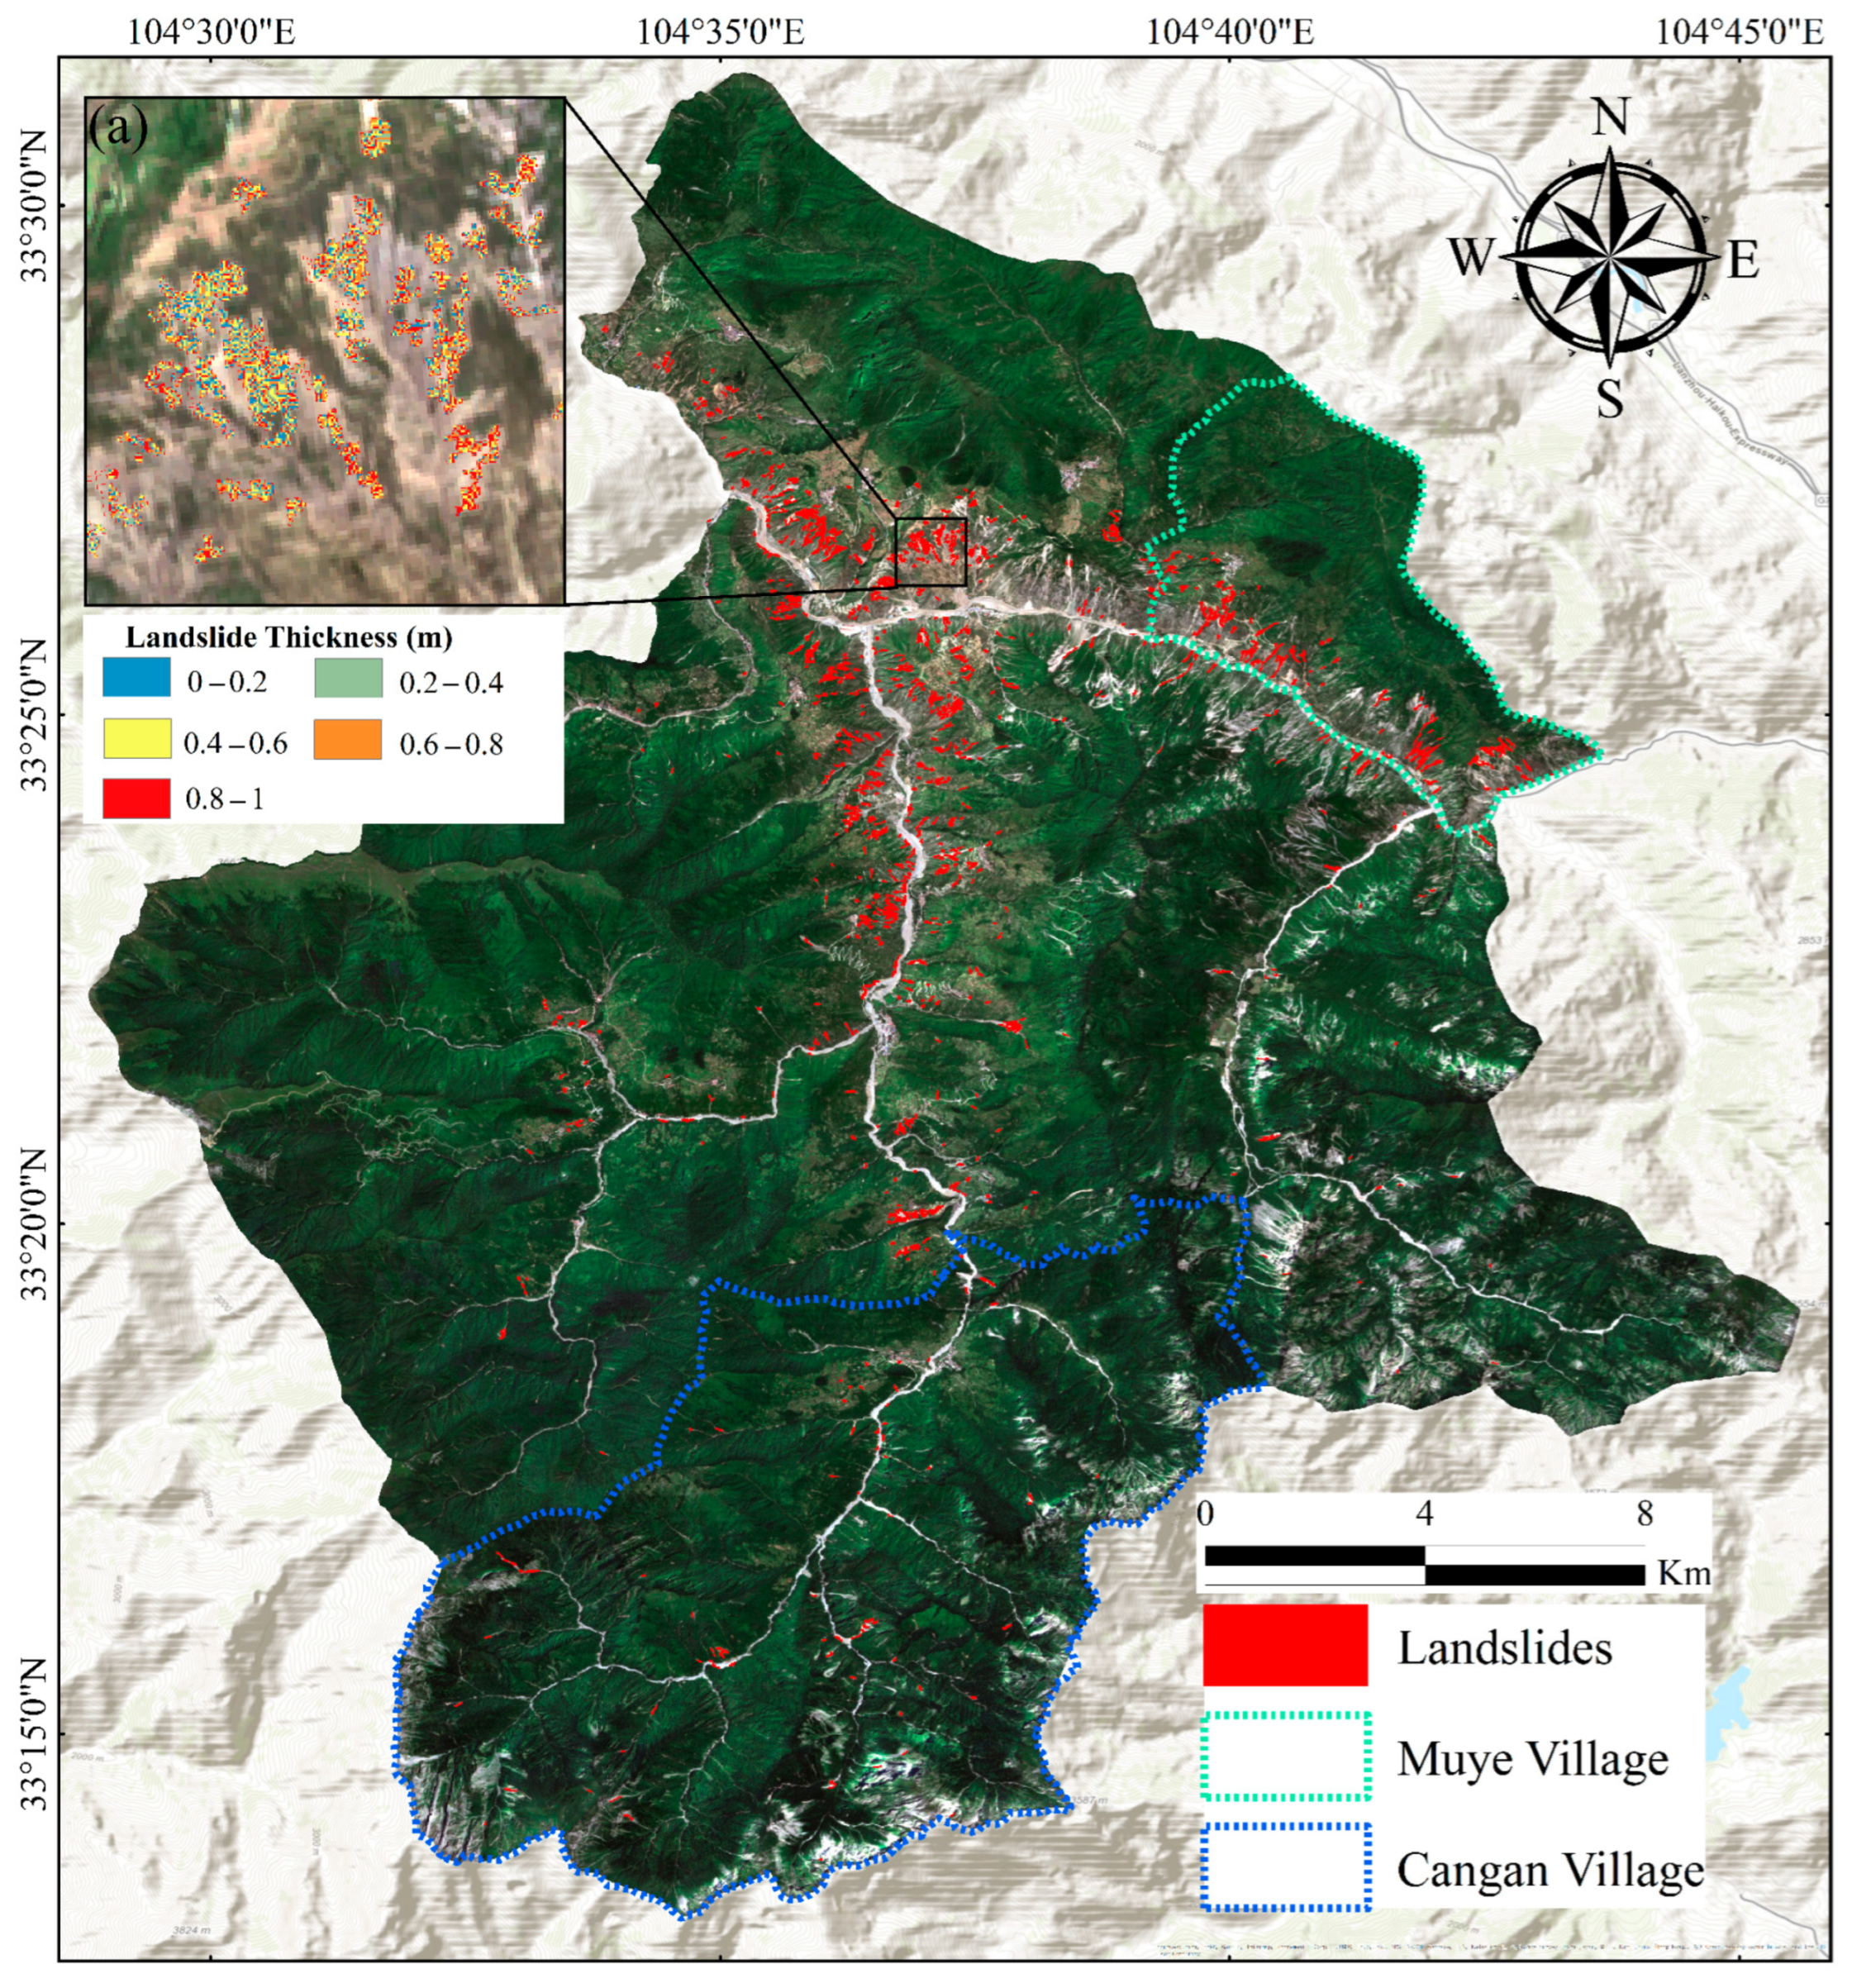
A total of 747 landslides were identified in Qugaona Township (Figure 3) using OTSU threshold segmentation applied to the NDVI change map, with an optimal threshold value of 0.1096. The mapped landslides exhibited substantial variation in area, ranging from 985 m2 to 127,809.97 m2, with an average size of approximately 3892 m2. The total landslide coverage constitutes approximately 0.65% of the township’s area. These findings provide a comprehensive overview of landslide spatial distribution in the study area and offer a scientific basis for targeted disaster mitigation and regional planning.

4.1.2. Landslide Identification Validation

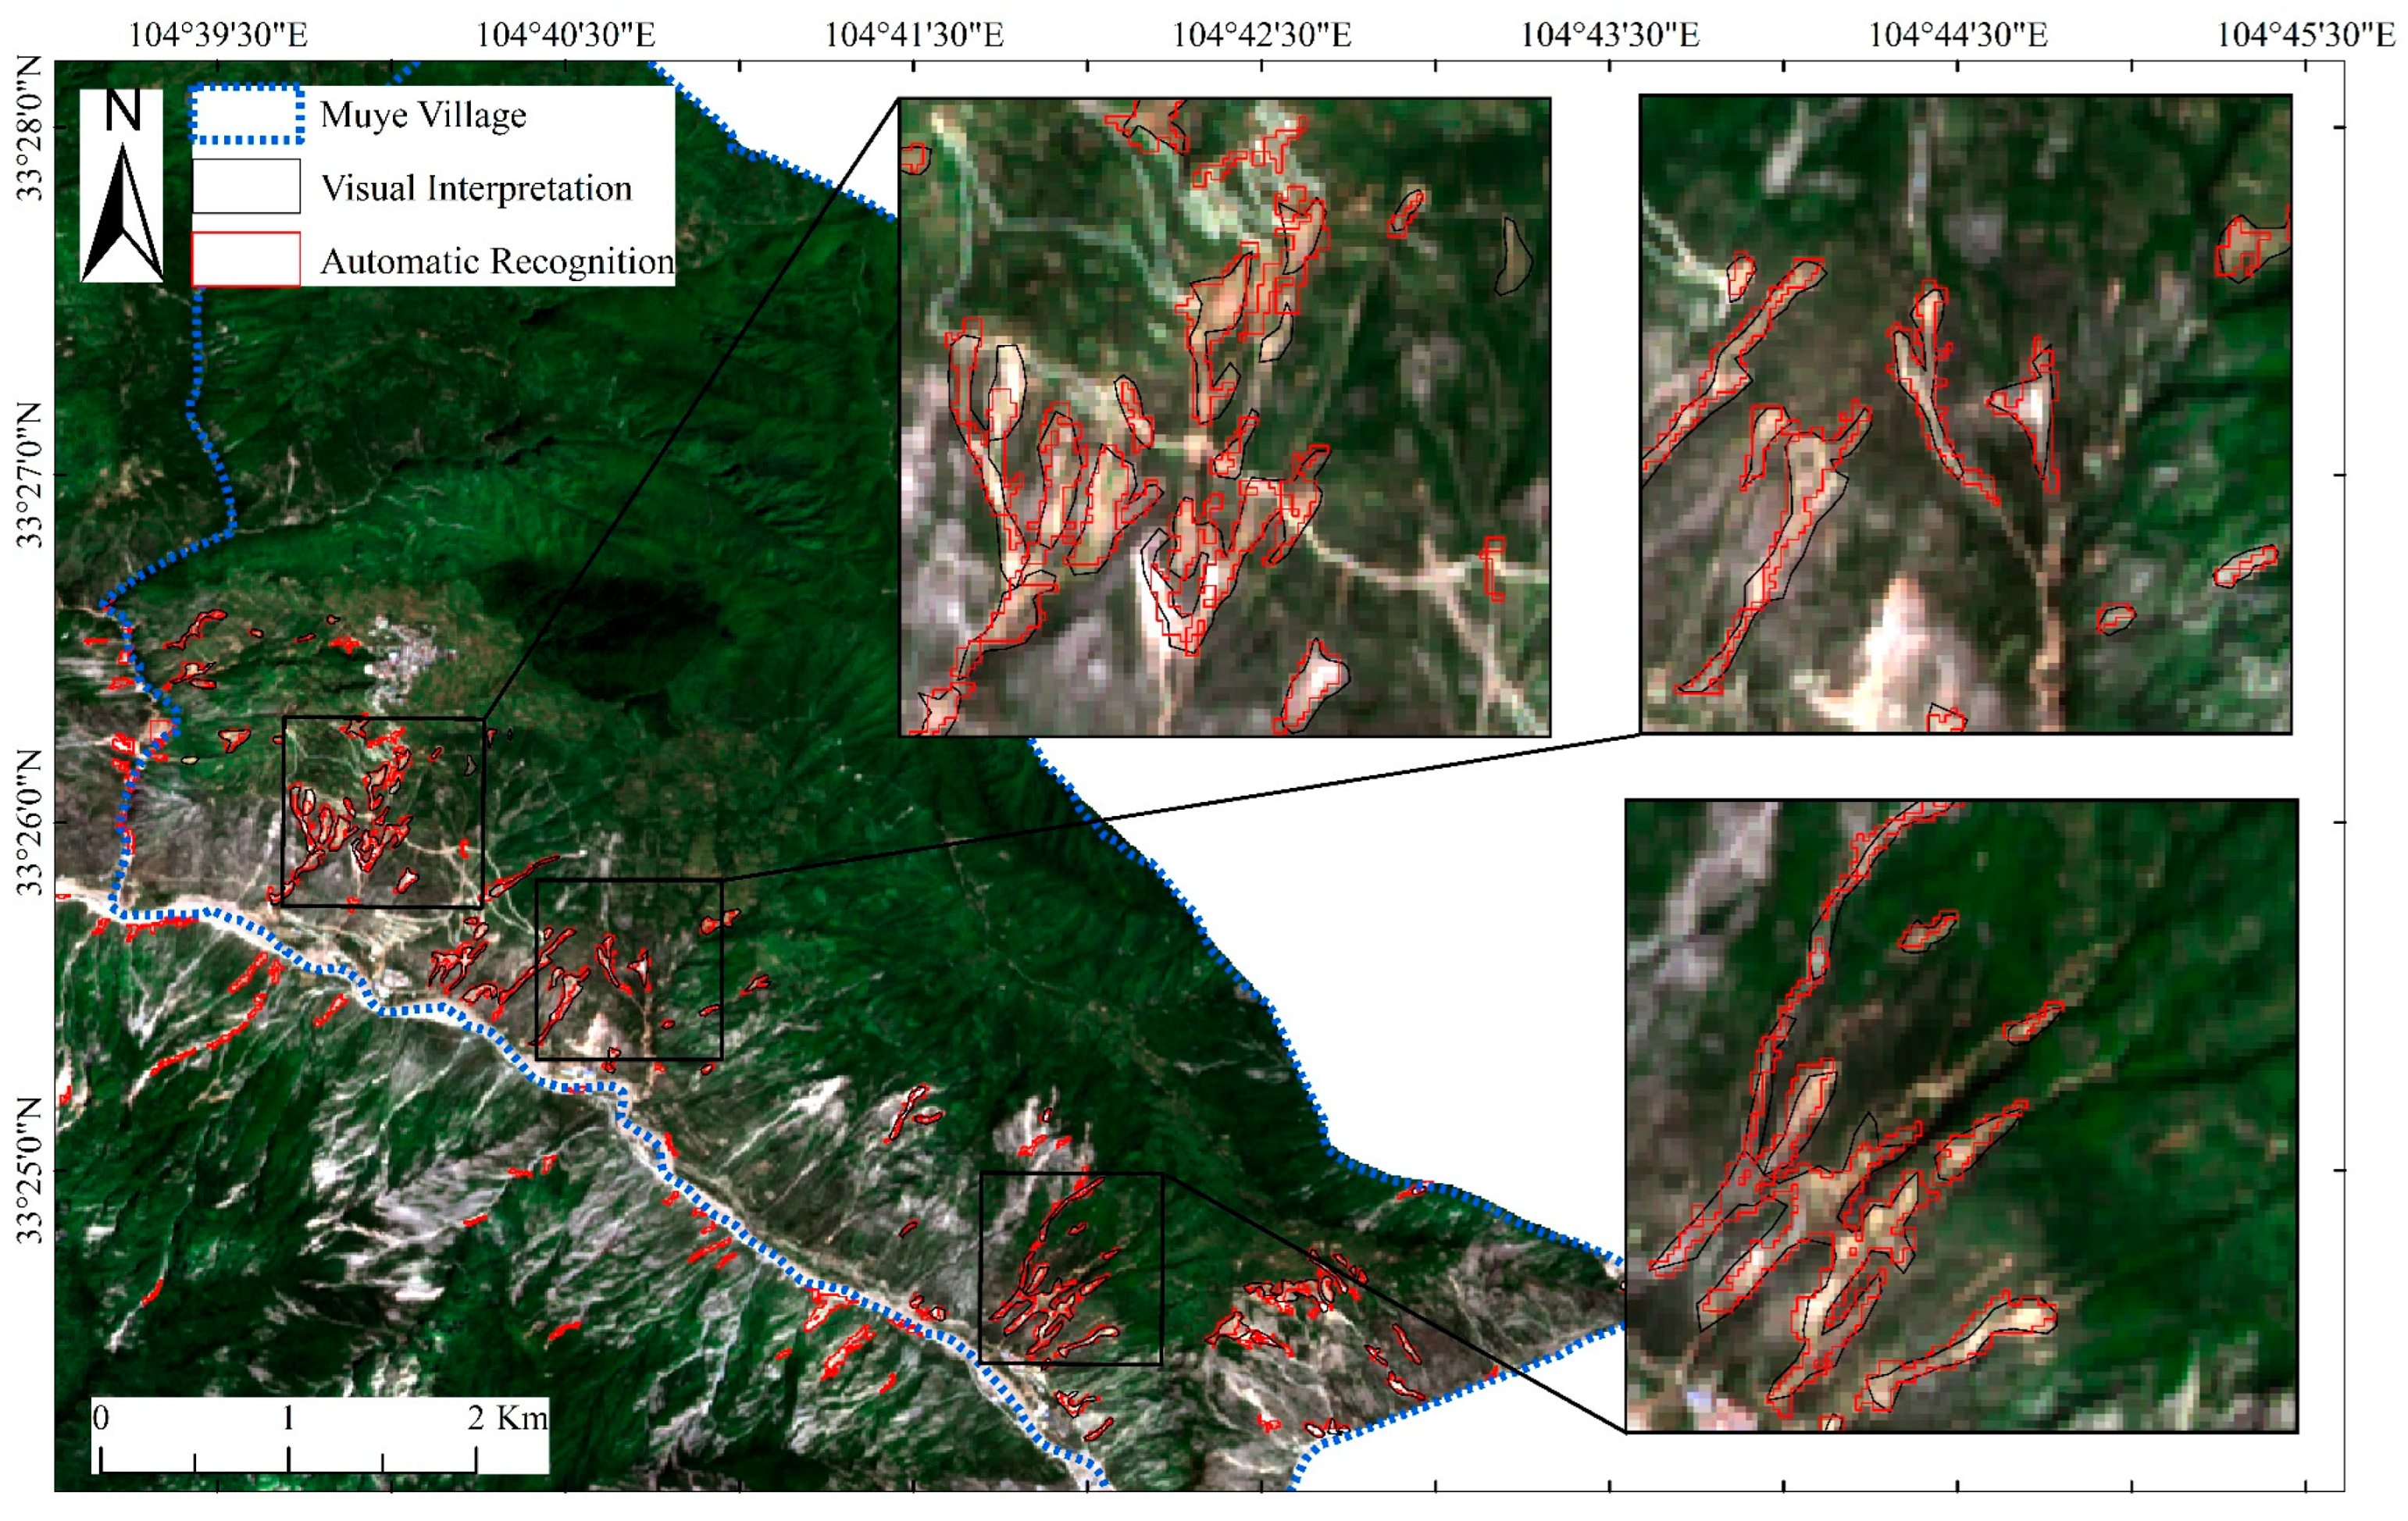
To evaluate the accuracy of landslide detection results, three geologists visually interpreted the landslides in the Muye Village area of Qugaona Township. A cross-validation approach was employed to assess the precision of the threshold-based automatic detection. Automatic detection results from the GEE platform were overlaid with manually interpreted landslides (Figure 4), followed by a quantitative comparison (Table 3).
A total of 79 landslides were identified through manual interpretation, while 93 were detected automatically. The total area detected by the threshold segmentation method accounted for 98.3% of the visually interpreted area, with 64.99% of the landslides exhibiting complete overlap. Only 1.26% of manually interpreted landslides were omitted by the automatic method. Nineteen false positives were identified, accounting for only 6.72% of the total visually interpreted area.
Using an 80% overlap threshold to define correct identification, the automatic detection method achieved an overall accuracy of 96.03%. The modest rate of complete matches is primarily attributed to the limited resolution of Sentinel-2 imagery and the inherent boundary inaccuracy of pixel-based detection methods, which reduces spatial agreement with manually interpreted outlines. Nevertheless, the method demonstrates high overall performance in detecting large-scale landslides, with almost no omissions, and misidentified areas constitute only a small proportion of the total. Therefore, the threshold segmentation-based detection results are adequate for subsequent analysis.

4.2. Post-Disaster Emergency Simulation

To convert remotely sensed landslide areas from 2D surface representations to 3D volumetric data, the SLBL plugin (pySLBL_v_2_1.tbx) in ArcGIS 10.8 was used to estimate landslide thickness. Field investigations in the upper Bailong River Basin indicated that shallow landslides generally exhibit thicknesses below 1 m. Accordingly, the maximum thickness parameter was set to 1 m in the SLBL estimation. The estimated landslide thickness distribution is shown in Figure 3a.
Landslide runout simulation in R.avaflow requires the specification of key input parameters. This study employed a back-analysis approach to calibrate parameter values. A series of cross-combination simulations (Figure 5) were performed to evaluate the sensitivity of model outputs to various parameters, including landslide density, the internal friction angle, the entrainment coefficient, and the basal friction angle. Specifically, landslide density was varied from 1700 to 2700 kg/m3, the internal friction angle from 30° to 40°, the basal friction angle from 8° to 18°, and the entrainment coefficient from 10−6 to 10−8.
Overall, the entrainment coefficient had a dominant influence on flow depth and velocity, while the basal friction angle showed an inverse relationship with velocity and a nonlinear effect on depth, with flow depth peaking at intermediate friction angles. Based on sensitivity analysis and spatial match, the simulation results revealed distinct sensitivities across different parameter combinations. The model exhibited high sensitivity to the basal friction angle but was relatively insensitive to variations in landslide density. Flow velocity decreased with an increasing basal friction angle, and the maximum flow depth was observed when the basal friction angle was set to 13°. When varying the density and internal friction angle simultaneously, the model demonstrated low sensitivity to both parameters.
In tests varying both internal and basal friction angles, the model again showed greater sensitivity to the basal friction angle. Flow velocity decreased with an increasing basal friction angle, and the maximum flow depth occurred when the basal friction angle was 10.5° and the internal friction angle was 40°. The internal friction angle had a limited influence on the simulation outputs. When analyzing density and entrainment coefficient interactions, the model was more sensitive to the entrainment coefficient. Larger entrainment coefficients resulted in greater flow depths and faster velocities, whereas density variations had negligible effects.
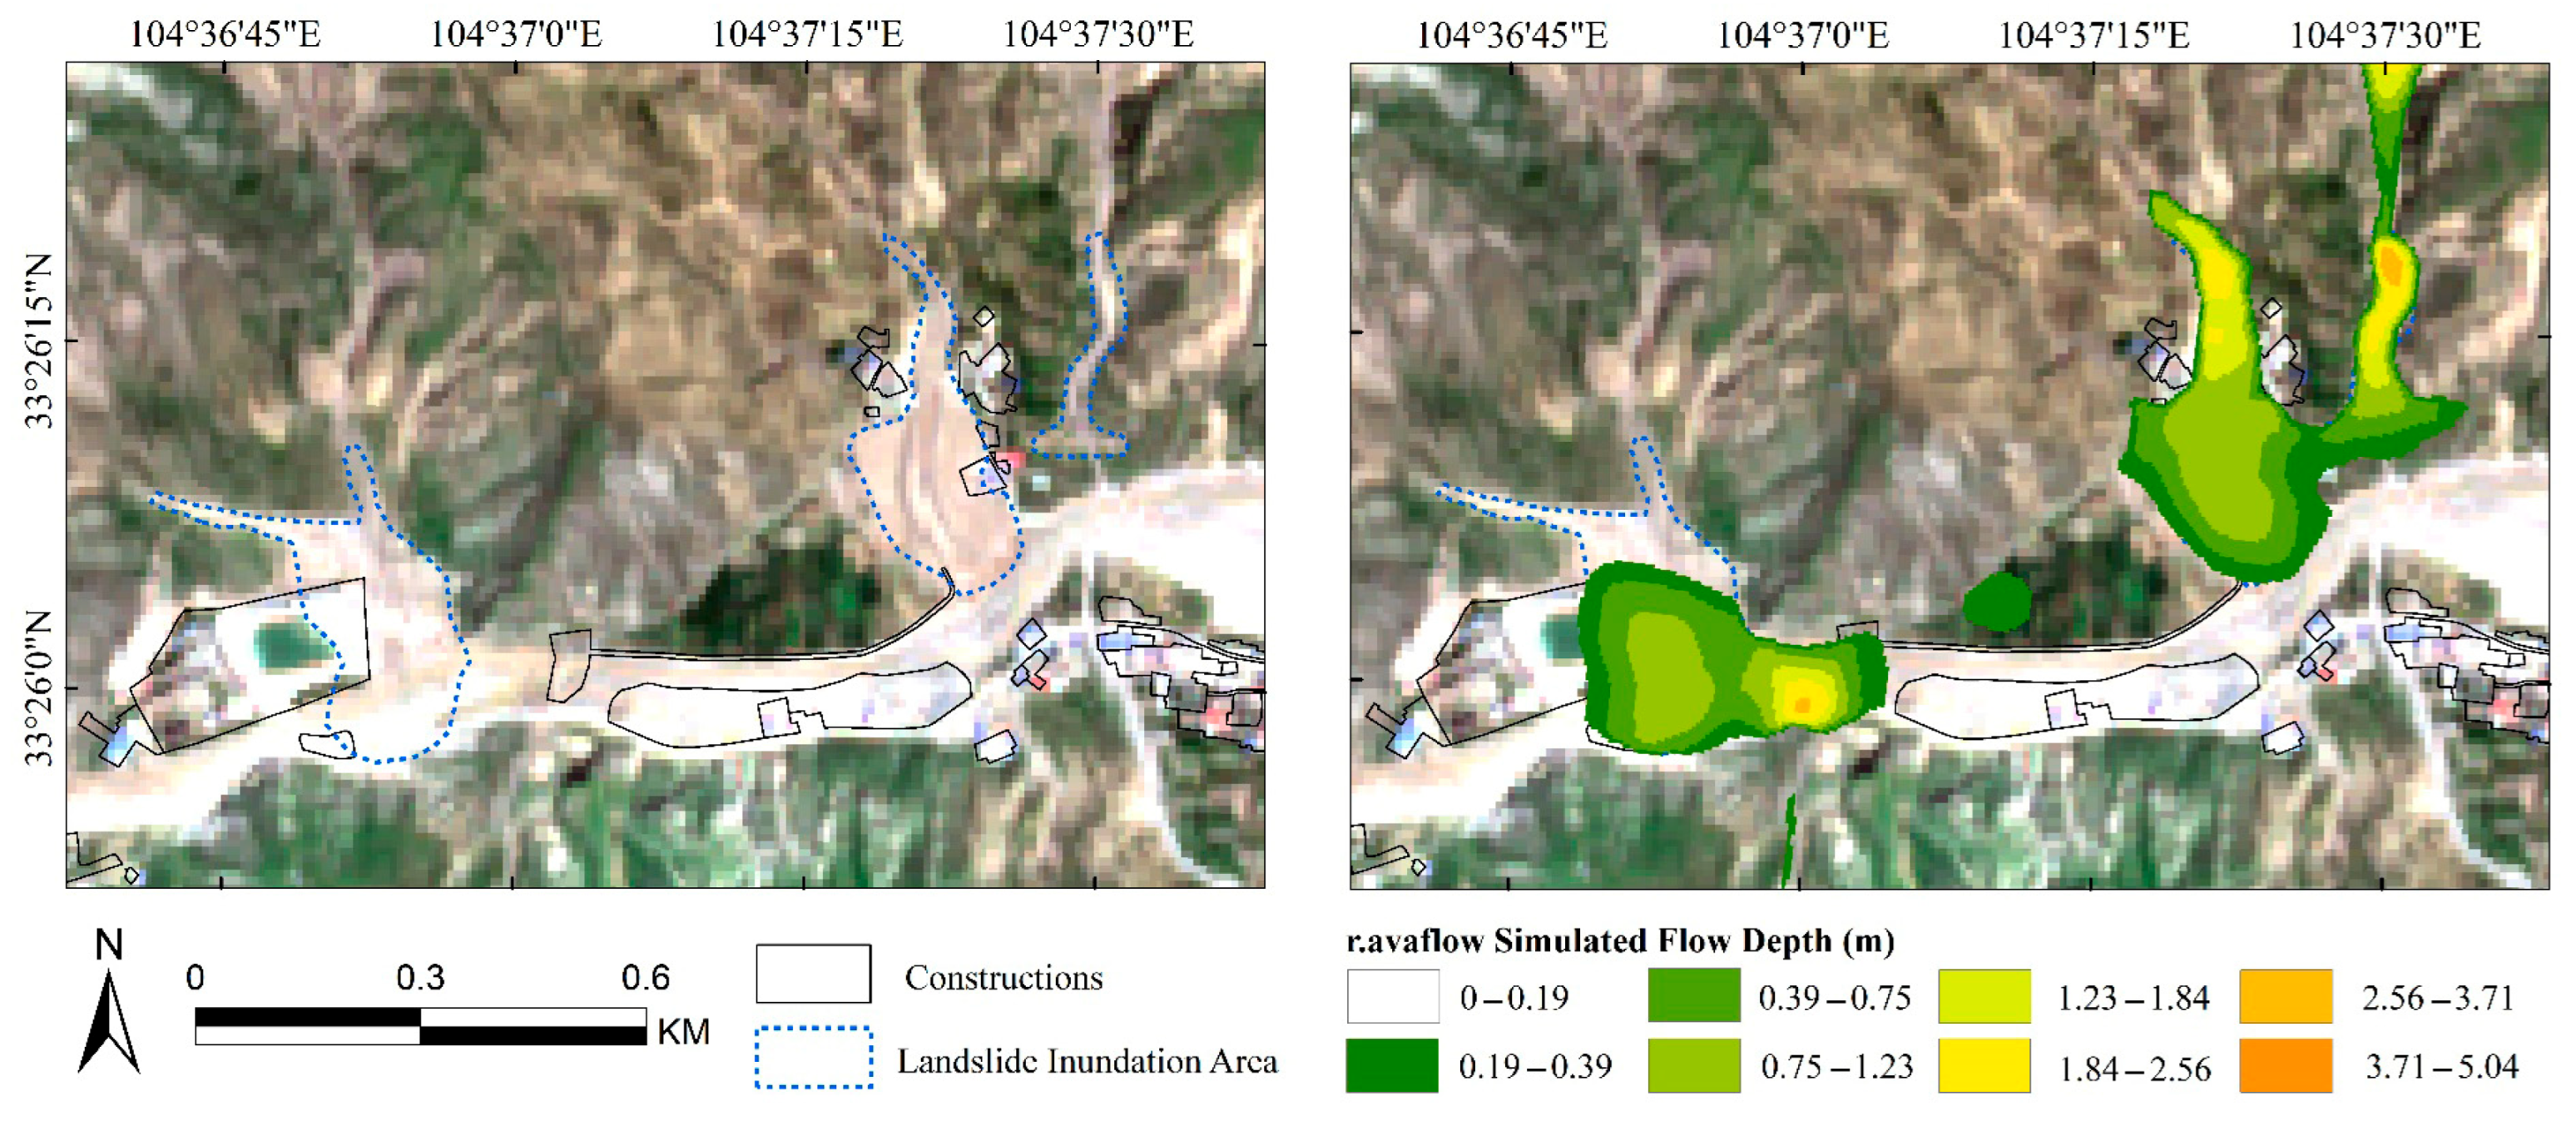
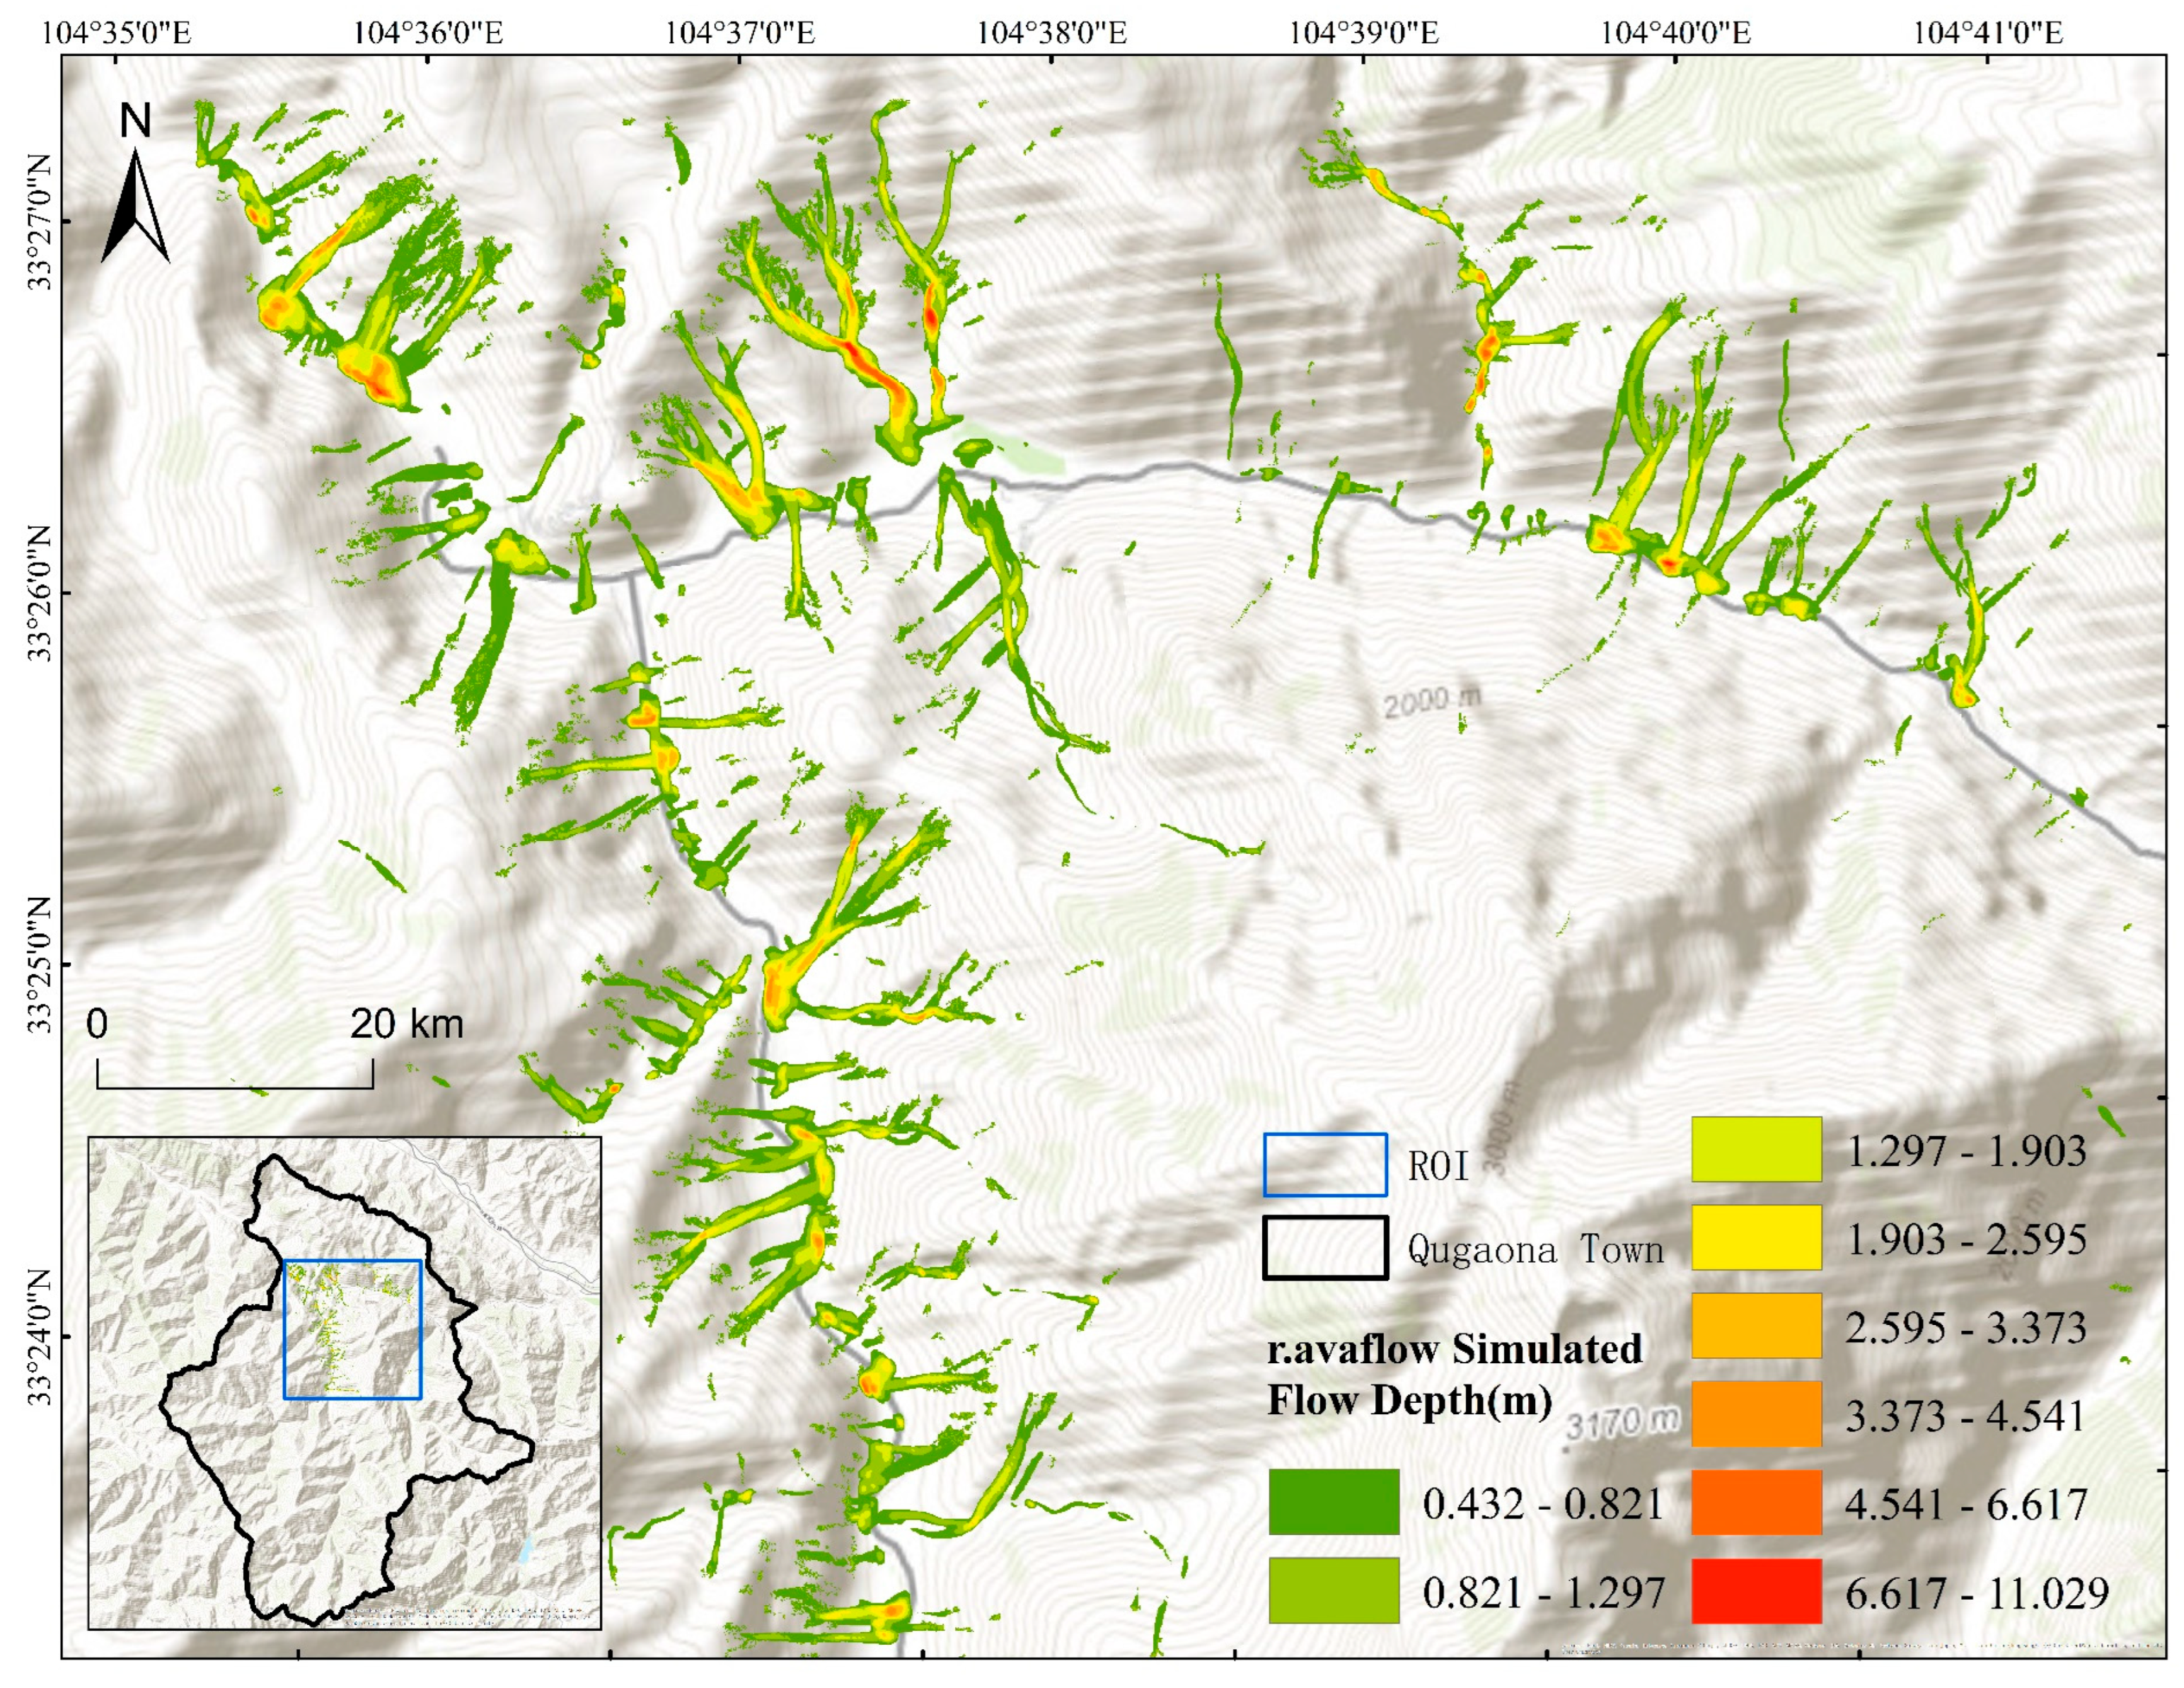
Overall, the entrainment coefficient had a dominant influence on flow depth and velocity, while the basal friction angle showed an inverse relationship with velocity and a nonlinear effect on depth, with flow depth peaking at intermediate friction angles. Based on sensitivity analysis and spatial matching between simulations and actual disaster extent, the optimal parameter set was identified (Table 4). This configuration yielded the highest spatial overlap with observed inundation extent (Figure 6). The densely populated area of Qugaona Township was selected as the Region of Interest (ROI) for simulation, and the results are shown in Figure 7. Despite potential discrepancies between the DEM acquisition time and actual terrain conditions in 2020, the selected parameter set is deemed representative of real-world conditions.

4.3. Landslide Susceptibility Assessment Results

4.3.1. Multicollinearity Analysis of Environmental Factors

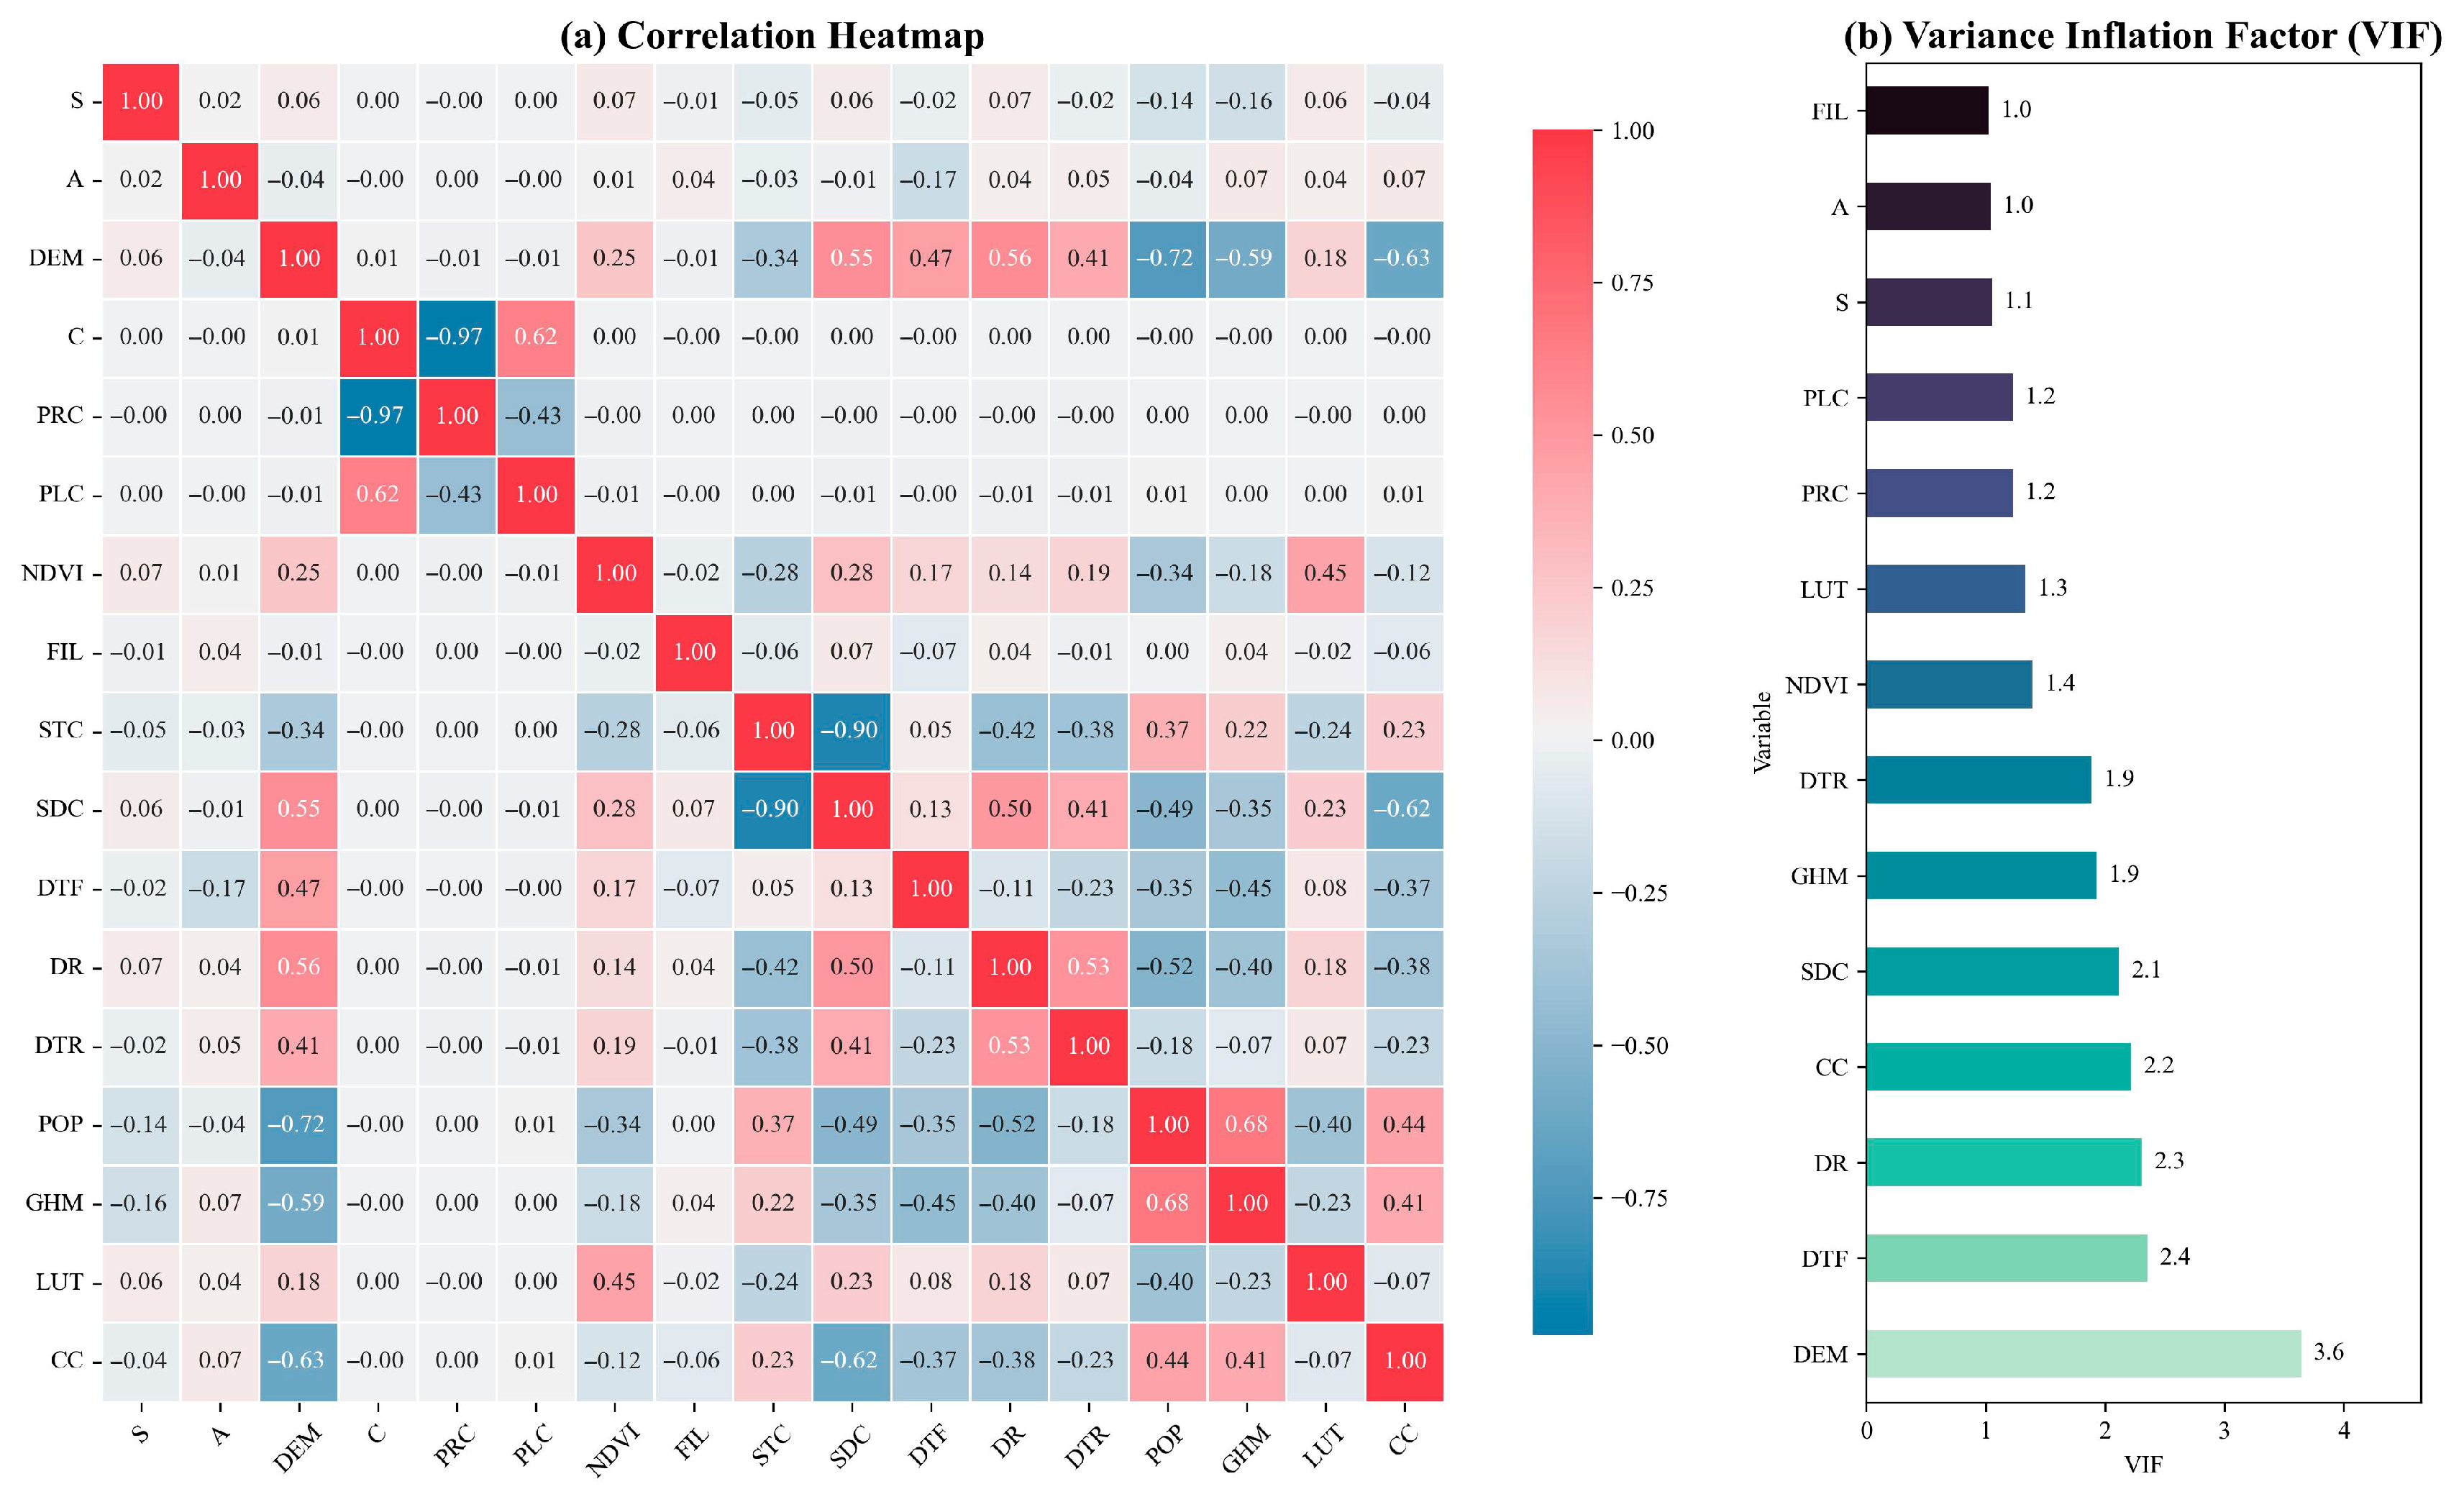
To mitigate the adverse effects of multicollinearity on model performance, a two-step screening process was employed. Initially, Pearson correlation analysis was conducted to identify pairs of variables exhibiting strong linear relationships. As illustrated in Figure 8a, variables with a Pearson correlation coefficient greater than 0.7 were considered highly correlated [65]. Specifically, strong correlations were observed between SDC and STC (0.90), POP and DEM (0.72), as well as C and PRC (0.97). In order to reduce redundancy and enhance model generalizability, STC, POP, and C were excluded from subsequent modeling.
Following this step, the Variance Inflation Factor (VIF) was calculated for the remaining variables to assess potential multicollinearity. As shown in Figure 8b, all retained variables exhibited VIF values below 5, a commonly accepted threshold for multicollinearity diagnostics. This indicates that the remaining 14 variables do not present severe collinearity issues and are suitable for model training and prediction.

4.3.2. Model Evaluation and Optimization

Qugaona Township was discretized into 4,570,890 grid cells at a 10 × 10 m resolution, of which 50,408 were associated with landslides and 4,520,482 with non-landslide areas. To ensure spatial independence between training and testing samples and to reduce overestimation caused by spatial autocorrelation, this study adopted a spatial five-fold cross-validation approach. The centroid coordinates of each grid cell were extracted from the shapefile geometry, and the entire study area was clustered into five spatially distinct regions using the MiniBatchKMeans algorithm.
In each fold, one spatial cluster was used as the testing set while the remaining four served as the training set, allowing for an objective assessment of model generalizability across different locations. Prior to model training, the dataset was balanced by randomly downsampling non-landslide samples to match the number of landslide samples, and 15 selected environmental factors were used as input features. Model performance was evaluated using ACC, with the results presented in Figure 9a.
The ACC metric was used to evaluate the overall classification performance of each model and served as a key indicator for model selection. As shown in Figure 9a, most models achieved an ACC exceeding 0.8. The Gradient Boosting classifier yielded the highest ACC (0.870), followed by LightGBM (0.857) and Logistic Regression (0.848), indicating their robust classification capabilities. To further assess model performance, the mean ROC curves from five-fold spatial cross-validation were plotted (Figure 9b). The Gradient Boosting model again demonstrated superior performance with the highest AUC (0.881), slightly outperforming LightGBM (0.873), Extra Trees (0.872), and Random Forest (0.872). These results indicate that ensemble learning models generally provide better discrimination between landslide and non-landslide areas.
Given its consistent top performance in both ACC and AUC, the Gradient Boosting model was selected for landslide susceptibility mapping. The resulting susceptibility index was classified into five levels—very high, high, moderate, low, and very low—using the Natural Breaks (Jenks) classification method (Figure 10).

4.4. Delineation of Impact Areas and Identification of Hazardous Slopes

4.4.1. Delineation of Impact Areas

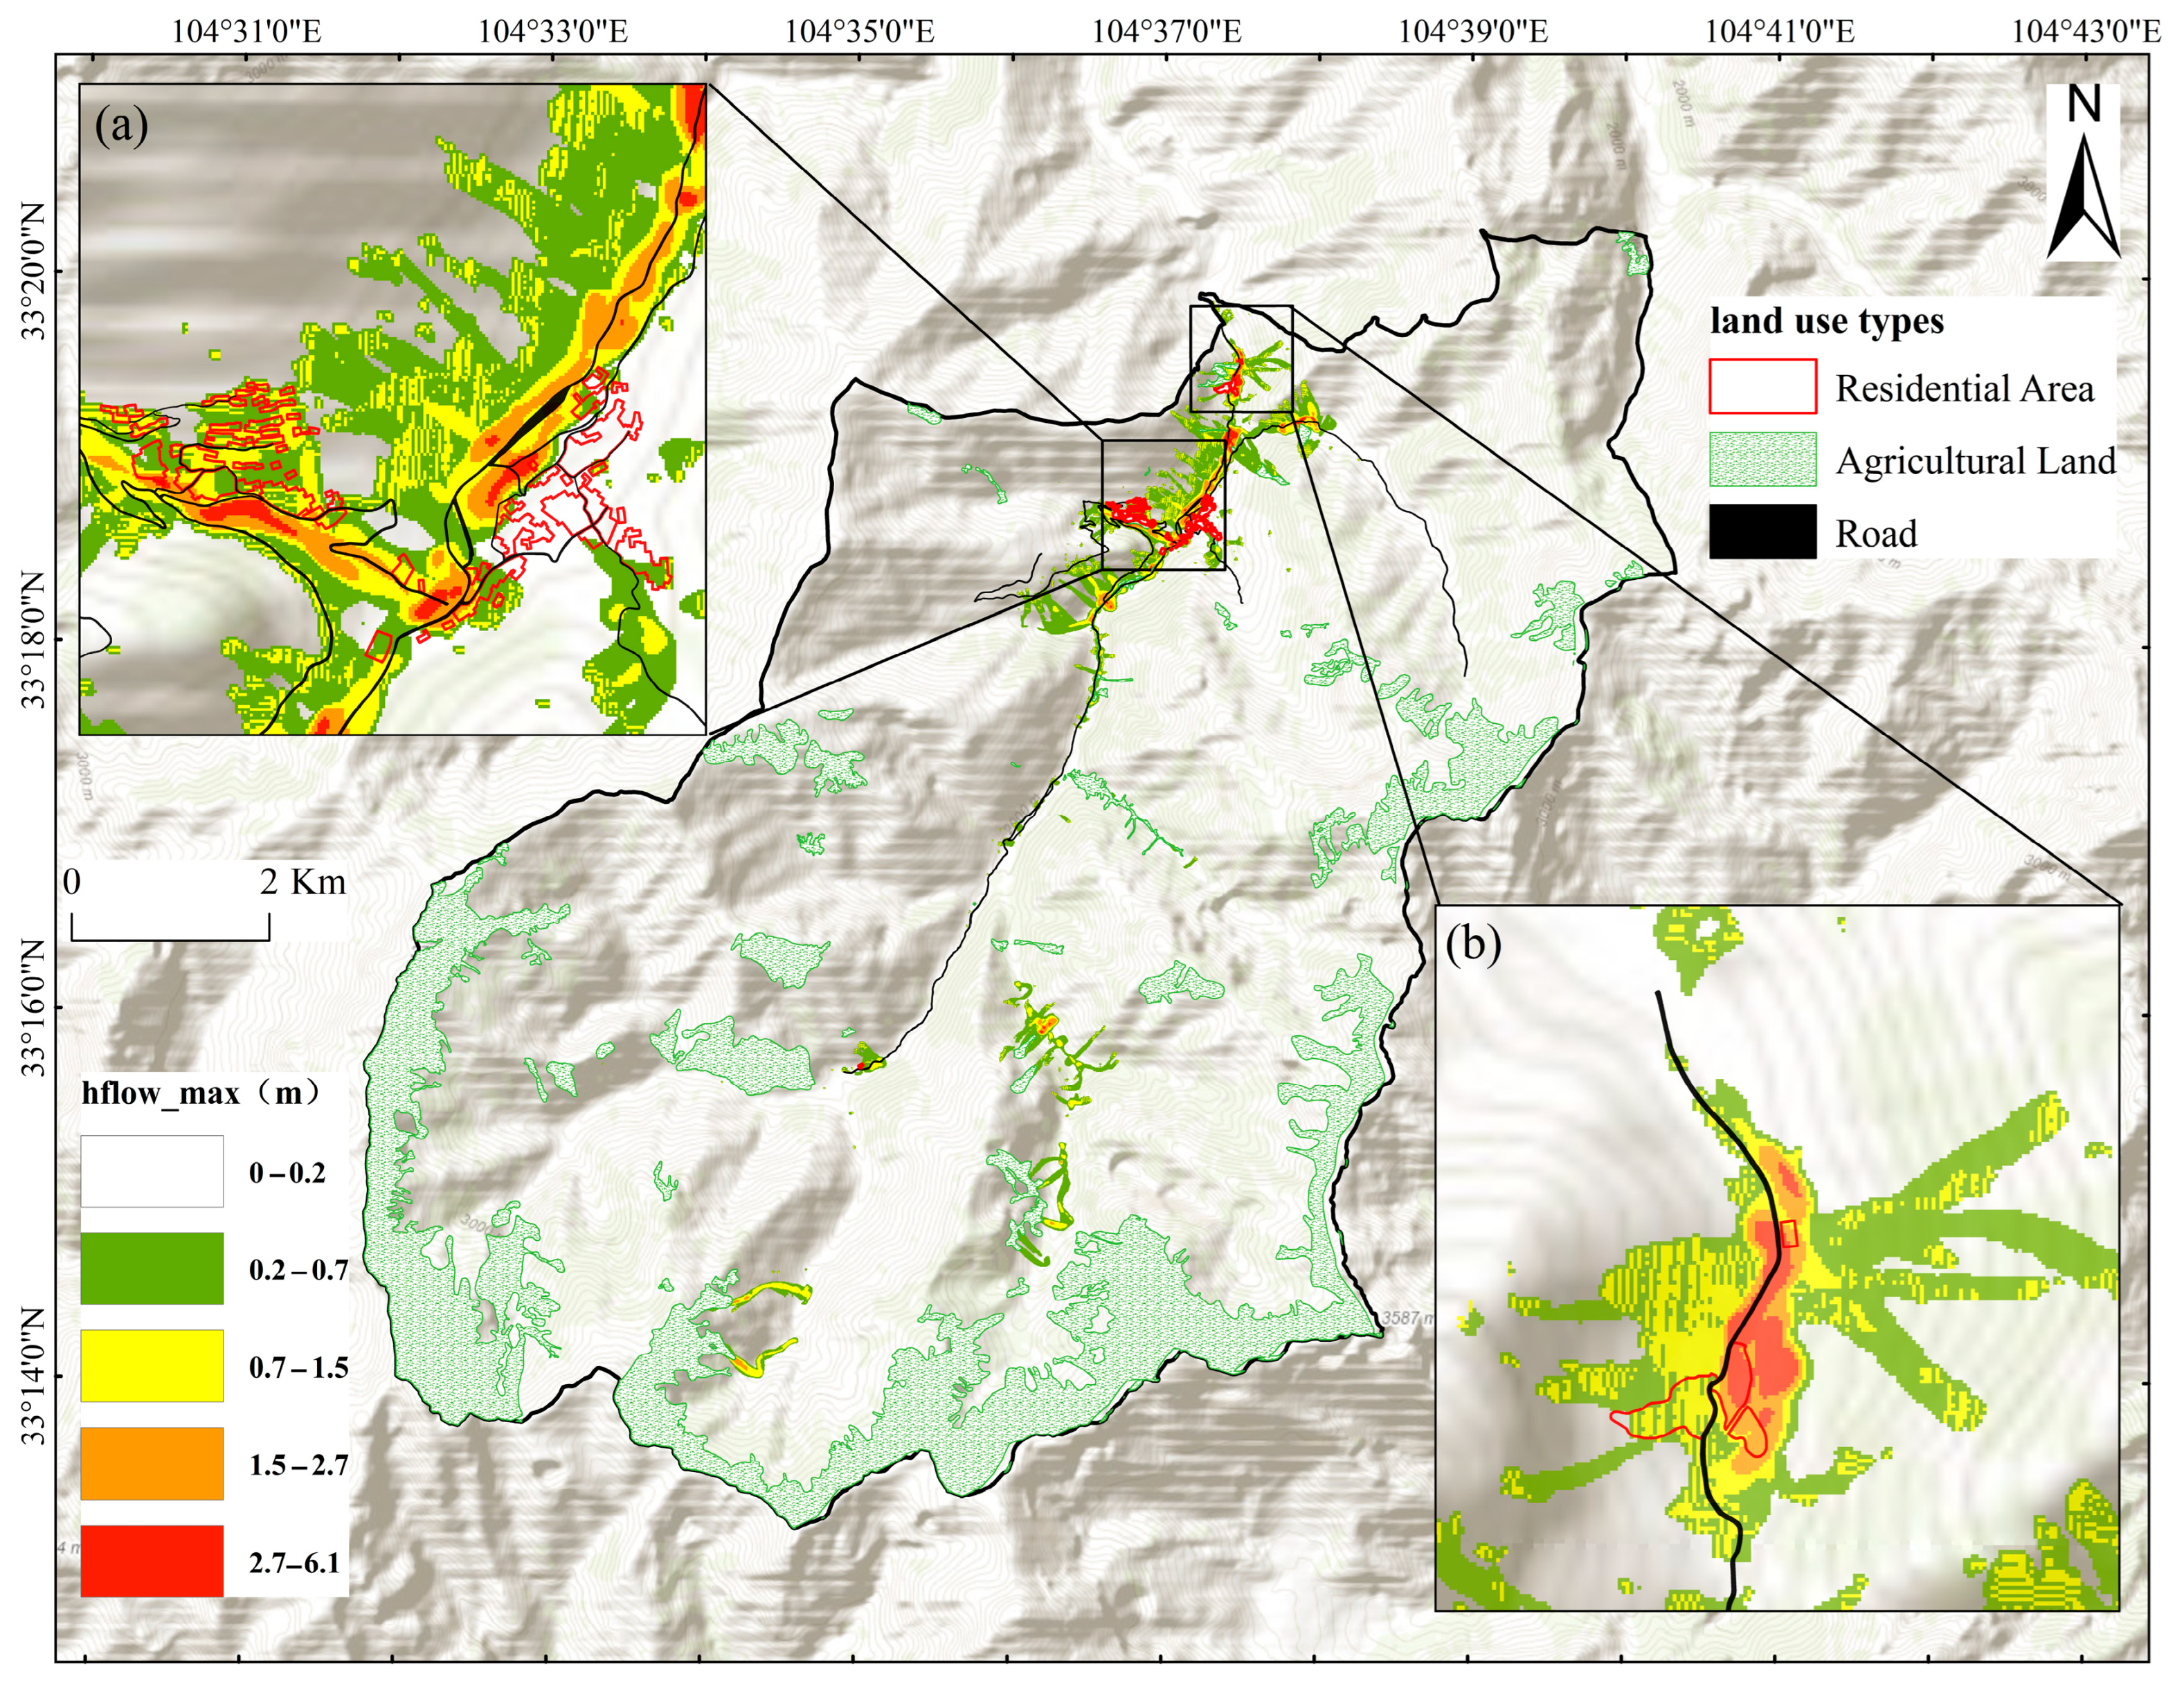
Landslide-induced environmental damage generally manifests in two forms: (1) accumulation damage, in which post-movement deposits affect the environment, and (2) impact damage, where the sliding mass’s kinetic energy directly strikes infrastructure or terrain. This study integrates and simplifies both damage mechanisms by employing the maximum flow depth (hflow_max) derived from the R.avaflow model as a reference for hazard assessment. The hflow_max represents the peak flow depth recorded per grid cell during simulation, indicating both final deposition zones and high-impact segments along the landslide path.
Using Cangan Village in Qugaona Township as a case study, the areas previously classified as very high susceptibility were used for landslide thickness estimation via the SLBL model. Based on the simulation parameters listed in Table 4, landslide impact areas were simulated in R.avaflow, with the results presented in Figure 11.

4.4.2. Identification of Hazardous Slopes

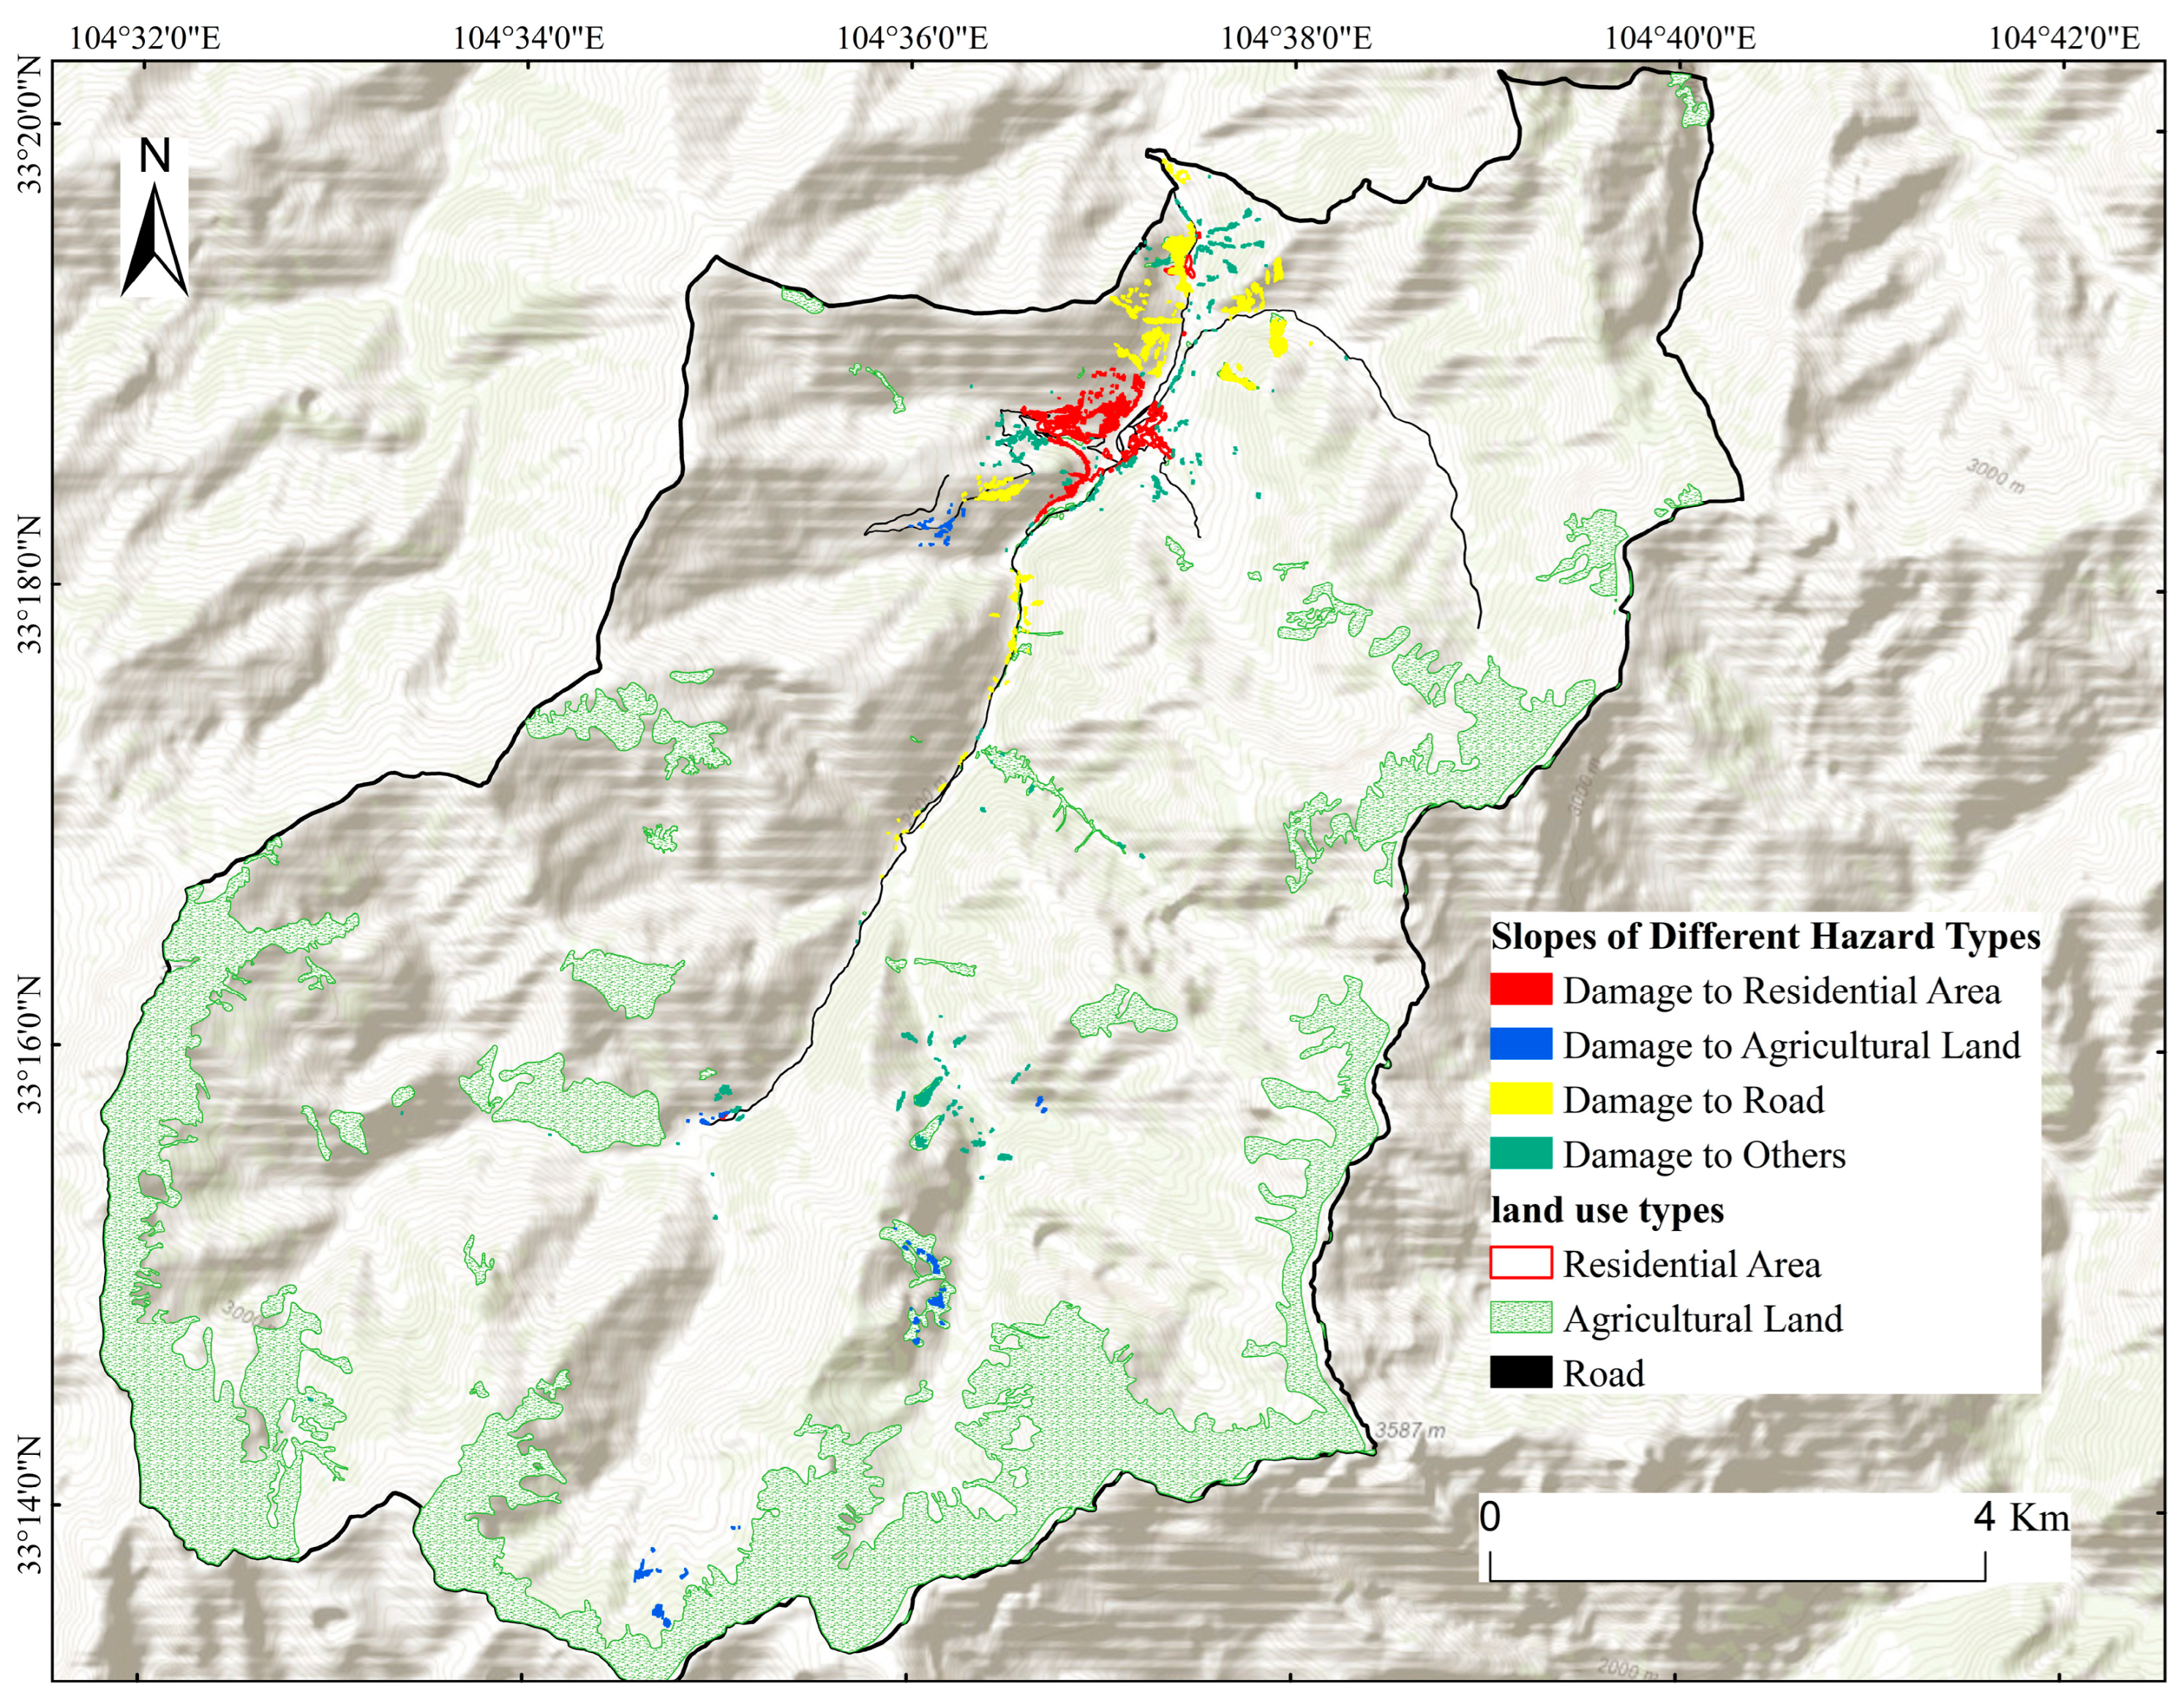
For streamlined statistical analysis, exposed elements were categorized into three classes: residential area, road, and agricultural land. These were then overlaid with the simulated landslide impact zones to identify slope units corresponding to different hazard types in Cangan Village (Figure 12).
Analysis revealed that 28.65% of the highly susceptible slopes in Cangan Village do not pose immediate disaster risks. The remaining slopes were associated with potential impacts on residential area (31.08%), road (22.42%), and agricultural land (17.85%). This study recommends implementing mitigation strategies for these high-risk slopes, including engineering reinforcement or diversion channel design for vulnerable buildings, roads, and other infrastructure within potentially affected zones.
Although 28.65% of the highly susceptible slopes in Cangan Village currently show no spatial overlap between their potential runout paths and critical infrastructure such as residential areas, major roads, or farmland, their latent disaster risks should not be underestimated. These slopes are primarily located in forested or sparsely inhabited mountainous areas, where direct impacts are unlikely in the short term. However, due to their inherent geomorphic instability, they may evolve into source zones for debris flows or trigger secondary hazards downstream under future extreme weather conditions such as intense rainfall or flooding. Therefore, while not prioritized for immediate mitigation, these slopes should be integrated into regional hazard chain analyses and long-term disaster preparedness strategies.

5. Discussion

5.1. An Integrated Approach to Risk Management of Rainfall-Induced Landslides

This study proposes a modular and operational framework for landslide risk management under extreme rainfall conditions, integrating rapid detection (GEE), landslide thickness estimation (SLBL), susceptibility modeling (machine learning), and dynamic propagation simulation (R.avaflow). The framework spans both short-term emergency response and long-term hazard mitigation.
In emergency contexts, the time-series analysis using Sentinel-2 imagery on the GEE platform enables efficient landslide identification with 96.03% detection accuracy. Although spatial resolution limits the precision of boundaries (with a complete match rate of 64.99%), it remains adequate for rapid decision-making. Combined with SLBL-based thickness estimation and R.avaflow simulation, this approach enables the timely assessment of affected areas and facilitates response coordination. For long-term planning, the use of high-resolution (10 m) raster-based evaluation units improves the spatial resolution of susceptibility mapping and avoids dilution effects present in coarser zoning. In contrast to traditional susceptibility maps, the integration of dynamic simulation allows the delineation of potential impact areas and depositional patterns. Additionally, tracing slope movement paths supports the classification of risky hillslope types, which informs targeted mitigation strategies. The modular framework allows each component—detection, simulation, and risk assessment—to be independently replaced or updated, ensuring adaptability in varying geoclimatic contexts.
Future enhancements may include the integration of Sentinel-1 radar imagery to improve landslide detection. Rainfall events are often accompanied by significant cloud cover that can severely affect the efficacy of Sentinel-2 optical imagery. In contrast, Sentinel-1 Synthetic Aperture Radar (SAR) imagery is unaffected by light and weather conditions. By utilizing Sentinel-1 SAR technology, cloud cover-related detection issues can be effectively avoided, especially during and after rainfall events, providing an essential supplement for landslide detection. Several studies have used Sentinel-1 data for landslide identification [66,67] or have combined Sentinel-1 and Sentinel-2 data for integrated assessments [68,69]. However, few studies have applied Sentinel-1 to the detection of rainfall-induced shallow landslides. This aspect could be a focus of future research.
Although this study focuses on Qugaona Township in Zhouqu County, the proposed modular framework exhibits strong transferability. The landslide detection module on the GEE platform can be retrained to accommodate local terrain and vegetation characteristics using regional Sentinel or commercial satellite imagery. The SLBL-based landslide thickness estimation model can be constrained using region-specific statistical thickness data. The R.avaflow dynamic simulation component can be recalibrated with local DEM and rheological parameters. Likewise, the susceptibility assessment model based on machine learning can be reconstructed or fine-tuned through transfer learning using landslide inventories from other regions. Owing to this high degree of flexibility, the framework is not only applicable to landslide and debris flow hazards in subtropical monsoon and alpine canyon regions, but it also holds promise for extension to other types of geohazards such as plateau ice avalanches and coseismic landslides.

5.2. Insights from Parameter Sensitivity in Numerical Simulation

The sensitivity analysis of R.avaflow parameters indicates that basal friction significantly affects debris flow dynamics. With increasing basal friction, maximum flow velocity decreases consistently due to enhanced resistance, while maximum flow depth shows a nonlinear response: It first increases and then decreases, peaking at a friction angle around 13°. This behavior reflects the balance between flow mobility and material accumulation. Low friction allows rapid movement with minimal deposition, whereas moderate friction induces temporary backflow and thickening. Excessive friction, however, leads to flow dissipation and reduced depth due to loss of driving energy.
This pattern provides valuable implications for the design of debris flow drainage channels. Under conditions with lower basal friction, the flow passes through swiftly and maintains a stable depth, suggesting that smooth materials such as concrete should be used to improve discharge efficiency. In contrast, under high-friction conditions prone to sediment accumulation, a regular sediment removal mechanism is necessary to prevent sudden increases in flow depth that could lead to overflow hazards. Therefore, it is advisable to maintain the basal friction angle within a safe and controllable range.

5.3. Insights from Feature Importance Analysis of the Susceptibility Evaluation Model

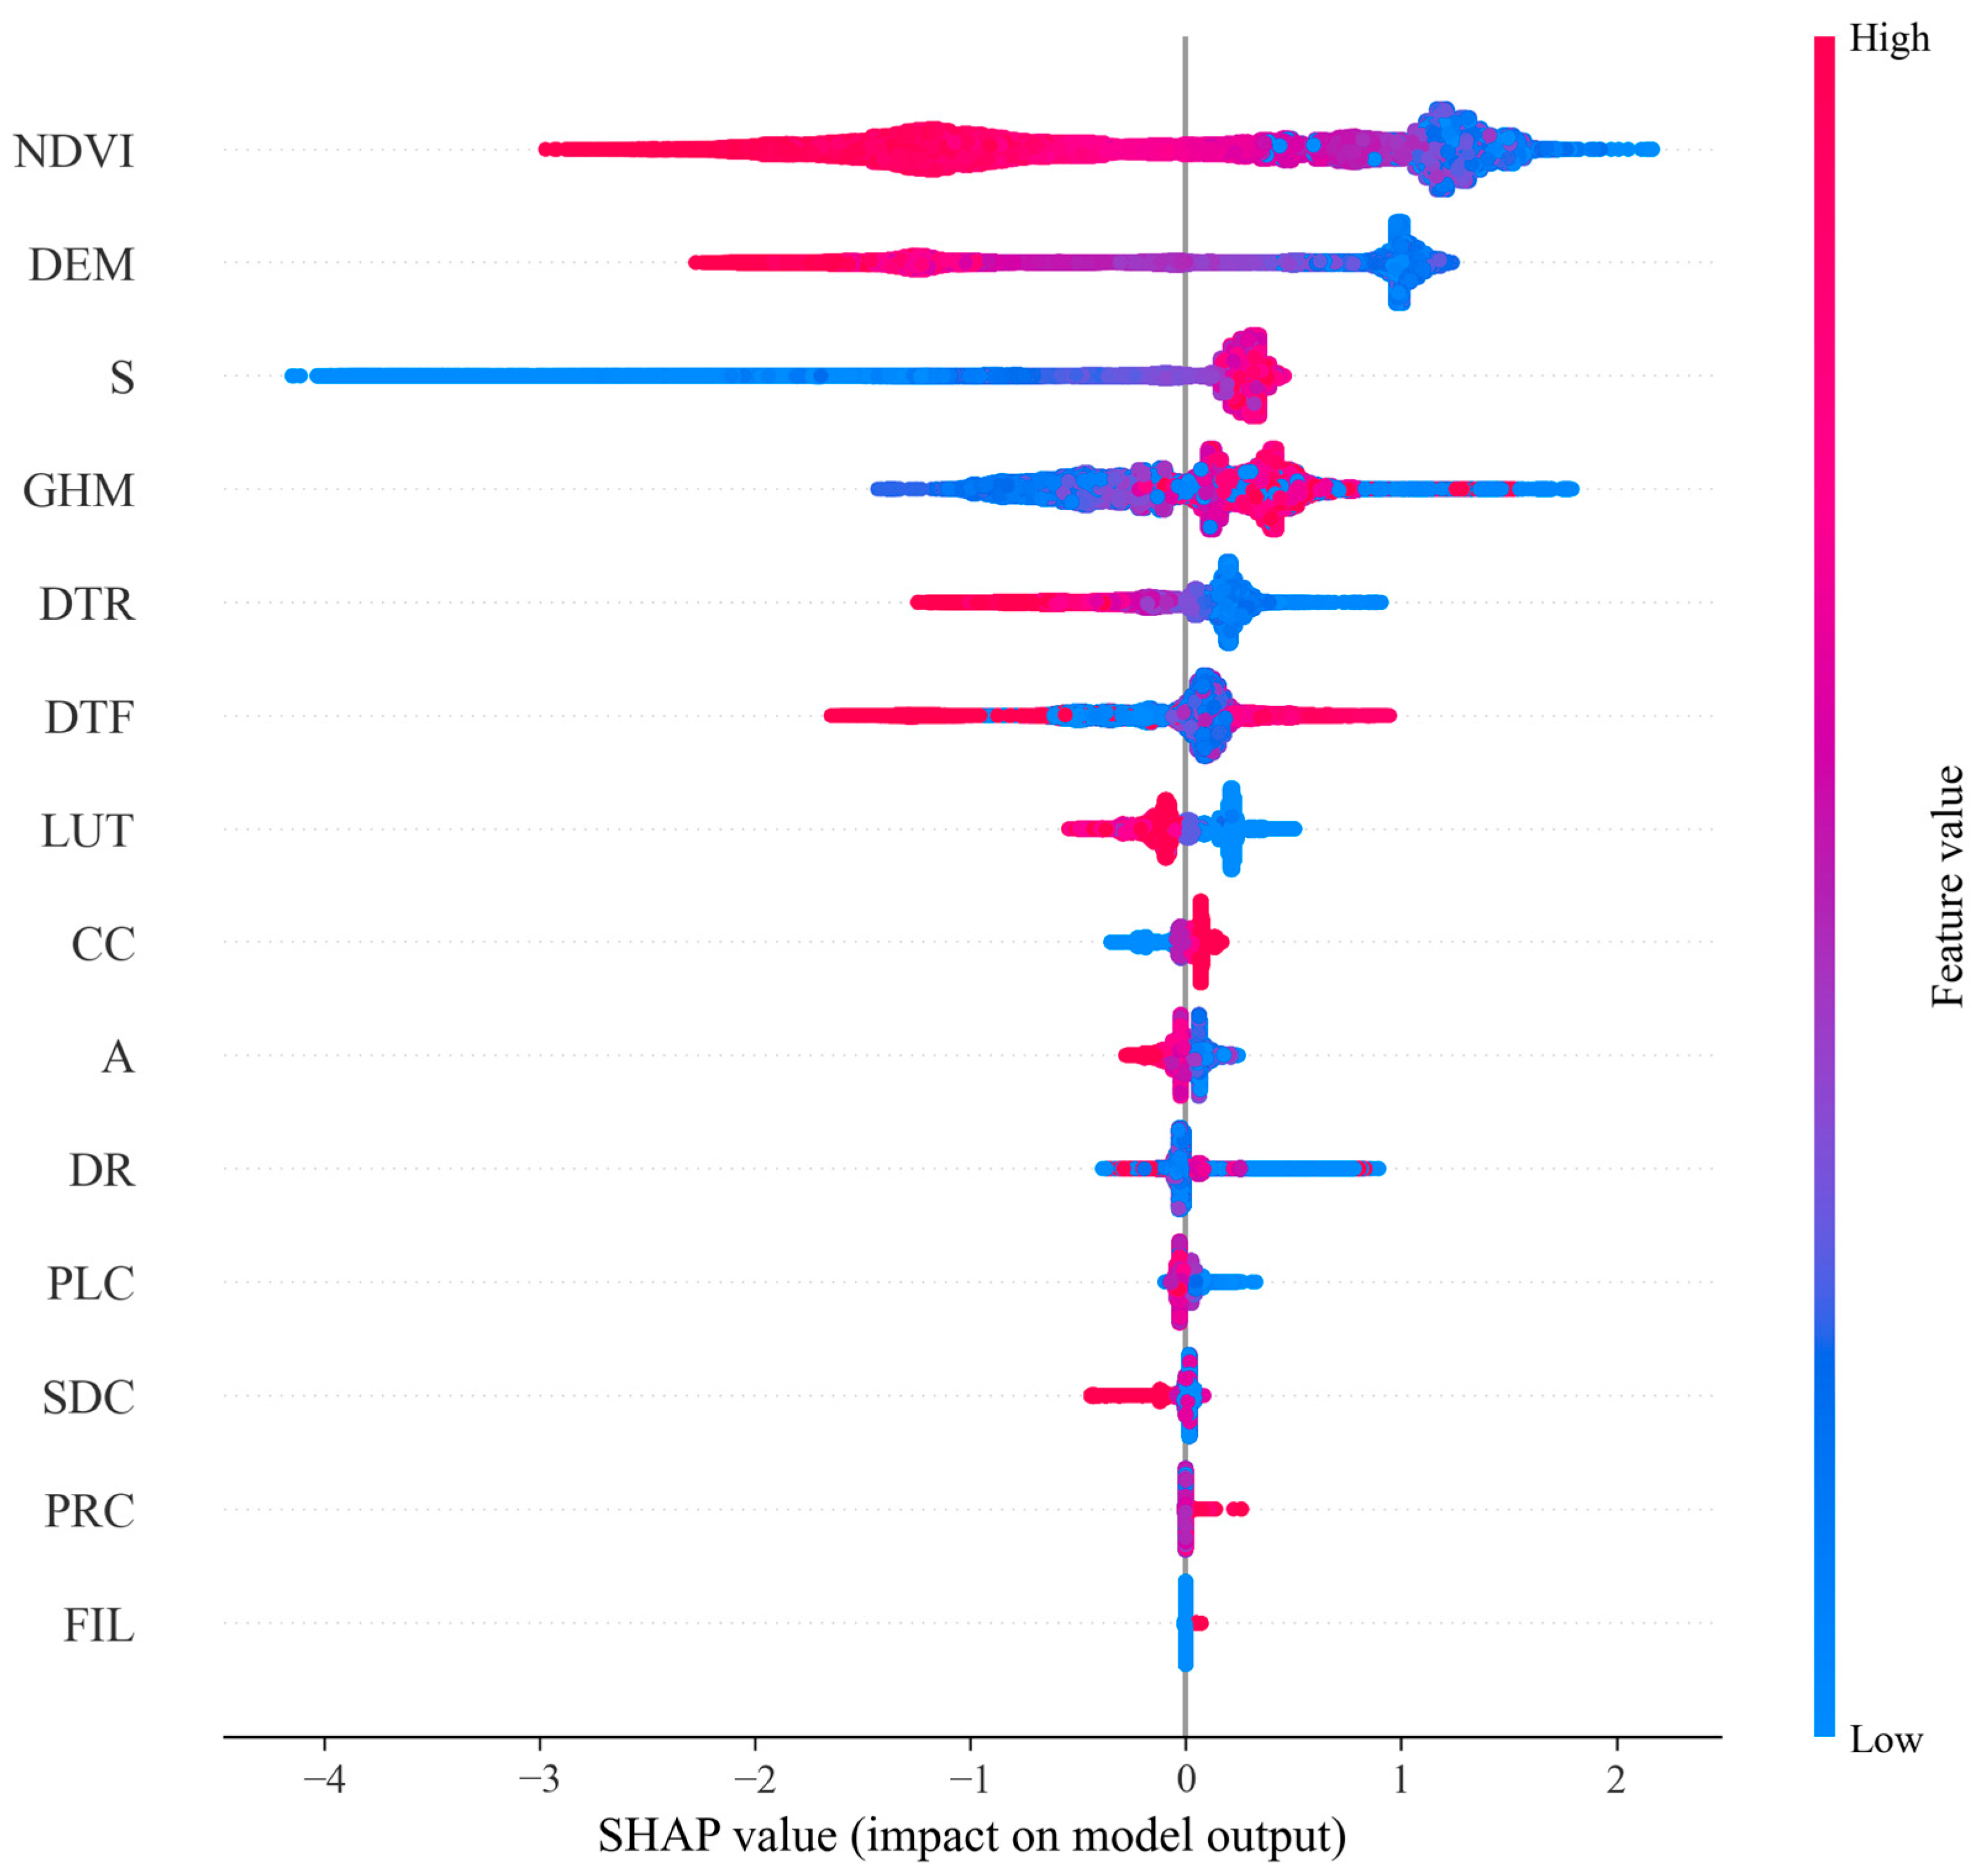
The feature importance and underlying mechanisms of the landslide susceptibility model were systematically analyzed using the SHAP (Shapley Additive exPlanations) method. The SHAP summary plot (Figure 13) provides a global overview of the feature importance ranking and the directionality of their impact on model output. Notably, NDVI, DEM, slope (S), and anthropogenic and geological variables (e.g., GHM, DTR, DTF) exhibit the most prominent influences. The color gradients in the beeswarm plot indicate how different value ranges of each feature affect susceptibility, revealing clear nonlinear and threshold-based relationships.
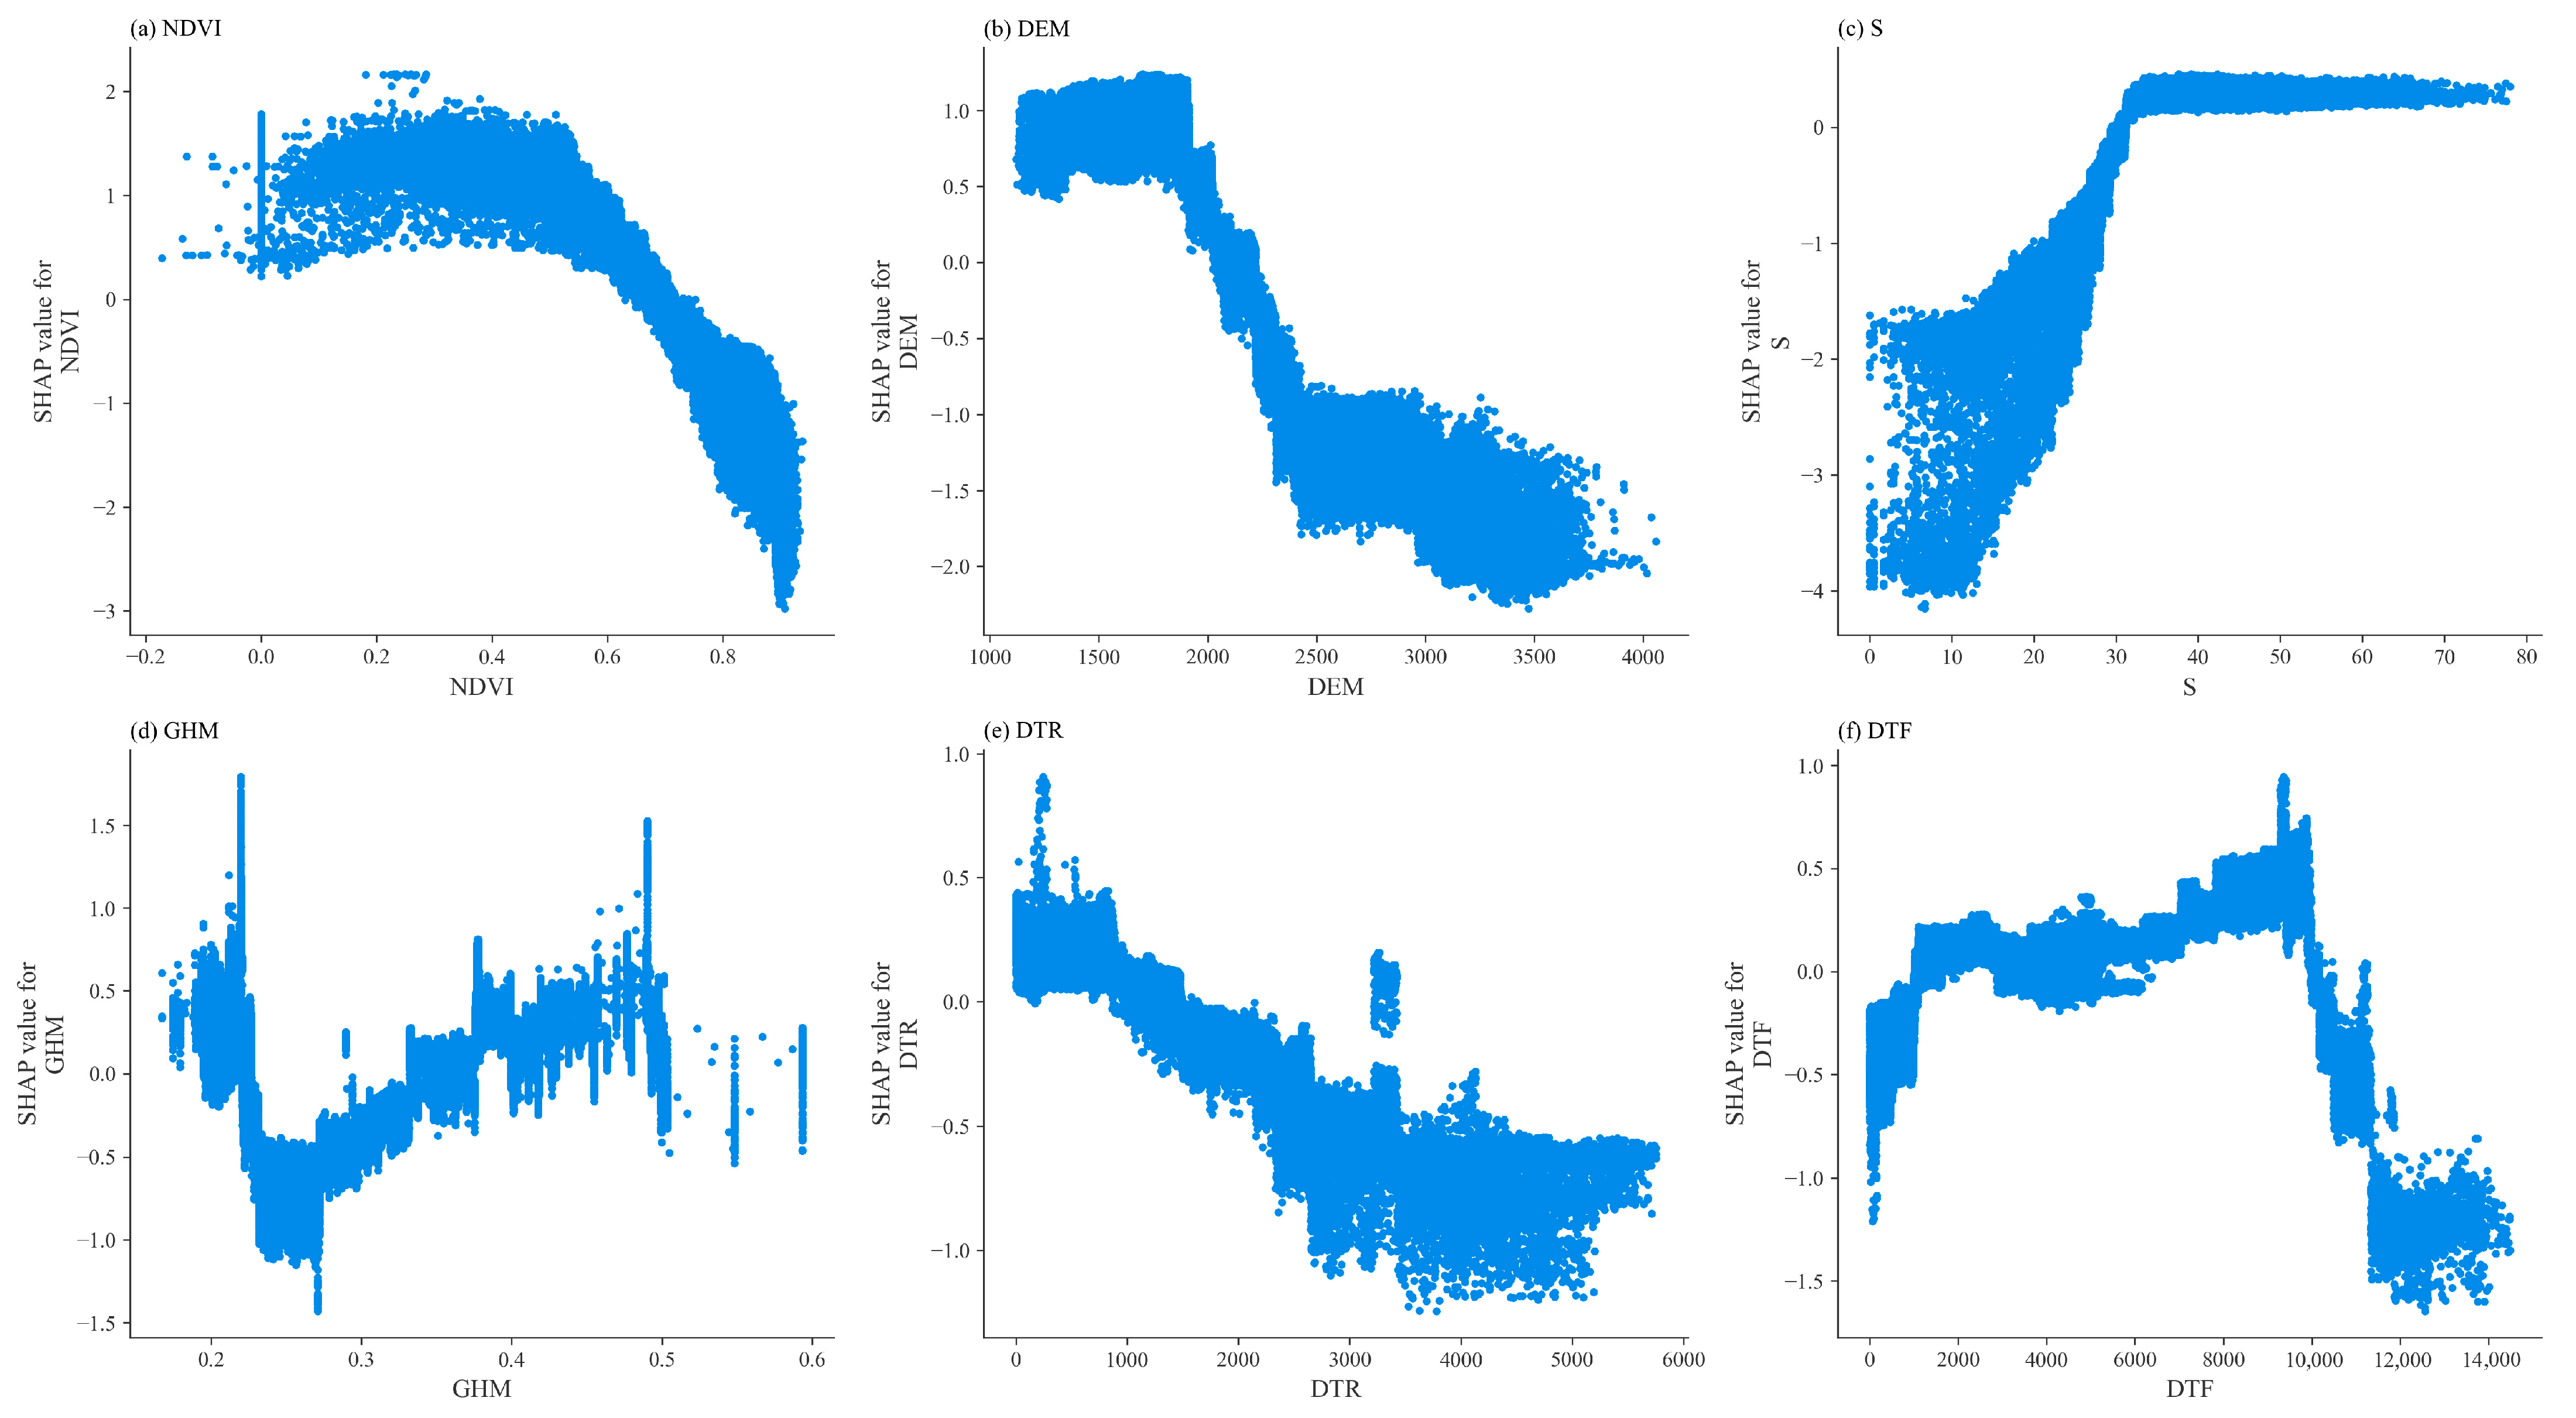
To further investigate the influence mechanisms, SHAP dependence plots were constructed for the six most important variables (Figure 14). NDVI shows a strong negative relationship with SHAP values, indicating that increased vegetation coverage significantly reduces landslide risk, which aligns with its known role in reinforcing slope stability and reducing runoff. DEM exhibits a nonlinear response: SHAP values decline above 2000 m, suggesting lower instability in high-altitude areas, likely due to limited colluvial materials and sparse anthropogenic disturbance.
Slope (S) demonstrates a distinctive pattern, with SHAP values increasing sharply from 10° to ~30°, then plateauing, implying an optimal slope range for shallow landslide development. For human and structural variables, GHM shows elevated SHAP values when exceeding 0.25, and DTF and DTR both reflect increased susceptibility with reduced proximity to faults and rivers, respectively—consistent with slope weakening from tectonic activity and river incision. These findings validate the physical plausibility of the model’s learned decision logic and improve the interpretability of susceptibility zonation.
These findings suggest that effective landslide hazard reduction in the study area requires a multifaceted approach, including vegetation restoration, optimized land-use planning, and the promotion of a more sustainable balance between human activities and the natural environment.

6. Conclusions

This study proposes an integrated framework that can facilitate emergency response and long-term prevention for rainfall-triggered landslides. The framework is structured into four interconnected modular components spanning the full disaster management cycle: (1) rapid landslide identification using multi-temporal remote sensing images, (2) rapid delineation of disastrous areas through numerical simulation, (3) landslide susceptibility assessment based on event-based landslide inventory and machine learning, and (4) risk zonation by integrating simulation outputs of high-susceptibility hillslopes with exposure data. The modularity of this design ensures flexibility across diverse spatial contexts and data availability conditions. Applied to the case of Qugaona Township, which was stricken by an extreme rainfall event occurring on 17 August 2020, the framework is able to (1) accurately identify most landslides that were triggered by the rainfall event, (2) delineate the extent and depositional features of the landslides, (3) identify high-susceptibility landslide hillslopes, and (4) identify high-risk-exposure elements and slopes with varying levels of disaster potential. These results offer practical insights for targeted mitigation and land use planning. By bridging the gap between landslide detection, process-based modeling, and susceptibility analysis, this framework offers a unified framework for both real-time emergency response and long-term disaster prevention. Leveraging the advantages of cloud-based geospatial platforms, data-driven prediction, and physically based simulation, the proposed approach provides robust technical support for government agencies and stakeholders engaged in landslide risk management under intensifying climatic extremes.

Author Contributions

Conceptualization, W.Z. and Y.L.; methodology, Y.L.; software, W.Z.; validation, Y.H., G.L., and J.Z.; formal analysis, F.M.; resources, X.M.; data curation, W.Z.; writing—original draft preparation, W.Z.; writing—review and editing, Y.L., Y.H., G.L., J.Z., F.M., M.W., G.C., Y.Z., X.M., F.G., and D.Y.; visualization, M.W.; supervision, X.M.; project administration, F.G.; funding acquisition, X.M. and D.Y. All authors have read and agreed to the published version of the manuscript.

Funding

This research was funded by the National Natural Science Foundation of China (42130709, 42407201, 42077230), the Key Technology Research and Development Program of the Ministry of Gansu Province, China (22ZD6FA051), the Natural Science Foundation of Gansu (21JR7RA442), the Fundamental Research Funds for the Central Universities (lzujbky-2024-31), the Central Guiding Local Science and Technology Development Fund Projects (24ZYQA046), the Construction Project of Gansu Technological Innovation Center (18JR2JA006), the Innovation Facility and Talent Plan Project of Gansu Province (20JR10RA657), and the “Talent Scientific Fund of Lanzhou University”.

Data Availability Statement

The datasets and codes used in this study have been publicly archived at Zenodo and are accessible via the DOI link: https://doi.org/10.5281/zenodo.15768008. These materials include input features, processed spatial data, and machine learning scripts as referenced in the Methodology section.

Conflicts of Interest

The authors declare no conflicts of interest. The funders had no role in the design of the study; in the collection, analyses, or interpretation of data; in the writing of the manuscript; or in the decision to publish the results.

References

  1. Touma, D.; Stevenson, S.; Swain, D.L.; Singh, D.; Kalashnikov, D.A.; Huang, X. Climate Change Increases Risk of Extreme Rainfall Following Wildfire in the Western United States. Sci. Adv. 2022, 8, eabm0320. [Google Scholar] [CrossRef] [PubMed]
  2. Wasko, C.; Nathan, R.; Stein, L.; O’Shea, D. Evidence of Shorter More Extreme Rainfalls and Increased Flood Variability under Climate Change. J. Hydrol. 2021, 603, 126994. [Google Scholar] [CrossRef]
  3. Nguyen, H.T.; Wiatr, T.; Fernández-Steeger, T.M.; Reicherter, K.; Rodrigues, D.M.M.; Azzam, R. Landslide Hazard and Cascading Effects Following the Extreme Rainfall Event on Madeira Island (February 2010). Nat. Hazards 2013, 65, 635–652. [Google Scholar] [CrossRef]
  4. Suradi, M.; Fourie, A.B.; Saynor, M.J. An Experimental and Numerical Study of a Landslide Triggered by an Extreme Rainfall Event in Northern Australia. Landslides 2016, 13, 1125–1138. [Google Scholar] [CrossRef]
  5. Lazzari, M.; Piccarreta, M. Landslide Disasters Triggered by Extreme Rainfall Events: The Case of Montescaglioso (Basilicata, Southern Italy). Geosciences 2018, 8, 377. [Google Scholar] [CrossRef]
  6. Araújo, J.R.; Ramos, A.M.; Soares, P.M.M.; Melo, R.; Oliveira, S.C.; Trigo, R.M. Impact of Extreme Rainfall Events on Landslide Activity in Portugal under Climate Change Scenarios. Landslides 2022, 19, 2279–2293. [Google Scholar] [CrossRef]
  7. Kirschbaum, D.; Kapnick, S.B.; Stanley, T.; Pascale, S. Changes in Extreme Precipitation and Landslides Over High Mountain Asia. Geophys. Res. Lett. 2020, 47, e2019GL085347. [Google Scholar] [CrossRef]
  8. Donnini, M.; Santangelo, M.; Gariano, S.L.; Bucci, F.; Peruccacci, S.; Alvioli, M.; Althuwaynee, O.; Ardizzone, F.; Bianchi, C.; Bornaetxea, T.; et al. Landslides Triggered by an Extraordinary Rainfall Event in Central Italy on September 15, 2022. Landslides 2023, 20, 2199–2211. [Google Scholar] [CrossRef]
  9. Iverson, R.M.; George, D.L.; Allstadt, K.; Reid, M.E.; Collins, B.D.; Vallance, J.W.; Schilling, S.P.; Godt, J.W.; Cannon, C.M.; Magirl, C.S. Landslide Mobility and Hazards: Implications of the 2014 Oso Disaster. Earth Planet. Sci. Lett. 2015, 412, 197–208. [Google Scholar] [CrossRef]
  10. Rossi, M.; Guzzetti, F.; Salvati, P.; Donnini, M.; Napolitano, E.; Bianchi, C. A Predictive Model of Societal Landslide Risk in Italy. Earth-Sci. Rev. 2019, 196, 102849. [Google Scholar] [CrossRef]
  11. Caleca, F.; Tofani, V.; Segoni, S.; Raspini, F.; Franceschini, R.; Rosi, A. How Can Landslide Risk Maps Be Validated? Potential Solutions with Open-Source Databases. Front. Earth Sci. 2022, 10, 998885. [Google Scholar] [CrossRef]
  12. Zhao, B.; Zhang, H.; Liao, H.; Li, W.; Su, L.; He, W.; Zeng, L.; Qin, H.; Dhital, M.R. Emergency Response to the Reactivated Aniangzhai Landslide Resulting from a Rainstorm-Triggered Debris Flow, Sichuan Province, China. Landslides 2021, 18, 1115–1130. [Google Scholar] [CrossRef]
  13. Huang, B.; Zheng, W.; Yu, Z.; Liu, G. A Successful Case of Emergency Landslide Response—The Sept. 2, 2014, Shanshucao Landslide, Three Gorges Reservoir, China. Geoenviron. Disasters 2015, 2, 18. [Google Scholar] [CrossRef]
  14. Robinson, T.R.; Rosser, N.J.; Densmore, A.L.; Williams, J.G.; Kincey, M.E.; Benjamin, J.; Bell, H.J. Rapid Post-Earthquake Modelling of Coseismic Landslide Intensity and Distribution for Emergency Response Decision Support. Nat. Hazards Earth Syst. Sci. 2017, 17, 1521–1540. [Google Scholar] [CrossRef]
  15. An, J.; Bai, X.; Xu, J.; Nie, G.; Wang, X. Prediction of Highway Blockage Caused by Earthquake-Induced Landslides for Improving Earthquake Emergency Response. Nat. Hazards 2015, 79, 511–536. [Google Scholar] [CrossRef]
  16. Chen, X.Q.; Cui, P.; Li, Y.; Zhao, W.Y. Emergency Response to the Tangjiashan Landslide-Dammed Lake Resulting from the 2008 Wenchuan Earthquake, China. Landslides 2011, 8, 91–98. [Google Scholar] [CrossRef]
  17. Dikau, R. The Recognition of Landslides. In Floods and Landslides: Integrated Risk Assessment; Casale, R., Margottini, C., Eds.; Springer: Berlin/Heidelberg, Germany, 1999; pp. 39–44. ISBN 978-3-642-63664-6. [Google Scholar]
  18. Saba, S.B.; van der Meijde, M.; van der Werff, H. Spatiotemporal Landslide Detection for the 2005 Kashmir Earthquake Region. Geomorphology 2010, 124, 17–25. [Google Scholar] [CrossRef]
  19. Xu, C.; Xu, X.; Shyu, J.B.H.; Gao, M.; Tan, X.; Ran, Y.; Zheng, W. Landslides Triggered by the 20 April 2013 Lushan, China, Mw 6.6 Earthquake from Field Investigations and Preliminary Analyses. Landslides 2015, 12, 365–385. [Google Scholar] [CrossRef]
  20. Murillo-García, F.G.; Alcántara-Ayala, I.; Ardizzone, F.; Cardinali, M.; Fiourucci, F.; Guzzetti, F. Satellite Stereoscopic Pair Images of Very High Resolution: A Step Forward for the Development of Landslide Inventories. Landslides 2015, 12, 277–291. [Google Scholar] [CrossRef]
  21. Đurić, D.; Mladenović, A.; Pešić-Georgiadis, M.; Marjanović, M.; Abolmasov, B. Using Multiresolution and Multitemporal Satellite Data for Post-Disaster Landslide Inventory in the Republic of Serbia. Landslides 2017, 14, 1467–1482. [Google Scholar] [CrossRef]
  22. Fan, X.; Scaringi, G.; Domènech, G.; Yang, F.; Guo, X.; Dai, L.; He, C.; Xu, Q.; Huang, R. Two Multi-Temporal Datasets That Track the Enhanced Landsliding after the 2008 Wenchuan Earthquake. Earth Syst. Sci. Data 2019, 11, 35–55. [Google Scholar] [CrossRef]
  23. Yang, W.; Wang, M.; Shi, P. Using MODIS NDVI Time Series to Identify Geographic Patterns of Landslides in Vegetated Regions. IEEE Geosci. Remote Sens. Lett. 2012, 10, 707–710. [Google Scholar] [CrossRef]
  24. Tavakkoli Piralilou, S.; Shahabi, H.; Jarihani, B.; Ghorbanzadeh, O.; Blaschke, T.; Gholamnia, K.; Meena, S.R.; Aryal, J. Landslide Detection Using Multi-Scale Image Segmentation and Different Machine Learning Models in the Higher Himalayas. Remote Sens. 2019, 11, 2575. [Google Scholar] [CrossRef]
  25. Ghorbanzadeh, O.; Shahabi, H.; Crivellari, A.; Homayouni, S.; Blaschke, T.; Ghamisi, P. Landslide Detection Using Deep Learning and Object-Based Image Analysis. Landslides 2022, 19, 929–939. [Google Scholar] [CrossRef]
  26. Meena, S.R.; Soares, L.P.; Grohmann, C.H.; Van Westen, C.; Bhuyan, K.; Singh, R.P.; Floris, M.; Catani, F. Landslide Detection in the Himalayas Using Machine Learning Algorithms and U-Net. Landslides 2022, 19, 1209–1229. [Google Scholar] [CrossRef]
  27. Zhou, W.; Qiu, H.; Wang, L.; Pei, Y.; Tang, B.; Ma, S.; Yang, D.; Cao, M. Combining Rainfall-Induced Shallow Landslides and Subsequent Debris Flows for Hazard Chain Prediction. Catena 2022, 213, 106199. [Google Scholar] [CrossRef]
  28. Tayyebi, S.M.; Pastor, M.; Stickle, M.M.; Yagüe, Á.; Manzanal, D.; Molinos, M.; Navas, P. Two-Phase SPH Modelling of a Real Debris Avalanche and Analysis of Its Impact on Bottom Drainage Screens. Landslides 2022, 19, 421–435. [Google Scholar] [CrossRef]
  29. Sajwan, A.; Mhaski, S.; Pandey, A.; Vangla, P.; Ramana, G.V. A Multi-Scale Approach for Deterministic Analysis of Landslide Triggering and Mass Flow Mechanism at Kaliasaur (Rudraprayag). Landslides 2024, 21, 393–409. [Google Scholar] [CrossRef]
  30. Ahmad, N.; Shafique, M.; Hussain, M.L.; Ullah, I. Integrated Debris Flow Hazard and Risk Assessment Using UAV Data and RAMMS, a Case Study in Northern Pakistan. Nat. Hazards 2025, 121, 1463–1487. [Google Scholar] [CrossRef]
  31. Bhagya, S.B.; Sumi, A.S.; Balaji, S.; Danumah, J.H.; Costache, R.; Rajaneesh, A.; Gokul, A.; Chandrasenan, C.P.; Quevedo, R.P.; Johny, A. Landslide Susceptibility Assessment of a Part of the Western Ghats (India) Employing the AHP and F-AHP Models and Comparison with Existing Susceptibility Maps. Land 2023, 12, 468. [Google Scholar] [CrossRef]
  32. Chanu, M.L.; Bakimchandra, O. Landslide Susceptibility Assessment Using AHP Model and Multi Resolution DEMs along a Highway in Manipur, India. Environ. Earth Sci. 2022, 81, 156. [Google Scholar] [CrossRef]
  33. Zhou, J.; Tan, S.; Li, J.; Xu, J.; Wang, C.; Ye, H. Landslide Susceptibility Assessment Using the Analytic Hierarchy Process (AHP): A Case Study of a Construction Site for Photovoltaic Power Generation in Yunxian County, Southwest China. Sustainability 2023, 15, 5281. [Google Scholar] [CrossRef]
  34. Malakar, S.; Rai, A.K. Estimating Seismic Vulnerability in West Bengal by AHP-WSM and AHP-VIKOR. Nat. Hazards Res. 2023, 3, 464–473. [Google Scholar] [CrossRef]
  35. Parvin, F.; Najmul Islam Hashmi, S.; Ali, S.A. Appraisal of Infrastructural Amenities to Analyze Spatial Backwardness of Murshidabad District Using WSM and GIS-Based Kernel Estimation. GeoJournal 2021, 86, 19–41. [Google Scholar] [CrossRef]
  36. Saha, A.; Villuri, V.G.K.; Bhardwaj, A.; Kumar, S. A Multi-Criteria Decision Analysis (MCDA) Approach for Landslide Susceptibility Mapping of a Part of Darjeeling District in North-East Himalaya, India. Appl. Sci. 2023, 13, 5062. [Google Scholar] [CrossRef]
  37. Beigh, I.H.; Bukhari, S.K. Landslide Susceptibility Assessment Using GIS-Based Multicriteria Decision Analysis (MCDA) along a Part of National Highway-1, Kashmir- Himalayas, India. Appl. Geomat. 2024, 16, 451–469. [Google Scholar] [CrossRef]
  38. He, J.; Qiu, H.; Qu, F.; Hu, S.; Yang, D.; Shen, Y.; Zhang, Y.; Sun, H.; Cao, M. Prediction of Spatiotemporal Stability and Rainfall Threshold of Shallow Landslides Using the TRIGRS and Scoops3D Models. Catena 2021, 197, 104999. [Google Scholar] [CrossRef]
  39. Raimondi, L.; Pepe, G.; Firpo, M.; Calcaterra, D.; Cevasco, A. An Open-Source and QGIS-Integrated Physically Based Model for Spatial Prediction of Rainfall-Induced Shallow Landslides (SPRIn-SL). Environ. Model. Softw. 2023, 160, 105587. [Google Scholar] [CrossRef]
  40. Zhang, S.; Wang, F. Three-Dimensional Seismic Slope Stability Assessment with the Application of Scoops3D and GIS: A Case Study in Atsuma, Hokkaido. Geoenviron. Disasters 2019, 6, 9. [Google Scholar] [CrossRef]
  41. Ermini, L.; Catani, F.; Casagli, N. Artificial Neural Networks Applied to Landslide Susceptibility Assessment. Geomorphology 2005, 66, 327–343. [Google Scholar] [CrossRef]
  42. Saito, H.; Nakayama, D.; Matsuyama, H. Comparison of Landslide Susceptibility Based on a Decision-Tree Model and Actual Landslide Occurrence: The Akaishi Mountains, Japan. Geomorphology 2009, 109, 108–121. [Google Scholar] [CrossRef]
  43. Trigila, A.; Iadanza, C.; Esposito, C.; Scarascia-Mugnozza, G. Comparison of Logistic Regression and Random Forests Techniques for Shallow Landslide Susceptibility Assessment in Giampilieri (NE Sicily, Italy). Geomorphology 2015, 249, 119–136. [Google Scholar] [CrossRef]
  44. Nikoobakht, S.; Azarafza, M.; Akgün, H.; Derakhshani, R. Landslide Susceptibility Assessment by Using Convolutional Neural Network. Appl. Sci. 2022, 12, 5992. [Google Scholar] [CrossRef]
  45. Marjanović, M.; Kovačević, M.; Bajat, B.; Voženílek, V. Landslide Susceptibility Assessment Using SVM Machine Learning Algorithm. Eng. Geol. 2011, 123, 225–234. [Google Scholar] [CrossRef]
  46. Park, S.-J.; Lee, C.-W.; Lee, S.; Lee, M.-J. Landslide Susceptibility Mapping and Comparison Using Decision Tree Models: A Case Study of Jumunjin Area, Korea. Remote Sens. 2018, 10, 1545. [Google Scholar] [CrossRef]
  47. Huang, Y.; Zhao, L. Review on Landslide Susceptibility Mapping Using Support Vector Machines. Catena 2018, 165, 520–529. [Google Scholar] [CrossRef]
  48. Pradhan, B.; Dikshit, A.; Lee, S.; Kim, H. An Explainable AI (XAI) Model for Landslide Susceptibility Modeling. Appl. Soft Comput. 2023, 142, 110324. [Google Scholar] [CrossRef]
  49. Yang, C.; Liu, L.-L.; Huang, F.; Huang, L.; Wang, X.-M. Machine Learning-Based Landslide Susceptibility Assessment with Optimized Ratio of Landslide to Non-Landslide Samples. Gondwana Res. 2023, 123, 198–216. [Google Scholar] [CrossRef]
  50. Zhang, J.; Ma, X.; Zhang, J.; Sun, D.; Zhou, X.; Mi, C.; Wen, H. Insights into Geospatial Heterogeneity of Landslide Susceptibility Based on the SHAP-XGBoost Model. J. Environ. Manag. 2023, 332, 117357. [Google Scholar] [CrossRef]
  51. Rong, G.; Li, K.; Tong, Z.; Liu, X.; Zhang, J.; Zhang, Y.; Li, T. Population Amount Risk Assessment of Extreme Precipitation-Induced Landslides Based on Integrated Machine Learning Model and Scenario Simulation. Geosci. Front. 2023, 14, 101541. [Google Scholar] [CrossRef]
  52. Gabet, E.J.; Mudd, S.M. The Mobilization of Debris Flows from Shallow Landslides. Geomorphology 2006, 74, 207–218. [Google Scholar] [CrossRef]
  53. Cui, P.; Zhou, G.G.; Zhu, X.H.; Zhang, J.Q. Scale Amplification of Natural Debris Flows Caused by Cascading Landslide Dam Failures. Geomorphology 2013, 182, 173–189. [Google Scholar] [CrossRef]
  54. Trancoso Gomes, R.A.; Guimarães, R.F.; de Carvalho Júnior, O.A.; Fernandes, N.F.; Vargas do Amaral Júnior, E. Combining Spatial Models for Shallow Landslides and Debris-Flows Prediction. Remote Sens. 2013, 5, 2219–2237. [Google Scholar] [CrossRef]
  55. Luu, C.; Ha, H.; Thong Tran, X.; Ha Vu, T.; Duy Bui, Q. Landslide Susceptibility and Building Exposure Assessment Using Machine Learning Models and Geospatial Analysis Techniques. Adv. Space Res. 2024, 74, 5489–5513. [Google Scholar] [CrossRef]
  56. Ma, S.; Xu, C.; Shao, X. Spatial Prediction Strategy for Landslides Triggered by Large Earthquakes Oriented to Emergency Response, Mid-Term Resettlement and Later Reconstruction. Int. J. Disaster Risk Reduct. 2020, 43, 101362. [Google Scholar] [CrossRef]
  57. Otsu, N. A Threshold Selection Method from Gray-Level Histograms. IEEE Trans. Syst. Man Cybern. 1979, 9, 62–66. [Google Scholar] [CrossRef]
  58. Jaboyedoff, M.; Chigira, M.; Arai, N.; Derron, M.-H.; Rudaz, B.; Tsou, C.-Y. Testing a Failure Surface Prediction and Deposit Reconstruction Method for a Landslide Cluster That Occurred during Typhoon Talas (Japan). Earth Surf. Dyn. 2019, 7, 439–458. [Google Scholar] [CrossRef]
  59. Sun, X.; Zeng, P.; Li, T.; Zhang, L.; Jimenez, R.; Dong, X.; Xu, Q. A Bayesian Approach to Develop Simple Run-out Distance Models: Loess Landslides in Heifangtai Terrace, Gansu Province, China. Landslides 2023, 20, 77–95. [Google Scholar] [CrossRef]
  60. Wang, Y.; Hutter, K.; Pudasaini, S.P. The Savage-Hutter Theory: A System of Partial Differential Equations for Avalanche Flows of Snow, Debris, and Mud. ZAMM—J. Appl. Math. Mech. Z. Für Angew. Math. Mech. 2004, 84, 507–527. [Google Scholar] [CrossRef]
  61. Pudasaini, S.P.; Mergili, M. A Multi-Phase Mass Flow Model. J. Geophys. Res. Earth Surf. 2019, 124, 2920–2942. [Google Scholar] [CrossRef]
  62. Baggio, T.; Mergili, M.; D’Agostino, V. Advances in the Simulation of Debris Flow Erosion: The Case Study of the Rio Gere (Italy) Event of the 4th August 2017. Geomorphology 2021, 381, 107664. [Google Scholar] [CrossRef]
  63. Pudasaini, S.P.; Fischer, J.-T. A Mechanical Erosion Model for Two-Phase Mass Flows. Int. J. Multiph. Flow 2020, 132, 103416. [Google Scholar] [CrossRef]
  64. Pudasaini, S.P.; Krautblatter, M. The Mechanics of Landslide Mobility with Erosion. Nat. Commun. 2021, 12, 6793. [Google Scholar] [CrossRef] [PubMed]
  65. Dormann, C.F.; Elith, J.; Bacher, S.; Buchmann, C.; Carl, G.; Carré, G.; Marquéz, J.R.G.; Gruber, B.; Lafourcade, B.; Leitão, P.J.; et al. Collinearity: A Review of Methods to Deal with It and a Simulation Study Evaluating Their Performance. Ecography 2013, 36, 27–46. [Google Scholar] [CrossRef]
  66. Mondini, A.C.; Santangelo, M.; Rocchetti, M.; Rossetto, E.; Manconi, A.; Monserrat, O. Sentinel-1 SAR Amplitude Imagery for Rapid Landslide Detection. Remote Sens. 2019, 11, 760. [Google Scholar] [CrossRef]
  67. Barra, A.; Monserrat, O.; Mazzanti, P.; Esposito, C.; Crosetto, M.; Scarascia Mugnozza, G. First Insights on the Potential of Sentinel-1 for Landslides Detection. Geomat. Nat. Hazards Risk 2016, 7, 1874–1883. [Google Scholar] [CrossRef]
  68. Ghorbanzadeh, O.; Didehban, K.; Rasouli, H.; Kamran, K.V.; Feizizadeh, B.; Blaschke, T. An Application of Sentinel-1, Sentinel-2, and GNSS Data for Landslide Susceptibility Mapping. ISPRS Int. J. Geo-Inf. 2020, 9, 561. [Google Scholar] [CrossRef]
  69. Dabiri, Z.; Hölbling, D.; Abad, L.; Helgason, J.K.; Sæmundsson, Þ.; Tiede, D. Assessment of Landslide-Induced Geomorphological Changes in Hítardalur Valley, Iceland, Using Sentinel-1 and Sentinel-2 Data. Appl. Sci. 2020, 10, 5848. [Google Scholar] [CrossRef]
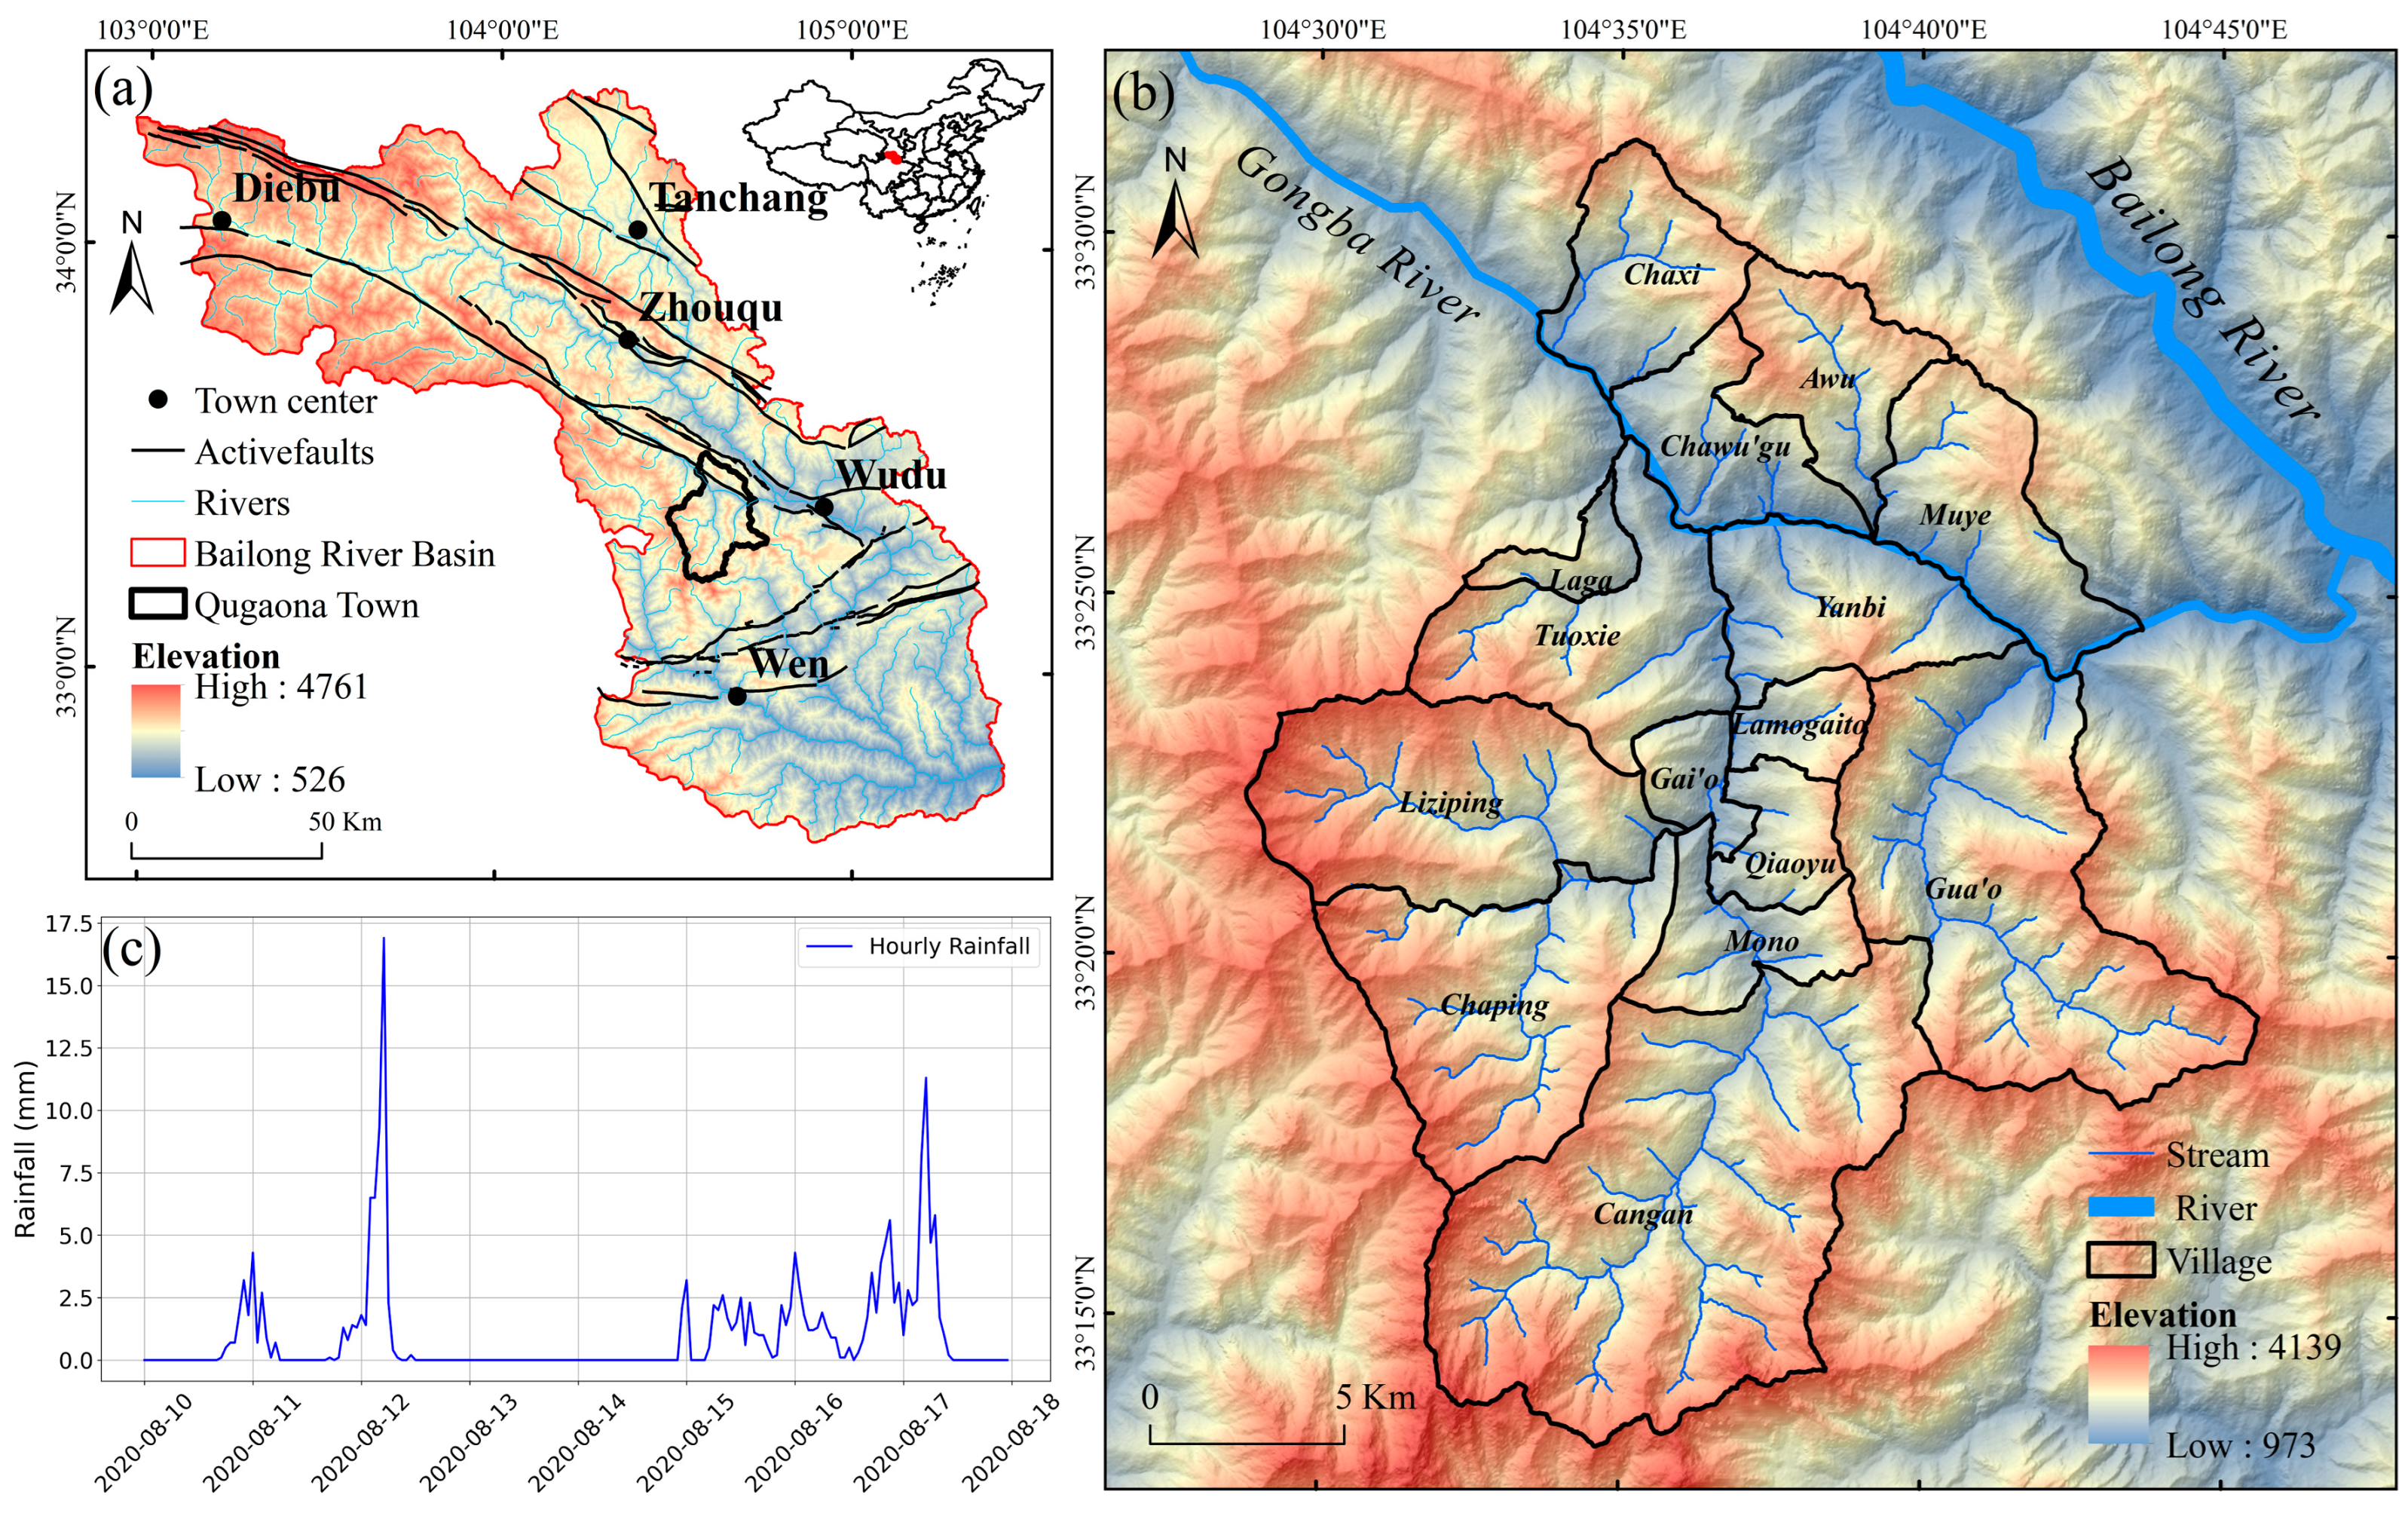
Figure 1. Geographical and hydrometeorological overview of the Bailong River Basin and Qugaona Township. (a) Topographic and tectonic setting of the Bailong River Basin. (b) Detailed geomorphological and hydrological features of Qugaona Township. (c) Hourly rainfall time series recorded from 10 August to 17 August 2020.
Remotesensing 17 02406 g001
Figure 2. Workflow of the integrated framework for rainfall-induced landslide cluster assessment and mitigation (LUT refers to land use type).
Remotesensing 17 02406 g002
Figure 3. Spatial distribution of identified landslides and estimated landslide thickness based on the SLBL model. (a) Estimated landslide thickness distribution.
Remotesensing 17 02406 g003
Figure 4. Comparison between automatically detected and visually interpreted landslides in Muye Village.
Remotesensing 17 02406 g004
Figure 5. Effects of parameter combinations within defined value ranges in landslide disaster simulations.
Remotesensing 17 02406 g005
Figure 6. Comparison between numerical simulation and actual inundation extent.
Remotesensing 17 02406 g006
Figure 7. Numerical simulation results in densely populated areas.
Remotesensing 17 02406 g007
Figure 8. Multicollinearity analysis of environmental variables. (a) Pearson correlation heatmap showing pairwise linear correlations among the initially selected variables. Variables with a correlation coefficient > 0.7 were considered redundant and removed. (b) VIF analysis of the remaining variables confirms the absence of severe multicollinearity (VIF < 5 for all variables).
Remotesensing 17 02406 g008
Figure 9. Performance evaluation of different machine learning models.
Remotesensing 17 02406 g009
Figure 10. Landslide susceptibility map of the study area classified into five levels using the Natural Breaks (Jenks) method. The pie chart shows the proportional distribution of each susceptibility class: very low (61.9%), low (17.6%), moderate (7.5%), high (8.0%), and very high (5.0%).
Remotesensing 17 02406 g010
Figure 11. Simulation results of high-susceptibility areas in Cangan Village. (a) The road and residential area on the left side are affected, while the right side remains unaffected. (b)The main road and residential area are significantly affected.
Remotesensing 17 02406 g011
Figure 12. Types of hazardous slope classification in Cangan Village.
Remotesensing 17 02406 g012
Figure 13. Multidimensional SHAP-based interpretation of factors driving landslide susceptibility.
Remotesensing 17 02406 g013
Figure 14. SHAP dependence plots of the six most important variables influencing landslide susceptibility. (a) Landslide susceptibility decreases with increasing NDVI values; (b) Susceptibility significantly decreases above 2000 m elevation; (c) Susceptibility increases rapidly between 10° and approximately 30°, then stabilizes; (d) Susceptibility increases significantly when the GHM value exceeds 0.25; (e) Landslide susceptibility decreases with increasing distance from rivers; (f) Landslide susceptibility drops sharply beyond a distance of 10,000 m from faults.
Remotesensing 17 02406 g014
Table 1. Evaluation factors and abbreviations.
Factor TypeEvaluation Factors and Abbreviations
Topographic FactorsSlope (S), Aspect (A), Elevation (DEM), Profile Curvature (PRC), Plan Curvature (PLC), Curvature (C)
Geological FactorsDistance to Faults (DF), Distance to Rivers (DTR), Clay Content (CC), Sand Content (SDC), Silt Content (STC), NDVI, Formation Intensity Level (FIL)
Human Activity FactorsDistance to Roads (DR), Land Use Type (LUT), Population Density (POP), Global Human Modification Index (GHM)
Table 2. Preselected machine learning models and their characteristics.
Model NameCharacteristicsSource
Logistic RegressionSuitable for binary classification; simple and efficient; best for linearly separable data.scikit-learn
Random ForestEnsemble of decision trees using majority voting; good for nonlinear data; prevents overfitting.scikit-learn
Gradient BoostingSequentially improves weak learners; good for complex nonlinear problems; longer training time.scikit-learn
Extra TreesSimilar to Random Forest but with random split thresholds; increases randomness and generalization.scikit-learn
Extreme Gradient Boosting (XGBoost)Highly efficient gradient boosting algorithm; supports parallel computation; robust and scalable.XGBoost
Light Gradient Boosting (LightGBM)Fast, memory-efficient framework; performs well with high-dimensional data.LightGBM
Categorical Boosting (CatBoost)Handles categorical variables well; requires less parameter tuning.CatBoost
SGD ClassifierLinear model optimized by stochastic gradient descent; suitable for large-scale or online learning.scikit-learn
Gaussian Naive BayesBased on Bayes’ theorem; assumes feature independence and Gaussian distribution; best for small, simple datasets.scikit-learn
Table 3. Comparison of visual interpretation and automated detection. Percentages are calculated based on the total area of manually interpreted landslides (469,049.93 m2).
Landslide Detection Landslide Detection (m2)Percentage (%)
Visual Interpretation 469,049.93100
Automated DetectionTotal Area461,113.5898.30
Perfect Match304,835.5564.99
False Positives31,520.166.72
Missed Detections5910.031.26
Correct Detections450,428.6596.03
Table 4. Simulation parameters. θ represents the basal friction angle; φ represents the internal friction angle; EM denotes the entrainment model; CE indicates the entrainment coefficient.
Phaseθ (°)φ (°)Uws (kg/m3)EMCE (kg−1)
Solid103622002\
Disclaimer/Publisher’s Note: The statements, opinions and data contained in all publications are solely those of the individual author(s) and contributor(s) and not of MDPI and/or the editor(s). MDPI and/or the editor(s) disclaim responsibility for any injury to people or property resulting from any ideas, methods, instructions or products referred to in the content.