Article

Humidify Feedback of Wetland Changes in the China Side of the Heilongjiang River Basin

1
College of Earth Sciences, Jilin University, Changchun 130012, China
2
Jilin Sinoagri Sunshine Data Ltd., Changchun 130033, China
*
Author to whom correspondence should be addressed.
Remote Sens. 2025, 17(14), 2405; https://doi.org/10.3390/rs17142405
Submission received: 12 June 2025 / Revised: 5 July 2025 / Accepted: 8 July 2025 / Published: 11 July 2025
(This article belongs to the Special Issue Application of Remote Sensing Technology in Wetland Ecology)

Abstract

Understanding how wetland changes affect near-surface humidity is essential for evaluating their climate-influencing functions, especially in mid- and high-latitude regions. Here, using multi-source remote sensing data, we investigated the impacts of wetland area changes and leaf area index (LAI) on 2 m specific humidity (2m SH) within the China side of the Heilongjiang River Basin (CHRB) from 2003 to 2020 across latitudinal gradients and seasonal scales. The results indicated that the wetland area initially decreased and then increased, while the LAI rose by 0.015/year. A significant positive correlation was identified between wetland coverage and 2m SH, with a threshold of 60%. A transition point at 50°N was observed in the response of humidity to wetland area changes, shifting from an increase to a decrease in humidity. The Wetland LAI Change Humidity Index increased with latitude from 2003 until 2010, significantly decreasing thereafter (R2 = 0.634, p < 0.05). Seasonally, the humidifying effect strengthened with latitude in spring and autumn, with a strong negative correlation observed in autumn between 2003 and 2010 (R2 = 0.789, p < 0.001). These findings deepen the understanding of wetland–humidity interactions and provide a scientific basis for wetland conservation and regional climate adaptation, supporting SDG13.

1. Introduction

Wetlands are among the most critical ecosystems globally, playing a pivotal role in maintaining regional hydrological cycles, regulating climate, and sustaining biodiversity [1,2]. Under the dual pressures of accelerating climate change and intensified human activities, wetlands have undergone substantial degradation and transformation, attracting increasing attention to their feedback effects on local and regional climate systems [3]. These changes, in addition to affecting carbon storage and hydrological dynamics [4], also alter land surface properties, thereby influencing regional temperature and humidity distribution [5,6,7]. Consequently, exploring the effect of wetland change on moistening from a climate regulation perspective is essential for increasing our understanding of their eco-climatic functions. Such insights further inform wetland conservation, restoration strategies, and climate adaptation in line with Sustainable Development Goal 13 (SDG 13).
There remains a critical knowledge gap in the current research on the climate regulatory effects of wetlands. Most studies to date have primarily focused on the cooling effects of wetlands on land surface temperature [8,9,10], while the direct impact of wetlands on near-surface atmospheric humidity has been largely overlooked, particularly 2 m specific humidity (2m SH) [11,12,13]. This may lead to an underestimation of the climate service functions of wetlands. Humidity regulation directly affects socio-ecological systems, altering human thermal comfort and crop water demand [14,15], and indirectly influences regional climate through feedback mechanisms involving cloud microphysics and radiation balance [16,17]. In addition, current studies on wetland-induced effects on humidity often treat wetlands as homogeneous underlying surfaces, failing to account for the spatiotemporal heterogeneity of internal vegetation structures, such as the leaf area index (LAI), and their differential impacts on water vapor fluxes [18,19,20]. Indeed, wetlands exhibit considerable variability in canopy structure and hydrological characteristics [21,22], which can result in spatial differences in humidity responses by affecting processes such as evapotranspiration efficiency. However, systematic quantitative evidence supporting these mechanisms is still lacking.
LAI is a key indicator of canopy structure and ecosystem functioning, playing a critical role in regulating evapotranspiration intensity, atmospheric moisture recycling efficiency, and energy exchange between the land surface and the atmosphere [10,23]. Spatiotemporal variation in wetland vegetation LAI not only reflects adjustments in ecosystem structure but also serves as an internal driving force for changes in the climate regulation capacity of wetlands [24,25]. Studies have shown that wetland vegetation with higher LAI values tends to exhibit stronger evapotranspiration potential, which enhances near-surface atmospheric moisture and increases local specific humidity levels [26,27,28]. However, the quantitative relationship between wetland LAI dynamics and specific humidity responses remains unclear, especially at seasonal and regional scales. Therefore, a comprehensive analysis of the combined effects of wetland area and LAI changes on 2m SH can help reveal the coupled mechanisms between wetland landscape structure and climate-regulating functions, offering new insights into wetland–atmosphere interactions in mid-to-high-latitude regions.
The Heilongjiang River Basin (HRB) contains one of the highest concentrations of wetlands in China [29,30]. Over recent decades, the wetland landscape in this region has undergone significant alterations due to agricultural expansion, urbanization, and other anthropogenic disturbances [29,31]. On the Chinese side of the Heilongjiang River Basin (CHRB), more than 93% of the population resides in areas influenced by wetland ecosystems [32]. Since the 1950s, widespread human settlement and agricultural development have profoundly transformed the natural wetland landscape in this region [33,34]. Previous work has indicated that over half of the natural wetlands in the CHRB have been converted into cropland or artificial land cover types [29,32,35]. The CHRB, a typical cold-region wetland system, plays a critical role in regional hydrothermal regulation and serves as a sensitive indicator of land–atmosphere interactions in Northeast Asia. Wetland expansion or degradation can substantially alter surface evapotranspiration patterns and atmospheric moisture transport, thereby affecting surface water vapor availability and near-surface humidity levels [36,37]. These changes have direct implications for regional habitability and the sustainability of agricultural systems [35]. However, while the temperature-related impacts of wetland change have been widely studied, the influence of wetland dynamics on near-surface humidity, particularly 2m SH, remains largely underexplored in the CHRB. Systematically investigating how changes in wetland structure and distribution influence 2m SH in the CHRB is essential for expanding our understanding of biophysical feedback mechanisms and obtaining valuable scientific insights for cold-region wetland function assessment, ecological restoration planning, and regional climate adaptation strategies.
Therefore, in this study, we examined the effects of wetland area and LAI changes on 2m SH in the CHRB from 2003 to 2020. The specific objectives were to (1) analyze the dynamic changes in wetland area and wetland vegetation LAI during different seasons from 2003 to 2020 in the CHRB; (2) quantify the effects of wetland area changes on 2m SH by comparing 2m SH changes over pixels experiencing wetland loss or gain with those without change; and (3) analyze the wetting effects of changes in wetland LAI across different seasons and geographical gradients. This study is expected to provide theoretical support for wetland management and protection to mitigate climate deterioration and enhance ecological resilience, thereby promoting the implementation of SDG 13.

2. Materials and Methods
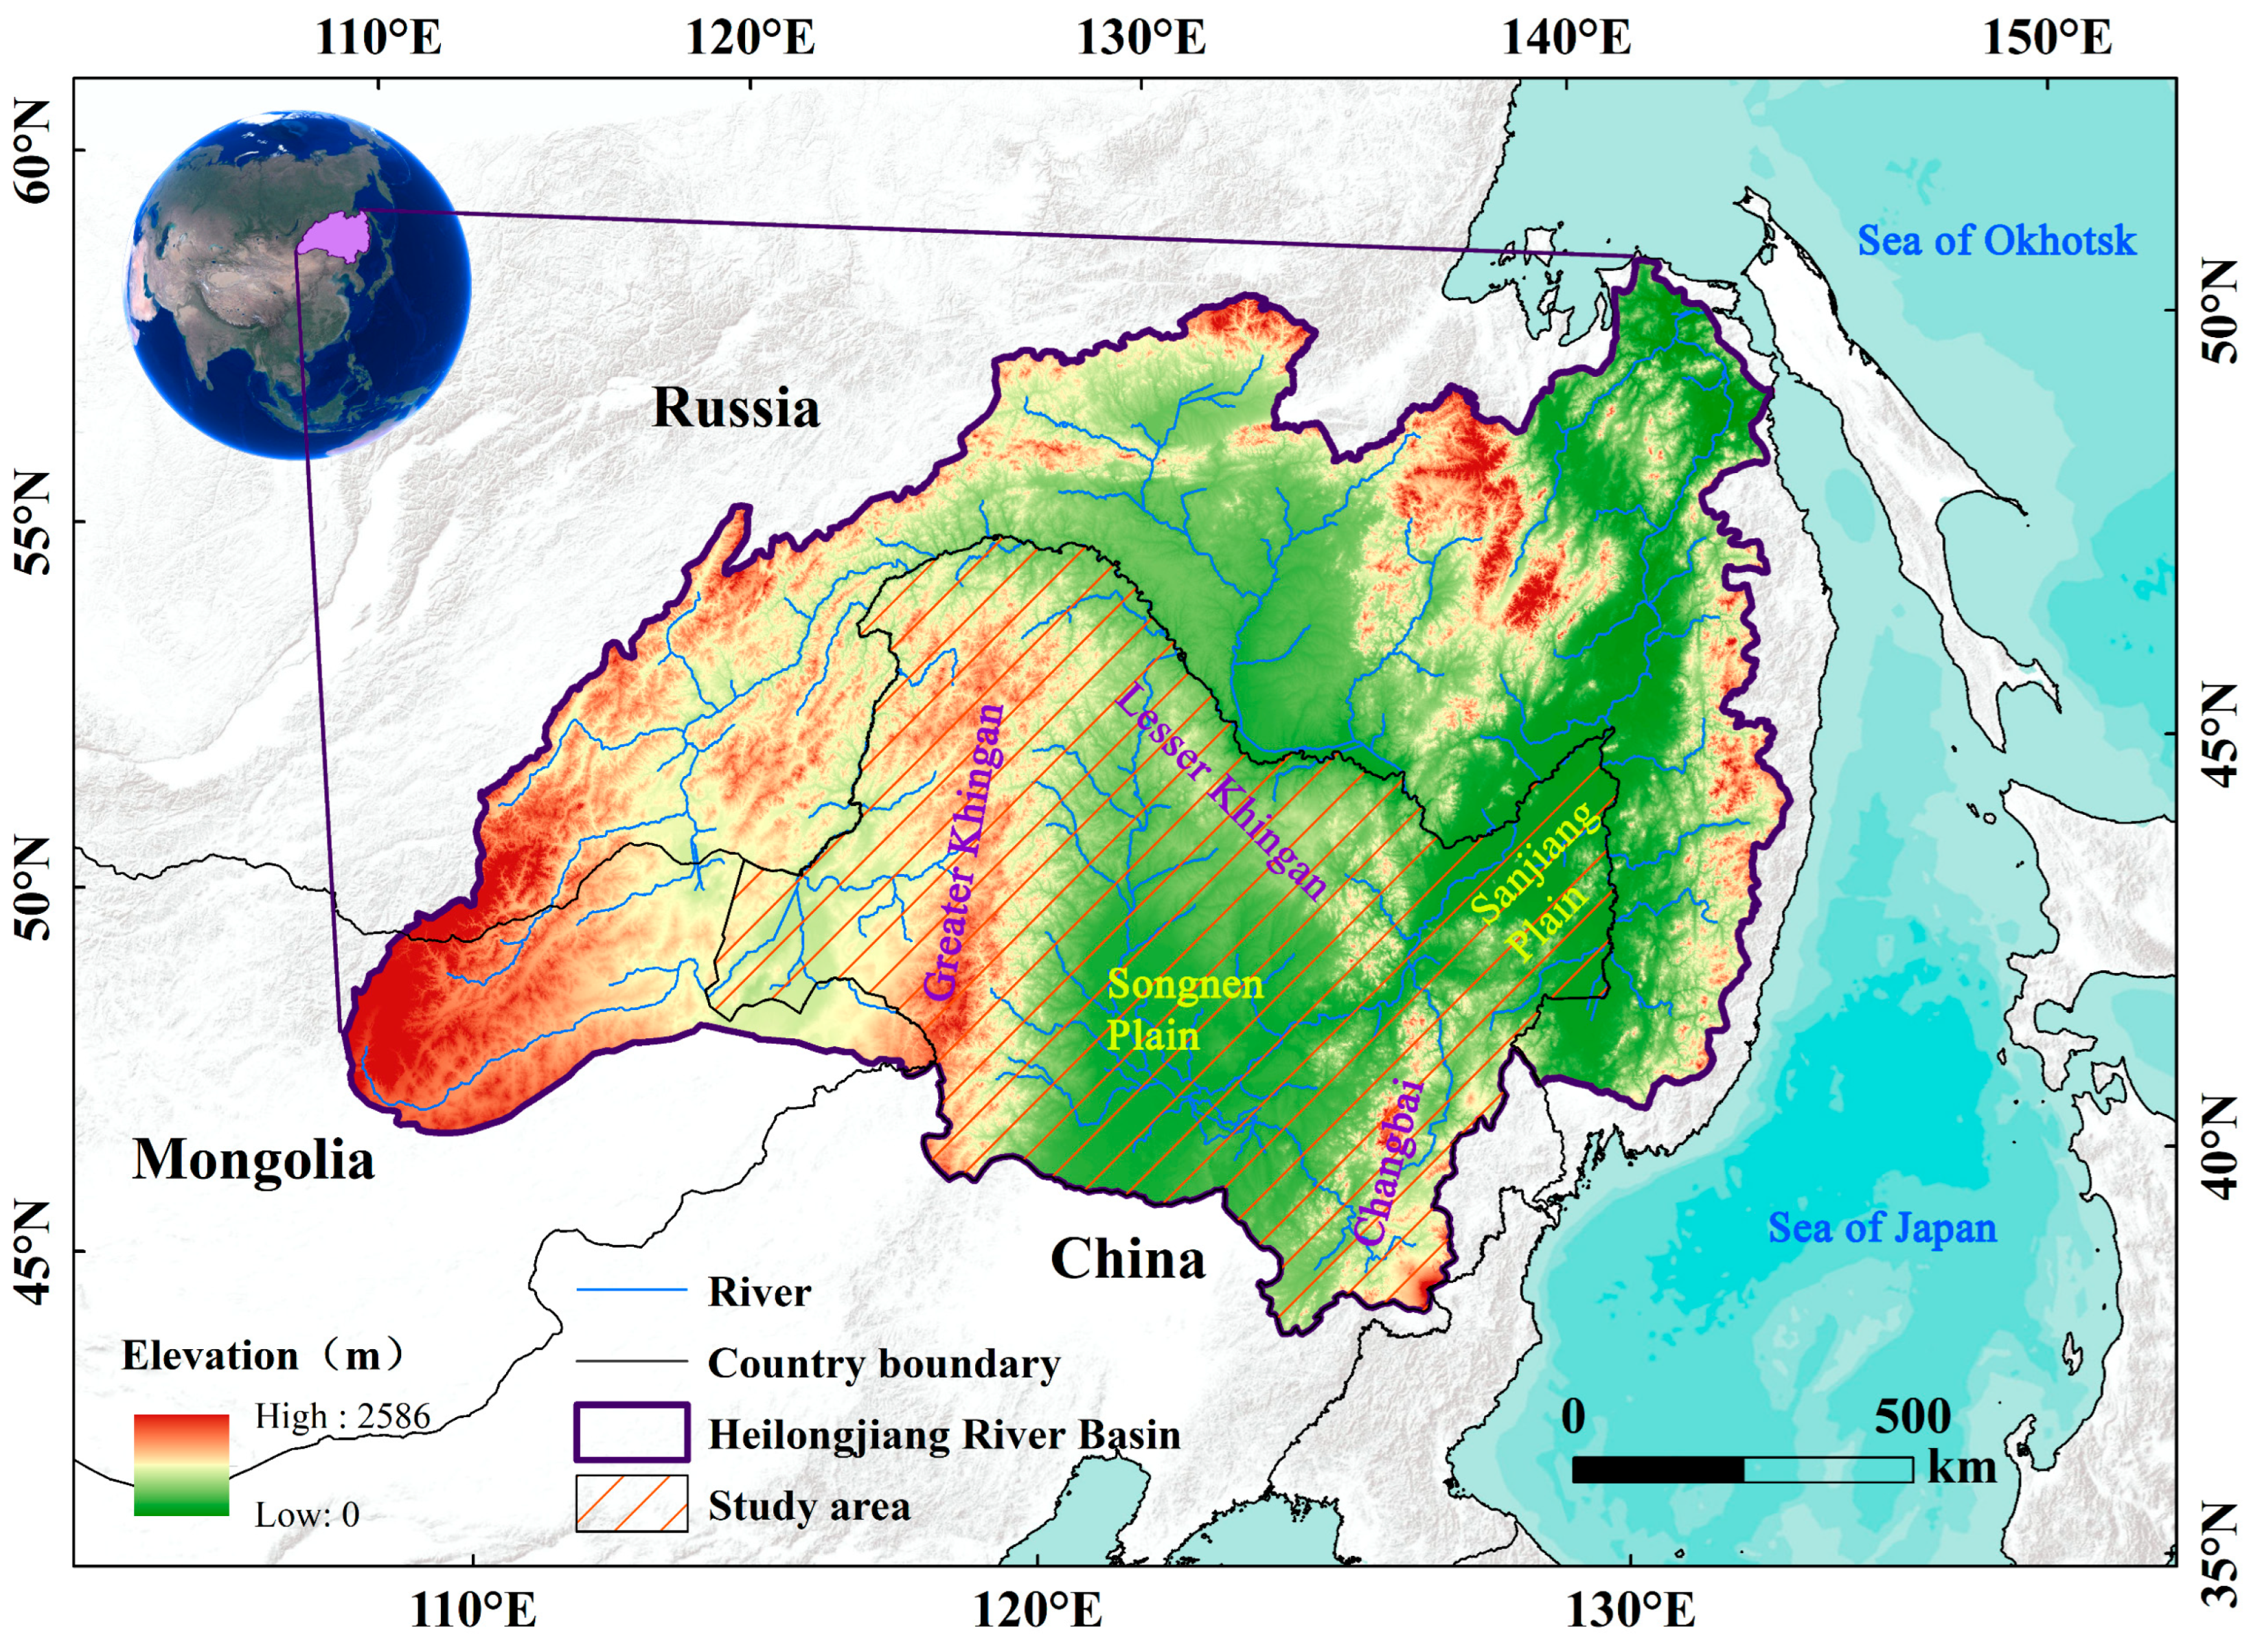
2.1. Study Area

The HRB is an important transnational water system in Northeast Asia, traversing China, Russia, and Mongolia (Figure 1). Internationally, it is known as the Amur River Basin, which stretches approximately 4440 km and drains an area of at least 1.855 million square kilometers. This river system is among the regions with the most concentrated distribution of cold-temperate wetlands and typical ecological functions. This study focused on the CHRB (41°45′N to 53°33′N, 115°13′E to 135°05′E), which accounts for approximately 48% of the total basin area and mainly covers the eastern regions of Heilongjiang province, Jilin province, and the Inner Mongolia Autonomous Region. It includes the two typical wetland distribution areas of the Sanjiang Plain and the Songnen Plain, with the Ussuri and Songhua Rivers being the main tributaries in the CHRB [35]. The terrain in this area gradually slopes from west to east. The CHRB has a temperate continental monsoon climate, with an average annual temperature ranging from −5 °C to 5 °C, and an annual precipitation of 400 to 800 mm, mainly concentrated from June to September. The basin has a rich variety of wetland types, including marsh, swamp, bog, and fen, which makes it a key area for the protection and restoration of wetland ecosystems in China. Over recent years, under the combined influence of climate change and human activities, the wetland pattern in the region has undergone significant alterations, and the changes in wetland area and structure have had a profound impact on regional climate. This makes this area ideal for studying the changes in cold-region wetlands and their climatic-ecological responses.

2.2. Data Processing and Analysis

Wetland distribution data for the years 2000, 2010, and 2020 in the CHRB were extracted from the China_Wetlands dataset available from the Northeast Branch of the National Earth System Science Data Center (https://www.geodata.cn/, accessed on 7 July 2025). This dataset, with a spatial resolution of 1 km, was generated using a hybrid object-based and hierarchical classification approach [38]. Based on validation with over 15,000 field verification points, the overall accuracy for this data was higher than 90%, and the user accuracy was higher than 85%. Natural wetlands in this study were defined as vegetated wetlands, including marshes, swamps, bogs, and fens. To examine the spatiotemporal evolution of wetland LAI and its influence on 2m SH, the analysis concentrated on areas within the CHRB where wetland extent remained stable throughout the 2000–2020 period. This subset of persistent wetlands enabled a clearer assessment of vegetation structure and humidity dynamics without the confounding effects of land cover conversion.
LAI represents a key biophysical parameter widely employed to describe vegetation canopy structure and overall ecosystem function [39,40]. In this study, the LAI was used to characterize the canopy properties of wetland vegetation. LAI data were derived from the MODIS Terra MOD15A2 Version 6 data product, which provides an 8-day composite LAI estimation with a spatial resolution of 500 m. We focused on the growing season, defined as May through September, between 2003 and 2020. To obtain representative seasonal values, the 8-day LAI composites were averaged for each growing season, and the resulting data were spatially resampled to a 1 km resolution using the Google Earth Engine platform (https://earthengine.google.com/, accessed on 7 July 2025). The spatiotemporal changes in wetland vegetation LAI from 2003 to 2020 were analyzed using the Sen’s slope estimation method combined with the Mann–Kendall trend test and the Hurst exponent, all implemented in R 4.4.3. The specific methods and formulas for Sen’s slope, the Mann–Kendall test, and the Hurst exponent can be found in the relevant references [41,42,43,44]. When 0.5 < H < 1, the LAI trend shows persistence, with stronger continuity as H approaches 1. H = 0.5 indicates a random series with no long-term correlation, while 0 < H < 0.5 suggests anti-persistence, with stronger reversals as H approaches 0.
The 2m SH data were derived from the HiMIC-Monthly dataset, China’s first 1 km, high-resolution, atmospheric humidity index product (https://data.tpdc.ac.cn/, accessed on 7 July 2025)). This dataset provides monthly records with a spatial resolution of 1 km, encompassing the Chinese mainland, from January 2003 to December 2020. It includes six humidity indicators, all with a coefficient of determination (R2) exceeding 0.96. The dataset is stored in annual files, and, to reduce storage size, all values are saved as 16-bit integers (Int16). In this study, specific humidity values were first corrected by dividing by 100 using a raster calculator in ArcGIS 10.6, then preprocessed through reprojection and masking operations, yielding a 1 km resolution specific humidity dataset, with values expressed in g/kg.

2.3. Grid Analysis

Given the difficulty in quantifying the feedback effects of wetland landscapes on climate, a quantitative study was conducted using grid analysis to initially explore the impact of wetland landscapes on climate [45]. Wetland distribution data at a 1 km resolution were aggregated in a 10 × 10 km window. The wetland area coverage of each grid was calculated and categorized into 0–100% with an interval of 5%, following which the wetland area coverage was coupled with 2m SH data for analysis.
The difference in the 2m SH between wetland and non-wetland is widely used to present the impact of wetlands on 2m SH. The window of wetland change rates was defined as the grid of pixels with wetland gain and wetland loss regardless of the year, after which the 2m SH change due to wetland change was calculated as follows:
C o u n t = C o u n t 2 ( w e t l a n d ) C o u n t 1 ( w e t l a n d )
L A I = L A I 2 ( w e t l a n d ) L A I 1 ( w e t l a n d )
2 m   S H = 2 m   S H 2 ( w e t l a n d ) 2 m   S H 1 ( w e t l a n d )
where C o u n t 1 ( w e t l a n d ) is the number of wetland pixels in each window in the first year, C o u n t 2 ( w e t l a n d ) is the number of wetland pixels in each window in the second year, L A I 1 ( w e t l a n d ) is the mean wetland vegetation LAI in each window in the first year, L A I 2 ( w e t l a n d ) is the mean wetland vegetation LAI in each window in the second year, 2 m   S H 1 ( w e t l a n d ) is the mean 2m SH of the wetland in the first year within a window of wetland changes, and 2 m   S H 2 ( w e t l a n d ) is the mean 2m SH of the wetland in the second year.
To more specifically quantify the impact of wetland area change on the 2m SH and minimize the influence of interannual background climate variability, two new metrics were defined in this study—the Wetland Area Change Humidity Index (WACHI) and the Wetland LAI Change Humidity Index (WLAICHI). The formulas used for calculating these indexes were as follows [23]:
W A C H I = 2 m   S H C o u n t
W L A I C H I = 2 m   S H L A I
where W A C H I is the change in 2m SH for every 1 km2 of wetland altered (as it is a 10 × 10 km window, each change of one pixel is equivalent to 1 km2), and W L A I C H I is the change in 2m SH due wetland LAI alteration.

2.4. Latitudinal Analysis

In this study, Ordinary Least Squares (OLS) regression, a traditional and straightforward trend analysis method, was employed to examine how the effects of changes in wetland area and LAI on humidity vary with latitude. Compared to more complex models, OLS is computationally efficient and well-suited for exploratory analysis along a single spatial gradient. Using IBM SPSS Statistics 25, regression models were constructed to assess the relationships between wetland coverage, change rate, and the mean values of surface temperature and specific humidity, as well as to evaluate the linear relationship between humidity indices and latitude. Regression equations were established, with R2 used to measure goodness-of-fit and p-values employed to test the statistical significance of correlations. Given the large volume of data, average values were first computed at 1° N latitudinal intervals, and linear regression analyses were then performed across these latitudinal bands. The formula used for calculation was as follows:
Y = a X + b
where X is the independent variable, representing different latitudes within the CHRB, and Y is the dependent variable, referring to various humidity indices. The optimal parameters a and b were estimated by minimizing the sum of squared residuals. The fitted parameter a (i.e., the slope) reflects the direction of the trend of the humidity index driven by wetland changes.

3. Results

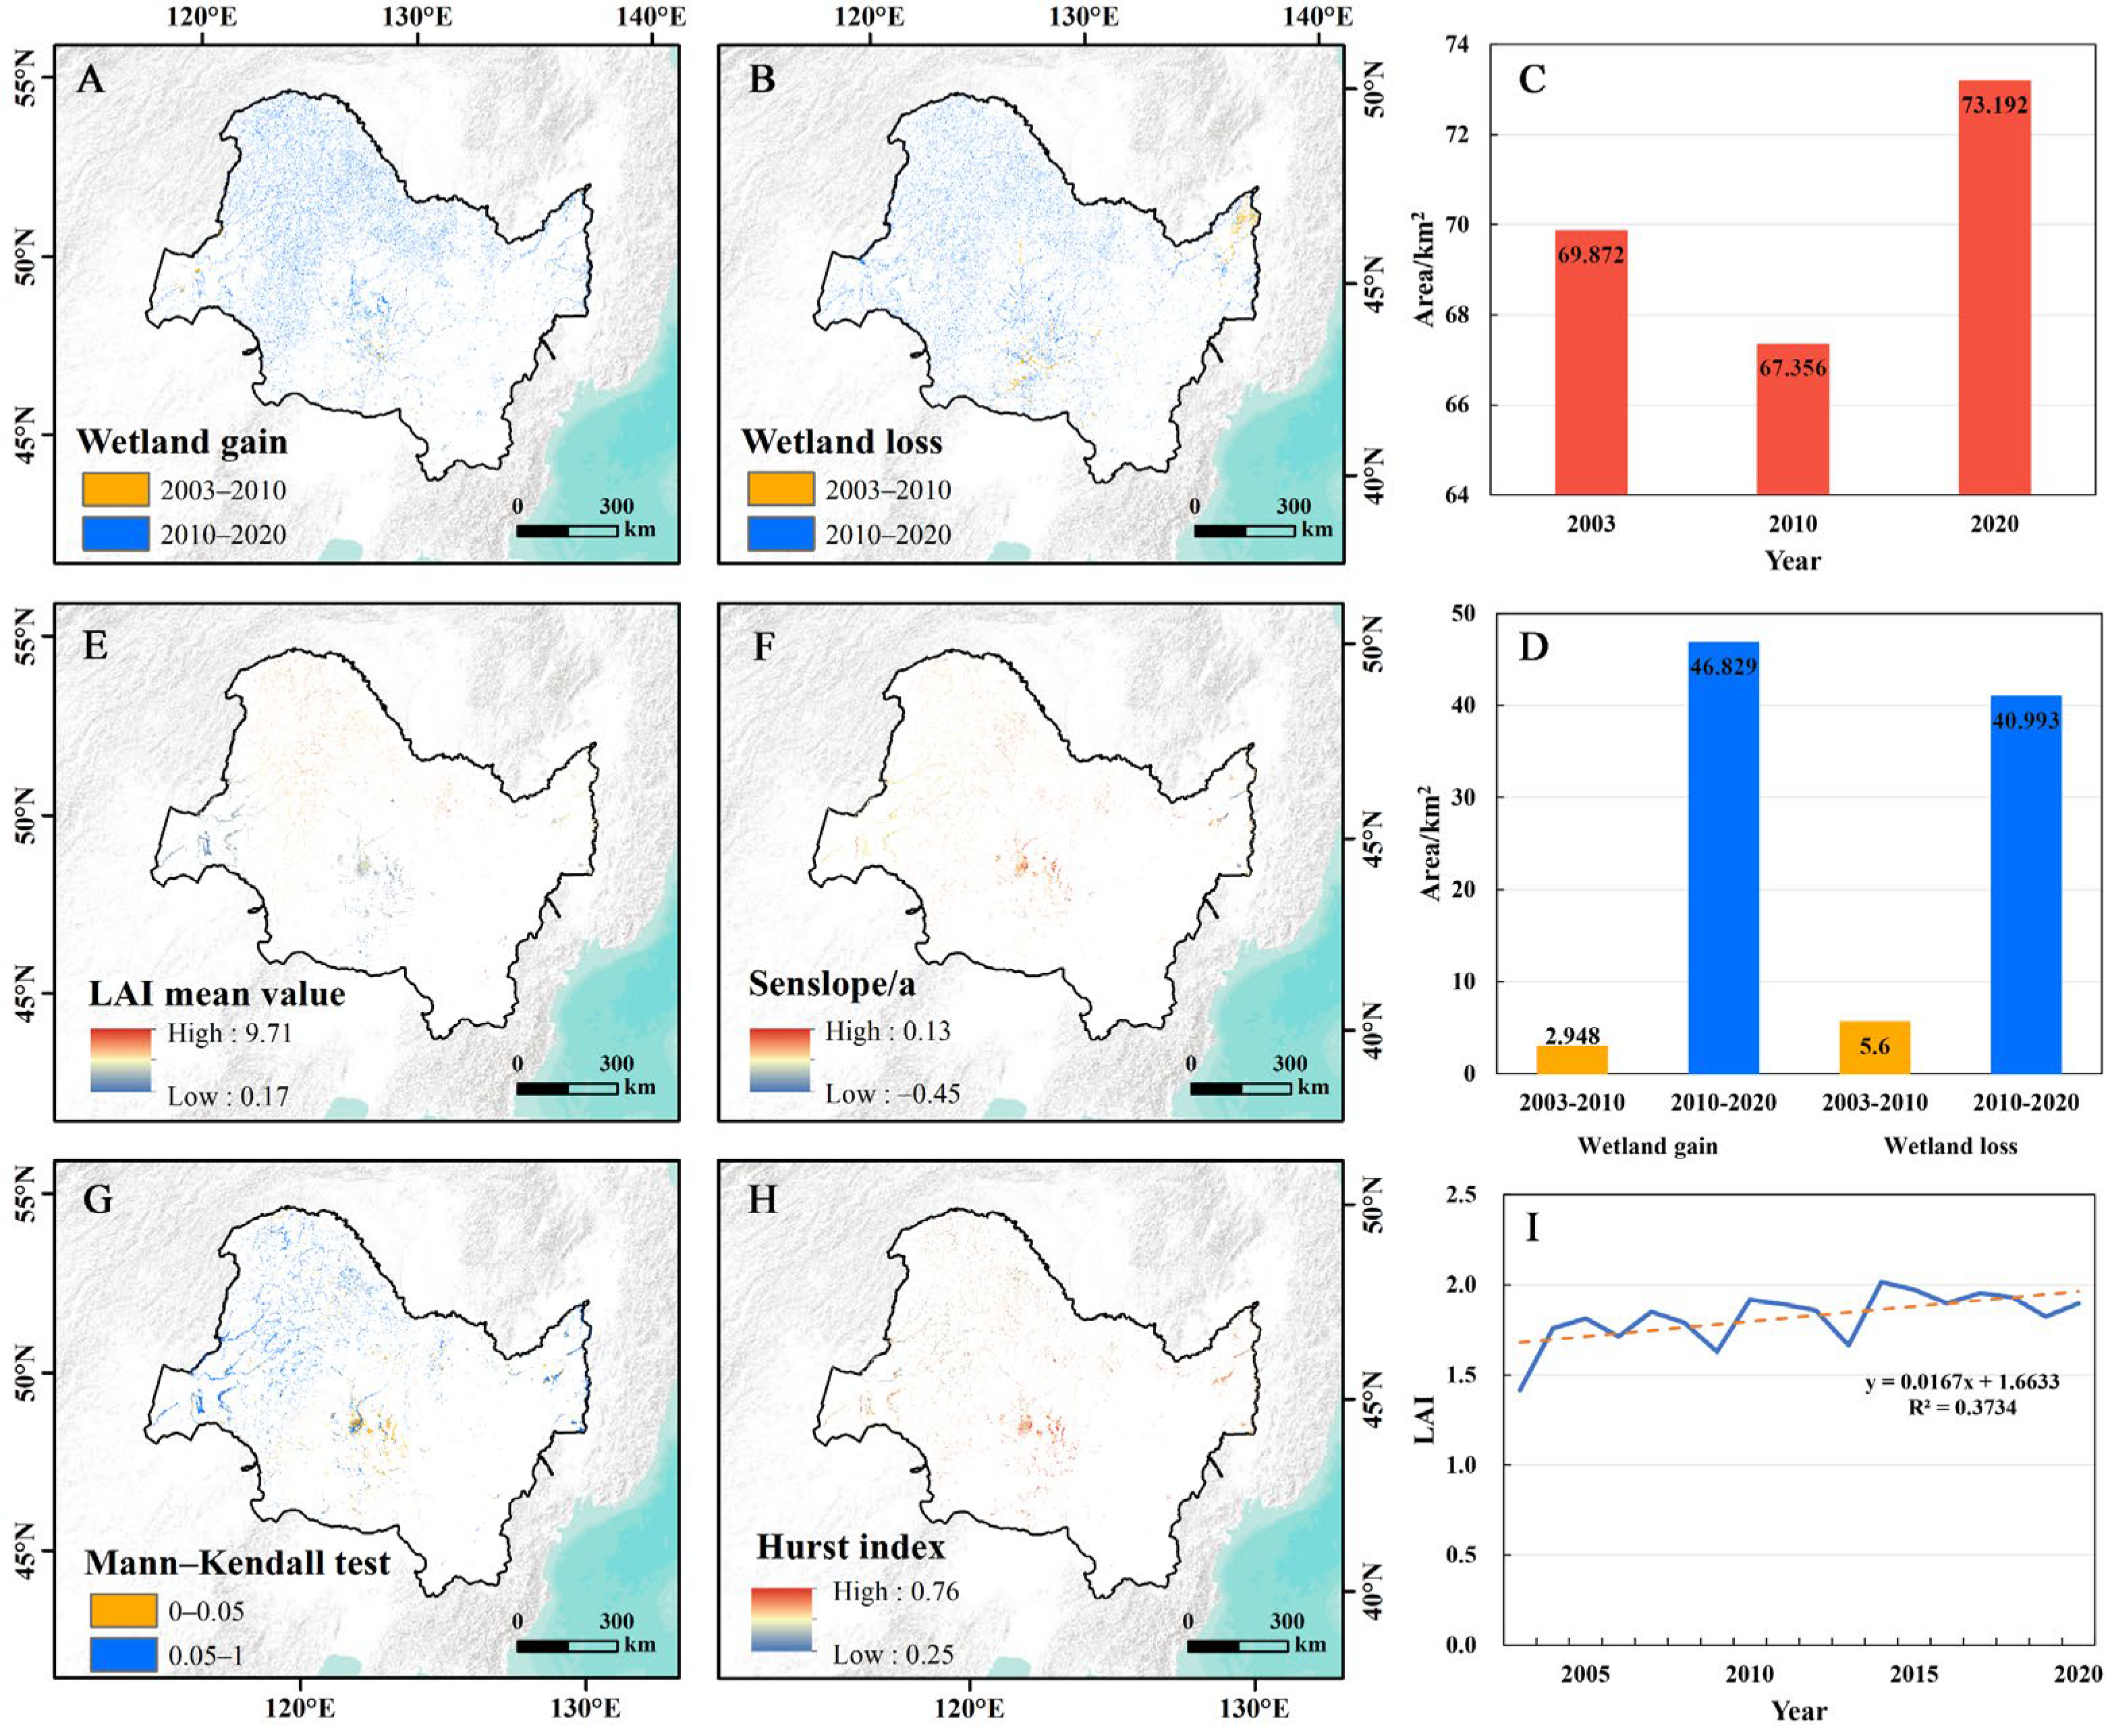
3.1. Spatiotemporal Changes in Wetland Area and LAI in the CHRB

From 2003 to 2010, the wetland area in the CHRB decreased from 69.872 to 67.356 km2, but it increased to 73.192 km2 by 2020. Between 2003 and 2010, the magnitude of wetland gain and loss was relatively small, with significant wetland loss observed in the Songnen Plain and Sanjiang Plain. This decline was mainly due to human activities, such as agricultural expansion and urbanization, which led to wetland reduction. Between 2010 and 2020, wetland area changes were more pronounced, yet gains and losses offset each other in most regions, resulting in a net increase in wetland area (Figure 2A,B). This increase was primarily driven by growing attention to wetlands and the implementation of various wetland protection and restoration policies.
Spatially, the growing season LAI of wetlands in the CHRB was generally lower in the southern part of the study area and higher in the north, with a 20-year mean LAI of 1.86 (Figure 2E). The annual mean wetland LAI showed a fluctuating upward trend, with an average Sen’s slope of 0.015 per year. The LAI exhibited a slight increasing trend overall, though a notable decrease was detected in the Sanjiang Plain. Most of the increasing trends in the Songnen Plain passed the Mann–Kendall significance test. Additionally, the average Hurst index from 2003 to 2020 was 0.55, and over 71% of the pixels had a Hurst index value greater than 0.5, indicative of a persistent pattern in LAI changes.
Seasonally, the LAI of wetland vegetation generally showed an increasing trend throughout the four seasons, with 22%, 21%, and 16% of wetlands experiencing significant increases in the LAI during spring, summer, and autumn, respectively (Figure 3). In summer, any significant increase in the LAI was mainly concentrated in the Songnen Plain. The proportion of wetland with significantly decreasing LAI in any season did not exceed 5% in the CHRB. The seasonal mean Hurst indices of wetland LAI were 0.54 in spring, 0.55 in summer, 0.53 in autumn, and 0.50 in winter. Over 70% of the wetland had Hurst index values greater than 0.5 in spring, summer, and autumn, while in winter, only 50% of the wetland exceeded this threshold (Figure 4). It is likely influenced by low temperatures and hydrological factors in winter, which reduce the persistence of the time series.

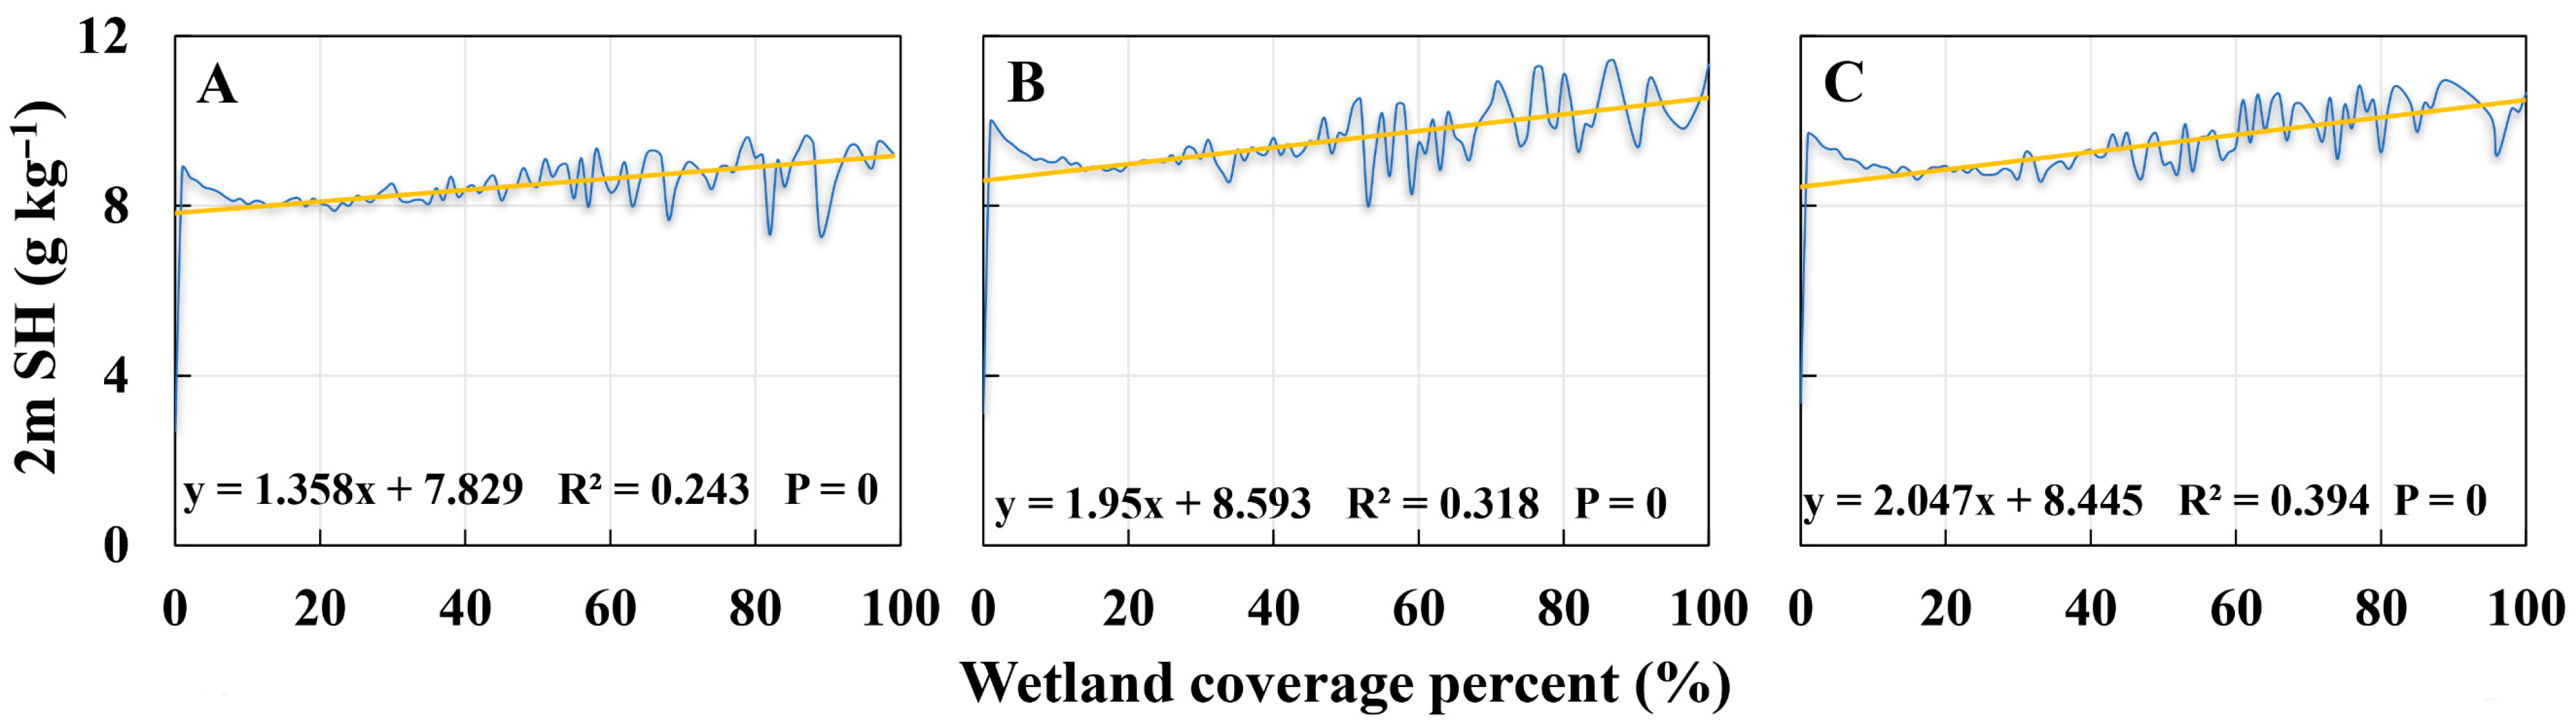
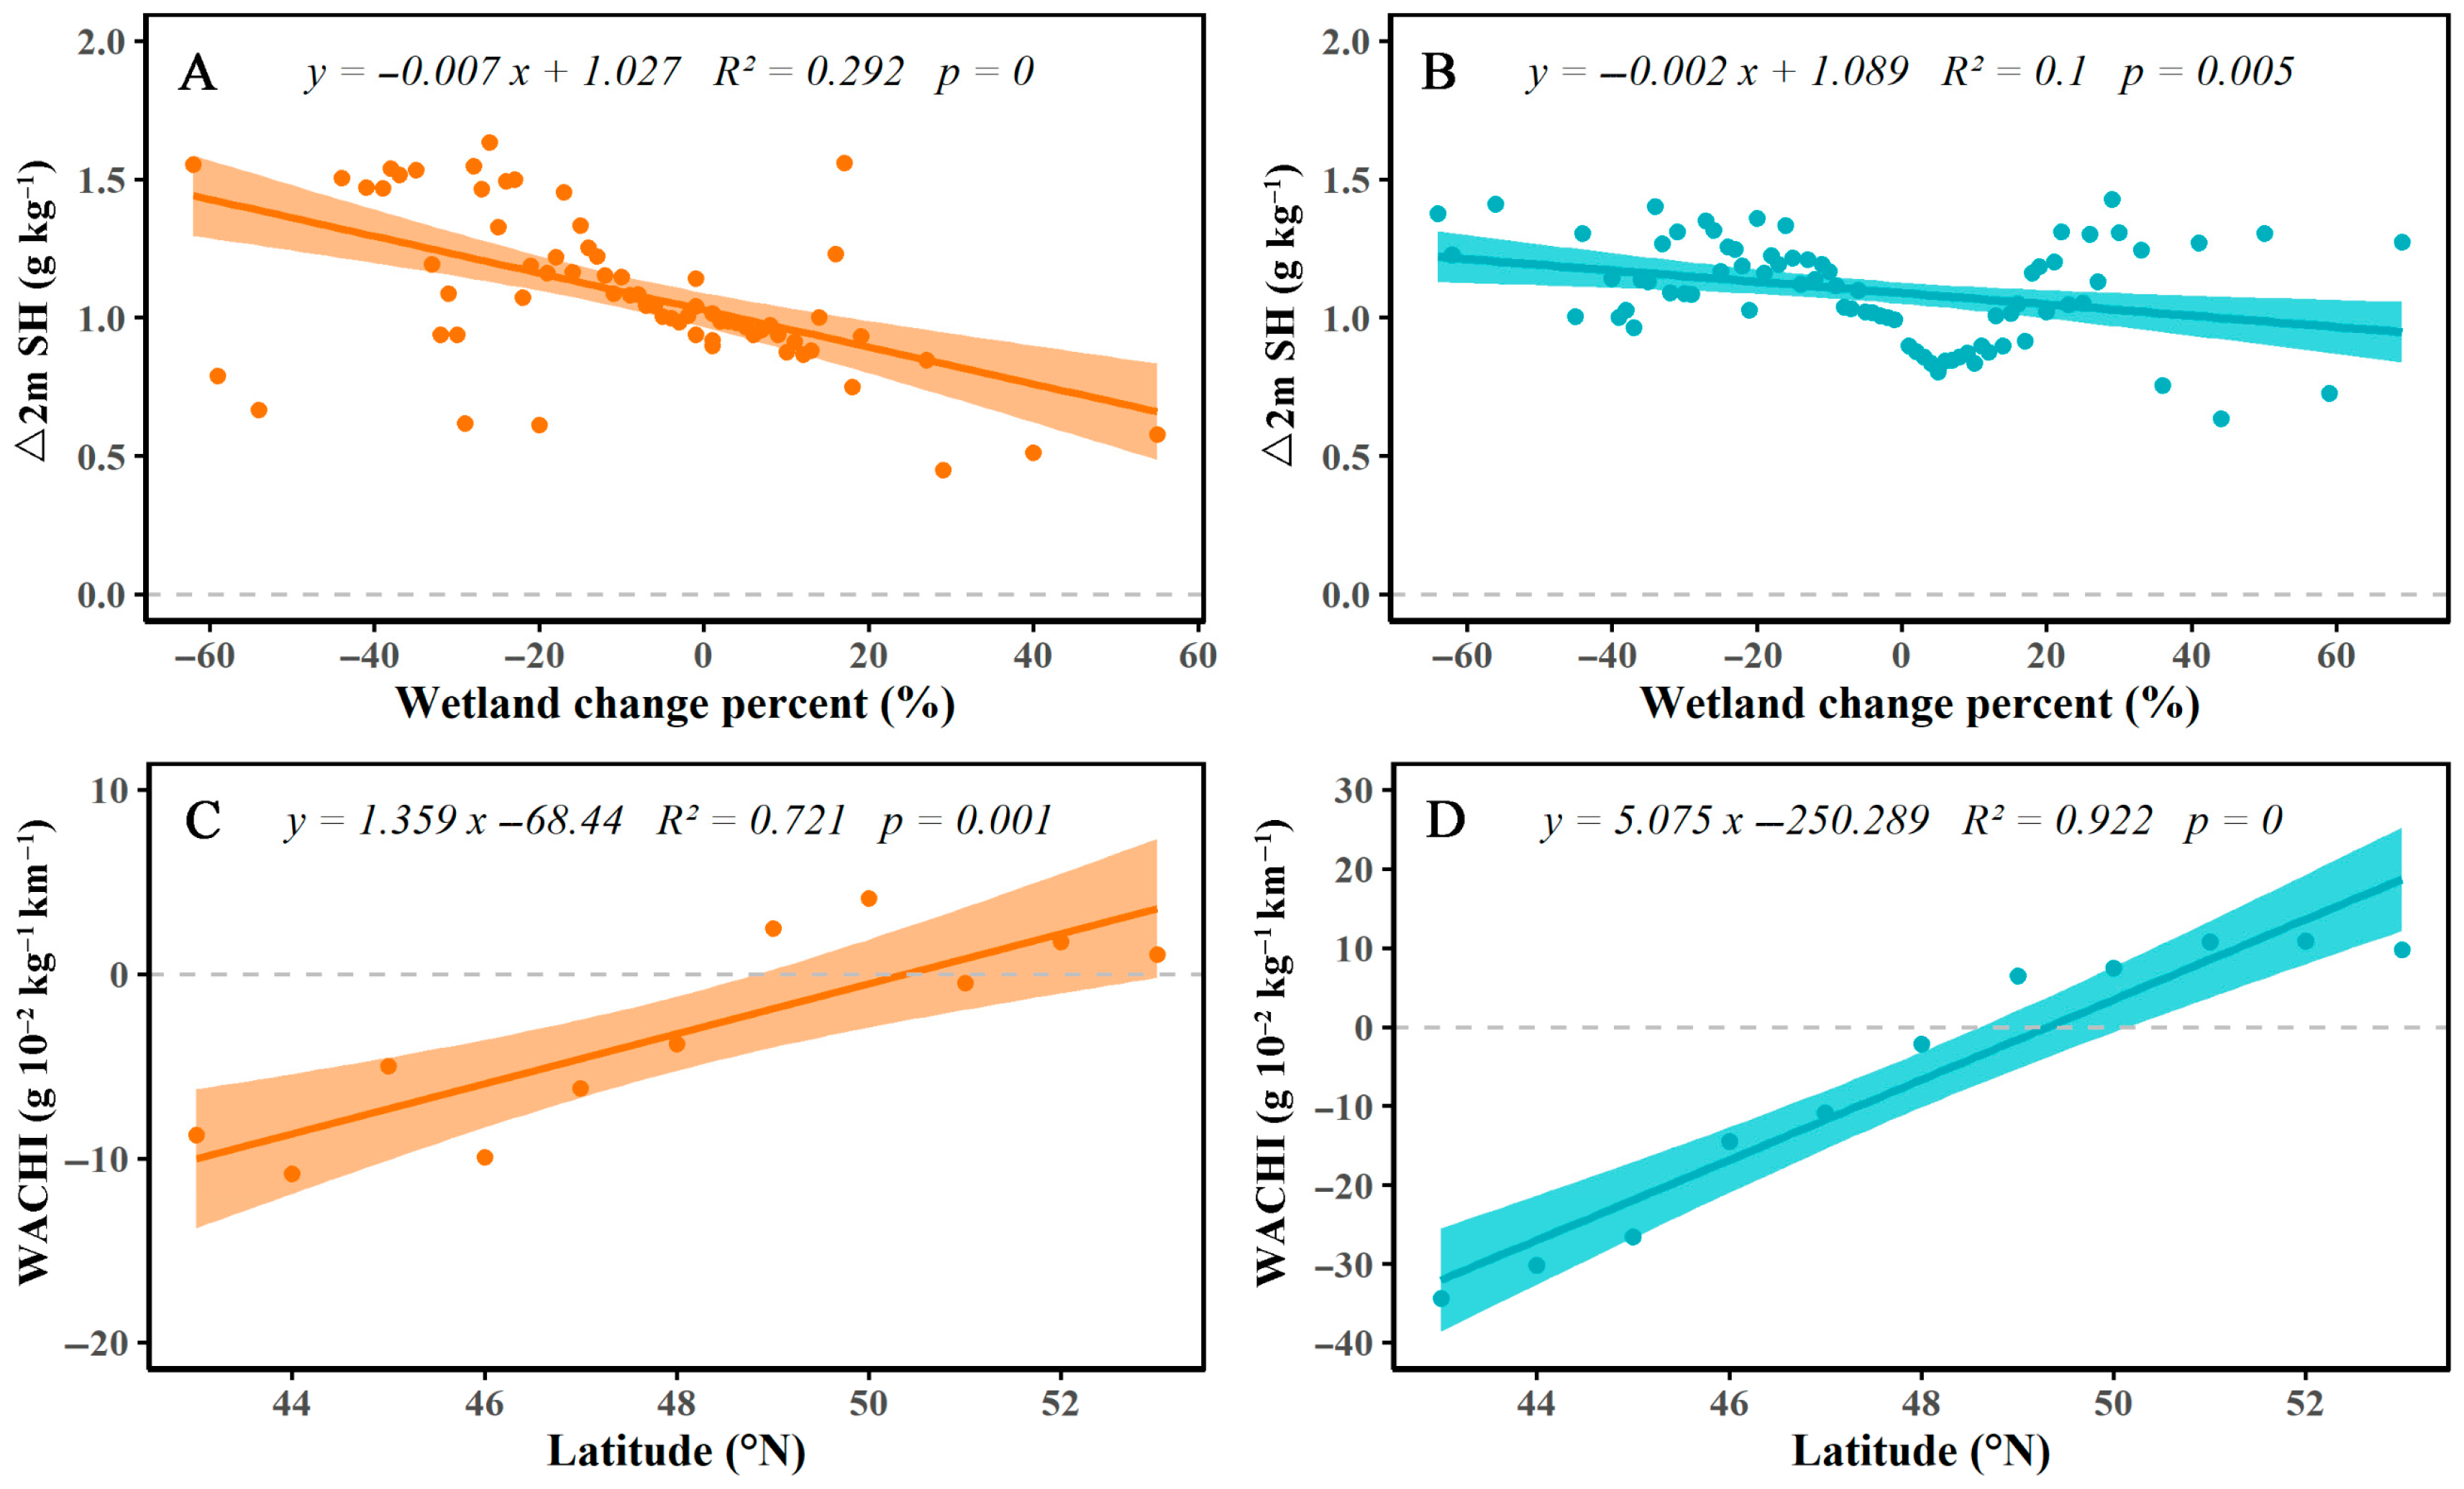
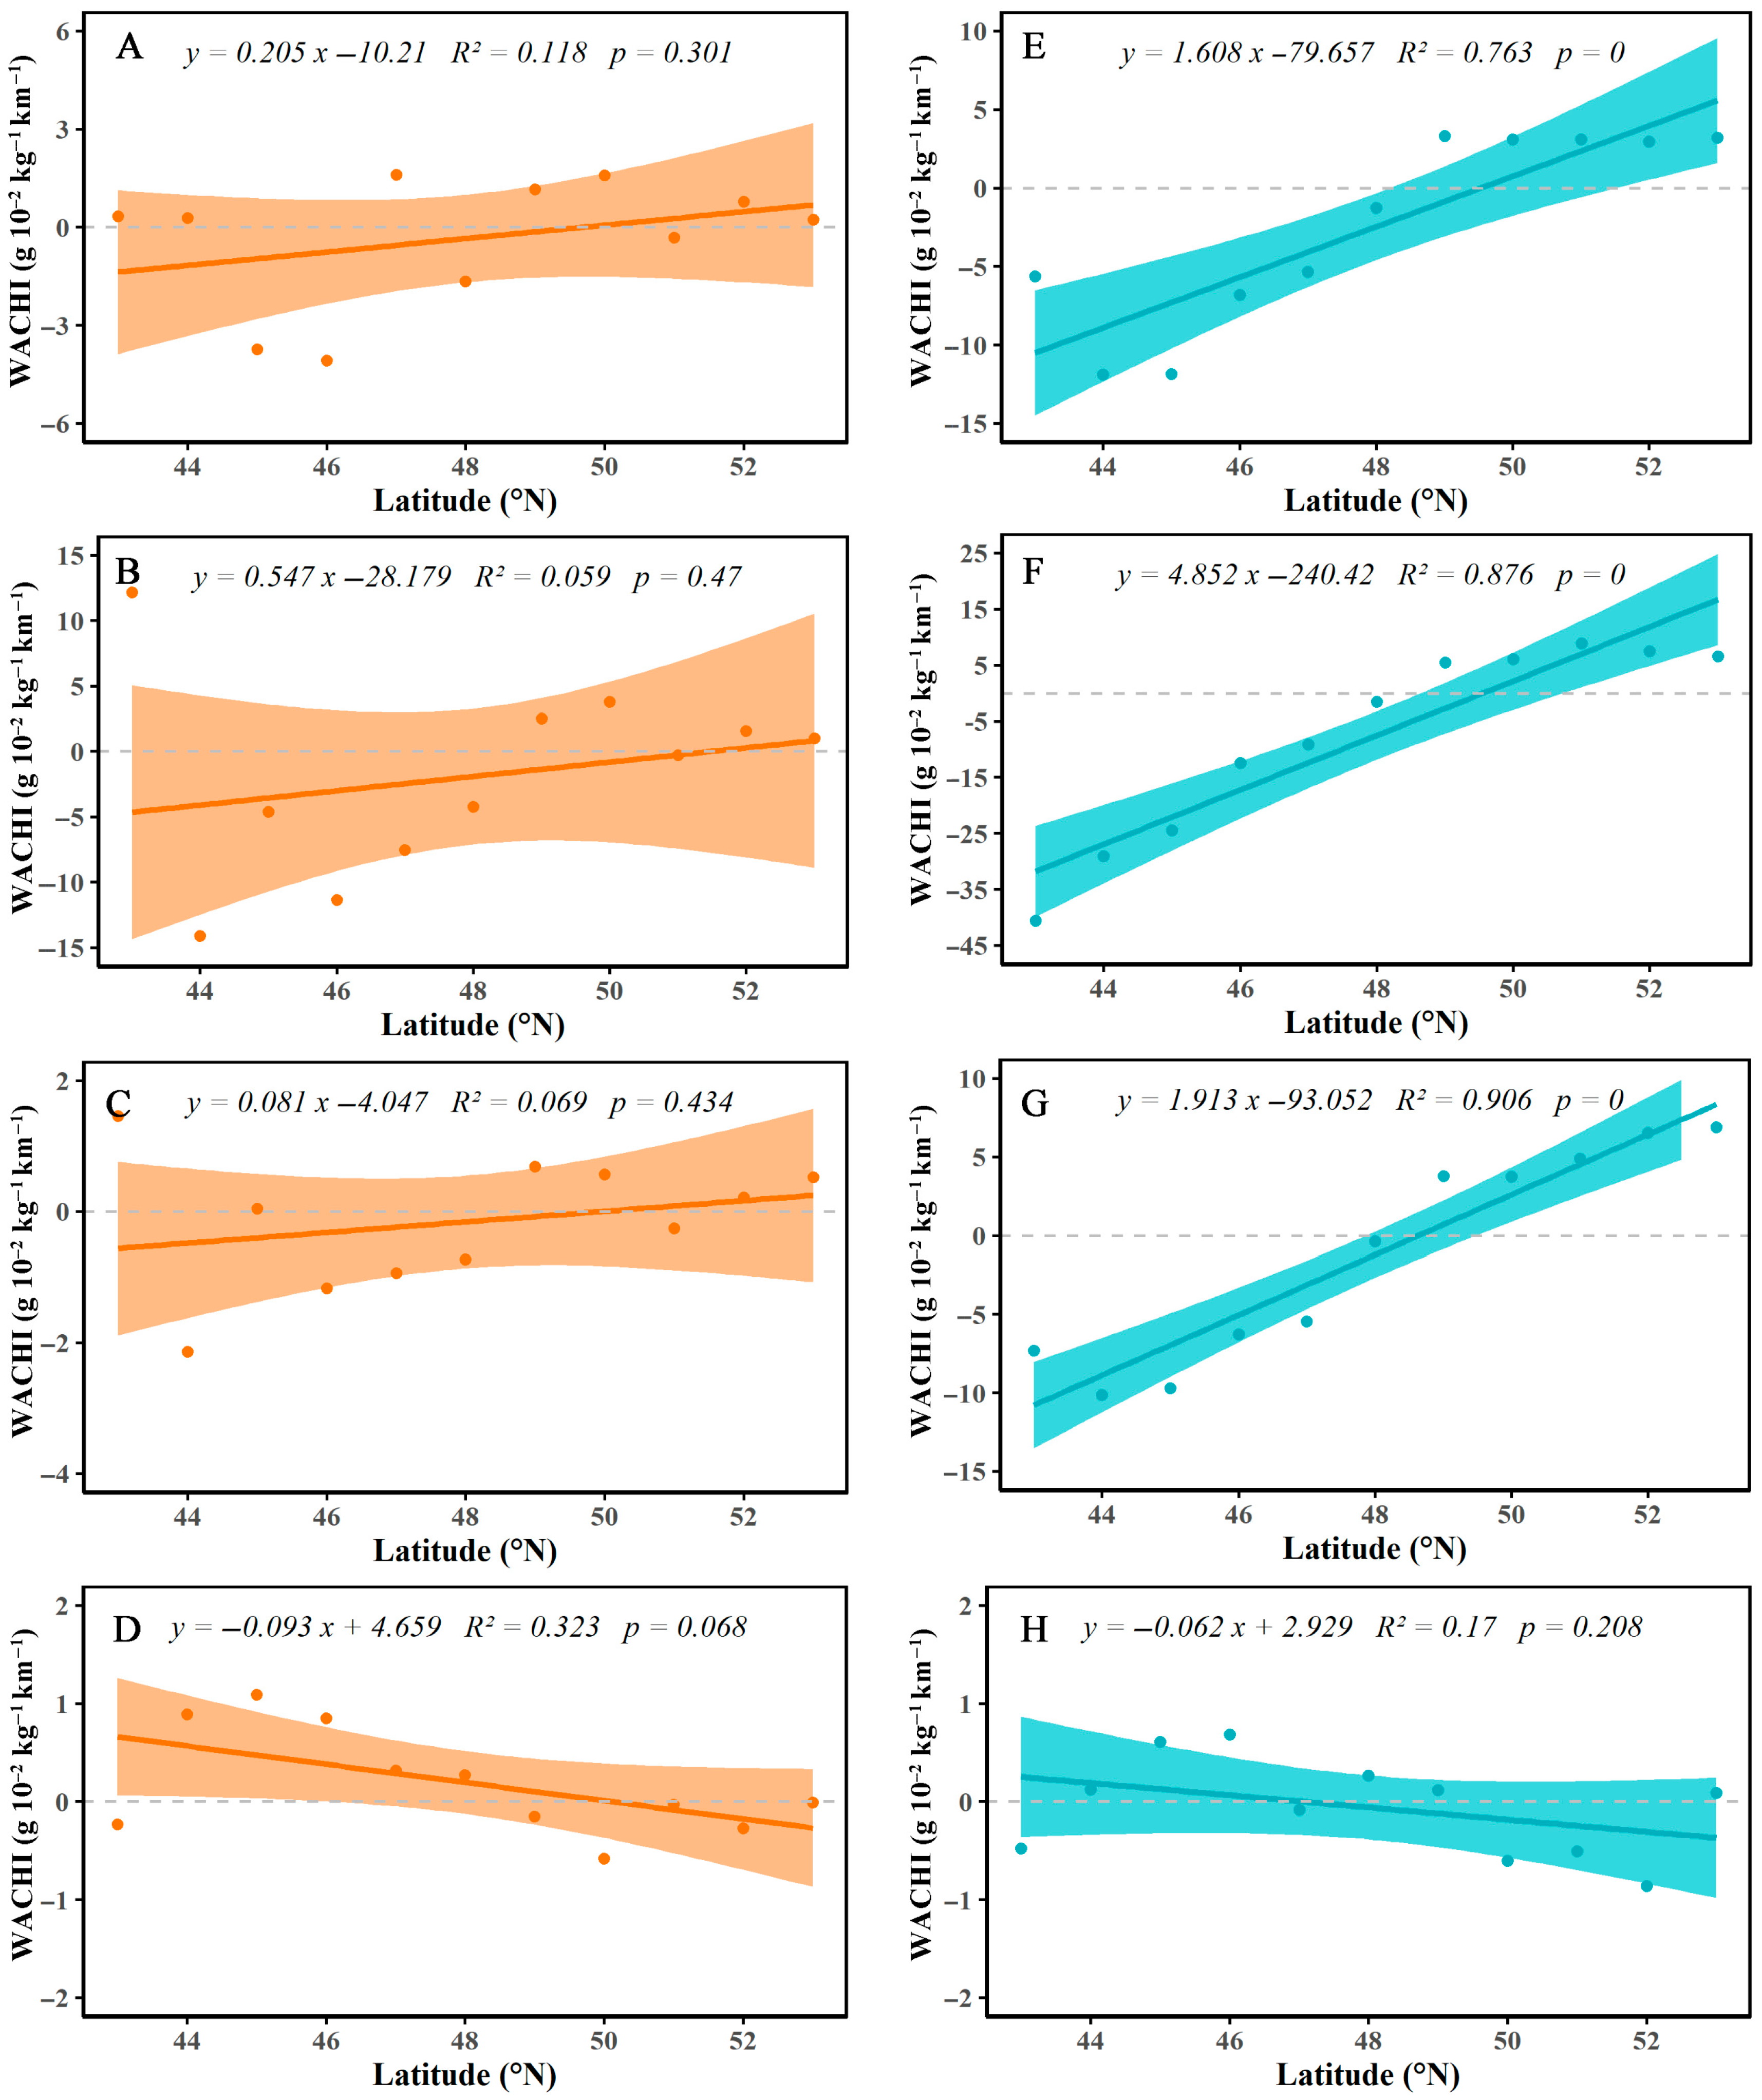
3.2. Relationship Between Wetland Area Change and 2m SH

During the growing season, wetlands within the CHRB exhibited a clear moistening effect. When wetland coverage was below 20%, the moistening effect was relatively weak. However, once coverage exceeded 20%, the moistening effect progressively strengthened, showing a fluctuating but overall increasing trend. When wetland coverage surpassed 60%, the moistening effect stabilized into a relatively steady fluctuating state (Figure 5). The 2m SH increased with increasing wetland coverage during spring, summer, and autumn but decreased in winter (Figure 6). Nevertheless, even in winter, the 2m SH in wetland areas still exceeded that in non-wetland areas by more than 0.2 g/kg.
The influence of wetland change rates on 2m SH during the growing season was generally consistent between 2003 and 2010 and between 2010 and 2020. A significant negative correlation was observed between the change in 2m SH and wetland change rates, although the differences in WACHI and latitude remained positive (Figure 7). Meanwhile, the WACHI increased with increasing latitude, shifting from negative to positive values, suggesting that the drying effect associated with wetland area changes was significantly weaker at higher latitudes and was ultimately reversed to a moistening effect.
During spring, summer, and autumn, the WACHI showed an increasing trend with increasing latitude, gradually shifting from negative to positive values (Figure 8). This indicated that in lower-latitude regions, wetland expansion did not produce a pronounced humidifying effect, even reducing 2m SH. However, as latitude increased, the drying effect associated with wetland area changes weakened and eventually transitioned into a humidifying effect, with the turning point occurring at approximately 50°N. The significance of this trend varied across periods. From 2010 to 2020, the WACHI significantly increased with increasing latitude in spring, summer, and autumn. In contrast, during winter in both the 2003–2010 and the 2010–2020 periods, the WACHI consistently decreased with increasing latitude, switching from positive to negative values.

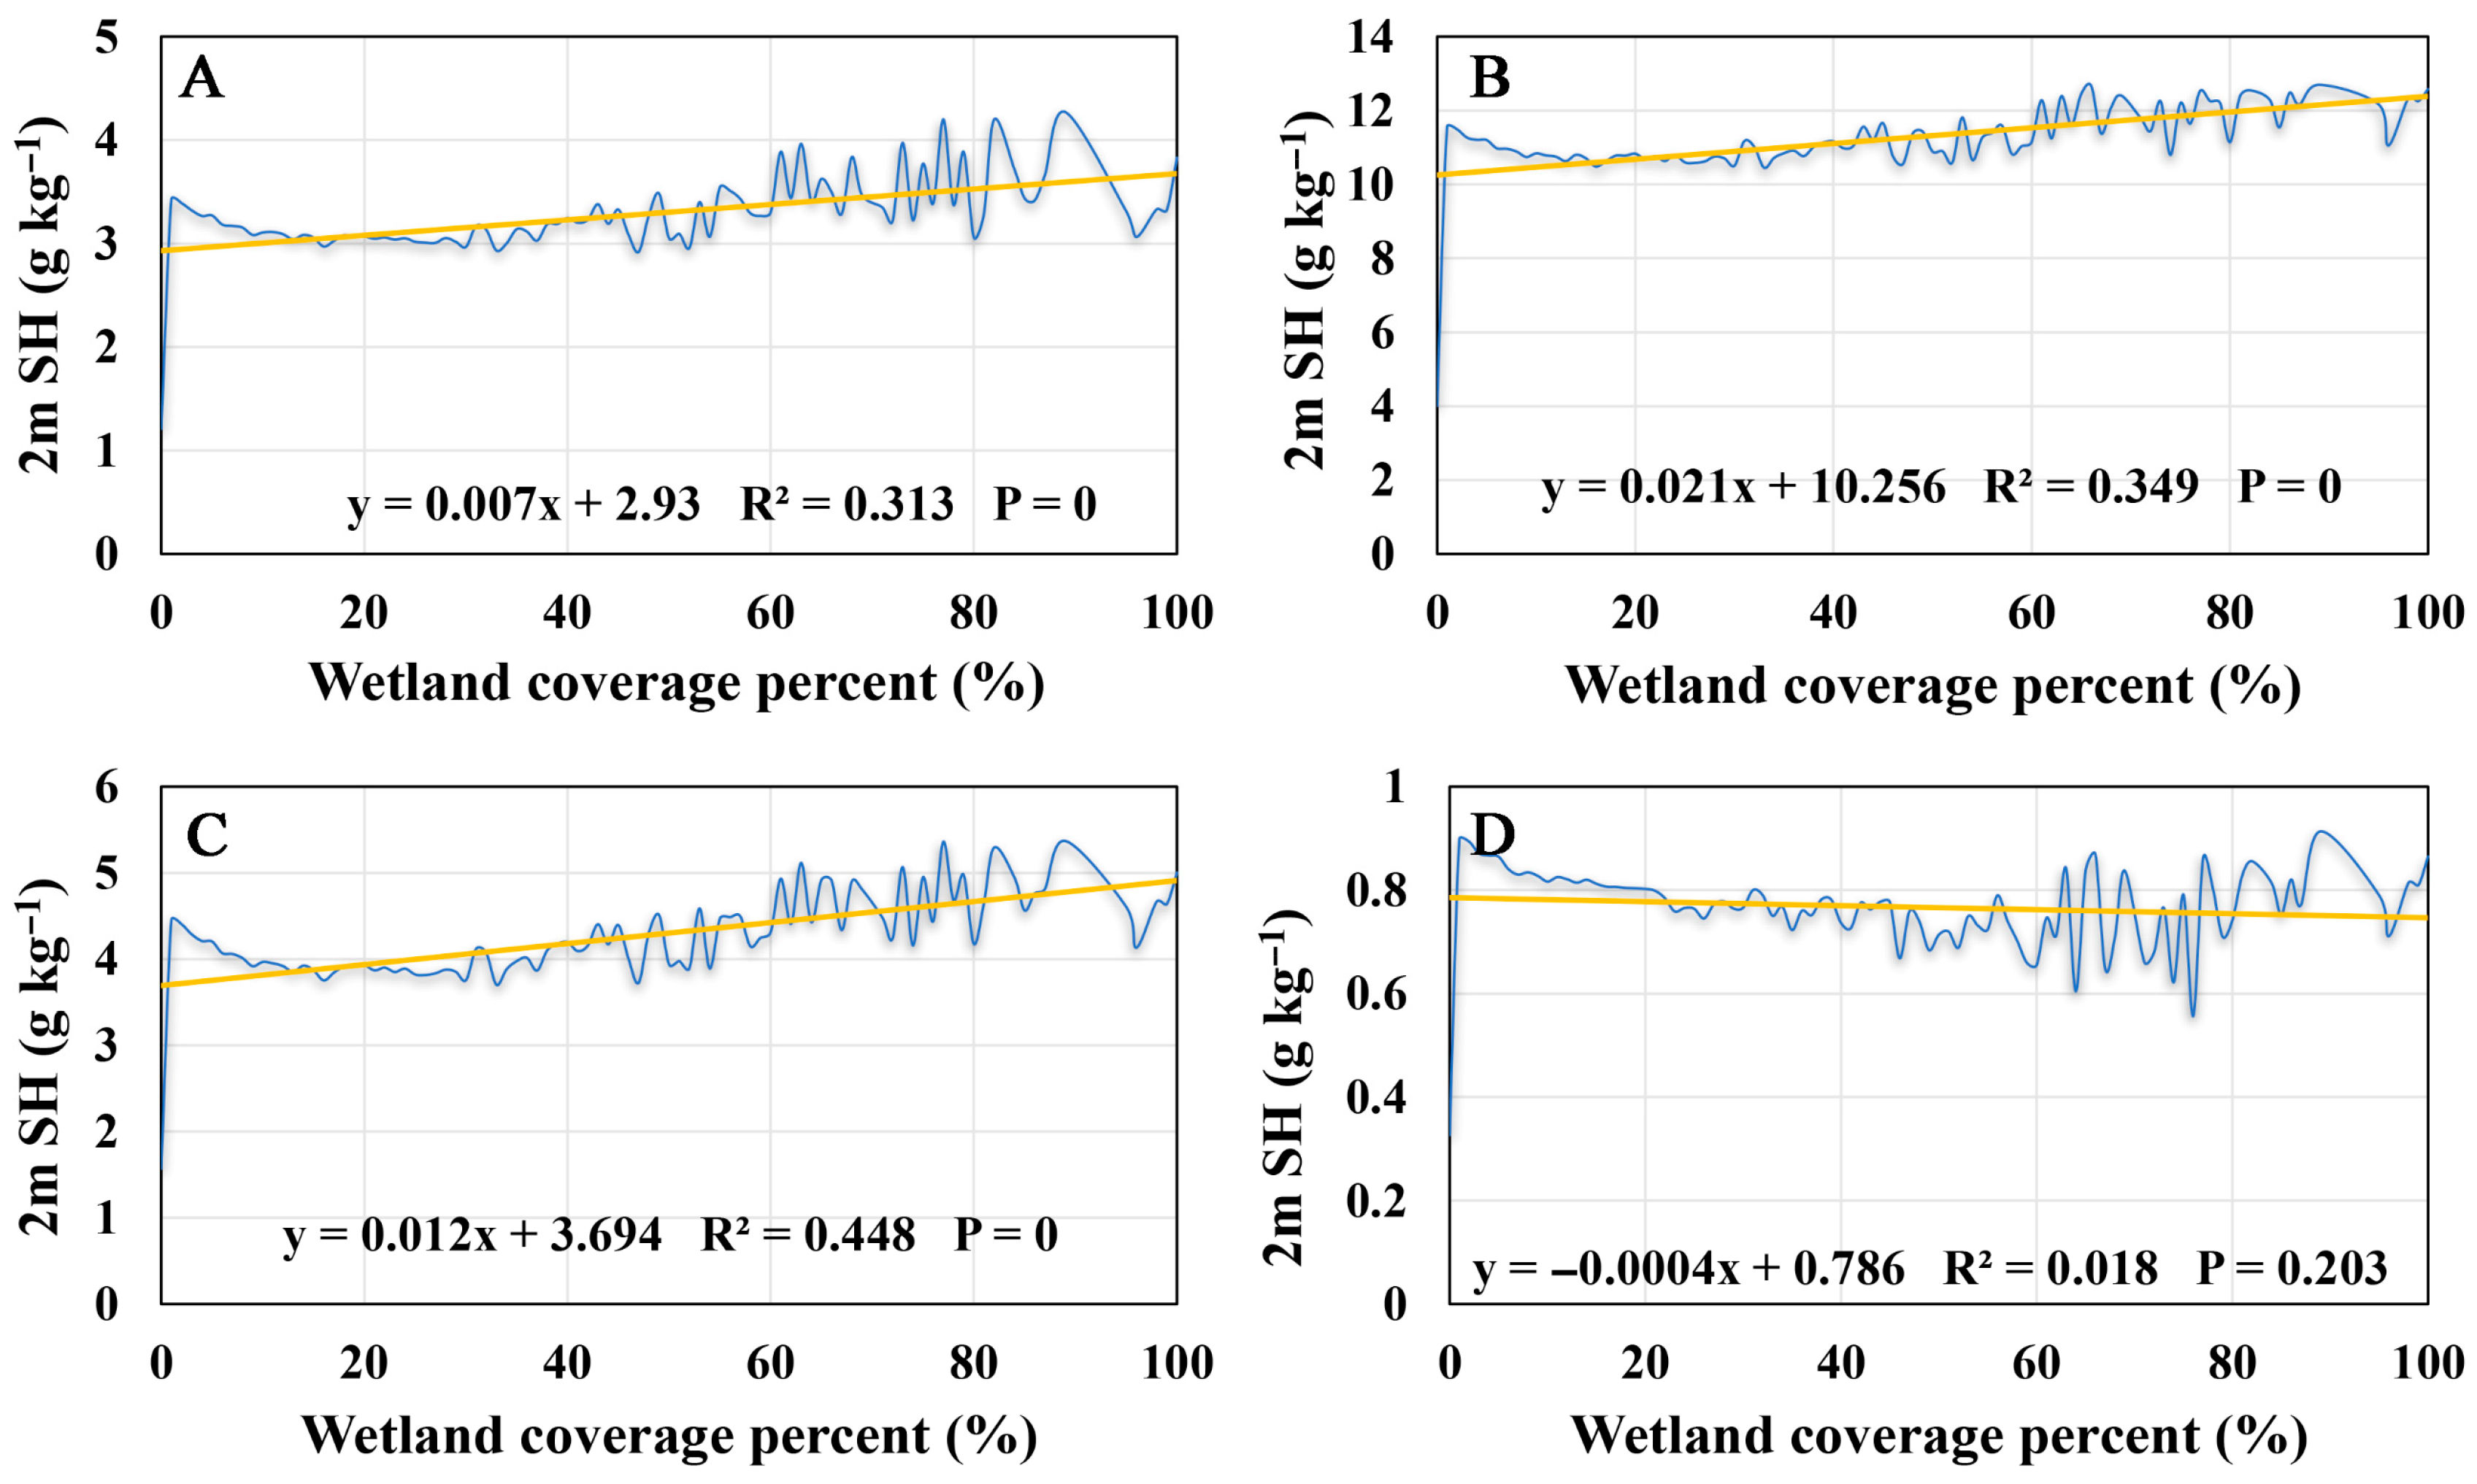
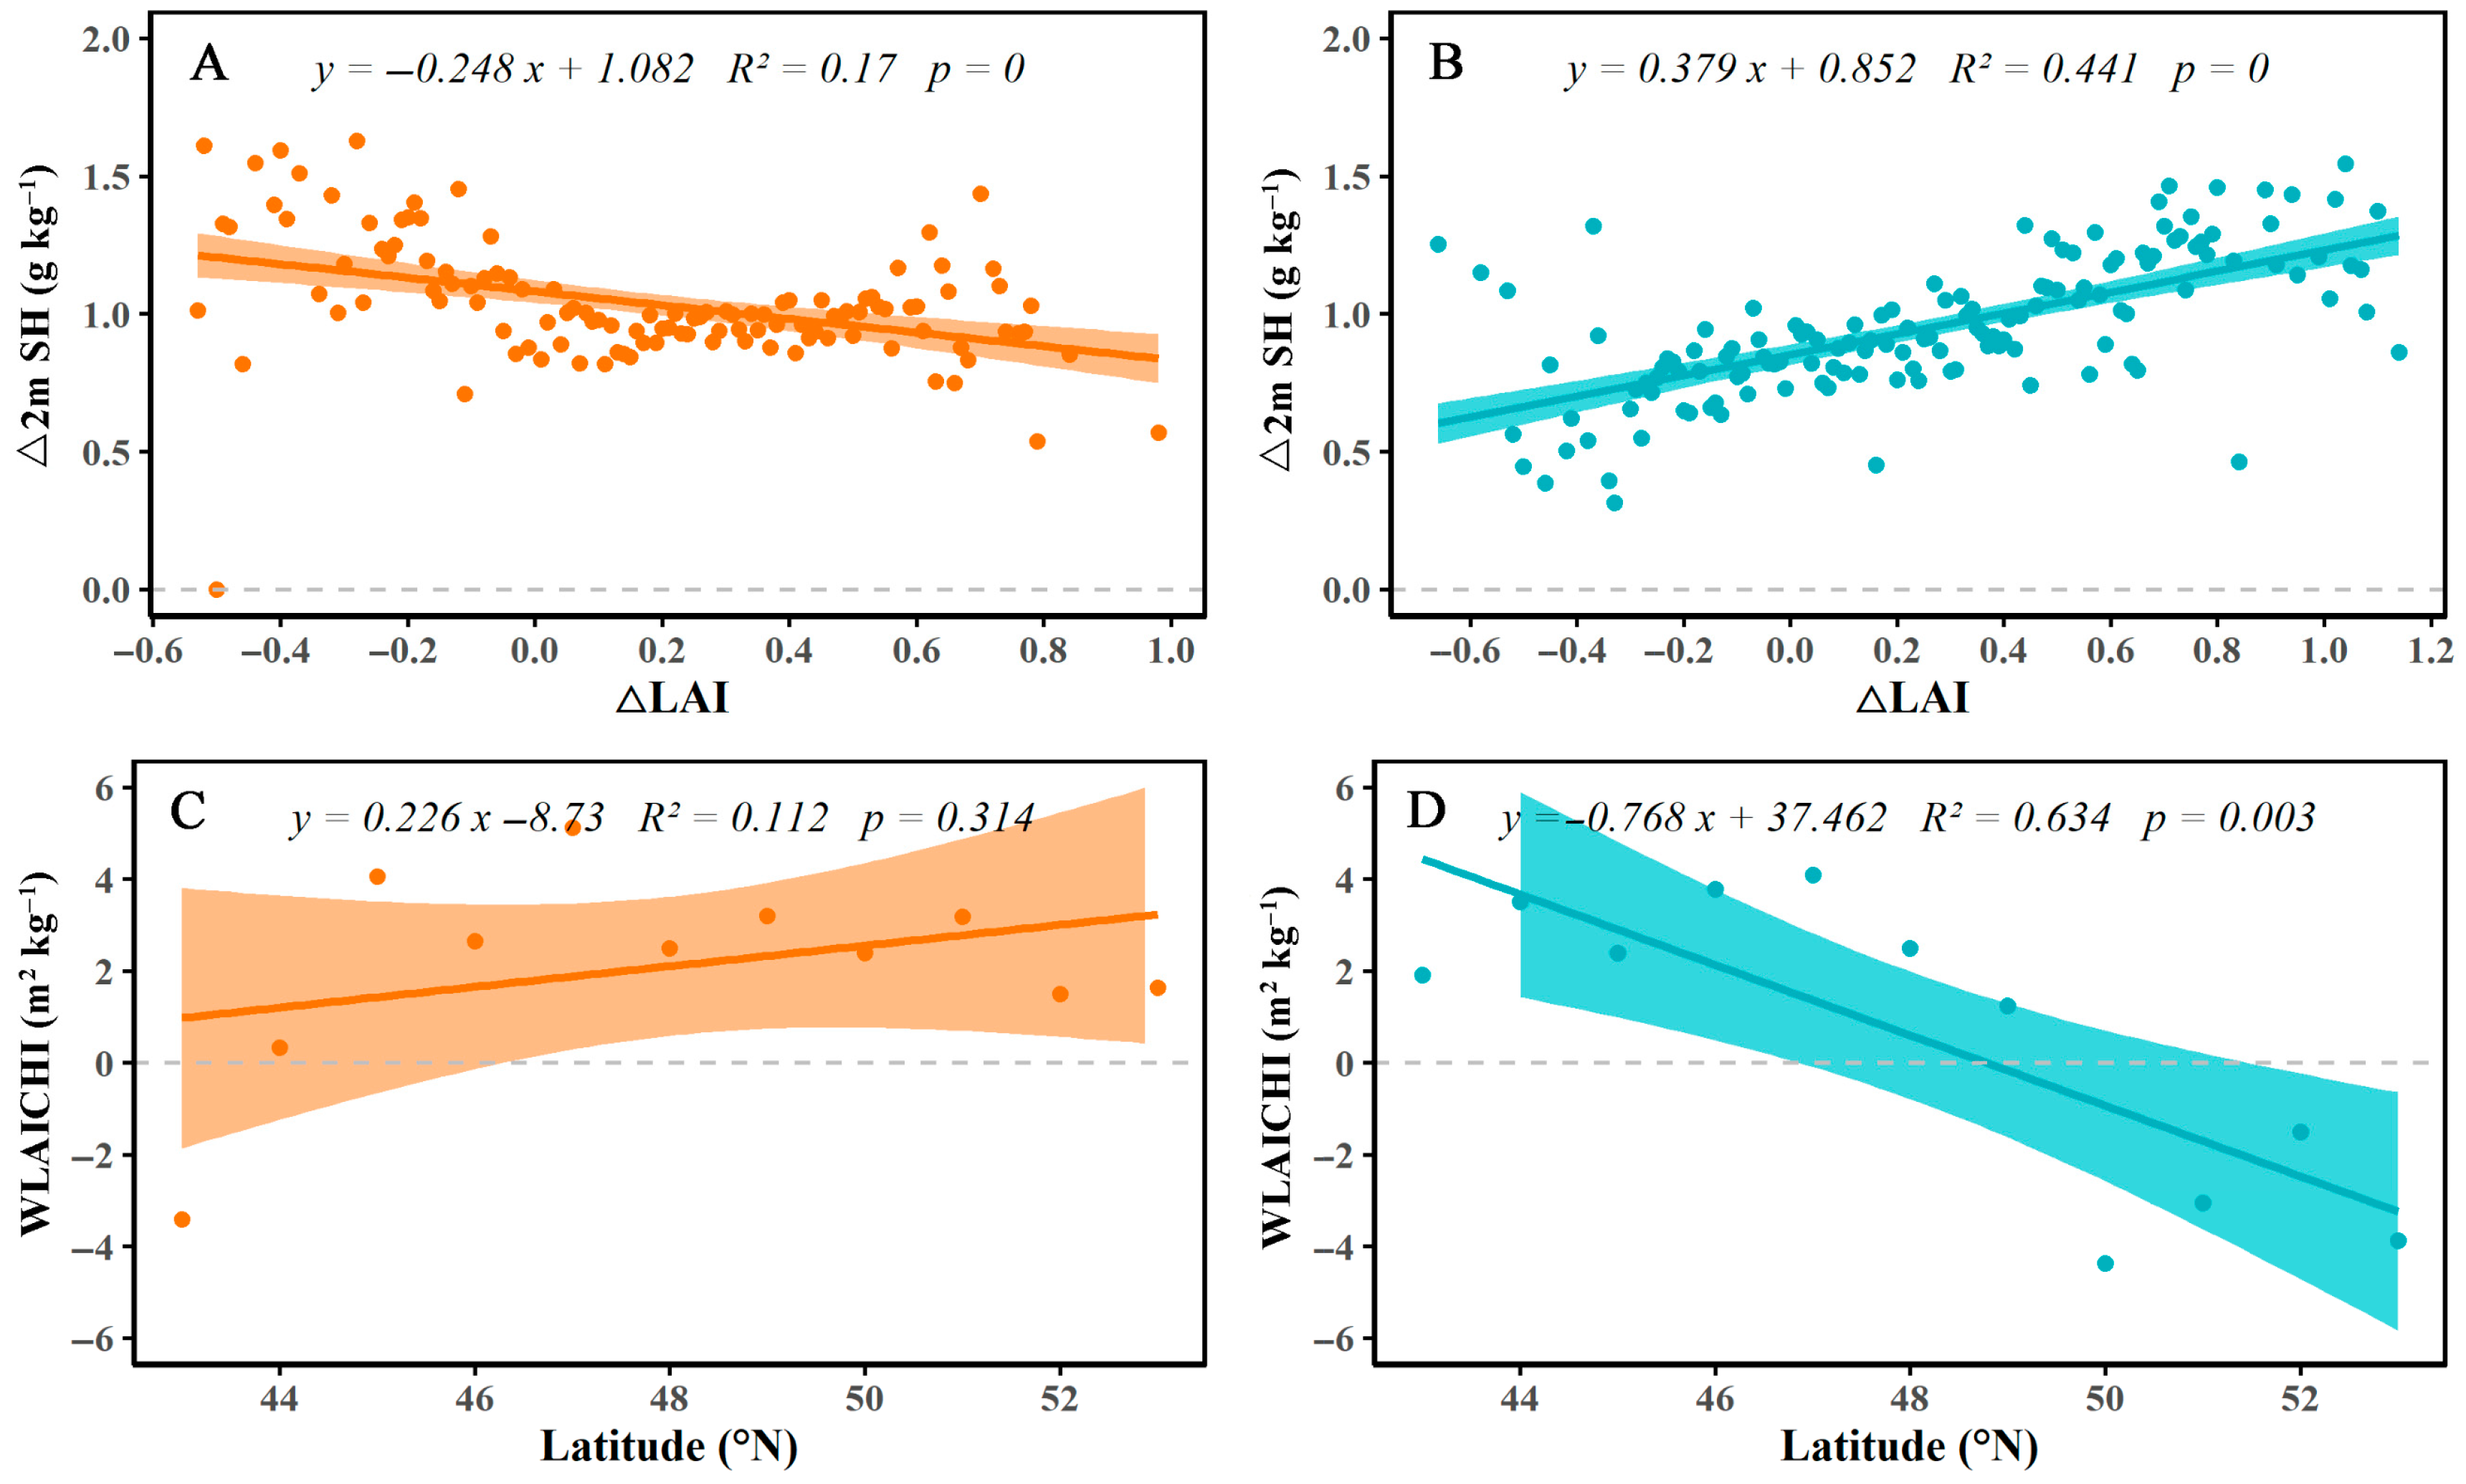
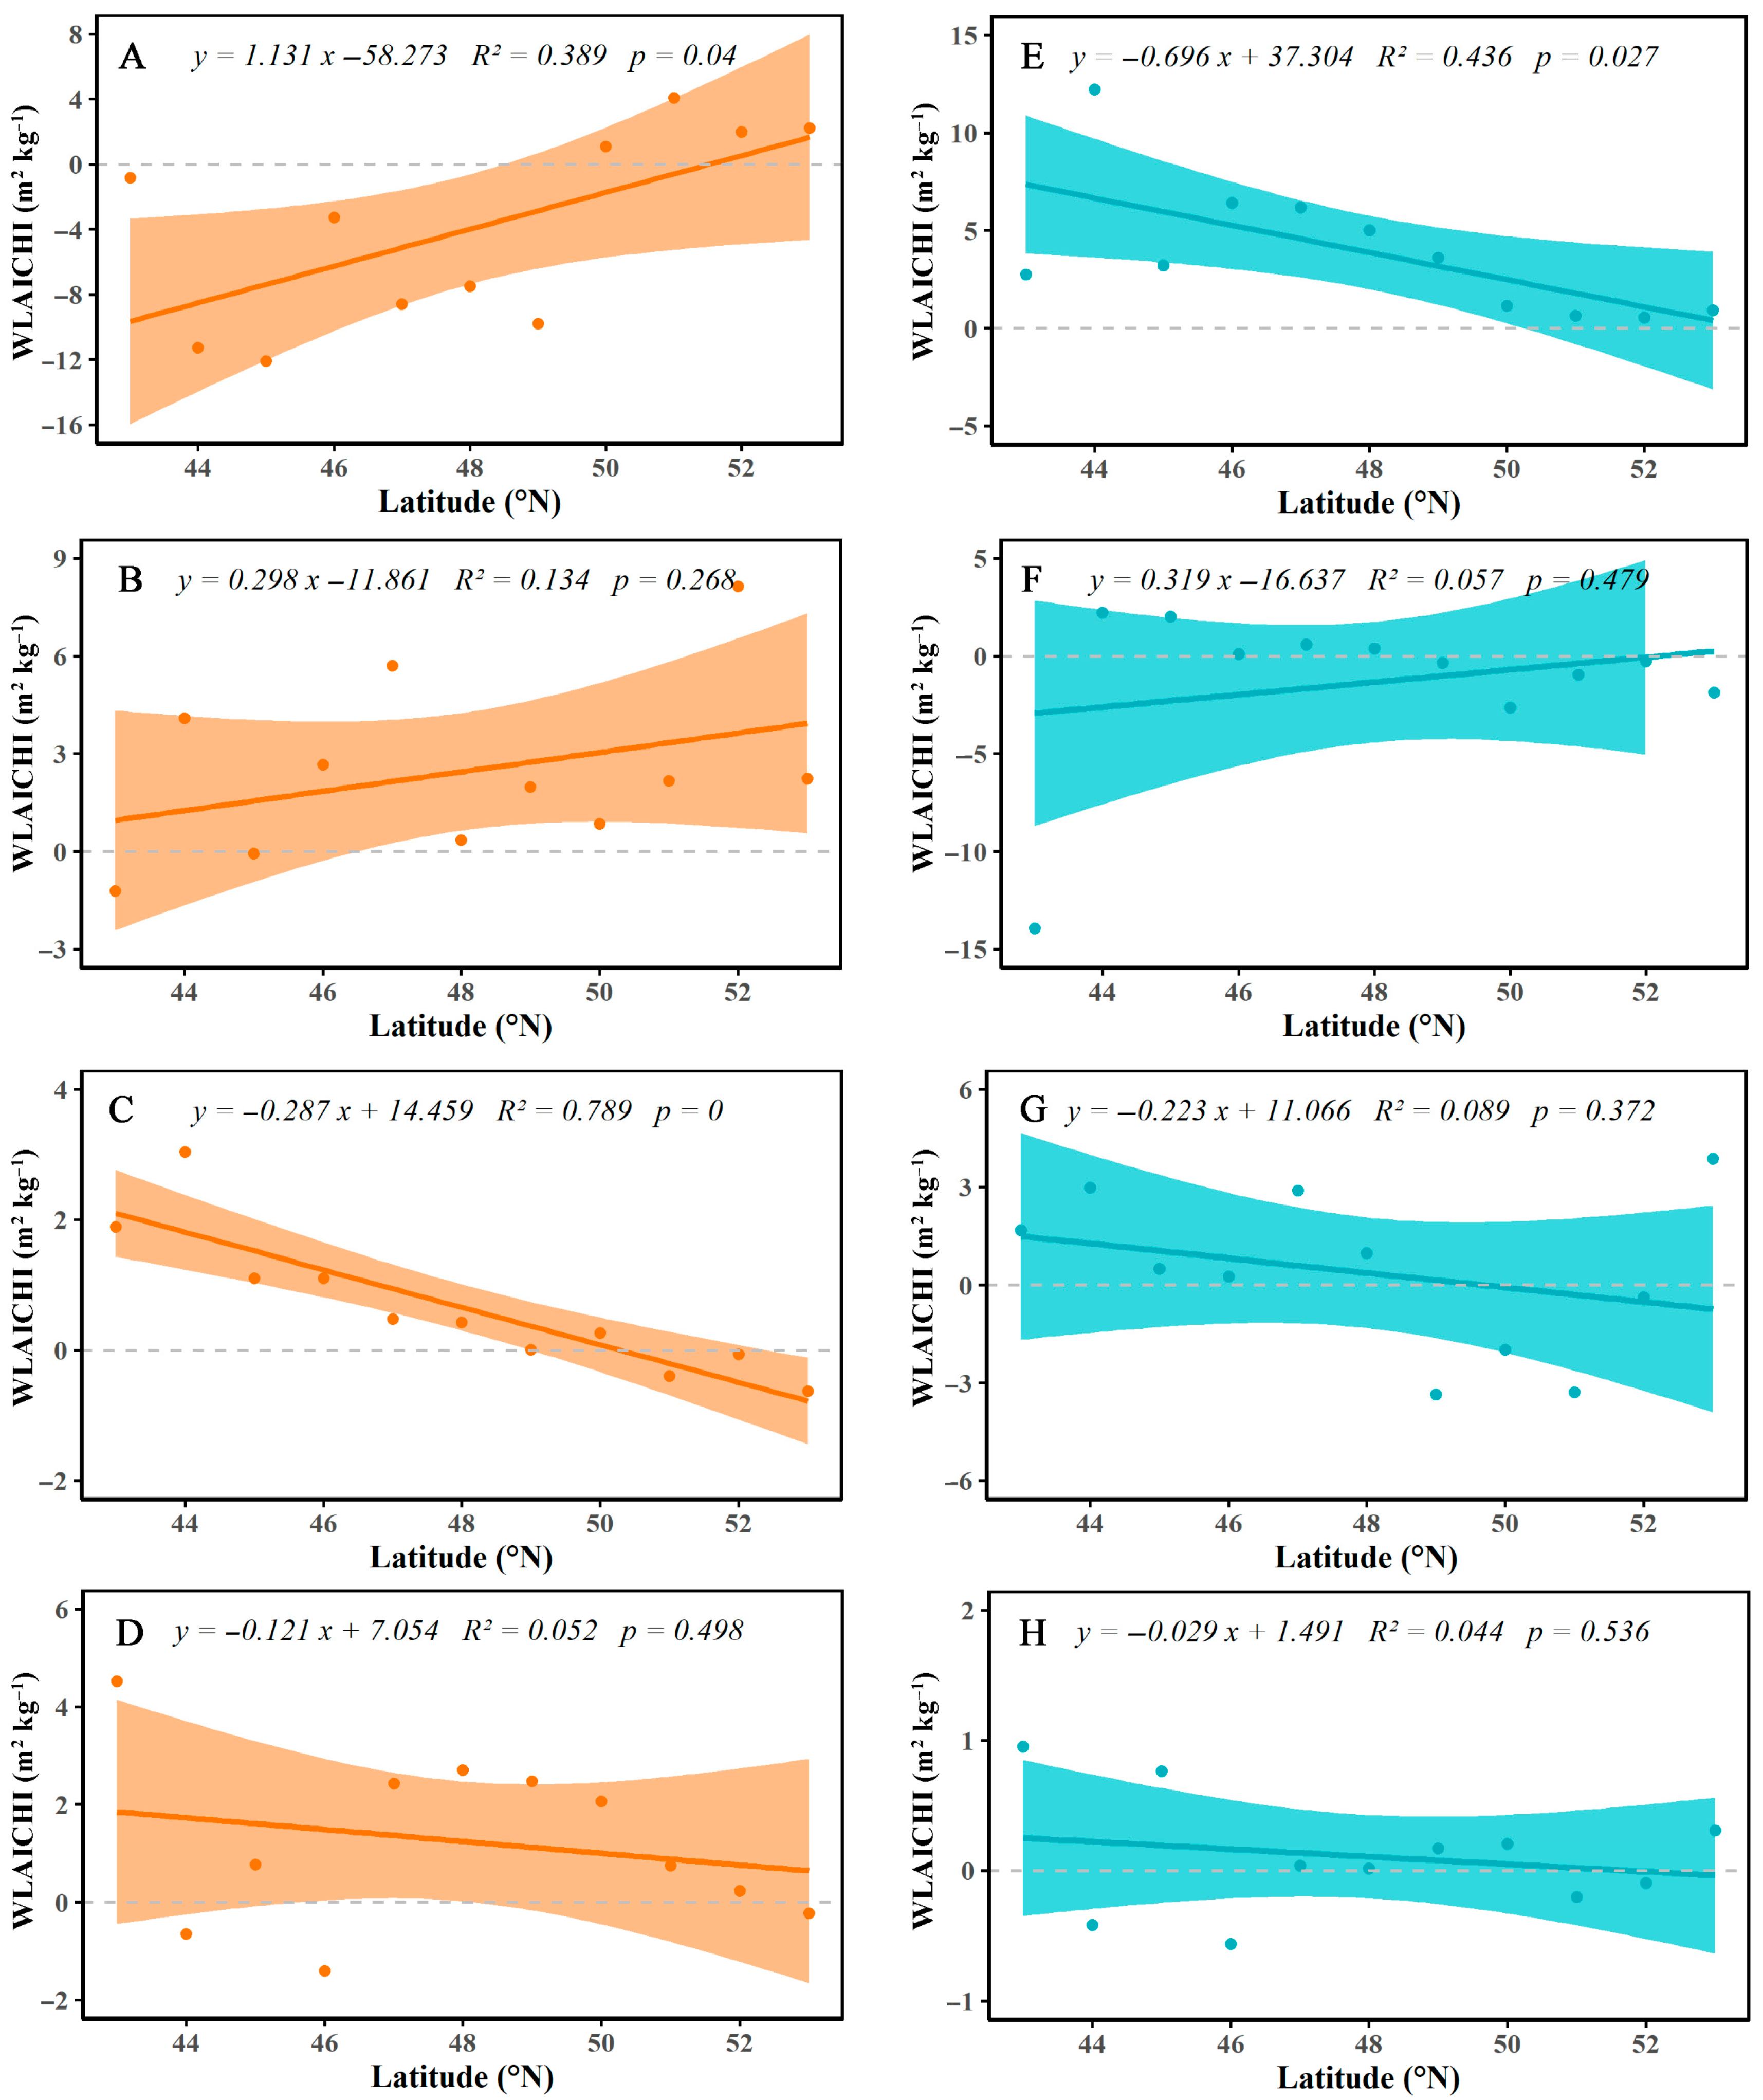
3.3. Relationship Between Wetland LAI Change and 2m SH

Analysis of the relationship between changes in wetland LAI and changes in 2m SH indicated that from 2003 to 2020, variations in wetland vegetation LAI had a positive effect on 2m SH. However, the trend of this effect varied across years (Figure 9). In the CHRB, between 2003 and 2010, the WLAICHI during the growing season gradually increased with increasing latitude. However, from 2010 to 2020, the WLAICHI decreased significantly, shifting from positive to negative values (Figure 9). Between 2003 and 2010, the positive correlation between wetland vegetation LAI and 2m SH strengthened with increasing latitude, meaning that, with increasing latitude, higher wetland vegetation LAI was associated with higher 2m SH, although the relationship was not significant. In contrast, from 2010 to 2020, the WLAICHI significantly decreased with increasing latitude, changing from positive to negative, with a slope of −0.768.
From 2003 to 2010, with increasing latitude, the WLAICHI in the CHRB increased in spring and summer but decreased in autumn and winter (Figure 10). The trends in spring and autumn were statistically significant. In spring, the WLAICHI shifted from negative to positive values as the latitude increased, indicating a weakening of the inverse relationship between wetland vegetation LAI and 2m SH and a strengthening of the positive correlation. This suggested a transition from a drying-out to a humidifying effect. In summer, the WLAICHI remained positive and increased with increasing latitude, implying that the humidifying effect of wetland vegetation LAI intensified at higher latitudes. In contrast, during autumn, the humidifying effect weakened with increasing latitude and transitioned to a drying-out effect in higher-latitude regions. In winter, the humidifying effect also decreased with increasing latitude. From 2010 to 2020, the WLAICHI in spring, autumn, and winter showed a decreasing trend with increasing latitude, suggesting a weakening of the humidifying effect of wetland vegetation LAI. In spring, the WLAICHI significantly decreased with increasing latitude, whereas the opposite was observed in summer, shifting from negative to positive values. This indicated that the humidifying effect of wetland LAI strengthened at higher latitudes.

4. Discussion

4.1. Threshold Effect of Wetland Area Change on Moistening

The moistening effect of wetlands exhibits a threshold phenomenon, meaning that when wetland coverage exceeds 60%, local humidity no longer continues to increase but instead enters a dynamic equilibrium. This may be attributed to the saturation of evapotranspiration once regional humidity reaches a relatively high level, leading to a balance in water vapor exchange and subsequent deceleration of the rate of enhancement of the moistening effect [46]. In addition, elevated local humidity can promote cloud formation and precipitation [47,48], which, in turn, cools the surface and reduces evapotranspiration rates. This forms a negative feedback mechanism that causes fluctuations—rather than continuous amplification—of the moistening effect within a certain range. Although some studies have mentioned threshold effects in wetlands, systematic comparisons are still lacking, and further research is needed to determine whether similar humidifying thresholds exist in wetlands across different regions.
Moreover, in northern wetlands, particularly in the CHRB, extensive surface freezing occurs during winter, resulting in the near cessation of water surface evaporation and a sharp decline in surface evapotranspiration, which weakens the moistening effect. The low winter temperatures further suppress evaporation [49]. With warming in spring, the melting of ice and snow restores wetlands to their liquid state, and wetland vegetation (e.g., Phragmites, Typha) begins to grow, enhancing evapotranspiration [50,51,52]. During summer, when the air temperature and solar radiation peak, wetland vegetation reaches its maximum growth, and both water surface evaporation and plant transpiration reach their peak, strengthening the moistening effect [53,54]. Even in autumn, although wetland vegetation starts to senesce, it still maintains a certain level of transpiration capacity [55].
As the rate of wetland area change increases, the moistening effect tends to weaken, and vice versa. This pattern may also be attributed to a threshold effect in the wetland moistening process [56]. Although a moistening effect persists, its intensity diminishes as wetlands continue to expand. In low-latitude regions, the moistening effect associated with wetland loss is particularly pronounced. This may be due to the conversion of wetlands into riverine or lacustrine water bodies, where wetland vegetation is largely absent and open water surfaces exhibit substantially higher evapotranspiration rates [57,58]. Such transformations can lead to an increase in atmospheric moisture despite the reduction in wetland area. Furthermore, once a certain threshold is reached, additional increases in wetland area may no longer enhance evapotranspiration or further increase near-surface humidity, with excess water vapor instead contributing to an increase in precipitation [59,60]. In contrast, in higher-latitude regions where baseline humidity levels are relatively low due to colder temperatures, reduced evapotranspiration, and limited atmospheric water vapor capacity, increases in wetland area can still produce a strong moistening effect. This is because newly expanded wetlands introduce additional surface water and saturated soils that enhance evapotranspiration, and in dry atmospheric conditions, even moderate water vapor release can significantly raise local humidity levels [60,61,62].

4.2. The Effects of Changes in Wetland Vegetation LAI on Humidity

Both the relationship between wetland vegetation dynamics, as characterized by the LAI, and the near-surface specific humidity exhibited significant interannual, latitudinal, and seasonal variability over the study period (2003–2020). Our findings indicated that the capacity of wetlands to regulate humidity is determined not only by vegetation greenness but also by regional ecological conditions, climatic factors, and restoration status.
From 2003 to 2010, although the LAI increased in some areas, the overall humidification effect remained weak. This period coincided with extensive wetland degradation, particularly in the Sanjiang Plain, driven by agricultural expansion and hydrological alterations [63,64]. Consequently, the increases in the LAI reflected the growth of secondary vegetation or croplands rather than the recovery of natural wetland systems, leading to limited evapotranspiration and weak feedback effects on humidity [65]. Furthermore, the regional climate during this decade was relatively dry, reducing the baseline atmospheric moisture and constraining the potential for the LAI to enhance specific humidity. In contrast, the 2010–2020 period showed a stronger coupling between the LAI and 2m SH. This shift can be attributed to intensified wetland conservation and restoration efforts, including large-scale ecological projects such as the “Return Farmland to Wetland” program [66,67,68]. In parallel, the regional climate exhibited a warming and wetting trend, which favored vegetation growth and enhanced water availability, collectively amplifying the evapotranspiration flux and resulting in a more pronounced humidification effect from increased LAI.
Latitudinal gradients further modulated these relationships. From 2003 to 2010, the humidification effect (WLAICHI) increased with increasing latitude, likely due to the preservation of relatively intact wetland patches in higher-latitude regions that maintained stronger moisture regulation capacities [69,70]. However, in the 2010–2020 period, this pattern was reversed. Higher latitudes experienced a notable decline in the WLAICHI, suggesting that the humidification benefits of the LAI were constrained by colder temperatures, shorter growing seasons, and weaker evapotranspiration [71,72]. Seasonal dynamics also revealed marked differences. In summer, when solar radiation and water availability peaked, the positive relationship between the LAI and specific humidity was most evident, particularly at higher latitudes in the later decade [73,74]. In contrast, winter exhibited the weakest effect across all latitudes due to frozen soils and dormant vegetation [75,76]. Spring and autumn showed transitional patterns, influenced by melting snow, vegetation phenology, and rapid shifts in temperature and humidity.

4.3. Uncertainty and Future Work

Although this study provides valuable insights into the effects of wetland changes on humidity based on satellite-derived products, several limitations should be acknowledged. First, the analysis relied on observational data that inherently integrates the influence of multiple environmental factors, such as meteorological conditions, land use changes, and human activities, making it difficult to isolate the direct impact of wetland changes on atmospheric humidity. Second, specific atmospheric processes such as precipitation, evapotranspiration, wind speed, and pressure, which also significantly affect humidity, could not be separated when using satellite products alone. Third, this study primarily focused on quantifying the individual impacts of wetland area and LAI changes on humidity, without examining their potential synergistic interactions or exploring the underlying physical mechanisms by which wetland dynamics influence atmospheric moisture. In addition, the 1 km resolution may lead to omission of small and fragmented wetland patches, potentially underestimating their local humidifying effects. Moreover, satellite imagery has limited ability to distinguish between different wetland types, which may exhibit varying impacts on atmospheric humidity.
Future research should address these limitations by combining satellite observations with controlled numerical experiments, such as using the WRF model to modify only the wetland area and LAI, thus isolating the direct impact of wetland changes. In addition, studies should incorporate wetland data of varying spatial resolutions to investigate the humidifying effects of wetlands across broader geographic regions and conduct coupled simulations to explore the synergistic humidifying effects of wetland area and vegetation LAI. Moreover, process-based studies are needed to reveal how wetland dynamics interact with local energy balance, surface–atmosphere exchange, and regional circulation patterns. Overall, satellite-based methods are effective for large-scale trend analysis, whereas model-based simulations can more accurately quantify the direct contributions and mechanisms of wetland changes. A combination of these approaches will help to provide a more comprehensive and precise understanding of the humidifying effects of wetland dynamics. Importantly, such integrated research contributes to SDG13 by enhancing our capacity to monitor, simulate, and manage the climate-regulating functions of wetlands. A deeper understanding of wetland–climate feedbacks is essential for developing nature-based solutions that support climate adaptation and mitigation strategies in cold and temperate regions.

5. Conclusions

This study demonstrated that changes in both wetland area and vegetation LAI significantly influence near-surface atmospheric humidity in the CHRB during 2003–2020, underscoring the vital role of wetland ecosystems in regulating regional water vapor and maintaining climate stability. The results demonstrated that variations in wetland area and LAI had significant but spatially and temporally heterogeneous impacts on 2m SH. A threshold effect was identified between wetland coverage and 2m SH; namely, when wetland coverage was below 60%, its positive regulatory effect on humidity was significantly enhanced. The sensitivity of humidity to wetland area changes increased with increasing latitude, indicating that high-latitude regions were more vulnerable to wetland loss. From 2003 to 2020, although the wetland LAI changes generally enhanced specific humidity, the temporal trends varied. The relationship between LAI and humidity also showed opposite latitude-related trends in the two decades. In addition, LAI-driven humidity regulation exhibited strong seasonality, with the most pronounced humidifying effect observed in summer and the weakest response detected in winter, with spring and autumn exhibiting moderate responses. Overall, wetland ecological changes had a significant influence on near-surface humidity. The implementation of climate-adaptive wetland protection strategies is of great importance for enhancing ecosystem stability and climate resilience in mid-to-high-latitude regions.

Author Contributions

Methodology, software, writing—original draft, Z.X.; conceptualization, validation, funding acquisition, writing—review and editing, X.L.; writing—review and editing, validation, Y.B.; data curation, validation, F.Y.; writing—review and editing, Y.Y.; writing—review and editing, Y.R. All authors have read and agreed to the published version of the manuscript.

Funding

This research was funded by the National Natural Science Foundation of China, grant numbers 42171328, 42301430, and 42401458.

Data Availability Statement

Data will be made available on request.

Conflicts of Interest

Author Fudong Yu was employed by the company Jilin Sinoagri Sunshine Data Ltd. The remaining authors declare that the research was conducted in the absence of any commercial or financial relationships that could be construed as a potential conflict of interest.

Abbreviations

The following abbreviations are used in this manuscript:
CHRBThe China side of Heilongjiang River Basin
HRBHeilongjiang River Basin
LAILeaf area index
OLSOrdinary Least Squares
WACHIWetland Area Change Humidity Index
WLAICHIWetland Leaf Area Index Change Humidity Index

References

  1. Bullock, A.; Acreman, M. The role of wetlands in the hydrological cycle. Hydrol. Earth Syst. Sci. 2003, 7, 358–389. [Google Scholar] [CrossRef]
  2. Zhao, Z.; Fu, B.; Lü, Y.; Li, T.; Deng, L.; Wang, Y.; Lü, D.; Wang, Y.; Wu, X. Variable climatic conditions dominate decreased wetland vulnerability on the Qinghai–Tibet Plateau: Insights from the ecosystem pattern-process-function framework. J. Clean. Prod. 2024, 458, 142496. [Google Scholar] [CrossRef]
  3. Bai, J.; Lu, Q.; Zhao, Q.; Wang, J.; Ouyang, H. Effects of alpine wetland landscapes on regional climate on the Zoige Plateau of China. Adv. Meteorol. 2013, 2013, 972430. [Google Scholar] [CrossRef]
  4. Bardgett, R.D.; Freeman, C.; Ostle, N.J. Microbial contributions to climate change through carbon cycle feedbacks. ISME J. 2008, 2, 805–814. [Google Scholar] [CrossRef] [PubMed]
  5. Bridgham, S.D.; Johnston, C.A.; Pastor, J.; Updegraff, K. Potential feedbacks of northern wetlands on climate change. BioScience 1995, 45, 262–274. [Google Scholar] [CrossRef]
  6. Wang, Y.S.; Gu, J.D. Ecological responses, adaptation and mechanisms of mangrove wetland ecosystem to global climate change and anthropogenic activities. Int. Biodeterior. Biodegrad. 2021, 162, 105248. [Google Scholar] [CrossRef]
  7. Zhang, Z.; Chen, F.; Barlage, M.; Bortolotti, L.E.; Famiglietti, J.; Li, Z.; Ma, X.; Li, Y. Cooling effects revealed by modeling of wetlands and land-atmosphere interactions. Water Resour. Res. 2022, 58, e2021WR030573. [Google Scholar] [CrossRef]
  8. Bright, R.M.; Davin, E.; O’Halloran, T.; Pongratz, J.; Zhao, K.; Cescatti, A. Local temperature response to land cover and management change driven by non-radiative processes. Nat. Clim. Change 2017, 7, 296–302. [Google Scholar] [CrossRef]
  9. Shen, M.; Piao, S.; Jeong, S.J.; Zhou, L.; Zeng, Z.; Ciais, P.; Chen, M.; Huang, M.; Jin, C.; Li, L.X.; et al. Evaporative cooling over the Tibetan Plateau induced by vegetation growth. Proc. Natl. Acad. Sci. USA 2015, 112, 9299–9304. [Google Scholar] [CrossRef]
  10. Yu, L.; Liu, Y.; Yang, J.; Liu, T.; Bu, K.; Li, G.; Jiao, Y.; Zhang, S. Asymmetric daytime and nighttime surface temperature feedback induced by crop greening across Northeast China. Agric. For. Meteorol. 2022, 325, 109136. [Google Scholar] [CrossRef]
  11. Camargo, J.L.C.; Kapos, V. Complex edge effects on soil moisture and microclimate in central Amazonian forest. J. Trop. Ecol. 1995, 11, 205–221. [Google Scholar] [CrossRef]
  12. Jucker, T.; Hardwick, S.R.; Both, S.; Elias, D.M.O.; Ewers, R.M.; Milodowski, D.T.; Swinfield, T.; Coomes, D.A. Canopy structure and topography jointly constrain the microclimate of human-modified tropical landscapes. Glob. Change Biol. 2018, 24, 5243–5258. [Google Scholar] [CrossRef] [PubMed]
  13. Yu, L.; Li, X.; Bu, K.; Yan, F.; Zhang, S.; Liu, T. Increased background precipitation masks the moisture deficit caused by crop greening in Northeast China. J. Hydrol. 2023, 623, 129857. [Google Scholar] [CrossRef]
  14. Ceppi, P.; Brient, F.; Zelinka, M.D.; Hartmann, D.L. Cloud feedback mechanisms and their representation in global climate models. Wiley Interdiscip. Rev. Clim. Change 2017, 8, e465. [Google Scholar] [CrossRef]
  15. Gentine, P.; Massmann, A.; Lintner, B.R.; Hamed Alemohammad, S.; Fu, R.; Green, J.K.; Kennedy, D.; Vilà-Guerau de Arellano, J. Land–atmosphere interactions in the tropics–a review. Hydrol. Earth Syst. Sci. 2019, 23, 4171–4197. [Google Scholar] [CrossRef]
  16. Yeo, L.B.; Ling, G.H.T.; Tan, M.L.; Leng, P.C. Interrelationships between land use land cover (LULC) and human thermal comfort (HTC): A comparative analysis of different spatial settings. Sustainability 2021, 13, 382. [Google Scholar] [CrossRef]
  17. Malakar, K.D.; Kumar, M.; Anand, S.; Kuzur, G. Climate, climate change ecology, and socio-ecological environments. In Climate Change and Socio-Ecological Transformation: Vulnerability and Sustainability; Springer Nature: Singapore, 2023; pp. 29–116. [Google Scholar]
  18. Liu, T.; Yu, L.; Bu, K.; Yan, F.; Zhang, S. Seasonal local temperature responses to paddy field expansion from rain-fed farmland in the cold and humid Sanjiang Plain of China. Remote Sens. 2018, 10, 2009. [Google Scholar] [CrossRef]
  19. Liu, T.; Yu, L.; Bu, K.; Yang, J.; Yan, F.; Zhang, S.; Li, G.; Jiao, Y.; Liu, S. Thermal and moisture response to land surface changes across different ecosystems over Heilong-Amur River Basin. Sci. Total Environ. 2022, 818, 151799. [Google Scholar] [CrossRef]
  20. Miralles, D.G.; Vilà-Guerau de Arellano, J.; McVicar, T.R.; Mahecha, M.D. Vegetation-climate feedbacks across scales. Ann. N. Y. Acad. Sci. 2025, 1544, 27–41. [Google Scholar] [CrossRef]
  21. Luo, S.; Wang, C.; Pan, F.; Xi, X.; Li, G.; Nie, S.; Xia, S. Estimation of wetland vegetation height and leaf area index using airborne laser scanning data. Ecol. Indic. 2015, 48, 550–559. [Google Scholar] [CrossRef]
  22. Kamal, M.; Phinn, S.; Johansen, K. Assessment of multi-resolution image data for mangrove leaf area index mapping. Remote Sens. Environ. 2016, 176, 242–254. [Google Scholar] [CrossRef]
  23. Li, Y.; Li, Z.L.; Wu, H.; Zhou, C.; Liu, X.; Leng, P.; Yang, P.; Wu, W.; Tang, R.; Shang, G.F.; et al. Biophysical impacts of earth greening can substantially mitigate regional land surface temperature warming. Nat. Commun. 2023, 14, 121. [Google Scholar] [CrossRef] [PubMed]
  24. Wong, C.P.; Jiang, B.; Bohn, T.J.; Lee, K.N.; Lettenmaier, D.P.; Ma, D.; Ouyang, Z. Lake and wetland ecosystem services measuring water storage and local climate regulation. Water Resour. Res. 2017, 53, 3197–3223. [Google Scholar] [CrossRef]
  25. Niu, Z.; Si, B.; Li, D.; Zhao, Y.; Hou, X.; Li, L.; Wang, B.; Song, B.; Zhang, M.; Li, X.; et al. Spatiotemporal variation in driving factors of vegetation dynamics in the Yellow River Delta Estuarine wetlands from 2000 to 2020. Remote Sens. 2023, 15, 4332. [Google Scholar] [CrossRef]
  26. Jia, L.; Xi, G.; Liu, S.; Huang, C.; Yan, Y.; Liu, G. Regional estimation of daily to annual regional evapotranspiration with MODIS data in the Yellow River Delta wetland. Hydrol. Earth Syst. Sci. 2009, 13, 1775–1787. [Google Scholar] [CrossRef]
  27. Brümmer, C.; Black, T.A.; Jassal, R.S.; Grant, N.J.; Spittlehouse, D.L.; Chen, B.; Nesic, Z.; Amiro, B.D.; Arain, M.A.; Barr, A.G.; et al. How climate and vegetation type influence evapotranspiration and water use efficiency in Canadian forest, peatland and grassland ecosystems. Agric. For. Meteorol. 2012, 153, 14–30. [Google Scholar] [CrossRef]
  28. Fleischmann, A.S.; Laipelt, L.; Papa, F.; Paiva, R.C.D.D.; De Andrade, B.C.; Collischonn, W.; Biudes, M.S.; Kayser, R.; Prigent, C.; Cosio, E.; et al. Patterns and drivers of evapotranspiration in South American wetlands. Nat. Commun. 2023, 14, 6656. [Google Scholar] [CrossRef]
  29. Mao, D.; Tian, Y.; Wang, Z.; Jia, M.; Du, J.; Song, C. Wetland changes in the Amur River Basin: Differing trends and proximate causes on the Chinese and Russian sides. J. Environ. Manag. 2021, 280, 111670. [Google Scholar] [CrossRef]
  30. Liu, T.; Yu, L.; Yan, Z.; Li, X.; Bu, K.; Yang, J. Enhanced climate mitigation feedbacks by wetland vegetation in semi-arid compared to humid regions. Geophys. Res. Lett. 2025, 52, e2025GL115242. [Google Scholar] [CrossRef]
  31. Xing, Z.; Li, X.; Mao, D.; Luo, L.; Wang, Z. Heterogeneous responses of wetland vegetation to climate change in the Amur River basin characterized by normalized difference vegetation index from 1982 to 2020. Front. Plant Sci. 2023, 14, 1290843. [Google Scholar] [CrossRef]
  32. Simonov, E.A.; Dahmer, T.D. Amur-Heilong River Basin Reader; Ecosystems Hong Kong: Hong Kong, China, 2008. [Google Scholar]
  33. Wang, Z.; Song, K.; Ma, W.; Ren, C.; Zhang, B.; Liu, D.; Chen, J.; Song, C. Loss and fragmentation of marshes in the Sanjiang Plain, Northeast China, 1954–2005. Wetlands 2011, 31, 945–954. [Google Scholar] [CrossRef]
  34. Zou, Y.; Wang, L.; Xue, Z.; Mingju, E.; Jiang, M.; Lu, X.; Yang, S.; Shen, X.; Liu, Z.; Sun, G.; et al. Impacts of agricultural and reclamation practices on wetlands in the Amur River Basin, Northeastern China. Wetlands 2018, 38, 383–389. [Google Scholar] [CrossRef]
  35. Jia, M.; Mao, D.; Wang, Z.; Ren, C.; Zhu, Q.; Li, X.; Zhang, Y. Tracking long-term floodplain wetland changes: A case study in the China side of the Amur River Basin. Int. J. Appl. Earth Obs. Geoinf. 2020, 92, 102185. [Google Scholar] [CrossRef]
  36. Vanderhoof, M.K.; Lane, C.R.; McManus, M.G.; Alexander, L.C.; Christensen, J.R. Wetlands inform how climate extremes influence surface water expansion and contraction. Hydrol. Earth Syst. Sci. 2018, 22, 1851–1873. [Google Scholar] [CrossRef] [PubMed]
  37. Fluet-Chouinard, E.; Stocker, B.D.; Zhang, Z.; Malhotra, A.; Melton, J.R.; Poulter, B.; Kaplan, J.O.; Goldewijk, K.K.; Siebert, S.; Minayeva, T.; et al. Extensive global wetland loss over the past three centuries. Nature 2023, 614, 281–286. [Google Scholar] [CrossRef]
  38. Mao, D.; Wang, M.; Wang, Y.; Jiang, M.; Yuan, W.; Luo, L.; Feng, K.; Wang, D.; Xiang, H.; Ren, Y.; et al. The trajectory of wetland change in China between 1980 and 2020: Hidden losses and restoration effects. Sci. Bull. 2025, 70, 587–596. [Google Scholar] [CrossRef]
  39. Hill, M.J.; Senarath, U.; Lee, A.; Zeppel, M.; Nightingale, J.M.; Williams, R.J.; McVicar, T.R. Assessment of the MODIS LAI product for Australian ecosystems. Remote Sens. Environ. 2006, 101, 495–518. [Google Scholar] [CrossRef]
  40. Smith, W.K.; Dannenberg, M.P.; Yan, D.; Herrmann, S.; Barnes, M.L.; Barron-Gafford, G.A.; Biederman, J.A.; Ferrenberg, S.; Fox, A.M.; Hudson, A.; et al. Remote sensing of dryland ecosystem structure and function: Progress, challenges, and opportunities. Remote Sens. Environ. 2019, 233, 111401. [Google Scholar] [CrossRef]
  41. Kendall, M.G. Rank Correlation Methods. Available online: https://psycnet.apa.org/record/1948-15040-000 (accessed on 7 July 2025).
  42. Sen, P.K. Estimates of the regression coefficient based on Kendall’s tau. J. Am. Stat. Assoc. 1968, 63, 1379–1389. [Google Scholar] [CrossRef]
  43. Hurst, H.E. Long-term storage capacity of reservoirs. Trans. Am. Soc. Civ. Eng. 1951, 116, 770–799. [Google Scholar] [CrossRef]
  44. Mandelbrot, B.B.; Wallis, J.R. Robustness of the rescaled range R/S in the measurement of noncyclic long run statistical dependence. Water Resour. Res. 1969, 5, 967–988. [Google Scholar] [CrossRef]
  45. Zhang, Y.; Wang, X.; Lian, X.; Li, S.; Li, Y.; Chen, C.; Piao, S. Asymmetric impacts of forest gain and loss on tropical land surface temperature. Nat. Geosci. 2024, 17, 426–432. [Google Scholar] [CrossRef]
  46. Yang, W.; Zhang, L.; Gao, Y. Drought and flood risk assessment for rainfed agriculture based on copula-Bayesian conditional probabilities. Ecol. Indic. 2023, 146, 109812. [Google Scholar] [CrossRef]
  47. Dai, A.; Trenberth, K.E.; Karl, T.R. Effects of clouds, soil moisture, precipitation, and water vapor on diurnal temperature range. J. Clim. 1999, 12, 2451–2473. [Google Scholar] [CrossRef]
  48. Rosenfeld, D.; Andreae, M.O.; Asmi, A.; Chin, M.; de Leeuw, G.; Donovan, D.P.; Kahn, R.; Kinne, S.; Kivekäs, N.; Kulmala, M.; et al. Global observations of aerosol-cloud-precipitation-climate interactions. Rev. Geophys. 2014, 52, 750–808. [Google Scholar] [CrossRef]
  49. Blanken, P.D. The effect of winter drought on evaporation from a high-elevation wetland. J. Geophys. Res. Biogeosci. 2014, 119, 1354–1369. [Google Scholar] [CrossRef]
  50. Lode, E. Wetland Restoration. 1999. Available online: https://publications.slu.se/?file=publ/show&id=125757 (accessed on 7 July 2025).
  51. Erwin, K.L. Wetlands and global climate change: The role of wetland restoration in a changing world. Wetl. Ecol. Manag. 2009, 17, 71–84. [Google Scholar] [CrossRef]
  52. Lindborg, R.; Ermold, M.; Kuglerová, L.; Jansson, R.; Larson, K.W.; Milbau, A.; Cousins, S.A.O. How does a wetland plant respond to increasing temperature along a latitudinal gradient? Ecol. Evol. 2021, 11, 16228–16238. [Google Scholar] [CrossRef]
  53. Poiani, K.A.; Johnson, W.C. Global warming and prairie wetlands. BioScience 1991, 41, 611–618. [Google Scholar] [CrossRef]
  54. Rouse, W.R. The energy and water balance of high-latitude wetlands: Controls and extrapolation. Glob. Change Biol. 2000, 6, 59–68. [Google Scholar] [CrossRef]
  55. Moor, H.; Rydin, H.; Hylander, K.; Nilsson, M.B.; Lindborg, R.; Norberg, J. Towards a trait-based ecology of wetland vegetation. J. Ecol. 2017, 105, 1623–1635. [Google Scholar] [CrossRef]
  56. Ma, S.; Ren, J.; Wu, C.; Cheng, F.; Wang, X.; Li, B.; He, Q. Hydrological control of threshold transitions in vegetation over early-period wetland development. J. Hydrol. 2022, 610, 127931. [Google Scholar] [CrossRef]
  57. Mohamed, Y.A.; Bastiaanssen, W.G.M.; Savenije, H.H.G.; Van den Hurk, B.J.J.M.; Finlayson, C.M. Wetland versus open water evaporation: An analysis and literature review. Phys. Chem. Earth Parts A B C 2012, 47–48, 114–121. [Google Scholar] [CrossRef]
  58. Hesslerová, P.; Pokorný, J.; Huryna, H.; Harper, D. Wetlands and forests regulate climate via evapotranspiration. In Wetlands: Ecosystem Services, Restoration and Wise Use; An, S., Verhoeven, J.T.A., Eds.; Springer International Publishing: Cham, Switzerland, 2019; pp. 63–93. [Google Scholar]
  59. Ye, H.; Fetzer, E.J.; Wong, S.; Behrangi, A.; Olsen, E.T.; Cohen, J.; Lambrigtsen, B.H.; Chen, L. Impact of increased water vapor on precipitation efficiency over northern Eurasia. Geophys. Res. Lett. 2014, 41, 2941–2947. [Google Scholar] [CrossRef]
  60. Dai, A.; Zhao, T.; Chen, J. Climate change and drought: A precipitation and evaporation perspective. Curr. Clim. Change Rep. 2018, 4, 301–312. [Google Scholar] [CrossRef]
  61. Behrangi, A.; Nguyen, H.; Lambrigtsen, B.; Schreier, M.; Dang, V. Investigating the role of multi-spectral and near surface temperature and humidity data to improve precipitation detection at high latitudes. Atmos. Res. 2015, 163, 2–12. [Google Scholar] [CrossRef]
  62. Ouyang, W.; Gao, X.; Hao, Z.; Liu, H.; Shi, Y.; Hao, F. Farmland shift due to climate warming and impacts on temporal-spatial distributions of water resources in a middle-high latitude agricultural watershed. J. Hydrol. 2017, 547, 156–167. [Google Scholar] [CrossRef]
  63. Liu, H.; Zhang, S.; Li, Z.; Lu, X.; Yang, Q. Impacts on wetlands of large-scale land-use changes by agricultural development: The small Sanjiang Plain, China. Ambio 2004, 33, 306–310. [Google Scholar] [CrossRef]
  64. Chen, H.; Zhang, W.; Gao, H.; Nie, N. Climate change and anthropogenic impacts on wetland and agriculture in the Songnen and Sanjiang Plain, Northeast China. Remote Sens. 2018, 10, 356. [Google Scholar] [CrossRef]
  65. Xu, C.; Zhang, Z.; Fu, Z.; Xiong, S.; Chen, H.; Zhang, W.; Wang, S.; Zhang, D.; Lu, H.; Jiang, X. Impacts of climatic fluctuations and vegetation greening on regional hydrological processes: A case study in the Xiaoxinganling Mountains–Sanjiang Plain region, Northeastern China. Remote Sens. 2024, 16, 2709. [Google Scholar] [CrossRef]
  66. Mao, D.; Luo, L.; Wang, Z.; Wilson, M.C.; Zeng, Y.; Wu, B.; Wu, J. Conversions between natural wetlands and farmland in China: A multiscale geospatial analysis. Sci. Total Environ. 2018, 634, 550–560. [Google Scholar] [CrossRef] [PubMed]
  67. Xiang, H.X.; Wang, Z.M.; Mao, D.H.; Zhang, J.; Xi, Y.B.; Du, B.J.; Zhang, B. What did China’s national wetland conservation program achieve? Observations of changes in land cover and ecosystem services in the Sanjiang Plain. J. Environ. Manag. 2020, 267, 110623. [Google Scholar] [CrossRef] [PubMed]
  68. Wang, H.; Zhang, C.; Yao, X.; Yun, W.; Ma, J.; Gao, L.; Li, P. Scenario simulation of the tradeoff between ecological land and farmland in black soil region of Northeast China. Land. Use Policy 2022, 114, 105991. [Google Scholar] [CrossRef]
  69. Page, S.E.; Baird, A.J. Peatlands and global change: Response and resilience. Annu. Rev. Environ. Resour. 2016, 41, 35–57. [Google Scholar] [CrossRef]
  70. Evers, S.; Yule, C.M.; Padfield, R.; O’Reilly, P.; Varkkey, H. Keep wetlands wet: The myth of sustainable development of tropical peatlands–implications for policies and management. Glob. Change Biol. 2017, 23, 534–549. [Google Scholar] [CrossRef]
  71. Xu, Z.; Man, X.; Cai, T.; Shang, Y. How potential evapotranspiration regulates the response of canopy transpiration to soil moisture and leaf area index of the Boreal Larch Forest in China. Forests 2022, 13, 571. [Google Scholar] [CrossRef]
  72. Yang, C.; Lei, H. Climate and management impacts on crop growth and evapotranspiration in the North China Plain based on long-term eddy covariance observation. Agric. For. Meteorol. 2022, 325, 109147. [Google Scholar] [CrossRef]
  73. Hardwick, S.R.; Toumi, R.; Pfeifer, M.; Turner, E.C.; Nilus, R.; Ewers, R.M. The relationship between leaf area index and microclimate in tropical forest and oil palm plantation: Forest disturbance drives changes in microclimate. Agric. For. Meteorol. 2015, 201, 187–195. [Google Scholar] [CrossRef]
  74. Cox, D.T.C.; Maclean, I.M.D.; Gardner, A.S.; Gaston, K.J. Global variation in diurnal asymmetry in temperature, cloud cover, specific humidity and precipitation and its association with leaf area index. Glob. Change Biol. 2020, 26, 7099–7111. [Google Scholar] [CrossRef]
  75. Kreyling, J. Winter climate change: A critical factor for temperate vegetation performance. Ecology 2010, 91, 1939–1948. [Google Scholar] [CrossRef]
  76. Preston, J.C.; Sandve, S.R. Adaptation to seasonality and the winter freeze. Front. Plant Sci. 2013, 4, 167. [Google Scholar] [CrossRef] [PubMed]
Figure 1. Location of the study area.
Remotesensing 17 02405 g001
Figure 2. Spatial pattern of changes in wetland area and the leaf area index (LAI) in the China side of the Heilongjiang River Basin from 2003 to 2020. (A) Spatial distribution of wetland gain. (B) Spatial distribution of wetland loss. (C) Wetland area change in 2003, 2010, and 2020. (D) Wetland gain and loss between 2003 and 2010 and between 2010 and 2020. (E) Spatial distribution of wetland LAI. (F) Spatial distribution of the wetland LAI trend per year. (G) Spatial distribution of Mann–Kendall test results for the wetland LAI trend. (H) Spatial distribution of the Hurst index of wetland LAI. (I) Temporal changes in wetland LAI from 2003 to 2020.
Remotesensing 17 02405 g002
Figure 3. Spatial pattern of wetland leaf area index (LAI) change in the China side of the Heilongjiang River Basin from 2000 to 2020. (A) Spring, (B) summer, (C) autumn, and (D) winter. The pie charts illustrate the area percentage for each spatial change pattern.
Remotesensing 17 02405 g003
Figure 4. Seasonal spatial pattern of Hurst index values for wetland leaf area index (LAI) changes in the China side of Heilongjiang River Basin from 2000 to 2020. (A) Spring, (B) summer, (C) autumn, and (D) winter.
Remotesensing 17 02405 g004
Figure 5. Correlation between 2 m specific humidity (2m SH) and wetland coverage percent in the China side of the Heilongjiang River Basin during the growing season in (A) 2000, (B) 2010, and (C) 2020.
Remotesensing 17 02405 g005
Figure 6. Relationship between 2 m specific humidity (2m SH) and wetland coverage percent in the China side of Heilongjiang River Basin during (A) spring, (B) summer, (C) autumn, and (D) winter in 2020.
Remotesensing 17 02405 g006
Figure 7. Relationship between wetland change rates and 2 m specific humidity (2m SH) changes (A,B) during the growing season and latitudinal variation in the Wetland Area Change Humidity Index (WACHI) (C,D) in the China side of Heilongjiang River Basin (CHRB) between 2003 and 2010 and between 2010 and 2020.
Remotesensing 17 02405 g007
Figure 8. The trend of the Wetland Area Change Humidity Index (WACHI) with changes in latitude in spring (A,E), summer (B,F), autumn (C,G), and winter (D,H) from 2003 to 2010 and from 2010 to 2020.
Remotesensing 17 02405 g008
Figure 9. Relationship between wetland change rates and 2 m specific humidity (2m SH) changes (A,B) during the growing season, and latitudinal variation in the Wetland Leaf Area Index Change Humidity Index (WLAICHI) (C,D) in the China side of Heilongjiang River Basin (CHRB) during 2003–2010 and 2010–2020.
Remotesensing 17 02405 g009
Figure 10. The trend of the Wetland Leaf Area Index Change Humidity Index (WLAICHI) with increasing latitude in spring (A,E), summer (B,F), autumn (C,G), and winter (D,H) between 2003 and 2010 and between 2010 and 2020.
Remotesensing 17 02405 g010
Disclaimer/Publisher’s Note: The statements, opinions and data contained in all publications are solely those of the individual author(s) and contributor(s) and not of MDPI and/or the editor(s). MDPI and/or the editor(s) disclaim responsibility for any injury to people or property resulting from any ideas, methods, instructions or products referred to in the content.

