Article

Semantic Segmentation of Rice Fields in Sub-Meter Satellite Imagery Using an HRNet-CA-Enhanced DeepLabV3+ Framework

1
National Nanfan Research Institute, Chinese Academy of Agriculture Science (CAAS), Sanya 572024, China
2
Agricultural Information Institute, Chinese Academy of Agricultural Sciences, Beijing 100081, China
3
Nanjing Institute of Agricultural Mechanization, Ministry of Agriculture and Rural Affairs, Nanjing 210014, China
4
National Agricultural Science Data Center, Beijing 100081, China
5
Institute of Western Agriculture, Chinese Academy of Agricultural Sciences, Changji 831100, China
*
Author to whom correspondence should be addressed.
Remote Sens. 2025, 17(14), 2404; https://doi.org/10.3390/rs17142404
Submission received: 22 May 2025 / Revised: 7 July 2025 / Accepted: 9 July 2025 / Published: 11 July 2025

Abstract

Accurate monitoring of rice-planting areas underpins food security and evidence-based farm management. Recent work has advanced along three complementary lines—multi-source data fusion (to mitigate cloud and spectral confusion), temporal feature extraction (to exploit phenology), and deep-network architecture optimization. However, even the best fusion- and time-series-based approaches still struggle to preserve fine spatial details in sub-meter scenes. Targeting this gap, we propose an HRNet-CA-enhanced DeepLabV3+ that retains the original model’s strengths while resolving its two key weaknesses: (i) detail loss caused by repeated down-sampling and feature-pyramid compression and (ii) boundary blurring due to insufficient multi-scale information fusion. The Xception backbone is replaced with a High-Resolution Network (HRNet) to maintain full-resolution feature streams through multi-resolution parallel convolutions and cross-scale interactions. A coordinate attention (CA) block is embedded in the decoder to strengthen spatially explicit context and sharpen class boundaries. The rice dataset consisted of 23,295 images (11,295 rice + 12,000 non-rice) via preprocessing and manual labeling and benchmarked the proposed model against classical segmentation networks. Our approach boosts boundary segmentation accuracy to 92.28% MIOU and raises texture-level discrimination to 95.93% F1, without extra inference latency. Although this study focuses on architecture optimization, the HRNet-CA backbone is readily compatible with future multi-source fusion and time-series modules, offering a unified path toward operational paddy mapping in fragmented sub-meter landscapes.

1. Introduction

As one of the world’s most important staple crops [1], rice requires accurate monitoring of its cultivation area to ensure food security, optimize agricultural resource allocation, and inform sustainable agricultural policy development [2,3,4]. Traditional farmland survey methods rely on manual field measurements, which are costly, time-consuming, and limited in spatial coverage, making them inadequate for large-scale dynamic monitoring [5,6]. Remote sensing technology, with its advantages of speed, broad coverage, and multi-temporal capabilities, has emerged as a crucial tool for agricultural informatization [7,8]. In addition, with the rapid development of deep learning in agriculture, an increasing number of studies have applied deep learning to agricultural scenarios. For instance, Seelwal et al. [9] presented a systematic review on deep learning-based rice disease diagnosis, summarizing current model trends and key challenges in field applications. Malik et al. [10]. employed analytical and deep learning techniques to assess agricultural vulnerability to climate change in the Jammu and Kashmir region, demonstrating deep learning’s capacity in multi-factor agricultural assessments. Gulzar et al. [11] enhanced soybean classification using a modified Inception model and transfer learning, highlighting improvements in generalization across varied environments. Alkanan et al. [12] focused on corn seed disease identification, leveraging MobileNetV2 combined with feature augmentation and achieving high classification performance on a small dataset. Gulzar et al. [13] optimized pear leaf disease detection using a dense residual architecture (PL-DenseNet), emphasizing the importance of fine-grained lesion recognition. Additionally, Gulzar et al. [14] proposed PlmNet for bruise detection in plums, addressing the challenge of time-sensitive detection under variable lighting through transfer learning. These recent advances demonstrate the expanding scope and adaptability of deep learning in agriculture, yet few have directly addressed the challenge of high-resolution rice field segmentation, especially in fragmented and irregular planting patterns. Our work targets this gap by focusing on preserving spatial detail and improving boundary localization in complex rice-growing environments.
In recent years, research on rice identification using remote sensing has focused on three main directions, multi-source data fusion, temporal feature extraction, and model architecture optimization, significantly improving the accuracy and efficiency of rice area mapping. In the area of multi-source data fusion, Tang Yisheng et al. [15] utilized the Google Earth Engine platform to integrate Sentinel and Landsat data and construct NDVI time series, distinguishing early-, mid-, and late-season rice using phenological features and UAV validation. Wagner et al. [16] observed subsurface scattering in C-band radar signals in arid regions and proposed an exponential model to quantify the relationship between soil moisture and scattering signals. Zhao et al. [17] developed a wheat yield prediction model by integrating an ensemble approach with multi-source data, achieving improved performance. Nevertheless, the dependence on ground-based observations poses a challenge to the scalability of remote sensing-based yield estimation methods [18,19]. In the field of temporal feature mining, Pi et al. [20] proposed a Sentinel-2 time-series data fusion method based on a multi-model scoring strategy to effectively improve the classification accuracy of rice cropping structure in the Poyang Lake area and reveal the driving role of socio-economic factors on the migration of cropping pattern through the spatio-temporal evolution law. Lin et al. [21] proposed a multi-task spatio-temporal deep learning model (LSTM-MTL) based on the Sentinel-1 SAR time-series data to construct rice growth time-series features and achieved 98.3% rice mapping accuracy in the main production area of the United States by jointly learning the regional common features and spatial specific features. Bascon et al. [22] constructed a yield prediction model by variety based on UAV multispectral imagery, combining an extreme gradient boosting model (XGBoost) and Gompertz growth curve to dynamically estimate aboveground biomass and leaf area index of rice, and found that there are differences in the optimal monitoring window period of different varieties, which provides a basis for optimizing the collection of remote sensing temporal features by a UAV. Zhang Jun et al. [23] improved the DeepLabv3+ framework for terraced field extraction by adopting the MobileNetv2 backbone to reduce computational cost and introducing a coordinate attention mechanism to enhance edge features. Zhu Chang et al. [24] focused on wheat and rapeseed classification, integrating CI/OSAVI vegetation indices at the DeepLabv3+ input layer and applying multi-level attention mechanisms to enhance crop differentiation; however, the model still exhibited misclassification issues in fine-grained segmentation of fragmented farmland. In summary, current algorithms share three major limitations: (1) insufficient model adaptability due to differences in sensor characteristics during multi-source data fusion, leading to weak generalization in complex terrains and mixed cropping areas [25,26,27]; (2) high sensitivity of temporal analysis that misses remote sensing imagery, requiring dense temporal coverage [28,29,30]; and (3) feature degradation in fragmented field identification with deep learning models, accompanied by challenges in balancing accuracy and computational efficiency [31,32]. These bottlenecks constrain the refinement of rice monitoring, highlighting the urgent need to enhance feature recognition and scene perception capabilities.

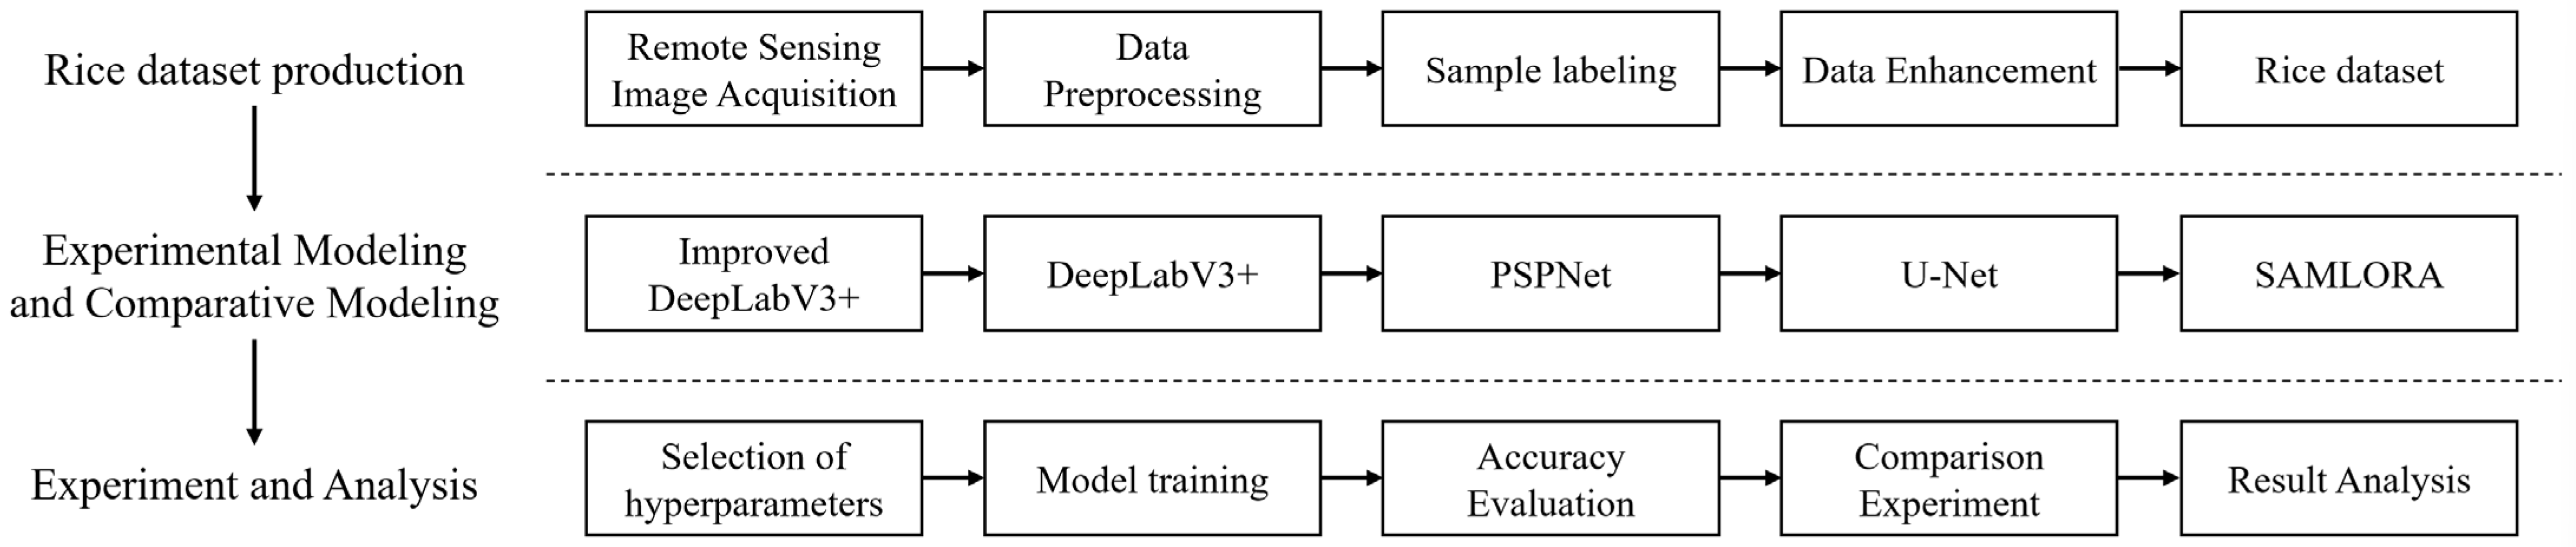
2. Materials and Methods

2.1. Study Area

Yazhou District belongs to Sanya City, Hainan Province, with geographic coordinates between 18°9′~18°37′N latitude and 108°56′~109°48′E longitude, covering a total area of 383.25 km2, with a topography that is high in the north and low in the south and with hilly mountainous terrains such as Zazao Ridge in the north and the alluvial plain of Ningyuan River in the south. Rice fields are concentrated in the alluvial plains of Ningyuan River, Wanglou River downstream, and the terraces around Nanshanling; according to the statistics in 2023, the area of a single block of 0.05~2.5 hm2 accounts for 72% of the total area, and the area of only the scaled bases such as Paotianyang (the third largest field in Hainan) is more than 5 hm2. The boundaries of the fields are divided by natural ditches, mechanized roads, and experimental fields of southern propagation, and the pattern is complicated.
Regarding the planting system, conventional rice is mainly planted in two seasons: early rice is sown in February–March, and late rice is transplanted in July-August; the southern propagation breeding fields are planted intensively from November to April [33]. The study area promotes the “vegetable-rice-green fertilizer” rotation model [34] (with an extension area of 25,000 mu in 2023), and a large number of breeding experimental fields are planted with rice during this period, so it is difficult to accurately determine the planting system for the rice fields. Therefore, in order to accurately obtain the rice planting area in Yazhou District, the distribution range of the optical remote sensing images obtained in this paper, based on the southern breeding period, is shown in Figure 1.

2.2. Data Sources and Preprocessing

In this study, we mainly used the 0.75 m high-resolution remote sensing image (RGB three-band, 8-bit) acquired by Jilin-1 HFSS; the image was taken from January 2021 to January 2024, covering the whole territory of Yazhou District, Sanya City (383.25 km2). The data were derived from “Star Chart Earth Today Imagery”, with an average cloudiness of <5%, and the detailed information of the data is shown in Table 1.
Before analyzing and applying remote sensing images, it is usually necessary to preprocess them. By preprocessing remote sensing images, image quality can be improved, noise and interference can be eliminated, image features can be enhanced, and information loss can be reduced so that remote sensing images can be better adapted to the needs of subsequent applications. In this paper, the data quality of Jilin-1 remote sensing image was improved through the operations of radiometric calibration, atmospheric correction, orthometric correction, image fusion, homogenization and color homogenization, and super-scoring reconstruction. Figure 2 illustrates the workflow of the proposed method.

2.3. Sample Labeling and Dataset Partitioning

Based on Jilin-1 0.75 m images, UAV aerial data, and field surveys, the boundaries of rice fields were manually labeled. A total of 3765 rice and 4000 non-rice 512 × 512 pixel images were originally collected, covering rice cultivation and non-cultivation areas (e.g., woodland, buildings, water bodies). To improve the model’s generalization, data augmentation techniques such as rotation and noise addition were applied. As a result, the dataset was expanded to 11,295 rice and 12,000 non-rice labeled images. The dataset was randomly split into training, validation, and test sets at a 7:2:1 ratio. Evaluation metrics on the test set included precision, recall, MIOU, and F1 Score.
To further assess class distribution and imbalance, Table 2 presents the pixel-level distribution across the two classes. The dataset shows a moderate imbalance, with non-rice samples being slightly more abundant, which reflects the spatial complexity of real-world backgrounds.
Although no class-specific balancing was performed during augmentation, both categories were augmented proportionally, and all samples retained pixel-level annotations. This ensured semantic and spatial consistency in the dataset and helped the model generalize well under natural distribution conditions.

2.4. Improved DeepLabV3+ Network

To meet the requirements of accurate segmentation of rice planting areas in remote sensing images, this study carried out in-depth improvement and optimization of the traditional DeepLabV3+ semantic segmentation framework. In this paper, based on retaining the original multi-scale contextual information capturing capability, a high-resolution feature extraction module (HRNet) and a coordinate attention mechanism (CA) with regional sensitivity were introduced. This structure not only has advantages in global semantic understanding but also shows better adaptability in spatial detail portrayal and target localization. The overall architecture of the overall improvement network is shown in Figure 3.

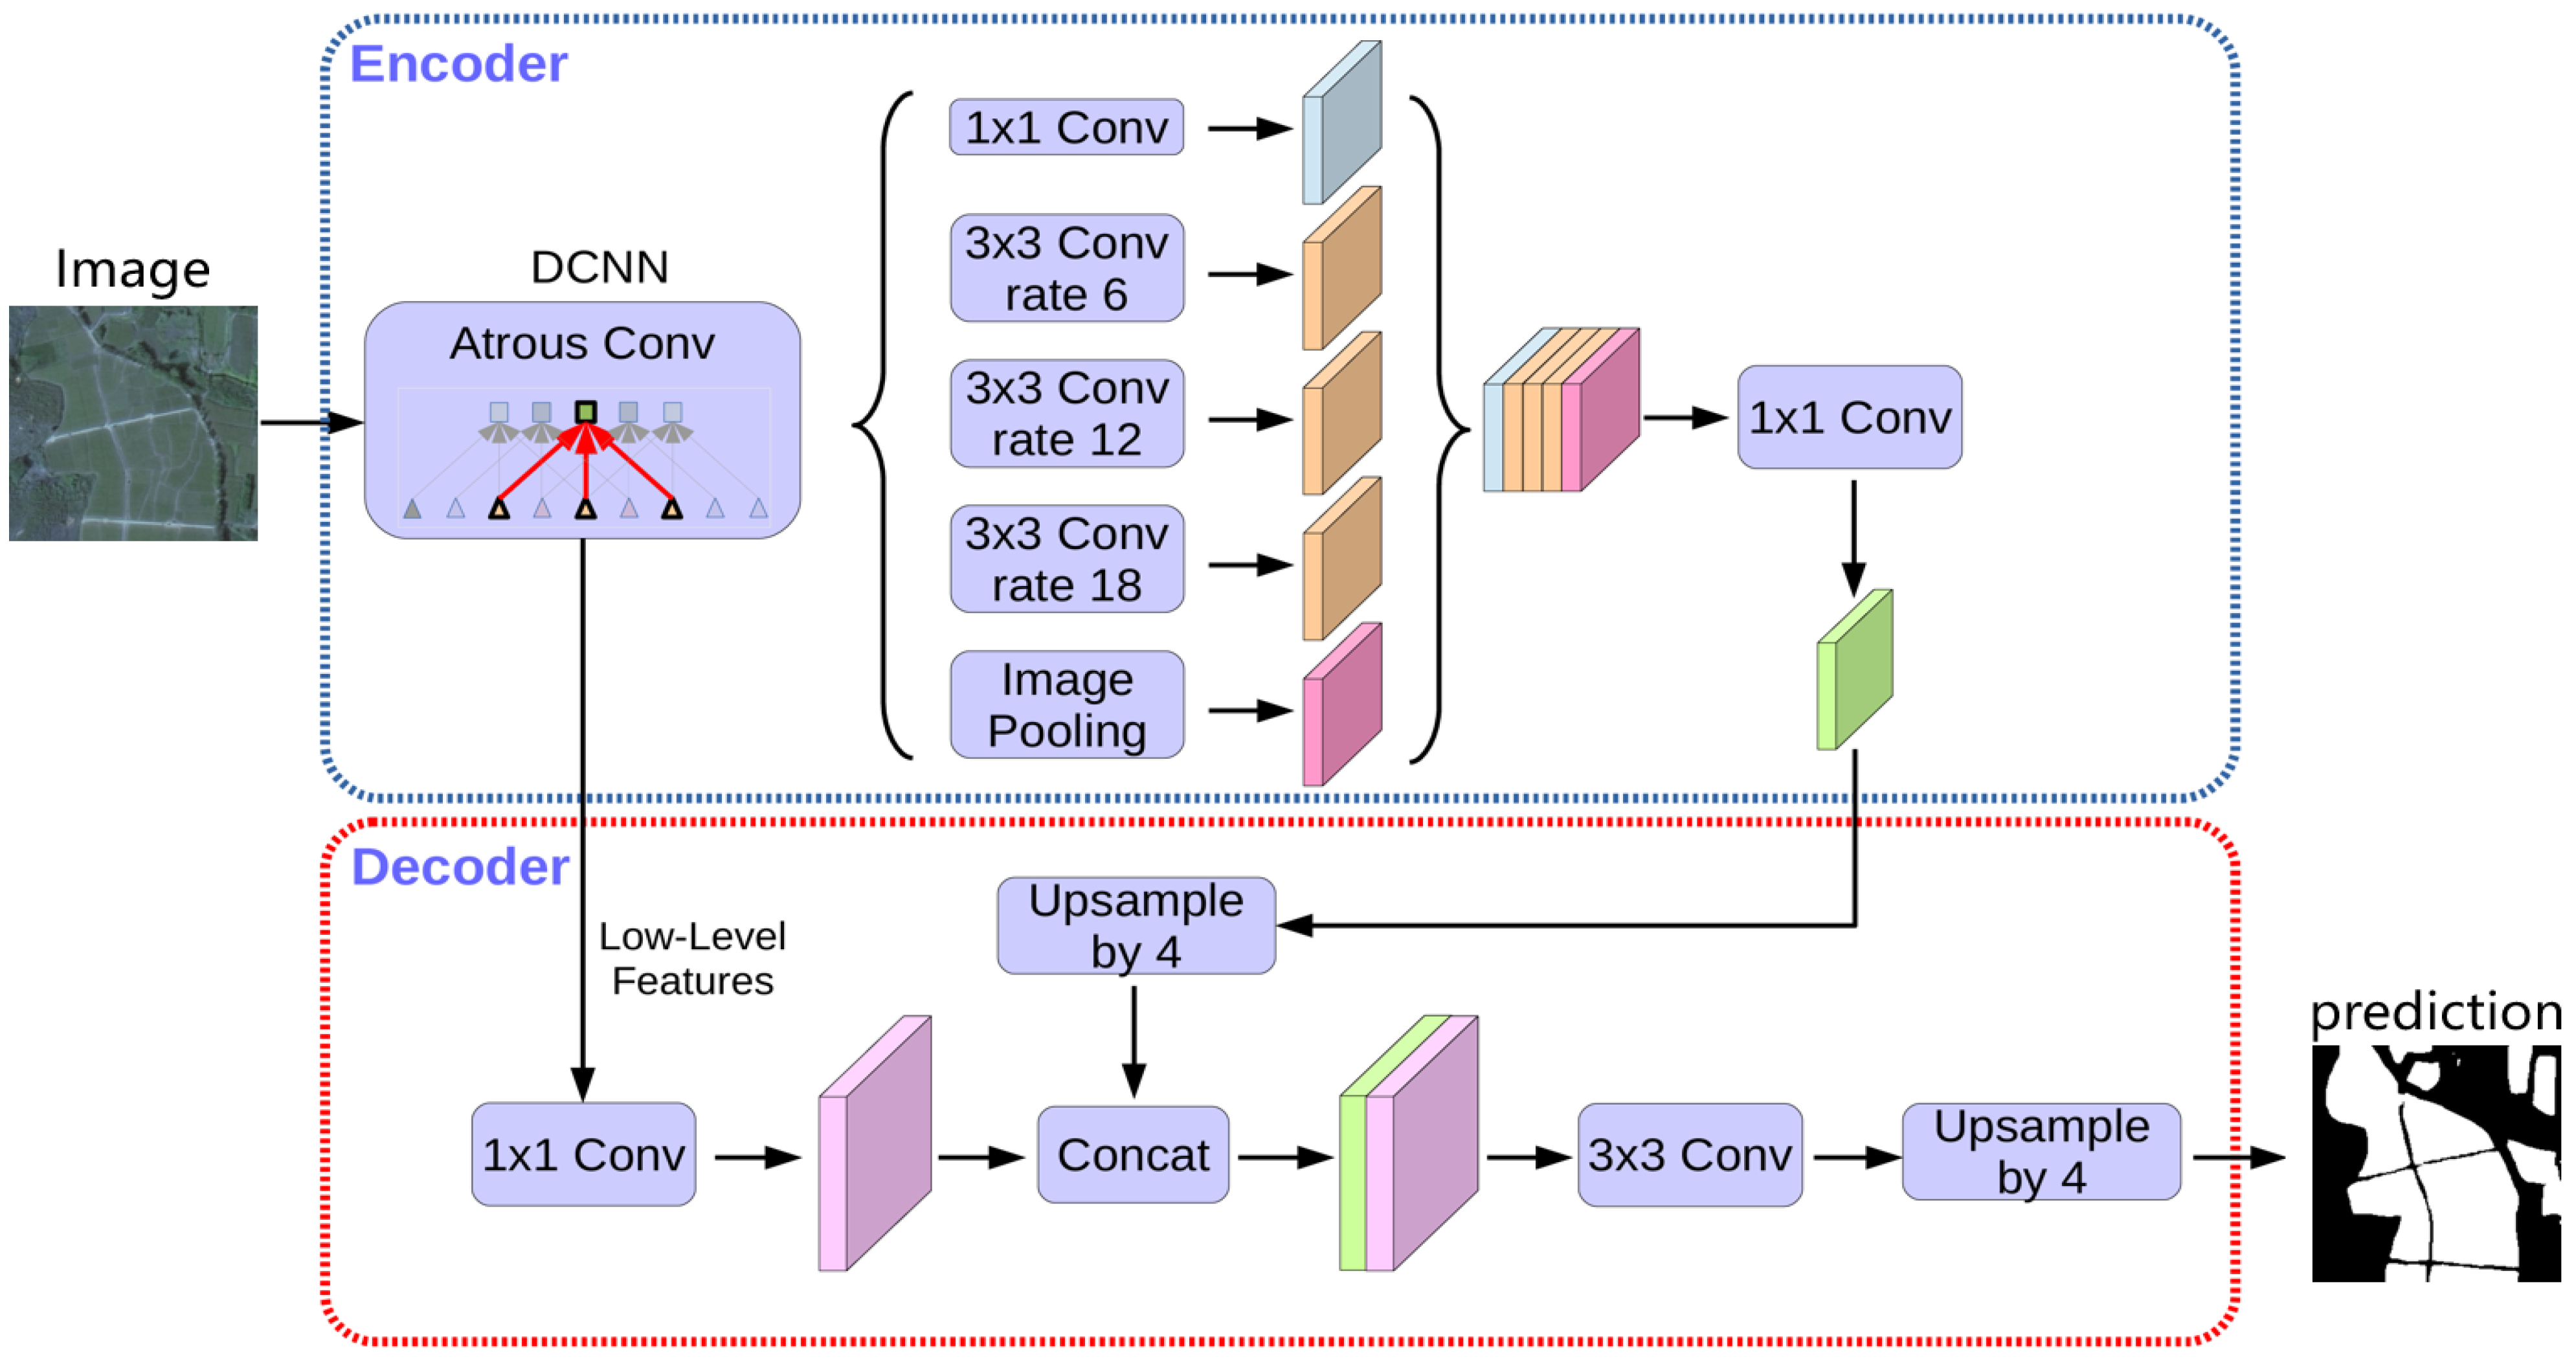
2.4.1. DeepLabV3+ Infrastructure

DeepLabV3+ was initially designed to focus on solving semantic segmentation problems in complex scenarios, and its network can be divided into two main parts: encoder and decoder. The encoder part uses Atrous Convolution combined with Atrous Spatial Pyramid Pooling (ASPP) module, which is designed to allow the model to extract rich contextual information at different scales, ensuring that a wide range of contextual information can be captured without loss of details. The decoder part effectively recovers the spatial accuracy in the segmentation results by progressively upsampling and fusing low-level detail features to ensure that the model can accurately segment the target even in complex backgrounds. This branching structure shows strong robustness and accuracy in the field of remote sensing image processing, and its network architecture diagram is shown in Figure 4. However, in the task of rice planting area segmentation in remote sensing images, the original model has the following limitations: first, the traditional backbone network (e.g., Xception) reduces the feature map size through multiple downsampling, which leads to a decrease in segmentation accuracy in the details of the edges of the rice field plots and the small fragmented areas (e.g., terraces, ditches) and a loss of the feature resolution [35]; second, the ASPP module expands the sensing field but has no impact on the remote sensing image. Second, although the ASPP module can expand the sensing field, it lacks targeted optimization for the complex spectral confusion between rice and background features (e.g., water bodies, buildings) in remote sensing images, which makes it difficult to accurately distinguish similar targets in spatial proximity, and the spatial position sensitivity is insufficient.

2.4.2. High-Resolution Network (HRNet)

In traditional convolutional neural networks, the resolution of the feature map gradually decreases due to the superposition of layers, making it difficult to retain fine-grained features. HRNet proposes a new solution to this problem, which realizes the retention of high-resolution features in the whole network by constructing multiple parallel branches, each of which maintains a different resolution and allows cross-scale information to continuously interact [36,37]. Its network structure periodically performs feature fusion among different branches, allowing low-resolution information to be synergized with high-resolution features, thus significantly enhancing the ability to capture spatial details [38,39]. This module provides a finer characterization of targets with tiny features and fuzzy edges in remote sensing images, and its network structure is shown in Figure 5, which visualizes the multiple interactions and information aggregation process among the resolution branches.
The HRNet used in this study was initialized with weights pre-trained on ImageNet. No structural modifications were made to the original HRNetv2-W48 architecture; it was directly integrated as the encoder of the segmentation model.

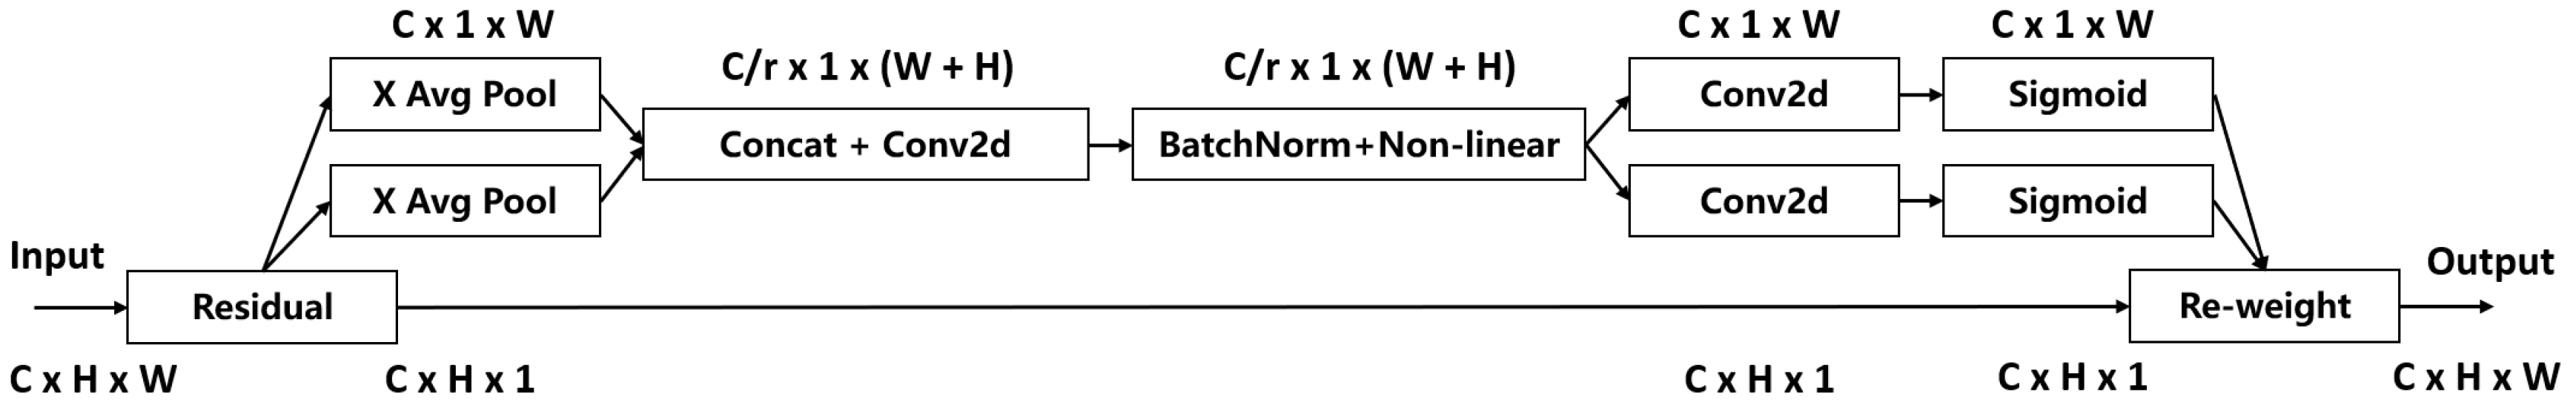
2.4.3. Coordinate Attention (CA) Mechanism

In order to further improve the model’s focusing ability when dealing with complex backgrounds and multi-scale targets, the CA mechanism was introduced in this study. Unlike the traditional channel attention module, the CA mechanism performs global average pooling independently in both horizontal and vertical directions, capturing the global dependencies in the horizontal and vertical directions, respectively. By generating the attention weights in both directions separately, the module is able to strengthen the model’s ability to differentiate between individual spatial location features and thus be more accurate in localizing the target area. The mechanism utilizes the generated direction-sensitive weights to adjust the original feature map on a channel-by-channel basis, effectively filtering out the background redundant information and improving the response strength of the target region.
The design of the CA mechanism greatly improves the model’s ability to recognize subtle features in the rice growing region, and its modular structure, as shown in Figure 6, provides an important complement to the overall segmentation network. In this architecture, the CA module is inserted after the HRNet encoder and before the Atrous Spatial Pyramid Pooling (ASPP) module. This intermediate placement allows the CA to enhance spatial and channel-wise dependencies before multi-scale context aggregation, thereby improving the model’s sensitivity to fine-grained boundary details.

2.5. Segmentation Loss Function

To optimize the model for semantic segmentation, the final output feature maps are passed through a pixel-wise softmax activation to compute class probabilities. The segmentation task is formulated as a multi-class classification problem at the pixel level and optimized using the standard cross-entropy loss. Given an input image with N pixels and C classes, the loss is defined as follows:
L C E = 1 N i = 1 N c = 1 C y i , c log ( p i , c )
where y i , c 0 , 1 indicates the ground truth label of pixel i for class c and p i , c denotes the predicted probability after softmax. The softmax probability is computed as follows:
p i , c = e x p z i , c k = 1 C e x p z i , k
where z i , c is the raw output (logit) of class c at pixel i . This formulation penalizes incorrect predictions more heavily when the confidence is high, promoting stable and accurate segmentation performance.

2.6. Evaluation Metrics and Interpretatio

To comprehensively assess the discrimination capability of the model, four widely used statistics—precision, recall, F1-Score, and Mean Intersection over Union (MIOU)—were adopted and defined as
P r e c i s i o n = T P T P + F P
R e c a l l = T P T P + F N
F 1 S c o r e = 2 × P r e c i s i o n × R e c a l l P r e c i s i o n + R e c a l l
M I O U = 1 c c = 1 c T P C T P C + F P C + F N C
Precision quantifies how many pixels predicted as rice are indeed rice, thus reflecting the ability to suppress false positives; recall measures how many actual rice pixels are correctly retrieved, indicating resistance to false negatives; F1 Score is the harmonic mean of precision and recall, balancing the two and being especially relevant for downstream acreage estimation; and MIOU evaluates the overall overlap between prediction and ground truth by averaging the intersection-over-union across classes and is the de facto holistic metric for semantic segmentation. Taken together, the four metrics allow for a comprehensive appreciation of the model’s performance with respect to boundary fidelity, miss-rate control, and overall overlap.

3. Experiments and Results

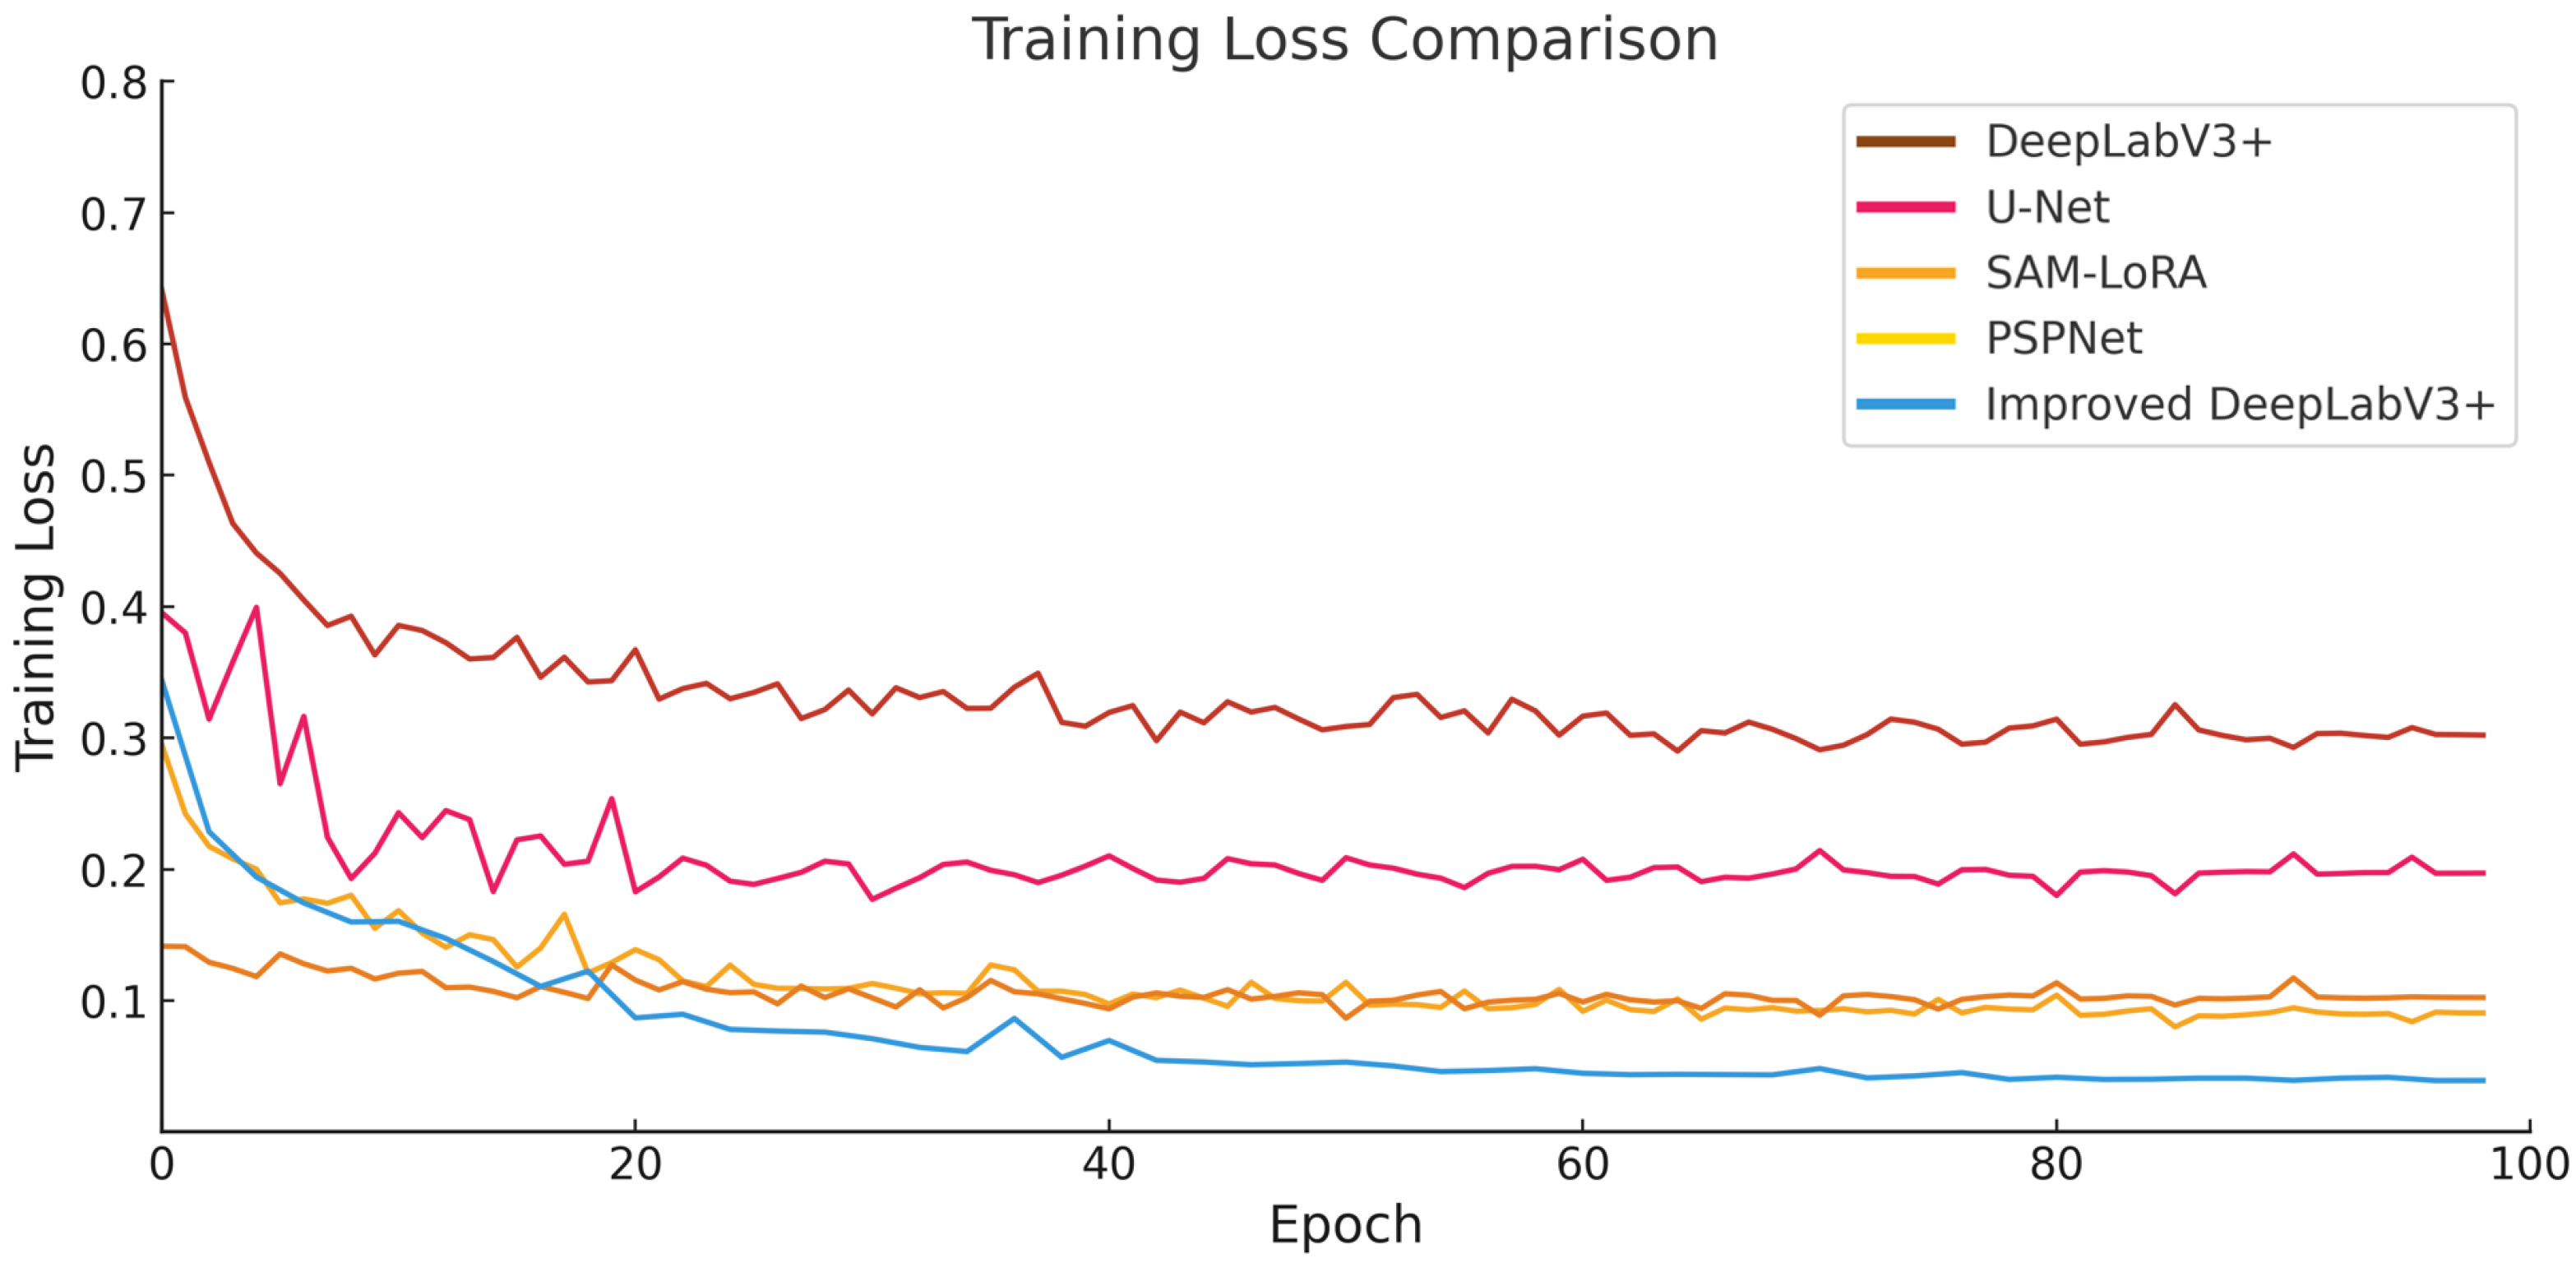
3.1. Training Settings

The hardware system of this study utilizes an Intel® Core™ i9-11900K processor (Intel Corporation, Santa Clara, CA, USA; octa-core/3.5 GHz) and an NVIDIA® GeForce RTX 3080 graphics card (NVIDIA Corporation, Santa Clara, CA, USA; 10 GB graphics memory), with 64 GB DDR4 dual-channel memory. The software environment is constructed based on the PyTorch 2.3.0 deep learning framework, and the development tools include vs. Code and Arcgis Pro 3.0.1. The key training parameters are configured as shown in Table 3, where the mixed-accuracy training is realized by CUDA 11.8.
In this study, k-fold cross-validation was not adopted. Instead, we followed a commonly used single-split strategy, dividing the dataset into training, validation, and test sets in a 7:2:1 ratio. This setup was chosen because the dataset is sufficiently large (over 23,000 labeled samples) and includes temporal diversity and spatial heterogeneity. To ensure generalizability, the test set was sampled independently from separate scenes not used during training or validation. Therefore, the single split is considered sufficient to evaluate model performance under realistic deployment scenarios.

3.2. Comparative Experiments

To verify the effectiveness of the improved model, several mainstream semantic segmentation models are selected for comparison in this study. The experimental results show that the improved DeepLabV3+ model based on HRNet with a CA mechanism demonstrates significantly superior feature extraction capability. As shown in Table 4, the improved model achieves overall leadership in the four core metrics of recall (96.89%), precision (95.01%), F1 Score (95.93%), and MIOU (92.28%), which are, respectively, 14.46%, 7.28%, 10.94%, and 8.08 percentage points higher than the original DeepLabV3+ base model. It is worth noting that the breakthrough performance of the improved model in the recall index verifies the improvement effect of the HRNet multi-scale feature fusion mechanism on the leakage detection problem of complex farmland boundaries, while the MIOU value of 92.28% highlights the ability of the CA mechanism to finely differentiate between confusing regions (e.g., rice and other vegetation), which confirms the necessity of the cross-resolution feature interactions and CA mechanism introduced in this paper.
To evaluate the convergence behavior of different segmentation models, the training loss curves across 100 epochs are plotted in Figure 7. The results show that all models generally converge, albeit with varying speeds and final loss levels. The proposed Improved DeepLabV3+ model exhibits the fastest convergence and the lowest training loss, indicating effective optimization and stable learning. Compared to baseline models such as U-Net and DeepLabV3+, which show slower convergence and higher final loss, the improved model demonstrates superior training dynamics. SAM-LoRA and PSPNet lie in between, showing moderate convergence patterns. These findings further confirm the effectiveness of our structural enhancements in guiding efficient model learning.
To comprehensively evaluate the extraction effect of the improved DeepLabV3+ model on rice planting areas in complex remote sensing image scenes, six representative small pieces of remote sensing images are selected as comparison experiment samples in this study. These six images present different interference factors and feature complexity, respectively, with strong scene diversity and challenge: Figure 8a contains a large area of water area, which is easily confused with the rice field, testing the discriminative ability of the model; Figure 8b has a mountainous terrain with obvious undulations, which requires the ability of image geometric feature recognition; in Figure 8c, there are a large number of trees, which are easily confused with the high-density rice areas; in Figure 8d, rice fields are interspersed with other crops over a large area, requiring the model to have good boundary recognition capability; in Figure 8e, multiple vegetation types are mixed in the area, and the interference background is complicated; and in Figure 8f, there is obvious cloud cover, which challenges the robustness of the model.
On the above six different types of remote sensing images, multiple mainstream semantic segmentation models are also selected for comparison in this study, and the visualization results are shown in Figure 8. The experimental results show that the proposed model exhibits better segmentation accuracy and boundary recognition ability in all types of complex scenes, especially in scenes with strong interference, such as cloud occlusion, mixed vegetation, and interspersed rice fields with other crops; the improved model can extract the rice region more accurately and significantly reduce the misclassification and miss classification, which verifies that the HRNet is effective in enhancing the feature expression ability, and the CA mechanism is effective in improving the spatial effectiveness in attention guidance.

3.3. Ablation Studies

In order to further analyze the contribution of the core modules of the model improvement, a systematic ablation experiment was designed in this study. The result evaluation metrics of each model on the test set are shown in Table 5. The experimental results show that the synergistic effect of HRNet multi-scale feature fusion and CA mechanism has a significant gain effect on model performance improvement. Under the ablation experimental framework, the base model DeepLabV3+ presents a systematic bottleneck in the four evaluation metrics, and its single-stage feature extraction architecture is limited in its ability to characterize the complex boundaries of farmland. When the HRNet module and CA module are introduced, respectively, the model performance shows differential improvement: the CA mechanism jumps the recall rate to 96.30% through spatial-channel two-dimensional attention weight allocation, which verifies its suppression effect on the omission detection of fine vegetation, while the HRNet increases the precision rate to 94.55% through multi-resolution feature interactions, which shows the continuous high-resolution characterization’s interclass confusing noise of the strong filtering ability of continuous high-resolution characterization.
To further evaluate model efficiency, Table 6 reports the number of parameters, FLOPs, and average training time per epoch for each variant in the ablation study. Introducing HRNet and CA indeed raises the computational budget, yet the overhead remains moderate relative to the accuracy gains discussed above. In particular, adding the CA module alone increases FLOPs by only ≈1.6% while yielding a notable performance boost, highlighting its lightweight nature and practical deployability.
The experimental data further reveal that the comprehensive performance breakthrough of the improved model is characterized by significant technology coupling. The model maintains the high recall property of HRNet (96.89%) while relying on the refined feature selection mechanism of the CA module to push the precision rate up to 95.01%, which is 0.46% (HRNet) and 2.81% (CA) higher than the single-module improved model, respectively. The evolution trajectory of the MIOU metrics (84.20% for the base model → HRNet 91.50% → CA 89.07% → 92.28%) clearly demonstrates the complementary advantages of the dual-module: the HRNet fuses features across layers through cross-layer feature fusion, and it (CA 89.07% → joint model 92.28%) clearly demonstrates the complementary advantages of the dual modules: HRNet enhances semantic consistency through cross-layer feature fusion, while the CA mechanism suppresses background bleed-through through attentional masking, and the synergistic effect of the two results in an 8.08% improvement in the recognition accuracy of overlapping regions between classes. The optimal balance of the improved model on F1 Score (95.93%) and MIOU (92.28%) verifies the dialectical and unified relationship between HRNet feature enrichment and CA feature purification strategies and provides a reliable technology fusion path for semantic segmentation of complex farmland scenes.

3.4. Case Study

Based on the semantic segmentation results of the improved model, this study will further verify its accuracy in extracting rice planting areas in remote sensing images. Unlike studies that compare segmentation results with government-reported rice area statistics, this work evaluates model accuracy using manually annotated labels derived from UAV observations and ground surveys. This approach ensures higher spatial and temporal consistency with the remote sensing imagery. Government statistics often count all paddy plots that have grown rice at least once within a calendar year, regardless of the specific cropping cycle or image acquisition period. Consequently, if a field underwent only one planting that falls outside the satellite’s observation window, it would still be counted in the official data but remain undetectable by the model. Therefore, direct comparison with government figures may introduce overestimation bias, whereas using human-verified annotations provides a more precise benchmark for evaluating segmentation performance. Therefore, in order to obtain the “real” rice planting area benchmark, this section takes the Po Tian Yang area in the remote sensing image of Yazhou District, Hainan Province, on 30 January 2024 as the research object and manually sketches the boundary of the rice fields in the Po Tian Yang area one by one with the help of the remote sensing image processing software on the basis of the aerial photography by unmanned aerial vehicles and the field survey as shown in Figure 9. The terrain in this area is flat, rice cultivation is concentrated, and the boundaries of the plots are clear, which is suitable for the accuracy verification of the remote sensing segmentation model.
In the area calculation process, the ellipsoid correction method was used to replace the planar projection algorithm, and a spatial datum was established by relying on the WGS84 UTM Zone 49N projected coordinate system. Firstly, we traversed all the vector surface elements of the rice planting area and counted the number of original raster pixels covered patch by patch and then converted the number of pixels into the actual area according to the ground resolution of Jilin-1 satellite pixels:
A s u m = N i × 0.5625 × 10 4 × 15
where N i is the number of pixels contained in the i-th surface element, the coefficient 15 corresponds to the conversion relationship between hectares and mu (1 ha = 15 mu), and 10 × 10−4 realizes the conversion from square meters to hectares. The calculation results show that the total area under rice cultivation in Po Tien Yang area on 30 January 2024 is 8890.71 mu, which serves as the “real area benchmark” under the manual fine annotation and provides a reliable basis for the evaluation of the subsequent segmentation model.
Subsequently, the same remote sensing image was input into the improved DeepLabV3+ model for semantic segmentation, and the “raster to surface” tool of ArcGIS Pro 3.0.1 was used to transform the binary classification results into vector surface elements; in order to eliminate the classification noise interference, the area filtering algorithm was used to filter the fine polygons generated by linear features, such as roads, ditches, and so on, using the same area calculation method as that of manual annotation, resulting in a total area estimated by the model of 8912.52 mu. The area filtering algorithm uses the minimum plot area of 10 square meters (equivalent to the coverage of 15 image elements) as the threshold value; filters the fine polygons generated by roads, ditches, and other linear features; and then adopts the same area calculation method as that of manual labeling, resulting in a total area of 8912.52 mu estimated by the model. Compared with the manual labeling results, there is a certain deviation in the model extracted area, but the two are highly close to each other, and the relative error is only 0.25%. In order to further validate the accuracy of the model proposed in this study, we conducted comparison experiments with the mainstream semantic segmentation models U-Net, DeepLabV3+, PSPNet, and SAM-LoRA again, and the results are shown in Table 7.
Comprehensive comparison results show that the improved DeepLabV3+ network proposed in this paper—incorporating HRNet high-resolution branching and coordinate attention mechanisms—outperforms the existing mainstream models in all evaluation indexes. It fully reflects its superior performance in target integrity extraction. In the real area extraction, the rice planted area extracted by this improved model is the only one higher than the real area, and the rest of the model extraction results are lower than the real value. This phenomenon indicates that high recall is of key significance for semantic segmentation models for agricultural remote sensing. Especially in the farmland extraction task, the omission of the real planted area will directly affect the accuracy of agricultural yield estimation and arable land resource regulation, and improving the recall rate is a key direction to enhance the practical application value of the remote sensing rice planted area extraction model. The improved DeepLabV3+ network proposed in this paper shows significant advantages in this aspect, which fully demonstrates the effectiveness and advancement of this method in the rice planting area extraction task of remote sensing images.

4. Discussion

In recent years, rice field semantic segmentation has attracted increasing attention, especially with the advancement of high-resolution remote sensing imagery. However, accurately identifying fragmented, irregular, or mixed-planting rice regions remains challenging due to complex land-use backgrounds and varying field geometries.
Compared to conventional methods, the proposed HRNet-CA-enhanced DeepLabV3+ shows significant improvements in spatial consistency and boundary preservation. The HRNet backbone maintains high-resolution feature representations throughout the encoding stage, which effectively reduces detail loss and enhances feature alignment across scales. The CA module further reinforces long-range spatial attention and geometric awareness, particularly for strip-like or spatially fragmented patterns.
Despite the overall high performance, several failure cases were observed. For instance, the model occasionally misclassifies dry bare soil or paved surfaces near built-up areas as rice due to spectral and texture similarity. It also struggles with curved or irregular field boundaries, where the strip-attention design of the CA module may not align well. In addition, shadowed or waterlogged regions may cause under-segmentation due to weakened visual contrast.
While the current workflow incorporates manual annotation and UAV-based field verification, its core components—satellite imagery analysis and semantic segmentation—are designed for automation and scalability. Once trained, the model can be deployed in a fully automatic inference pipeline across large agricultural areas. UAV data, though used here for verification, can support active learning frameworks by supplementing training samples. Over time, the reliance on human annotation can be gradually reduced as model generalization improves. In practical applications, this method can be embedded into regional or national-level rice monitoring platforms. By integrating it with satellite image acquisition, cloud-based model inference, and geographic information systems (GIS), large-scale paddy field mapping can be achieved with high spatial precision and low human cost. The approach is particularly suitable for countries or regions with high rice cropping intensity and limited field survey resources. Looking forward, future research may focus on integrating temporal information to distinguish rice growth stages, incorporating lightweight backbones such as HRNet-W32 for faster inference, or applying semi-supervised methods to reduce labeling costs. Exploring multi-modal fusion with SAR or hyperspectral data may further improve model robustness under extreme conditions.

5. Conclusions

In this paper, a deep learning model based on improved DeepLabV3+ is proposed for the task of accurately segmenting rice planting areas in remote sensing images. The model adopts HRNet as the backbone network in its structure, and its multi-resolution parallel architecture can effectively integrate semantic information at different scales while maintaining high-resolution features, which is especially suitable for the southern rice planting area with fragmented land parcels and significant spatial heterogeneity; at the same time, it introduces a coordinate attention mechanism to enhance the model’s ability to perceive the spatial distribution features of the target in the remotely sensed imagery by explicitly encoding the spatial location information. The model’s ability to perceive the spatial distribution features of targets in remote sensing images is enhanced by explicitly encoding the spatial location information. On the test set of remote sensing images of Yazhou district, the average intersection ratio (MIOU) and F1 Score of the proposed model reach 92.28% and 95.93%, respectively, which are 8.08 and 10.94 percentage points higher than the original DeepLabV3+ model, and the overall performance is better than that of the mainstream segmentation models, such as PSPNet and SAMLoRA model, which integrates a lightweight attention mechanism.
Although the improved DeepLabV3+ model shows high accuracy in monitoring rice plantation areas in Yazhou District, it still faces multiple challenges in practical applications. On the one hand, Hainan Island frequently encounters cloud cover during the rainy season, resulting in more missing areas in the optical remote sensing images; on the other hand, Yazhou District has a complex topography, and the fragmented layout of terraces and scattered plots in the mountains increases the difficulty of detecting small-scale targets (<10 m2). In addition, the model still suffers from a certain degree of leakage detection in such scenarios. Future research can consider integrating multi-temporal features such as time-series NDVI to enhance the model’s ability to perceive the dynamic changes of the rice fertility cycle and further improve the model’s segmentation robustness and timeliness in complex environments.

Author Contributions

Conceptualization, Y.S. and J.Z.; methodology, Y.S., P.P. and H.Z.; soft-ware, Y.S., H.Z. and J.L.; validation, Y.S., P.P. and H.Z.; writing—original draft, Y.S.; writing—review and editing, J.Z. and G.Y.; supervision, G.Z.; project administration, J.Z., G.Z. and G.Y.; funding acquisition, J.Z. All authors have read and agreed to the published version of the manuscript.

Funding

This study was funded by the Special Funding for Science and Technology of Sanya Yazhou Bay Science and Technology City (SCKJ-JYRC-2023-45); National Key R&D Program (2022YFF0711805, 2022YFF0711801); Natural Science Foundation of Hainan Province (325MS155); Special Funding for Southern Propagation of the National Institute of Southern Propagation Research, Chinese Academy of Agricultural Sciences, Sanya (YBXM2409, YBXM2410, YBXM2508, YBXM2509); Special Funding for Basic Scientific Research Operations of Central-level Public Welfare Research Institutes (JBYW-AII-2024-05, JBYW-AII-2025-05, Y2025YC90); and Science and Technology Innovation Project of the Chinese Academy of Agricultural Sciences (CAAS-ASTIP-2024-AII); Hainan Provincial Graduate Student Innovative Research Project (Qhys2024-561).

Data Availability Statement

The data that support the findings of this study are available from the corresponding author upon reasonable request.

Conflicts of Interest

The authors declare no conflicts of interest.

Abbreviations

The following abbreviations are used in this manuscript:
HRNetHigh-Resolution Network
CACoordinate Attention

References

  1. Ramos-Fernández, L.; Gonzales-Quiquia, M.; Huanuqueño-Murillo, J.; Tito-Quispe, D.; Heros-Aguilar, E.; Flores del Pino, L.; Torres-Rua, A. Water Stress Index and Stomatal Conductance under Different Irrigation Regimes with Thermal Sensors in Rice Fields on the Northern Coast of Peru. Remote Sens. 2024, 16, 796. [Google Scholar] [CrossRef]
  2. Xu, T.; Wang, F.; Shi, Z.; Miao, Y. Multi-scale monitoring of rice aboveground biomass by combining spectral and textural information from UAV hyperspectral images. Int. J. Appl. Earth Obs. Geoinf. 2024, 127, 103655. [Google Scholar] [CrossRef]
  3. Jiang, P.; Zhou, X.; Zhang, L.; Liu, M.; Xiong, H.; Guo, X.; Zhu, Y.; Luo, J.; Chen, L.; Liu, J.; et al. Improving Rice Yield by Promoting Pre-anathesis Growth in Subtropical Environments. Agronomy 2023, 13, 820. [Google Scholar] [CrossRef]
  4. Mallareddy, M.; Thirumalaikumar, R.; Balasubramanian, P.; Naseeruddin, R.; Nithya, N.; Mariadoss, A.; Eazhilkrishna, N.; Choudhary, A.K.; Deiveegan, M.; Subramanian, E.; et al. Maximizing Water Use Efficiency in Rice Farming: A Comprehensive Review of Innovative Irrigation Management Technologies. Water 2023, 15, 1802. [Google Scholar] [CrossRef]
  5. Kurihara, J.; Nagata, T.; Tomiyama, H. Rice Yield Prediction in Different Growth Environments Using Unmanned Aerial Vehicle-Based Hyperspectral Imaging. Remote Sens. 2023, 15, 2004. [Google Scholar] [CrossRef]
  6. Luo, S.; Jiang, X.; Jiao, W.; Yang, K.; Li, Y.; Fang, S. Remotely Sensed Prediction of Rice Yield at Different Growth Durations Using UAV Multispectral Imagery. Agriculture 2022, 12, 1447. [Google Scholar] [CrossRef]
  7. Franch, B.; Bautista, A.S.; Fita, D.; Rubio, C.; Tarrazó-Serrano, D.; Sánchez, A.; Skakun, S.; Vermote, E.; Becker-Reshef, I.; Uris, A. Within-Field Rice Yield Estimation Based on Sentinel-2 Satellite Data. Remote Sens. 2021, 13, 4095. [Google Scholar] [CrossRef]
  8. Zhou, X.; Zheng, H.B.; Xu, X.Q.; He, J.Y.; Ge, X.K.; Yao, X.; Cheng, T.; Zhu, Y.; Cao, W.X.; Tian, Y.C. Predicting grain yield in rice using multi-temporal vegetation indices from UAV-based multispectral and digital imagery. Isprs J. Photogramm. Remote Sens. 2017, 130, 246–255. [Google Scholar] [CrossRef]
  9. Seelwal, P.; Dhiman, P.; Gulzar, Y.; Kaur, A.; Wadhwa, S.; Onn, C. A systematic review of deep learning applications for rice disease diagnosis: Current trends and future directions. Front. Comput. Sci. 2024, 6, 1452961. [Google Scholar] [CrossRef]
  10. Malik, I.; Ahmed, M.; Gulzar, Y.; Baba, S.H.; Mir, M.S.; Soomro, A.B.; Sultan, A.; Elwasila, O. Estimation of the Extent of the Vulnerability of Agriculture to Climate Change Using Analytical and Deep-Learning Methods: A Case Study in Jammu, Kashmir, and Ladakh. Sustainability 2023, 15, 11465. [Google Scholar] [CrossRef]
  11. Gulzar, Y. Enhancing soybean classification with modified inception model: A transfer learning approach. Emir. J. Food Agric. 2024, 36, 1–9. [Google Scholar] [CrossRef]
  12. Alkanan, M.; Gulzar, Y. Enhanced corn seed disease classification: Leveraging MobileNetV2 with feature augmentation and transfer learning. Front. Appl. Math. Stat. 2024, 9, 1320177. [Google Scholar] [CrossRef]
  13. Gulzar, Y.; Unal, Z. Optimizing Pear Leaf Disease Detection Through PL-DenseNet. Appl. Fruit Sci. 2025, 67, 40. [Google Scholar] [CrossRef]
  14. Gulzar, Y.; Nal, Z. Time-Sensitive Bruise Detection in Plums Using PlmNet with Transfer Learning. Procedia Comput. Sci. 2025, 257, 127–132. [Google Scholar] [CrossRef]
  15. Tang, Y.; Sun, X.; Chen, Q.; Tang, J.; Chen, W.; Huang, X. Rice Identification Based on Remote Sensing Big Data Cloud Computing. Spacecr. Recovery Remote Sens. 2022, 43, 113–123. [Google Scholar]
  16. Wagner, W.; Lindorfer, R.; Melzer, T.; Hahn, S.; Bauer-Marschallinger, B.; Morrison, K.; Calvet, J.C.; Hobbs, S.; Quast, R.; Greimeister-Pfeil, I.; et al. Widespread occurrence of anomalous C-band backscatter signals in arid environments caused by subsurface scattering. Remote Sens. Environ. 2022, 276, 113025. [Google Scholar] [CrossRef]
  17. Saravia, D.; Salazar, W.; Valqui-Valqui, L.; Quille-Mamani, J.; Porras-Jorge, R.; Corredor, F.-A.; Barboza, E.; Vásquez, H.V.; Casas Diaz, A.V.; Arbizu, C.I. Yield Predictions of Four Hybrids of Maize (Zea mays) Using Multispectral Images Obtained from UAV in the Coast of Peru. Agronomy 2022, 12, 2630. [Google Scholar] [CrossRef]
  18. Su, X.; Wang, J.; Ding, L.; Lu, J.; Zhang, J.; Yao, X.; Cheng, T.; Zhu, Y.; Cao, W.; Tian, Y. Grain yield prediction using multi-temporal UAV-based multispectral vegetation indices and endmember abundance in rice. Field Crops Res. 2023, 299, 108992. [Google Scholar] [CrossRef]
  19. Quille-Mamani, J.A.; Ruiz, L.A.; Ramos-Fernández, L. Rice Crop Yield Prediction from Sentinel-2 Imagery Using Phenological Metric. Environ. Sci. Proc. 2023, 28, 16. [Google Scholar]
  20. Pi, F.; Chen, Y.; Huang, G.; Lei, S.; Hong, D.; Ding, N.; Shi, Y. Tracking and analyzing the spatio-temporal changes of rice planting structure in Poyang Lake using multi-model fusion method with sentinel-2 multi temporal data. PLoS ONE 2025, 20, e0320781. [Google Scholar] [CrossRef]
  21. Lin, Z.; Zhong, R.; Xiong, X.; Guo, C.; Xu, J.; Zhu, Y.; Xu, J.; Ying, Y.; Ting, K.C.; Huang, J.; et al. Large-Scale Rice Mapping Using Multi-Task Spatiotemporal Deep Learning and Sentinel-1 SAR Time Series. Remote Sens. 2022, 14, 699. [Google Scholar] [CrossRef]
  22. Bascon, M.V.; Nakata, T.; Shibata, S.; Takata, I.; Kobayashi, N.; Kato, Y.; Inoue, S.; Doi, K.; Murase, J.; Nishiuchi, S. Estimating Yield-Related Traits Using UAV-Derived Multispectral Images to Improve Rice Grain Yield Prediction. Agriculture 2022, 12, 1141. [Google Scholar] [CrossRef]
  23. Zhang, J.; Chen, Y.-y.; Qin, Z.-y.; Zhang, M.-y.; Zhang, J. Remote sensing extraction method of terraced fields based on improved DeepLab v3+. Smart Agric. 2024, 6, 46–57. [Google Scholar] [CrossRef]
  24. Chang, Z.; Li, H.; Chen, D.H.; Liu, Y.F.; Zou, C.; Chen, J.; Han, W.J.; Liu, S.S.; Zhang, N.M. Crop Type Identification Using High-Resolution Remote Sensing Images Based on an Improved DeepLabV3+Network. Remote Sens. 2023, 15, 5088. [Google Scholar] [CrossRef]
  25. Sun, L.; Yang, T.; Lou, Y.; Shi, Q.; Zhang, L. Paddy Rice Mapping Based on Phenology Matching and Cultivation Pattern Analysis Combining Multi-Source Data in Guangdong, China. J. Remote Sens. 2024, 4, 0152. [Google Scholar] [CrossRef]
  26. Wang, Y.; Tao, F.; Chen, Y.; Yin, L. Mapping irrigation regimes in Chinese paddy lands through multi-source data assimilation. Agric. Water Manag. 2024, 304, 109083. [Google Scholar] [CrossRef]
  27. Meng, L.; Li, Y.; Shen, R.; Zheng, Y.; Pan, B.; Yuan, W.; Li, J.; Zhuo, L. Large-scale and high-resolution paddy rice intensity mapping using downscaling and phenology-based algorithms on Google Earth Engine. Int. J. Appl. Earth Obs. Geoinf. 2024, 128, 103725. [Google Scholar] [CrossRef]
  28. Liu, Y.; Wang, B.; Tao, J.; Tian, S.; Sheng, Q.; Li, J.; Wang, S.; Liu, X.; He, H. Canopy structure dynamics constraints and time sequence alignment for improving retrieval of rice leaf area index from multi-temporal Sentinel-1 imagery. Comput. Electron. Agric. 2024, 227, 109658. [Google Scholar] [CrossRef]
  29. Tian, S.; Sheng, Q.; Cui, H.; Zhang, G.; Li, J.; Wang, B.; Xie, Z. Rice recognition from Sentinel-1 SLC SAR data based on progressive feature screening and fusion. Int. J. Appl. Earth Obs. Geoinf. 2024, 134, 104196. [Google Scholar] [CrossRef]
  30. Gao, Y.; Pan, Y.; Zhu, X.; Li, L.; Ren, S.; Zhao, C.; Zheng, X. FARM: A fully automated rice mapping framework combining Sentinel-1 SAR and Sentinel-2 multi-temporal imagery. Comput. Electron. Agric. 2023, 213, 108262. [Google Scholar] [CrossRef]
  31. Xia, L.; Zhang, R.; Chen, L.; Li, L.; Yi, T.; Chen, M. Monitoring the leaf damage by the rice leafroller with deep learning and ultra-light UAV. Pest Manag. Sci. 2024, 80, 6620–6633. [Google Scholar] [CrossRef] [PubMed]
  32. Gao, R.; Chang, P.; Chang, D.; Tian, X.; Li, Y.; Ruan, Z.; Su, Z. RTAL: An edge computing method for real-time rice lodging assessment. Comput. Electron. Agric. 2023, 215, 108386. [Google Scholar] [CrossRef]
  33. Jiang, M.; Xin, L.; Li, X.; Tan, M.; Wang, R. Decreasing Rice Cropping Intensity in Southern China from 1990 to 2015. Remote Sens. 2018, 11, 35. [Google Scholar] [CrossRef]
  34. Gao, S.; Zhou, G.; Rees, R.M.; Cao, W. Green manuring inhibits nitrification in a typical paddy soil by changing the contributions of ammonia-oxidizing archaea and bacteria. Appl. Soil Ecol. 2020, 156, 103698. [Google Scholar] [CrossRef]
  35. Chen, L.-C.; Zhu, Y.; Papandreou, G.; Schroff, F.; Adam, H. Encoder-Decoder with Atrous Separable Convolution for Semantic Image Segmentation. In Proceedings of the 15th European Conference on Computer Vision (ECCV), Munich, Germany, 8–14 September 2018; pp. 833–851. [Google Scholar]
  36. Liu, J.; Li, D.; Xu, X. Enhancing bridge damage detection with Mamba-Enhanced HRNet for semantic segmentation. PLoS ONE 2024, 19, e0312136. [Google Scholar] [CrossRef]
  37. Yang, X.; Fan, X.; Peng, M.; Guan, Q.; Tang, L. Semantic segmentation for remote sensing images based on an AD-HRNet model. Int. J. Digit. Earth 2022, 15, 2376–2399. [Google Scholar] [CrossRef]
  38. Seong, S.; Choi, J. Semantic Segmentation of Urban Buildings Using a High-Resolution Network (HRNet) with Channel and Spatial Attention Gates. Remote Sens. 2021, 13, 3087. [Google Scholar] [CrossRef]
  39. Li, R.; Yan, A.; Yang, S.; He, D.; Zeng, X.; Liu, H. Human Pose Estimation Based on Efficient and Lightweight High-Resolution Network (EL-HRNet). Sensors 2024, 24, 396. [Google Scholar] [CrossRef]
Figure 1. Remote sensing image location distribution.
Remotesensing 17 02404 g001
Figure 2. Research workflow.
Remotesensing 17 02404 g002
Figure 3. HRNet-CA-enhanced DeepLabV3+ framework.
Remotesensing 17 02404 g003
Figure 4. DeepLabV3+ network architecture.
Remotesensing 17 02404 g004
Figure 5. High-Resolution Network (HRNet) architecture.
Remotesensing 17 02404 g005
Figure 6. Coordinate attention (CA) mechanism architecture.
Remotesensing 17 02404 g006
Figure 7. Training loss curves of five semantic segmentation models across 100 epochs.
Remotesensing 17 02404 g007
Figure 8. Comparison of prediction results from different models. (a) contains a large area of water area; (b) has a mountainous terrain with obvious undulations; (c) there are a large number of trees; (d) rice fields are interspersed with other crops over a large area; (e) multiple vegetation types are mixed in the area; (f) there is obvious cloud cover.
Remotesensing 17 02404 g008
Figure 9. Delineated paddy-field boundaries (red polygons) overlaid on a GF-2 true-colour image of the Po Tian Yang region.
Remotesensing 17 02404 g009
Table 1. Description of remote sensing image data.
NameArea/km2Collection TimeSensorCloudiness/%Satellite
Tianya District 1 m resolution image24.4719 January 20241mCCD20.0GF-2
Hainan Province 0.75 m resolution image26.798 January 2024PMS20.0JL1GF02B
Yazhou District 1 m resolution image302.3419 January 20241mCCD10.0GF-2
Yazhou District 0.75 m resolution image119.209 December 2023PMS2.0JL1GF03D24
Tianya District 0.75 m resolution image162.5417 November 2023PMS1.0JL1GF03D34
Yazhou District 0.75 m resolution image76.797 January 2024PMS1.0JL1GF03D12
Yazhou District 0.75 m resolution image52.4417 November 2023PMS4.0JL1GF03D05
Yazhou District 0.75 m resolution image204.1517 November 2023PMS2.0JL1GF03D05
0.75 m resolution image111.5330 January 2021PMS040.0JL1KF01A
0.75 m resolution image82.4830 January 2021PMS050.0JL1KF01A
Yazhou District 0.75 m Resolution Image197.9730 January 2021PMS050.0JL1KF01A
Yazhou District 0.75 m resolution image56.8528 November 2023PMS21.0JL1GF02B
0.75 m resolution image280.5128 November 2023PMS10.0JL1GF02B
0.75 m resolution image72.1528 November 2023PMS20.0DP04
Yazhou District 0.75 m resolution image260.3413 December 2022PMS20.0JL1GF02B
Tianya District 0.75 m resolution image53.6913 December 2022PMS10.0JL1GF02B
Yazhou District 0.75 m resolution image87.5313 December 2022PMS20.0JL1GF02B
Table 2. Image-level class distribution before and after augmentation.
ClassOriginal ImagesAugmented ImagesTotal ImagesProportion/%
Rice3765753011,29548.5
Non-rice4000800012,00051.5
Total776515,53023,295100
Table 3. Hyper parameter setting.
ParametersSetting
Image Size512 × 512
Batch Size8
Max Epoch100
OptimizerAdam
Learning Rate0.0001
loss functionCross-Entropy Loss
Table 4. Evaluation indicators for comparative experiment.
Network ModelsRecall/%Precision/%F1 Score/%MIOU/%
U-Net87.0286.7786.8985.90
PSPNet89.2490.2689.7588.75
SAMLoRA88.6188.8088.7187.68
DeepLabV3+82.4387.7384.9984.20
Improved DeepLabV3+96.8995.0195.9392.28
Table 5. Evaluation indicators for ablation experiment.
VariantRecall/%Precision/%F1 Score/%MIOU/%
Baseline (DeepLabV3+)82.4387.7384.9984.20
+ HRNet96.4794.5595.5191.50
+ CA96.3092.2094.1489.07
+ HRNet + CA96.8995.0195.9392.28
Table 6. Parameter, computational complexity and training speed of ablation variants.
VariantParams/MFLOPs/GAvg Epoch Time/s
Baseline (DeepLabV3+)42.0178.732.5
+ HRNet66.521045.8
+ CA42.6181.633.7
+ HRNet + CA67.121346.2
Table 7. Comparison of extracted area errors by model.
Network ModelsMIOU/%Recall/%Extracted Area/AcreError Rate/%
U-Net85.9087.028524.074.12
PSPNet88.7589.248677.742.40
SAMLoRA87.6888.618638.892.83
DeepLabV3+84.2082.438565.013.66
Improved DeepLabV3+92.2896.898912.520.25
Disclaimer/Publisher’s Note: The statements, opinions and data contained in all publications are solely those of the individual author(s) and contributor(s) and not of MDPI and/or the editor(s). MDPI and/or the editor(s) disclaim responsibility for any injury to people or property resulting from any ideas, methods, instructions or products referred to in the content.

