Article

Mapping Subtidal Marine Forests in the Mediterranean Sea Using Copernicus Contributing Mission

by
Dimitris Poursanidis
1,2,* and
Stelios Katsanevakis
2
1
Foundation for Research and Technology—Hellas (FORTH), Institute of Applied and Computational Mathematics, N. Plastira 100, Vassilika Vouton, 70013 Heraklion, Greece
2
Department of Marine Sciences, University of the Aegean, 81100 Mytilene, Greece
*
Author to whom correspondence should be addressed.
Remote Sens. 2025, 17(14), 2398; https://doi.org/10.3390/rs17142398
Submission received: 11 June 2025 / Revised: 8 July 2025 / Accepted: 10 July 2025 / Published: 11 July 2025
(This article belongs to the Special Issue Marine Ecology and Biodiversity by Remote Sensing Technology)

Abstract

Mediterranean subtidal reefs host ecologically significant habitats, including forests of Cystoseira spp., which form complex benthic communities within the photic zone. These habitats are increasingly degraded due to climate change, invasive species, and anthropogenic pressures, particularly in the eastern Mediterranean. In support of habitat monitoring under the EU Natura 2000 directive and the Nature Restoration Regulation, this study investigates the utility of high-resolution satellite remote sensing for mapping subtidal brown algae and associated benthic classes. Using imagery from the SuperDove sensor (Planet Labs, San Francisco, CA, USA), we developed an integrated mapping workflow at the Natura 2000 site GR2420009. Aquatic reflectance was derived using ACOLITE v.20250114.0, and both supervised classification and spectral unmixing were implemented in the EnMAP Toolbox v.3.16.3 within QGIS. A Random Forest classifier (100 fully grown trees) achieved high thematic accuracy across all habitat types (F1 scores: 0.87–1.00), with perfect classification of shallow soft bottoms and strong performance for Cystoseira s.l. (F1 = 0.94) and Seagrass (F1 = 0.93). Spectral unmixing further enabled quantitative estimation of fractional cover, with high predictive accuracy for deep soft bottoms (R2 = 0.99; RPD = 18.66), shallow soft bottoms (R2 = 0.98; RPD = 8.72), Seagrass (R2 = 0.88; RPD = 3.01) and Cystoseira s.l. (R2 = 0.82; RPD = 2.37). The lower performance for rocky reefs with other cover (R2 = 0.71) reflects spectral heterogeneity and shadowing effects. The results highlight the effectiveness of combining classification and unmixing approaches for benthic habitat mapping using CubeSat constellations, offering scalable tools for large-area monitoring and ecosystem assessment. Despite challenges in field data acquisition, the presented framework provides a robust foundation for remote sensing-based conservation planning in optically shallow marine environments.

1. Introduction

The ocean plays a fundamental role in regulating Earth’s climate, supporting biodiversity, and providing essential ecosystem services, including food provision, carbon sequestration, and coastal protection. However, human activities are driving unprecedented changes in the marine environment through climate change, pollution, habitat destruction, and overexploitation of resources. Ocean warming and acidification are particularly severe threats, with widespread consequences for marine ecosystems and human societies [1,2]. Global projections indicate that many ecosystems will experience a decline in biodiversity, habitat complexity, and trophic stability due to these combined stressors. Coral reefs, kelp forests, and Seagrass meadows are particularly vulnerable, with some regions already experiencing severe degradation [3,4]. Coastal communities dependent on fisheries and tourism are especially at risk due to declining fish stocks and habitat loss [5].
The Mediterranean Sea, a global biodiversity hotspot, is disproportionally affected by climate change [6,7,8,9,10,11,12]. Marine heat waves, invasive species, and habitat loss due to coastal development linked to tourism are key factors shaping the current situation [12,13]. Shallow reefs, once supporting rich biodiversity, have seen a decline in foundation species notably within the order Fucales, Bory de Saint-Vincent, 1827, particularly the Cystoseira genus, C. Agardh, 1820, Sensu lato (s.l.), which includes the Cystoseira, Ericaria, and Gongolaria genera. Cystoseira s.l. forests are among the most important foundation species in the shallow rocky reefs of the Mediterranean Sea and the warm temperate northeast Atlantic Ocean [14]. They create complex habitats and are essential for biodiversity and ecosystem functioning. In the Mediterranean Sea, approximately two-thirds of the estimated 28 Cystoseira s.l. species are endemic, with new species still being described [15,16].
Over the last few decades, Mediterranean Cystoseira s.l. populations have sharply declined due to human and climate-driven pressures [17]. Recent studies have highlighted the vulnerability of Cystoseira s.l. species to habitat destruction, eutrophication, pollution, invasive species, and trophic cascades from overfishing [18]. Most of the Cystoseira s.l. species are protected under the Barcelona Convention (Annex II, COM/2009/0585 FIN) and the Bern Convention (Annex I), and they are listed as vulnerable by the IUCN, RAC/SPA, and MedPAN. Despite reforestation and protection efforts, these forests continue to decline [19,20,21].
Marine Protected Areas (MPAs) aim to safeguard critical ecosystems but their effectiveness for Cystoseira s.l. remains understudied. Several restoration initiatives, such as the ROC-POP-LIFE [22] and REEForest [23] projects, have focused on the restoration of Cystoseira s.l. forests but challenges remain due to the slow growth and low reproductive rates of Cystoseira s.l. species along with persisting pressures. For instance, deep-water Cystoseira zosteroides forests demonstrate slow population dynamics akin to long-lived terrestrial perennials, thus rendering them highly susceptible to environmental disturbances [24,25,26]. It is imperative to implement continuous monitoring and adaptive management strategies to halt the decline of Cystoseira s.l. forests. Effective conservation and restoration strategies are urgently needed to preserve these fundamental species and the ecosystem services they provide. Accurate mapping of Cystoseira s.l. forests is a cornerstone of monitoring efforts and necessary for assessing their status and trends. In the EU, this is essential for developing programs of measures for achieving Good Environmental Status (GES) under the Marine Strategy Framework Directive (MSFD) and restoring algal canopy forests under the Nature Restoration Regulation (NRR). By mid-2026, EU member states must establish habitat baselines to guide National Restoration Plans. Habitat extent is a key metric, yet large-scale mapping of Cystoseira s.l. forests is lacking.
Satellite remote sensing has been widely used to map a variety of marine habitats, such as Seagrasses [27,28,29,30] and surface canopy-forming algae such as kelp and sargassum [31,32,33]. However, no study to date has employed these methods to map Cystoseira s.l. forests. In this study, we leverage high-resolution PlanetLabs imagery (a Copernicus Contributing Mission) to map Cystoseira s.l. forests in the eastern Mediterranean Sea. The methodology is refined through a case study on Skyros Island [34], a unique site in the Aegean Sea where extensive Cystoseira forests persist in geomorphic settings favorable for satellite mapping.

2. Materials and Methods
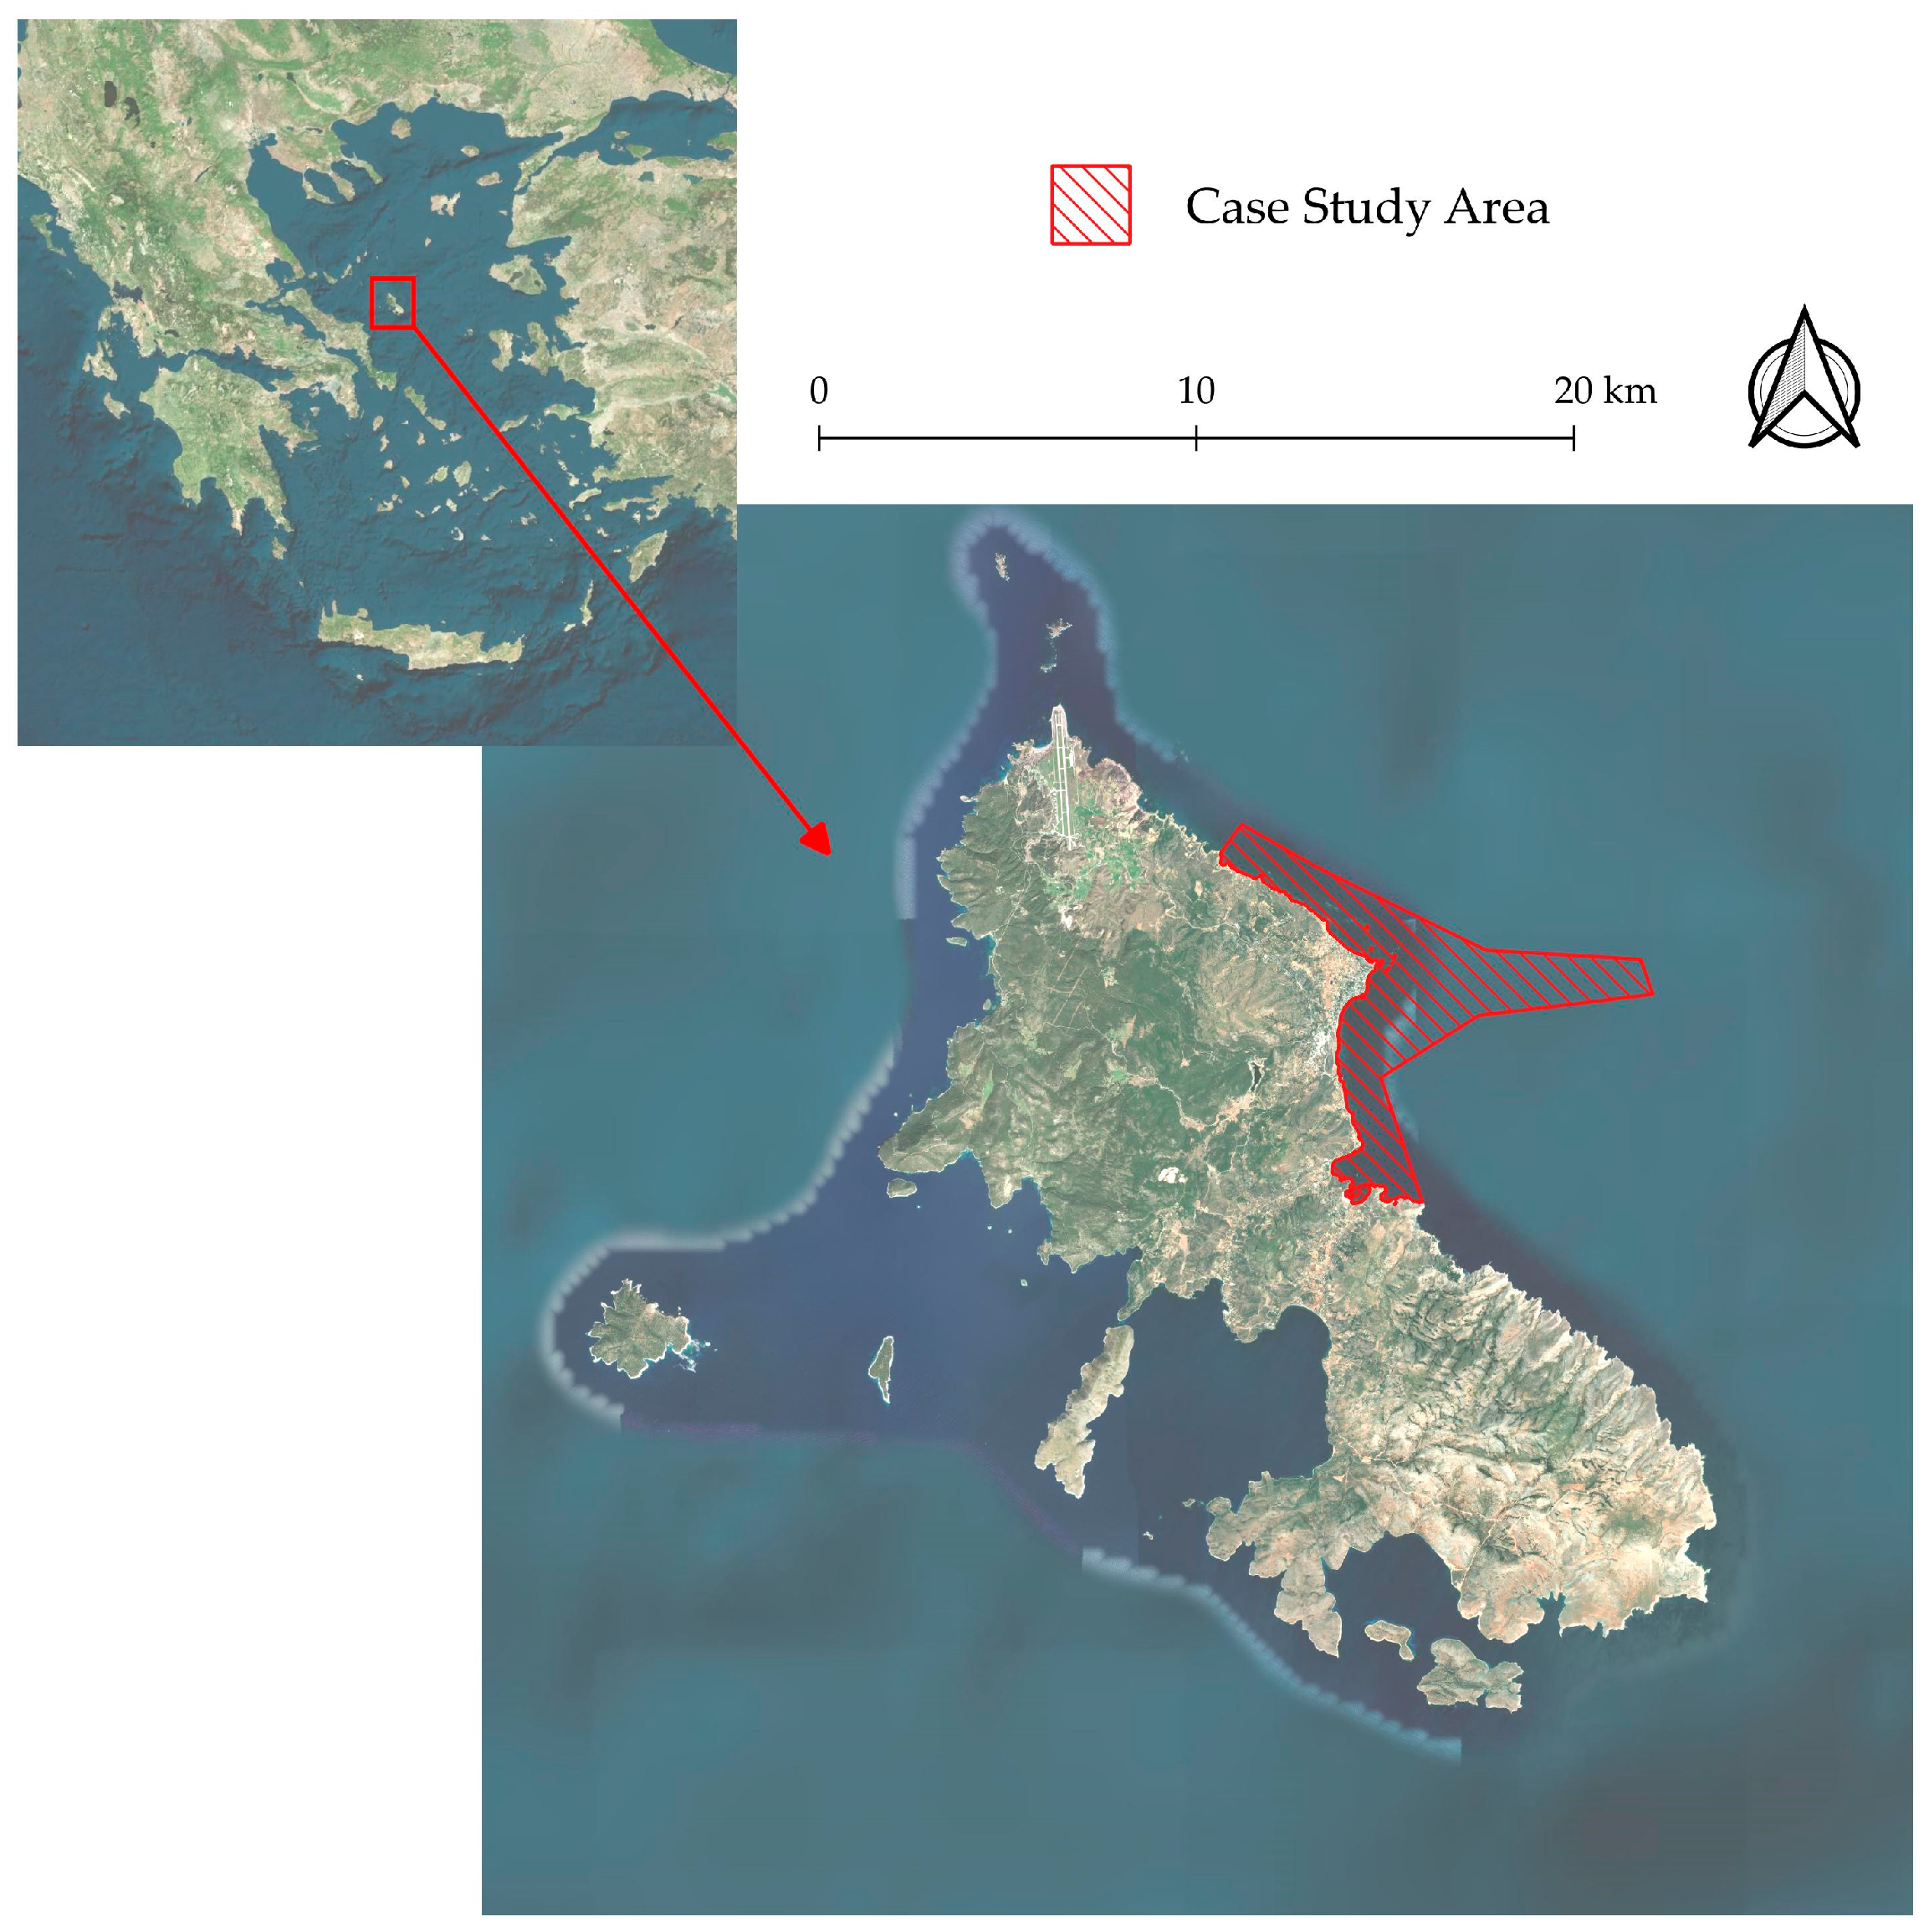
2.1. Study Area

The study area is located in the Central Aegean Sea, around Skyros Island (Figure 1). This site was selected for its extensive intact Cystoseira forests, now rare in the eastern Mediterranean Sea [34]. A suitable location has been identified on the eastern side of the island [35], where an extensive reef system is present across 2667.2 hectares. The seascape is a complex mosaic of shallow rocky reefs, partly covered by Cystoseira s.l. (see Figure 2), surrounded by sandy bottoms of varying depths and Posidonia oceanica Seagrass beds. The study area reaches a maximum depth of 30 m.

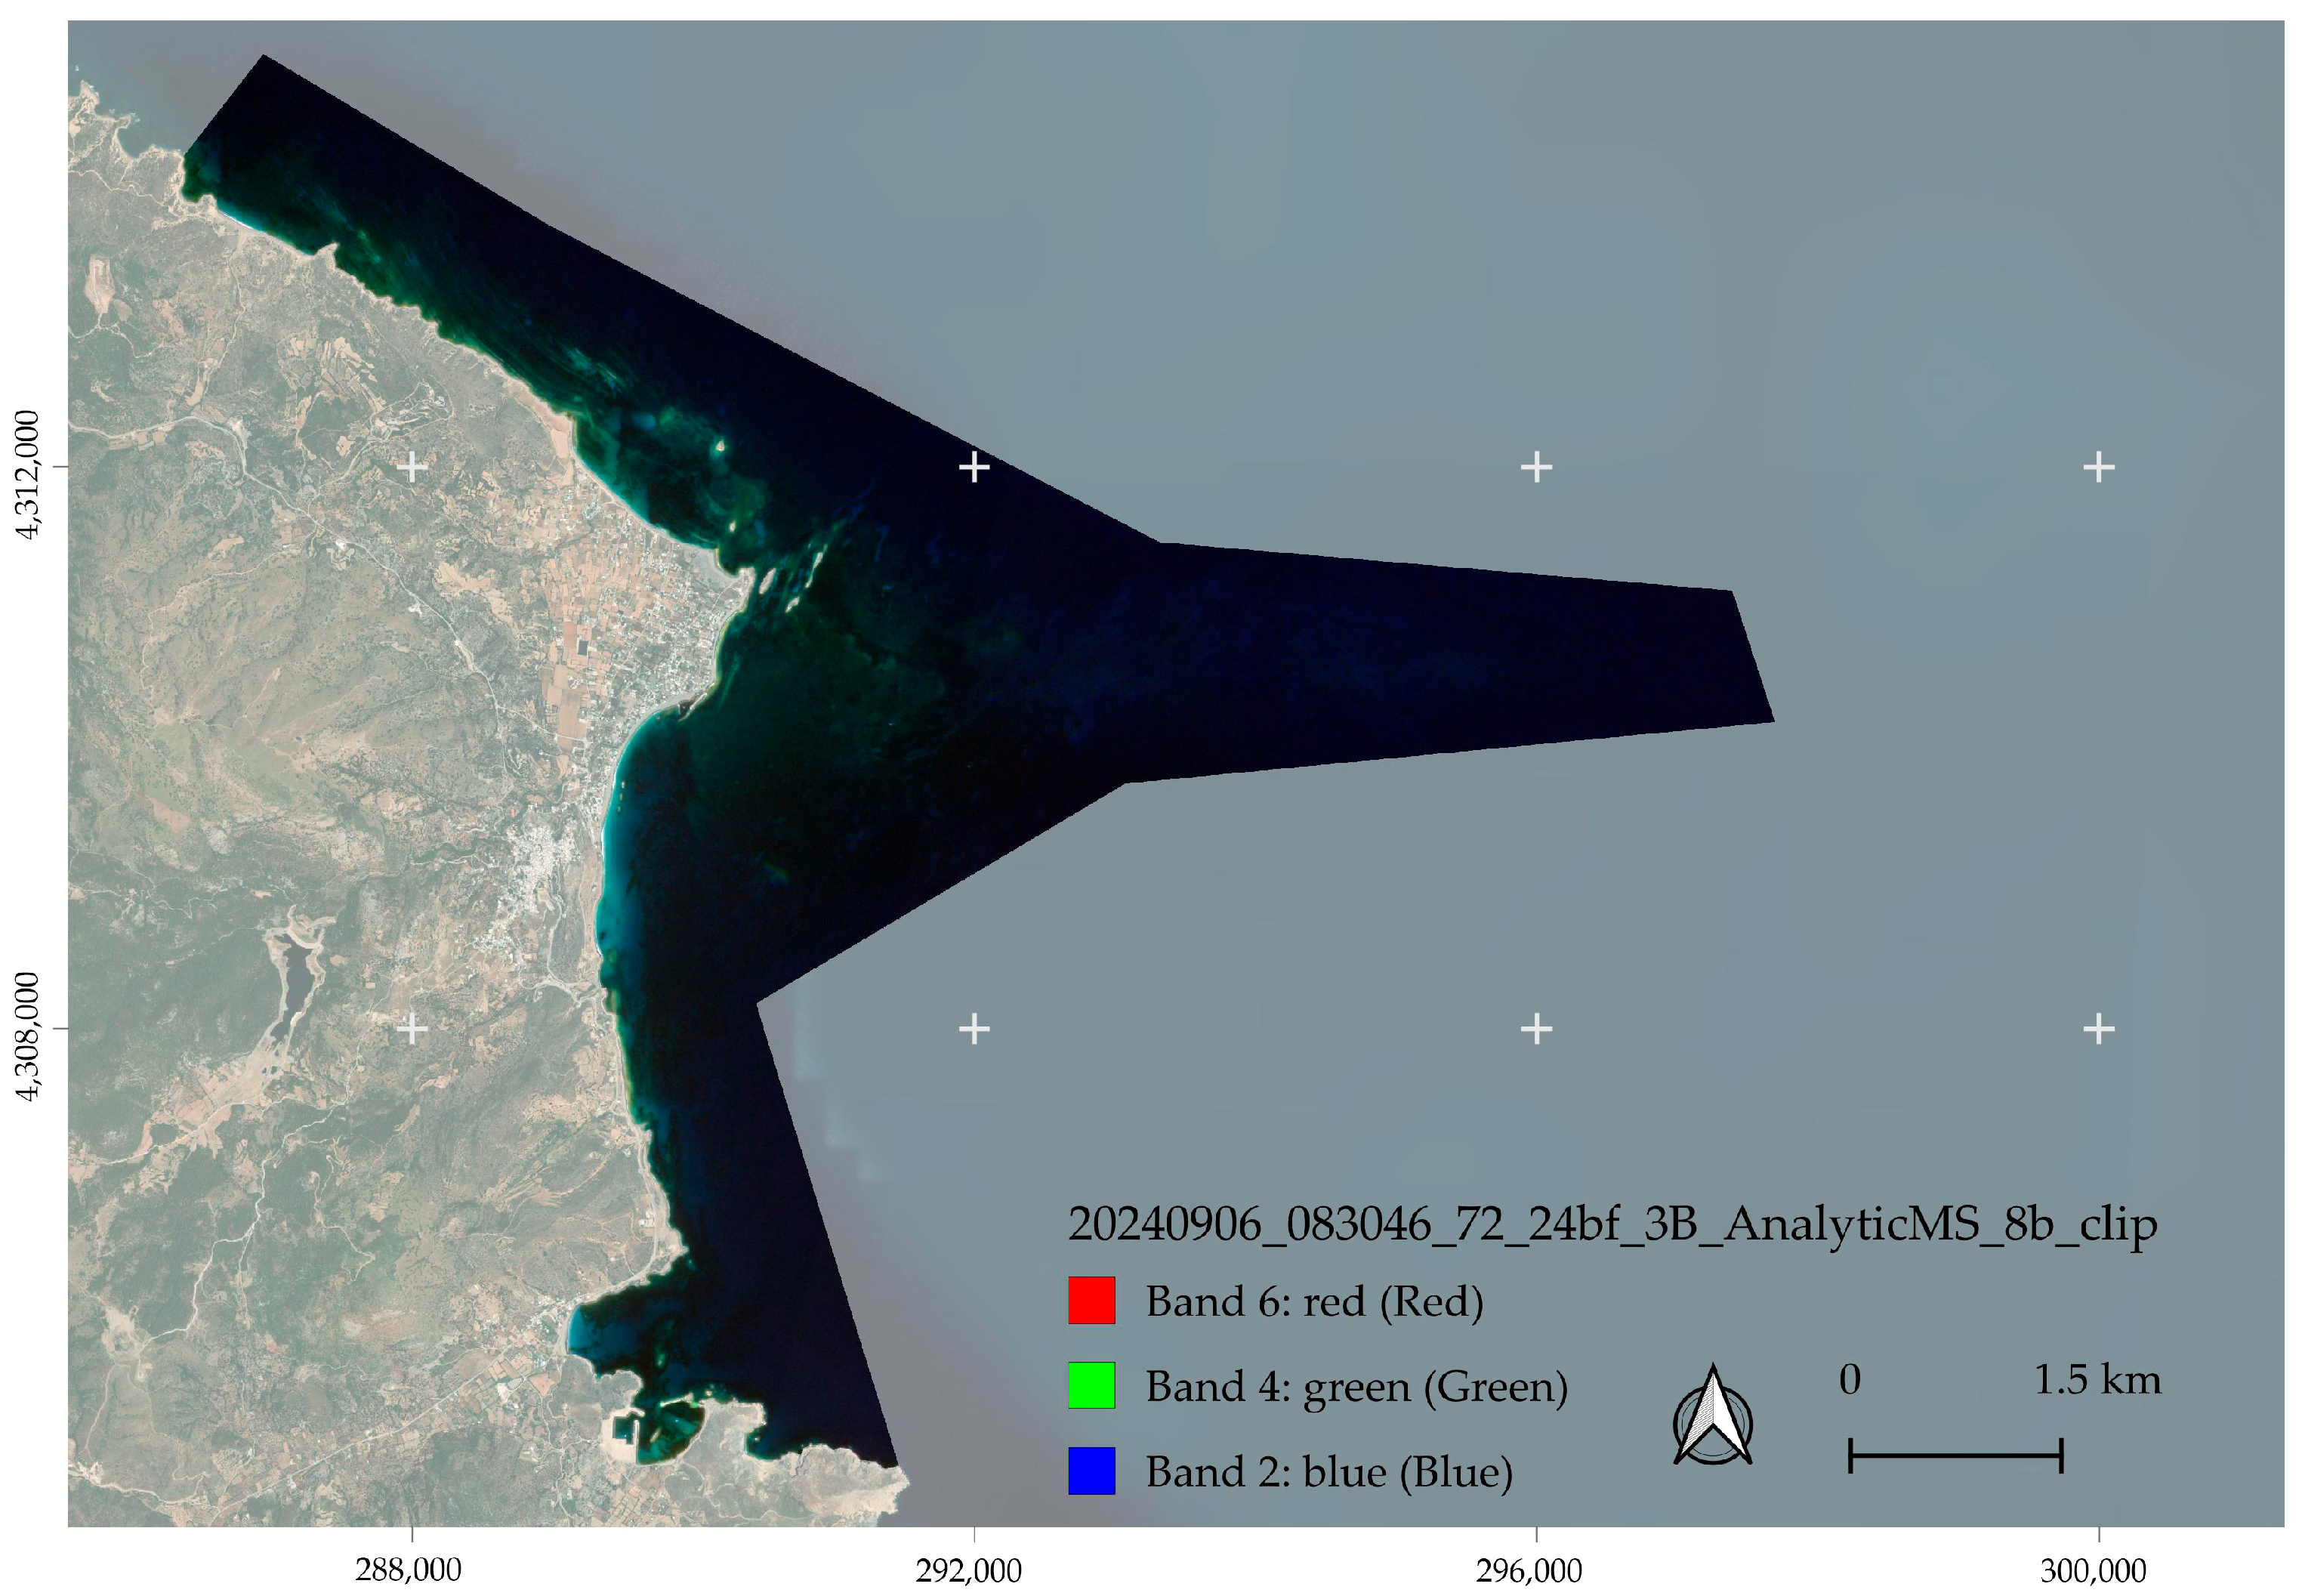
2.2. Earth Observation Data

Cystoseira forests in the area typically occur in shallow reefs with a maximum depth of 10 m [34]. Their distance from the shore varies with geomorphology. The 10 m pixel resolution of Sentinel-2 was insufficient for mapping Cystoseira forests due to mixed pixels representing multiple habitats. After evaluating commercial options, we selected PlanetLabs imagery—available under the Education and Research Program—because other providers (e.g., Airbus France, MAXAR, Westminster, CO, USA) lacked consistent coverage for the study area. On-demand tasking was possible but cost-prohibitive and subject to uncertain sea surface conditions (e.g., wave and sunglint interference).
PlanetLabs provides daily or more frequent imagery, enabled by a constellation of ~200 CubeSats. We used Planet Explorer to select imagery that matched temporally with the field expedition to collect spatial data from the Cystoseira peak growth period in summer [36]. The image of 6 September 2024 (image ID: 20240906_083046_72_24bf_3B_AnalyticMS_8b_clip.tif) from the SuperDove sensor was ordered as Τop of Atmospheric Radiance (TOAR) after visually confirming minimal capillary wave action/whitecap effects along the shore and the absence of sunglint interference (Figure 3). The imagery is from EPSG 32635 WGS 84/UTM zone 35N, which is used in all cartographic representations.

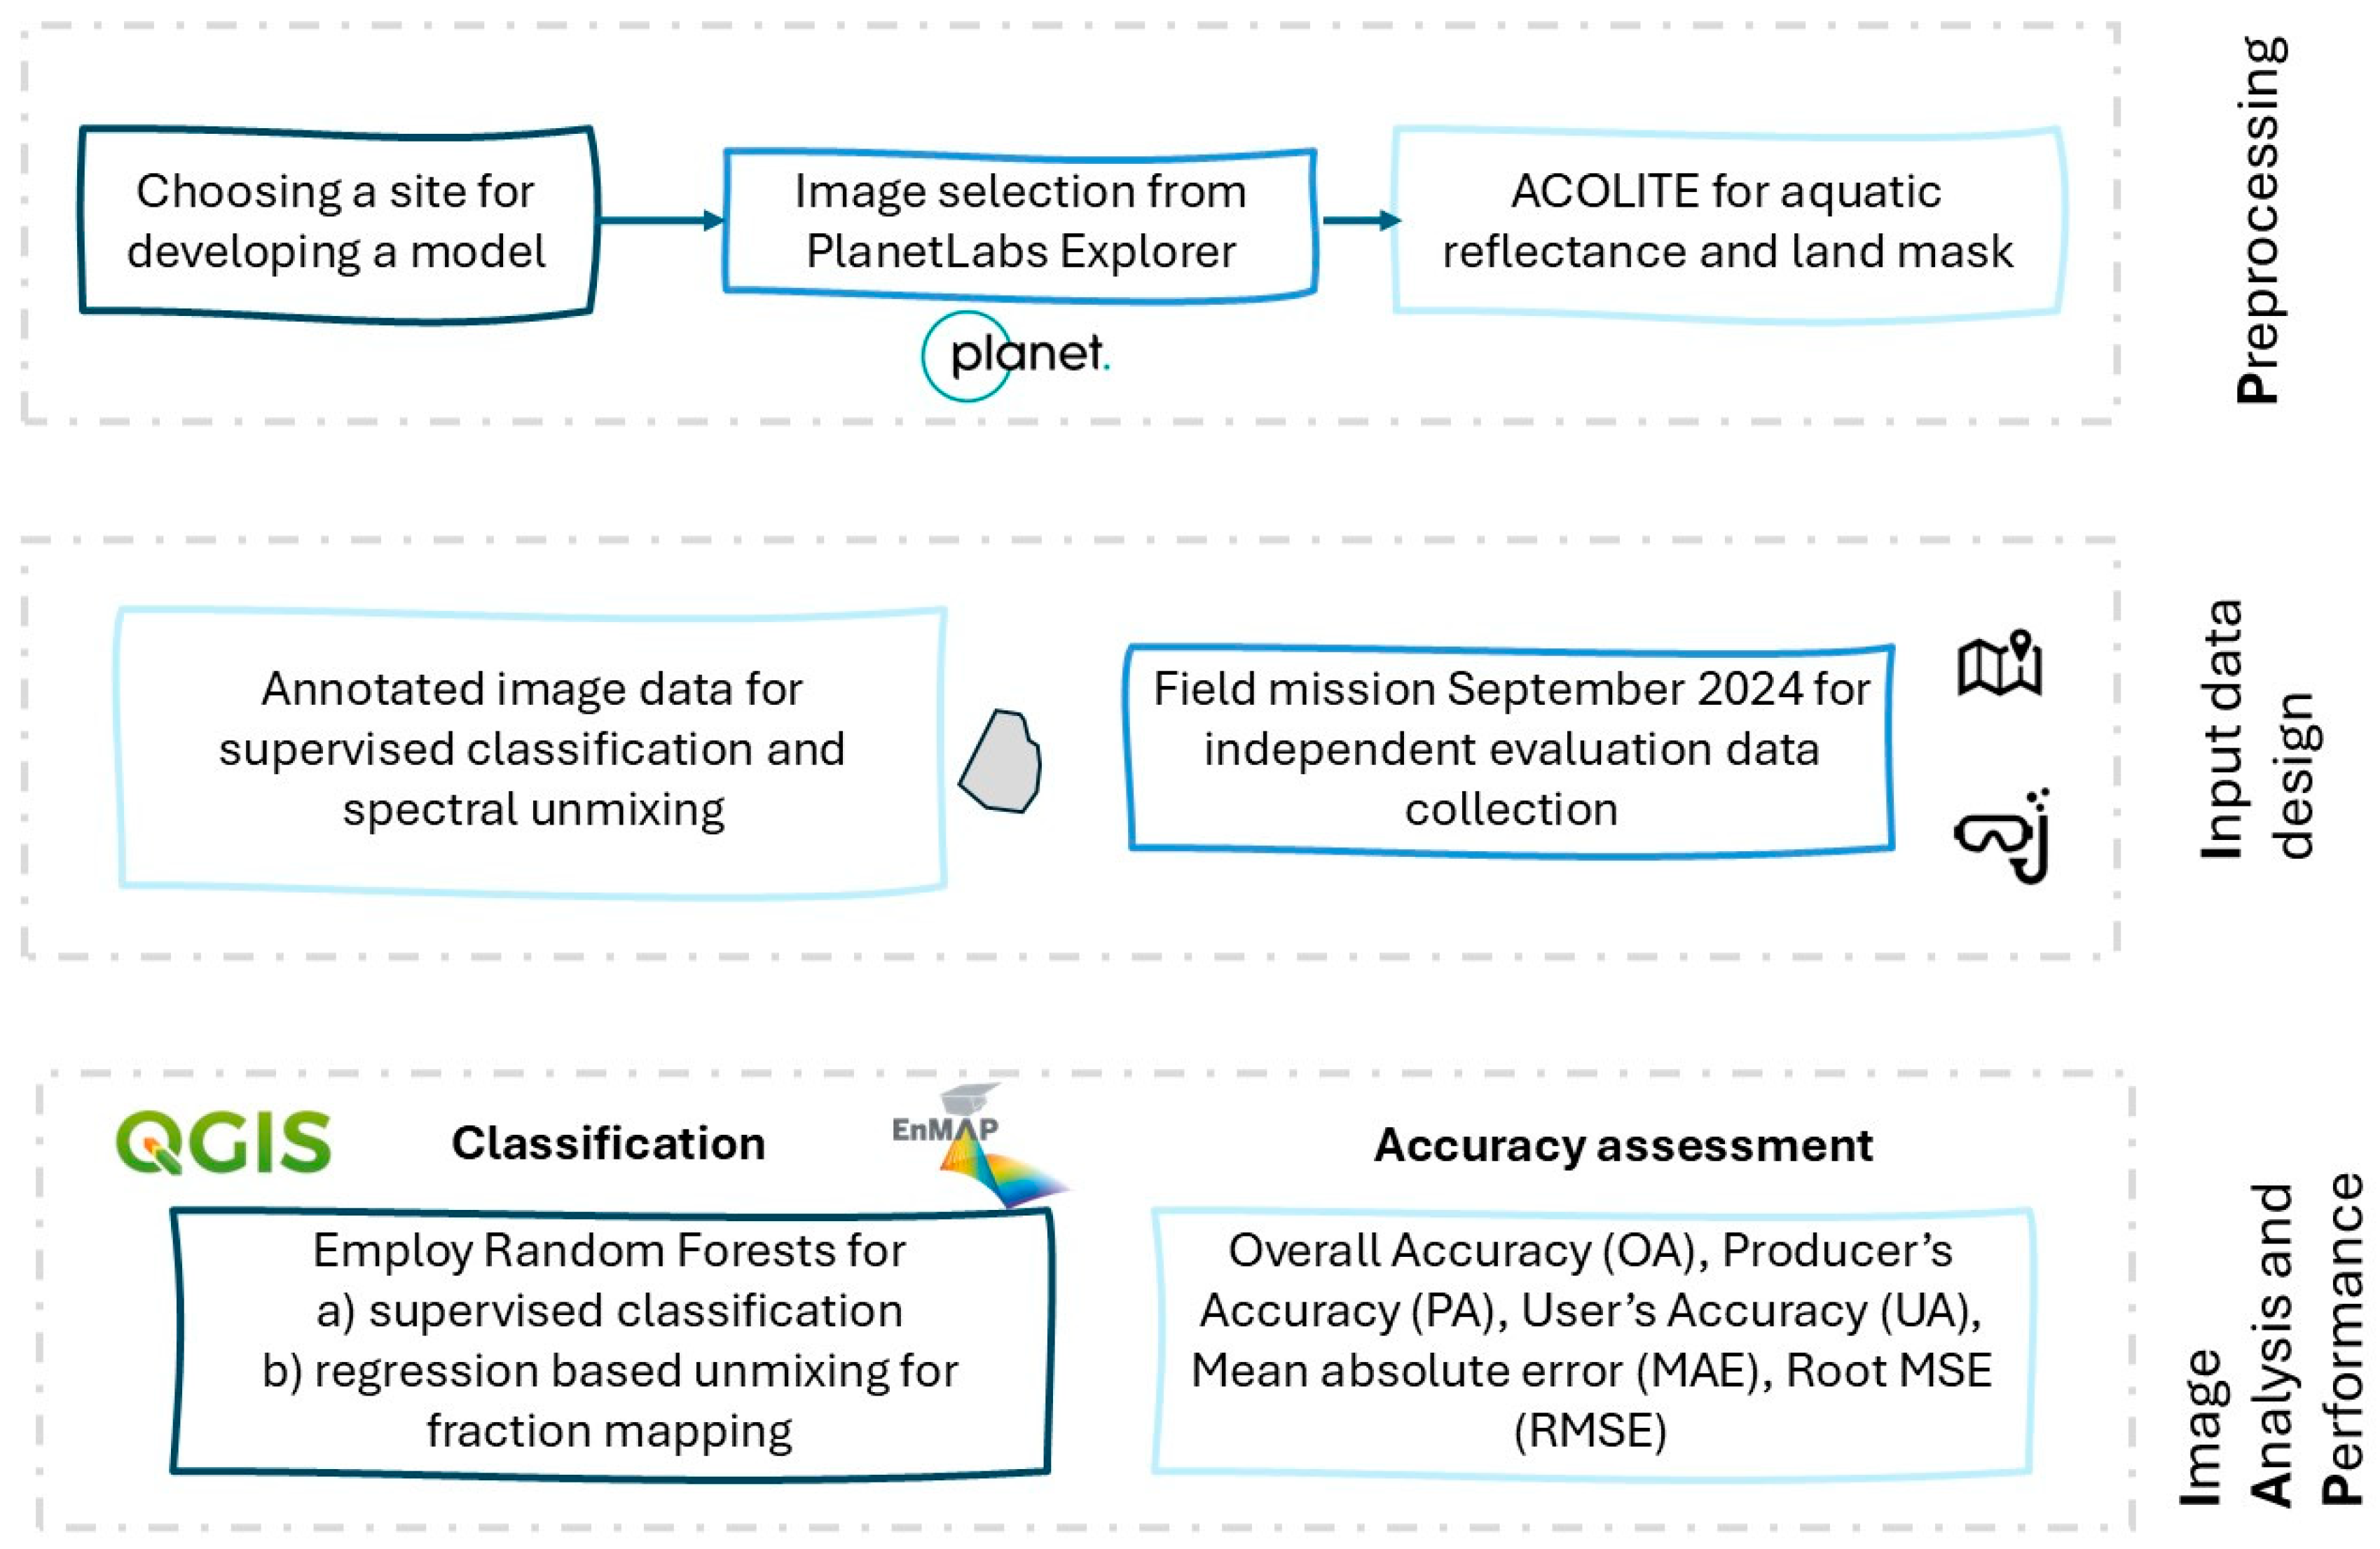
2.3. Analysis Workflow
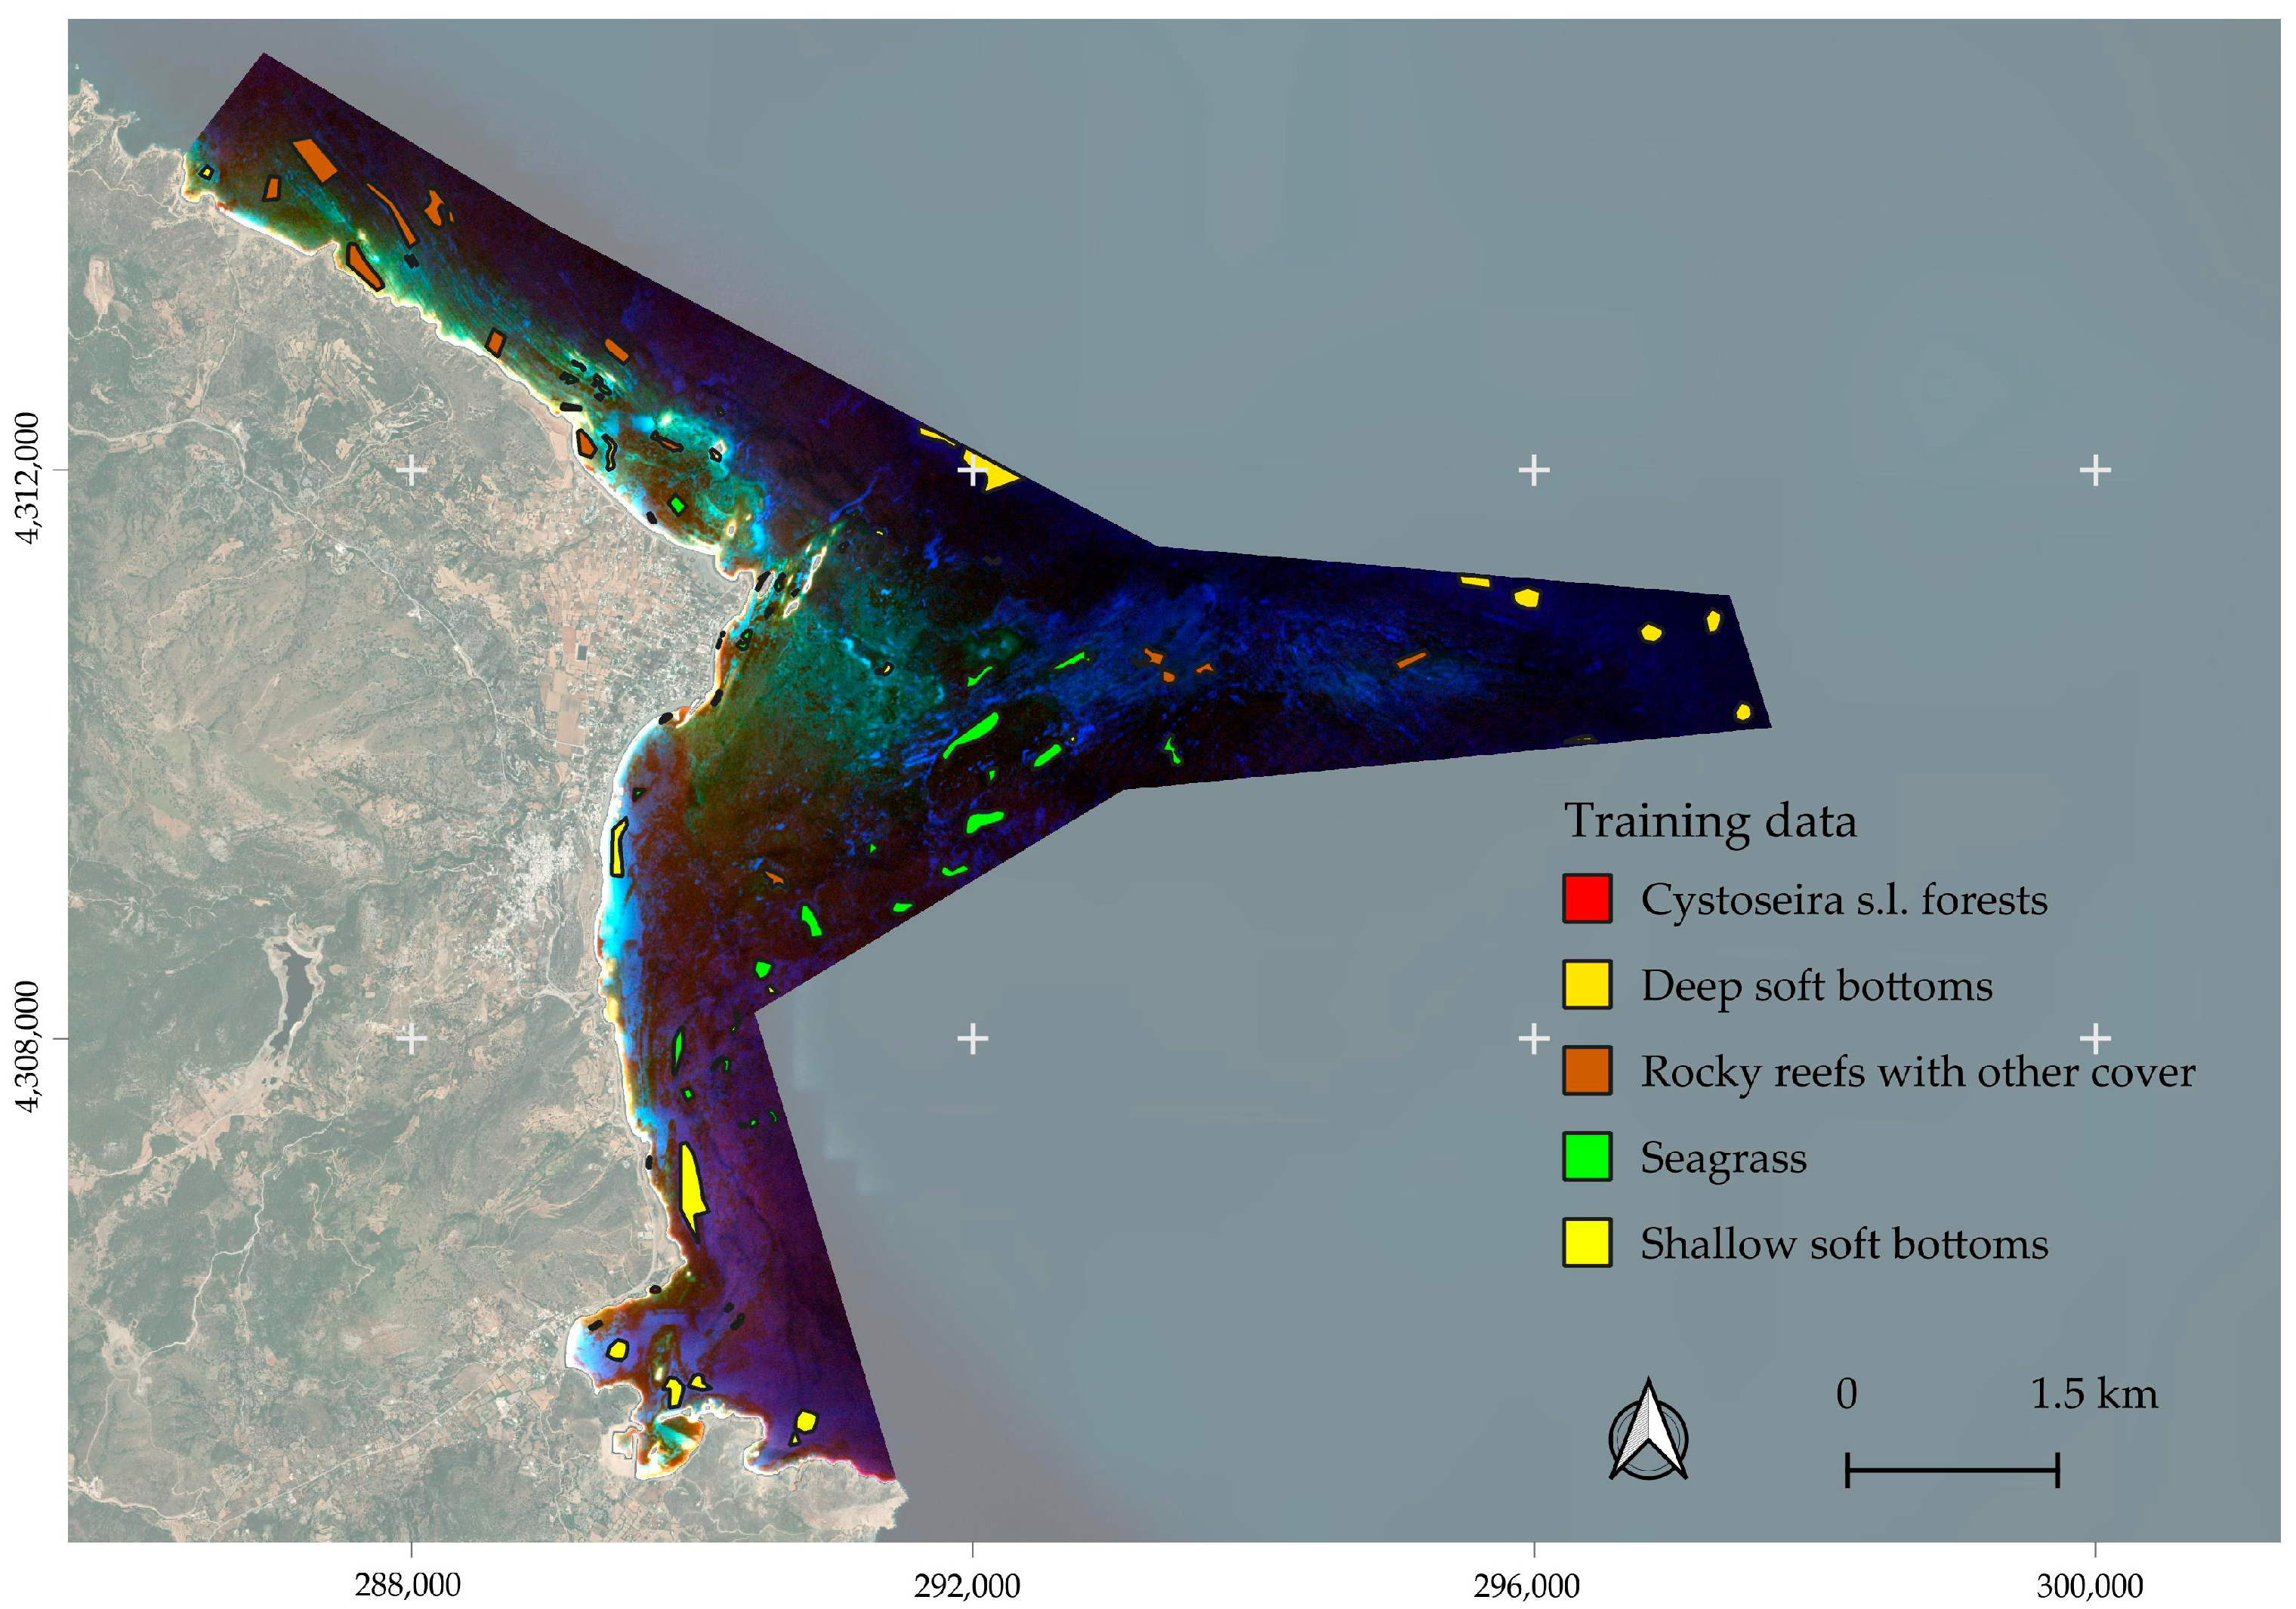
We developed a workflow based on open access, desktop-based software applications (Figure 4). Initially, ACOLITE [37,38,39] was employed for atmospheric correction, retrieving aquatic reflectance from the TOAR PlanetLabs imagery. The most recent version, 20250402.0, incorporates RAdCor processing and an explicit treatment of adjacency effects for Landsat, Sentinel-2, and PlanetScope datasets [40]. Default settings were applied and the Rayleigh-corrected product was retrieved (product rhorc_*). We also estimated the Suspended Matter Concentration using the band switching algorithm available in ACOLITE as a metric of the water quality linked with the transparency of the water column. Non-water pixels were masked through the internal process of the algorithm. Subsequent analysis was conducted in QGIS (version 3.40.4, Bratislava LTR) and the EnMAP toolbox (v3.13.3) [41] for the analysis of the image, both for the supervised classification and the spectral unmixing. The classification scheme included five habitat categories:
(a)
Cystoseira s.l. forests;
(b)
Shallow soft bottoms (<15 m depth);
(c)
Rocky reefs with other cover;
(d)
Seagrass;
(e)
Deep soft bottoms (>15 m depth).
The designation of the training dataset for the analysis of the satellite imagery followed the pathway of integration of annotations we created using Bing basemaps and Google satellite imagery, available in QGIS and Google Earth. For the habitats “shallow soft bottoms”, “deep soft bottoms”, “rocky reefs with other cover” and “Seagrass”, we identified the habitats on these platforms with confidence given the experience we have in the Greek territorial waters from past expeditions. We selected homogeneous patches that clearly depicted the target habitats, and we evaluated the spectral separability accordingly in an iterative approach. We finalized the delineation of our training data when the lowest value was above 1.50, as was the case with Seagrass vs. rocky reefs with other cover. For the class “Cystoseira s.l.”, we utilized knowledge from colleagues that had visited the site for the collection of samples in the view of taxonomic work. They provided us with polygons in which, during their mission (August 2024), they observed 100% cover of the target habitat.
Table 1 details the number of polygons and annotated pixels per class. Figure 5 presents the spatial distribution of the training data, and Figure 6 depicts the spectral signatures of each class.
Spectral separability between classes constitutes a pivotal step in the development of the classification scheme and the selection of the training sites. It was assessed using the Transformed Divergence (TD) metric (Table 2), with index values from 0 (complete overlap) to 2 (perfect separation) [42].
The training dataset was employed to train a Random Forest (RF) algorithm, a robust ensemble-based supervised machine learning classifier known for its robustness against overfitting [43]. The selection of RF was based on its capacity to avert overtraining [44] and its demonstrated efficacy in coastal habitat mapping across diverse scales [45,46]. By leveraging multiple decision trees, RF effectively captures nonlinear relationships between classes, making it particularly effective for distinguishing Posidonia oceanica from sedimentary and carbonate substrates [47]. We used 100 trees and allowed the maximum tree depth to effectively capture the complex relations of the seascape. In addition, we applied regression-based spectral unmixing [48,49,50,51,52], using the EnMAP toolbox, leveraging the RF model to estimate fractional cover for the Cystoseira s.l. class, which constitutes a novel application for marine habitat mapping.

2.4. Evaluation Approach

The accuracy of habitat mapping was assessed using an independent validation dataset (Figure 7), manually digitized at the pixel level, based on the following resources:
-
High-resolution Google Earth Pro images;
-
Aerial imagery from the Greek Cadastral Office;
-
September 2024 field campaign.
Validation sites required 100% habitat cover at the reference sources, with a pixel size of 25 cm–1 m. A particular emphasis was placed on the collection of updated field data for the Cystoseira spp. habitat class in September 2024 via snorkeling surveys at three reef sites, all covered predominantly by Cystoseira spp. (see Figure 8). Each site was surveyed for one hour using a GoPro 9 camera, with geolocation via a waterproof GPS (Garmin GPSMAP 67) logged every 5 s. Images and positional data were integrated to generate georeferenced datasets confirming 100% Cystoseira cover (see Supplementary Material S1.pdf). A total of 20 random points per class distributed across the designated area of interest were selected for evaluation.
The created dataset was used to calculate standard metrics frequently utilized in remote sensing and classification analysis [51], including Overall Accuracy (OA), Producer’s Accuracy (PA), User’s Accuracy (UA), and F1 score. A confusion matrix was generated to analyze misclassification patterns between habitat classes. For fractional cover estimates, the same dataset was utilized (pure-pixel assumption), and scikit-learn regression metrics [53] were applied (https://scikit-learn.org/stable/modules/model_evaluation.html#regression-metrics, accessed on 5 June 2025): mean absolute error (MAE), root mean square error (RMSE), ratio of performance to deviation (RPD), mean error (ME), mean squared error (MSE), median absolute error (MedAE), squared Pearson correlation (r2), and coefficient of determination (R2). Scatterplots and residual plots were also generated.

3. Results

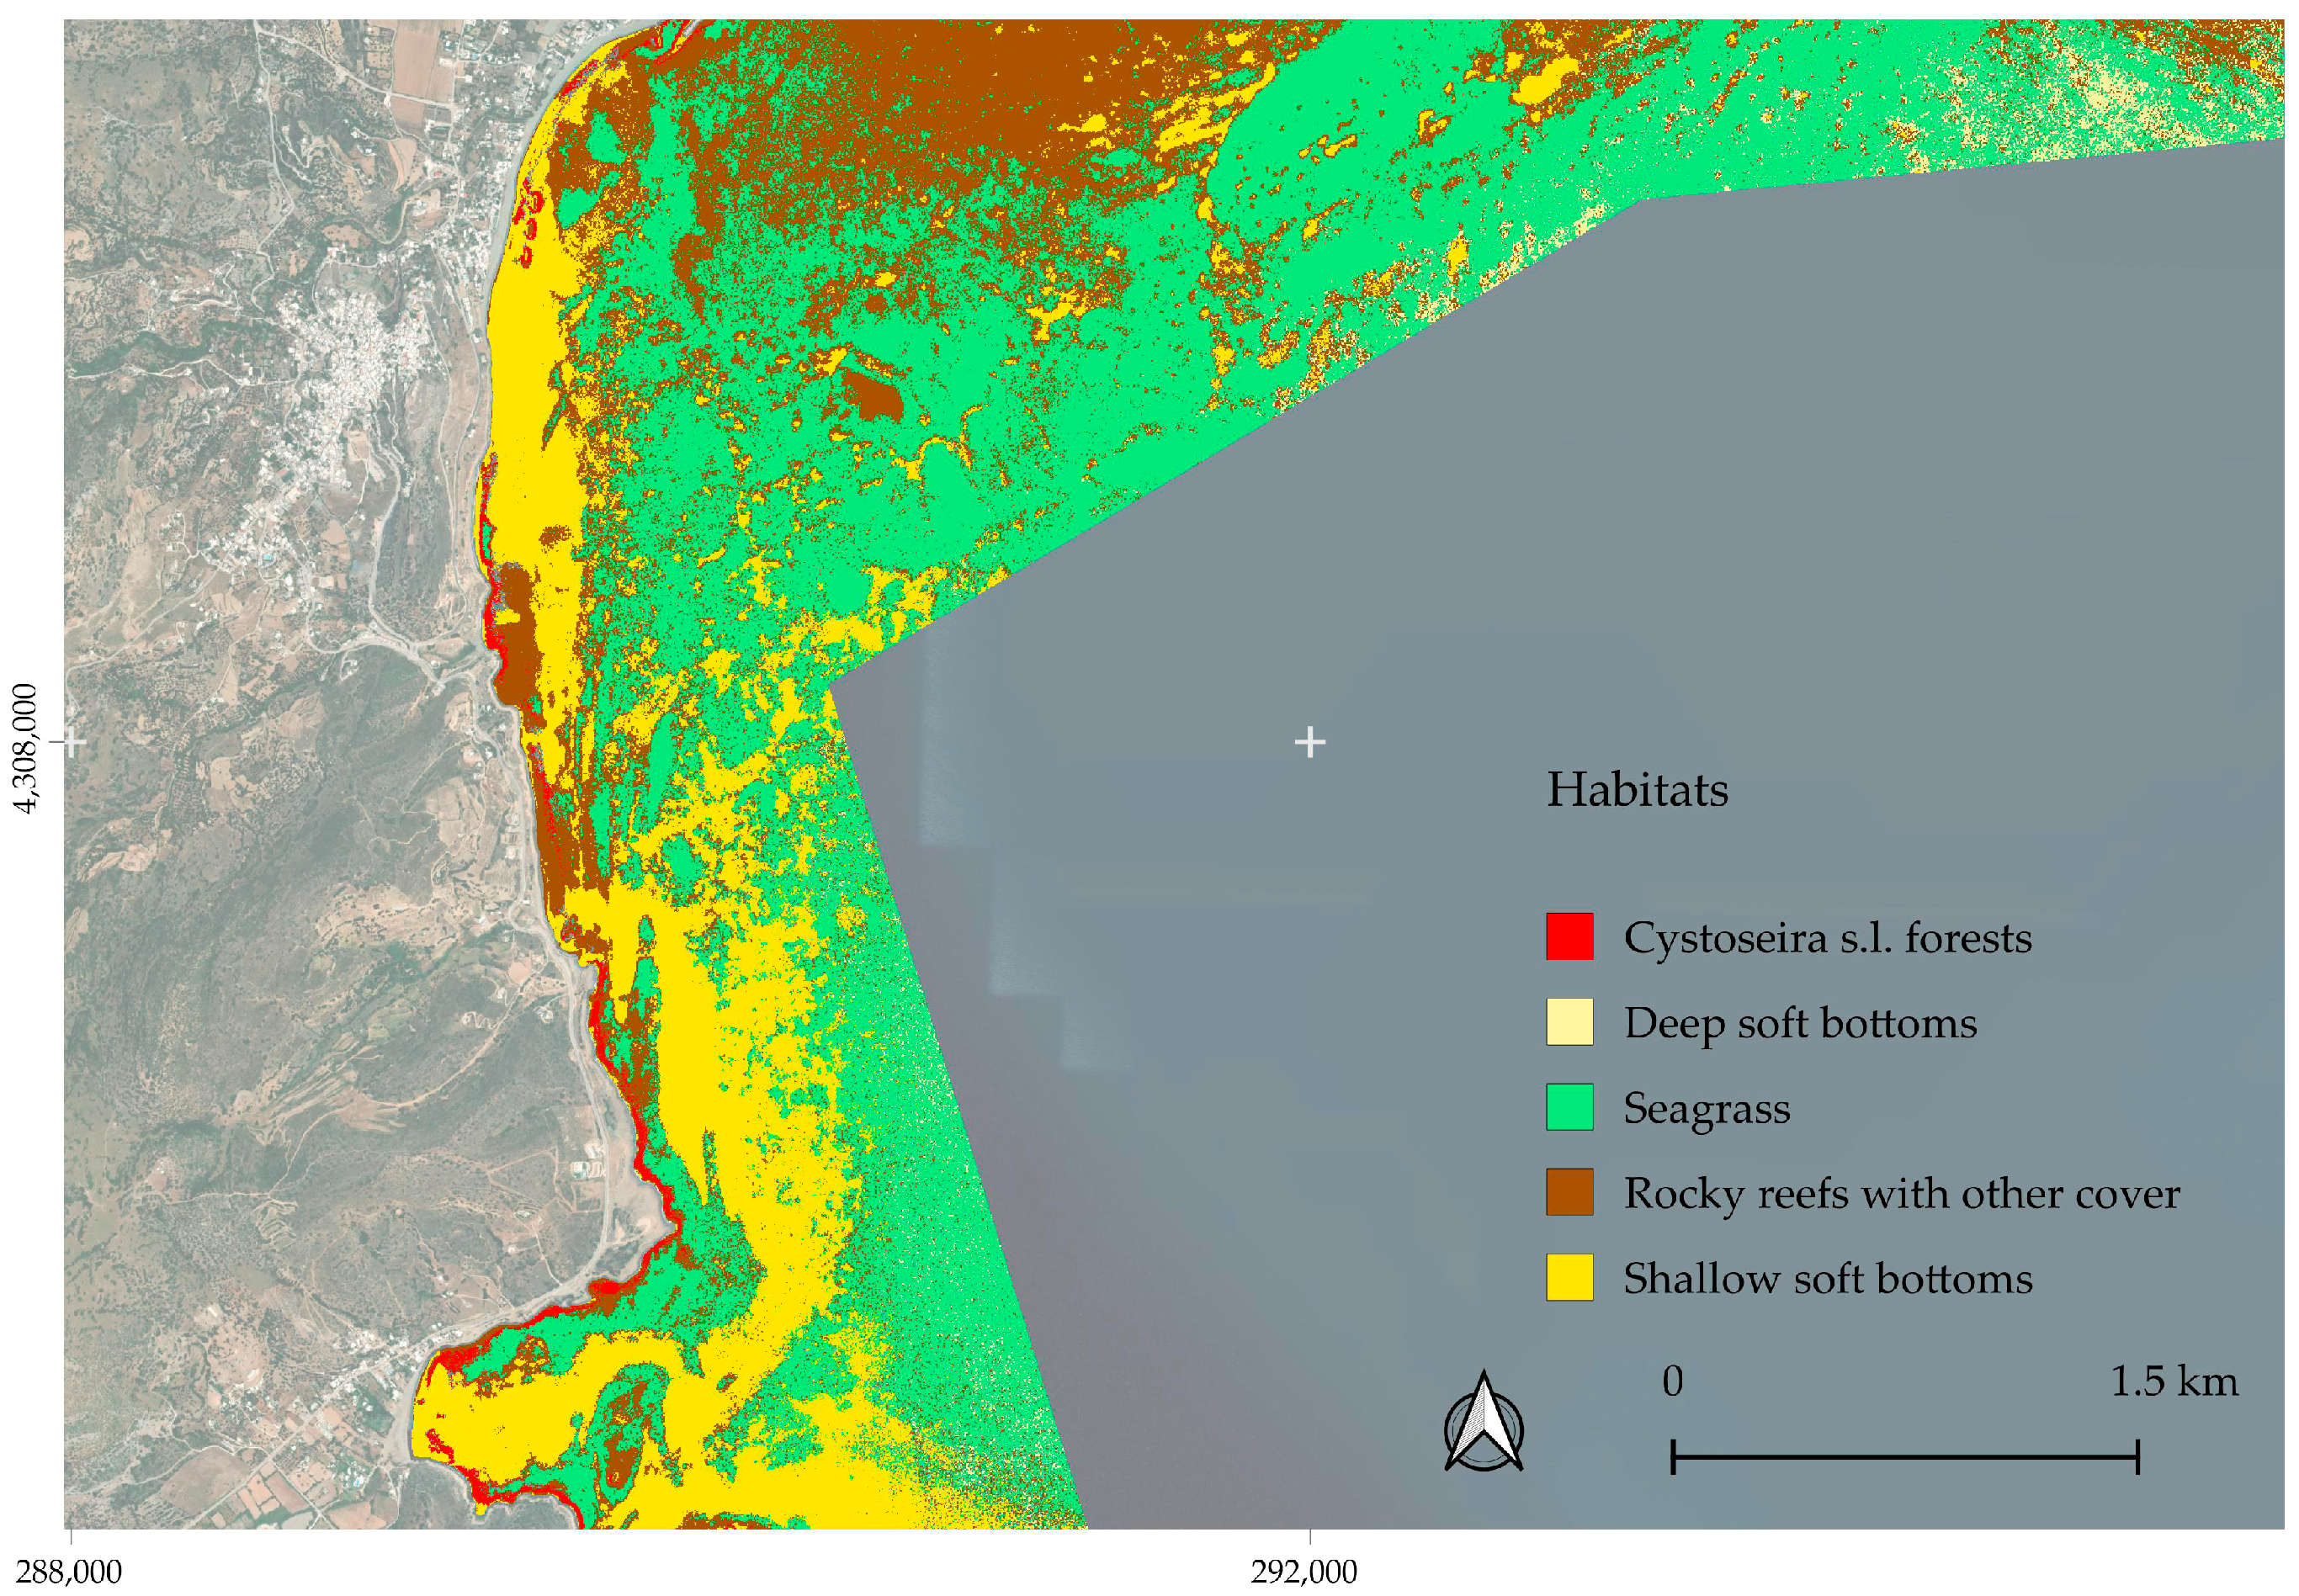
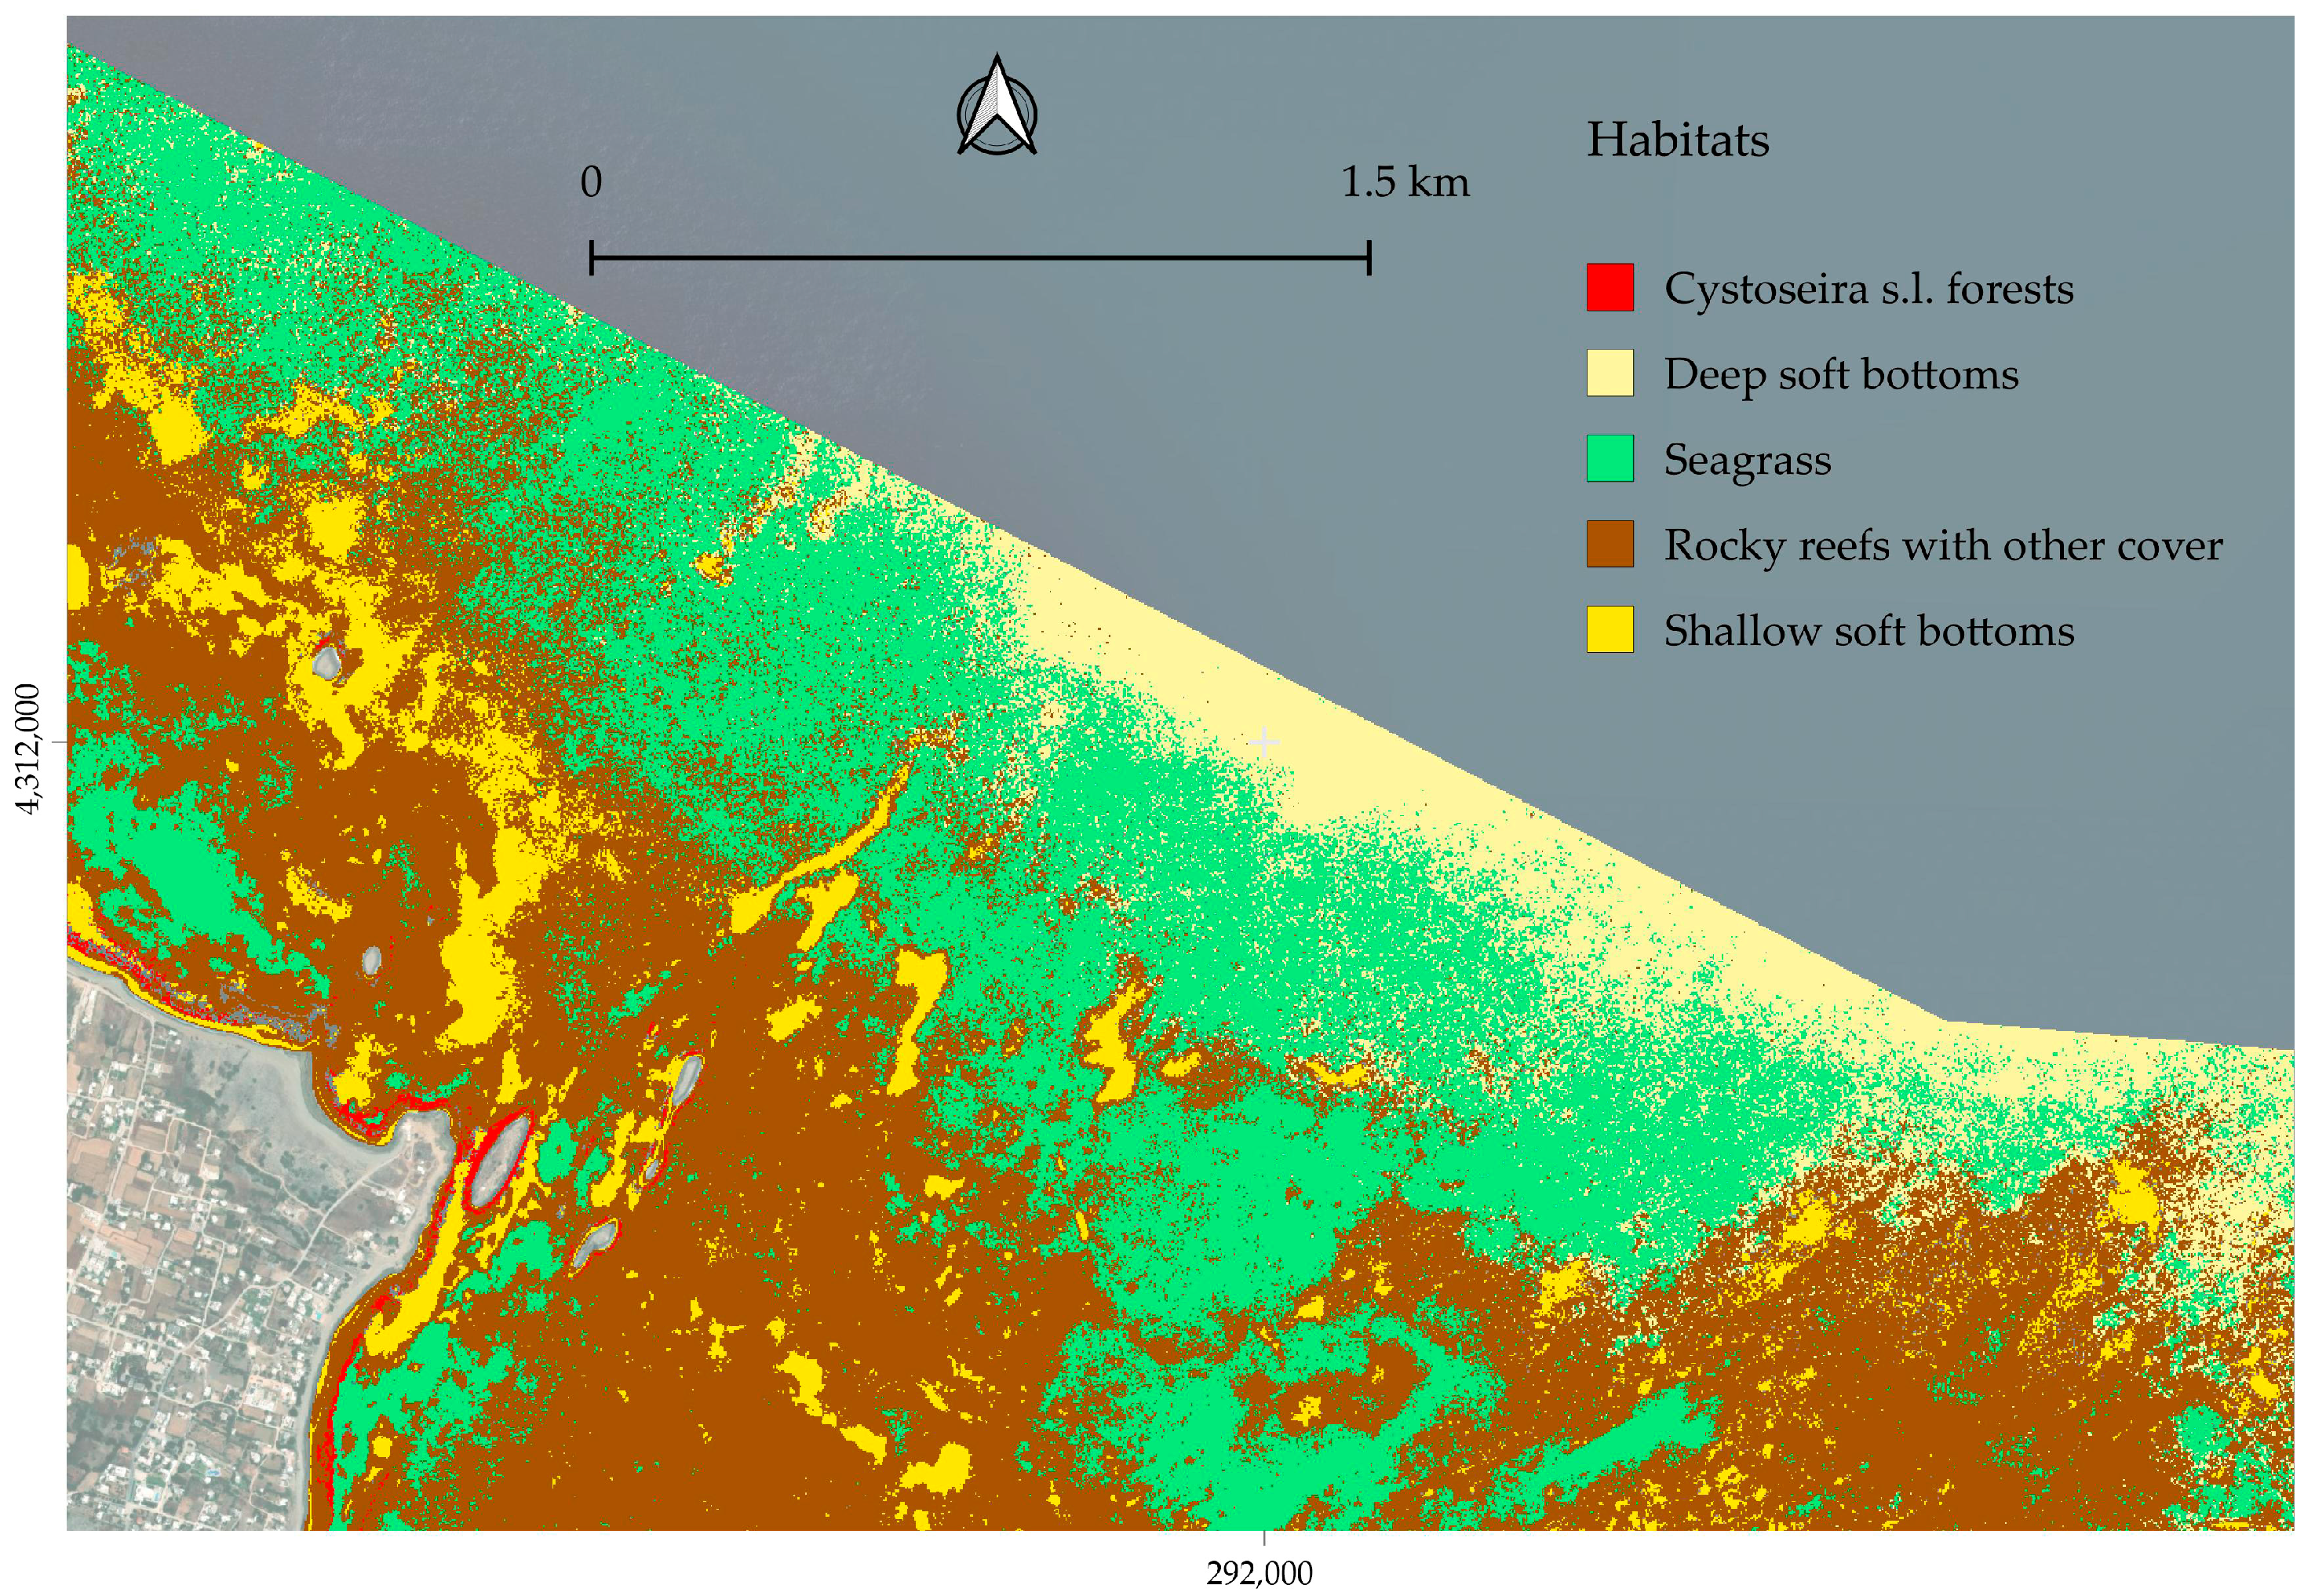
3.1. Mapping Subtidal Marine Forests and Related Seascapes

Hard Classification Products

The mapping of 2637.85 hectares of marine habitats (Table 3) was based on PlanetLabs SuperDove satellite imagery [54]. Although the focus was on subtidal Cystoseira s.l. forests, the other habitats present were also classified. The spatial distribution of the identified marine habitats is presented in Figure 9, Figure 10 and Figure 11.

3.2. Fraction Mapping of the Target Habitats

The spectral unmixing analysis produced fractional cover maps for each habitat class, with values scaled between 0 and 1 at the pixel level. Below we provide the fraction map for Cystoseira s.l. (Figure 12), while the other habitats can be found in File S2.

3.3. Product Validation

The validation results indicate robust performance for the classification of most habitat categories, particularly for distinguishing Cystoseira s.l. from rocky reef habitats without coverage by such canopy algae. The Overall Accuracy of the classification was 95%, confirming the reliability of the mapping framework. Accuracy metrics for the supervised classification are presented in Table 4 and Table 5, and the fractional cover analysis metrics in Table 6.

4. Discussion

4.1. Capability of Earth Observation to Map Coastal Seascapes with Emphasis on Cystoseira s.l. Forests

The utilization of the unique PlanetLabs SuperDove CubeSat sensors enabled the selection of optimal imagery during the growth period of Cystoseira s.l. forests and temporal consistency with the field campaign for data collection. This flexibility, combined with a robust field dataset covering all the main habitat types, facilitated the production of accurate maps, surpassing the conventional 80% OA threshold. The spectral separability for Cystoseira s.l. (TD = 1.69) confirmed their distinct spectral profile. In regard to the water quality, the SPM concentration ranged from 0 to 2 g per m3, which indicates high water column transparency.
The seascape classification yielded high thematic accuracy across all benthic classes, with F1 scores ranging from 0.87 to 1.00, demonstrating the effectiveness of the remote sensing workflow applied. Soft bottom habitats, both shallow and deep, were identified with perfect accuracy (UA = 1.00, PA = 1.00), likely due to their spectral uniformity and low structural complexity. Cystoseira s.l. and Seagrass also exhibited strong performance (F1 = 0.94 and 0.93, respectively), although some confusion occurred at habitat interfaces, potentially due to mixed pixels or spectral similarity with adjacent classes such as rocky reefs with other cover and shadows. Rocky reefs with other cover showed comparatively lower accuracy (F1 = 0.87), possibly influenced by substrate heterogeneity, relief-induced shadowing, and spectral overlap with macroalgal assemblages. Mapping accuracy was highest for soft bottom habitats, while Seagrasses demonstrated comparable performance to that reported in previous studies utilizing the same satellite constellation [29,54,55,56]. In this study, “Seagrass” primarily referred to Posidonia oceanica. However, the possibility of concomitant occurrence of other species typically found in the periphery of P.oceanica meadows, such as little Neptune grass (Cymodocea nodosa) or dwarf eelgrass (Zostera nolteii), cannot be ruled out. The dominance of Cystoseira s.l. in shallow reef zones, with canopy cover of >80% at the 3 m pixel level, enabled accurate delineation and separation from other rocky barrens or other rocky reef assemblages.
The classification was performed using a Random Forest algorithm consisting of 100 decision trees grown to maximum depth. This configuration was selected to maximize model flexibility and ensure the separation of spectrally similar classes. Despite the potential for overfitting with fully grown trees, the ensemble nature of the model and the strong accuracy metrics observed suggest robust generalization to the mapping domain. Although the analysis relied on single-date imagery, this does not constitute a major limitation in this context, as the mapped benthic habitats are largely stable over time, not subject to strong seasonal variability, while the key habitat is mapped in the proper period. Future research could further enhance classification performance by exploring refined bathymetric corrections, incorporating additional spectral/temporal features, and testing advanced classification techniques—such as object-based image analysis or deep learning—for better discrimination of complex habitats. Expanding field validation across broader spatial extents would also improve the model’s transferability and support large-scale monitoring and conservation planning.
The spectral unmixing model exhibited strong performance across most benthic habitat classes, with particularly high accuracy for deep soft bottoms (R2 = 0.99; RPD = 18.66) and shallow soft bottoms (R2 = 0.99; RPD = 8.72). These classes also presented the lowest error metrics (MAE < 0.007), indicating well-defined spectral signatures and minimal confusion with other substrates. Seagrass was mapped with high reliability (R2 = 0.89; RPD = 3.01), consistent with the known spectral distinctiveness of dense Seagrass meadows. Moderate performance was observed for Cystoseira s.l. (R2 = 0.82; RPD = 2.37), likely reflecting spectral overlap with adjacent classes and roughness variability in the canopy structure. The lowest accuracy was associated with rocky reefs with other cover (R2 = 0.72; RPD = 1.87), which may be attributed to greater within-class heterogeneity or shadowing effects. Overall, the combination of a high coefficient of determination, favorable RPD values, and low absolute errors supports the effectiveness of spectral unmixing for benthic habitat mapping while emphasizing the need for enhanced class discrimination in spectrally complex substrates.

4.2. Performance of PlanetLabs SuperDove Data

Daily high-resolution observations at ~3 m GSD are promising for coastal habitat mapping, but selecting suitable imagery is non-trivial. Commercial sensors, including SuperDove, are not designed for aquatic applications [57]. Nonetheless, a multitude of aquatic case studies have demonstrated that the SuperDove series of sensors can be a satisfactory means for operational monitoring in the marine environment [39].
In coastal subtidal habitat mapping, several factors influence the quality of the final product, many of which are beyond control during image selection. The only parameters that can be specified are cloud cover thresholds, off-nadir angle, sun elevation, and azimuth. No dedicated filters exist to exclude images affected by sunglint or thin cirrus clouds. Furthermore, oceanographic phenomena such as water haze, often caused by downslope winds disturbing the sea surface, are not detectable via the PlanetLabs Explorer interface, and current automated pipelines lack the capacity to identify and filter such conditions. Wave action and whitecaps are also rarely visible in the Explorer, further limiting the effectiveness of automated quality control.
These challenges arise during data harvesting, retrieval and preprocessing with ACOLITE to generate aquatic reflectance products. In cases of strong sunglint, the processing resulted in negative reflectance values, leading to the masking of large areas in the analysis. Similar issues were encountered with significant wave action and wavecaps, which rendered several images unsuitable for seascape mapping due to severe signal degradation.
Finally, geolocation among images from the same sensor was not always consistent. In a few cases, shifts exceeding three pixels (>6 m) were observed between images. Although this remains within the sensor’s CE90 specification, such shifts, when combined with handheld GPS inaccuracies, can introduce errors in model development and product validation. A thorough investigation [58] identified geolocation errors along multiple axis orientations, based on careful comparison of numerous images from different locations, with field data for geolocation and Copernicus Sentinel-2 imagery for radiometric consistency.

4.3. Limitations in Mapping Cystoseira s.l. Forests and the Role of Copernicus Sentinel-2

Identifying suitable sites for mapping Cystoseira s.l. forests is increasingly challenging due to ongoing habitat degradation. Many historically rich sites have transitioned to barren reefs dominated by filamentous or encrusting algae. Based on this study’s experience, we propose the following site adequacy criteria for effectively mapping Cystoseira forests via satellite imaging:
  • Dominance of Cystoseira s.l. canopy algae.
  • More than 80% cover at the pixel scale of PlanetLabs imagery.
  • Minimal interference from other species.
  • Homogenous patches of at least 3 × 3 pixels (~9 × 9 m)—the central pixel to be used for training to avoid adjacency effects.
  • Avoidance of steep slopes (>30° within a pixel) and areas where landscape features cast shadows.
  • At least 20 pure pixels for independent validation, avoiding mixed-habitat edges.
The 10 m resolution of Sentinel-2 limits its utility for mapping Cystoseira forests, as these habitats often span < 10 m width. Sentinel-2 can effectively map binary categories in clearly separable habitats (e.g., Seagrass vs. sand) but is inadequate for detailed mapping of Cystoseira. Future approaches should combine UAVs with high-resolution commercial satellites (1.2–3 m) for precise delineation. Accurate habitat extent mapping is essential for the implementation of environmental EU policies, including the Habitats Directive, the Marine Strategy Framework Directive, and the Nature Restoration Regulation. Satellite-based monitoring, integrated with robust field data, provides a scalable, transparent, and cost-effective solution for meeting reporting obligations for these legislative instruments and establishing baselines for conservation and restoration planning.

5. Conclusions

Mapping Cystoseira s.l. forests using satellite remote sensing is feasible but requires specific conditions and careful selection of the sites for the replication of the current developments. While several Earth observation platforms offer free or commercial data, sensor selection must be guided by the ecological and spatial characteristics of the target habitat, here the Cystoseira s.l. forests which have been mapped with high accuracy using PlanetLabs imagery. This study outlines a checklist for Cystoseira forest mapping and emphasizes the need for standardized protocols across the Mediterranean Sea, where this habitat still occurs.
Designing fiducial sites aligned with the pixel size of the selected sensors is essential for long-term monitoring, as such settings will benefit the fractional cover analysis. Establishing these reference sites will facilitate systematic data collection, change detection, and integration of satellite and field observations at matching spatial scales. The availability of level 3 aquatic reflectance products suitable for subtidal seascape mapping is crucial for accurate spatiotemporal analysis and monitoring of key habitats.
European regulations mandate precise information on habitat distribution and extent to inform restoration strategies, assess carbon stocks, and monitor ecosystem health. High-resolution satellite data, when combined with sound ecological knowledge and field validation, can support member states in meeting these requirements transparently and cost-effectively. This study provides a foundation for advancing satellite-based mapping of Cystoseira forests. Broader adoption and further refinement of this approach will enhance its operational potential, supporting the conservation and management of these critical habitats.

Supplementary Materials

The following supporting information can be downloaded at https://www.mdpi.com/article/10.3390/rs17142398/s1: S1: Cystoseira s.l. view from Skyros island during September 2024 mission, S2: Fraction maps of the seascape habitats.

Author Contributions

Conceptualization, D.P. and S.K.; methodology, D.P.; validation, D.P.; formal analysis, D.P.; data curation, D.P.; writing—original draft preparation, D.P.; writing—review and editing, D.P. and S.K.; visualization, D.P.; project administration, D.P. and S.K.; funding acquisition, D.P. and S.K. All authors have read and agreed to the published version of the manuscript.

Funding

This study was supported by the project NemoTools (next-generation monitoring and mapping tools to assess marine ecosystems and biodiversity) carried out within the framework of the National Recovery and Resilience Plan Greece 2.0, funded by the European Union—NextGenerationEU (implementation body: HFRI)—project No: 16035. DP was supported by the European Union’s Horizon Europe research and innovation program (project C-BLUES 101137844). Views and opinions expressed are, however, those of the beneficiaries only and do not necessarily reflect those of the European Union. Neither the European Union nor the granting authority can be held responsible for them.

Data Availability Statement

The products, in the format of GeoTIFF, are available upon request.

Acknowledgments

A special thanks to Planet and the Education & Research program (https://www.planet.com/markets/education-and-research/, accessed on 20 May 2025) for providing the PlanetScope images for this study.

Conflicts of Interest

The authors declare no conflicts of interest.

References

  1. Johansen, E. The Role of the Oceans in Regulating the Earth’s Climate: Legal Perspectives. In The Law of the Sea and Climate Change: Solutions and Constraints; Johansen, E., Busch, S.V., Jakobsen, I.U., Eds.; Cambridge University Press: Cambridge, UK, 2020; pp. 1–21. [Google Scholar]
  2. Prada, F.; Caroselli, E.; Mengoli, S.; Brizi, L.; Fantazzini, P.; Capaccioni, B.; Pasquini, L.; Fabricius, K.E.; Dubinsky, Z.; Falini, G.; et al. Ocean warming and acidification synergistically increase coral mortality. Sci. Rep. 2017, 7, 40842. [Google Scholar] [CrossRef]
  3. Guild, R.; Wang, X.; Quijón, P. Climate change impacts on coastal ecosystems. Environ. Res. Clim. 2025, 3, 042006. [Google Scholar] [CrossRef]
  4. Zhang, T.; Liu, H.; Lu, Y.; Wang, Q.; Loh, Y.C.; Li, Z. Impact of climate change on coastal ecosystem: A comparative analysis among four largest coastline covering countries. Environ. Res. 2024, 250, 118405. [Google Scholar] [CrossRef] [PubMed]
  5. Cinner, J.E.; Caldwell, I.R.; Thiault, L.; Ben, J.; Blanchard, J.L.; Coll, M.; Diedrich, A.; Eddy, T.D.; Everett, J.D.; Folberth, C.; et al. Potential impacts of climate change on agriculture and fisheries production in 72 tropical coastal communities. Nat. Commun. 2022, 13, 3530. [Google Scholar] [CrossRef]
  6. Cuttelod, A.; García, N.; Abdul Malak, D.; Temple, H.; Katariya, V. The Mediterranean: A biodiversity hotspot under threat. In The 2008 Review of The IUCN Red List of Threatened Species; Vié, J.-C., Hilton-Taylor, C., Stuart, S.N., Eds.; IUCN Gland: Gland, Switzerland, 2008. [Google Scholar]
  7. Malak, D. An Assessment of Marine Biodiversity Protection in the Mediterranean Sea: A Threatened Global Biodiversity Hotspot. 2022. Available online: https://planbleu.org/wp-content/uploads/2023/01/An_assessment_of_marine_biodiversity_protection_in_the_Mediterranean_Sea__3_.pdf (accessed on 31 January 2025).
  8. Vasilakopoulos, P.; Raitsos, D.E.; Tzanatos, E.; Maravelias, C.D. Resilience and regime shifts in a marine biodiversity hotspot. Sci. Rep. 2017, 7, 13647. [Google Scholar] [CrossRef] [PubMed]
  9. Coll, M.; Piroddi, C.; Albouy, C.; Ben Rais Lasram, F.; Cheung, W.W.L.; Christensen, V.; Karpouzi, V.S.; Guilhaumon, F.; Mouillot, D.; Paleczny, M.; et al. The Mediterranean Sea under siege: Spatial overlap between marine biodiversity, cumulative threats and marine reserves. Glob. Ecol. Biogeogr. 2012, 21, 465–480. [Google Scholar] [CrossRef]
  10. Lloret, J. Human health benefits supplied by Mediterranean marine biodiversity. Mar. Pollut. Bull. 2010, 60, 1640–1646. [Google Scholar] [CrossRef]
  11. Bianchi, C.N.; Morri, C. Marine Biodiversity of the Mediterranean Sea: Situation, Problems and Prospects for Future Research. Mar. Pollut. Bull. 2000, 40, 367–376. [Google Scholar] [CrossRef]
  12. Garrabou, J.; Gómez-Gras, D.; Medrano, A.; Cerrano, C.; Ponti, M.; Schlegel, R.; Bensoussan, N.; Turicchia, E.; Sini, M.; Gerovasileiou, V.; et al. Marine heatwaves drive recurrent mass mortalities in the Mediterranean Sea. Glob. Change Biol. 2022, 28, 5708–5725. [Google Scholar] [CrossRef]
  13. Katsanevakis, S.; Coll, M.; Piroddi, C.; Steenbeek, J.; Ben Rais Lasram, F.; Zenetos, A.; Cardoso, A.C. Invading the Mediterranean Sea: Biodiversity patterns shaped by human activities. Front. Mar. Sci. 2014, 1, 32. [Google Scholar] [CrossRef]
  14. Mineur, F.; Arenas, F.; Assis, J.; Davies, A.J.; Engelen, A.H.; Fernandes, F.; Malta, E.; Thibaut, T.; Van Nguyen, T.; Vaz-Pinto, F.; et al. European Seaweeds under Pressure: Consequences for Communities and Ecosystem Functioning. J. Sea Res. 2015, 98, 91–108. [Google Scholar] [CrossRef]
  15. Guiry, M.D.; Guiry, G.M. AlgaeBase. World-Wide Electronic Publication, University of Galway. Available online: https://www.algaebase.org (accessed on 31 January 2025).
  16. Sellam, L.N.; Blanfuné, A.; Boudouresque, C.F.; Thibaut, T.; Zahaf, C.R.; Verlaque, M. Cystoseira montagnei J. Agardh and C. spinosa Sauvageau (Phaeophyceae, Sargassaceae): A Taxonomic Reappraisal of Misused Names, with the Proposal of Cystoseira michaelae Verlaque et al. nom. et stat. nov. Cryptogam. Algol. 2017, 38, 133–157. [Google Scholar] [CrossRef]
  17. Bianchelli, S.; Danovaro, R. Impairment of microbial and meiofaunal ecosystem functions linked to algal forest loss. Sci. Rep. 2020, 10, 19970. [Google Scholar] [CrossRef] [PubMed]
  18. Lipej, L.; Ivajnšič, D.; Pitacco, V.; Trkov, D.; Mavrič, B.; Orlando-Bonaca, M. Coastal Fish Fauna in the Cystoseira s.l. Algal Belts: Experiences from the Northern Adriatic Sea. J. Mar. Sci. Eng. 2023, 11, 888. [Google Scholar] [CrossRef]
  19. Smith, C.J.; Verdura, J.; Papadopoulou, N.; Fraschetti, S.; Cebrian, E.; Fabbrizzi, E.; Monserrat, M.; Drake, M.; Bianchelli, S.; Danovaro, R.; et al. A decision-support framework for the restoration of Cystoseira sensu lato forests. Front. Mar. Sci. 2023, 10, 1159262. [Google Scholar] [CrossRef]
  20. Cimini, J.; Asnaghi, V.; Chiantore, M.; Kaleb, S.; Onida, A.; Falace, A. Can thermal anomalies impair the restoration of Cystoseira s.l. forests? Mar. Environ. Res. 2024, 198, 106537. [Google Scholar] [CrossRef]
  21. Mancuso, F.P.; Sarà, G.; Mannino, A.M. Conserving Marine Forests: Assessing the Effectiveness of a Marine Protected Area for Cystoseira sensu lato Populations in the Central Mediterranean Sea. Plants 2024, 13, 162. [Google Scholar] [CrossRef]
  22. Reeforest.eu. Available online: https://reeforest.eu/mapping-cystoseira (accessed on 9 March 2025).
  23. Promoting Biodiversity Enhancement by Restoration of Cystoseira POPulations, Reference: LIFE16 NAT/IT/000816|Acronym: ROC-POP-LIFE. Available online: https://webgate.ec.europa.eu/life/publicWebsite/project/LIFE16-NAT-IT-000816/promoting-biodiversity-enhancement-by-restoration-of-cystoseira-populations (accessed on 31 January 2025).
  24. Capdevila, P.; Hereu, B.; Riera, J.L.; Linares, C. Unravelling the natural dynamics and resilience patterns of underwater Mediterranean forests: Insights from the demography of the brown alga Cystoseira zosteroides. J. Ecol. 2016, 104, 1799–1808. [Google Scholar] [CrossRef]
  25. Felline, S.; Del Coco, L.; Kaleb, S.; Guarnieri, G.; Fraschetti, S.; Terlizzi, A.; Fanizzi, F.P.; Falace, A. The response of the algae Fucus virsoides (Fucales, Ochrophyta) to Roundup® solution exposure: A metabolomics approach. Environ. Pollut. (Barking Essex 1987) 2019, 254, 112977. [Google Scholar] [CrossRef]
  26. Darmaraki, S.; Denaxa, D.; Theodorou, I.; Livanou, E.; Rigatou, D.; Raitsos, E.D.; Stavrakidis-Zachou, O.; Dimarchopoulou, D.; Bonino, G.; McAdam, R.; et al. Marine Heatwaves in the Mediterranean Sea: A Literature Review. Mediterr. Mar. Sci. 2024, 25, 586–620. [Google Scholar] [CrossRef]
  27. Schoenrock, K.M.; Chan, K.M.; O’Callaghan, T.; O’CAllaghan, R.; Golden, A.; Krueger-Hadfield, S.A.; Power, A.M. A review of subtidal kelp forests in Ireland: From first descriptions to new habitat monitoring techniques. Ecol. Evol. 2020, 10, 6819–6832. [Google Scholar] [CrossRef] [PubMed]
  28. Davies, B.F.R.; Oiry, S.; Rosa, P.; Zoffoli, M.L.; Sousa, A.I.; Thomas, O.R.; Smale, D.A.; Austen, M.C.; Biermann, L.; Attrill, M.J.; et al. A sentinel watching over inter-tidal seagrass phenology across Western Europe and North Africa. Commun. Earth Environ. 2024, 5, 382. [Google Scholar] [CrossRef]
  29. Hill, V.J.; Zimmerman, R.C.; Byron, D.A.; Heck, K.L., Jr. Mapping Seagrass Distribution and Abundance: Comparing Areal Cover and Biomass Estimates Between Space-Based and Airborne Imagery. Remote Sens. 2024, 16, 4351. [Google Scholar] [CrossRef]
  30. Poursanidis, D.; Mylonakis, K.; Christofilakos, S.; Barnias, A. Mind the gap in data poor Natura 2000 sites and how to tackle them using Earth Observation and scientific diving surveys. Mar. Pollut. Bull. 2023, 188, 114595. [Google Scholar] [CrossRef] [PubMed]
  31. Cavanaugh, K.C.; Bell, T.; Costa, M.; Eddy, N.E.; Gendall, L.; Gleason, M.G.; Hessing-Lewis, M.; Martone, R.; McPherson, M.; Pontier, O.; et al. A Review of the Opportunities and Challenges for Using Remote Sensing for Management of Surface-Canopy Forming Kelps. Front. Mar. Sci. 2021, 8, 753531. [Google Scholar] [CrossRef]
  32. Mora-Soto, A.; Palacios, M.; Macaya, E.C.; Gómez, I.; Huovinen, P.; Pérez-Matus, A.; Young, M.; Golding, N.; Toro, M.; Yaqub, M.; et al. A High-Resolution Global Map of Giant Kelp (Macrocystis pyrifera) Forests and Intertidal Green Algae (Ulvophyceae) with Sentinel-2 Imagery. Remote Sens. 2020, 12, 694. [Google Scholar] [CrossRef]
  33. Bell, T.W.; Cavanaugh, K.C.; Saccomanno, V.R.; Cavanaugh, K.C.; Houskeeper, H.F.; Eddy, N.; Schuetzenmeister, F.; Rindlaub, N.; Gleason, M.; Pérez-Matus, A. Kelpwatch: A new visualization and analysis tool to explore kelp canopy dynamics reveals variable response to and recovery from marine heatwaves. PLoS ONE 2023, 18, e0271477. [Google Scholar] [CrossRef]
  34. Nikolaou, A.; Tsirintanis, K.; Rilov, G.; Katsanevakis, S. Invasive Fish and Sea Urchins Drive the Status of Canopy Forming Macroalgae in the Eastern Mediterranean. Biology 2023, 12, 763. [Google Scholar] [CrossRef]
  35. ActiveCaptain Map by Garmin. Available online: https://activecaptain.garmin.com/el-GR/Map (accessed on 9 March 2025).
  36. Sales, M.; Ballesteros, E. Seasonal dynamics and annual production of Cystoseira crinita (Fucales: Ochrophyta)-dominated assemblages from the northwestern Mediterranean. Sci. Mar. 2012, 76, 391–401. [Google Scholar] [CrossRef]
  37. Vanhellemont, Q.; Ruddick, K. Atmospheric correction of metre-scale optical satellite data for inland and coastal water applications. Remote Sens. Environ. 2018, 216, 586–597. [Google Scholar] [CrossRef]
  38. Vanhellemont, Q. Daily metre-scale mapping of water turbidity using CubeSat imagery. Opt. Express 2019, 27, A1372–A1399. [Google Scholar] [CrossRef] [PubMed]
  39. Vanhellemont, Q. Evaluation of eight band SuperDove imagery for aquatic applications. Opt. Express 2023, 31, 13851–13874. [Google Scholar] [CrossRef] [PubMed]
  40. Castagna, A.; Vanhellemont, Q. A generalised physics-based correction for adjacency effects. Appl. Opt. 2025, 64, 2719. [Google Scholar] [CrossRef]
  41. Jakimow, B.; Janz, A.; Thiel, F.; Okujeni, A.; Hostert, P.; van der Linden, S. EnMAP-Box: Imaging spectroscopy in QGIS. SoftwareX 2023, 23, 101507. [Google Scholar] [CrossRef]
  42. Pons, X.; Cristóbal, J.; Sanjurjo-Vílchez, J. Some notes on the divergence and transformed divergence formulae in the remote sensing literature. Remote Sens. Lett. 2024, 15, 1187–1194. [Google Scholar] [CrossRef]
  43. Breiman, L. Random Forests. Mach. Learn. 2001, 45, 5–32. [Google Scholar] [CrossRef]
  44. Gislason, P.O.; Benediktsson, J.A.; Sveinsson, J.R. Random Forests for Land Cover Classification. Pattern Recognit. Lett. 2006, 27, 294–300. [Google Scholar] [CrossRef]
  45. Hu, W.; Zhang, D.; Chen, B.; Liu, X.; Ye, X.; Jiang, Q. Mapping the Seagrass Conservation and Restoration Priorities: Coupling Habitat Suitability and Anthropogenic Pressures. Ecol. Indic. 2021, 129, 107960. [Google Scholar] [CrossRef]
  46. Poursanidis, D.; Traganos, D.; Teixeira, L.; Shapiro, A.; Muaves, L. Cloud-native seascape mapping of Mozambique’s Quirimbas National Park with Sentinel-2. Remote Sens. Ecol. Conserv. 2021, 7, 275–291. [Google Scholar] [CrossRef]
  47. Traganos, D.; Lee, C.B.; Blume, A.; Poursanidis, D.; Čižmek, H.; Deter, J.; Mačić, V.; Montefalcone, M.; Pergent, G.; Pergent-Martini, C.; et al. Spatially Explicit Seagrass Extent Mapping Across the Entire Mediterranean. Front. Mar. Sci. 2022, 9, 871799. [Google Scholar] [CrossRef]
  48. Okujeni, A.; van der Linden, S.; Tits, L.; Somers, B.; Hostert, P. Support vector regression and synthetically mixed training data for quantifying urban land cover. Remote Sens. Environ. 2013, 137, 184–197. [Google Scholar] [CrossRef]
  49. Okujeni, A.; van der Linden, S.; Suess, S.; Hostert, P. Ensemble learning from synthetically mixed training data for quantifying urban land cover with support vector regression. IEEE J. Sel. Top. Appl. Earth Obs. Remote Sens. 2017, 10, 1640–1650. [Google Scholar] [CrossRef]
  50. Okujeni, A.; Jänicke, C.; Cooper, S.; Frantz, D.; Hostert, P.; Clark, M.; Segl, K.; van der Linden, S. Multi-season unmixing of vegetation class fractions across diverse Californian ecoregions using simulated spaceborne imaging spectroscopy data. Remote Sens. Environ. 2021, 264, 112558. [Google Scholar] [CrossRef]
  51. Stehman, S.V. Estimating area and map accuracy for stratified random sampling when the strata are different from the map classes. Int. J. Remote Sens. 2014, 35, 4923–4939. [Google Scholar] [CrossRef]
  52. Senf, C.; Laštovička, J.; Okujeni, A.; Heurich, M.; van der Linden, S. A generalized regression-based unmixing model for mapping forest cover fractions throughout three decades of Landsat data. Remote Sens. Environ. 2020, 240, 111691. [Google Scholar] [CrossRef]
  53. Pedregosa, F.; Varoquaux, G.; Gramfort, A.; Michel, V.; Thirion, B.; Grisel, O.; Blondel, M.; Prettenhofer, P.; Weiss, R.; Dubourg, V.; et al. Scikit-learn: Machine Learning in Python. J. Mach. Learn. Res. 2011, 12, 2825–2830. [Google Scholar]
  54. Ha, N.T.; Nguyen, H.Q.; Pham, T.D.; Hoang, C.-T.; Hawes, I. Superpixel for seagrass mapping: A novel method using PlanetScope imagery and machine learning in Tauranga harbour. N. Z. Environ. Earth Sci. 2023, 82, 154. [Google Scholar] [CrossRef]
  55. Krause, J.R.; Hinojosa-Corona, A.; Gray, A.B.; Burke Watson, E. Emerging Sensor Platforms Allow for Seagrass Extent Mapping in a Turbid Estuary and from the Meadow to Ecosystem Scale. Remote Sens. 2021, 13, 3681. [Google Scholar] [CrossRef]
  56. Wicaksono, P.; Lazuardi, W. Assessment of PlanetScope images for benthic habitat and seagrass species mapping in a complex optically shallow water environment. Int. J. Remote Sens. 2018, 39, 5739–5765. [Google Scholar] [CrossRef]
  57. Frazier, A.E.; Hemingway, B.L. A Technical Review of Planet Smallsat Data: Practical Considerations for Processing and Using PlanetScope Imagery. Remote Sens. 2021, 13, 3930. [Google Scholar] [CrossRef]
  58. Kim, M.; Park, S.; Anderson, C.; Stensaas, G.L. Chapter F of System characterization report on Planet’s SuperDove. In System Characterization of Earth Observation Sensors; Chandra, S.N.R., Ed.; Open-File Report 2021–1030; U.S. Geological Survey: Reston, VA, USA, 2022; p. 19. [Google Scholar] [CrossRef]
Figure 1. In the red polygon is Skyros Island (upper left) in the North Aegean Sea, and in the red lined polygon is the case study area.
Remotesensing 17 02398 g001
Figure 2. Elusive Cystoseira forests as recorded during fieldwork in September 2024. Photo: Vasillis Trakos.
Remotesensing 17 02398 g002
Figure 3. The imagery from the PlanetLabs archive as visualized in R (band 6)-G (band 4)-B (band 2) and overlaid over BING imagery in QGIS. The coordinate system is EPSG 32635 WGS 84/UTM zone 35N.
Remotesensing 17 02398 g003
Figure 4. The developed workflow for image processing, training and validation design and classification.
Remotesensing 17 02398 g004
Figure 5. The spatial distribution of the training data overlaid on the atmospheric corrected imagery.
Remotesensing 17 02398 g005
Figure 6. The spectral signatures of the designated classification scheme, as collected at 5 m depth from the satellite imagery.
Remotesensing 17 02398 g006
Figure 7. The location of the evaluation dataset.
Remotesensing 17 02398 g007
Figure 8. The sites of the field data collection for the Cystoseira spp. class.
Remotesensing 17 02398 g008
Figure 9. The distribution of the coastal marine habitats, as resulted from the analysis of the PlanetLabs SuperDove imagery and the Random Forest supervised classification.
Remotesensing 17 02398 g009
Figure 10. Zoomed map of the southern part of the region.
Remotesensing 17 02398 g010
Figure 11. Zoomed map of the central/northern part of the region.
Remotesensing 17 02398 g011
Figure 12. Fraction cover map of Cystoseira s.l.
Remotesensing 17 02398 g012
Table 1. Summary information on the annotated data used in the analysis of the imagery.
ClassNumber of PolygonsNumber of Annotated Pixels
Cystoseira spp. forests3469
Deep soft bottoms715,809
Seagrass primarily composed of Posidonia oceanica2626,561
Rocky reefs with other cover1227,575
Shallow soft bottoms3125,248
Table 2. Transformed Divergence values in pairs of marine habitats.
Classvs.ClassTD Value
Seagrass-Rocky reefs1.51
Cystoseira spp.-Rocky reefs1.69
Rocky reefs-Soft bottoms (shallow)1.81
Soft bottoms (deep)-Seagrass1.83
Soft bottoms (deep)-Rocky reefs1.89
Cystoseira spp.-Soft bottoms (shallow)1.93
Soft bottoms (deep)-Soft bottoms (shallow)1.95
Seagrass-Soft bottoms (shallow)1.96
Cystoseira spp.-Seagrass1.99
Cystoseira spp.-Soft bottoms (deep)1.99
Table 3. Areal extend of the habitats mapped using Copernicus Contribution Mission data.
ClassAreal Extent
Cystoseira s.l. 25.83
Sand (shallow)336.92
Sand (deep)370.99
Posidonia oceanica922.96
Rocky bottoms (without Cystoseira)981.13
Table 4. Confusion matrix counts: predicted (rows) vs. observed (columns).
Cystoseira spp.Soft Bottoms (Deep)SeagrassRocky ReefsSoft Bottoms (Shallow)
Cystoseira spp.180000
Soft bottons (deep)020000
Seagrass002030
Rocky reefs200170
Soft bottons (shallow)000020
Table 5. Class-wise accuracies.
User’s Accuracy (UA)Producer’s Accuracy (PA)F1 Score
Cystoseira spp.10.90.94
Soft bottoms (deep)111
Seagrass0.8710.93
Rocky reefs0.890.850.87
Soft bottoms (shallow)111
Table 6. Regression metrics from the fraction cover evaluation.
Cystoseira s.l.Soft Bottoms (Deep)SeagrassRocky ReefsSoft Bottoms (Shallow)
Mean absolute error (MAE)0.060.00520.040.0970.007
Root MSE (RMSE)0.170.020.130.210.046
Ratio of performance to deviation (RPD)2.3718.663.0051.878.72
Mean error (ME)−0.06300.0180.04−0.006
Mean squared error (MSE)0.0290.00050.0180.0460.002
Median absolute error (MedAE)00000
Squared Pearson correlation (r2)0.890.990.890.730.99
Explained variance score0.850.990.890.730.99
Coefficient of determination (R2)0.820.990.890.710.99
Disclaimer/Publisher’s Note: The statements, opinions and data contained in all publications are solely those of the individual author(s) and contributor(s) and not of MDPI and/or the editor(s). MDPI and/or the editor(s) disclaim responsibility for any injury to people or property resulting from any ideas, methods, instructions or products referred to in the content.

