Article

DMA-Net: Dynamic Morphology-Aware Segmentation Network for Remote Sensing Images

1
School of Artificial Intelligence, Nanning Normal University, No. 508, Xinning Road, Nanning 530100, China
2
State Key Laboratory of Remote Sensing and Digital Earth, Aerospace Information Research Institute, Chinese Academy of Sciences, Beijing 100101, China
3
University of Chinese Academy of Sciences, Beijing 100049, China
*
Author to whom correspondence should be addressed.
Remote Sens. 2025, 17(14), 2354; https://doi.org/10.3390/rs17142354
Submission received: 6 May 2025 / Revised: 29 May 2025 / Accepted: 2 June 2025 / Published: 9 July 2025

Abstract

Semantic segmentation of remote sensing imagery is a pivotal task for intelligent interpretation, with critical applications in urban monitoring, resource management, and disaster assessment. Recent advancements in deep learning have significantly improved RS image segmentation, particularly through the use of convolutional neural networks, which demonstrate remarkable proficiency in local feature extraction. However, due to the inherent locality of convolutional operations, prevailing methodologies frequently encounter challenges in capturing long-range dependencies, thereby constraining their comprehensive semantic comprehension. Moreover, the preprocessing of high-resolution remote sensing images by dividing them into sub-images disrupts spatial continuity, further complicating the balance between local feature extraction and global context modeling. To address these limitations, we propose DMA-Net, a Dynamic Morphology-Aware Segmentation Network built on an encoder–decoder architecture. The proposed framework incorporates three primary parts: a Multi-Axis Vision Transformer (MaxViT) encoder achieves a balance between local feature extraction and global context modeling through multi-axis self-attention mechanisms; a Hierarchy Attention Decoder (HA-Decoder) enhanced with Hierarchy Convolutional Groups (HCG) for precise recovery of fine-grained spatial details; and a Channel and Spatial Attention Bridge (CSA-Bridge) to mitigate the encoder–decoder semantic gap while amplifying discriminative feature representations. Extensive experimentation has been conducted to demonstrate the state-of-the-art performance of DMA-Net, which has been shown to achieve 87.31% mIoU on Potsdam, 83.23% on Vaihingen, and 54.23% on LoveDA, thereby surpassing existing methods.

1. Introduction

Semantic segmentation of remote sensing (RS) imagery is a foundational task in intelligent interpretation [1,2], enabling pixel-level precise classification of diverse ground objects [3,4,5,6,7]. The rapid evolution of RS sensors, characterized by progressively higher spatial resolutions and imaging frequencies, has significantly expanded the applications of high-resolution imagery [8,9,10]. This expansion encompasses domains such as urban monitoring, land use mapping, ecological assessment, and disaster management [11,12,13,14,15]. Compared to conventional resolution data, modern high-precision RS imagery exhibits substantially richer textural details and structural complexity, which theoretically supports both enhanced recognition accuracy and finer segmentation boundaries. Nevertheless, this also puts higher requirements on the semantic segmentation model in terms of feature extraction, context understanding, and computational efficiency.
Convolutional neural networks (CNNs) [16] have been widely used in various image analysis tasks since their emergence and have gradually become the dominant technical framework for semantic segmentation of remote sensing images. By leveraging the concepts of local receptive fields and parameter sharing, CNNs can efficiently extract edge, texture, and structural information from images, making them particularly well-suited for remote sensing applications characterized by strong spatial locality. U-Net, a notable architecture, employs a symmetrical encoder–decoder configuration, leveraging skip connections to seamlessly integrate multi-scale features. This architecture has demonstrated remarkable efficacy in medical image segmentation and remote sensing image segmentation tasks. The efficacy of these architectures is evident in the substantial advancements achieved in semantic segmentation, particularly in terms of accuracy and generalization capability.
Despite their pervasive utilization, CNNs are inherently limited by their local receptive fields, which are constrained by both kernel size and network depth. This fundamental characteristic impedes their ability to capture long-range dependencies and complex spatial–semantic relationships in remote sensing imagery, particularly when processing high-resolution images [17]. These architectural constraints compromise global context integration, ultimately degrading segmentation accuracy [18,19,20]. To address these limitations, researchers have proposed several enhancement strategies: Spatial Transformer Networks (STNs) [21] incorporate learnable geometric transformation modules to adaptively adjust spatial representations, thereby improving structural awareness. Dilated Convolutions [22] expand receptive fields through dilation rates, enabling large-scale context capture without substantial increases in parameters or computational complexity. Squeeze-and-Excitation Networks (SE-Net) [23] establish explicit inter-channel dependencies via attention mechanisms for feature recalibration. The Convolutional Block Attention Module (CBAM) [24] dynamically enhances features through coordinated channel and spatial attention mechanisms. Adaptive Spatial Feature Fusion (ASFF) [25] mitigates multi-scale feature conflicts through spatial filtering, improving semantic consistency. While these approaches partially improve global context perception, they remain fundamentally rooted in local convolution operations, failing to fully address long-range dependency modeling. Moreover, most enhancements introduce additional computational overhead and parameter complexity, creating deployment challenges in resource-constrained environments [26,27,28,29]. This trade-off between accuracy and efficiency becomes particularly acute in high-resolution remote sensing image segmentation tasks.
To address the limitations of CNNs in modeling long-range dependencies, the Transformer [30] architecture has been introduced to semantic segmentation tasks [31,32]. The core multi-head self-attention mechanism of Transformers offers robust global modeling capabilities, which significantly enhances the recognition of complex land structures in remote sensing images [33,34]. However, a Vision Transformer (ViT) faces two significant challenges in image tasks. First, the computation of global self-attention is highly expensive, making it difficult to scale to high-resolution images. Second, a ViT lacks an inherent ability to model local details, resulting in insufficient extraction of fine-grained features [35,36,37]. These limitations hinder their effectiveness in remote sensing image applications. To overcome the limitations of ViTs, researchers have proposed various efficient variants to improve its adaptability in image tasks. A Swin Transformer [38], for instance, achieves a balance between local modeling and global interaction through a sliding window mechanism. A Cross-Shape Window Transformer (CSWin) [39] enhances spatial structure modeling with cross-window attention. Architectures such as Mobile-Former [40] and EdgeViT [41] have been developed to strike a balance between lightweight design and modeling capability. As Transformer technology expands into the domain of remote sensing, models such as ST-UNet [42], MAResU-Net [43], UNetFormer [44], and AerialFormer [44] have been developed. These models incorporate mechanisms such as window attention, linear attention, skip connection reconstruction, and multi-scale convolution, thereby enhancing the accuracy and expressive power of remote sensing semantic segmentation.
Transformer-based methods have exhibited remarkable efficacy in remote sensing semantic segmentation tasks. However, several challenges persist. On one hand, the increasing number of modules has led to more complex network architectures, significantly extending model inference time and making it difficult to meet the real-time and lightweight requirements of practical applications [45]. On the other hand, current research focuses primarily on the optimization of encoder structures, often overlooking the critical role of decoders in feature reconstruction and boundary detail restoration [46]. This oversight often leads to suboptimal recognition of fine-grained object structures in the resulting segmentation maps [43]. Furthermore, remote sensing imagery is distinguished by substantial spatial heterogeneity and a wide spectrum of object morphologies, which impose elevated demands on the generalization capability of models [47]. However, existing studies have paid limited attention to data augmentation strategies and task-adaptive modeling, further limiting performance in real-world scenarios [44].
To address the aforementioned challenges, this study proposes a lightweight and efficient Dynamic Morphology-Aware Segmentation Network (DMA-Net), which is designed to achieve fine-grained segmentation of land cover objects in high-resolution remote sensing imagery while maintaining a compact architecture and high inference efficiency. The proposed model employs an encoder–decoder framework. The encoder integrates the Multi-Axis Vision Transformer (MaxViT) as the backbone, leveraging multi-axis self-attention to jointly model local details and global semantics efficiently. The decoder employs a Hierarchical Attention Decoder (HA-Decoder), which incorporates a Hierarchical Convolutional Group (HCG) to enhance the restoration of edge structures and small-scale features. Furthermore, a Channel-Spatial Attention Bridge (CSA-Bridge) is introduced to effectively mitigate the semantic gap between the encoder and decoder, thereby improving feature consistency and discriminability. The primary contributions of this study are as follows:
1.
We propose DMA-Net, a lightweight segmentation network that integrates MaxViT to efficiently capture both local and global features in high-resolution remote sensing imagery.
2.
We design a novel HA-Decoder with HCG to enhance multi-scale context fusion and fine-grained detail restoration.
3.
We introduce a CSA-Bridge to improve semantic consistency between encoder and decoder by enhancing inter-patch feature representation.
The remainder of this study is organized as follows: Section 2 reviews the related work on semantic segmentation networks, with particular emphasis on MaxViT and U-Net-like architectures. Section 3 presents the overall architecture of the proposed DMA-Net, including the design of its key components: the MaxViT encoder, the HA-Decoder, and the CSA-Bridge. Section 4 introduces the experimental settings and datasets, presents ablation results, and compares the model’s performance on the Potsdam, Vaihingen, and LoveDA datasets. Section 5 concludes the study and discusses potential directions for future research. The source code will be available at https://github.com/HIGISX/DMA-Net (accessed on 4 June 2025).

2. Related Work

2.1. MaxViT

In remote sensing images, objects manifest substantial variations in scale. For instance, buildings and low vegetation typically occupy large areas, while smaller objects such as vehicles take up much less space. This phenomenon underscores the inherently multi-scale nature of remote sensing scenes, where effective analysis necessitates consideration across multiple scales [48,49,50].
Multi-scale information analysis plays a pivotal role in remote sensing tasks. For instance, Zhao et al. developed a double-branch Siamese network to capture multi-scale spatial details in change detection imagery [51], Yu et al. introduced a Multi-Scale Feature Interaction module to enhance object detection performance by leveraging hierarchical features [52], while Alhichri et al. proposed a multibranch fusion attention mechanism to extract discriminative multi-scale representations for scene classification [53]. These approaches collectively underscore the significance of cross-scale feature learning in advancing remote sensing applications.
However, a single attention window is not sufficient to effectively capture such diverse spatial scales. Additionally, the quadratic computational complexity of self-attention renders it impractical to directly model dependencies across the entire spatial domain. Numerous studies have addressed this issue. Su et al.’s Multiscale Feature Fusion Module effectively extracts multi-scale features from remote sensing roadscape images by combining convolutional kernels of varying sizes [54]. Guo’s Saliency Dual Attention Residual Network employs a dual-attention mechanism to analyze remote sensing images from multiple perspectives, thoroughly exploring latent information along the channel dimension [55]. HE’s HFSA-Unet preserves global features throughout the decoding phase via a hybrid first and second order attention mechanism [56]. While these approaches significantly improve the efficiency of remote sensing models, they all fail to properly balance global feature extraction with local detail preservation.
To address this issue, MaxViT [57] introduces a multi-axis attention mechanism that factorizes the spatial dimensions, thereby decomposing full-resolution attention into two sparse forms: local and global. This design reduces the quadratic complexity of the Transformer attention mechanism to linear complexity, enhancing computational efficiency. The multi-axis attention mechanism is composed of two distinct components: Block Attention and Grid Attention. Block Attention is responsible for capturing local dependencies, while Grid Attention is responsible for capturing global dependencies.
Given a feature map X R ( H × W × C ) , Block Attention segments it into tensors of size ( H P × W P , P × P , C ) , where P × P represents non-overlapping windows. Self-attention is then performed over these fixed, non-overlapping windows of size P × P . To capture fine-grained features, Grid Attention divides the feature map X into tensors of size ( G × G , H G × W G , C ) , applying self-attention calculations over adaptive windows of size H G × W G . By alternating between fixed windows and adaptive windows, MaxViT effectively balances the computational costs of local and global self-attention operations.

2.2. U-Net-Like Architecture for Semantic Segmentation Networks

U-Net is a classic, fully convolutional network architecture widely used for semantic segmentation tasks, consisting of three main components: the encoder, decoder, and skip connections. The architecture is symmetric, with the left-side encoding path extracting image features through layer-by-layer downsampling, progressively capturing high-level semantic information while reducing spatial dimensions. Conversely, the right-side decoder path restores the spatial resolution of the feature maps through upsampling, generating pixel-level predictions. To preserve spatial details and mitigate the loss of semantic information during downsampling, U-Net introduces skip connections that directly transfer high-resolution features from the encoder’s shallow layers to the corresponding decoder layers. This design improves performance, particularly in boundary regions and small object segmentation. In Unet++, the encoder progressively extracts semantic features at multiple levels using convolution and downsampling operations, producing feature maps of varying scales. Additionally, dense skip connections [58] are introduced to facilitate more effective fusions of features from different semantic levels, while deep supervision is applied during the decoding phase.
With the continuous improvement in the resolution and diversity of remote sensing images, U-Net [59] and its variants have been widely adopted for remote sensing semantic segmentation tasks, achieving ongoing advancements in multi-scale feature extraction, boundary modeling, and context fusion. For example, Zhang et al. introduced the High-Resolution Network (HRNet) [60] architecture, incorporating multi-branch parallel convolutions to construct multi-scale feature representations and designing an adaptive spatial pooling module to effectively enhance the modeling of local contextual information. Majoli et al. integrated an edge detection [61] module into the segmentation network to explicitly capture boundary features, thereby improving the recognition of land cover contours. Qi et al. proposed a spatial information reasoning structure that combines recurrent neural networks with 3D convolutions [62] to enhance the network’s spatial understanding in occluded areas, significantly improving performance in road detection tasks. To address the discontinuity issue in bounding box regression, RSDet [63] introduced a modulation loss function, while AOPG [64] and R3Det [65] employed progressive regression methods to gradually refine object localization from coarse to fine scales, thereby improving detection accuracy and stability.
ST-Unet, based on a Swin Transformer, integrates a Spatial Interaction Module (SIM), Feature Compression Module (FCM), and Relation Aggregation Module (RAM) into the traditional U-Net architecture. This design improves the recognition of small objects and effectively mitigated semantic ambiguity caused by occlusions. ABCNet [66] constructs a dual-path structure combining CNNs and Transformers, where one spatial path preserves local detail information and another context path captures global semantics. Through a Feature Aggregation Module (FAM), it achieves multi-scale information fusion, leading to improved segmentation performance. LSKNet [67] utilizes the Large Selective Kernel Network, dynamically adjusting the receptive field of the backbone network to better adapt to objects at different scales. It also utilizes depthwise separable convolution to enhance multi-scale context modeling with a reduced computational cost. SCRDet [68] incorporates attention mechanisms to reduce background noise and enhance the detection of dense, small-scale targets. Some studies have explored combining object detection frameworks with the Transformer-based architectures. For instance, AO2-DETR [69] adapts the DETR [70] architecture to remote sensing applications by introducing a dual encoder design and a rotation-aware detection strategy, offering new approaches for detecting and segmenting complex objects in remote sensing images.
Despite the numerous advancements achieved by the aforementioned methods in remote sensing image semantic segmentation, there are still challenges such as complex network structures, high computational costs, insufficient boundary detail recovery capability in decoders, and limited adaptability to the unique spatial heterogeneity of remote sensing images. The current state of research in remote sensing semantic segmentation is characterized by the ongoing pursuit of solutions to three critical issues. Firstly, the challenge lies in balancing segmentation accuracy with reduced model complexity. Secondly, enhancing detail restoration capabilities is paramount. Thirdly, improving adaptability to the complex spatial features of remote sensing images is essential.

3. Method

To achieve efficient and accurate segmentation of complex land cover structures in remote sensing images [71,
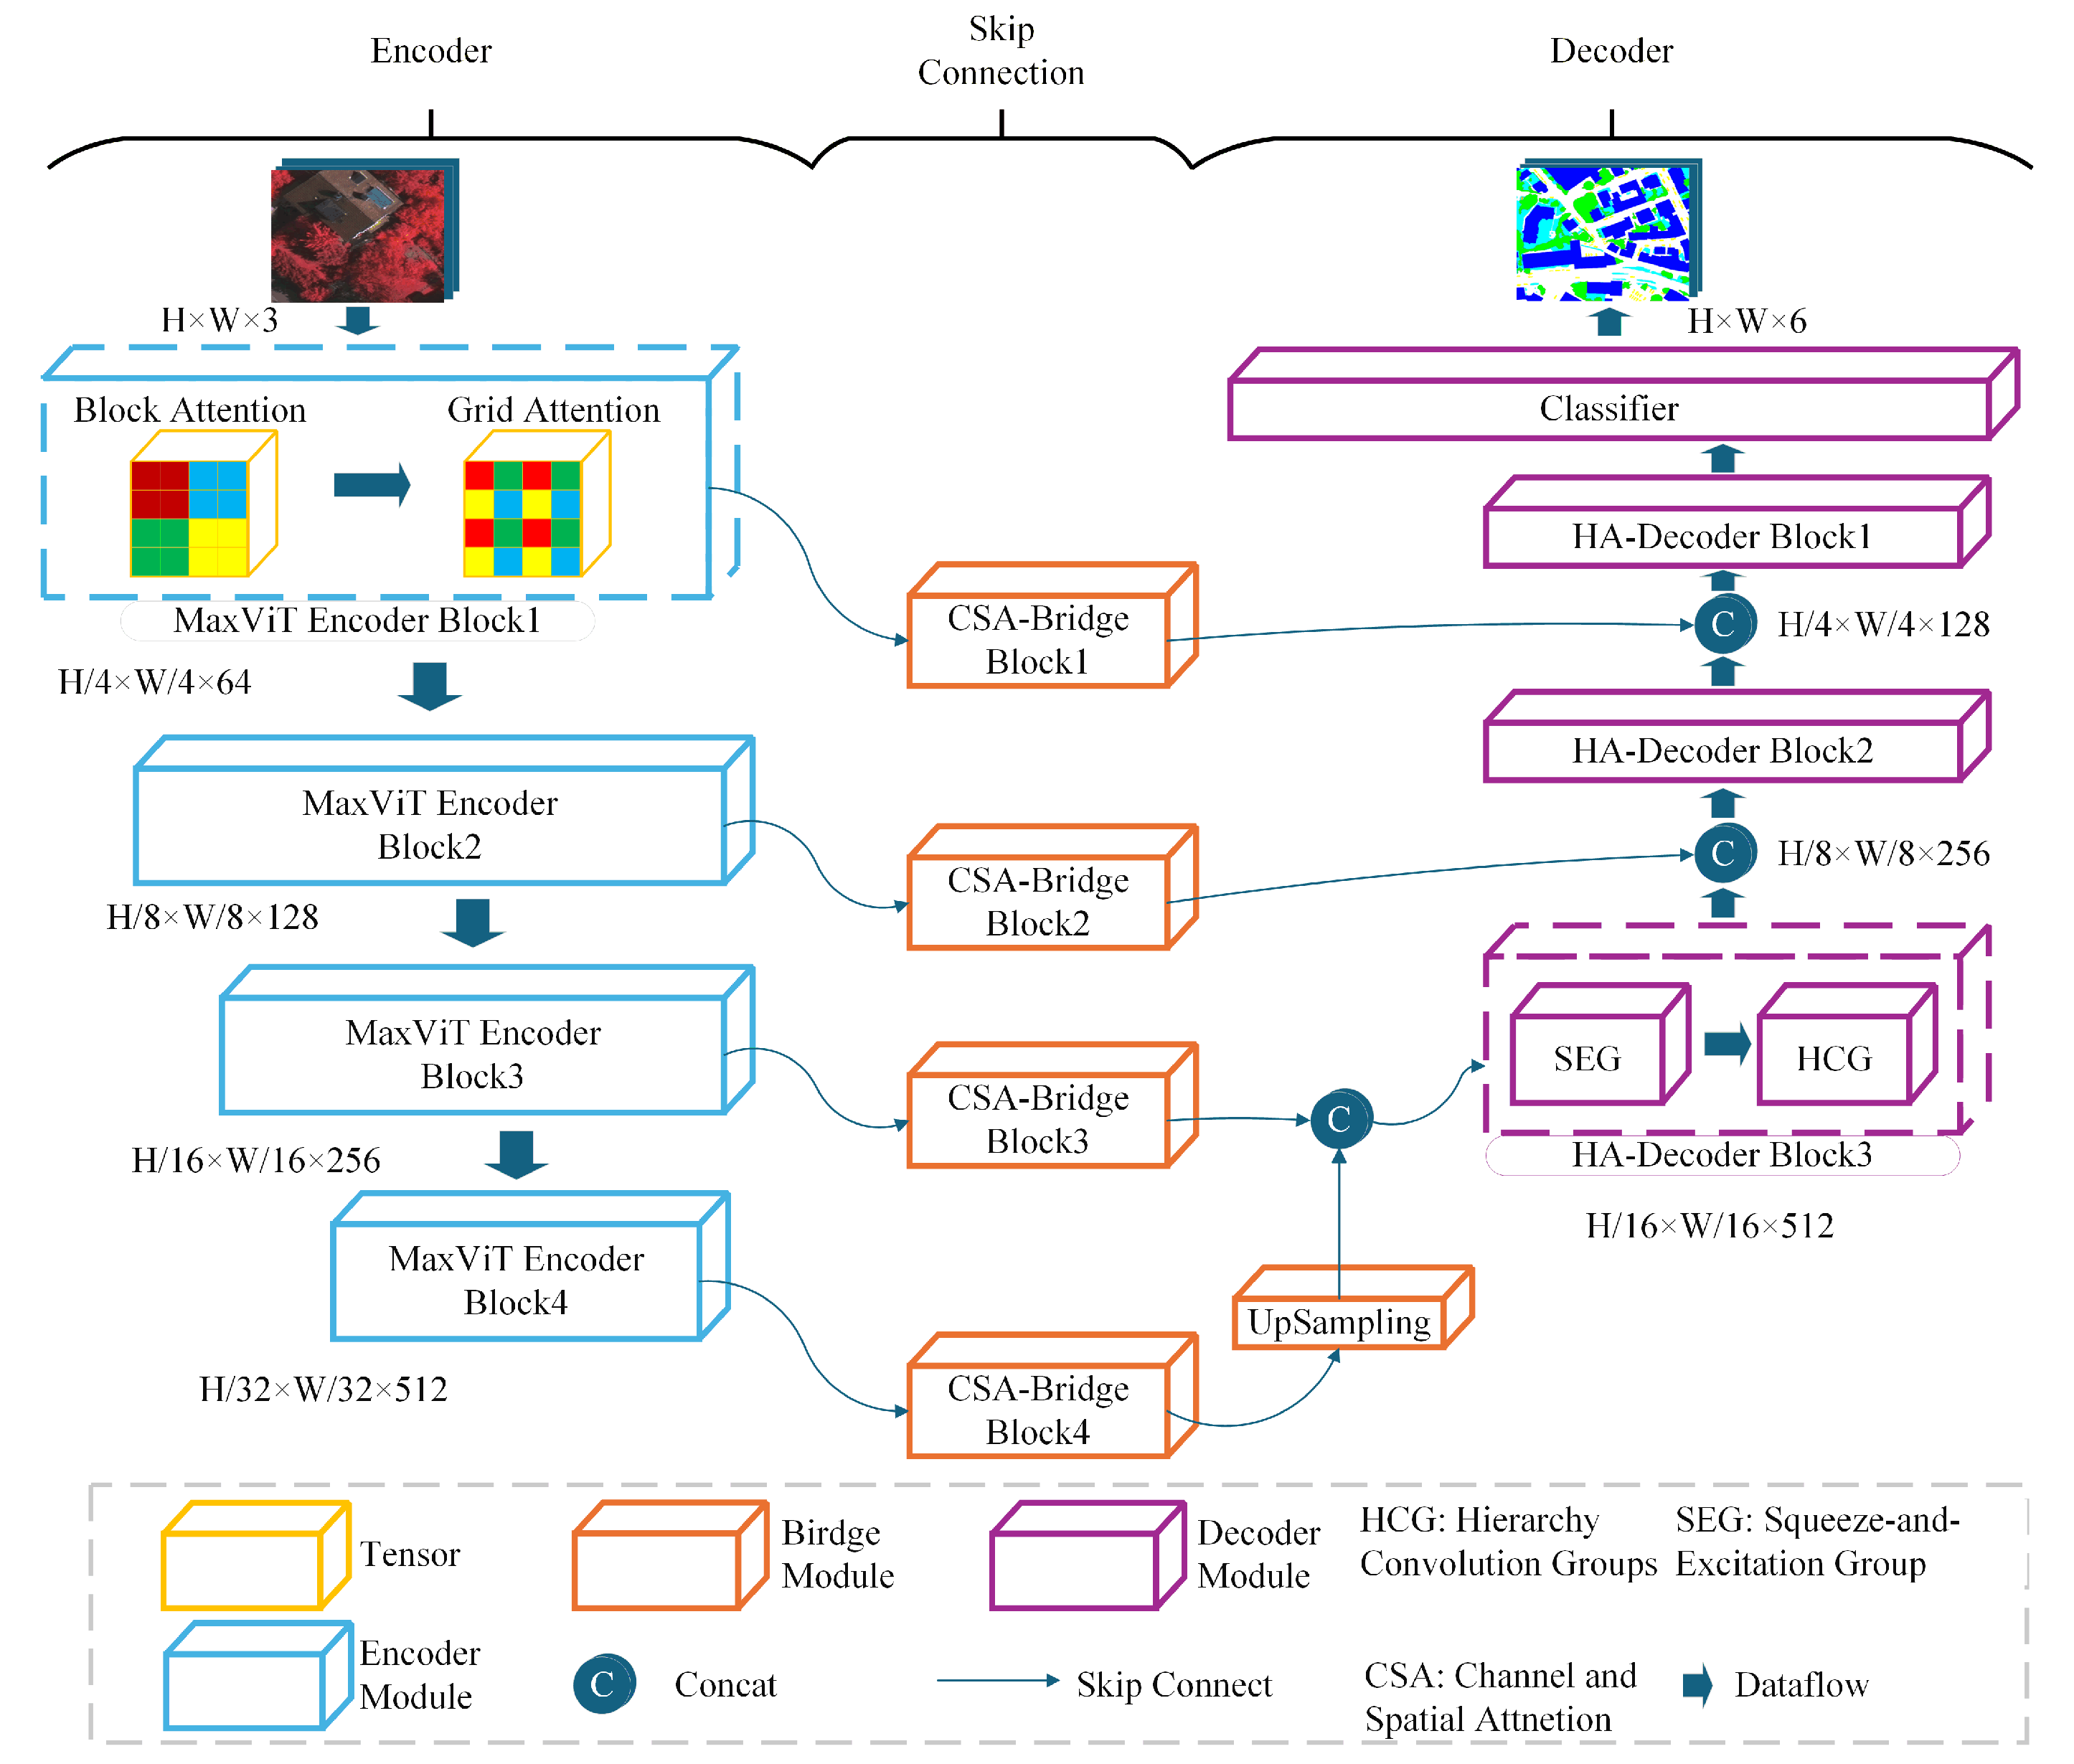
72], this study proposes DMA-Net, a novel semantic segmentation network built upon an encoder–decoder architecture. The network incorporates a multi-axis attention mechanism to enhance local and global feature modeling, and integrates a fine-grained Hierarchical Attention Decoder (HA-Decoder) and a Channel-Spatial Attention Bridge (CSA-Bridge) to recover small object details and boundary structures. These components are jointly optimized to ensure high segmentation accuracy while maintaining low computational complexity and strong deployability. This section offers a thorough overview of the DMA-Net architecture, introducing its fundamental modules: the encoder, decoder, and skip connection.

3.1. Network Structure

As illustrated in Figure 1, DMA-Net consists of three main components: the encoder based on MaxViT, the HA-Decoder, and the CSA-Bridge for skip connections.
Given an input image X R H × W × 3 , the encoder extracts multi-scale feature maps from different stages:
F = E n c o d e r X
Here, F = [ F 1 , F 2 , F 3 , F 4 ] represents the feature maps at each encoding stage, with progressively reduced spatial resolution and increased channel depth. These multi-scale features are refined through the CSA-Bridge:
F ^ = C S A B r i d g e ( F )
Finally, the decoder aggregates and upsamples these refined features to generate the segmentation output:
S = D e c o d e r F ^ , S R ( H × W × C )
where C is the number of semantic classes.

3.2. MaxViT Encoder Block

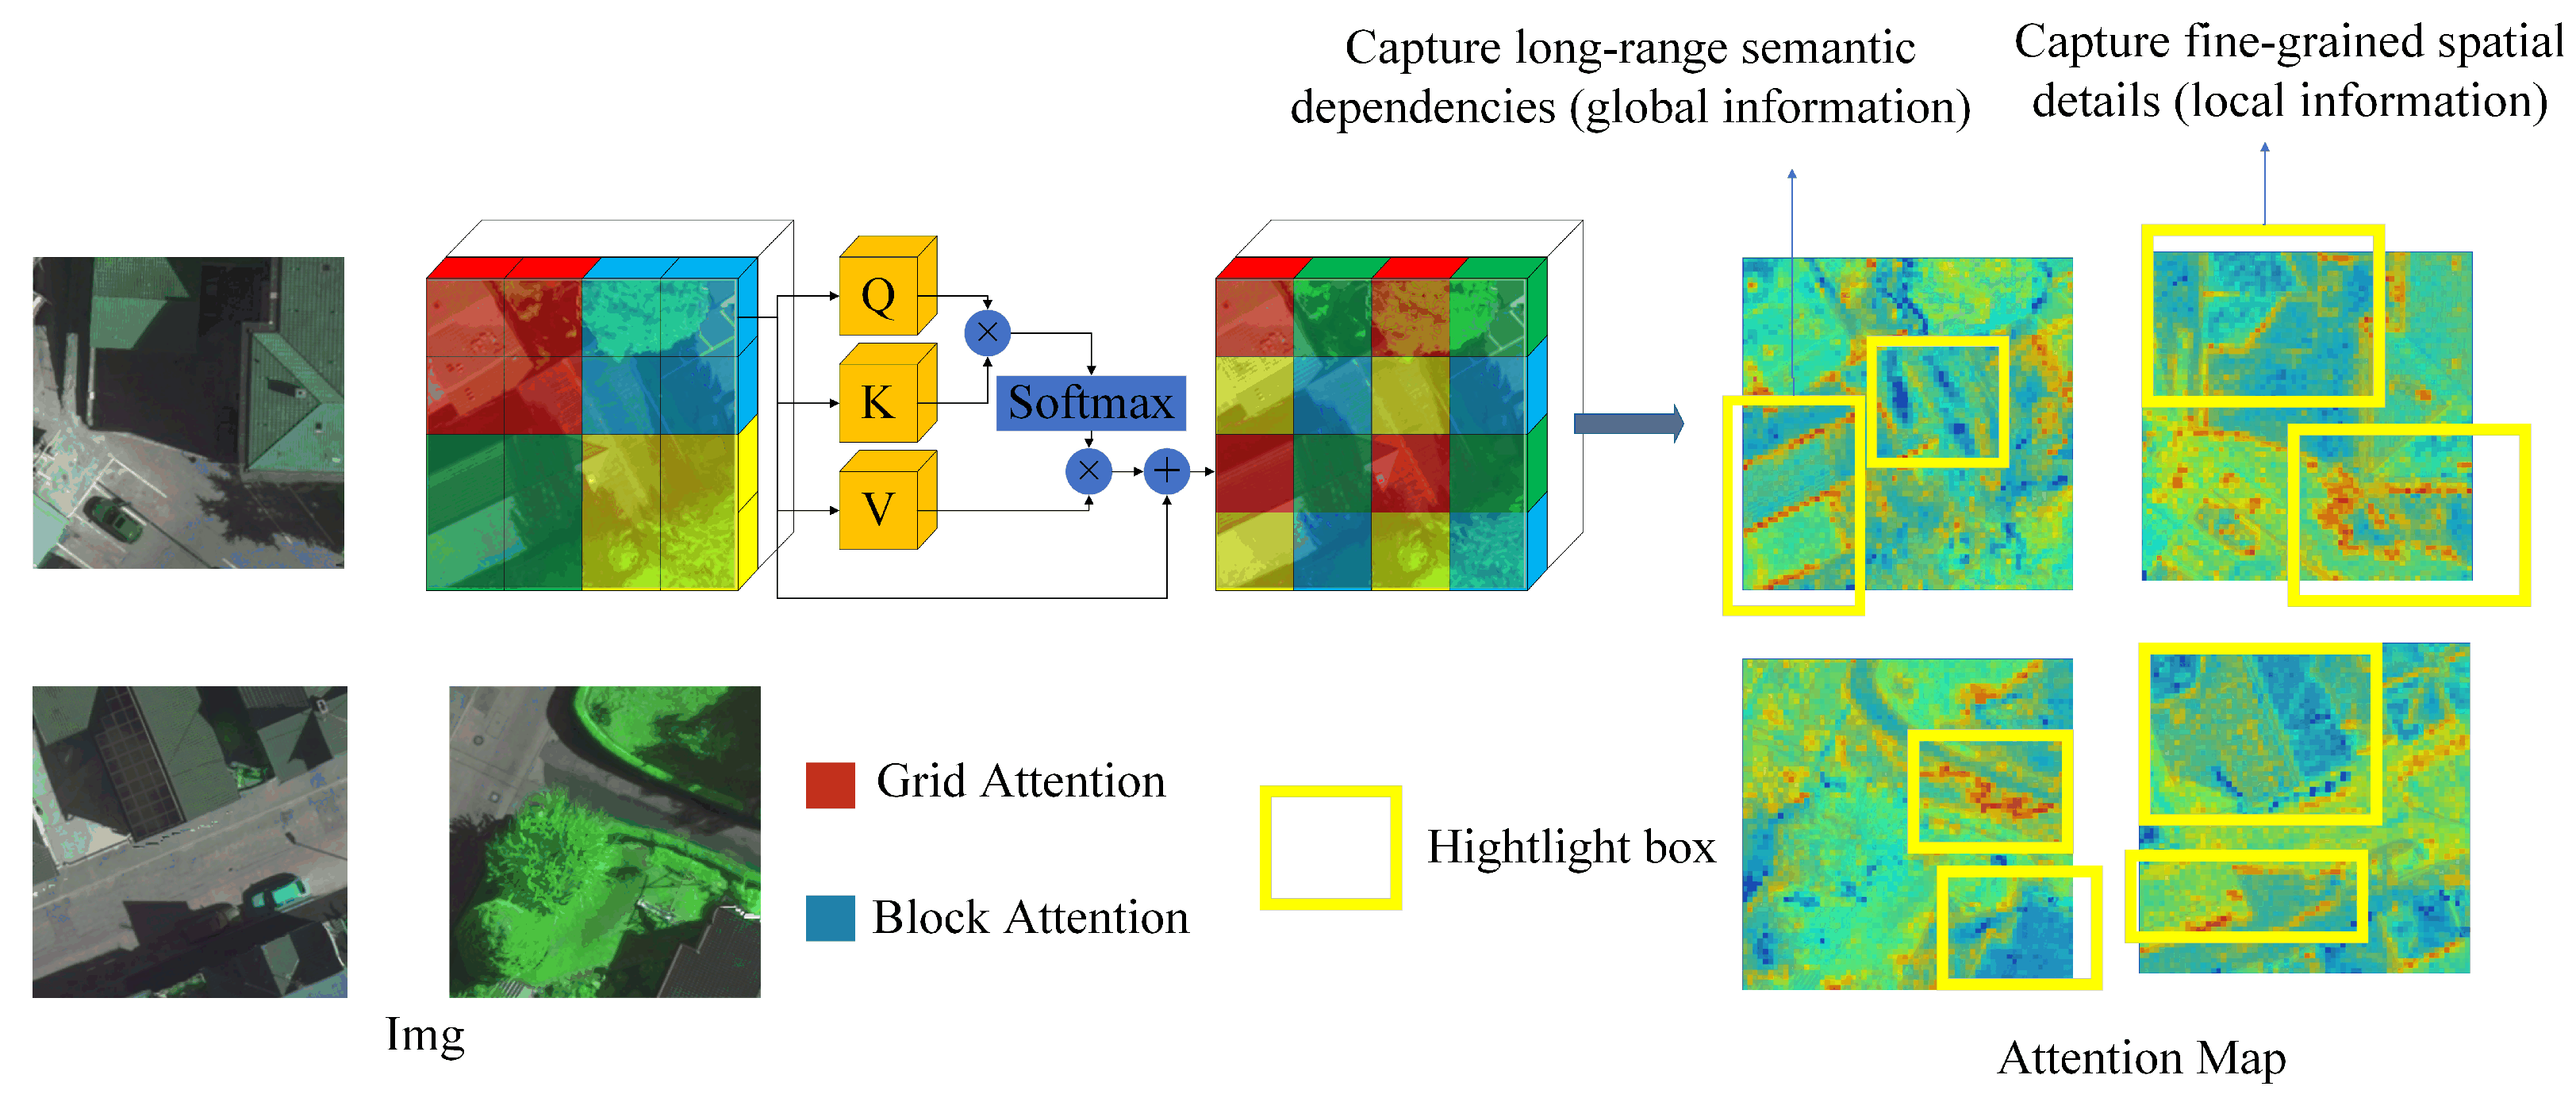
To effectively extract hierarchical and multi-scale representations from high-resolution remote sensing imagery, DMA-Net adopts MaxViT as the backbone of its encoder. In 
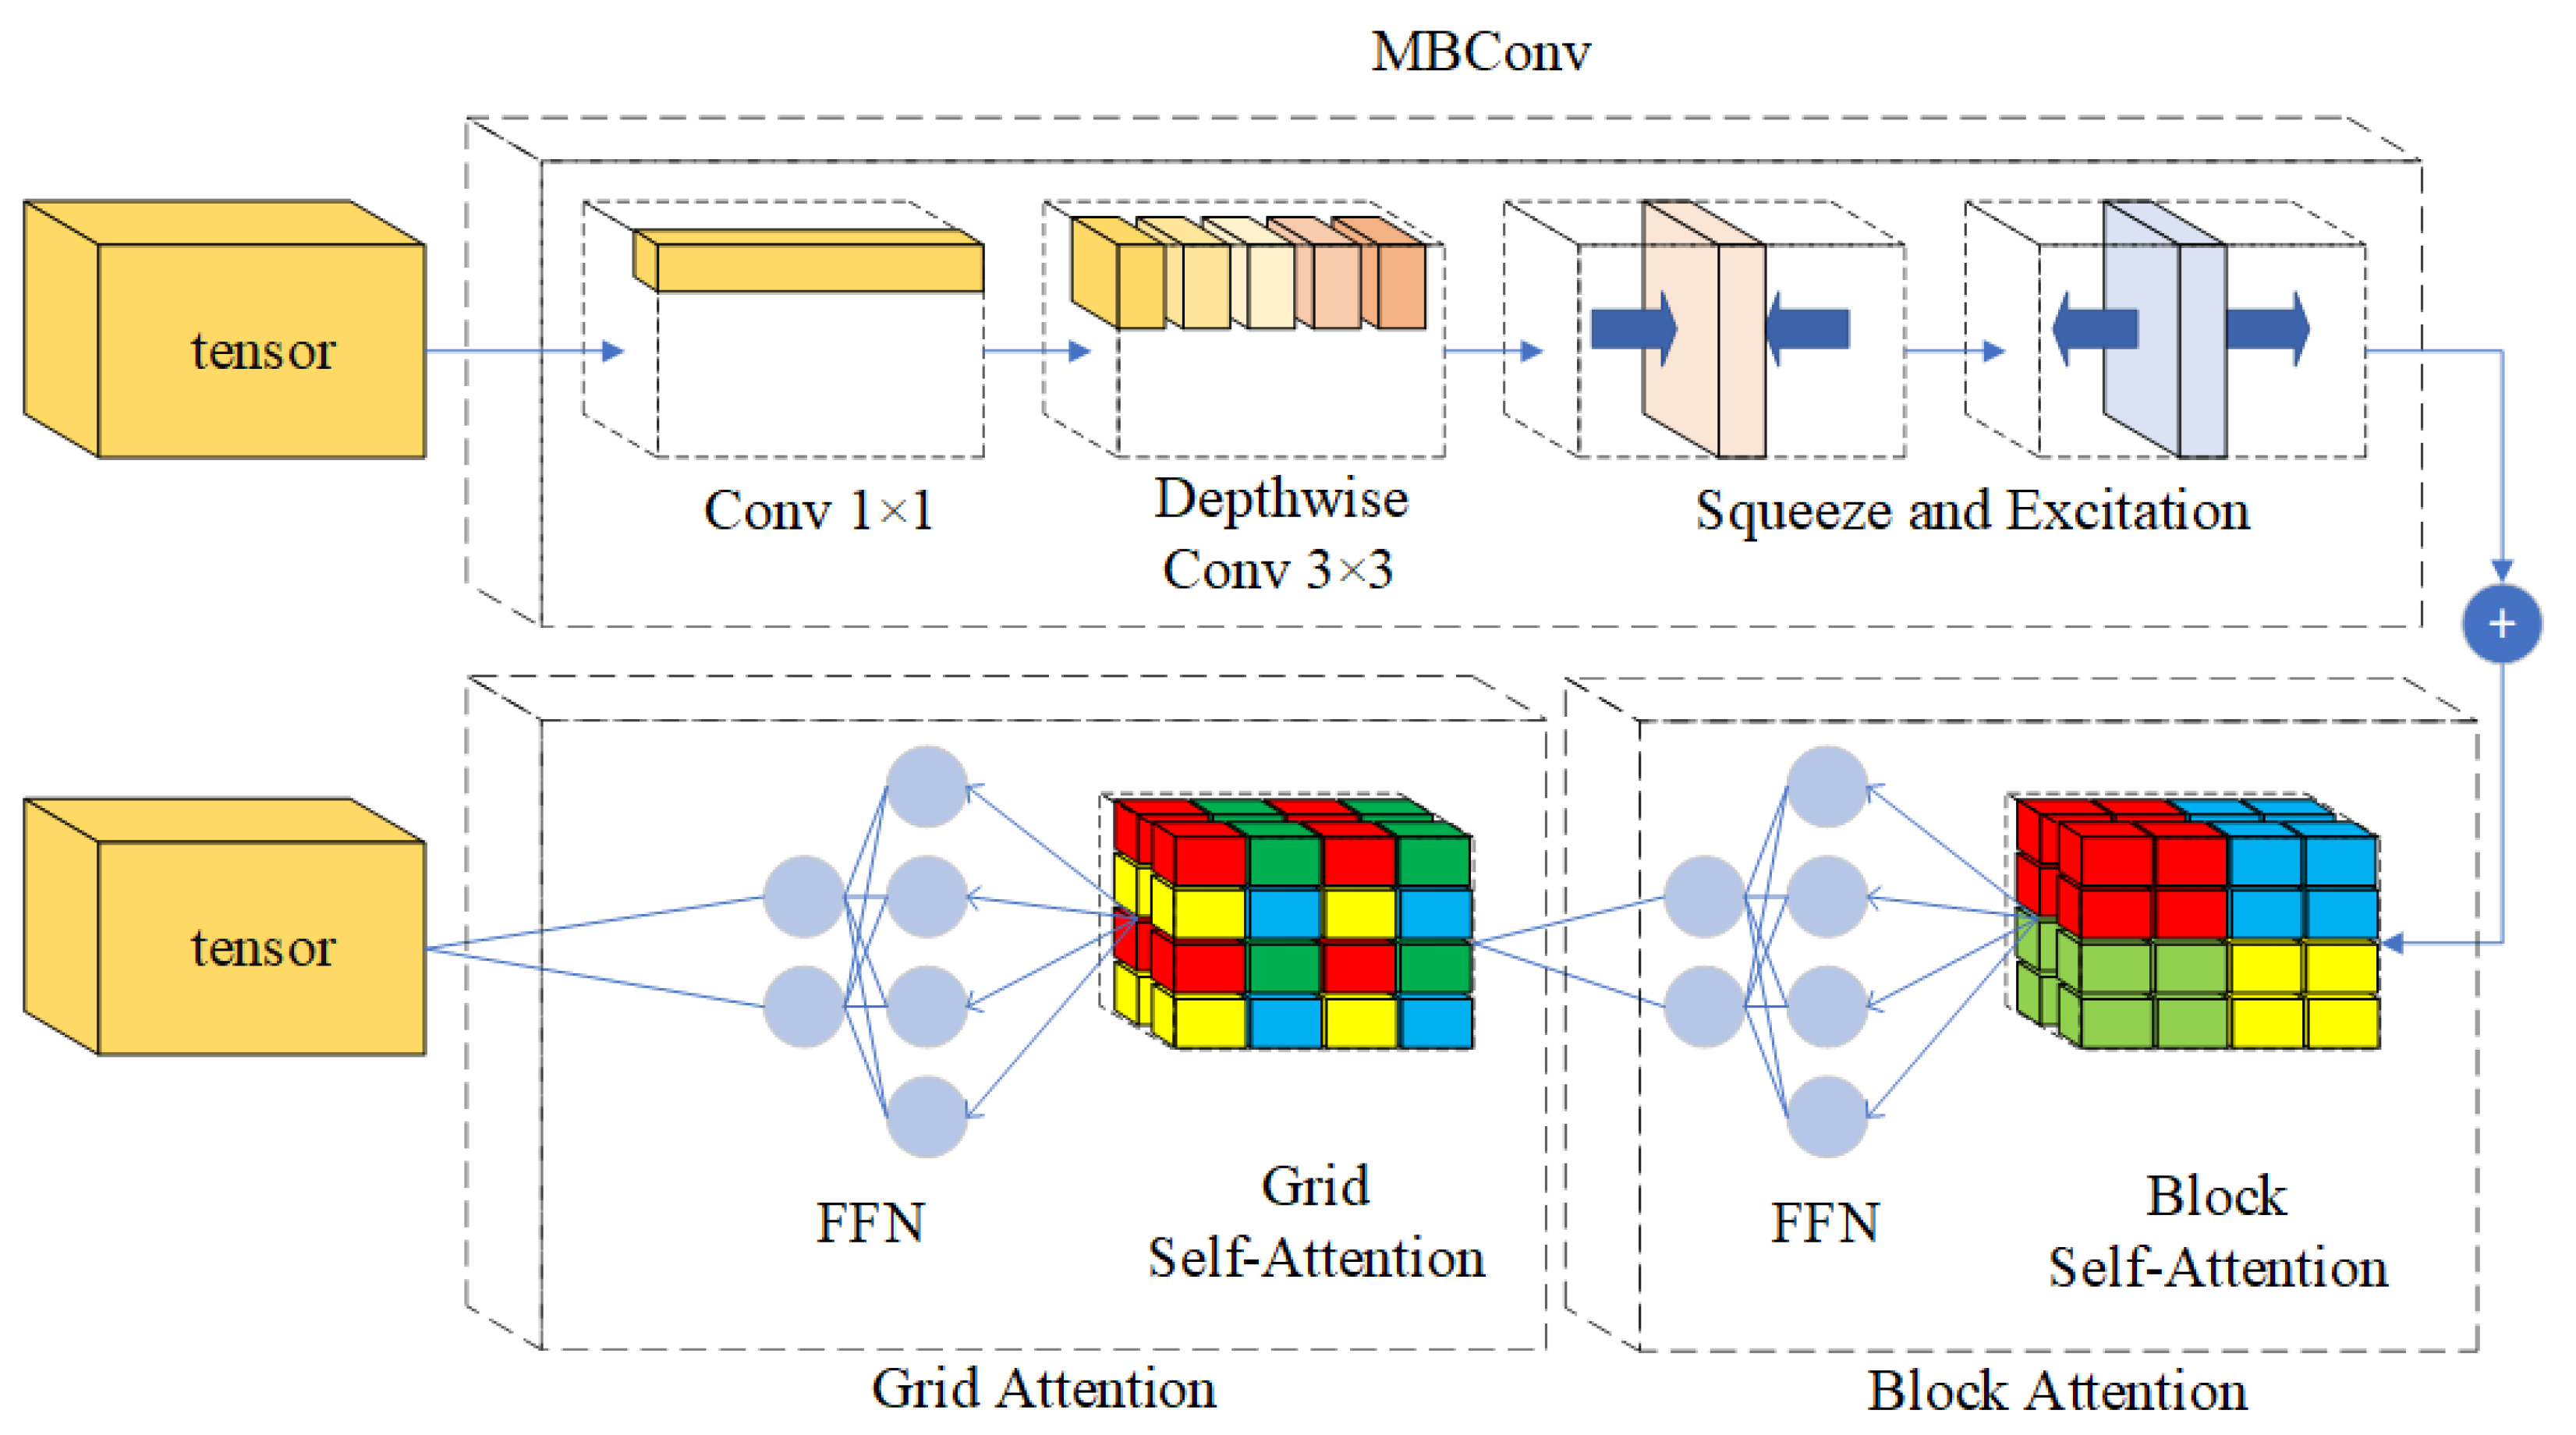
Figure 2, MaxViT introduces a hybrid structure that combines convolutional modules with a multi-axis attention mechanism. Different colors represent the patches covered by the self-attention operation in MaxViT. The alternating use of Grid Attention and Block Attention enables the network to model both fine-grained spatial details and long-range semantic dependencies efficiently. As shown in Figure 3, each encoder stage contains a Mobile Inverted Bottleneck Convolution (MBConv) module followed by a MaxViT encoder block composed of Block Attention and Grid Attention.
The internal transformation at each encoder stage is formulated as follows:
X i + 1 ( 1 ) = W i ( 1 ) · X i ( 0 ) + b i ( 1 ) X i ( 2 ) = H i · σ W i ( 2 ) · X i ( 1 ) + b i ( 2 ) F i = f i X i 2 + X i + 1 ( 1 )
Here, X i ( 0 ) denotes the input feature maps for stage i; W i ( 1 ) , W i ( 2 ) , b i ( 1 ) , and b i ( 2 ) are learnable projection parameters; σ is the activation function; H i reflects spatial transformation within attention; f i is the intermediate transformation or decoding function; and ⊙ denotes element-wise multiplication.
To better adapt MaxViT to remote sensing image segmentation, DMA-Net modifies the default MaxViT encoder design to preserve high spatial resolution in early layers. We have combined the deep supervision training framework with MaxViT, which involves the feature maps output by MaxViT at different stages in the loss calculation. This allows the loss to supervise the learning of both high-level abstract semantic information and low-level detailed texture information in MaxViT, thereby improving its ability to retain edge contours and shape details of small-scale targets. Moreover, features from all four encoding stages are retained and forwarded to the following components, enabling rich multi-level semantic representation and ensuring that both shallow textures and deep semantics are fully leveraged during decoding.
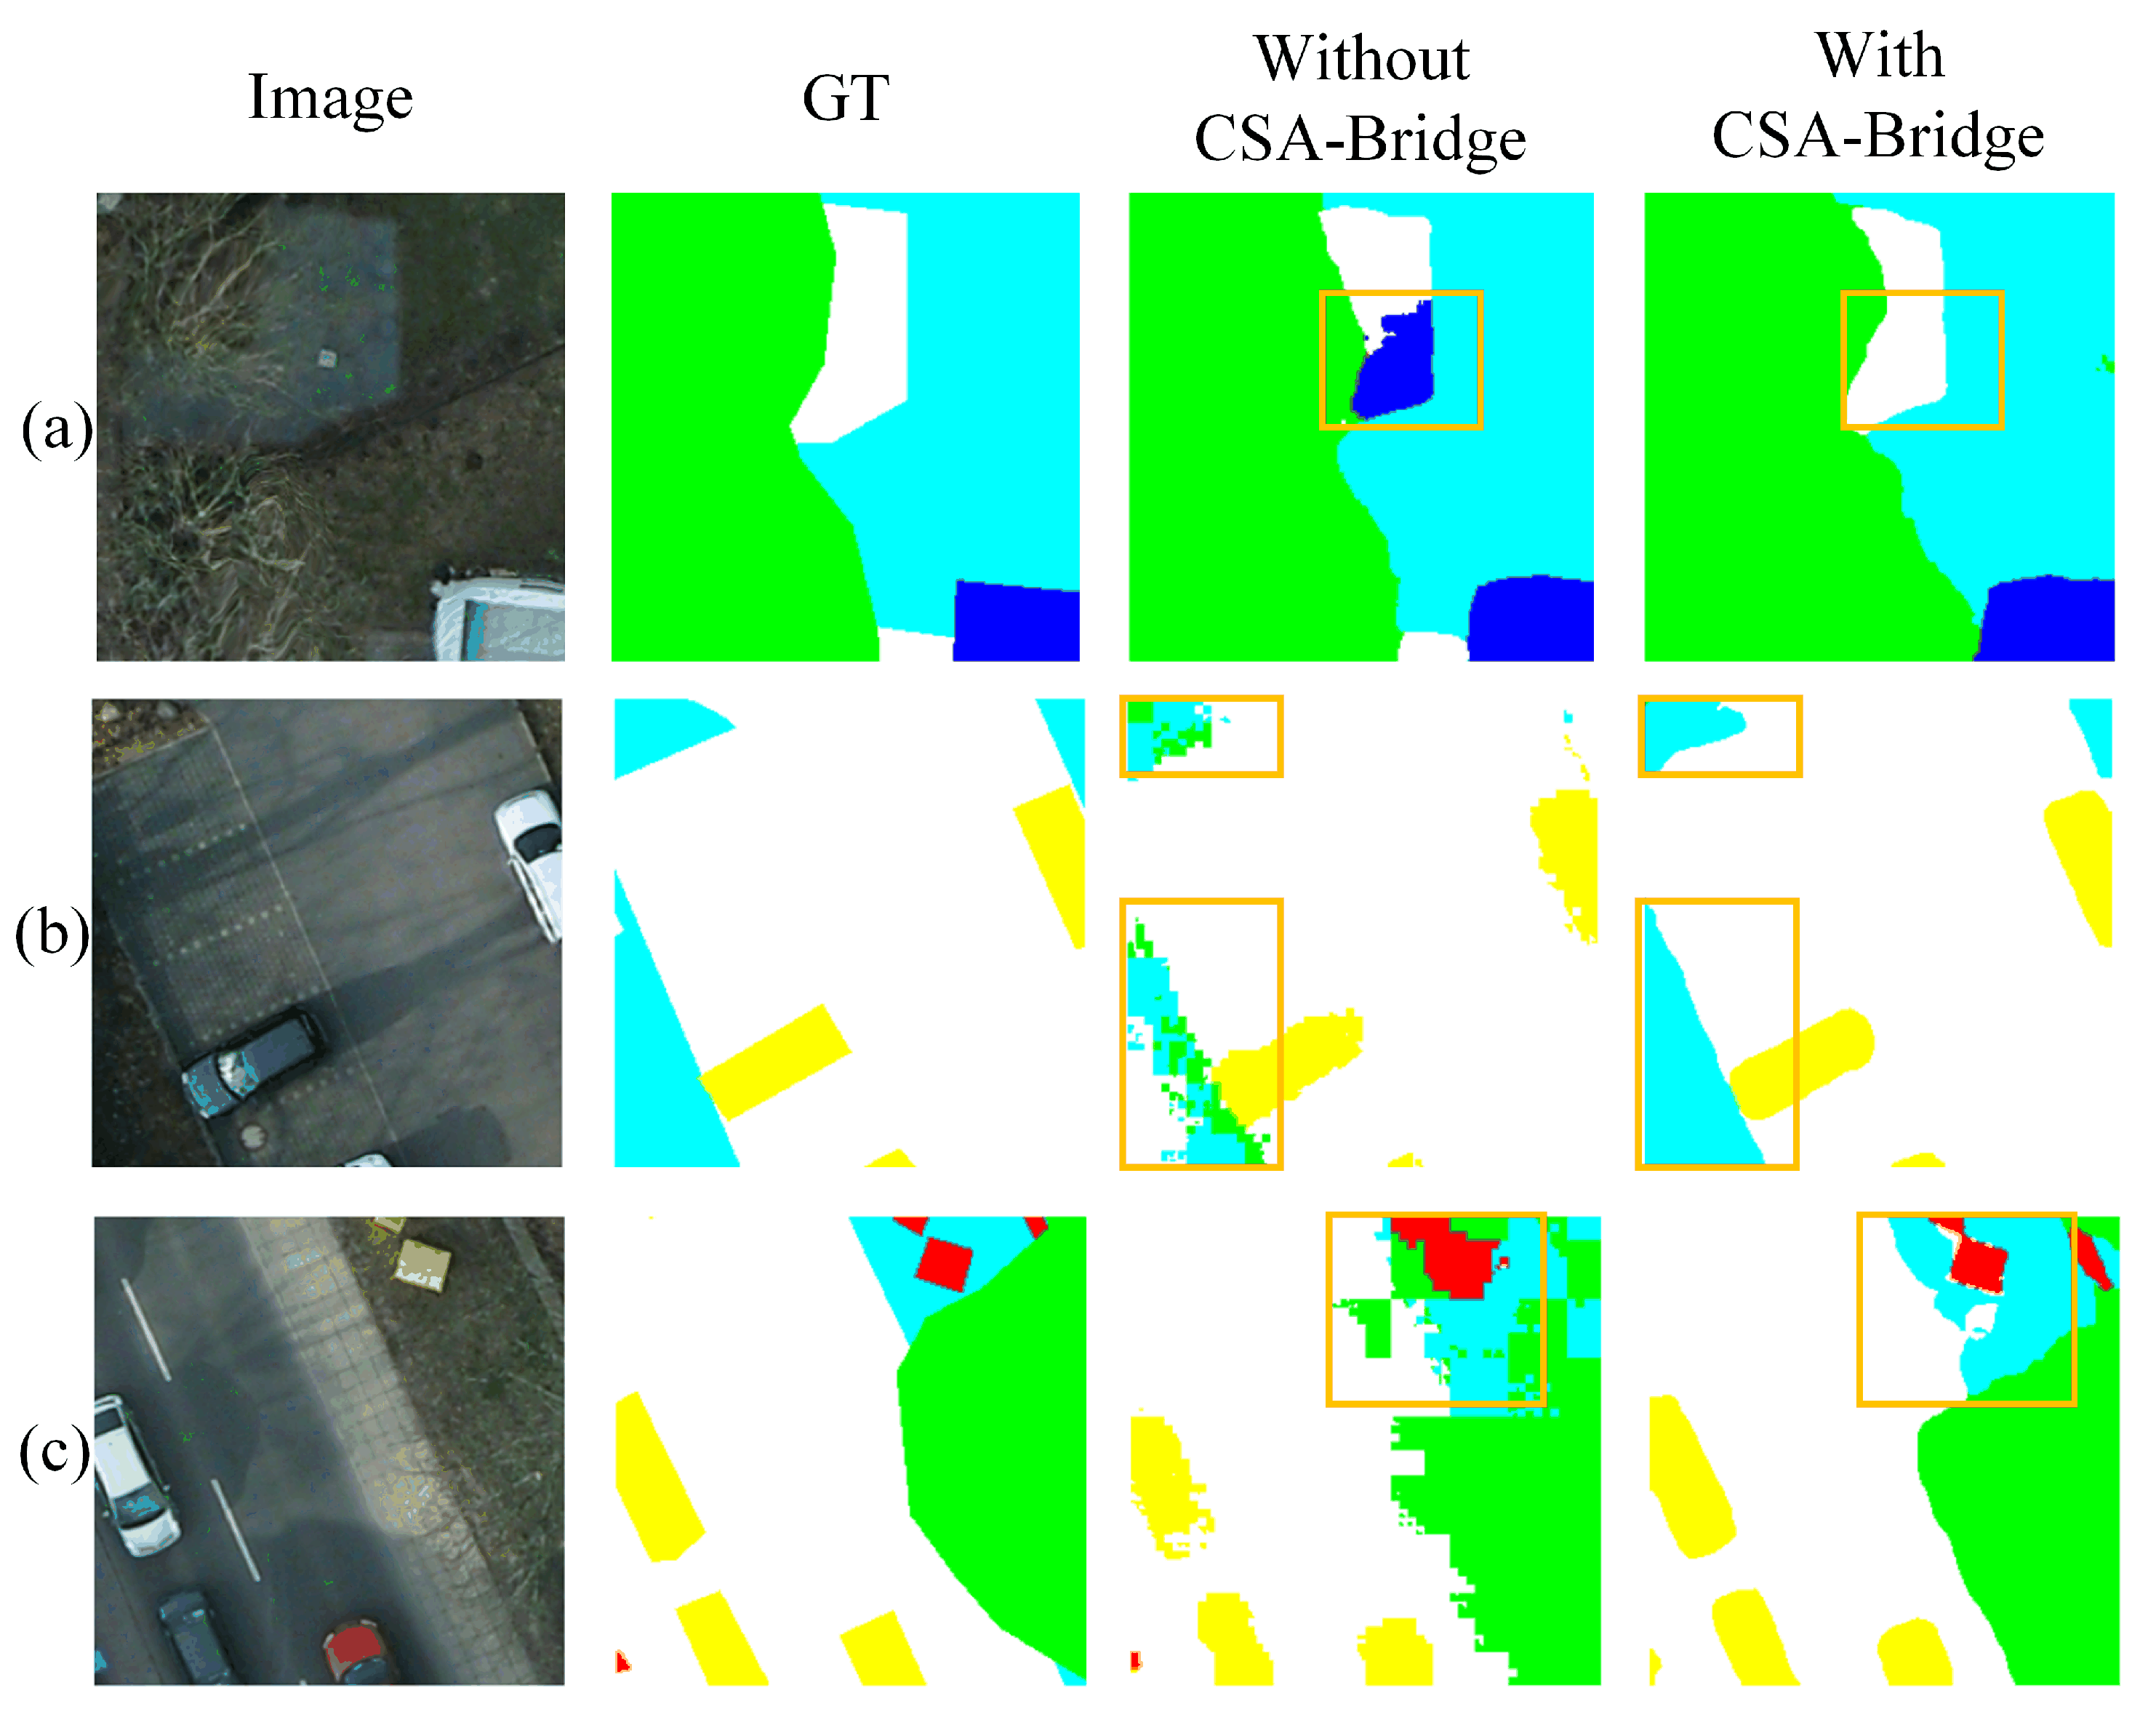
3.3. CSA-Bridge

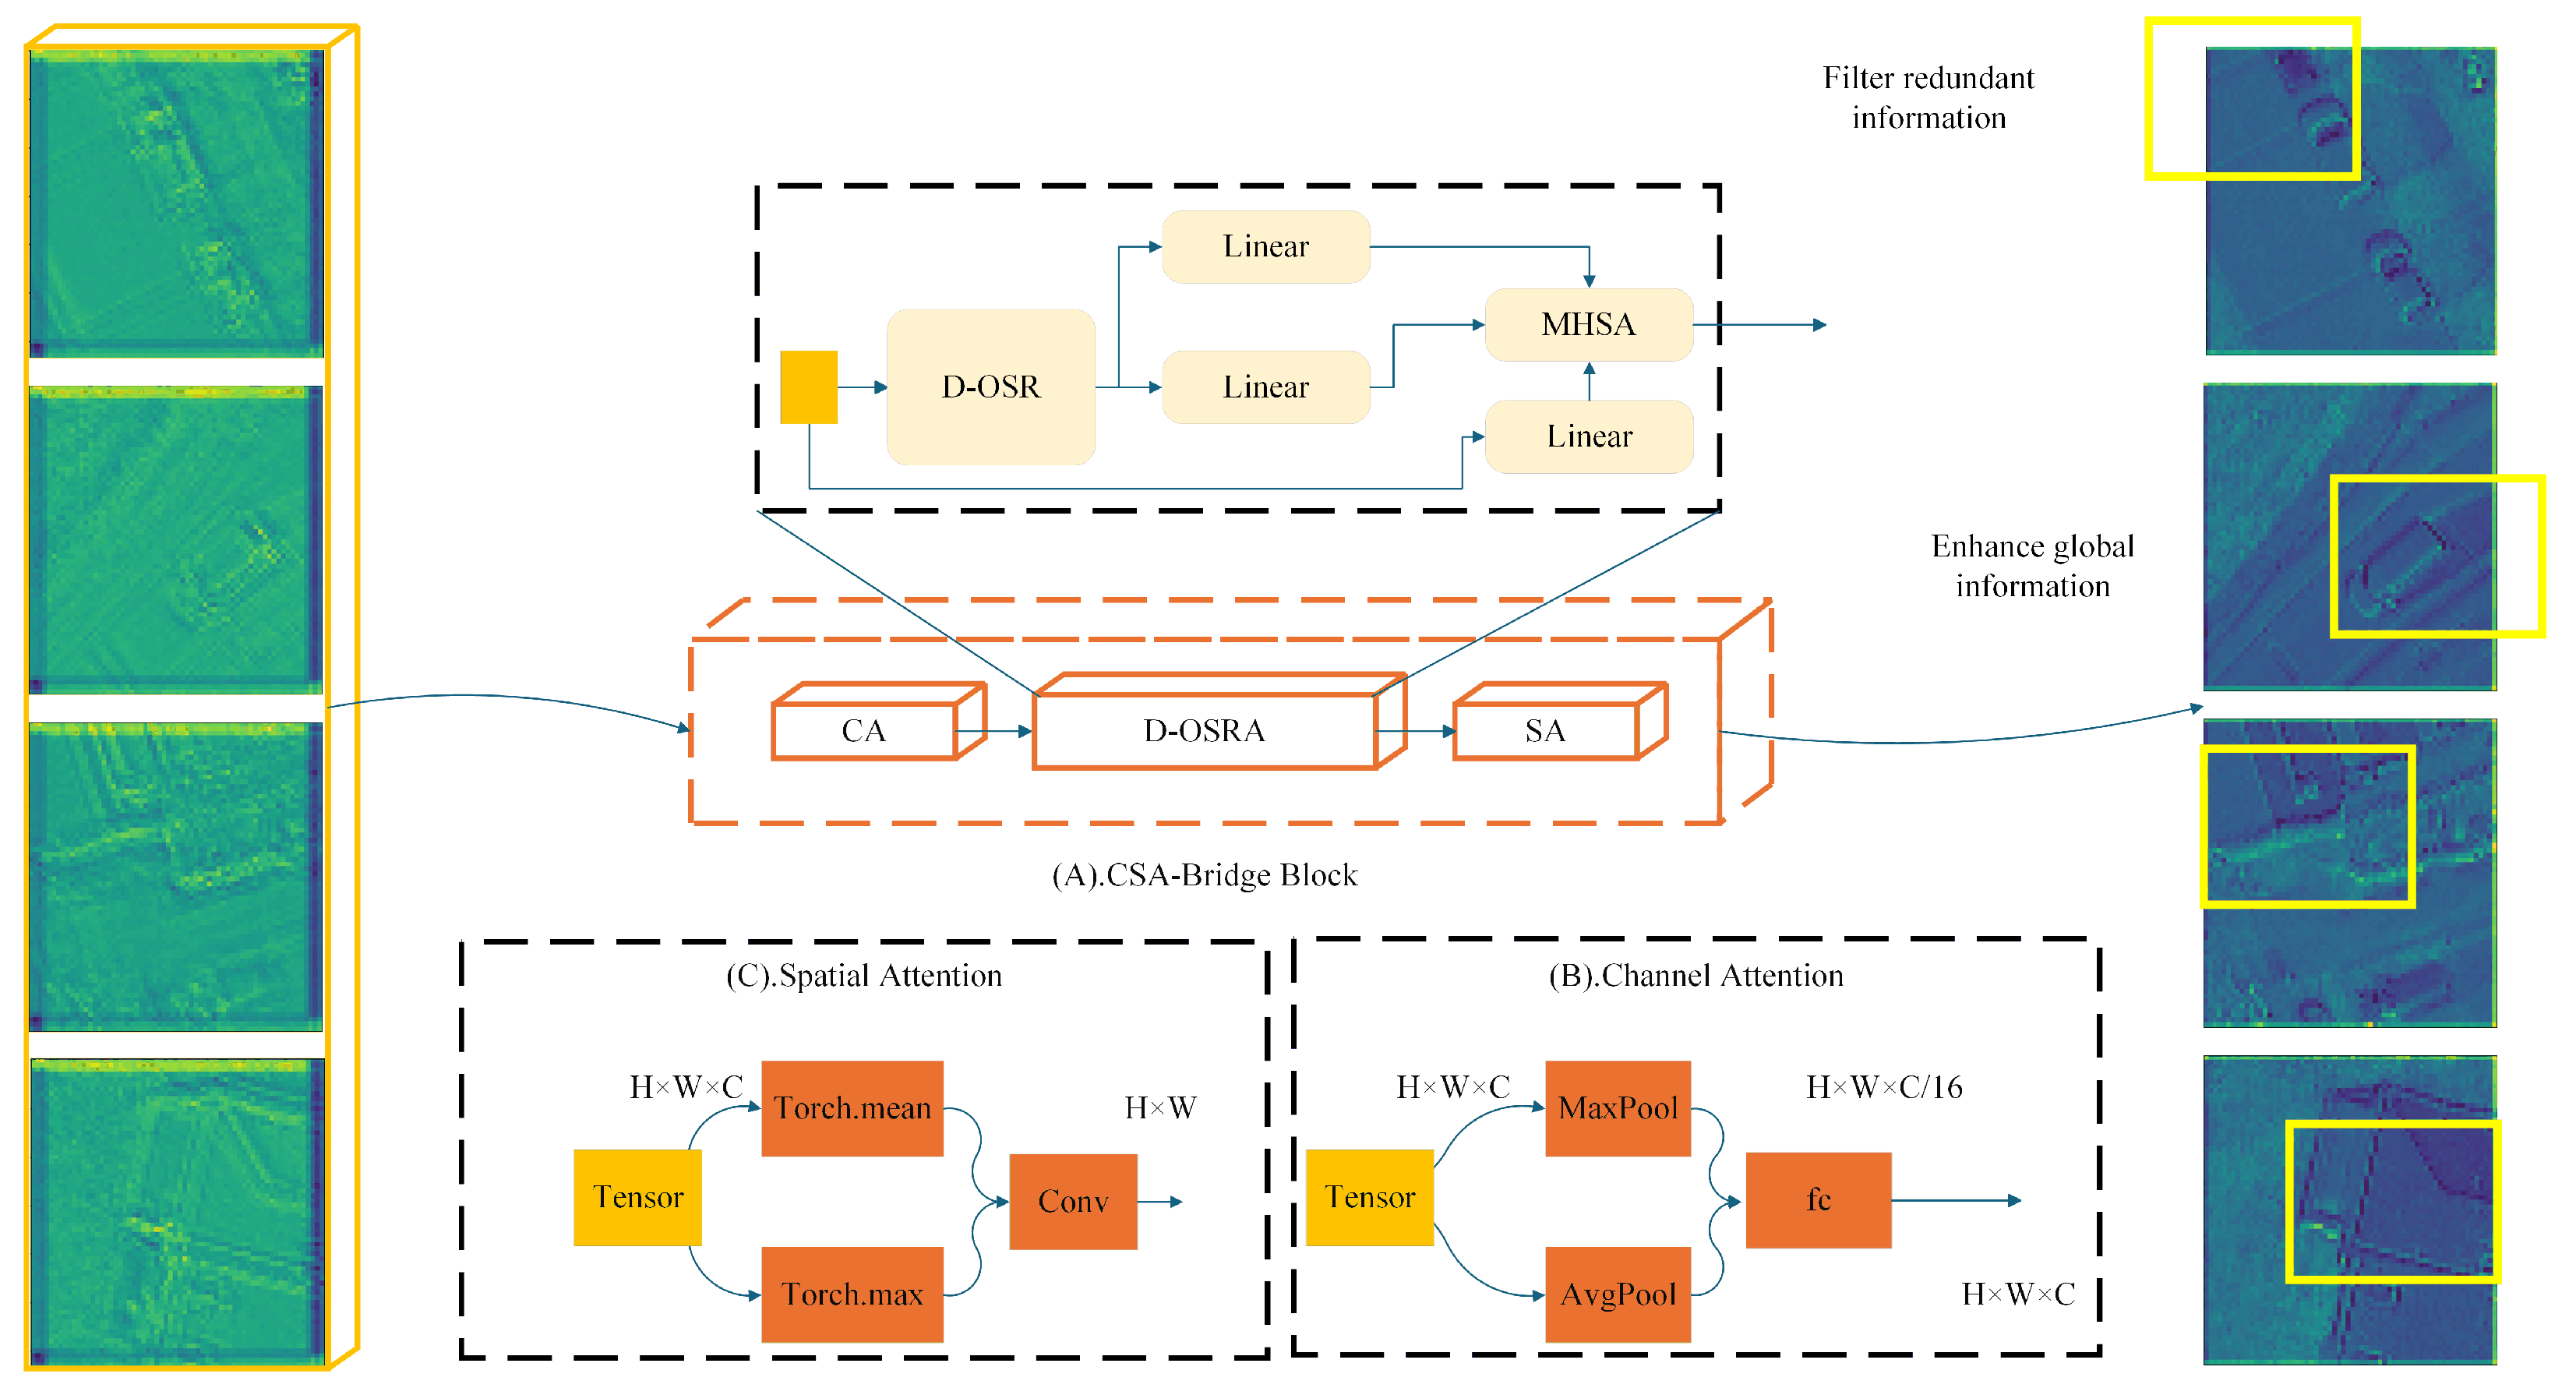
While the encoder effectively captures hierarchical features at multiple scales, directly transmitting these raw feature maps to the decoder may introduce redundant or noisy information that compromises segmentation precision. To bridge the encoder and decoder more effectively, DMA-Net incorporates a Channel-Spatial Attention Bridge (CSA-Bridge) module, which selectively enhances and refines the skip connection features before fusion. The structure and mechanism of CSA-Bridge are detailed as follows.
CSA-Bridge operates on each stage of encoder output and refines feature quality through a sequential attention mechanism. It first applies channel attention to model inter-channel dependencies and emphasize semantically informative feature channels. Then, a Dynamic Overlapping Spatial Reduction Attention (D-OSRA) module compresses spatial redundancy using dynamically adaptive convolutional kernels, effectively retaining structural information. Finally, a spatial attention module enhances salient regions, particularly edges and small objects, ensuring spatial focus in feature refinement. The overall architecture of CSA-Bridge is illustrated in Figure 4.
Given an encoder output feature map F i R H × W × C from stage i, the refined feature produced by CSA-Bridge is computed as follows:
F ^ i = F D O S R A F i + H S A · H C A · F i , i 1 , 4
where F D O S R A is the output of the D-OSRA module, H C A and H S A represent the transformation matrices of the CA and SA modules, respectively, and ⊙ denotes element-wise multiplication. The kernel size used in D-OSRA is dynamically determined as k i = L 32 where L is the side length of the input feature map, enabling adaptive receptive field adjustment based on the spatial scale of the input. By jointly leveraging attention mechanisms in both channel and spatial dimensions, combined with a dynamic receptive field spatial reduction strategy, the CSA-Bridge effectively suppresses redundant information while enhancing discriminative features. This provides the decoder with more representative multi-scale contextual support, thereby improving overall segmentation performance.
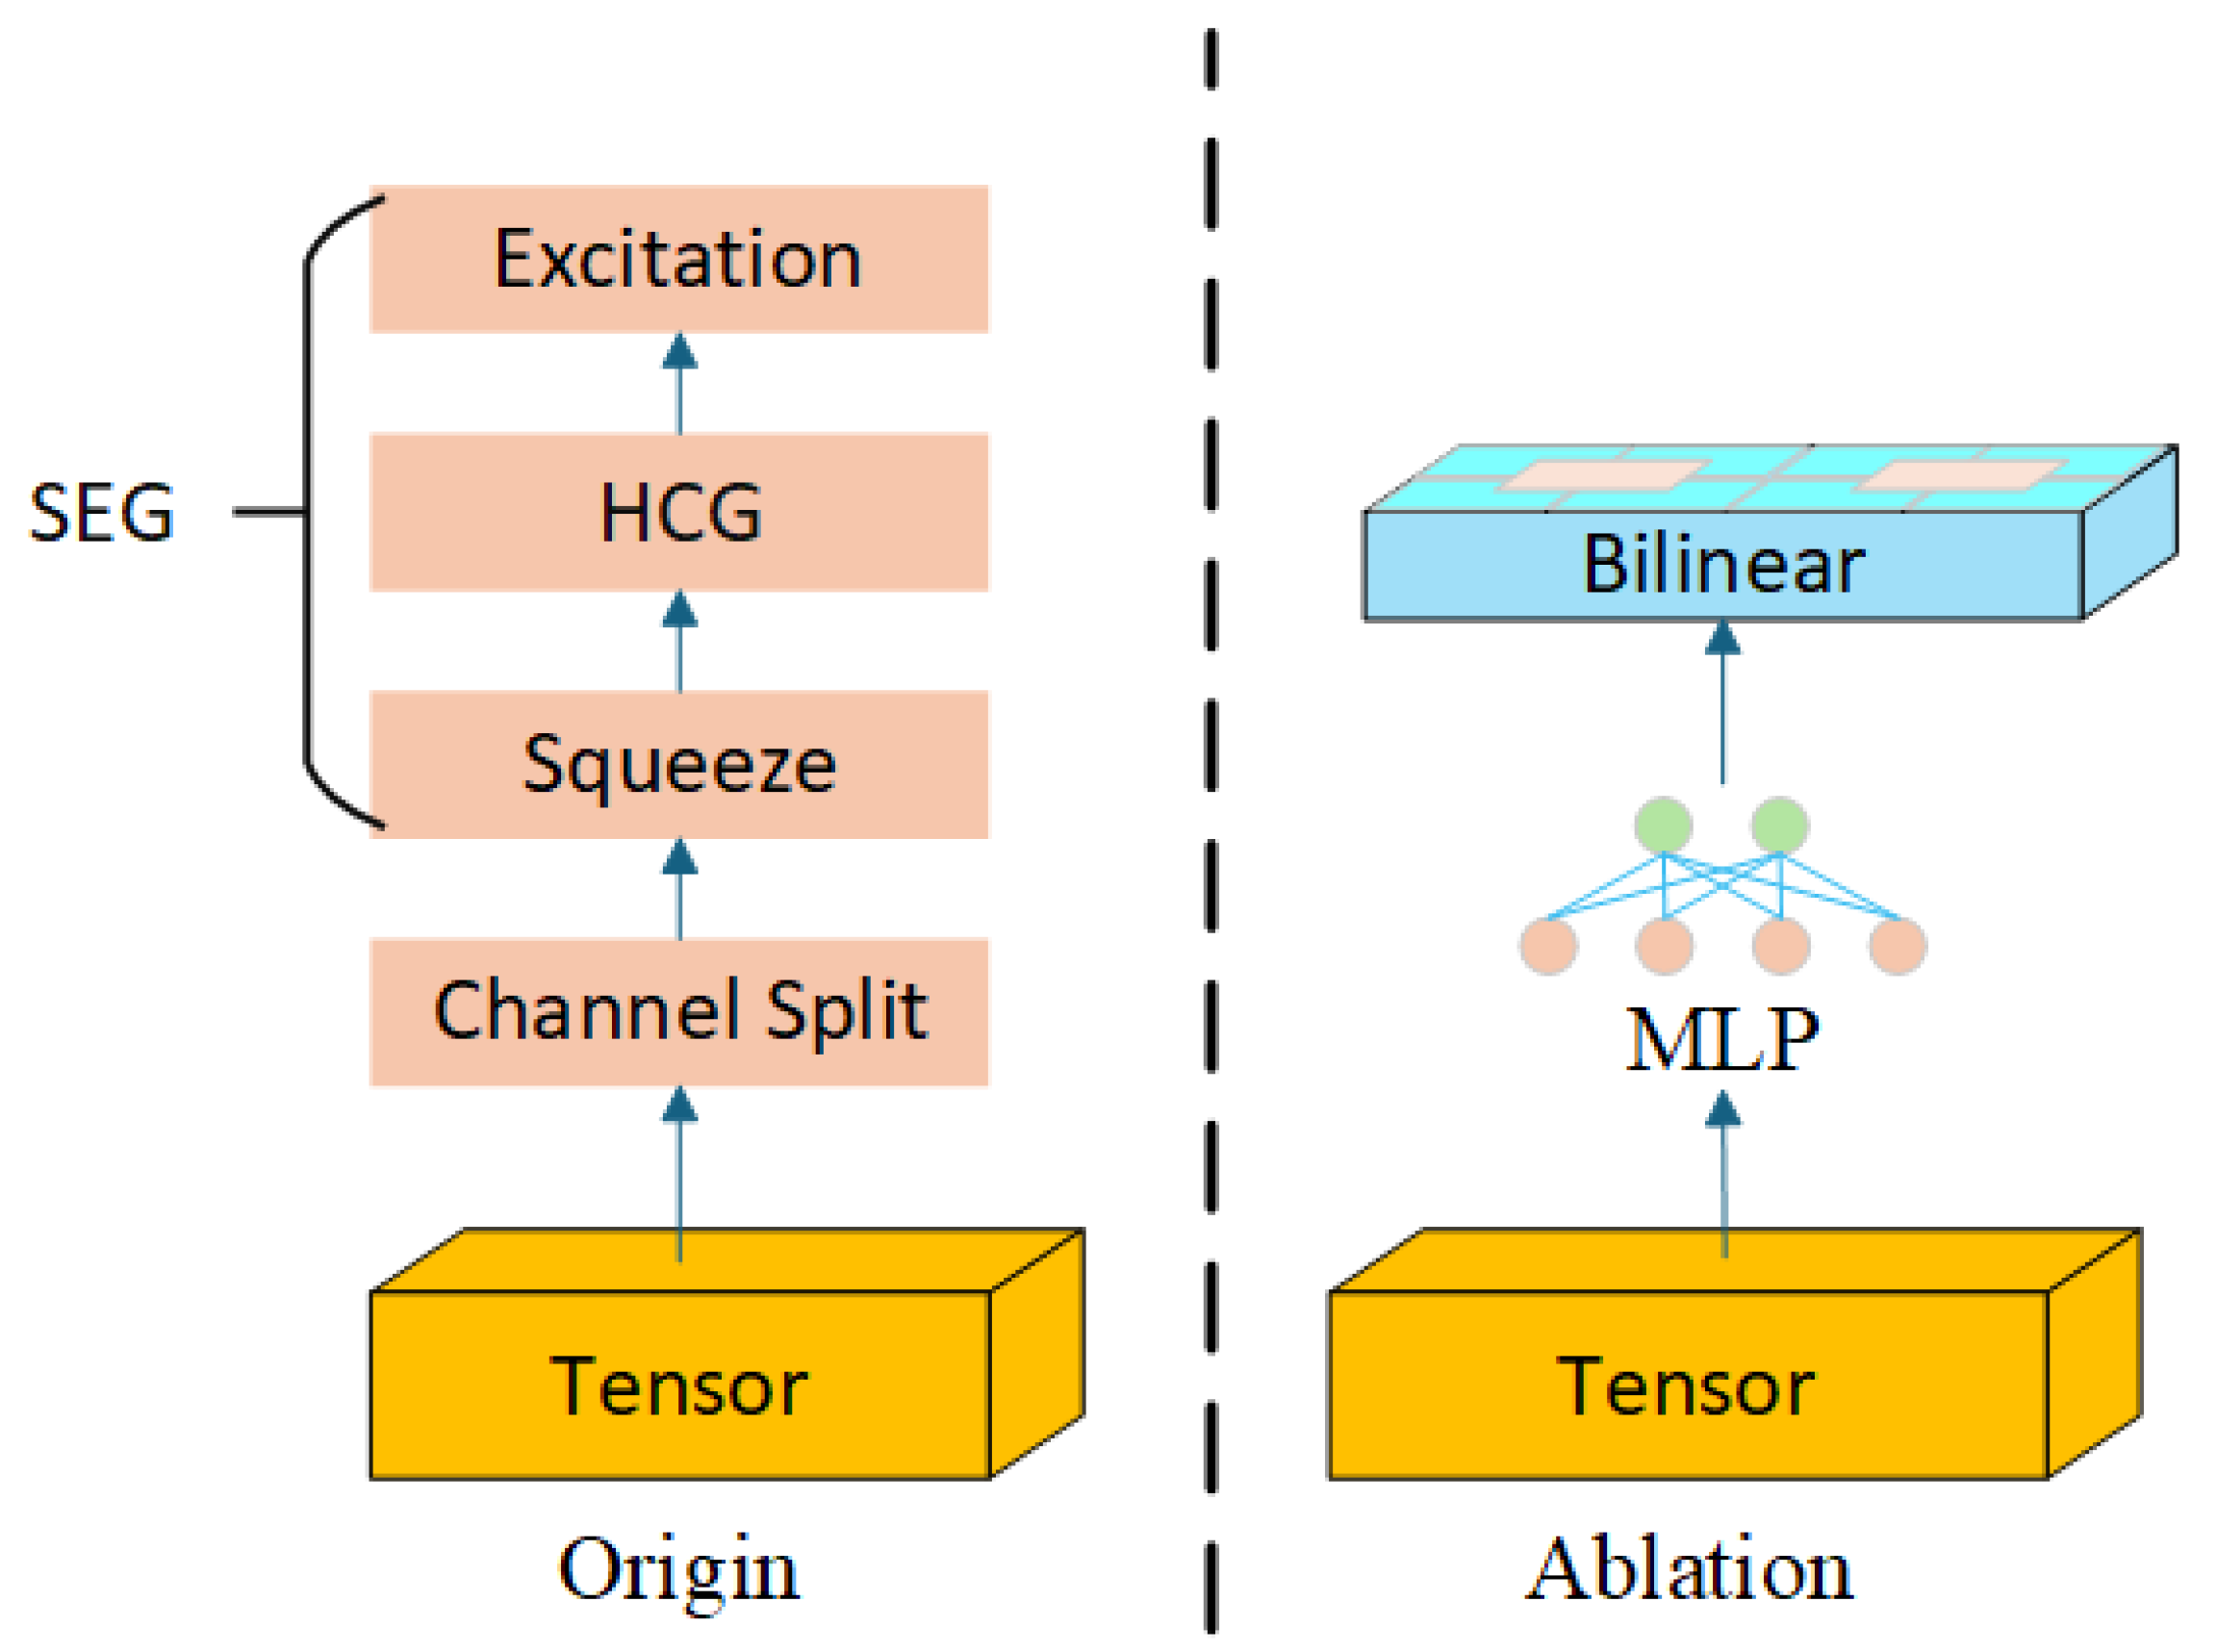
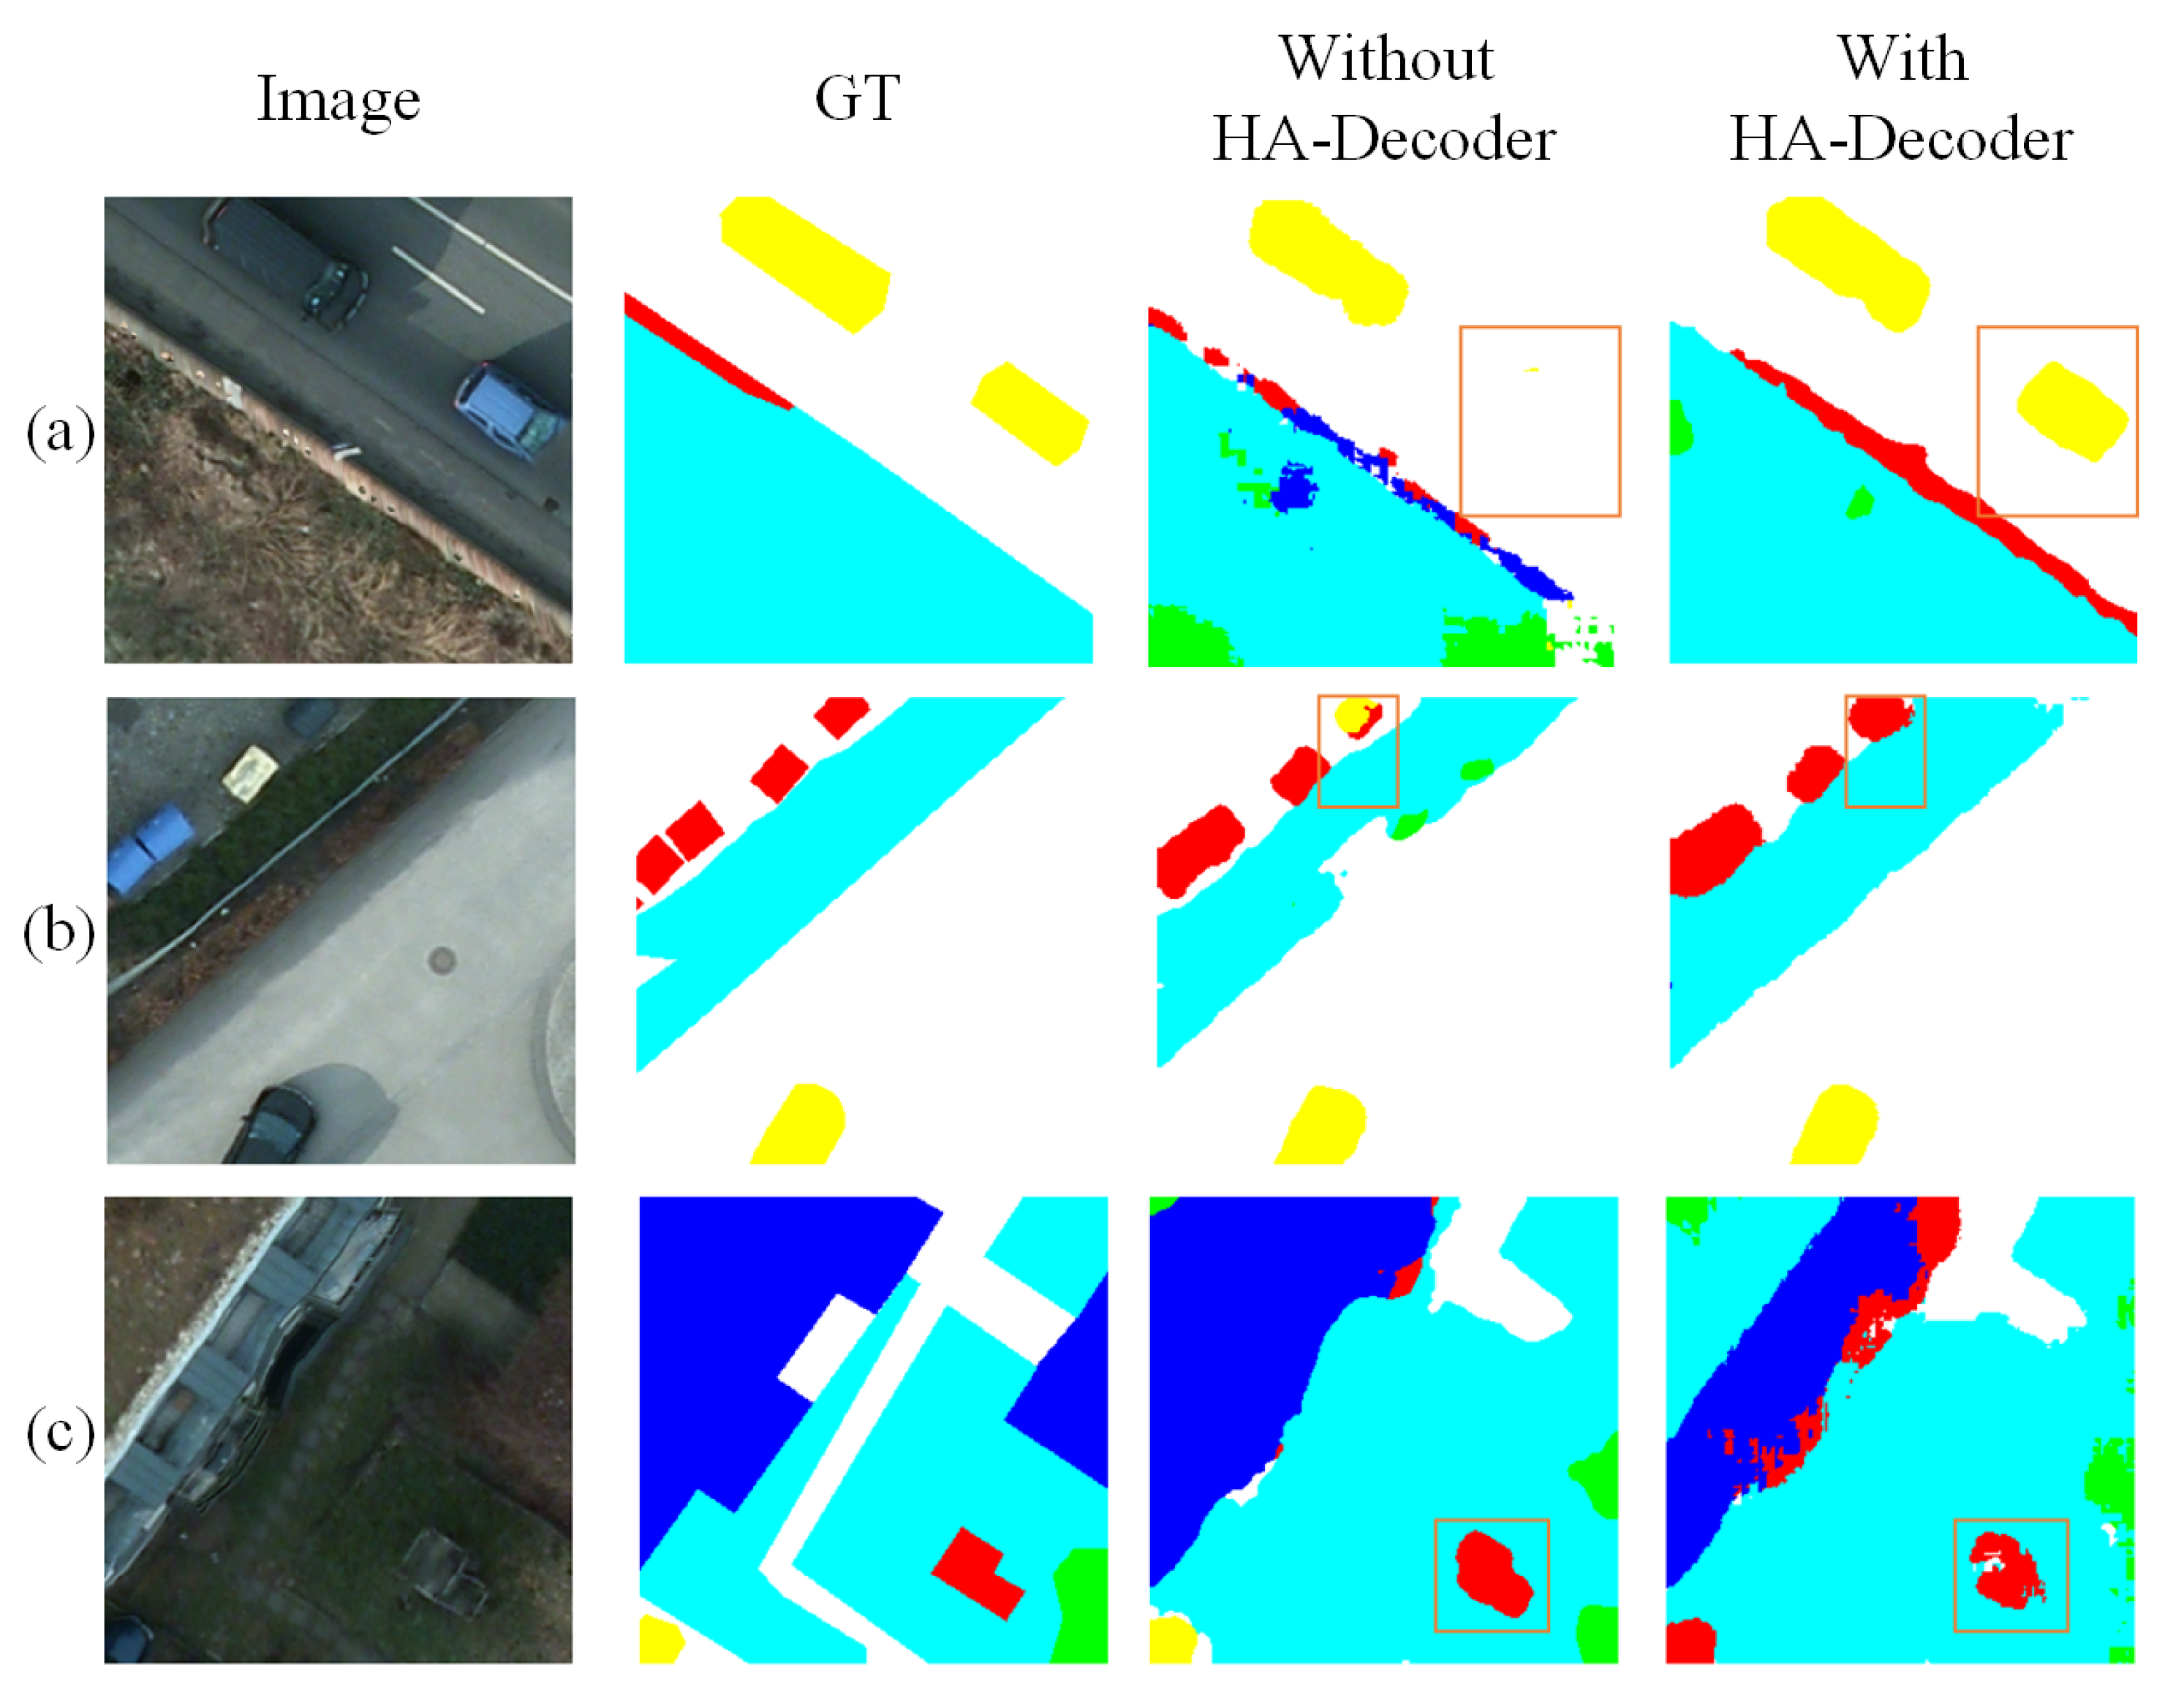
3.4. HA-Decoder

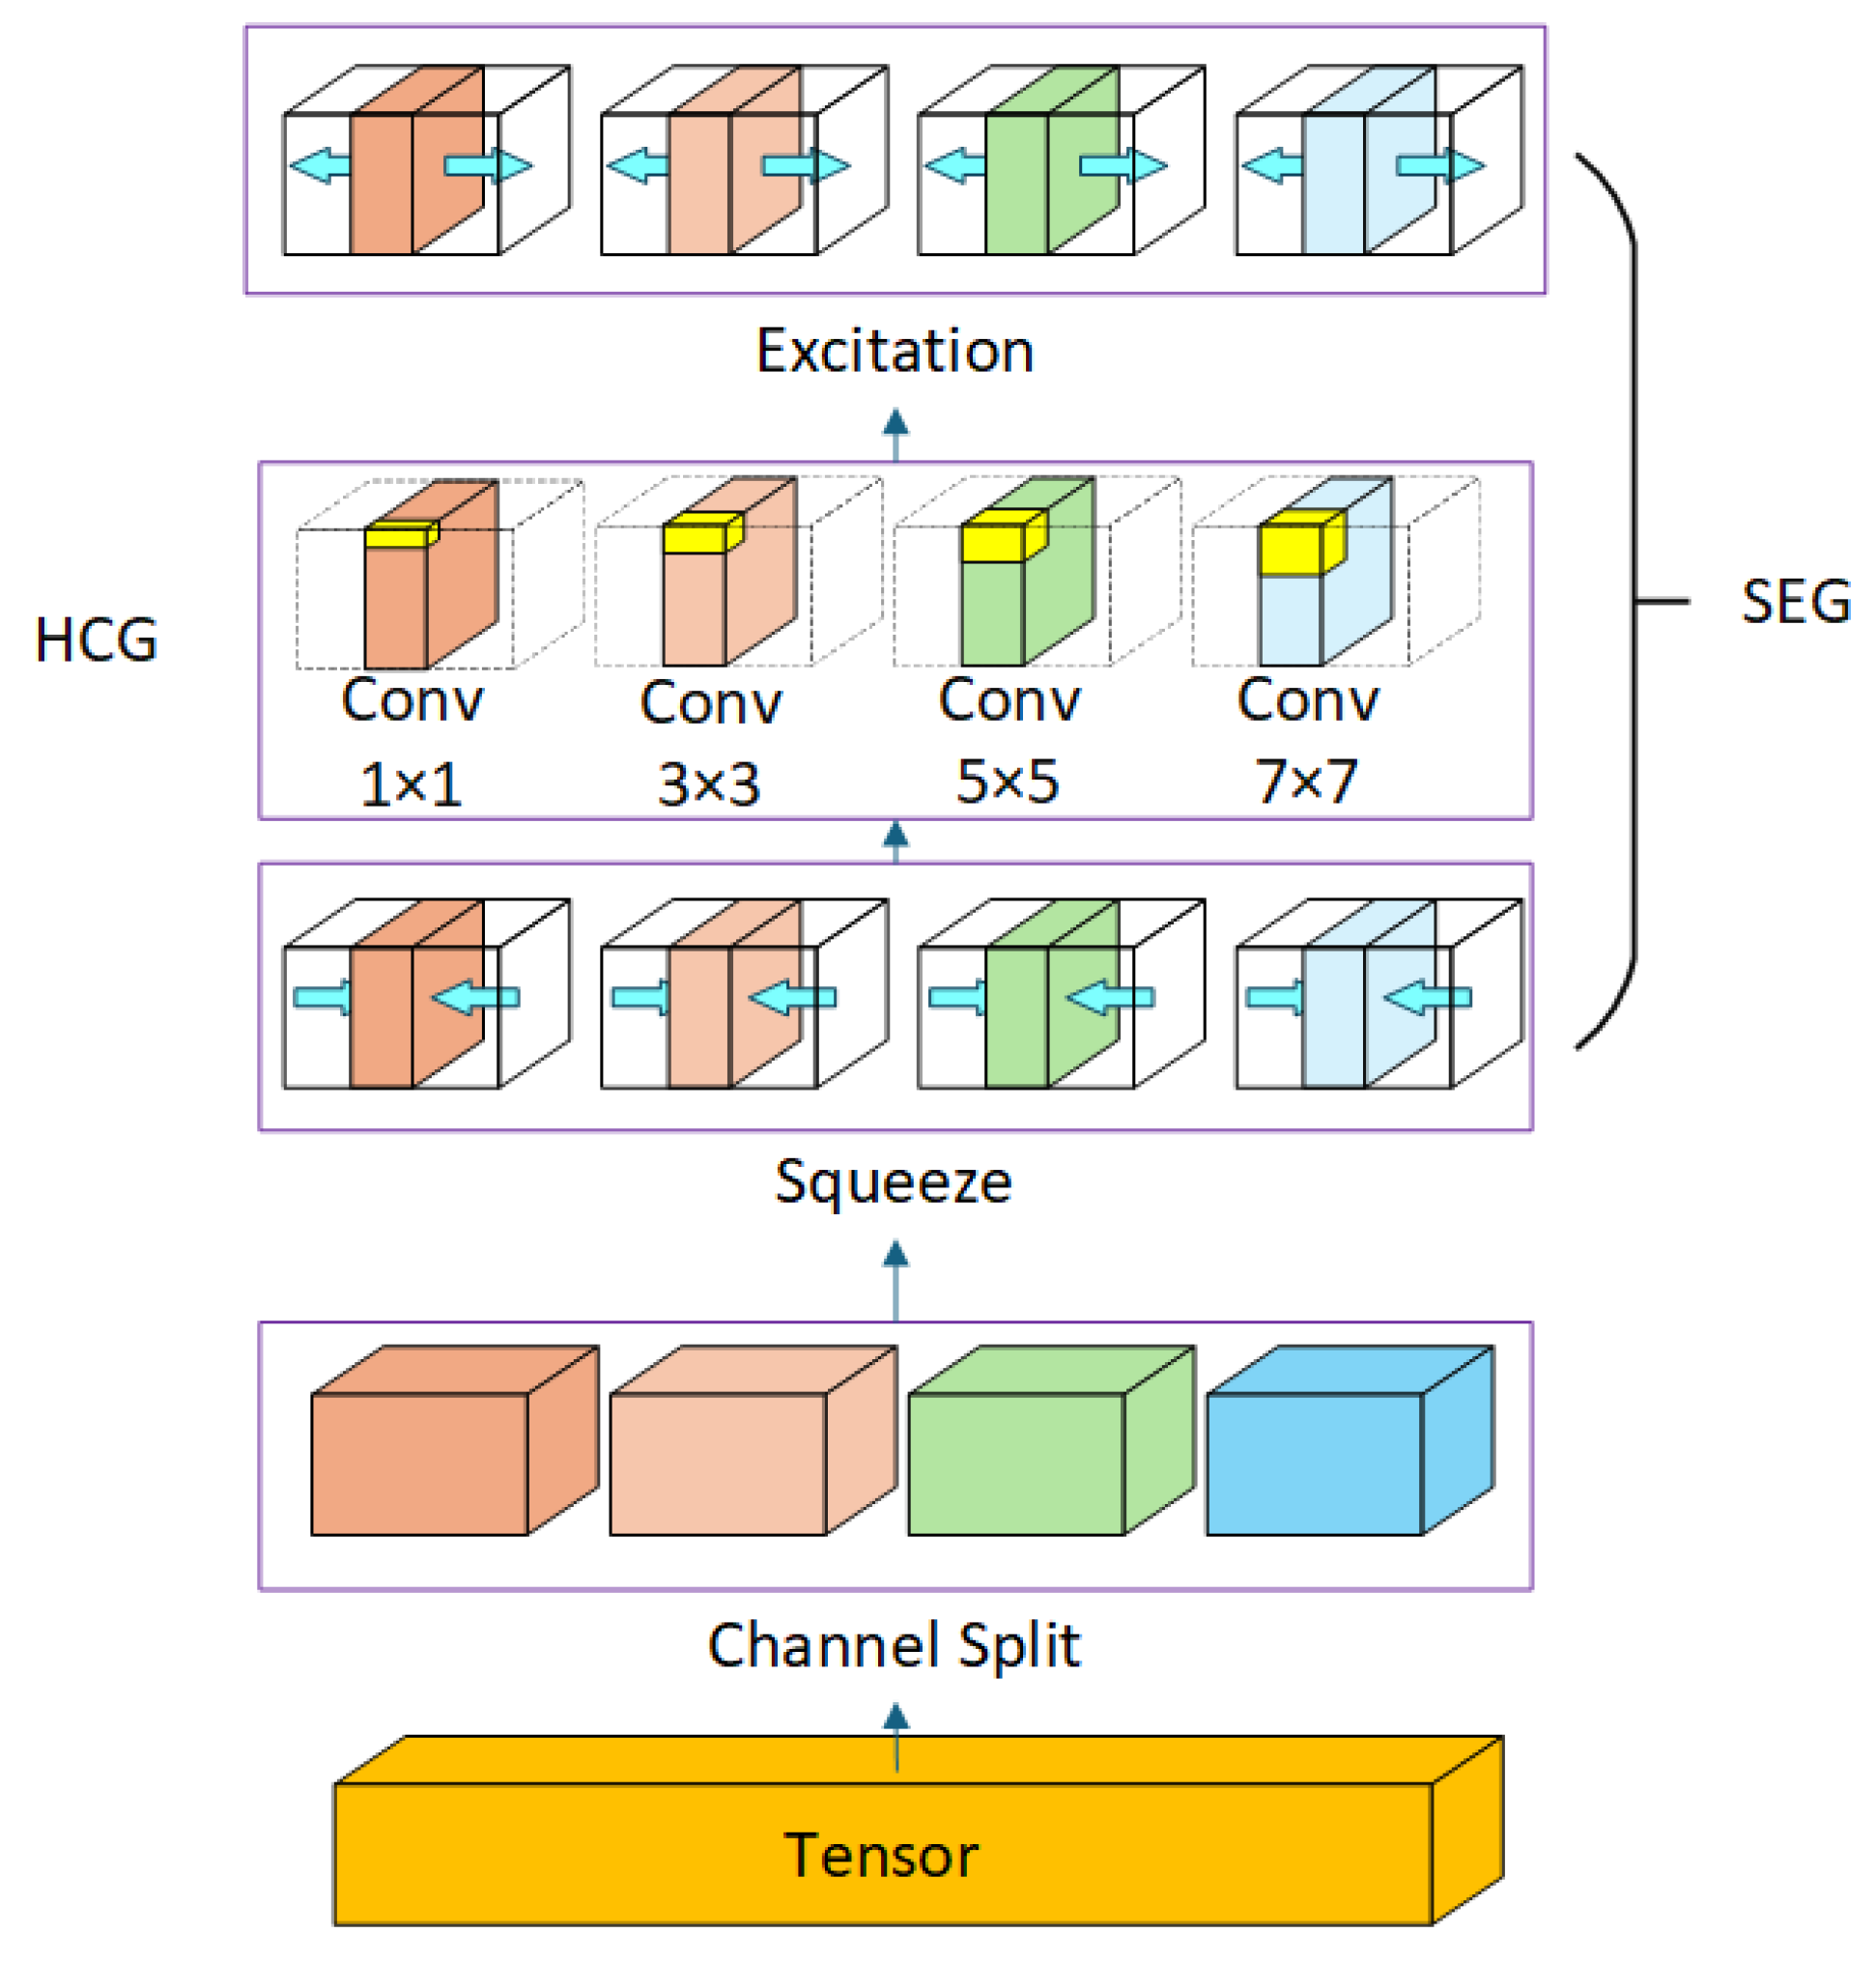
To restore spatial resolution and accurately reconstruct fine structures such as object boundaries and small targets, DMA-Net employs a lightweight, yet expressive decoding module named the Hierarchical Attention Decoder (HA-Decoder). Unlike conventional decoders that stack basic upsampling layers, the HA-Decoder introduces a structured decoding unit that integrates multi-scale convolution and nested attention operations in a hierarchical fashion. The internal structure of the decoder is illustrated in Figure 5.
Each decoding stage in the HA-Decoder is aligned with its corresponding encoder stage and receives refined skip features F ^ i from the CSA-Bridge. The core component of the HA-Decoder is the Hierarchical Convolutional Group (HCG) module, which performs multi-scale feature enhancement in two steps: channel grouping and nested attention-based modulation. Given an input feature map F ^ i H × W × C , we first partition it into G channel groups F ^ i g g = 1 G , where in each sub-feature map, F ^ i g H × W × C G . These sub-groups are processed in parallel using convolutional kernels of different receptive fields:
F ^ i g , c o n v = C o n v k g F ^ i g , k g { 7 , 5 , 3 , 1 }
The multi-scale convolved features are then concatenated and passed through a nested Squeeze-and-Excitation Group (SEG) attention block to recalibrate channel-wise responses. This block includes a squeeze transformation H S , an excitation transformation H E , and a residual enhancement layer:
y i = H E W o · H S · F ^ i g , c o n v g = 1 G + b
where W o and b are learnable projection parameters. The output y i serves as the decoded feature map at stage i, which is upsampled and propagated to the next decoding level. This hierarchical decoding structure enables the HA-Decoder to progressively recover spatial resolution while preserving small-object details and boundary integrity, significantly enhancing final segmentation accuracy.

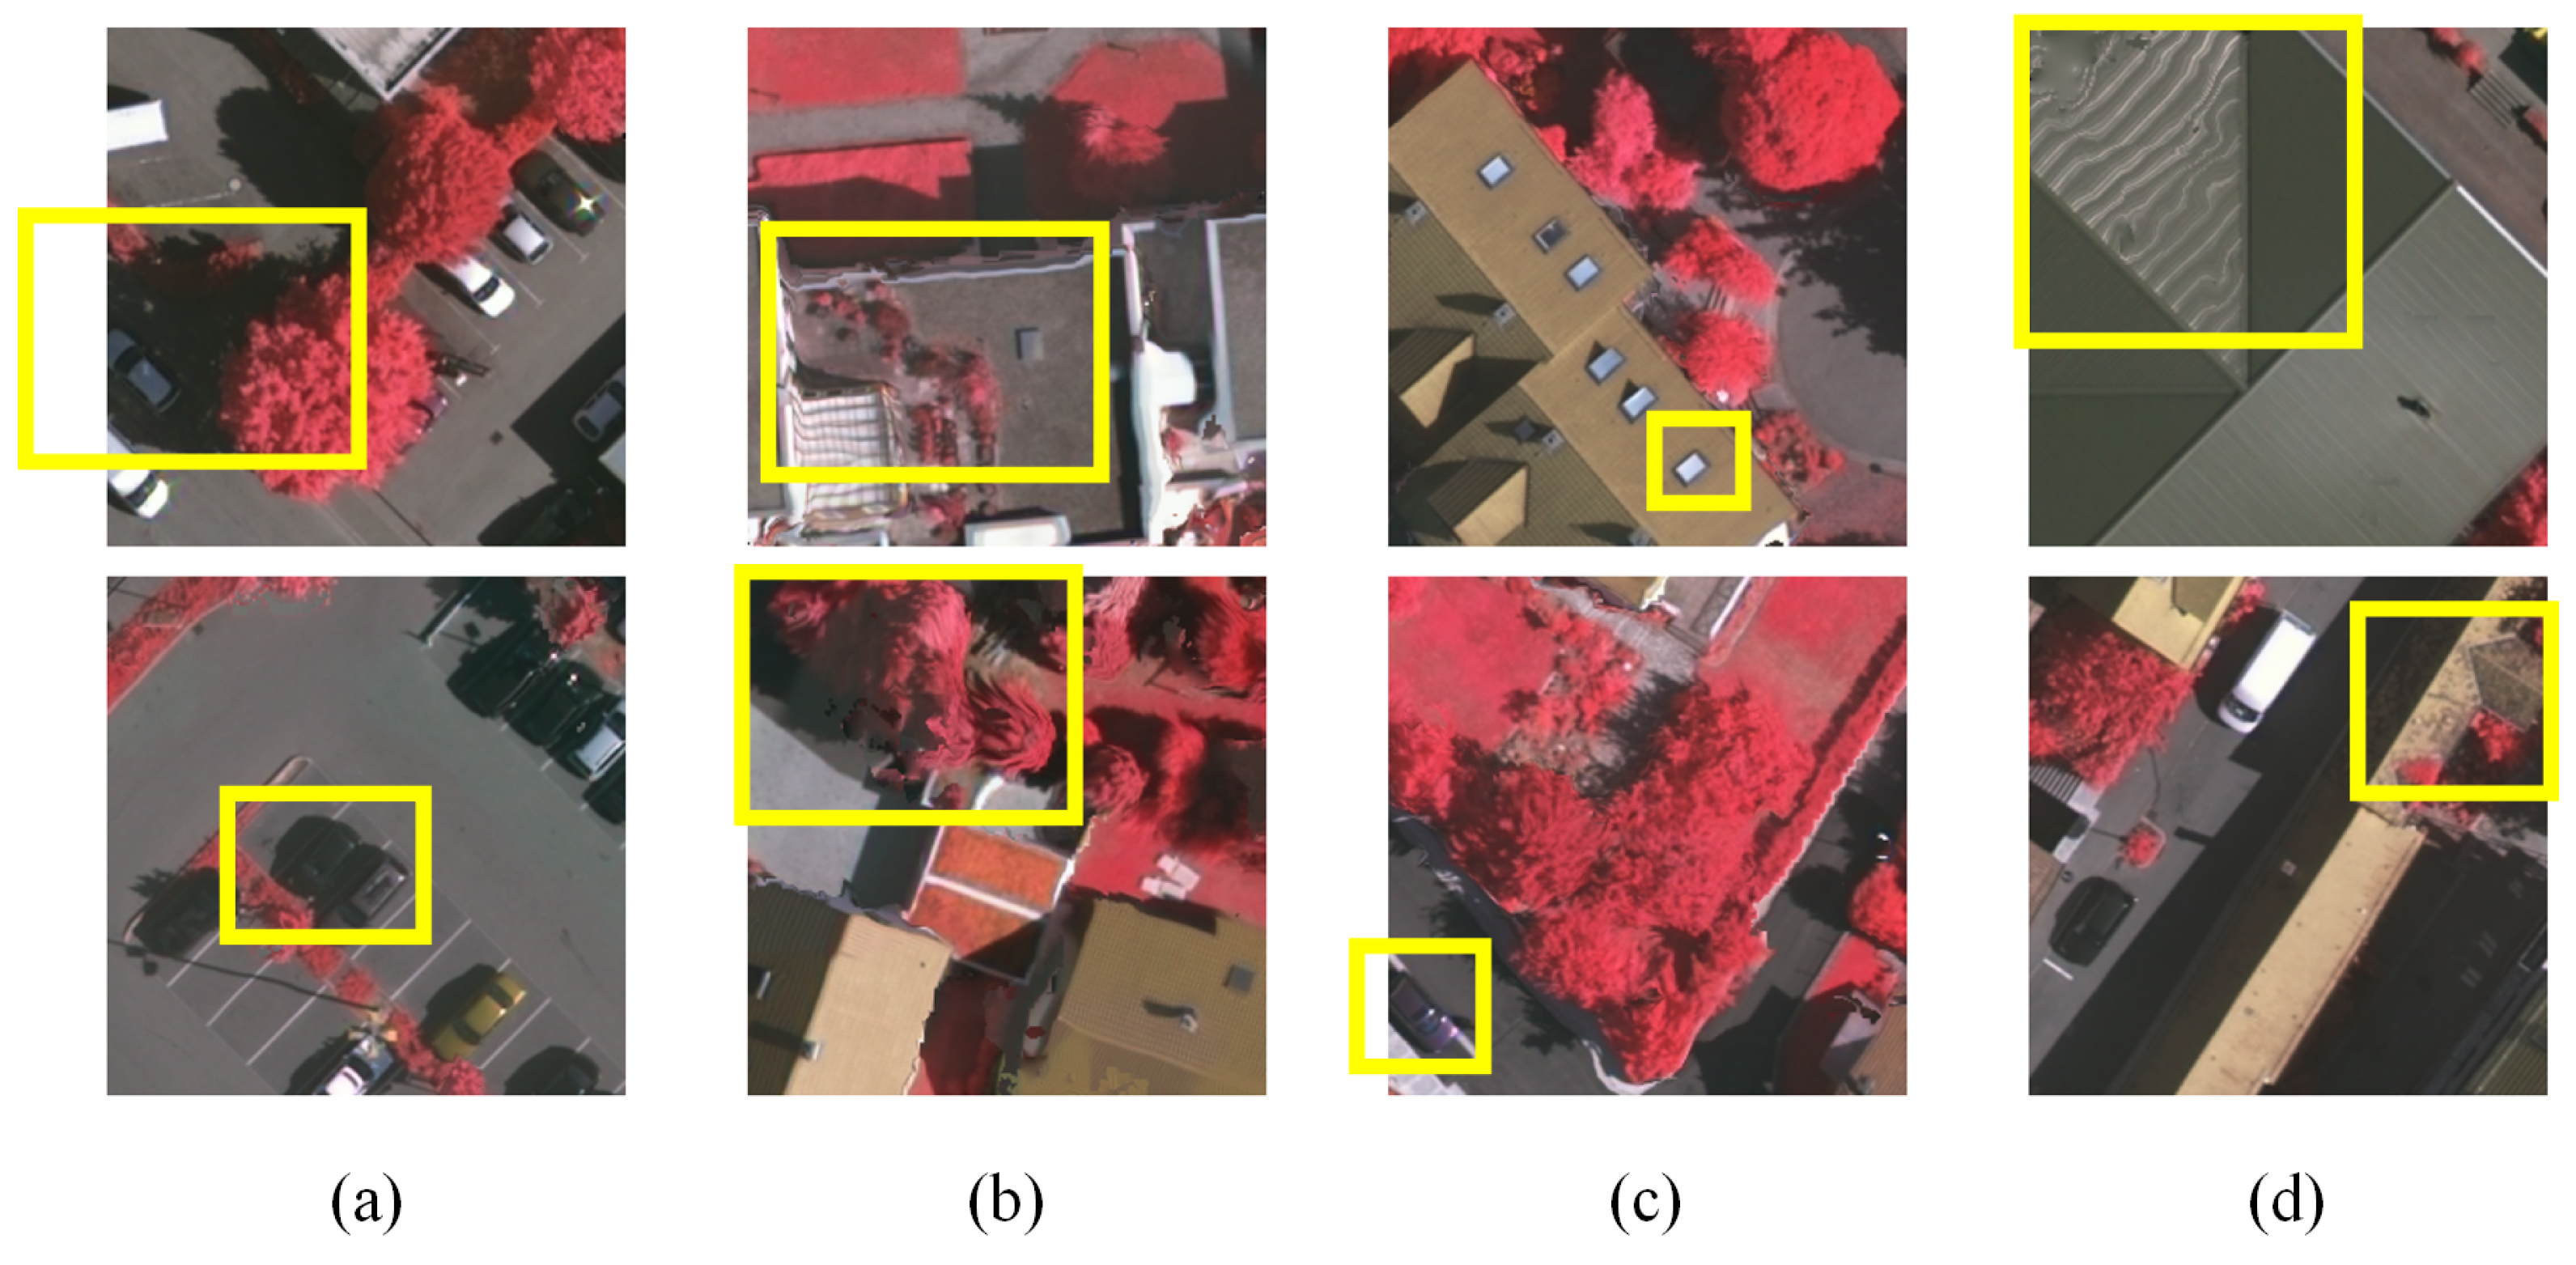
3.5. Data Augmentation Strategies

Remote sensing imagery is often subject to various forms of environmental interference, including shadow occlusions, acquisition distortions, and intra-class appearance variability [73,74]. These factors can have a substantial impact on the efficacy of semantic segmentation models. As demonstrated in Figure 6, such interference may result in the obscuring of object boundaries, the alteration of geometric consistency, or the augmentation of intra-class ambiguity. Consequently, this may impede the model’s capacity to accurately discern spatial and semantic features. While architectural design plays a central role in enhancing model robustness, it is equally important to address these challenges from the perspective of data distribution. To this end, this study adopts a comprehensive data augmentation strategy aimed at improving the diversity and realism of training samples, thereby mitigating the impact of interference during training.
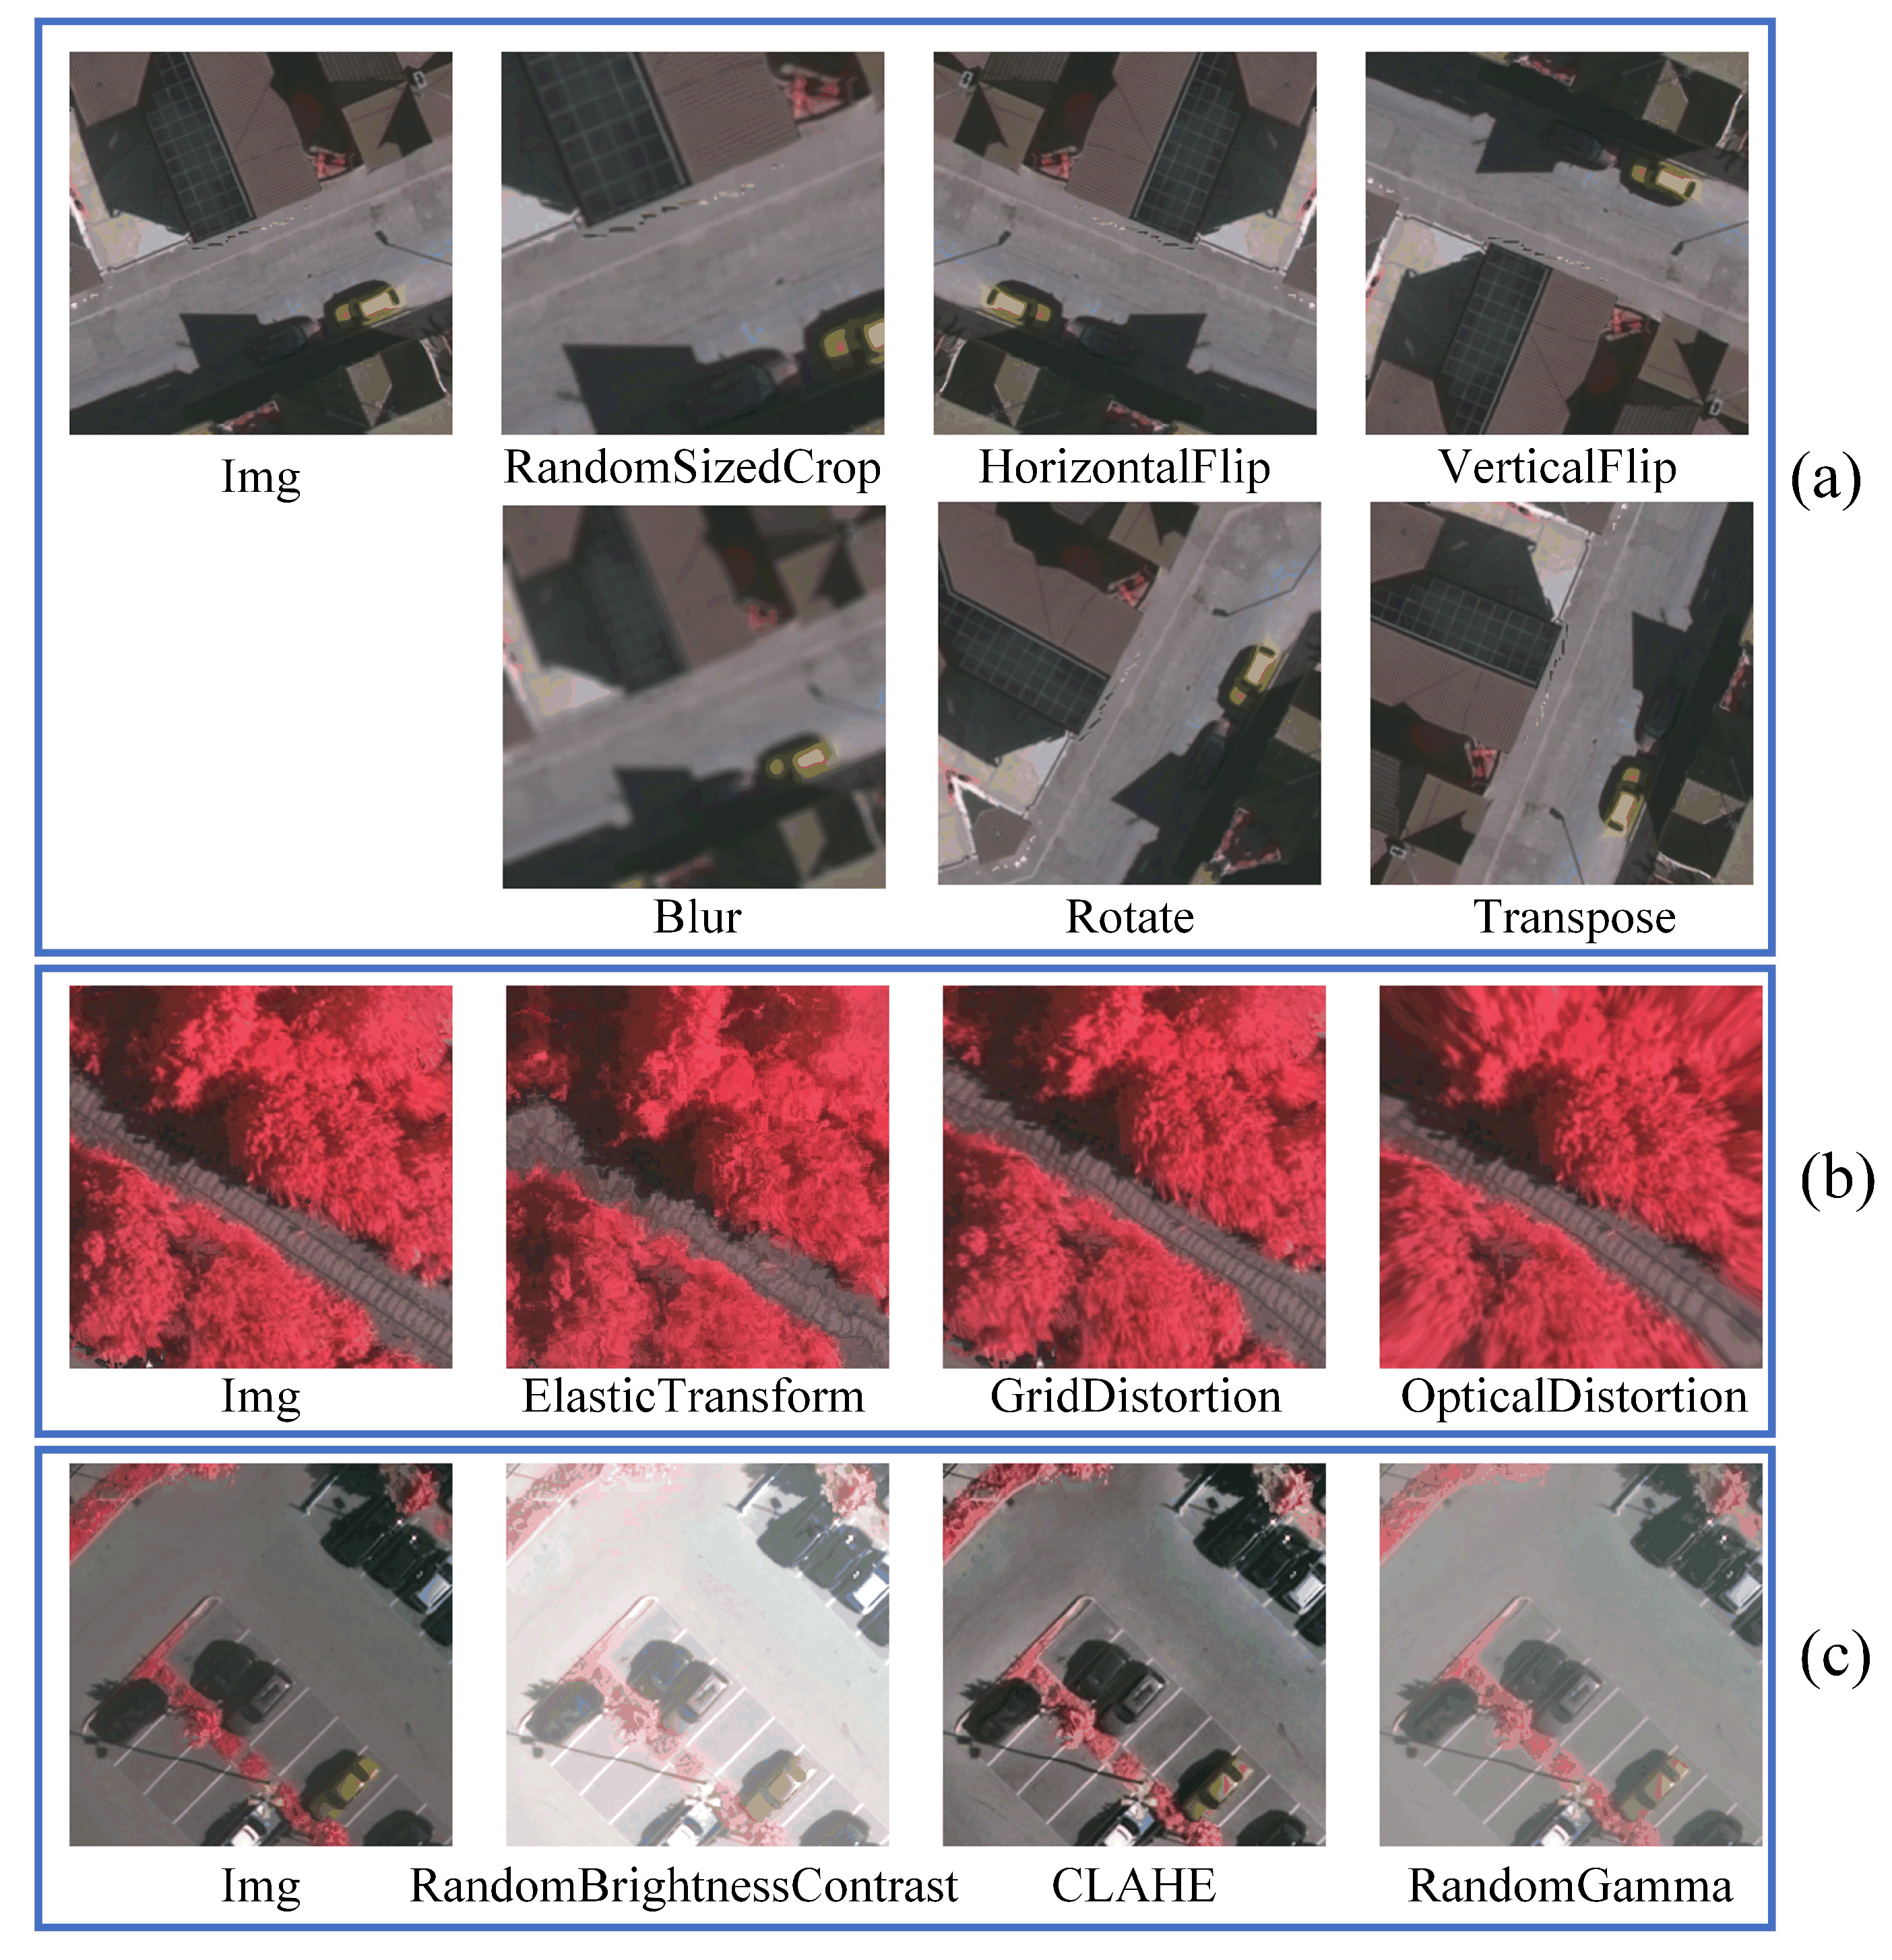
The augmentation operations are implemented through the utilization of the Albumentations library, which furnishes a malleable and efficient framework for image transformation. As illustrated in Figure 7, the proposed strategy is categorized into three distinct functions: planar information augmentation, spatial distortion augmentation, and environmental information augmentation. Planar information augmentation includes basic geometric operations such as random cropping, horizontal and vertical flipping, and random angle rotation, which increase positional and directional variation across samples. Spatial distortion augmentation simulates image deformations caused by terrain variation or sensor instability using elastic transform, grid distortion, and optical distortion techniques, thereby enriching the spatial diversity of training data. Environmental information augmentation is designed to enhance model adaptability to illumination inconsistencies and visual interference, such as shadowing or haze. Techniques such as Contrast Limited Adaptive Histogram Equalization (CLAHE), Random Brightness/Contrast adjustment, and Random Gamma correction are employed to improve the model’s ability to capture consistent semantic cues under varying environmental conditions.
By jointly applying augmentations from geometric, spatial, and environmental dimensions, the resulting training samples better reflect the variability present in real-world remote sensing scenarios. This strategy complements the structural robustness of DMA-Net and plays a crucial role in improving segmentation accuracy under complex imaging conditions.

4. Experiments

4.1. Datasets

This study conducts experiments on three widely used benchmark datasets for remote sensing semantic segmentation: Vaihingen, Potsdam, and LoveDA. These datasets have been extensively adopted in both academic and industrial contexts, and they cover diverse scenes with high-quality annotations. Their widespread use and standardized formats make them suitable for fair and rigorous comparison of segmentation performance across different models. By aligning our evaluation with these datasets, we ensure that the proposed DMA-Net can be objectively assessed under challenging and representative real-world conditions.

4.1.1. Potsdam

The Potsdam dataset, released by the ISPRS, comprises 38 ultra-high-resolution aerial images, each with a spatial resolution of 6000 × 6000 pixels and a ground sampling distance (GSD) of 5 cm. These images are extracted from the TOP mosaic of the city of Potsdam, Germany, covering a total area of approximately 3.42 square kilometers characterized by complex urban layouts, dense residential regions, and diverse land cover types. For semantic segmentation tasks, each image is annotated into six land cover classes: Impervious Surface, Building, Low Vegetation, Tree, Car, and Clutter. The dataset provides imagery in three channel formats: IR-R-G (infrared-red-green), R-G-B (true color), and R-G-B-IR (four-band composite), offering flexibility for multi-modal analysis.
Following widely adopted experimental settings in prior work [61,75,76,77,78], this study selects 24 images as the training set and 14 images as the test set. All images are uniformly cropped into non-overlapping patches of 256 × 256 pixels to accommodate GPU memory limitations and facilitate batch-based training. Model performance is evaluated using the mean Intersection over Union (mIoU) metric, computed over five primary semantic categories: Impervious Surface, Building, Low Vegetation, Tree, and Car, excluding Clutter as a background or auxiliary class.

4.1.2. Vaihingen

The Vaihingen dataset is another widely used benchmark from the ISPRS semantic labeling challenge, comprising 33 true orthophoto (TOP) images collected over a smaller urban area of 1.38 km2 in Vaihingen, Germany. Compared to Potsdam, Vaihingen images are smaller in coverage and have a slightly lower ground sampling distance of 9 cm. All images contain three channels—infrared, red, and green—and are annotated with six semantic classes, consistent with Potsdam. In our experiments, we adopted a subset of 28 images for training and 5 for testing, following established evaluation protocols. To ensure training consistency, all data are cropped into 256 × 256 patches. As with Potsdam, segmentation performance is measured using the mIoU, computed on five core classes: Impervious Surface, Building, Low Vegetation, Tree, and Car.

4.1.3. Loveda

The LoveDA dataset provides a large-scale benchmark for semantic segmentation tasks involving both urban and rural scenes. It contains 5987 high-resolution satellite images sourced from Google Earth, each with a spatial resolution of 0.3 m and image dimensions of 1024 × 1024 pixels. Unlike the Potsdam and Vaihingen datasets, which focus on dense urban areas, LoveDA offers a broader geographical spectrum, making it suitable for evaluating model adaptability across domain shifts. The dataset is manually annotated into seven semantic categories: Background, Building, Road, Water, Barren Land, Forest, and Agriculture, covering a wide range of land cover types. For experimental consistency, all images are uniformly divided into non-overlapping patches of 256 × 256 pixels.

4.2. Implementation Details

4.2.1. Training Environment and Hyperparameters

The proposed DMA-Net model is implemented using the PyTorch framework version 2.6.0, with all training and evaluation conducted on an NVIDIA GeForce RTX 3090 GPU (24GB GDDR6X, NVIDIA Corporation, Beijing, People’s Republic of China) platform. To accelerate convergence and improve feature generalization, we initialized the MaxViT encoder with pre-trained weights obtained from ImageNet-1k. All input images were uniformly resized and cropped to 256 × 256 pixels for both training and testing.
The model was trained with a batch size of 14, and the initial learning rate was set to 0.0001. We adopted the AdamW optimizer with a weight decay of 0.0001 to stabilize gradient updates and prevent overfitting. This combination of optimization strategies ensures an effective balance between fast convergence and stable learning.

4.2.2. Loss Function

To fully exploit hierarchical feature representations from different network depths, we designed a multi-stage feature aggregation loss function inspired by the CASCADE mechanism. The overall prediction was defined as a weighted combination of intermediate feature maps from four stages of DMA-Net:
y = α p 1 + β p 2 + γ p 3 + δ p 4
where p 1 , p 2 , p 3 , p 4 are the feature maps from four decoding stages ( y i , i [ 1 , 4 ] in Equation (7)), and α , β , γ , δ are learnable or preset coefficients to balance contributions from different depths. The total loss is defined as the combination of cross-entropy loss and Dice loss:
L t o t a l = L c e y + L d i c e y
The cross-entropy loss is defined as follows:
L c e = 1 N n = 1 N k = 1 K y k ( n ) × l o g y ^ k ( n )
The Dice loss is defined as follows:
L d i c e = 1 2 N n = 1 N k = 1 K y ^ k ( n ) × y k ( n ) y ^ k ( n ) + y k ( n )
where N is the number of pixels in an image and k is the number of semantic categories. y k ( n ) and y ^ k ( n ) represent the ground truth and predicted probabilities for class k at pixel n, respectively. The combination of these two losses allows the network to capture both class-wise prediction accuracy and global shape consistency, especially for small and thin objects.

4.2.3. Evaluation Metrics

To evaluate the segmentation performance of DMA-Net, we adopt two widely used evaluation metrics—mIoU and Average F1-Score (Avg.F1). These metrics are widely used in semantic segmentation tasks and are calculated based on the confusion matrix. mIoU reflects the average region-level overlap between predictions and ground truth. It is defined as follows:
I o U = T P T P + F P + F N
Avg.F1 balances precision and recall across all classes, providing a measure of classification consistency. The F1-Score is calculated as follows:
F 1 = 2 × P r e c i s i o n × R e c a l l P r e c i s i o n + R e c a l l
where:
P r e c i s i o n = T P T P + F P , R e c a l l = T P T P + F N

4.3. Compare with State-of-the-Art Models

We conducted comparative experiments between DMA-Net and existing advanced models, including CNN-based models (such as DeepLab V3+ and UNet) and Transformer-based models (such as MISSFormer, ST-UNet, and TransUNet).

4.3.1. Result of Potsdam

Table 1 presents the experimental results of DMA-Net on the Potsdam dataset, demonstrating its superior performance. DMA-Net achieves an MIoU of 87.31 and an Average F1 score of 92.55, outperforming other models listed in the table in terms of MIoU. Compared to state-of-the-art models such as ST-UNet and LSKNet, DMA-Net improves the MIoU by 0.14% and 1.15%, respectively, and enhances the Average F1 score by 1.94% and 0.86%. Additionally, DMA-Net achieves the best performance in the Building category and secures the second-highest scores in segmenting Impervious Surfaces, Low Vegetation, and Cars. Notably, while DMA-Net achieves the highest mIoU score on the Potsdam dataset, its F1-score slightly trails behind state-of-the-art models like LSKNet and AerialFormer. This performance gap stems from two factors: (1) severe class imbalance in the Potsdam dataset (as illustrated in Figure 8), and (2) DMA-Net’s currently inadequate capability in capturing small-sample objects.
Figure 9 shows the semantic segmentation results of various models on the Potsdam dataset. Observing row (a), it can be seen that in cases with numerous labels, DMA-Net accurately segments Impervious Surface, Building, Clutter, and Tree, thanks to the HCG successfully capturing multi-scale information within the feature maps during the decoder’s upsampling process. In contrast, Deeplab V3+ misses the Tree label, UNet misses Clutter, and MISSFormer, ST-UNet, Swin-UNet, and TransUNet incorrectly label Clutter, leading to contaminated feature maps. Observing rows (d) and (e), thanks to the refinement of the encoder outputs by CSA-Bridge, DMA-Net generates cleaner output maps compared to other models. Conversely, Deeplab V3+ incorrectly labels parts of the Building area, MISSFormer mislabels Tree as Clutter, and Swin-UNet and UNet are polluted by irrelevant information, resulting in large areas of mixed feature maps.

4.3.2. Result of Vaihingen

Table 2 presents the experimental results of DMA-Net on the Vaihingen dataset. It can be seen that DMA-Net achieved the best segmentation results across all metrics. Compared to the current advanced models, ST-Unet and UNetformer, DMA-Net improved the MIoU by 5.8% and 6.4%, respectively; the Average F1 score by 3.93% and 4.23%; the Impervious Surface metric by 4.92% and 9.90%; the Building metric by 6.61% for both; the Low Vegetation metric by 5.11% and 2.76%; the Tree metric by 1.43% and 4.09%; and the Car metric by 10.95% and 8.67%.
Figure 10 illustrates the segmentation performance of various models on the Vaihingen dataset. Compared to the Potsdam dataset, the Vaihingen dataset exhibits a significantly higher frequency of vehicle instances, a characteristic consistent with the label statistics presented in Figure 8. Row (a) demonstrates the effectiveness of DMA-Net’s encoder architecture, which incorporates MaxViT’s Grid Attention mechanism. By capturing globally sparse features in the feature maps, this design enables DMA-Net to effectively segment numerous car instances. In row (b), the input image contains a dominant Tree label occupying a large portion of the feature map, alongside minor labels such as Car and Low Vegetation. Through the Block Attention mechanism of MaxViT, the model successfully balances feature extraction: it preserves the Tree’s global structure while retaining fine-grained details of the smaller objects (e.g., cars and vegetation), yielding accurate segmentation results. Rows (f), (g), and (h) highlight three challenging scenarios involving occlusion and ambiguity. In row (f), multiple cars are parked beneath a withered tree, yet the ground truth (GT) inaccurately masks the car regions, labeling the entire area as Tree. This suggests that the withered tree’s texture has functionally transitioned into an occluder rather than a distinct object. Similarly, in rows (g) and (h), tree canopies partially obscure cars. Despite this, DMA-Net’s output aligns more closely with human intuition, correctly identifying the visible cars while maintaining Tree labels. These results underscore DMA-Net’s robust contextual reasoning capabilities. By leveraging dataset augmentation strategies, the model not only accurately segments dominant features (e.g., trees) but also reconstructs occluded objects (e.g., cars under trees) with high fidelity. This dual ability to prioritize semantically meaningful details and resolve complex occlusions demonstrates the efficacy of our proposed architecture in real-world remote sensing scenarios.

4.3.3. Result of LoveDA

Table 3 presents the experimental results of DMA-Net on the LoveDA dataset, demonstrating its superior performance. DMA-Net achieves an MIoU of 54.23, outperforming all other models listed in the table. Compared to state-of-the-art models such as ST-UNet and Swin-UNet, DMA-Net improves MIoU by 3.46% and 1.8%, respectively. Additionally, DMA-Net achieves the best performance in the Road and Water categories, while securing the second-highest scores in segmenting Background, Building, and Agriculture.
Figure 11 presents the segmentation results of DMA-Net in the LoveDA dataset. In row (a), DMA-Net achieves optimal results in reconstructing small objects. In row (f), DMA-Net produces the cleanest background segmentation, with its crop segmentation significantly closer to the ground truth compared to ST-UNet. In row (c), the results demonstrate that DMA-Net avoids confusion when training on small objects, highlighting its robustness in handling fine-grained details.

4.4. Ablation Study

To rigorously assess the performance enhancements achieved by integrating the CSA-Bridge, HA-Decoder, and MaxViT into DMA-Net, we performed ablation studies using the Vaihingen dataset within the MERIT network architecture framework. In DMA-Net, the encoder is built upon MaxViT, with both Block Attention and Grid Attention window sizes set to 2. The encoder consists of four stages with layer counts [2, 2, 5, 2], respectively, and the dimension of the encoding vectors is set to 96.

4.4.1. Effect of CSA-Bridge

The role of CSA-Bridge is to supply in the missing connection information between patches for the encoder and refine the encoder’s output. As demonstrated in Figure 12, in the ablation experiment for CSA-Bridge, the original modules were eliminated from CSA-Bridge, and the encoder’s output was directly connected to the decoder’s output via residual connections. As demonstrated in Table 4, it is evident that due to the lack of filtration of the encoder’s output by CSA-Bridge, the IoU metrics of DMA-Net decreased across various sub-items: a 6.60 decrease in the Impervious Surface item, a 1.33 decrease in the Building item, a 4.58 decrease in the Low Vegetation item, a 3.79 decrease in the Tree item, and a 2.34 decrease in the Car item. It is evident that CSA-Bridge has a significant impact on the Low Vegetation and Tree items. Figure 13 further validates this point. Observing Figure 13a–c, in the absence of the CSA-Bridge module, it can be seen that labels originally belonging to Low Vegetation and Tree were incorrectly marked as other objects. Meanwhile, we conducted ablation experiments on the D-OSRA module, CA module, and SA module in CSA-Bridge, and the results are shown in Table 5.

4.4.2. Effect of HA-Decoder

The task of the HA-Decoder is to capture multi-scale features within the feature maps as much as possible during upsampling to restore the missing details in the feature maps. As shown in Figure 14, in the ablation experiment for HA-Decoder, we removed the original SEG and ConvG modules from the HA-Decoder and instead used MLP to reduce the dimensionality of the channels and bilinear interpolation for upsampling the spatial dimensions. Observing Figure 15, it can be seen that due to the lack of multi-scale information capture, the decoder cannot accurately restore the segmentation maps of some small objects during the upsampling process. From Table 4, it can be seen that the performance of DMA-Net decreased by 6.04 in the Impervious Surface item, 6.58 in the Building item, 1.91 in the Low Vegetation item, 1.89 in the Tree item, and 3.86 in the Car item. This indicates that the HA-Decoder has a significant impact on the Building and Impervious Surface items.
Meanwhile, we conducted ablation experiments on the ConvG module and SEG module in HA-Decoder, and the results are shown in Table 6.

4.4.3. Effect of MaxViT

To explore the ability of MaxViT as an encoder to capture local and global information, we conducted ablation experiments on the Vaihingen dataset by replacing the encoder with other types of Transformers while keeping the other modules of DMA-Net fixed. As shown in Table 7, DMA-Net achieved the best performance when using MaxViT as the encoder. Additionally, MobileNet demonstrated weaker performance in handling Building, Car, and Low Vegetation, while ResNet showed weaker performance in handling Tree.

4.5. Effect of Loss Function

We conducted ablation experiments on the loss function using the Vaihingen dataset. As demonstrated in Figure 16, the Tree category is less affected by the loss function. The combination of Loss_Dice and Loss_CE significantly improves the segmentation results of DMA-Net on the dataset.

4.5.1. Effect of Hyperparameters in Loss Function

We conducted ablation experiments on the four hyperparameters of the loss function, as shown in Table 8. The results indicate that high-level semantic information has a greater impact on categories with large area proportions, such as Impervious Surfaces, while low-level semantic information plays a more significant role in smaller categories, such as Cars.

4.5.2. Effect of Data Augment

We conducted ablation experiments on the data augmentation scheme, as shown in Table 9. Environmental information data augmentation had the greatest impact on the Car category, improving its segmentation accuracy by 4.68. Spatial information data augmentation also had a significant impact on the Low Vegetation category, improving its segmentation accuracy by 2.42. Planar information data augmentation affected the Impervious Surface and Building categories, improving their segmentation accuracy by 1.37 and 2.34, respectively.

4.5.3. Statistical Significance Test for Data Augment

We conducted a significance test on the data augmentation strategy. As shown in Table 10, applying the data augmentation strategy to segmentation models with a Transformer backbone results in a noticeable performance improvement. However, when the same strategy is applied to models with a CNN backbone, the improvement is less significant due to the weaker generalization capability of CNN.

4.5.4. Effect of D-OSR

We performed an ablation study on the D-OSR module within D-OSRA to investigate the impact of different dynamic kernel sizes on experimental performance. As shown in Table 11, DMA-Net achieves optimal performance when the D-OSR module selects a dynamic kernel size of L 32 .

4.6. Efficiency Analysis

To comprehensively evaluate the advantages and disadvantages of the models, Table 12 presents the parameter and processing speed of multiple models on the Vaihingen and Potsdam datasets under the same hardware conditions [98,99,100,101]. The speed is indicated by the number of images processed per second, measured in FPS. Since Transformer models typically generate more parameters than CNN, models using Transformers as encoders are often larger and have lower FPS compared to models using CNN as encoders. However, DMA-Net, with MaxViT as the encoder, is capable of fully leveraging the advantages of MaxViT in remote sensing image datasets. Consequently, DMA-Net attains optimal segmentation results while maintaining basic smoothness (the minimum threshold for smoothness perceived by the human eye is 30 FPS [96,102,103]). Additionally, due to its lightweight design, DMA-Net can also run on small mobile devices.

5. Conclusions

In this study, we propose a novel and efficient semantic segmentation network, DMA-Net, and validate its effectiveness in the field of remote sensing image segmentation. DMA-Net employs MaxViT as the backbone encoder, which leverages its dual-axis attention mechanisms—Grid Attention and Block Attention mechanisms—to efficiently capture both local and global information. To enhance the skip connection design, we introduce a CSA-Bridge module, which combines D-OSRA with CA and SA to supplement missing details between encoder stages and enhance fine-grained feature representations. In the decoding stage, we propose a HA-Decoder which integrates ConvG and SE-Net to comprehensively recover the missing details and improve the semantic integrity of the segmentation output.
While DMA-Net achieves promising results, it still exhibits several limitations. Notably, some output maps show jagged boundaries that fail to align precisely with the ground truth images. In scenarios involving multiple adjacent objects, the model occasionally struggles to delineate clear boundaries. Furthermore, DMA-Net only meets the minimum threshold for visual smoothness, and noticeable stuttering often occurs during practical operation. We also observe that DMA-Net has limited capability in handling class-imbalanced datasets, leading to inefficient capture of small-sample object information. Future work will focus on further improving the model’s processing speed and edge refinement capabilities, while continuing to explore lightweight and high-performance designs suitable for complex remote sensing environments. Additionally, methods such as imbalanced learning and ensemble learning will be adopted to enhance DMA-Net’s ability to capture small-sample object information.

Author Contributions

Conceptualization, C.D. and X.Q.; methodology, C.D.; software, C.D.; validation, C.D.; formal analysis, C.D.; investigation, C.D.; resources, S.W.; data curation, C.D.; writing—original draft preparation, C.D.; writing—review and editing, H.L.; visualization, C.D.; supervision, H.L.; project administration, H.L.; funding acquisition, S.W. All authors have read and agreed to the published version of the manuscript.

Funding

This study was financially supported by the National Key R&D Program of China (Grant No. 2023YFF0805904), Talent introduction Program Youth Project of the Chinese Academy of Sciences (E43302020D, E2Z105010F), the National Natural Science Foundation of China (Grant No. 42471495), Deployment Program of AIRCAS (Grant Number: E4Z202021F) and the Guangzhou Energy Institute Project (E4C1020301).

Data Availability Statement

The raw data supporting the conclusions of this article will be made available by the authors on request.

Conflicts of Interest

The authors declare no conflicts of interest.

Abbreviations

The following abbreviations are used in this manuscript:
DMA-NetDynamic Morphology-Aware Segmentation Network for Remote Sensing Images
MaxViTMulti-Axis Vision Transformer
HA-DecoderHierarchy Attention Decoder
HCGHierarchy Convolutional Groups
CSA-BridgeChannel and Spatial Attention Bridge
CSWinCross-Shaped windows Transformer
SWinShifted Windows Transformer
CNNConvolutional Neural Network
CAChannel Attention
SASpatial Attention
D-OSRADynamic Overlapping Spatial Reduction Attention

References

  1. Lyons, M.B.; Keith, D.A.; Phinn, S.R.; Mason, T.J.; Elith, J. A comparison of resampling methods for remote sensing classification and accuracy assessment. Remote Sens. Environ. 2018, 208, 145–153. [Google Scholar] [CrossRef]
  2. Maggiori, E.; Tarabalka, Y.; Charpiat, G.; Alliez, P. Convolutional neural networks for large-scale remote-sensing image classification. IEEE Trans. Geosci. Remote Sens. 2016, 55, 645–657. [Google Scholar] [CrossRef]
  3. Kemker, R.; Salvaggio, C.; Kanan, C. Algorithms for semantic segmentation of multispectral remote sensing imagery using deep learning. ISPRS J. Photogramm. Remote Sens. 2018, 145, 60–77. [Google Scholar] [CrossRef]
  4. Zhang, C.; Sargent, I.; Pan, X.; Li, H.; Gardiner, A.; Hare, J.; Atkinson, P.M. Joint Deep Learning for land cover and land use classification. Remote Sens. Environ. 2019, 221, 173–187. [Google Scholar] [CrossRef]
  5. Bi, H.; Xu, F.; Wei, Z.; Xue, Y.; Xu, Z. An active deep learning approach for minimally supervised PolSAR image classification. IEEE Trans. Geosci. Remote Sens. 2019, 57, 9378–9395. [Google Scholar] [CrossRef]
  6. Li, K.; Cheng, G.; Bu, S.; You, X. Rotation-insensitive and context-augmented object detection in remote sensing images. IEEE Trans. Geosci. Remote Sens. 2017, 56, 2337–2348. [Google Scholar] [CrossRef]
  7. Xia, G.S.; Bai, X.; Ding, J.; Zhu, Z.; Belongie, S.; Luo, J.; Datcu, M.; Pelillo, M.; Zhang, L. DOTA: A large-scale dataset for object detection in aerial images. In Proceedings of the IEEE Conference on Computer Vision and Pattern Recognition, Salt Lake City, UT, USA, 18–22 June 2018; pp. 3974–3983. [Google Scholar]
  8. Duan, C.; Li, R. Multi-head linear attention generative adversarial network for thin cloud removal. arXiv 2020, arXiv:2012.10898. [Google Scholar]
  9. Li, R.; Zheng, S.; Duan, C.; Yang, Y.; Wang, X. Classification of hyperspectral image based on double-branch dual-attention mechanism network. Remote Sens. 2020, 12, 582. [Google Scholar] [CrossRef]
  10. Tong, X.Y.; Xia, G.S.; Lu, Q.; Shen, H.; Li, S.; You, S.; Zhang, L. Land-cover classification with high-resolution remote sensing images using transferable deep models. Remote Sens. Environ. 2020, 237, 111322. [Google Scholar] [CrossRef]
  11. Gong, P.; Marceau, D.J.; Howarth, P.J. A comparison of spatial feature extraction algorithms for land-use classification with SPOT HRV data. Remote Sens. Environ. 1992, 40, 137–151. [Google Scholar] [CrossRef]
  12. Ma, L.; Li, M.; Ma, X.; Cheng, L.; Du, P.; Liu, Y. A review of supervised object-based land-cover image classification. ISPRS J. Photogramm. Remote Sens. 2017, 130, 277–293. [Google Scholar] [CrossRef]
  13. Tucker, C.J. Red and photographic infrared linear combinations for monitoring vegetation. Remote Sens. Environ. 1979, 8, 127–150. [Google Scholar] [CrossRef]
  14. Zhong, Y.; Zhao, J.; Zhang, L. A hybrid object-oriented conditional random field classification framework for high spatial resolution remote sensing imagery. IEEE Trans. Geosci. Remote Sens. 2014, 52, 7023–7037. [Google Scholar] [CrossRef]
  15. Zhu, X.X.; Tuia, D.; Mou, L.; Xia, G.S.; Zhang, L.; Xu, F.; Fraundorfer, F. Deep learning in remote sensing: A comprehensive review and list of resources. IEEE Geosci. Remote Sens. Mag. 2017, 5, 8–36. [Google Scholar] [CrossRef]
  16. Krizhevsky, A.; Sutskever, I.; Hinton, G.E. Imagenet classification with deep convolutional neural networks. Commun. ACM 2017, 60, 84–90. [Google Scholar] [CrossRef]
  17. Ronneberger, O.; Fischer, P.; Brox, T. U-net: Convolutional networks for biomedical image segmentation. In Proceedings of the Medical Image Computing and Computer-Assisted Intervention–MICCAI 2015: 18th International Conference, Munich, Germany, 5–9 October 2015; Proceedings, Part III 18. Springer: Cham, Switzerland, 2015; pp. 234–241. [Google Scholar]
  18. Chen, J.; Lu, Y.; Yu, Q.; Luo, X.; Adeli, E.; Wang, Y.; Lu, L.; Yuille, A.L.; Zhou, Y. Transunet: Transformers make strong encoders for medical image segmentation. arXiv 2021, arXiv:2102.04306. [Google Scholar]
  19. Azad, R.; Fayjie, A.R.; Kauffmann, C.; Ben Ayed, I.; Pedersoli, M.; Dolz, J. On the texture bias for few-shot cnn segmentation. In Proceedings of the IEEE/CVF Winter Conference on Applications of Computer Vision, Virtual, 5–9 January 2021; pp. 2674–2683. [Google Scholar]
  20. Wen, M.; Zhou, Q.; Tao, B.; Shcherbakov, P.; Xu, Y.; Zhang, X. Short-term and long-term memory self-attention network for segmentation of tumours in 3D medical images. CAAI Trans. Intell. Technol. 2023, 8, 1524–1537. [Google Scholar] [CrossRef]
  21. Jaderberg, M.; Simonyan, K.; Zisserman, A. Spatial transformer networks. Adv. Neural Inf. Process. Syst. 2015, 28. [Google Scholar]
  22. Chen, L.C.; Papandreou, G.; Kokkinos, I.; Murphy, K.; Yuille, A.L. Deeplab: Semantic image segmentation with deep convolutional nets, atrous convolution, and fully connected crfs. IEEE Trans. Pattern Anal. Mach. Intell. 2017, 40, 834–848. [Google Scholar] [CrossRef]
  23. Hu, J.; Shen, L.; Sun, G. Squeeze-and-excitation networks. In Proceedings of the IEEE Conference on Computer Vision and Pattern Recognition, Salt Lake City, UT, USA, 18–22 June 2018; pp. 7132–7141. [Google Scholar]
  24. Woo, S.; Park, J.; Lee, J.Y.; Kweon, I.S. Cbam: Convolutional block attention module. In Proceedings of the European Conference on Computer Vision (ECCV), Munich, Germany, 8–14 September 2018; pp. 3–19. [Google Scholar]
  25. Liu, S.; Huang, D.; Wang, Y. Learning spatial fusion for single-shot object detection. arXiv 2019, arXiv:1911.09516. [Google Scholar]
  26. Carion, N.; Massa, F.; Synnaeve, G.; Usunier, N.; Kirillov, A.; Zagoruyko, S. End-to-end object detection with transformers. In Proceedings of the European Conference on Computer Vision, Virtual, 23–28 August 2020; pp. 213–229. [Google Scholar]
  27. Ye, L.; Rochan, M.; Liu, Z.; Wang, Y. Cross-modal self-attention network for referring image segmentation. In Proceedings of the IEEE/CVF Conference on Computer Vision and Pattern Recognition, Long Beach, CA, USA, 16–20 June 2019; pp. 10502–10511. [Google Scholar]
  28. Yu, X.; Wang, J.; Zhao, Y.; Gao, Y. Mix-ViT: Mixing attentive vision transformer for ultra-fine-grained visual categorization. Pattern Recognit. 2023, 135, 109131. [Google Scholar] [CrossRef]
  29. Wang, P.; Zhang, T.; Zhang, H.; Cheng, S.; Wang, W. Adding attention to the neural ordinary differential equation for spatio-temporal prediction. Int. J. Geogr. Inf. Sci. 2024, 38, 156–181. [Google Scholar] [CrossRef]
  30. Vaswani, A. Attention is all you need. Adv. Neural Inf. Process. Syst. 2017. [Google Scholar] [CrossRef]
  31. Dosovitskiy, A.; Beyer, L.; Kolesnikov, A.; Weissenborn, D.; Zhai, X.; Unterthiner, T.; Dehghani, M.; Minderer, M.; Heigold, G.; Gelly, S. An image is worth 16 × 16 words: Transformers for image recognition at scale. arXiv 2020, arXiv:2010.11929. [Google Scholar]
  32. Xu, G.; Zhang, X.; He, X.; Wu, X. Levit-unet: Make faster encoders with transformer for medical image segmentation. In Proceedings of the Chinese Conference on Pattern Recognition and Computer Vision (PRCV), Xiamen, China, 13–15 October 2023; pp. 42–53. [Google Scholar]
  33. Chu, X.; Tian, Z.; Zhang, B.; Wang, X.; Shen, C. Conditional positional encodings for vision transformers. arXiv 2021, arXiv:2102.10882. [Google Scholar]
  34. Shaw, P.; Uszkoreit, J.; Vaswani, A. Self-attention with relative position representations. arXiv 2018, arXiv:1803.02155. [Google Scholar]
  35. Zhang, Z.C.; Chen, Z.D.; Wang, Y.; Luo, X.; Xu, X.S. A vision transformer for fine-grained classification by reducing noise and enhancing discriminative information. Pattern Recognit. 2024, 145, 109979. [Google Scholar] [CrossRef]
  36. Zhang, T.; Xu, W.; Luo, B.; Wang, G. Depth-wise convolutions in vision transformers for efficient training on small datasets. Neurocomputing 2025, 617, 128998. [Google Scholar] [CrossRef]
  37. Zhang, Z.C.; Chen, Z.D.; Wang, Y.; Luo, X.; Xu, X.S. Vit-fod: A vision transformer based fine-grained object discriminator. arXiv 2022, arXiv:2203.12816. [Google Scholar]
  38. Liu, Z.; Lin, Y.; Cao, Y.; Hu, H.; Wei, Y.; Zhang, Z.; Lin, S.; Guo, B. Swin transformer: Hierarchical vision transformer using shifted windows. In Proceedings of the IEEE/CVF International Conference on Computer Vision, Montreal, BC, Canada, 11–17 October 2021; pp. 10012–10022. [Google Scholar]
  39. Dong, X.; Bao, J.; Chen, D.; Zhang, W.; Yu, N.; Yuan, L.; Chen, D.; Guo, B. Cswin transformer: A general vision transformer backbone with cross-shaped windows. In Proceedings of the IEEE/CVF Conference on Computer Vision and Pattern Recognition, New Orleans, LA, USA, 18–24 June 2022; pp. 12124–12134. [Google Scholar]
  40. Chen, Y.; Dai, X.; Chen, D.; Liu, M.; Dong, X.; Yuan, L.; Liu, Z. Mobile-former: Bridging mobilenet and transformer. In Proceedings of the IEEE/CVF Conference on Computer Vision and Pattern Recognition, New Orleans, LA, USA, 18–24 June 2022; pp. 5270–5279. [Google Scholar]
  41. Pan, J.; Bulat, A.; Tan, F.; Zhu, X.; Dudziak, L.; Li, H.; Tzimiropoulos, G.; Martinez, B. Edgevits: Competing light-weight cnns on mobile devices with vision transformers. In Proceedings of the European Conference on Computer Vision, Tel Aviv, Israel, 23–27 October 2022; pp. 294–311. [Google Scholar]
  42. Yu, B.; Yin, H.; Zhu, Z. St-unet: A spatio-temporal u-network for graph-structured time series modeling. arXiv 2019, arXiv:1903.05631. [Google Scholar]
  43. Li, R.; Zheng, S.; Duan, C.; Su, J.; Zhang, C. Multistage attention ResU-Net for semantic segmentation of fine-resolution remote sensing images. IEEE Geosci. Remote Sens. Lett. 2021, 19, 8009205. [Google Scholar] [CrossRef]
  44. Hanyu, T.; Yamazaki, K.; Tran, M.; McCann, R.A.; Liao, H.; Rainwater, C.; Adkins, M.; Cothren, J.; Le, N. AerialFormer: Multi-resolution transformer for aerial image segmentation. Remote Sens. 2024, 16, 2930. [Google Scholar] [CrossRef]
  45. He, X.; Zhou, Y.; Zhao, J.; Zhang, D.; Yao, R.; Xue, Y. Swin Transformer Embedding UNet for Remote Sensing Image Semantic Segmentation. IEEE Trans. Geosci. Remote Sens. 2022, 60, 4408715. [Google Scholar] [CrossRef]
  46. Long, J.; Shelhamer, E.; Darrell, T. Fully convolutional networks for semantic segmentation. In Proceedings of the IEEE Conference on Computer Vision and Pattern Recognition, Boston, MA, USA, 7–12 June 2015; pp. 3431–3440. [Google Scholar]
  47. Wang, L.; Li, R.; Zhang, C.; Fang, S.; Duan, C.; Meng, X.; Atkinson, P.M. UNetFormer: A UNet-like transformer for efficient semantic segmentation of remote sensing urban scene imagery. ISPRS J. Photogramm. Remote Sens. 2022, 190, 196–214. [Google Scholar] [CrossRef]
  48. Cheng, B.; Misra, I.; Schwing, A.G.; Kirillov, A.; Girdhar, R. Masked-attention mask transformer for universal image segmentation. In Proceedings of the IEEE/CVF Conference on Computer Vision and Pattern Recognition, New Orleans, LA, USA, 18–24 June 2022; pp. 1290–1299. [Google Scholar]
  49. Bi, Q.; You, S.; Gevers, T. Learning content-enhanced mask transformer for domain generalized urban-scene segmentation. In Proceedings of the AAAI Conference on Artificial Intelligence, Vancouver, BC, Canada, 20–27 February 2024; Volume 38, pp. 819–827. [Google Scholar]
  50. Bi, Q.; You, S.; Gevers, T. Learning generalized segmentation for foggy-scenes by bi-directional wavelet guidance. In Proceedings of the AAAI Conference on Artificial Intelligence, Vancouver, BC, Canada, 20–27 February 2024; Volume 38, pp. 801–809. [Google Scholar]
  51. Zhao, M.; Hu, X.; Zhang, L.; Meng, Q.; Chen, Y.; Bruzzone, L. Beyond pixel-level annotation: Exploring self-supervised learning for change detection with image-level supervision. IEEE Trans. Geosci. Remote Sens. 2024, 62, 5614916. [Google Scholar] [CrossRef]
  52. Yu, R.; Cai, H.; Zhang, B.; Feng, T. Multi-Scale Object Detection in Remote Sensing Images Based on Feature Interaction and Gaussian Distribution. Remote Sens. 2024, 16, 1988. [Google Scholar] [CrossRef]
  53. Alhichri, H.; Alswayed, A.S.; Bazi, Y.; Ammour, N.; Alajlan, N.A. Classification of remote sensing images using EfficientNet-B3 CNN model with attention. IEEE Access 2021, 9, 14078–14094. [Google Scholar] [CrossRef]
  54. Su, C.; Hu, X.; Meng, Q.; Zhang, L.; Shi, W.; Zhao, M. A multimodal fusion framework for urban scene understanding and functional identification using geospatial data. Int. J. Appl. Earth Obs. Geoinf. 2024, 127, 103696. [Google Scholar] [CrossRef]
  55. Guo, D.; Xia, Y.; Luo, X. Scene classification of remote sensing images based on saliency dual attention residual network. IEEE Access 2020, 8, 6344–6357. [Google Scholar] [CrossRef]
  56. He, N.; Fang, L.; Plaza, A. Hybrid first and second order attention Unet for building segmentation in remote sensing images. Sci. China Inf. Sci. 2020, 63, 140305. [Google Scholar] [CrossRef]
  57. Tu, Z.; Talebi, H.; Zhang, H.; Yang, F.; Milanfar, P.; Bovik, A.; Li, Y. Maxvit: Multi-axis vision transformer. In Proceedings of the European Conference on Computer Vision, Tel Aviv, Israel, 23–27 October 2022; pp. 459–479. [Google Scholar]
  58. Yu, C.; Xiao, B.; Gao, C.; Yuan, L.; Zhang, L.; Sang, N.; Wang, J. Lite-hrnet: A lightweight high-resolution network. In Proceedings of the IEEE/CVF Conference on Computer Vision and Pattern Recognition, Virtual, 19–25 June 2021; pp. 10440–10450. [Google Scholar]
  59. Zhang, C.; Yang, L. Improving the Segmentation Method of Overburden Dump Wall in Open-Pit Mines Using HRNetV2. In Proceedings of the 2024 9th International Symposium on Computer and Information Processing Technology (ISCIPT), Xi’an, China, 24–26 May 2024; pp. 390–393. [Google Scholar]
  60. Zhang, H.; Dun, Y.; Pei, Y.; Lai, S.; Liu, C.; Zhang, K.; Qian, X. HF-HRNet: A simple hardware friendly high-resolution network. IEEE Trans. Circuits Syst. Video Technol. 2024, 34, 7699–7711. [Google Scholar] [CrossRef]
  61. Maggiori, E.; Tarabalka, Y.; Charpiat, G.; Alliez, P. High-Resolution Aerial Image Labeling With Convolutional Neural Networks. IEEE Trans. Geosci. Remote Sens. 2017, 55, 7092–7103. [Google Scholar] [CrossRef]
  62. Tao, C.; Qi, J.; Li, Y.; Wang, H.; Li, H. Spatial information inference net: Road extraction using road-specific contextual information. ISPRS J. Photogramm. Remote Sens. 2019, 158, 155–166. [Google Scholar] [CrossRef]
  63. Qian, W.; Yang, X.; Peng, S.; Zhang, X.; Yan, J. RSDet++: Point-based modulated loss for more accurate rotated object detection. IEEE Trans. Circuits Syst. Video Technol. 2022, 32, 7869–7879. [Google Scholar] [CrossRef]
  64. Cheng, G.; Wang, J.; Li, K.; Xie, X.; Lang, C.; Yao, Y.; Han, J. Anchor-free oriented proposal generator for object detection. IEEE Trans. Geosci. Remote Sens. 2022, 60, 5625411. [Google Scholar] [CrossRef]
  65. Yang, X.; Yan, J.; Feng, Z.; He, T. R3det: Refined single-stage detector with feature refinement for rotating object. In Proceedings of the AAAI Conference on Artificial Intelligence, Virtual, 2–9 February 2021; Volume 35, pp. 3163–3171. [Google Scholar]
  66. Li, R.; Zheng, S.; Zhang, C.; Duan, C.; Wang, L.; Atkinson, P.M. ABCNet: Attentive bilateral contextual network for efficient semantic segmentation of Fine-Resolution remotely sensed imagery. ISPRS J. Photogramm. Remote Sens. 2021, 181, 84–98. [Google Scholar] [CrossRef]
  67. Li, Y.; Li, X.; Dai, Y.; Hou, Q.; Liu, L.; Liu, Y.; Cheng, M.M.; Yang, J. LSKNet: A foundation lightweight backbone for remote sensing. Int. J. Comput. Vis. 2024, 133, 1410–1431. [Google Scholar] [CrossRef]
  68. Yang, X.; Yang, J.; Yan, J.; Zhang, Y.; Zhang, T.; Guo, Z.; Sun, X.; Fu, K. Scrdet: Towards more robust detection for small, cluttered and rotated objects. In Proceedings of the IEEE/CVF International Conference on Computer Vision, Seoul, Republic of Korea, 27 October–2 November 2019; pp. 8232–8241. [Google Scholar]
  69. Dai, L.; Liu, H.; Tang, H.; Wu, Z.; Song, P. Ao2-detr: Arbitrary-oriented object detection transformer. IEEE Trans. Circuits Syst. Video Technol. 2022, 33, 2342–2356. [Google Scholar] [CrossRef]
  70. Zhu, X.; Su, W.; Lu, L.; Li, B.; Wang, X.; Dai, J. Deformable detr: Deformable transformers for end-to-end object detection. arXiv 2020, arXiv:2010.04159. [Google Scholar]
  71. Wang, W.; Xie, E.; Li, X.; Fan, D.P.; Song, K.; Liang, D.; Lu, T.; Luo, P.; Shao, L. Pyramid vision transformer: A versatile backbone for dense prediction without convolutions. In Proceedings of the IEEE/CVF International Conference On computer Vision, Montreal, BC, Canada, 10–17 October 2021; pp. 568–578. [Google Scholar]
  72. Wang, W.; Xie, E.; Li, X.; Fan, D.P.; Song, K.; Liang, D.; Lu, T.; Luo, P.; Shao, L. Pvt v2: Improved baselines with pyramid vision transformer. Comput. Vis. Media 2022, 8, 415–424. [Google Scholar] [CrossRef]
  73. Yang, Y.; Yuan, G.; Li, J. SFFNet: A Wavelet-Based Spatial and Frequency Domain Fusion Network for Remote Sensing Segmentation. arXiv 2024, arXiv:2405.01992. [Google Scholar] [CrossRef]
  74. Zhang, C.; Lin, H.; Chen, M.; Li, R.; Zeng, Z. Scale compatibility analysis in geographic process research: A case study of a meteorological simulation in Hong Kong. Appl. Geogr. 2014, 52, 135–143. [Google Scholar] [CrossRef]
  75. Mou, L.; Hua, Y.; Zhu, X.X. Relation Matters: Relational Context-Aware Fully Convolutional Network for Semantic Segmentation of High-Resolution Aerial Images. IEEE Trans. Geosci. Remote Sens. 2020, 58, 7557–7569. [Google Scholar] [CrossRef]
  76. Zheng, Z.; Yang, Z.; Chen, Y.; Wu, Z.; Marinello, F. The interannual calibration and global nighttime light fluctuation assessment based on pixel-level linear regression analysis. Remote Sens. 2019, 11, 2185. [Google Scholar] [CrossRef]
  77. Liu, Y.; Minh Nguyen, D.; Deligiannis, N.; Ding, W.; Munteanu, A. Hourglass-shapenetwork based semantic segmentation for high resolution aerial imagery. Remote Sens. 2017, 9, 522. [Google Scholar] [CrossRef]
  78. Marcos, D.; Volpi, M.; Kellenberger, B.; Tuia, D. Land cover mapping at very high resolution with rotation equivariant CNNs: Towards small yet accurate models. ISPRS J. Photogramm. Remote Sens. 2018, 145, 96–107. [Google Scholar] [CrossRef]
  79. Diakogiannis, F.I.; Waldner, F.; Caccetta, P.; Wu, C. ResUNet-a: A deep learning framework for semantic segmentation of remotely sensed data. ISPRS J. Photogramm. Remote Sens. 2020, 162, 94–114. [Google Scholar] [CrossRef]
  80. Zheng, S.; Lu, J.; Zhao, H.; Zhu, X.; Luo, Z.; Wang, Y.; Fu, Y.; Feng, J.; Xiang, T.; Torr, P.H. Rethinking semantic segmentation from a sequence-to-sequence perspective with transformers. In Proceedings of the IEEE/CVF Conference on Computer Vision and Pattern Recognition, Nashville, TN, USA, 20–25 June 2021; pp. 6881–6890. [Google Scholar]
  81. Tsai, F.J.; Peng, Y.T.; Tsai, C.C.; Lin, Y.Y.; Lin, C.W. Banet: A blur-aware attention network for dynamic scene deblurring. IEEE Trans. Image Process. 2022, 31, 6789–6799. [Google Scholar] [CrossRef]
  82. Cao, H.; Wang, Y.; Chen, J.; Jiang, D.; Zhang, X.; Tian, Q.; Wang, M. Swin-unet: Unet-like pure transformer for medical image segmentation. In Proceedings of the European Conference on Computer Vision, Tel Aviv, Israel, 23–27 October 2022; pp. 205–218. [Google Scholar]
  83. Wang, L.; Li, R.; Duan, C.; Zhang, C.; Meng, X.; Fang, S. A novel transformer based semantic segmentation scheme for fine-resolution remote sensing images. IEEE Geosci. Remote Sens. Lett. 2022, 19, 6506105. [Google Scholar] [CrossRef]
  84. Marsocci, V.; Scardapane, S.; Komodakis, N. MARE: Self-supervised multi-attention REsu-Net for semantic segmentation in remote sensing. Remote Sens. 2021, 13, 3275. [Google Scholar] [CrossRef]
  85. Emara, T.; Abd El Munim, H.E.; Abbas, H.M. Liteseg: A novel lightweight convnet for semantic segmentation. In Proceedings of the 2019 Digital Image Computing: Techniques and Applications (DICTA), Perth, Australia, 2–4 December 2019; pp. 1–7. [Google Scholar]
  86. Wang, R.; Jiang, H.; Li, Y. UPerNet with ConvNeXt for Semantic Segmentation. In Proceedings of the 2023 IEEE 3rd International Conference on Electronic Technology, Communication and Information (ICETCI), Changchun, China, 26–28 May 2023; pp. 764–769. [Google Scholar]
  87. Fu, J.; Liu, J.; Tian, H.; Li, Y.; Bao, Y.; Fang, Z.; Lu, H. Dual attention network for scene segmentation. In Proceedings of the IEEE/CVF Conference on Computer Vision and Pattern Recognition, Long Beach, CA, USA, 15–20 June 2019; pp. 3146–3154. [Google Scholar]
  88. Huang, X.; Deng, Z.; Li, D.; Yuan, X. Missformer: An effective medical image segmentation transformer. arXiv 2021, arXiv:2109.07162. [Google Scholar] [CrossRef] [PubMed]
  89. Zhou, Z.; Rahman Siddiquee, M.M.; Tajbakhsh, N.; Liang, J. Unet++: A nested u-net architecture for medical image segmentation. In Proceedings of the Deep learning in Medical Image Analysis and Multimodal Learning for Clinical Decision Support: 4th International Workshop, DLMIA 2018, and 8th International Workshop, ML-CDS 2018, Held in Conjunction with MICCAI 2018, Granada, Spain, 20 September 2018; Proceedings 4. Springer: Cham, Switzerland, 2018; pp. 3–11. [Google Scholar]
  90. Zheng, Z.; Zhong, Y.; Wang, J.; Ma, A. Foreground-aware relation network for geospatial object segmentation in high spatial resolution remote sensing imagery. In Proceedings of the IEEE/CVF Conference on Computer Vision and Pattern Recognition, Seattle, WA, USA, 13–19 June 2020; pp. 4096–4105. [Google Scholar]
  91. Strudel, R.; Garcia, R.; Laptev, I.; Schmid, C. Segmenter: Transformer for semantic segmentation. In Proceedings of the IEEE/CVF International Conference on Computer Vision, Montreal, BC, Canada, 11–17 October 2021; pp. 7262–7272. [Google Scholar]
  92. Xie, E.; Wang, W.; Yu, Z.; Anandkumar, A.; Alvarez, J.M.; Luo, P. SegFormer: Simple and efficient design for semantic segmentation with transformers. Adv. Neural Inf. Process. Syst. 2021, 34, 12077–12090. [Google Scholar]
  93. Ma, A.; Wang, J.; Zhong, Y.; Zheng, Z. FactSeg: Foreground activation-driven small object semantic segmentation in large-scale remote sensing imagery. IEEE Trans. Geosci. Remote Sens. 2021, 60, 5606216. [Google Scholar] [CrossRef]
  94. Xu, R.; Wang, C.; Zhang, J.; Xu, S.; Meng, W.; Zhang, X. RSSFormer: Foreground saliency enhancement for remote sensing land-cover segmentation. IEEE Trans. Image Process. 2023, 32, 1052–1064. [Google Scholar] [CrossRef]
  95. Wang, D.; Zhang, J.; Xu, M.; Liu, L.; Wang, D.; Gao, E.; Han, C.; Guo, H.; Du, B.; Tao, D.; et al. Mtp: Advancing remote sensing foundation model via multi-task pretraining. IEEE J. Sel. Top. Appl. Earth Obs. Remote Sens. 2024, 17, 11632–11654. [Google Scholar] [CrossRef]
  96. He, K.; Zhang, X.; Ren, S.; Sun, J. Deep residual learning for image recognition. In Proceedings of the IEEE Conference on Computer Vision and Pattern Recognition, Las Vegas, NV, USA, 27–30 June 2016; pp. 770–778. [Google Scholar]
  97. Howard, A.G. Mobilenets: Efficient convolutional neural networks for mobile vision applications. arXiv 2017, arXiv:1704.04861. [Google Scholar]
  98. Sinha, D.; El-Sharkawy, M. Thin mobilenet: An enhanced mobilenet architecture. In Proceedings of the 2019 IEEE 10th Annual Ubiquitous Computing, Electronics & Mobile Communication Conference (UEMCON), New York, NY, USA, 10–12 October 2019; pp. 0280–0285. [Google Scholar]
  99. Sandler, M.; Howard, A.; Zhu, M.; Zhmoginov, A.; Chen, L.C. Mobilenetv2: Inverted residuals and linear bottlenecks. In Proceedings of the IEEE Conference on Computer Vision and Pattern Recognition, Salt Lake City, UT, USA, 18–23 June 2018; pp. 4510–4520. [Google Scholar]
  100. Koonce, B. MobileNetV3. In Convolutional Neural Networks with Swift for Tensorflow: Image Recognition and Dataset Categorization; Springer: Cham, Switzerland, 2021; pp. 125–144. [Google Scholar]
  101. Qin, D.; Leichner, C.; Delakis, M.; Fornoni, M.; Luo, S.; Yang, F.; Wang, W.; Banbury, C.; Ye, C.; Akin, B.; et al. MobileNetV4: Universal models for the mobile ecosystem. In Proceedings of the European Conference on Computer Vision, Milan, Italy, 28 September–4 October 2024; pp. 78–96. [Google Scholar]
  102. Ou, Y.F.; Lin, W.; Zeng, H.; Wang, Y. Perceptual quality of video with periodic frame rate and quantization variation-subjective studies and analytical modeling. arXiv 2014, arXiv:1406.2018. [Google Scholar]
  103. Ou, Y.F.; Liu, T.; Zhao, Z.; Ma, Z.; Wang, Y. Modeling the impact of frame rate on perceptual quality of video. In Proceedings of the 2008 15th IEEE International Conference on Image Processing, San Diego, CA, USA, 12–15 October 2008; pp. 689–692. [Google Scholar]
Figure 1. Overall architecture of DMA-Net.
Remotesensing 17 02354 g001
Figure 2. Visualization of MaxViT Aattention.
Remotesensing 17 02354 g002
Figure 3. The internal structure of the MaxViT Encoder Block.
Remotesensing 17 02354 g003
Figure 4. (A) Overall architecture of the CSA-Bridge module. (B) Internal structure of the Channel Attention module. (C) Internal structure of the Spatial Attention module. Yellow squares correspond to highlight box.
Remotesensing 17 02354 g004
Figure 5. The internal structure of the HA-Decoder Block. The arrows indicate the data flow direction.
Remotesensing 17 02354 g005
Figure 6. Samples in Remote Sensing Images. (a) Environmental shadows obscuring objects. (b) Distortions generated during the image acquisition process. (c) Presence of similar but different category objects. (d) Objects belonging to the same category but appearing different due to environmental erosion. Yellow squares correspond to highlight box.
Remotesensing 17 02354 g006
Figure 7. Data augmentation strategies. (a) Planar information data augmentation; (b) Spatial information data augmentation; (c) Environmental information data augmentation.
Remotesensing 17 02354 g007
Figure 8. Proportion of each semantic label in the Vaihingen and Potsdam datasets.
Remotesensing 17 02354 g008
Figure 9. Examples of semantic segmentation results on the Potsdam dataset. (af) show the selected representative samples.
Remotesensing 17 02354 g009
Figure 10. Examples of semantic segmentation results on the Vaihingen dataset. (ah) show the selected representative samples.
Remotesensing 17 02354 g010
Figure 11. Examples of semantic segmentation results on the LoveDA dataset. (af) show the selected representative samples.
Remotesensing 17 02354 g011
Figure 12. Illustration of CSA-Bridge module ablation experiment. The arrow indicates the direction of data flow.
Remotesensing 17 02354 g012
Figure 13. Comparison of segmentation results before and after using CSA-Bridge. (ac) show the selected representative samples.
Remotesensing 17 02354 g013
Figure 14. Illustration of HA-Decoder module ablation experiment. The arrow indicates the direction of data flow.
Remotesensing 17 02354 g014
Figure 15. Comparison of segmentation results before and after using HA-Decoder. (ac) show the selected representative samples.
Remotesensing 17 02354 g015
Figure 16. Ablation experiment of loss functions on the Vaihingen dataset.
Remotesensing 17 02354 g016
Table 1. Potsdam experimental results, with the best results marked in red and the second-best results marked in blue.
ModelBackboneIoU (%)Evaluation Index
Impervious Surface Building Low Vegetation Tree Car MIoU (%) Average F1 (%)
ResUNet (2020) [79]CNN52.1364.9750.0447.0353.6853.5769.56
SETR (2021) [80]Transformer56.8067.5852.0446.9653.7355.4271.07
BANet (2022) [81]Transformer63.7076.9259.6357.9867.6965.1878.73
Swin-Unet (2022) [82]Transformer71.4575.0259.0350.9671.1565.5278.79
LSKNet-s (2024) [67]Transformer65.5980.9059.8057.3171.6167.0479.97
DC-Swin (2022) [83]Transformer68.6083.1063.6066.0273.8571.0381.63
MAResUNet (2021) [84]Transformer68.7983.3265.3665.4275.4071.6683.31
LiteSeger (2024) [85]Transformer71.2084.5967.1867.0272.9272.5882.52
UperNet (2023) [86]Transformer76.9583.9365.6560.4076.5772.7083.91
FCN (2018) [46]CNN77.4183.5266.1063.1974.3472.9184.12
DANet (2019) [87]Transformer77.3583.4566.4663.4775.2873.2084.32
Unet (2020) [17]CNN77.1082.8364.5965.4476.1673.2284.35
Deeplab V3+ (2022) [22]CNN79.0184.7667.5363.0578.0574.4885.13
TransUNet (2021) [18]Transformer78.6185.6067.1664.1079.3374.9685.44
MISSFormer (2021) [88]Transformer76.6261.5157.7077.0121.6858.9071.75
PSPNet (2024) [46]Transformer78.0284.1667.0163.2579.0374.3083.22
ST-UNet (2023) [45]Transformer79.1986.6390.8983.3786.7785.3786.13
UNetFormer (2022) [47]Transformer85.9585.3691.6586.7881.4086.2381.67
ABCNet (2021) [66]Transformer85.9385.1691.2786.9081.7386.2080.67
AerialFormer (2023) [44]Transformer89.3389.2592.3885.1976.5186.5393.70
LSKNet (2024) [67]Transformer86.0287.5691.2587.3880.0286.4592.90
DMA-NetTransformer88.2190.3291.5585.0781.4287.3192.55
Table 2. Vaihingen experimental results, with the best results marked in red and the second-best results marked in blue.
ModelBackboneIoU (%)Evaluation Index
Impervious Surface Building Low Vegetation Tree Car MIoU (%) Average F1 (%)
Swin-Unet (2022) [82]Transformer69.3173.3749.4867.1230.7858.0172.02
SETR (2021) [80]Transformer65.1976.5255.2766.1835.3759.7173.75
FCN (2018) [46]CNN73.2278.9754.8070.3839.9263.4676.65
DANet (2019) [87]Transformer73.5481.4056.8871.2142.6865.1478.00
UperNet (2023) [86]Transformer73.4581.5055.6571.3147.2665.8478.69
BANet (2022) [81]Transformer69.9380.3358.9568.0454.3866.3379.40
Unet (2020) [17]CNN72.9181.6857.2371.6348.2966.3579.13
TransUNet (2021) [18]Transformer73.2781.0155.0771.0855.1367.1179.86
Deeplab V3+ (2022) [22]CNN74.8583.0156.0971.5450.3067.1679.71
LSKNet (2024) [67]Transformer69.8281.0157.4668.6659.4967.2980.15
ResUNet (2020) [84]CNN70.2981.7458.9069.4859.7268.0380.68
ABCNet (2020) [66]Transformer70.1782.4658.6869.3359.5768.0480.67
DC-Swin (2022) [83]Transformer71.5083.6459.1469.7062.9269.3881.63
UNetFormer (2022) [47]Transformer89.1194.7573.1075.3379.2982.3281.85
ST-UNet (2023) [45]Transformer90.0591.3772.5576.9077.8981.7582.15
MISSFormer (2021) [88]Transformer68.7556.5054.0772.4721.6254.6868.69
MAResUNet (2021) [84]Transformer72.4783.1060.7370.6467.2870.8482.72
PSPNet (2024) [77]Transformer74.9883.2767.6562.5773.3572.3681.98
UPerNet (2024) [86]Transformer72.5183.1562.8372.9865.4271.3883.10
DMA-NetTransformer88.2893.5975.9077.9680.4383.2386.08
Table 3. In the experimental results on the LoveDA dataset, the best-performing results are highlighted in red, while the second-best results are marked in blue.
ModelBackboneIoU(%)Evaluation Index
Background Building Road Water Barren Forest Agriculture MIoU (%)
FCN (2015) [46]CNN42.6149.5148.1673.1811.8243.5958.3246.74
UNet (2015) [17]CNN43.1252.7752.8473.1710.3843.1759.9347.91
UNet++ (2018) [89]CNN42.9852.6452.8274.5911.4444.4258.8148.24
DeeplabV3+ (2018) [22]CNN43.6550.9952.2374.5410.4544.2858.5747.82
FarSeg (2020) [90]Transformer43.4251.8253.3976.1010.8243.2658.6548.21
TransUNet (2021) [18]Transformer43.9756.1753.7678.769.3444.9556.9449.13
Segmenter (2021) [91]Transformer38.2250.7348.7377.4413.3543.5258.2847.18
Segformer (2021) [92]Transformer42.2756.4850.7178.5517.2145.2353.8649.19
DC-Swin (2022) [83]Transformer41.3854.5456.2378.1814.5747.2762.4350.66
FactSeg (2022) [93]Transformer42.6653.6252.8676.9116.2342.9457.5248.96
UNetFormer (2022) [47]Transformer44.7558.8154.9379.6320.1246.1062.5452.41
RSSFormer (2023) [94]Transformer52.4960.7955.2676.3618.7345.4358.3252.48
AerialFormer (2023) [44]Transformer45.2357.8856.5479.6219.2446.1459.5452.03
MAE+MTP (2024) [95]Transformer49.2257.8556.5379.6819.2747.1664.4153.45
MISSFormer (2021) [88]Transformer42.9850.5248.3673.5710.5243.0958.3046.76
ST-UNet (2023) [45]Transformer43.9055.3954.9679.7821.2944.3455.7450.77
Swin-UNet (2022) [82]Transformer44.9757.3855.1480.2520.2246.1362.9452.43
DMA-NetTransformer49.3060.1258.6582.3317.2947.1364.7954.23
Table 4. Ablation experiment of the proposed modules on the vaihingen dataset, the best-performing results are highlighted in red.
ModulesIoU (%)Evaluation Index
HA-Decoder CSA-Bridge Impervious Surface Building Low Vegetation Tree Car MIoU (%) Average F1 (%)
××81.4586.2868.8370.8670.9668.5681.11
×82.2487.0173.9976.0777.5372.2583.74
×81.6892.2671.3274.1778.0972.3983.69
88.2893.5975.9077.9680.4383.2386.08
Table 5. Effect of D-OSRA, CA, and SA in CSA-Bridge, the best-performing results are highlighted in red.
CSA-BridgeIoU (%)Evaluation Index
D-OSRA CA and SA Impervious Surface Building Low Vegetation Tree Car MIoU (%)
82.2487.0173.9976.0777.5383.23
×79.3985.3369.4175.2276.1977.11
×81.9886.8971.4475.0276.0878.28
××81.4586.2868.8370.8670.9668.56
Table 6. Effect of ConvG and SEG in HA-Decoder, the best-performing results are highlighted in red.
HA-DecoderIoU (%)Evaluation Index
ConvG SEG Impervious Surface Building Low Vegetation Tree Car MIoU (%)
81.6892.2671.3274.1778.0983.23
×81.5190.9070.9673.2776.3378.59
×81.6391.2269.2574.0577.1178.65
××81.4586.2868.8370.8670.9668.56
Table 7. Ablation experiment of encoder, the best-performing results are highlighted in red.
EncoderIoU (%)Evaluation Index
Impervious Surface Building Low Vegetation Tree Car MIoU (%) Average F1 (%)
Swin Transformer [38]85.8590.8773.2377.2675.9980.6484.37
CSwin Transformer [27]84.6789.2873.2276.6271.2479.0183.26
ResNet101 [96]81.8787.6346.4164.2469.5269.9475.63
MobileNet [97]78.6172.0565.3066.2361.8268.8075.96
MaxViT [57]88.2893.5975.9077.9680.4383.2386.08
Table 8. Ablation study on loss function hyperparameters, the best-performing results are highlighted in red.
α β γ δ Impervious SurfaceBuildingLow VegetationTreeCarMIoU (%)
111188.2893.5975.9077.9680.4383.23
011185.3692.1472.1774.0075.1079.75
101188.0393.2673.6876.0779.8682.18
110187.5091.9474.2377.4180.1082.24
111087.0492.0275.5177.6979.7682.41
Table 9. Ablation experiment of data augmentation, the best-performing results are highlighted in red.
Data AugmentationImpervious SurfaceBuildingLow VegetationTreeCarMIoU (%)
Planar Spatial Environmental
×××85.7290.3872.0676.5474.5679.85
××87.0992.7274.0676.7876.3581.4
××81.2388.1074.4875.3573.1678.46
××85.9388.9774.3576.3179.2480.96
88.2893.5975.9077.9680.4383.23
Table 10. Statistical significance test, the best-performing results are highlighted in red.
ModelBackboneIoU (%)Evaluation Index
MIoU (%)
Data Augment
Impervious Surface Building Low Vegetation Tree Car
Swin-Unet (2022) [82]Transformer73.0376.0952.0268.9335.6161.14
69.3173.3749.4867.1230.7858.01×
ST-UNet (2023) [42]Transformer90.0591.3772.5576.9077.8981.75
90.0190.2971.4275.8973.2280.17×
Unet (2020) [44]CNN72.3382.5758.0471.2949.1066.67
72.9181.6857.2371.6348.2966.35×
ResUNet (2020) [79]CNN71.3379.4557.6167.5858.4466.88
70.2981.7458.969.4859.7268.03×
DMA-NetTransformer88.2893.5975.9077.9680.4383.23
85.7290.3872.0676.5474.5679.85×
Table 11. Ablation study on D-OSR, the best-performing results are highlighted in red.
BackboneIoU (%)Evaluation Index
MIoU (%)
Impervious Surface Building Low Vegetation Tree Car
L/3288.2893.5975.977.9680.4383.23
L87.2191.9974.3276.3179.9881.96
L/1684.2592.1674.3176.8980.5181.62
183.2292.1373.3476.2279.9880.98
Table 12. Number of parameters and inference speed of different methods, the best-performing results are highlighted in red.
ModelParametersVaihingenPotsdam
Speed (FPS) MIoU (%) Speed (FPS) MIoU (%)
FCN [46]22.70 MB38063.4638172.91
UNet [17]25.13 MB21966.3522973.22
Deeplab V3+ [22]38.48 MB7067.167174.48
UperNet [86]102.13 MB5965.845972.70
DANet [87]45.36 MB10865.1410873.20
TransUNet [18]100.44 MB3567.113774.96
Swin-Unet [82]25.89 MB5758.015965.52
ST-Unet [42]160.97 MB770.23975.97
ABCNet [66]13.7 MB3668.044168.04
BANet [81]12.7 MB3766.333565.18
UNetFormer [47]11.7 MB4769.63469.32
LSKNet [67]4.5 MB2467.292967.04
LiteSeger [85]4.7MB4971.384772.58
MISSFormer [88]42.46 MB3757.354358.90
DMA-Net30.25 MB3583.233287.31
Disclaimer/Publisher’s Note: The statements, opinions and data contained in all publications are solely those of the individual author(s) and contributor(s) and not of MDPI and/or the editor(s). MDPI and/or the editor(s) disclaim responsibility for any injury to people or property resulting from any ideas, methods, instructions or products referred to in the content.

