Article

Beyond the Grid: GLRT-Based TomoSAR Fast Detection for Retrieving Height and Thermal Dilation

1
Antennas and Microwave Devices Laboratory, Ecole Militaire Polytechnique, Bordj El Bahri 16046, Algeria
2
Department of Geoinformatics, Paris-Lodron University of Salzburg, 5020 Salzburg, Austria
3
Department of Engineering, University of Naples “Parthenope”, 80143 Naples, Italy
*
Author to whom correspondence should be addressed.
Remote Sens. 2025, 17(14), 2334; https://doi.org/10.3390/rs17142334
Submission received: 4 June 2025 / Revised: 29 June 2025 / Accepted: 4 July 2025 / Published: 8 July 2025
(This article belongs to the Section Urban Remote Sensing)

Abstract

The Tomographic Synthetic Aperture Radar (TomoSAR) technique is widely used for monitoring urban infrastructures, as it enables the mapping of individual scatterers across additional dimensions such as height (3D), thermal dilation (4D), and deformation velocity (5D). Retrieving this information is crucial for building management and maintenance. Nevertheless, accurately extracting it from TomoSAR data poses several challenges, particularly the presence of outliers due to uneven and limited baseline distributions. One way to address these issues is through statistical detection approaches such as the Generalized Likelihood Ratio Test, which ensures a Constant False Alarm Rate. While effective, these methods face two primary limitations: high computational complexity and the off-grid problem caused by the discretization of the search space. To overcome these drawbacks, we propose an approach that combines a quick initialization process using Fast-Sup GLRT with local descent optimization. This method operates directly in the continuous domain, bypassing the limitations of grid-based search while significantly reducing computational costs. Experiments conducted on both simulated and real datasets acquired with the TerraSAR-X satellite over the Spanish city of Barcelona demonstrate the ability of the proposed approach to maintain computational efficiency while improving scatterer localization accuracy in the third and fourth dimensions.

Graphical Abstract

1. Introduction

The structural health monitoring of urban infrastructure is essential for ensuring its safety and longevity, particularly in densely populated areas where detecting and tracking structural deformations (such as thermal dilation and subsidence) can prevent failures and optimize maintenance. Thermal dilation, driven by temperature-induced material expansion and contraction, and subsidence can lead to stress accumulation and long-term structural damage. The accurate monitoring of these effects requires high-resolution data and three-dimensional mapping techniques capable of capturing such subtle thermal dilations [1].
In the last decades, Tomographic Synthetic Aperture Radar (TomoSAR) has emerged as a promising remote sensing tool for addressing the challenges associated with 3D and 4D/5D mapping and monitoring. By integrating radar data from multiple view angles, TomoSAR enables 3D scene reconstruction with high resolution, providing detailed information about scatterers’ parameters. However, retrieving the 3D point cloud from TomoSAR data is inherently challenging due to several factors that include mainly sparse and irregular sampling in the elevation domain [2]. Additionally, the presence of outliers, caused by uneven baseline distributions, further complicates the accurate extraction of scatterer information [3].
Researchers have explored various approaches to address the artifacts that limit TomoSAR reconstruction, with the primary goal of improving accuracy and reducing false alarms. These methods can be systematically classified into three categories, based on (i) model type (parametric vs. non-parametric), (ii) search strategy (sparse recovery vs. detection-based), and (iii) discretization scheme (grid-based vs. gridless). In terms of parameter dimensionality, these techniques have been applied to 3D, 4D, and 5D reconstructions. The first class of TomoSAR techniques involves the integration of non-parametric and parametric spectral estimators into the inversion process. Non-parametric methods recover the reflectivity profile without making strong assumptions about scatterer distribution, offering robustness against model mismatch [4,5]. In contrast, parametric methods [6] assume a predefined model structure and can achieve high resolution under ideal statistical conditions. In both cases, statistical regularization can be incorporated to enhance the quality of the reconstruction [7,8].
Sparse recovery approaches, particularly Compressive Sensing (CS), frame the reconstruction problem as an L1-regularized inversion under the assumption that only a few dominant scatterers exist within each resolution cell [9,10]. These methods have been extended to 4D/5D to incorporate motion and thermal dilation effects [11]. Nevertheless, their performance often degrades in the presence of noise or model mismatch, and they generally lack Constant False Alarm Rate (CFAR) properties. On the contrary, detection-based approaches such as the Generalized Likelihood Ratio Test (GLRT) explicitly formulate scatterer detection within a statistical hypothesis-testing framework [12,13]. These methods inherently support CFAR and are more robust in high-noise or model-uncertain environments.
Several GLRT-based variants have been proposed, such as support GLRT [14] and its fast version [15], which retain robustness at a reduced computational cost. Extensions to 4D and 5D domains have been developed to enable detection in the presence of motion and thermal dilation [16,17,18,19]. To improve detection performance, multilook GLRT [20] has been introduced, offering enhanced detection capability at the expense of spatial resolution. Further variants such as CS-GLRT [21] combine the super-resolution benefits of CS with CFAR from GLRT, though they are computationally intensive due to L1 minimization. Iterative-SGLRT [22] improves this trade-off but still suffers from off-grid effects resulting from discretization. While fine-grained sampling can reduce such errors, it comes at a significant computational cost, particularly in multidimensional setups [14].
Most classical CS and GLRT implementations are grid-based, discretizing the elevation space to search for scatterer positions. However, this discretization can introduce off-grid errors, particularly in higher-dimensional scenarios. To mitigate this, numerous solutions have been proposed, including oversampling the neighborhood of dominant scatterers using Nonlinear Least Squares minimization [23], cardinal sinus interpolation in CS [24], and off-grid modeling with perturbation terms [25,26]. Atomic Norm Minimization has also been employed for gridless CS reconstruction [27,28,29,30,31]. However, these methods are often limited to uniform acquisitions or require preprocessing steps such as array interpolation, which can negatively impact algorithm performance. Additionally, they tend to be computationally expensive. Alternative approaches have been explored, such as the Alternate Descent Conditional Gradient algorithm [32], which alternates between globally adding new solutions and locally refining them in the continuous domain. Similarly, the work of [33] reformulated the problem into a least-squares estimation problem and employed gradient descent to iteratively refine the solution.
All the above-mentioned gridless methods lack the CFAR property and require prior knowledge of the number of scatterers, which limits their practical applicability. Nevertheless, a gridless version of GLRT has been proposed in [34], where the particle swarm optimization algorithm was successfully integrated into the CFAR framework. However, this approach requires careful parameter tuning to ensure convergence. Moreover, although it is computationally less demanding than Support GLRT, it remains more expensive than Fast-Sup GLRT. In this paper, we propose an efficient grid-free GLRT-based method to overcome the limitations outlined above. Our approach extends the gridless framework to 4D/5D detection, explicitly accounting for scatterers’ thermal dilations. Based on the findings in [19,35], observed displacements are often primarily due to thermal expansion, making it reasonable to neglect linear deformation velocity and focus on estimating thermal dilation.
To this end, a multiple-stage process is employed, centered on initialization and Local Descent Optimization. The initialization phase adopts a sequential strategy inspired by the Fast Support GLRT algorithm [15], which efficiently narrows the search space. The subsequent stage involves a local descent algorithm that refines the solution in the continuous domain, guiding the optimization toward a global minimum. The proposed method preserves the CFAR property and does not require prior knowledge of the number of scatterers, thereby enhancing its applicability to real-world scenarios. Experiments conducted on both simulated and real TomoSAR datasets acquired by the German TerraSAR-X sensor demonstrate the proposed method’s ability to improve scatterer localization accuracy while maintaining computational efficiency.
The remainder of this paper is organized as follows: Section 2 provides an overview of the TomoSAR detection framework with an emphasis on GLRT. Section 3 presents the mathematical formulation of our proposed gridless GLRT variant. Section 4 reports experimental results and comparisons with a state-of-the-art method, discussed in Section 5, while Section 6 concludes the paper and explores future research prospects.

2. TomoSAR Detection

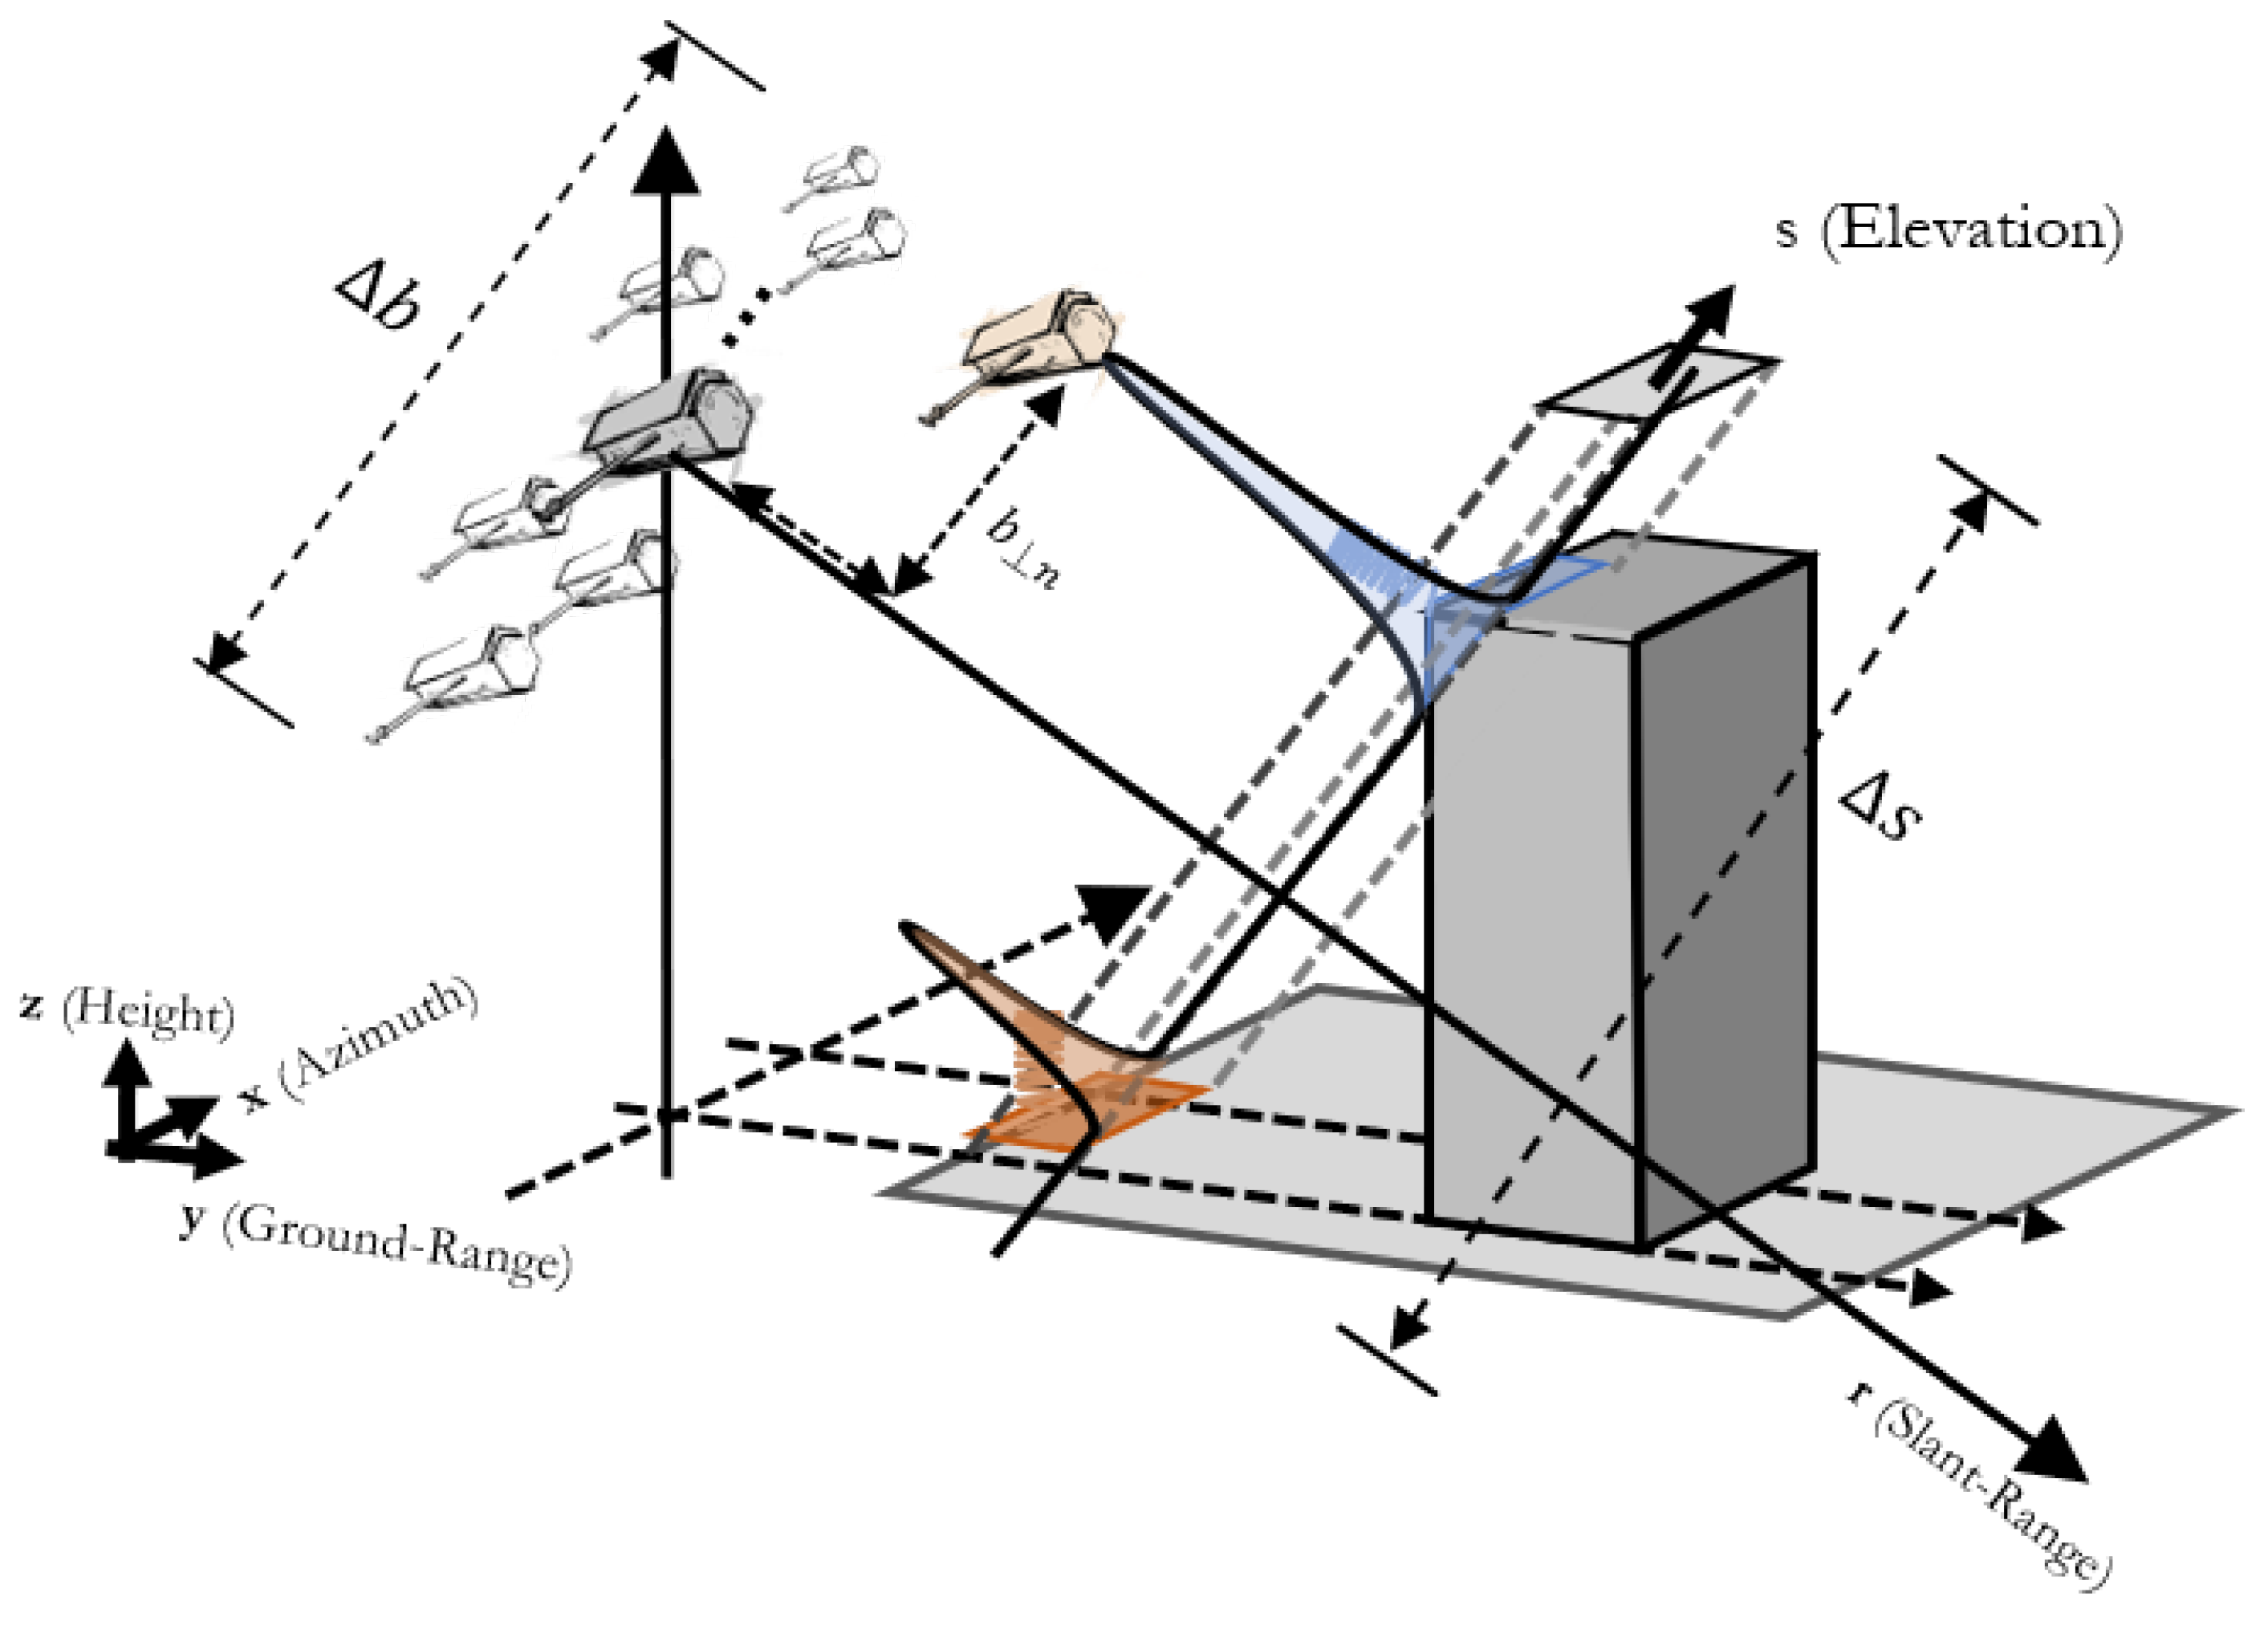
2.1. TomoSAR Configuration

TomoSAR imaging exploits M interferometric images acquired with slightly distinct viewing angles to perform an additional synthetic aperture along the direction perpendicular to the azimuth-range plan. The process enables the resolution of artifacts caused by the side-looking geometry of Synthetic Aperture Radar (SAR) data, particularly layover and foreshortening. The first step is co-registration and calibration, which includes multi-image registration and phase compensation. To account for thermal dilation and deformation, the m-th azimuth-range pixel, located at position b m on the baseline axis Δ b , and acquired at time t m when the temperature was T m , can be modeled in its compact form as:
u = Φ γ + w
where the subsequent parameters represent:
  • u : the measurement vector of dimension M × 1 .
  • γ : the discretized reflectivity function of dimension N × 1 whose elements are the samples γ ( s l , τ q , v t ) . At a fixed range and azimuth position, γ is sampled at N points corresponding to all the triplets ( l , q , t ) associated with the discrete samples ( s l , τ q , v t ) distributed over the (elevation, thermal dilation, velocity) domain. In other words, N = N s N τ N v is the number of discretized values of s, τ , and v.
  • Φ : the steering matrix of dimension M × N whose ( l , q , t ) -vector element is expressed as:
    ϕ m ( s l , τ q , v t ) = e j 2 π ξ m s l + ζ m τ q + χ m v t
    where ξ m and ζ m denote, respectively, the angular, thermal, and velocity frequencies whose analytical expressions are 2 b m / λ r 0 , 2 T m / λ , and 2 t m / λ (note that λ and r 0 account, respectively, for the wavelength and radar to ground distance).
  • w : the noise vector of dimension M × 1 .
Figure 1 shows a sketch of a typical TomoSAR geometry where two point-like scatterers are superimposed within a single resolution cell. The elevation extent, denoted as Δ s , plays an important role in the ability to invert the equation system (1) to resolve multiple scatterers. As  Δ s increases, the baseline configuration and angular sampling may become inadequate to cover the full height range. When the baseline coverage is limited relative to the elevation extent, aliasing may occur, causing scatterers from different heights to overlap in the reconstruction, resulting in ambiguity in vertical positioning [36].

2.2. GLRT Detection

As an alternative to classical inversion, the tomographic imaging problem in (1) can be addressed using a detection approach based on the well-known Generalized Likelihood Ratio Test. This approach carries out a hypothesis testing framework with ( K max + 1 ) hypotheses, corresponding to the presence of up to K max scatterers. Null and alternative hypotheses are formulated as:
H 0 : u = w , H 1 : u = Φ γ + w , with γ 1-sparse , H i : u = Φ γ + w , with γ i -sparse , H K max : u = Φ γ + w , with γ K max -sparse .
Binary tests are performed iteratively to estimate the number of dominant scatterers within each resolution cell. At each step p, statistical test Λ p is calculated according to the following:
Λ p ( u ) = min Ω p 1 u H Π Ω p 1 u min Ω K max u H Π Ω K max u H p 1 H K p T p ,
where the parameters listed below describe:
  • Ω p : the optimal p-sparse support set { l 1 , , l p } .
  • Π Ω p : the projection operator onto the orthogonal complement of the subspace spanned by the columns indexed by Ω p . Its formulas is I Φ Ω p Φ Ω p H Φ Ω p 1 Φ Ω p H .
  • T p : the predefined threshold for the test. Monte Carlo simulations provide a way to empirically estimate it by simulating the distribution of the GLRT statistic under the different hypotheses and selecting the value that corresponds to the desired false alarm rate.
Overall, the GLRT framework enables the estimation of both the number of scatterers and their corresponding support sets.

2.3. Optimal Support Set Ω p

Identifying the optimal support set Ω p (of cardinality p) that minimizes the objective function u H Π Ω p u is critical to the performance of the GLRT detector. In the literature, two main approaches have been considered:
  • Exhaustive search: where all possible support sets Ω p of size p are examined, in other words, all N p combinations. This variant of GLRT, known as Support GLRT, guarantees finding the global minimum of the objective function. However, its computational complexity is prohibitive for large values of N and p. This makes the exhaustive search approach impractical in high-dimensional scenarios, where the search space becomes challenging.
  • Sequential search: where the support set Ω p is built iteratively by adding one element at a time. At each step i ( 1 < i p ), the index l i is selected so that the objective function u H Π Ω i u is minimized, where Ω i = Ω i 1 { l i } . This variant of GLRT, known as Fast-Sup GLRT, greatly reduces the computational burden compared to exhaustive search by making locally optimal decisions at each iteration. However, since the search is greedy in nature, it may converge to a suboptimal local minimum rather than the global optimum. Its effectiveness depends on the structure of the problem and the quality of the locally optimal choices. While it significantly improves computational efficiency, especially for large-scale problems, its performance can be sensitive to noise and acquisition geometry.

3. Proposed Method

To balance efficiency and accuracy, we propose a hybrid multi-stage GLRT-based detector that leverages a fast sequential search to generate an initial estimate, followed by refinement using a quasi-Newton local descent. The stages of the proposed methodology are summarised in Algorithm 1 and detailed in the subsequent subsections:
Algorithm 1 Procedure for the estimation of the support { Ω ^ p } p = 1 K max and the corresponding matrix { Φ Ω p } p = 1 K max
Remotesensing 17 02334 i001
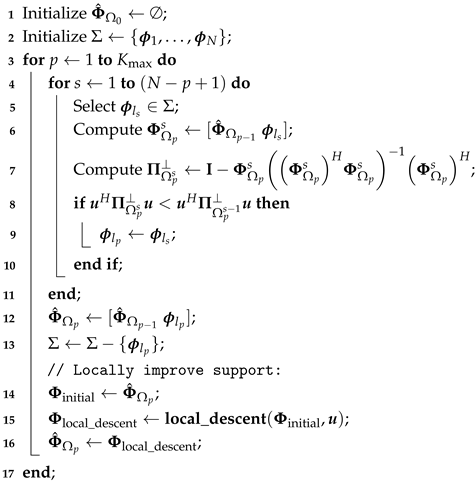
  • Initial sequential selection: The first stage of our methodology harnesses the strength of the Fast-Sup GLRT search to efficiently identify an initial estimate { Ω ^ p } p = 1 of the support set. This is achieved by minimizing { u H Π Ω p u } p = 1 . By doing so, the search is guided toward a promising region in the solution space.
  • Quasi-Newton optimization and refinement: Following the initial estimation, we employ a quasi-Newton optimization approach. The objective function to be minimized is:
    f P ( s , τ , v ) = u H Π Ω P u
    where Π Ω P = I Π Ω P with Π Ω P formulated as Φ Ω P Φ Ω P H Φ Ω P 1 Φ Ω P H , or in simplified manner as Φ Ω P Φ Ω P .
    The analytic gradients of the objective function with respect to the parameter vectors are:
    f P s = f P s 1 , , f P s i , , f P s P T
    f P τ = f P τ 1 , , f P τ i , , f P τ P T
    f P v = f P v 1 , , f P v i , , f P v P T
    To calculate these gradients, we first need to derive Π Ω P s i , Π Ω P τ i , and Π Ω P v i . Before simplification, they can be expressed by ([37]):
    Π Ω P s i = Φ Ω P s i Φ Ω P + Φ Ω P Φ Ω P s i
    Π Ω P τ i = Φ Ω P τ i Φ Ω P + Φ Ω P Φ Ω P τ i
    Π Ω P v i = Φ Ω P v i Φ Ω P + Φ Ω P Φ Ω P v i
    Using properties of the pseudoinverse and projection orthogonality, they become:
    Π Ω P s i = Π Ω P Φ Ω P s i Φ Ω P + Π Ω P Φ Ω P s i Φ Ω P H
    Π Ω P τ i = Π Ω P Φ Ω P τ i Φ Ω P + Π Ω P Φ Ω P τ i Φ Ω P H
    Π Ω P v i = Π Ω P Φ Ω P v i Φ Ω P + Π Ω P Φ Ω P v i Φ Ω P H
    The derivative of Φ Ω P , with respect to the parameters, affects only the corresponding column:
    Φ Ω P s i = 0 a ( s i , τ i , v i ) s i 0
    Φ Ω P τ i = 0 a ( s i , τ i , v i ) τ i 0
    Φ Ω P v i = 0 a ( s i , τ i , v i ) v i 0
    The steering vector derivatives are:
    a ( s i , τ i , v i ) s i = j 2 π ξ m a ( s i , τ i , v i )
    a ( s i , τ i , v i ) τ i = j 2 π ζ m a ( s i , τ i , v i )
    a ( s i , τ i , v i ) v i = j 2 π χ m a ( s i , τ i , v i )
    The complete gradient expressions for the objective function are:
    f P s i = Re u H Π Ω P Φ Ω P s i Φ Ω P + Π Ω P Φ Ω P s i Φ Ω P H u
    f P τ i = Re u H Π Ω P Φ Ω P τ i Φ Ω P + Π Ω P Φ Ω P τ i Φ Ω P H u
    f P v i = Re u H Π Ω P Φ Ω P v i Φ Ω P + Π Ω P Φ Ω P v i Φ Ω P H u
    For implementation purposes, we adopt the Broyden–Fletcher–Goldfarb–Shanno (BFGS) update strategy [38], implemented via MATLAB’s fminunc [39]. At each iteration ( j + 1 ) , the objective function is minimized in the updated support, refined by the previous optimization, with parameter updates expressed as:
    x j + 1 = x j + α j g j
    where the following parameters account for:
    • x j : the optimization variable at iteration j whose elements are
      s 1 τ 1 v 1 s i τ i v i s p τ p v p T
    • f P ( x j ) : the gradient of the objective function at iteration j having as elements f P s 1 f P τ 1 f P v 1 f P s i f P τ i f P v i f P s p f P τ p f P v p T
    • α j : the step size determined via a line search.
    • g j : the search direction expressed as B j 1 f ( x j ) .
    • B j : the Hessian approximation.
    The Hessian approximation is updated in each iteration using the BFGS formula:
    B j + 1 = B j + y j y j T z j T y j B j z j z j T B j z j T B j z j
    where z j and y j denote the step vector and the difference in gradients whose expressions are x j + 1 x j and f p ( x j + 1 ) f p ( x j ) , respectively.
    Since inverting B j at each iteration is computationally expensive, alternatively, one may directly update the inverse Hessian approximation ( H j = def B j 1 ) using:
    H j + 1 = ( I ρ j z j y j T ) H j ( I ρ j y j z j T ) + ρ j z j z j T , ρ j = 1 y j T z j .
  • Support Expansion: After each optimization cycle, the support set is expanded by incorporating an additional scatterer position identified through Fast-Sup GLRT while keeping the previously optimized positions. All identified scatterers then undergo re-optimization through the quasi-Newton optimization on the complete parameter set. This process of support expansion followed by joint re-optimization continues iteratively until the maximum number of scatterers is identified and localized.
To summarize, the proposed detector begins with an initial estimate, where the Fast-Sup GLRT test is applied under the assumption of a single scatterer. A local descent algorithm is then employed to improve the accuracy of the estimated scatterer position. The support is subsequently expanded by introducing an additional estimated scatterer using the Fast-Sup GLRT, followed by iterative refinement, in which all identified scatterers are re-optimized using a multidimensional local descent approach. The support expansion and local refinement steps are repeated until the maximum number of scatterers is effectively identified and localized.

4. Results

In this section, the performance of our proposed algorithm is compared to Fast-Sup GLRT. We selected the Fast-Sup GLRT as the primary comparison baseline due to its balance of theoretical robustness and practical feasibility for the TomoSAR scenario considered. While Atomic Norm Minimization (ANM) offers high-resolution, gridless reconstruction in theory, it assumes a uniform baseline distribution, a condition rarely met in practice. Interpolation to enforce uniformity introduces distortions that degrade detection accuracy. Moreover, ANM’s computational complexity is prohibitive, particularly in high-dimensional TomoSAR setups, and it lacks CFAR (Constant False Alarm Rate) compatibility due to its fixed model order requirement, making it unsuitable for fair comparison with GLRT-based detectors. The hybrid CS-GLRT approach, which combines an initial L1-minimization step with an exhaustive GLRT over a reduced support, partially alleviates the computational burden. However, the method still suffers from high complexity in 4D/5D TomoSAR applications due to the rapid growth of dictionary size and sparsity. Additionally, it requires the careful tuning of regularization parameters and is sensitive to Restricted Isometry Property (RIP) conditions, complicating threshold calibration and CFAR compliance.
The Fast-Sup GLRT is implemented with a height discretization step of 1 m and a thermal dilation step of 0.1 mm/°C. Since the initialization step of the proposed method also relies on Fast-Sup GLRT, we retain the same thermal dilation discretization. However, to accelerate the initial search, a coarser height discretization of 10 m is used, approximately equal to the Rayleigh resolution ( ρ ). The experimental study is conducted in two stages. First, simulated data are used, with parameters derived from a real dataset acquired by the TerraSAR-X (TSX) satellite. The corresponding system parameters are summarized in Table 1. In the second stage, a real TSX dataset is used to validate the simulation results and support final conclusions. In all experiments, the probabilities of false alarm and false detection are fixed at 10 3 .
It is important to note that deformation velocity is assumed to be negligible, as previous studies [19,35] have shown that deformation is minimal in the specific urban area covered by the real data used in this study, thereby supporting the validity of this assumption in our simulations. Of course, when present, the linear deformation term can couple with the thermal dilation term in the phase model. If not properly modeled and separated, this coupling may lead to a biased estimation of the thermal dilation coefficient. For this reason, the proposed method is derived in the general case where all terms, height, thermal dilation, and deformation, are included. However, for the purposes of the experiments presented, we exclude deformation without loss of generality.

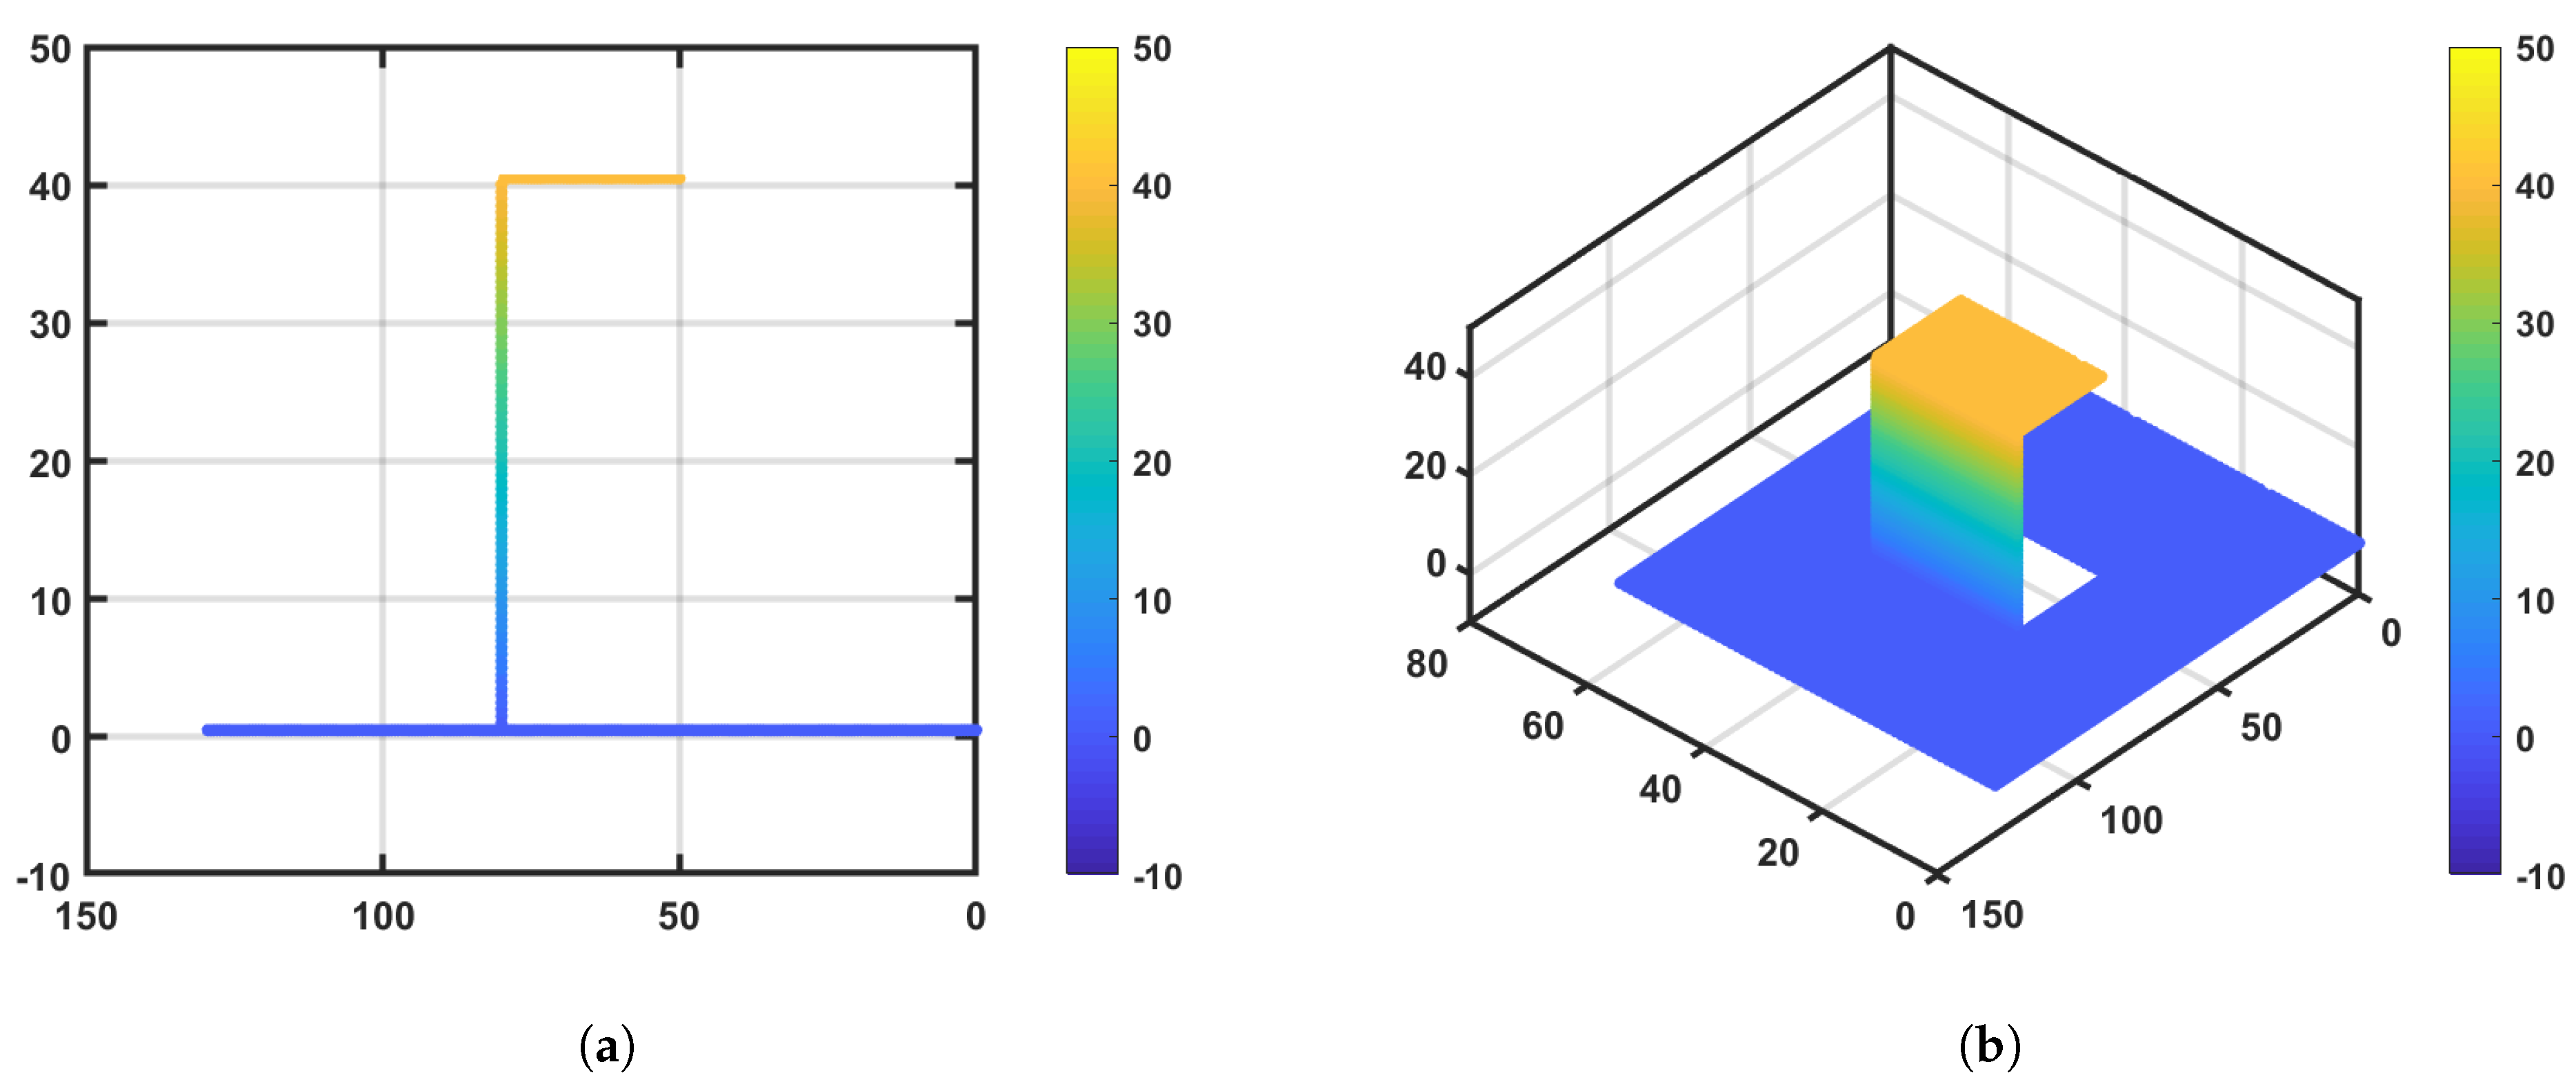
4.1. Simulated Results

With the aim of assessing the efficiency of our gridless detector, two types of simulations are considered: Monte Carlo simulation and urban-like structure simulation. In the first part of this theoretical study, by repeatedly simulating independent detection trials under different SNR conditions, Monte Carlo simulation enables the statistical analysis of the outcome displayed in Figure 2 and Figure 3.
First, the performance of the two detectors was evaluated in terms of the probability of detection P d 2 = P ( H 2 H 2 ) , where scenarios involving two scatterers (with equal magnitudes random phases and identical thermal dilation) were randomly placed on- and off-grid separated by distances d below and above the Rayleigh limit ρ . Figure 2a,b illustrate the detection performance as a function of SNR for two cases: well-separated scatterers ( 2 ρ ) and closely spaced scatterers ( 0.6 ρ ). For the former case, the performance of both Fast-Sup GLRT and the proposed detector is nearly identical, as expected, since detecting scatterers becomes easier with increasing separation. In contrast, for the latter case, our proposed detector demonstrates superior detection accuracy across all SNR values compared to the Fast-Sup GLRT.
Afterwards, we analyzed the detection performance behavior as a function of the normalized scatterer separation Δ s / ρ for a fixed SNR value of 10 dB. Figure 2c shows the probability of detection P d 2 under these conditions when the separation is ranging from 0.1 ρ to 2 ρ . For very closely spaced scatterers ( Δ s / ρ < 0.3 ), both methods struggled, resulting in low detection probabilities. As the separation increased from 0.3 ρ to 1.4 ρ , the proposed algorithm consistently outperformed the Fast-Sup GLRT, achieving higher detection rates. This improvement highlights the effectiveness of the proposed local refinement step, which enhances scatterer separation and detection performance in this range. Again for separations larger than 1.4 ρ , the performance gap between the two methods diminishes, with both approaches achieving near-perfect detection ( P d 2 1 ). This is consistent with the expectation that well-separated scatterers are inherently easier to detect.
After evaluating the detectors’ effectiveness in terms of detection, we analyzed the height and thermal dilation estimation accuracy, measured using the Root Mean Square Error (RMSE) as a function of SNR and the normalized scatterer separation, respectively. Figure 3a,b present the height RMSE versus SNR for two cases of well-separated scatterers ( 2 ρ ) and closely spaced scatterers ( 0.6 ρ ). In the former, the height RMSE remains stable with increasing SNR for the Fast-Sup GLRT, while the proposed detector consistently achieves a lower height RMSE, highlighting its superior accuracy. When the scatterer separation is below the Rayleigh limit (see Figure 3b), the height RMSE is slightly increasing with the SNR increase for the Fast-Sup GLRT, which can be considered as stability. This occurs because distinguishing closely spaced scatterers is inherently challenging as the algorithm sequentially fills the support, prioritizing immediate gains. It leads to suboptimal solutions that fail to fully exploit the benefits of higher SNR in cases of closely spaced scatterers. In contrast, our proposed detector achieves a better behavior, with a decreased height RMSE with increasing SNR.
Figure 3c shows the height RMSE versus the distance between scatterers for a fixed SNR value of 10 dB. A decreasing trend in height RMSE can be perceived as the distance between scatterers increases for both methods, as expected. However, the Fast-Sup GLRT exhibits some fluctuations, particularly in the range of small distances, while our proposed GLRT detector once again shows a smooth decrease and higher performance than the conventional one.
The same analysis was conducted for the thermal dilation estimation in Figure 3d–f. As the SNR increases, the thermal dilation RMSE decreases for both detectors in both closely and well-separated scatterer case scenarios. This is primarily due to the fact that both scatterers share the same thermal dilation, which explains why the estimation is not significantly affected by changes in scatterer distance whether it is above (see Figure 3d) or below (see Figure 3e) the Rayleigh resolution. This observation is further confirmed by the plot in Figure 3f. Moreover, the proposed gridless detector achieves better accuracy in estimating thermal dilation compared to the Fast-Sup GLRT.
In the second part of this theoretical study, a 3D structure approximating an urban building was simulated, where different levels of sparsity are considered within each resolution cell. In addition to that, randomly varying thermal dilation values have been attributed to the scatterers, ensuring that the ones within a given resolution cell share the same thermal dilation coefficient. The same system parameters outlined in Table 1 were considered for this simulation, with an SNR value set equal to 13 dB. Figure 4 shows the side and top lateral views of our simulated building.
Figure 5 and Figure 6 depict, respectively, the side and lateral top views of the 3D point clouds generated using both detectors. At first glance, the building’s structure is clearly discernible in all cases. Nevertheless, the Fast-Sup GLRT detector fails to accurately preserve its shape, specifically the top and bottom edges where the facade connects to the roof and ground. As shown clearly in Figure 5a, these parts appear curved and widened. In addition to that, the Fast-Sup point clouds exhibit a higher number of outliers and scatterers that deviate from their expected positions, as observed in both Figure 5a and Figure 6a.
The proposed method, on the other hand, shows a much better outcome than the classical detector, particularly when it comes to getting rid of outliers and accurately estimating height, as illustrated in the (b) subfigures of Figure 5 and Figure 6. Furthermore, it excels in accurately delineating the boundaries between the roof and the walls. The edges remain sharp and well-defined, preserving the building’s structural integrity when compared to the reference in Figure 4.
Quantitative evaluation supports this analysis through the computation of height accuracy and completeness, along with thermal dilation accuracy metrics. The results summarized in Table 2 indicate that our proposed detector achieves the smallest accuracy and completeness scores, which confirm its advantages in terms of 3D and 4D reconstruction quality. In terms of computational efficiency, the running time is also displayed in the same table showing the superiority of gridless GLRT over the classical one. Despite the fact that the proposed method relies on Fast-Sup (which is more expensive due to the fine discretization required) during the initialization stage, it is approximately 2.3 times faster than the Fast-Sup detector. This is due to the choice of cost-effective 10 m initialization by our proposed method, which offers a favorable trade-off between accuracy and computational cost.

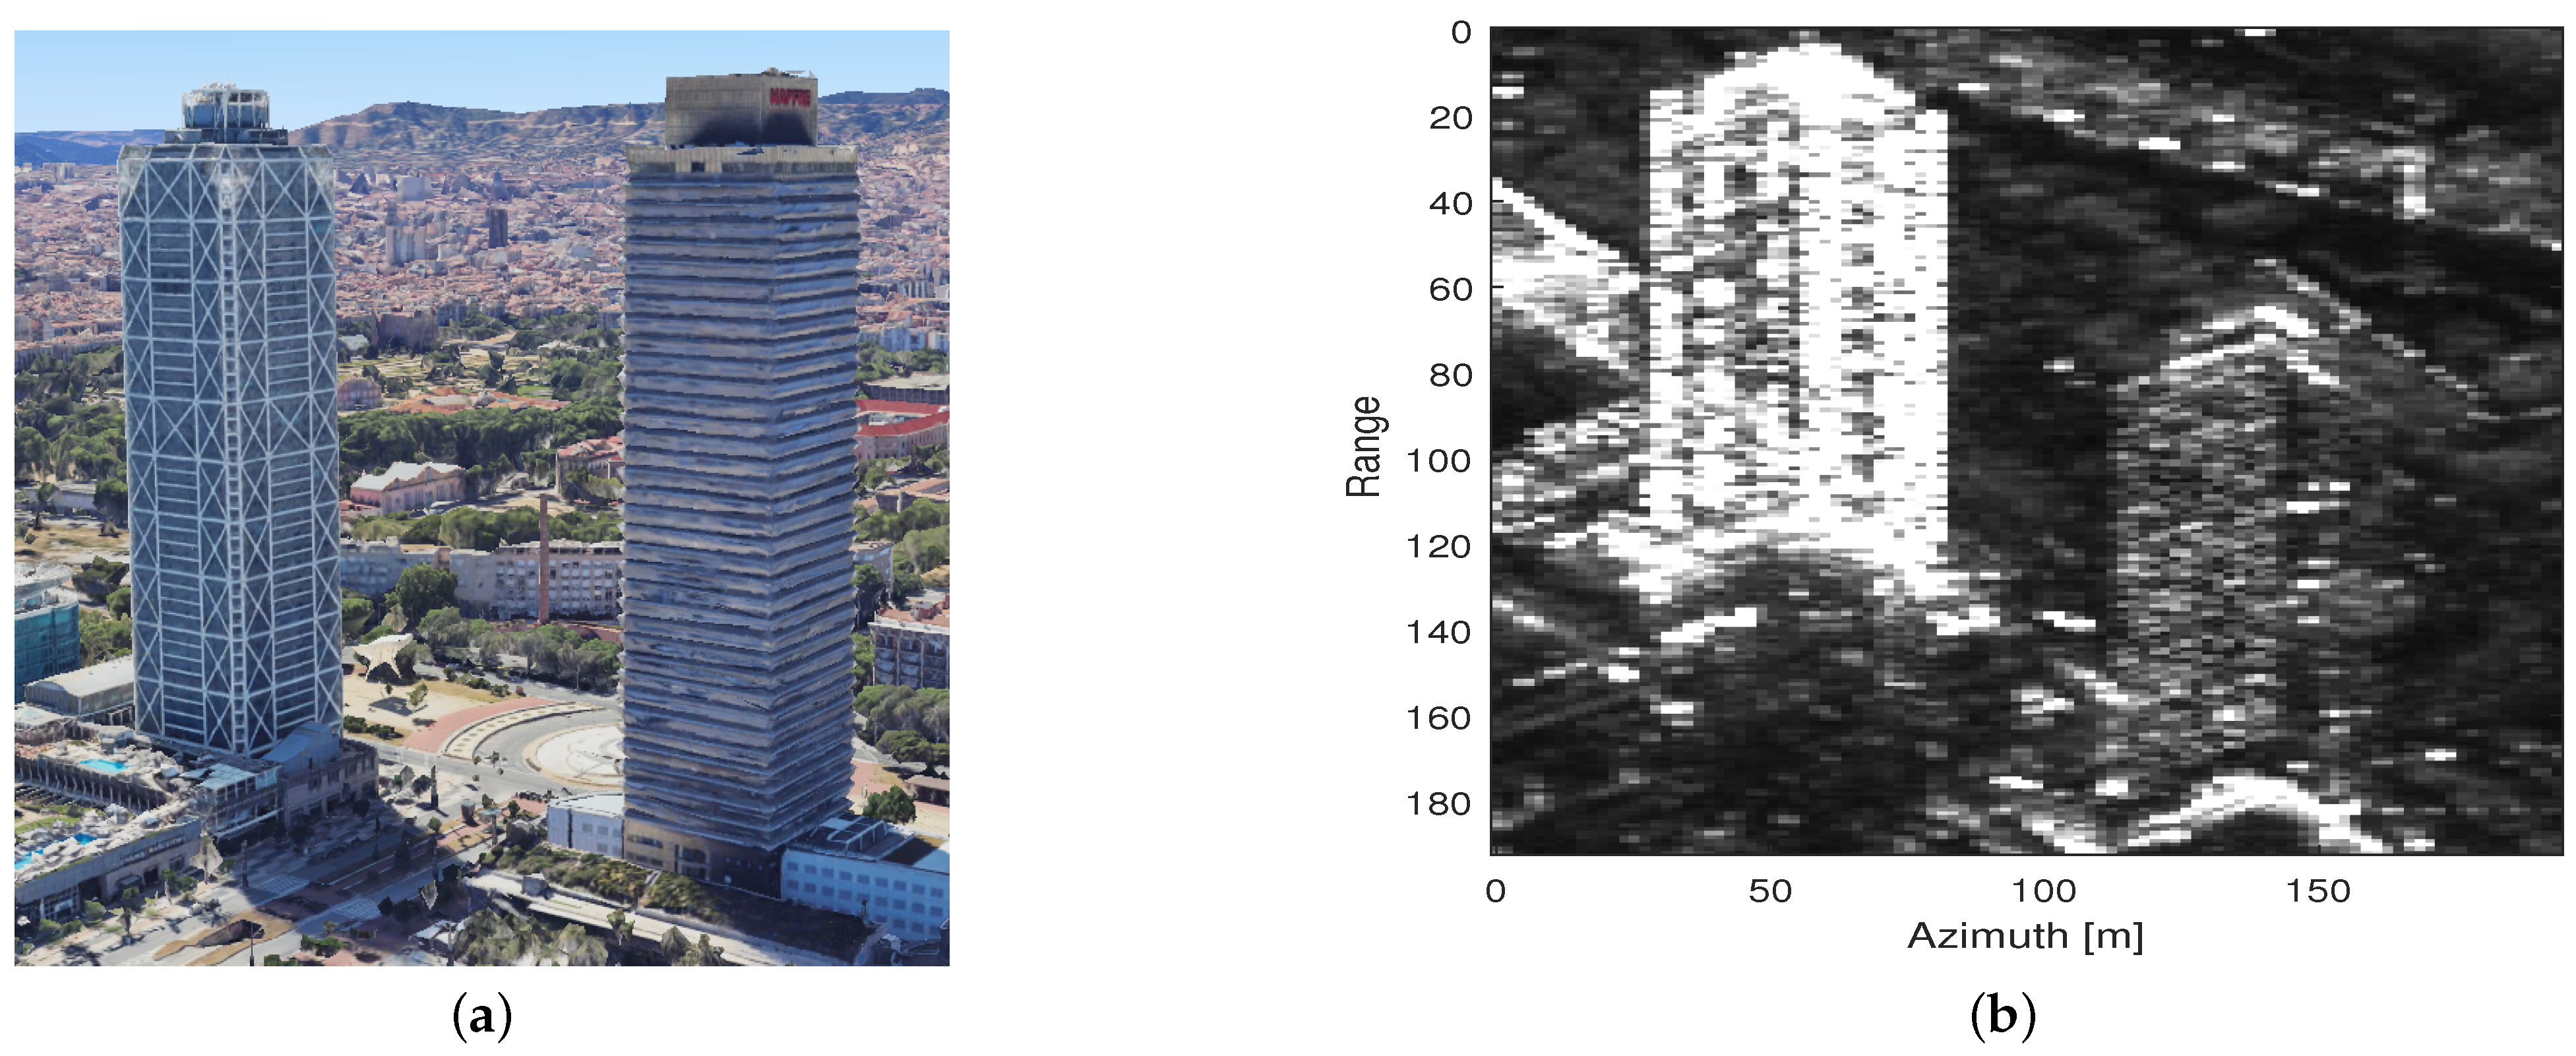
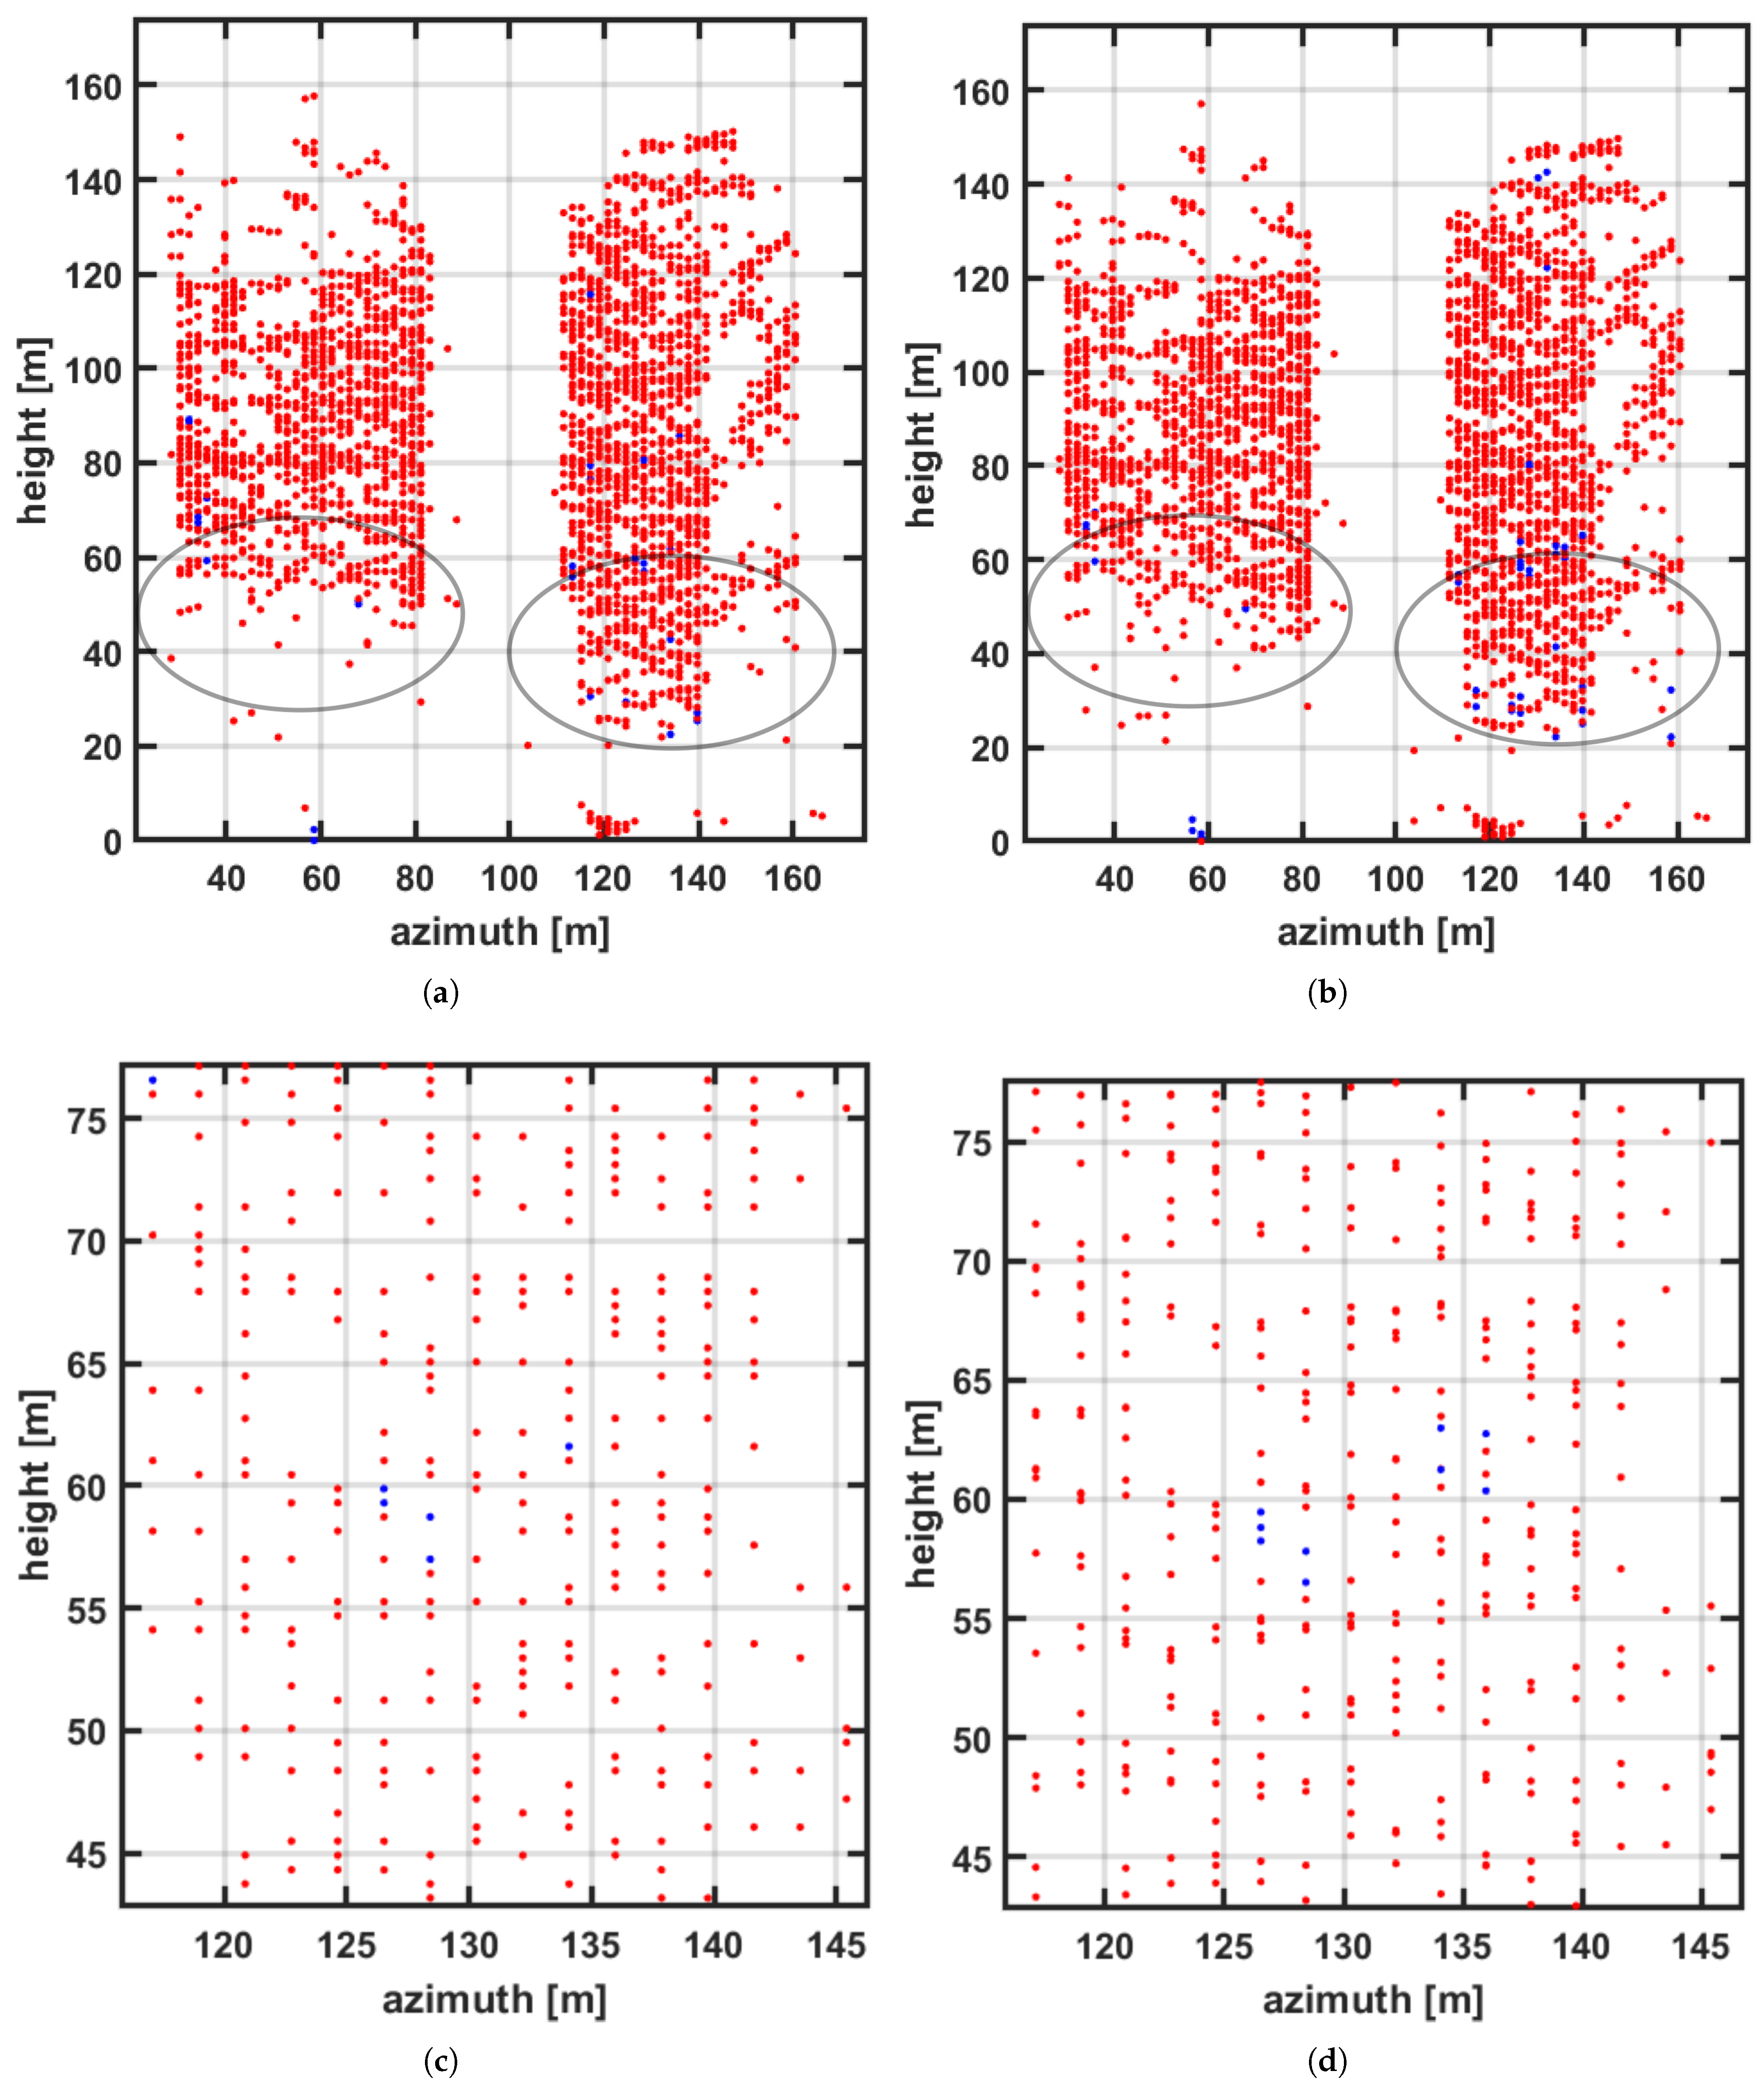
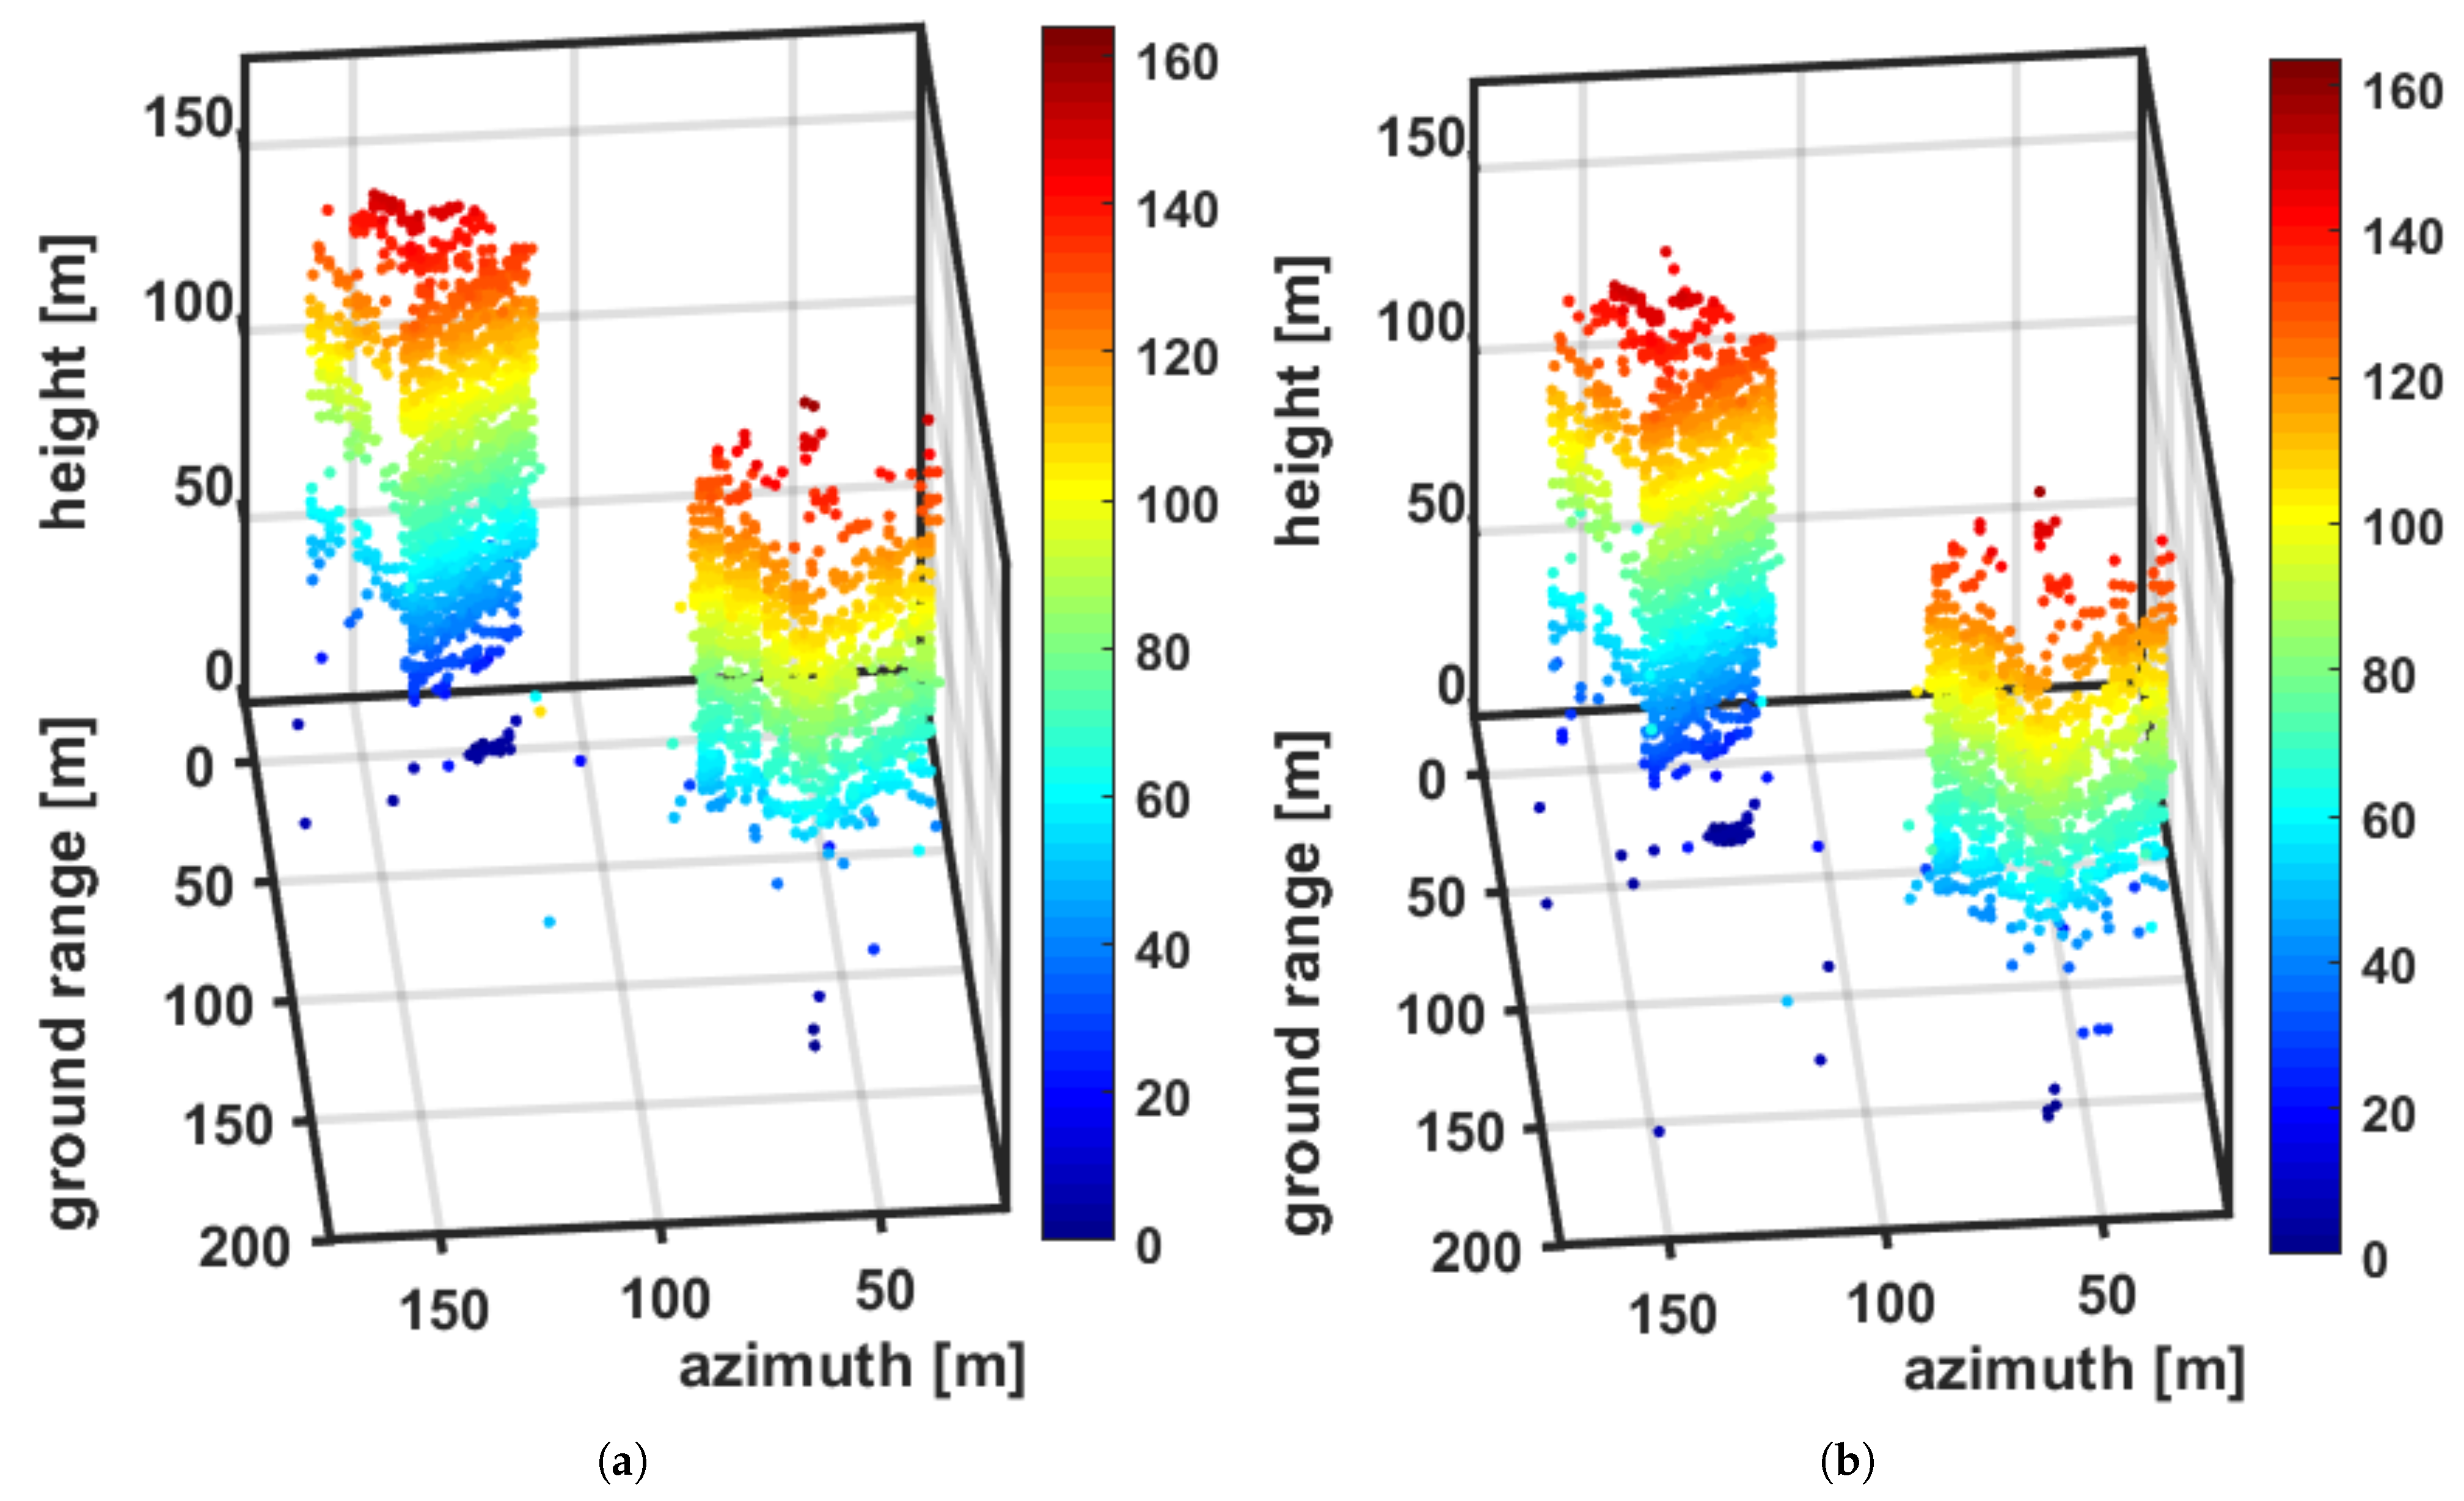
4.2. Experimental Results

With the aim of validating our conclusions derived from simulated data analysis, we applied both detectors to a stack of 28 TSX images covering the Mapfre tower and the Arts Hotel, located in Barcelona, Spain. The system parameters are displayed in Table 3. These two skyscrapers represent a challenging yet insightful case study due to their structural complexity, material properties, and urban surroundings. Both towers have a modern architectural design featuring glass, metal, and reinforced concrete. Mapfre has a reflective glass facade, while Arts Hotel has a more intricate exoskeleton structure with exposed metallic elements, potentially introducing multipath effects and producing strong radar returns. They are surrounded by roads, smaller buildings, and open spaces, creating a mixture of strong and weak scatterers. In Figure 7, the optical view from Google Earth alongside the SAR mean amplitude map are displayed to illustrate the suitability of such a test site in assessing the algorithms’ robustness.
In Figure 8a,b, we represented the 3D point clouds generated using the Fast-Sup GLRT and the proposed detector projected onto the azimuth-height plane. Pixels with single scatterers are shown in red, whereas those with double scatterers are depicted with the first scatterer in blue and the second one in green. To enhance visibility, a region within each point cloud bottom side was enlarged (see Figure 8c,d) for a detailed comparison of the scatterers’ positions. It can be seen that the Fast-Sup GLRT provides a uniform separation between different scatterers’ estimated heights, a flaw induced by the grid. In contrast, the proposed detector furnishes a more natural separation between different scatterers’ estimated heights. The ability of our proposed algorithm to avoid the off-grid effect by allowing for a continuous range of scatterer locations enables more accurate height estimations. The enhancement in detection performance is observed in the whole scene as well as in the lower sections of both buildings within the circled regions.
The complete 3D point cloud view representing the reconstructed scene’s height as well as thermal dilation generated by both detectors is illustrated in Figure 9 and Figure 10. The view angle was selected so scatterers located on the two building facades facing the sensor can be visible. It can be perceived that Mapfre’s side with weak backscattering along with the bottom part of the Art Hotel’s sides show fewer points’ distribution in height and thermal dilation estimates. The gradation of towers’ heights for both detectors is accurate since the highest value is equal to 154 m, which corresponds to the ground truth value (see Figure 9). Visually, the superiority of our gridless detector can be seen only for its reduced outlier presence compared to the Fast-Sup method.
Similarly, it can be observed from the 3D point clouds of Figure 10 that a high density of scatterers has dilation values primarily ranging from −1.5 mm/°C to 1.5 mm/°C. Within this range, most values are concentrated between −0.5 mm/°C and 0.5 mm/°C. For reference, the Art Hotel and the Mapfre Tower have, respectively, a theoretical thermal dilation of approximately 1.85 mm/°C and 1.54 mm/°C based on their respective characteristics (steel and reinforced concrete for construction materials as well as 154 m as a height for both structures). The observed values are consistent with these theoretical bounds and align with previous studies on the same buildings in [19,35]. The observations also indicate subtle variations in thermal expansion and contraction across the analyzed buildings. The same grid artifact is exhibited by Fast-Sup GLRT, while it is mitigated by our proposed detector since the separation between scatterers’ dilations is correspondingly even and uneven.
To quantitatively assess this qualitative analysis, we calculated the number of detected scatterers. The findings laid out in Table 4 confirm our previous observations since the highest number of detected single and double scatterers belongs to our proposed gridless GLRT. Another review consistent with our prior takeaway is the execution time shown in Table 5, where the proposed algorithm exhibits a better outcome. The scene’s reconstruction was approximately five times as fast as that of Fast-Sup GLRT, which underscores again the efficiency of our proposed approach. Furthermore, the calculated completeness and R-squared in Table 5 provide additional insight into the performance of both detectors in terms of height estimation. In this context, lower completeness values reflect smaller average distances between the detected and true scatterer positions, thus indicating better performance. The proposed method achieves a lower completeness score compared to Fast-Sup, confirming a closer match to the ground truth. The proposed algorithm demonstrates a higher R-squared value than Fast-Sup, further confirming its overall superior fit between the estimated and true height values. These results reinforce the conclusion that our proposed gridless GLRT offers improved detection accuracy and reconstruction quality.

5. Discussion

Our analysis concluded that the proposed gridless GLRT detector provides better 3D/4D reconstruction accuracy compared to the Fast-Sup GLRT method. This can be explained by the fact that the classical Fast-Sup relies on specific conditions to work properly, such as the steering matrix being square and orthogonal. These conditions are typically met when the baseline distribution is uniform and the number of measurements M equals the number of grid points N. In realistic scenarios, where these assumptions do not hold, its performance degrades. In contrast, the proposed algorithm achieves improved performance through its local descent step, which refines the initial Fast-Sup GLRT solution while mitigating the overestimation of scatterers (a common issue with off-grid targets). Additionally, the reduced computational burden makes our proposed method a practical choice for large-scale applications.

6. Conclusions

Accurately estimating the height, thermal dilation coefficient, and deformation velocity of man-made infrastructures from TomoSAR data is essential for urban mapping and monitoring. However, this task remains challenging due to the presence of outliers and the limitations of grid-based methods. In this paper, we address these challenges by introducing a method that combines Fast-Sup GLRT with local descent optimization, operating directly in the continuous domain to eliminate discretization errors and reduce computational costs. Experimental validation using both simulated and real TerraSAR-X datasets demonstrates the proposed method’s ability to improve scatterer localization accuracy in the third (height) and fourth (thermal dilation) dimensions, while preserving computational efficiency. These advancements provide a robust and scalable solution for practical deployment, highlighting the potential of continuous-domain processing in advancing urban TomoSAR applications.

Author Contributions

Conceptualization, N.H., K.H.-R., A.B. and G.S.; methodology, N.H., K.H.-R., A.B. and G.S.; writing—original draft preparation, N.H.; writing—review and editing, K.H.-R., A.B. and G.S. All authors have read and agreed to the published version of the manuscript.

Funding

This research received no external funding.

Data Availability Statement

The TerraSAR-X data are © DLR 2007–2010. The data can be provided to projects with a scientific purpose upon submission of a proposal at https://sss.terrasar-x.dlr.de/.

Conflicts of Interest

The authors declare no conflicts of interest.

References

  1. Budillon, A.; Schirinzi, G. Remote monitoring of civil infrastructure based on TomoSAR. Infrastructures 2022, 7, 52. [Google Scholar] [CrossRef]
  2. Fornaro, G.; Pauciullo, A.; Pascazio, V.; Schirinzi, G.; Reale, D. Multi-Dimensional Imaging with Synthetic Aperture Radar; Elsevier: Amsterdam, The Netherlands, 2024. [Google Scholar]
  3. Rambour, C.; Budillon, A.; Johnsy, A.C.; Denis, L.; Tupin, F.; Schirinzi, G. From Interferometric to Tomographic SAR: A Review of Synthetic Aperture Radar Tomography-Processing Techniques for Scatterer Unmixing in Urban Areas. IEEE Geosci. Remote Sens. Mag. 2020, 8, 6–29. [Google Scholar] [CrossRef]
  4. Omati, M.; Sahebi, M.R.; Aghababaei, H. Evaluation of nonparametric SAR tomography methods for urban building reconstruction. IEEE Geosci. Remote Sens. Lett. 2021, 19, 4013605. [Google Scholar] [CrossRef]
  5. Hadj-Rabah, K.; Schirinzi, G.; Budillon, A.; Hocine, F.; Belhadj-Aissa, A. Non-Parametric Tomographic SAR Reconstruction via Improved Regularized MUSIC. Remote Sens. 2023, 15, 1599. [Google Scholar] [CrossRef]
  6. Schmitt, M.; Stilla, U. Maximum-likelihood-based approach for single-pass synthetic aperture radar tomography over urban areas. IET Radar Sonar Navig. 2014, 8, 1145–1153. [Google Scholar] [CrossRef]
  7. Haddad, N.; Bouaraba, A.; Hadj-Rabah, K.; Budillon, A.; Harkati, L.; Schirinzi, G. Generalized Parametric Iterative Approach for Tomographic SAR Reconstruction. IEEE Geosci. Remote Sens. Lett. 2024, 21, 4011005. [Google Scholar] [CrossRef]
  8. Armeshi, H.; Sahebi, M.R.; Aghababaei, H. A deterministic descriptive regularization-based method for SAR tomography in urban areas. Int. J. Remote Sens. 2024, 45, 1884–1903. [Google Scholar] [CrossRef]
  9. Budillon, A.; Evangelista, A.; Schirinzi, G. Three-Dimensional SAR Focusing From Multipass Signals Using Compressive Sampling. IEEE Trans. Geosci. Remote Sens. 2011, 49, 488–499. [Google Scholar] [CrossRef]
  10. Zhu, X.X.; Bamler, R. Tomographic SAR inversion by L1-norm regularization—The compressive sensing approach. IEEE Trans. Geosci. Remote Sens. 2010, 48, 3839–3846. [Google Scholar] [CrossRef]
  11. Zhu, X.X.; Bamler, R. Let’s do the time warp: Multicomponent nonlinear motion estimation in differential SAR tomography. IEEE Geosci. Remote Sens. Lett. 2011, 8, 735–739. [Google Scholar] [CrossRef]
  12. De Maio, A.; Fornaro, G.; Pauciullo, A. Detection of single scatterers in multidimensional SAR imaging. IEEE Trans. Geosci. Remote Sens. 2009, 47, 2284–2297. [Google Scholar] [CrossRef]
  13. Pauciullo, A.; Reale, D.; De Maio, A.; Fornaro, G. Detection of double scatterers in SAR tomography. IEEE Trans. Geosci. Remote Sens. 2012, 50, 3567–3586. [Google Scholar] [CrossRef]
  14. Budillon, A.; Schirinzi, G. GLRT based on support estimation for multiple scatterers detection in SAR tomography. IEEE J. Sel. Top. Appl. Earth Obs. Remote Sens. 2015, 9, 1086–1094. [Google Scholar] [CrossRef]
  15. Budillon, A.; Johnsy, A.C.; Schirinzi, G. A fast support detector for superresolution localization of multiple scatterers in SAR tomography. IEEE J. Sel. Top. Appl. Earth Obs. Remote Sens. 2017, 10, 2768–2779. [Google Scholar] [CrossRef]
  16. Reale, D.; Fornaro, G.; Pauciullo, A. Extension of 4-D SAR imaging to the monitoring of thermally dilating scatterers. IEEE Trans. Geosci. Remote Sens. 2013, 51, 5296–5306. [Google Scholar] [CrossRef]
  17. Budillon, A.; Johnsy, A.C.; Schirinzi, G. 4-D SAR Support Based Tomographic Imaging. In Proceedings of the EUSAR 2016: 11th European Conference on Synthetic Aperture Radar, Hamburg, Germany, 6–9 June 2016; pp. 1–4. [Google Scholar]
  18. Budillon, A.; Johnsy, A.C.; Schirinzi, G. Support-detection 5-D SAR tomography. In Proceedings of the 2016 IEEE International Geoscience and Remote Sensing Symposium (IGARSS), Beijing, China, 10–15 July 2016; pp. 7407–7410. [Google Scholar]
  19. Budillon, A.; Johnsy, A.C.; Schirinzi, G. Extension of a fast GLRT algorithm to 5D SAR tomography of Urban areas. Remote Sens. 2017, 9, 844. [Google Scholar] [CrossRef]
  20. Pauciullo, A.; Reale, D.; Franzé, W.; Fornaro, G. Multi-look in GLRT-based detection of single and double persistent scatterers. IEEE Trans. Geosci. Remote Sens. 2018, 56, 5125–5137. [Google Scholar] [CrossRef]
  21. Luo, H.; Li, Z.; Dong, Z.; Yu, A.; Zhang, Y.; Zhu, X. Super-resolved multiple scatterers detection in SAR tomography based on compressive sensing generalized likelihood ratio test (CS-GLRT). Remote Sens. 2019, 11, 1930. [Google Scholar] [CrossRef]
  22. Luo, H.; Dong, Z.; Li, Z.; Yu, A. Iterative-SGLRT for multiple-scatterer detection in SAR tomography. IEEE Geosci. Remote Sens. Lett. 2020, 18, 122–126. [Google Scholar] [CrossRef]
  23. Zhu, X.; Yu, A.; Dong, Z.; Wu, M.; Liu, Q. Off-grid correction for improving scatterer localization performance in compressive sampling SAR tomography. Sci. China Inf. Sci. 2021, 64, 129302. [Google Scholar] [CrossRef]
  24. Budillon, A.; Ferraioli, G.; Schirinzi, G. Localization performance of multiple scatterers in compressive sampling SAR tomography: Results on COSMO-SkyMed data. IEEE J. Sel. Top. Appl. Earth Obs. Remote Sens. 2014, 7, 2902–2910. [Google Scholar] [CrossRef]
  25. Bang, D.; Xiaolan, Q.; Zhe, Z.; Bin, L.; Chibiao, D. L1 Minimization with Perturbation for Off-grid Tomographic SAR Imaging. J. Radars 2021, 11, 62–70. [Google Scholar]
  26. Guo, Q.; Liang, X.; Li, Y.; Dai, Y. A Novel Method for Airborne Array-InSAR Tomography Based on Off-grid Target Modeling and Group Sparsity. IEEE Geosci. Remote Sens. Lett. 2024, 21, 3505205. [Google Scholar] [CrossRef]
  27. Yu, L.; Feng, D.; Wang, J.; Huang, X. An efficient reconstruction approach based on atomic norm minimization for coprime tomographic SAR. IEEE Geosci. Remote Sens. Lett. 2022, 19, 4503705. [Google Scholar] [CrossRef]
  28. Wang, X.; Xu, F. Tomographic SAR Inversion by Atomic-Norm Minimization—The Gridless Compressive Sensing Approach. IEEE Trans. Geosci. Remote Sens. 2022, 60, 5239113. [Google Scholar] [CrossRef]
  29. Gao, S.; Zhang, Z.; Zhang, B.; Wu, Y. Gridless tomographic SAR imaging based on accelerated atomic norm minimization with efficiency. In Proceedings of the International Conference on Radar Systems (RADAR 2022), Hybrid Conference, Edinburgh, UK, 24–27 October 2022. [Google Scholar]
  30. Wang, X.; Xu, F. Efficient ADMM Algorithm for Atomic Norm Minimization in SAR Tomography. IEEE Trans. Geosci. Remote Sens. 2024, 62, 5211415. [Google Scholar] [CrossRef]
  31. Liu, M.; Wang, Y.; Ding, Z.; Li, L.; Zeng, T. Atomic Norm Minimization Based Fast Off-Grid Tomographic SAR Imaging with Nonuniform Sampling. IEEE Trans. Geosci. Remote Sens. 2024, 62, 5203517. [Google Scholar] [CrossRef]
  32. Shao, M.; Zhang, Z.; Li, J.; Kang, J.; Zhang, B. TADCG: A Novel Gridless Tomographic SAR Imaging Approach based on the Alternate Descent Conditional Gradient Algorithm with Robustness and Efficiency. IEEE Trans. Geosci. Remote Sens. 2023, 62, 5201213. [Google Scholar] [CrossRef]
  33. Shi, R.; Zhang, Z.; Qiu, X.; Ding, C. A Novel Gradient Descent Least Squares (GDLS) Algorithm for Efficient Gridless Line Spectrum Estimation with Applications in Tomographic SAR Imaging. IEEE Trans. Geosci. Remote Sens. 2023, 61, 5208313. [Google Scholar] [CrossRef]
  34. Haddad, N.; Budillon, A.; Hadj-Rabah, K.; Bouaraba, A.; Harkati, L.; Benbouzid, M.A.; Schirinzi, G. Gridless GLRT for Tomographic SAR Detection Using Particle Swarm Optimization Algorithm. IEEE Geosci. Remote Sens. Lett. 2024, 21, 4019205. [Google Scholar] [CrossRef]
  35. Crosetto, M.; Monserrat, O.; Cuevas-González, M.; Devanthéry, N.; Luzi, G.; Crippa, B. Measuring thermal expansion using X-band persistent scatterer interferometry. ISPRS J. Photogramm. Remote Sens. 2015, 100, 84–91. [Google Scholar] [CrossRef]
  36. Seker, I.; Lavalle, M. Tomographic performance of multi-static radar formations: Theory and simulations. Remote Sens. 2021, 13, 737. [Google Scholar] [CrossRef]
  37. Golub, G.H.; Pereyra, V. The differentiation of pseudo-inverses and nonlinear least squares problems whose variables separate. SIAM J. Numer. Anal. 1973, 10, 413–432. [Google Scholar] [CrossRef]
  38. Nocedal, J.; Wright, S.J. Numerical Optimization, 2nd ed.; Springer: New York, NY, USA, 2006. [Google Scholar]
  39. The MathWorks Inc. Optimization Toolbox User’s Guide, Version 9.4 (R2022b); The MathWorks Inc.: Natick, MA, USA, 2022; Available online: https://www.mathworks.com/help/optim/ (accessed on 9 March 2025).
Figure 1. Tomographic SAR geometry.
Remotesensing 17 02334 g001
Figure 2. The probability of detection: (a) P d 2 = P ( H 2 H 2 ) vs. SNR for d = 2 ρ , (b) P d 2 = P ( H 2 H 2 ) vs. SNR for d = 0.6 ρ , (c) P d 2 = P ( H 2 H 2 ) vs. Δ s / ρ for SNR = 10 dB.
Remotesensing 17 02334 g002
Figure 3. The height RMSE vs. SNR for (a) d = 2 ρ and (b) d = 0.6 ρ . (c) The height RMSE vs. Δ s / ρ for SNR = 10 dB. The thermal dilation vs. SNR for (d) d = 2 ρ and (e) d = 0.6 ρ . (f) The thermal dilation vs. Δ s / ρ for SNR = 10 dB.
Remotesensing 17 02334 g003
Figure 4. Simulated reference urban-like structure displayed with a (a) side and (b) lateral top views.
Remotesensing 17 02334 g004
Figure 5. Side view of the 3D point cloud representing the reconstructed building’s height obtained using (a) Fast-Sup GLRT and (b) the proposed detectors.
Remotesensing 17 02334 g005
Figure 6. Lateral top view of the 3D point cloud representing the reconstructed building’s height obtained using (a) Fast-Sup GLRT and (b) the proposed detectors.
Remotesensing 17 02334 g006
Figure 7. (a) Google Earth’s optical image of the towers, and (b) the SAR mean amplitude map of the scene.
Remotesensing 17 02334 g007
Figure 8. Detected scatterers of the whole scene using (a) Fast-Sup GLRT and (b) Proposed detector. Detected scatterers in a zoomed area using (c) Fast-Sup GLRT and (d) Proposed detector.
Remotesensing 17 02334 g008
Figure 9. Three-dimensional point cloud representing the reconstructed scene’s height obtained using (a) Fast-Sup GLRT and (b) Proposed detectors.
Remotesensing 17 02334 g009
Figure 10. Three-dimensional point cloud representing the reconstructed scene’s thermal dilation obtained using (a) Fast-Sup GLRT and (b) Proposed detectors.
Remotesensing 17 02334 g010
Table 1. System parameters of simulated data.
ParameterQuantity
Wavelength 0.0311 [m]
Incidence angle 28.75 °
Range Distance 579.4 [km]
Number of images27
Total Baseline 751.6 [m]
Table 2. Evaluation metrics.
DetectorHeight AccuracyHeight CompletenessThermal Dilation AccuracyComputational Time
[m][m][mm/°C][s]
Fast-Sup0.66890.82390.028951335.7
Proposed0.24460.23870.01031511.4
Table 3. System parameters of our real data.
ParameterQuantity
Wavelength 0.0311 [m]
Range Distance618 [km]
Number of images28
Total Baseline 506.32 [m]
Vertical Resolution19 [m]
Table 4. Number of detected scatterers.
Fast-SupProposed
Single Scatterers26242708
Double Scatterers1823
Table 5. Evaluation metrics.
DetectorTime [s]CompletenessR-Squared
Fast-Sup5856.40.13240.9813
Proposed1235.10.11510.9946
Disclaimer/Publisher’s Note: The statements, opinions and data contained in all publications are solely those of the individual author(s) and contributor(s) and not of MDPI and/or the editor(s). MDPI and/or the editor(s) disclaim responsibility for any injury to people or property resulting from any ideas, methods, instructions or products referred to in the content.

