1. Introduction
Unprecedented rates of deforestation globally represent one of the most pressing environmental challenges. According to the Food and Agriculture Organization, an annual loss of 5 million hectares of forests was reported globally from 2015 to 2020, pointing towards the urgent need for enhanced monitoring and intervention strategies [
1]. Beyond tree loss, this crisis is encroaching upon climate stability, biological diversity, and human livelihood. Tropical forest loss has reached an alarming magnitude. Research conducted by Flores et al. states that tropical forests are at a tipping point, where future losses can accelerate the deforestation process [
2]. This kind of deforestation immensely impacts global climate systems, contributing about 15% of global greenhouse gas emissions according to the Intergovernmental Panel on Climate Change [
3]. More concerning is the carbon stored in trees being released due to their clearing, creating a vicious cycle that fosters climate change and allows for remaining forests to be even more prone to destruction.
Beveridge et al. have suggested that the “Andes–Amazon–Atlantic” (AAA) water pathway is stretched beyond its capacity, leading to possible collapse. If this occurs, their modeling work predicts that great expanses of the Amazon will transform into savanna, producing massive consequences for climate and biodiversity further afield [
4]. Matricardi et al. have recently provided unambiguous evidence that gives a stark picture of this crisis; 17% of the Amazon has been lost in just five decades, plus another 17% of those remaining forests experience enormous degradation [
5]. The economic consequences of deforestation reach far beyond the immediate loss of forest resources [
6]. According to Wang et al., the global forest ecosystem service is valued at around 1.85 times the global GDP, which includes USD 1 trillion annually for critical functions like carbon sequestration, water regulation, and biodiversity maintenance [
7]. The World Bank adds that over 1.6 billion people who directly depend on forests for their livelihood are, therefore, threatened by deforestation, emphasizing the human aspect of the crisis [
8].
A holistic approach that includes technological solutions, interventions, and community engagement is needed to address the deforestation crisis. The United Nations REDD+ program is a good example of this approach, which pays for forest conservation and promotes sustainable development. As noted by Angelsen et al., successful implementation of such programs is largely contingent on credible monitoring and verification systems. Angelsen et al. argue that the durability of results-based forest protection schemes such as REDD+ rests squarely on the integrity of their measurement, reporting, and verification architecture. A credible system, they contend, must first deliver wall-to-wall, IPCC-compliant estimates of forest area change derived from satellite imagery and pair these with statistically sound ground inventories of carbon stocks. It must then make both the raw data and the intermediate processing steps fully transparent so that third-party auditors can independently verify the numbers and detect any inflated baselines or double counting. Equally important is a tight, auditable link between verified performance and payments; without this link, the initiative risks reverting to the logic of input-based aid and losing its results-based character. Finally, because fewer than one-fifth of tropical non-Annex I countries possess the necessary reception infrastructure, cloud-free image archives or trained inventory personnel, Angelsen et al. call for phased capacity-building roadmaps that develop satellite, inventory, and institutional competencies in parallel with policy rollout. Their comparison of Brazil’s PRODES/DEGRAD system—which publishes annual Amazon deforestation alerts and has become a global benchmark—with countries lacking real-time monitoring underscores the information need for surveillance [
9].
The introduction of deep learning methods marked a paradigm shift in deforestation monitoring capabilities. Advanced monitoring systems using satellite imagery and artificial intelligence are an important step toward solving this problem at the global level. These technologies allow for the detection of deforestation events in near real time, facilitating fast responses and interventions. Reiche et al. illustrate how using satellite imagery in conjunction with machine learning algorithms ensures unprecedented accuracy and speed in detecting deforestation events [
10]. The combination of different satellite platforms, such as Sentinel-2 and Landsat-8, guarantees complete coverage and detail at the spectral resolution required for efficient forest monitoring. The transition from traditional machine learning approaches to deep neural networks has revolutionized how we process and analyze satellite imagery. Implementation details of these systems reveal sophisticated architectural choices and optimization strategies crucial for real-world deployment. Zhang et al. pioneered the use of convolutional neural networks (CNNs) for image segmentation, achieving breakthrough performance improvements over traditional methods [
11]. Their implementation demonstrated accuracy rates exceeding 82% in test regions, though generalization to different landscapes remained challenging. The architecture employed a multi-scale feature extraction approach using a hierarchy of convolutional layers with varying receptive fields in meters (3 × 3, 5 × 5, and 7 × 7), along with batch normalization and dropout layers to mitigate overfitting.
U-Net architectures, first introduced by Ronneberger et al., revolutionized semantic segmentation for satellite imagery analysis [
12]. While originally developed for medical image segmentation, these models have proven effective in handling the spatial complexity of forest landscapes, incorporating key technical innovations such as multi-resolution feature extraction, adaptive feature fusion, boundary refinement, and specialized loss functions to address class imbalance. Zhang et al. extended this architecture by incorporating a Pyramid Feature Extraction module (PFE) to reduce overfitting [
13]. Long Short-Term Memory (LSTM) networks brought new capabilities for analyzing temporal patterns in forest change. Jamshed et al. demonstrated their effectiveness in capturing seasonal variations and long-term trends in forest cover changes, achieving temporal accuracy rates of 95% [
14]. The emergence of transformer-based architecture has provided another leap forward in deforestation monitoring capabilities. Bazi et al. demonstrated remarkable success with vision transformers (ViTs) adapted specifically for satellite imagery, achieving accuracy rates of 93% in the NWPU dataset [
15]. Self-supervised learning approaches have also gained traction, with Chen et al. pioneering novel pre-training strategies that significantly improve model generalization across different satellite datasets [
16]. The MapBiomas initiative (Souza et al.) represents a landmark achievement in comprehensive forest monitoring. Their approach combines multiple satellite platforms with sophisticated machine learning techniques to create annual land use maps across diverse Brazilian biomes [
17].
Recent years have witnessed a rapid evolution of deep learning approaches for monitoring forest disturbances, yet each strand of the literature still leaves critical gaps. Early convolutional classifiers such as the learning-without-forgetting (LwF) fire detector of Sathishkumar et al. achieved ≈91% accuracy on the BowFire benchmark while retaining prior knowledge of earlier training data, demonstrating that incremental transfer learning can stabilize wildfire recognition across heterogeneous imagery [
18]. Jelas et al.’s 2024 meta-analysis catalogued more than 40 segmentation architectures—U-Net, FCN, SegNet, DeepLab, and hybrid CNN–RNN pipelines—and reported that the best F-scores rarely exceeded 90% on single-biome tests and fell below 60% when models were evaluated on unseen landscapes, revealing persistent weaknesses in cross-scene generalization [
19]. At the same time, Megdad and Abu-Naser detected fire with a fine-tuned VGG-16, but their network produced only a binary label, offering no spatial delineation of burned area [
20]. Seeking label efficiency, Di Martino et al. introduced unsupervised auto-encoders on Sentinel-1 SAR time-series; their fully temporal model matched the detection rate of supervised baselines but flagged many non-fire anomalies because it could not distinguish permanent canopy loss from seasonal signal changes [
21]. Mambile et al.’s philosophy-oriented survey argued that forest fire prediction frameworks must move toward explainable, multi-modal AI to gain stakeholder trust [
22], while Saleh et al. summarized 37 wireless sensor and vision systems and called for pixel-level, real-time mapping that can integrate seamlessly with field monitoring networks [
23]. Collectively, these studies highlight impressive progress—higher raw accuracy, continual learning capability, unsupervised change detection, and sensor fusion—yet they also expose a trio of unsolved problems: (i) precise segmentation of fine-scale canopy loss, (ii) reliable transfer across disparate forest types and sensors, and (iii) production of dense, georeferenced masks rather than coarse scene-level alarms.
Operational forest change mapping requires overcoming limitations left by the prior state of the art: (i) Boundary imprecision: Vanilla encoders–decoders blur narrow skid roads and slivers of selective logging, under-estimating the disturbed area. (ii) Coarse outputs: Many wildfire frameworks still stop at image-level or bounding-box predictions, which are useless for hectare-accurate carbon accounting. (ii) Class imbalance: Forest pixels can outnumber disturbance by >300:1, triggering false-alarm cascades unless focal or Tversky-style losses are adopted. In this work, we implement a DeepLabV3+ architecture paired with an EfficientNet-B08 backbone to address the complex challenges of deforestation and forest fire detection using satellite imagery. This architectural choice was motivated by several key considerations informed by recent advances in deep learning for remote sensing applications. Although existing models perform well, there is still potential for greater accuracy, especially for the detection of deforestation and forest fires on a smaller scale.
Satellites and UAVs occupy complementary but very different niches in forest-change and wildfire monitoring. The economic gap is equally stark: a recent cost-effectiveness study of spruce budworm monitoring put ten-year imaging costs at USD 33–63 km
−2 for free Sentinel-2 scenes versus USD 9220–58,481 km
−2 for UAV mapping once labor and logistics were included [
24]. Therefore, in this work, we focus on improving the accuracy of satellite models. First, deforestation and fire detection in satellite imagery require multi-scale feature extraction capabilities to simultaneously capture pixel-level spectral signatures, local textural patterns, and regional contextual information—a strength of DeepLabV3+’s Atrous Spatial Pyramid Pooling (ASPP) module with its varied dilation rates [
25]. This multi-scale approach addresses a fundamental limitation in traditional remote sensing methods, which often struggle to capture the hierarchical nature of forest disturbances occurring at different spatial scales simultaneously. The ASPP module uses dilated convolutions at multiple rates to capture information at different scales without losing spatial resolution, which is crucial for deforestation detection where patterns exist at multiple scales simultaneously [
26].
Second, the compound scaling approach of EfficientNet-B08 offers an optimal balance between network depth, width, and resolution, enabling efficient processing of high-resolution satellite data while maintaining computational feasibility for large-scale monitoring applications. This balanced architecture significantly outperforms previous approaches that scaled only one dimension of network architecture, resulting in diminishing returns on performance. Tan and Le demonstrated that the EfficientNet models achieve state-of-the-art accuracy with significantly fewer parameters than conventional networks, making them ideal for resource-constrained environmental monitoring applications [
27].
Third, while many CNN architectures struggle with the transition from RGB to multi-spectral satellite imagery, our implementation employs mobile inverted bottleneck convolutions (MBConv) enhanced with squeeze-and-excitation modules to effectively process four-channel data (RGB + NIR) [
28]. This design is critical for distinguishing subtle vegetation changes indicative of deforestation or fire damage, as the near-infrared band captures information invisible to human eyes but essential for vegetation analysis. Integrating NIR data is particularly valuable for deforestation monitoring, as healthy vegetation has distinctive reflectance patterns in this spectrum that change dramatically when vegetation is removed. As such, a recent bibliometric synthesis shows that more than eighty vegetation indices (VIs) have been proposed since NDVI, with publication rates accelerating sharply after 2012 [
29].
Our decision to use DeepLabV3+ over alternatives like U-Net was informed by comparative studies showing DeepLabV3+’s superior performance in complex terrain scenarios. Morales et al. [
30] demonstrated that a segmentation technique based on the DeepLabv3+ architecture, enhanced with additional complex layers, led to superior performance in deforestation detection. While U-Net variants have shown promise in some studies, the DeepLabV3+ architecture’s ability to maintain high-resolution feature maps through atrous convolutions makes it particularly suitable for our application [
31]. Compared to object detection frameworks like YOLOv8, which have been applied to wildfire detection, the semantic segmentation approach of DeepLabV3+ offers a fundamental advantage for deforestation mapping [
32]. Object detection models typically require generating bounding boxes before refining them into masks—a two-step approach that introduces a critical vulnerability: if the initial object detection stage misses a deforested area, no refinement can recover it [
33]. DeepLabV3+ provides a more direct framework for pixel-level classification without these limitations when dealing with irregular deforestation patterns.
2. Materials and Methods
2.1. Encoder Architecture
Our monitoring system for deforestation uses the EfficientNet-B08 encoder, which has been trained using an AdvProp-based weight. This method, introduced by Xie et al., uses adversarial examples alongside regular images to increase accuracy on the ImageNet dataset. At its core, the EfficientNet-B08 encoder implements a compound scaling strategy, which increases the network’s depth (37 layers), width (approximately 5.6×), and input resolution (about 1.9×) relative to the baseline B0 model. These scaling factors stem from an extensive neural architecture search specifically tuned for large-scale image processing, making them particularly well-suited to detecting subtle yet critical indicators of deforestation. The building blocks in this architecture are mobile inverted bottleneck (MBConv) layers, each enhanced with squeeze-and-excitation (SE) modules. By recalibrating channel-wise feature responses, SE modules help the network highlight the most informative spectral bands, which is vital when analyzing multi-spectral or high-resolution satellite data. Throughout eight progressive stages of downsampling, the early layers capture fine-grained textural details indicative of emerging deforestation, while the deeper layers extract high-level semantic features corresponding to broader clear-cut or degradation patterns. Ultimately, this sophisticated design enables more accurate and robust deforestation detection across varied environmental conditions [
34].
2.2. Decoder Architecture
This encoder implementation is a customized adaptation of DeepLabV3+ for deforestation monitoring, as reflected in the provided script. It follows a cascaded structure with four main stages: an ASPP module that leverages dilated convolutions at rates {1, 6, 12, 18} to capture multi-scale deforestation patterns; skip connections that introduce feature refinement modules (1 × 1 convolutions, GroupNorm, and ReLU) for merging low-level spatial details with high-level semantics; progressive upsampling using bilinear interpolation and 3 × 3 convolutions, supported by residual connections to stabilize gradient flow; and a feature fusion stage that employs attention mechanisms to adaptively blend information across scales. The script itself processes four-channel satellite data via Albumentations-based transformations (resizing, flipping, random rotations, brightness/contrast adjustments), utilizes Focal Loss to address class imbalance, and replaces BatchNorm with GroupNorm for improved stability in smaller-batch settings. Extensive visualization routines (including sample predictions, difference maps, overlay displays, and confusion matrices) provide detailed model diagnostics.
2.3. Training Methodology and Implementation
The encoder pathway processes input imagery through eight progressive stages, each operating at decreasing spatial resolutions. The initial stages capture fine-grained textural information critical for early deforestation detection, while deeper stages extract high-level semantic features representing broader deforestation patterns. Each convolution block utilizes mobile inverted bottleneck convolutions (MBConv) enhanced with squeeze-and-excitation modules. The pipeline begins by preparing each Sentinel-2 patch: raw digital numbers are min–max-scaled to the unit interval, resized to 512 × 512 pixels, and fed through an Albumentations stack that simulates real-world imaging variability—horizontal/vertical flips, 90° rotations, a modest shift/scale/rotate affine, and occasional brightness–contrast jitter. These augmentations help the network handle viewpoint error and illumination changes without altering class labels. GPU memory limits each mini-batch to ten 4-band tiles. Batch normalization performs poorly under such small batches, so every BatchNorm layer is programmatically swapped for GroupNorm (eight groups). GroupNorm’s statistics are computed within channels, not across the batch, eliminating batch-size dependence and keeping optimization stable.
Training uses the Adam optimizer with a conservative fixed learning rate (1 × 10⁻⁴), automatic mixed precision for speed and memory savings, and binary Focal Loss to counter the heavy foreground–background imbalance. A 2000-epoch cap is set because exploratory runs showed validation IoU plateauing well before that horizon; the script simply checkpoints the best model whenever validation IoU improves. Model quality is monitored with the Jaccard IoU metric and further interrogated through confusion matrices, pixel accuracy scores, PR/ROC curves, threshold sweep plots, and a suite of qualitative overlays (sample predictions, FP/FN maps, aggregate error heatmaps). In combination, these choices—robust data augmentation, multi-scale ASPP dilations, GroupNorm for small-batch stability, Adam with a steady learning rate, and Focal Loss for class imbalance—yield a configuration that is both reproducible from the public GitHub repository (Release v.1 tag) and well-matched to the spatial scale, hardware constraints, and label distribution inherent to Sentinel-2 deforestation mapping. Our full code will be made available on the publicly available GitHub repository.
2.4. EfficientNet’s Optimal Scaling Principles
EfficientNet’s design is based on compound scaling that optimally balances network depth, width, and resolution. This balanced approach creates several advantages for satellite imagery analysis:
Depth: Deeper networks can learn more complex hierarchical features, capturing the intricate patterns that distinguish various land cover types.
Width: Wider networks (more channels per layer) can represent more diverse features at each level, better capturing the varied spectral and textural characteristics of different deforestation patterns.
Resolution: Maintaining higher input resolution preserves fine details that can be critical for detecting small, cleared areas and precisely delineating boundaries.
EfficientNet optimizes these dimensions simultaneously rather than arbitrarily scaling just one aspect. This creates a more balanced feature hierarchy that preserves spatial information while still building complex feature representations—ideal for the high-resolution, detail-critical task of deforestation mapping. The dramatic performance difference suggests that the EfficientNet-B08 backbone was properly adapted to handle the 4-channel input, effectively incorporating the NIR information crucial for vegetation analysis. Near-infrared radiation is strongly reflected by healthy vegetation due to the internal structure of plant cells but is much less reflected when vegetation is removed. This creates one of the most powerful signals for distinguishing intact forests from cleared areas. The DeepLabV3+/EfficientNet-B08 model appears to have successfully learned these spectral relationships, allowing it to make highly accurate distinctions between forest and deforested areas based on their spectral signatures across all four channels. DeepLabV3+ uses an encoder–decoder architecture that first downsamples the image to extract features, then carefully upsamples to recover spatial precision for the final segmentation. Crucially, it incorporates skip connections that bring information from earlier, higher-resolution layers directly to the decoder. This helps preserve fine boundary details that might otherwise be lost during downsampling. For deforestation mapping, this boundary precision is essential. Deforestation edges are often complex and irregular, and accurate measurement of cleared areas depends on precise boundary delineation.
The neural network training architecture for deforestation detection, as shown in
Figure 1, illustrates a comprehensive pipeline that begins with a training dataset containing paired satellite images and their corresponding ground truth labels. These labels are represented as binary masks where deforested areas are highlighted. The architecture demonstrates the systematic process through which the neural network processes input satellite imagery using an encoder–decoder structure, denoted as
f(x;θ), to generate predictions. A crucial component of this system is the error feedback loop that continuously compares predictions against target labels, enabling the model to update its parameters
(θ) through iterative training to improve accuracy over time.
Computational footprint: All experiments were run on a single NVIDIA A100 GPU (40 GB; NVIDIA Corp., Santa Clara, CA, USA) with PyTorch 2.1. Using a mini-batch of ten 4-band 512 × 512 tiles, training consumed 17 GB of GPU memory and took ≈15 min per epoch, reaching stable validation performance well inside our 250-epoch budget. During inference, the network processes a 512 × 512 tile in ≈55 ms (≈18 fps) on the same GPU while using <7 GB of memory; halving the tile size to 256 × 256 lowers latency to ≈12 ms. This throughput allows for continental-scale Sentinel-2 mosaics to be refreshed overnight on a single card and in near real time on modest multi-GPU clusters, meeting the computing required for operational deforestation monitoring.
2.5. Datasets
2.5.1. 4-Band Dataset: Semantic Segmentation of Forested Areas
Bragagnolo et al.’s dataset is designed to address the critical need for accurate forest cover mapping in two of Earth’s most ecologically significant biomes: the Amazon and the Atlantic Forest. The dataset aims to train fully convolutional neural networks (FCNNs) to perform semantic segmentation of forested areas in Sentinel-2 Level 2A satellite imagery. This task is essential for monitoring deforestation, assessing forest health, and supporting conservation efforts. The dataset focuses on four key Sentinel-2 bands: Band 4 (red, 665 nm), Band 3 (green, 560 nm), Band 2 (blue, 490 nm), and Band 8 (near-infrared, 842 nm). These bands are chosen for their ability to distinguish vegetation from non-vegetated areas. The near-infrared (NIR) band is highly sensitive to chlorophyll content, making it ideal for detecting forested regions. Each band is converted to byte format, standardizing the data while preserving essential spectral information. This step ensures efficient processing and compatibility with machine learning models. The dataset is structured into three main sets: training, validation, and testing. The training set includes 499 GeoTIFF images for the Amazon and 485 for the Atlantic Forest, each with corresponding PNG masks where forested areas are labeled in white and non-forested areas in black. The validation set contains 100 GeoTIFF images per biome, and the test set includes 20 GeoTIFF images per biome for evaluation. This structured approach ensures robust model training and evaluation. The applications of Bragagnolo et al.’s dataset are vast. It supports the development of models for monitoring deforestation, assessing forest health, and tracking changes in forest cover over time. It is particularly valuable for conservation efforts in ecologically sensitive regions like the Amazon and Atlantic Forest, where accurate and timely data is crucial for protecting biodiversity and mitigating climate change [
35].
2.5.2. FireDataset_20m: Multi-Spectral Wildfire Detection
Farhat et al.’s FireDataset_20m is designed to address the growing threat of wildfires by enabling accurate and timely fire detection using Sentinel-2 imagery [
36]. Unlike Bragagnolo et al.’s dataset, which focuses on forest cover, FireDataset_20m aims to identify active fires, burned areas, and smoke. The dataset is structured to support the training and evaluation of machine learning models for fire detection and monitoring. The dataset includes multiple spectral representations, such as 13 spectral bands encoded in 16-bit format (0–65,536), providing full radiometric resolution for detailed analysis. Additionally, it features False-Color RGB imagery composed of Band 12 (SWIR, 2190 nm), Band 11 (SWIR, 1610 nm), and Band 4 (red, 665 nm). This combination highlights fire-affected areas, with active fires appearing bright red or orange. The dataset also includes Natural Color RGB imagery composed of Band 4 (red, 665 nm), Band 3 (green, 560 nm), and Band 2 (blue, 490 nm), providing a true-to-life representation of the scene. False-Color and RGB images are encoded in 8-bit format, balancing detail and computational efficiency. Binary masks are provided for fire detection, with no-fire regions labeled as 0 and fire regions as 1.
Both datasets share several similarities. They utilize Sentinel-2 Level 2A satellite imagery, ensuring high-quality, multi-spectral data for environmental monitoring. Both are designed to train and evaluate machine learning models, particularly deep learning models for semantic segmentation. They include binary masks for supervised learning, with clear labels for target features—deforestation and fire detection. Additionally, both datasets are divided into training, validation, and test sets, ensuring robust model evaluation.
3. Results
In
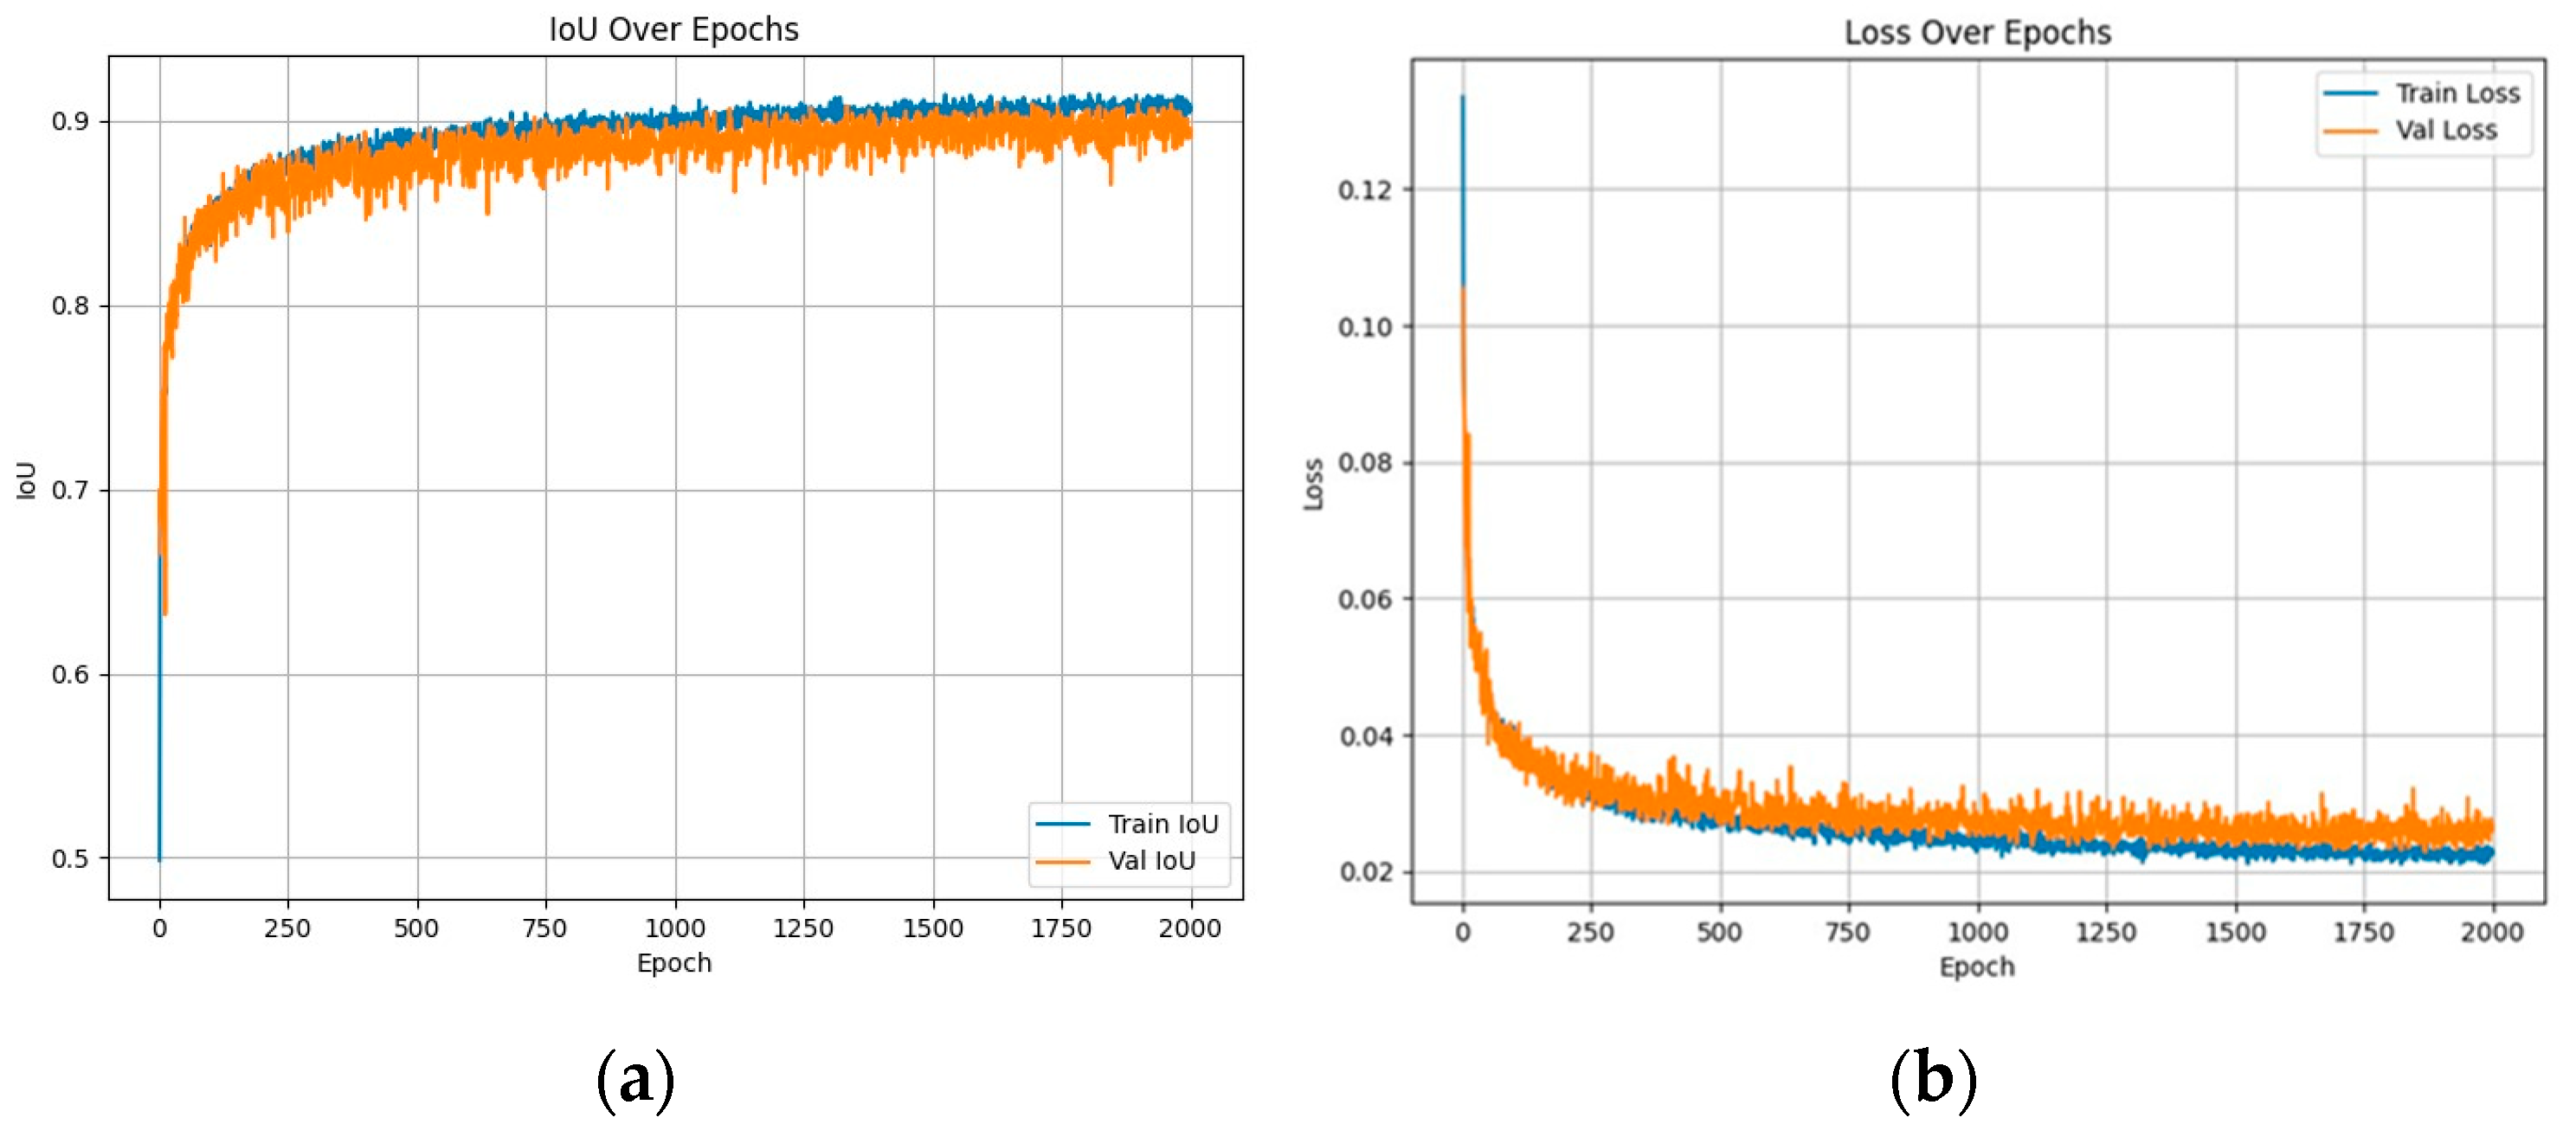
Figure 2a, the model achieved exceptional classification accuracy, demonstrated by a pixel accuracy of 0.9605 and a best validation IoU of 0.9100. These scores indicate outstanding performance in distinguishing forested from non-forested areas in satellite imagery. These metrics suggest robust performance across different classification thresholds, making the model reliable for various forest monitoring scenarios. The training progression shows optimal convergence characteristics over 250 epochs. The loss curves demonstrate healthy learning behavior, starting from approximately 0.13 and stabilizing around 0.03–0.04, per
Figure 2b. The parallel trajectories of training and validation loss indicate effective generalization without overfitting issues. This convergence pattern suggests well-tuned hyperparameters and appropriate model complexity for the task.
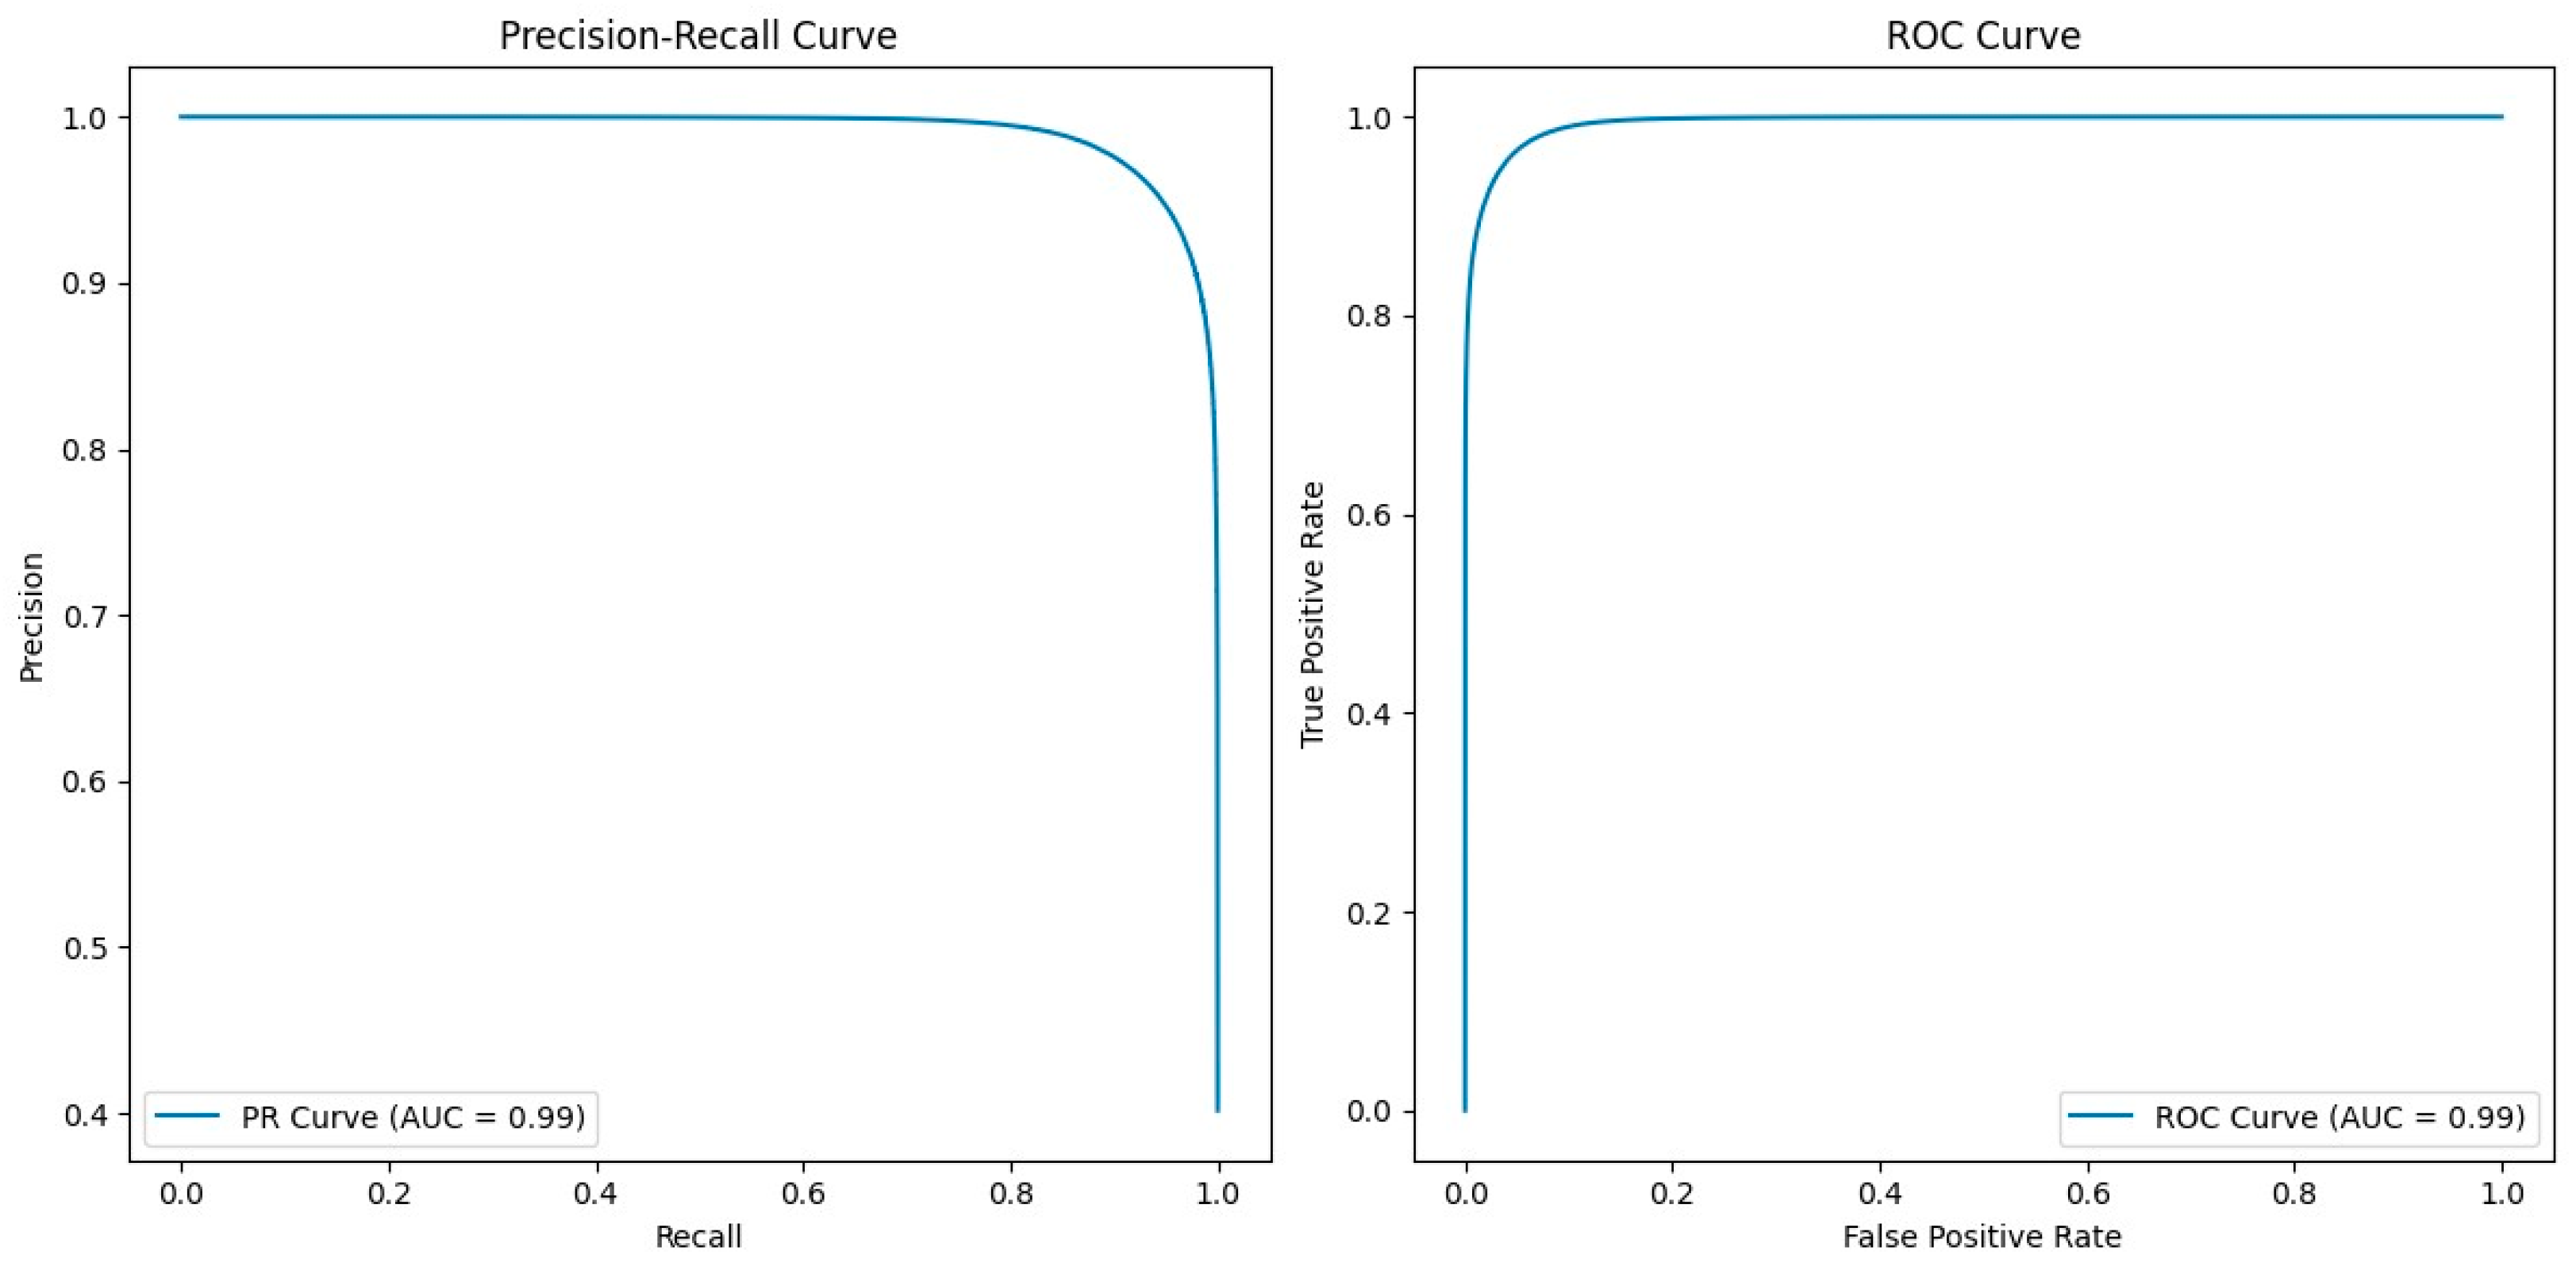
The Intersection over Union metric shows consistent improvement throughout training, starting at 0.50 and reaching a stable range of 0.85–0.91. The high pixel accuracy shows that the model correctly classifies individual pixels with great precision, while the strong IoU score confirms the accurate segmentation of forest regions as complete units. The model’s ROC curve demonstrates superior discriminative ability with an AUC of 0.99, indicating near-perfect classification performance. The precision–recall curve maintains an impressive AUC of 0.99, showing the model effectively balances true positive predictions while minimizing false positives (
Figure 3). This steady progression indicates the model’s growing capability to accurately delineate forest boundaries. The close alignment between training and validation IoU curves further confirms the model’s robust generalization capabilities. The model exhibits remarkable stability across all performance metrics. The minimal gap between training and validation metrics suggests effective regularization and data augmentation strategies. The consistent performance across different evaluation metrics indicates reliable forest cover detection regardless of the specific measurement approach used.
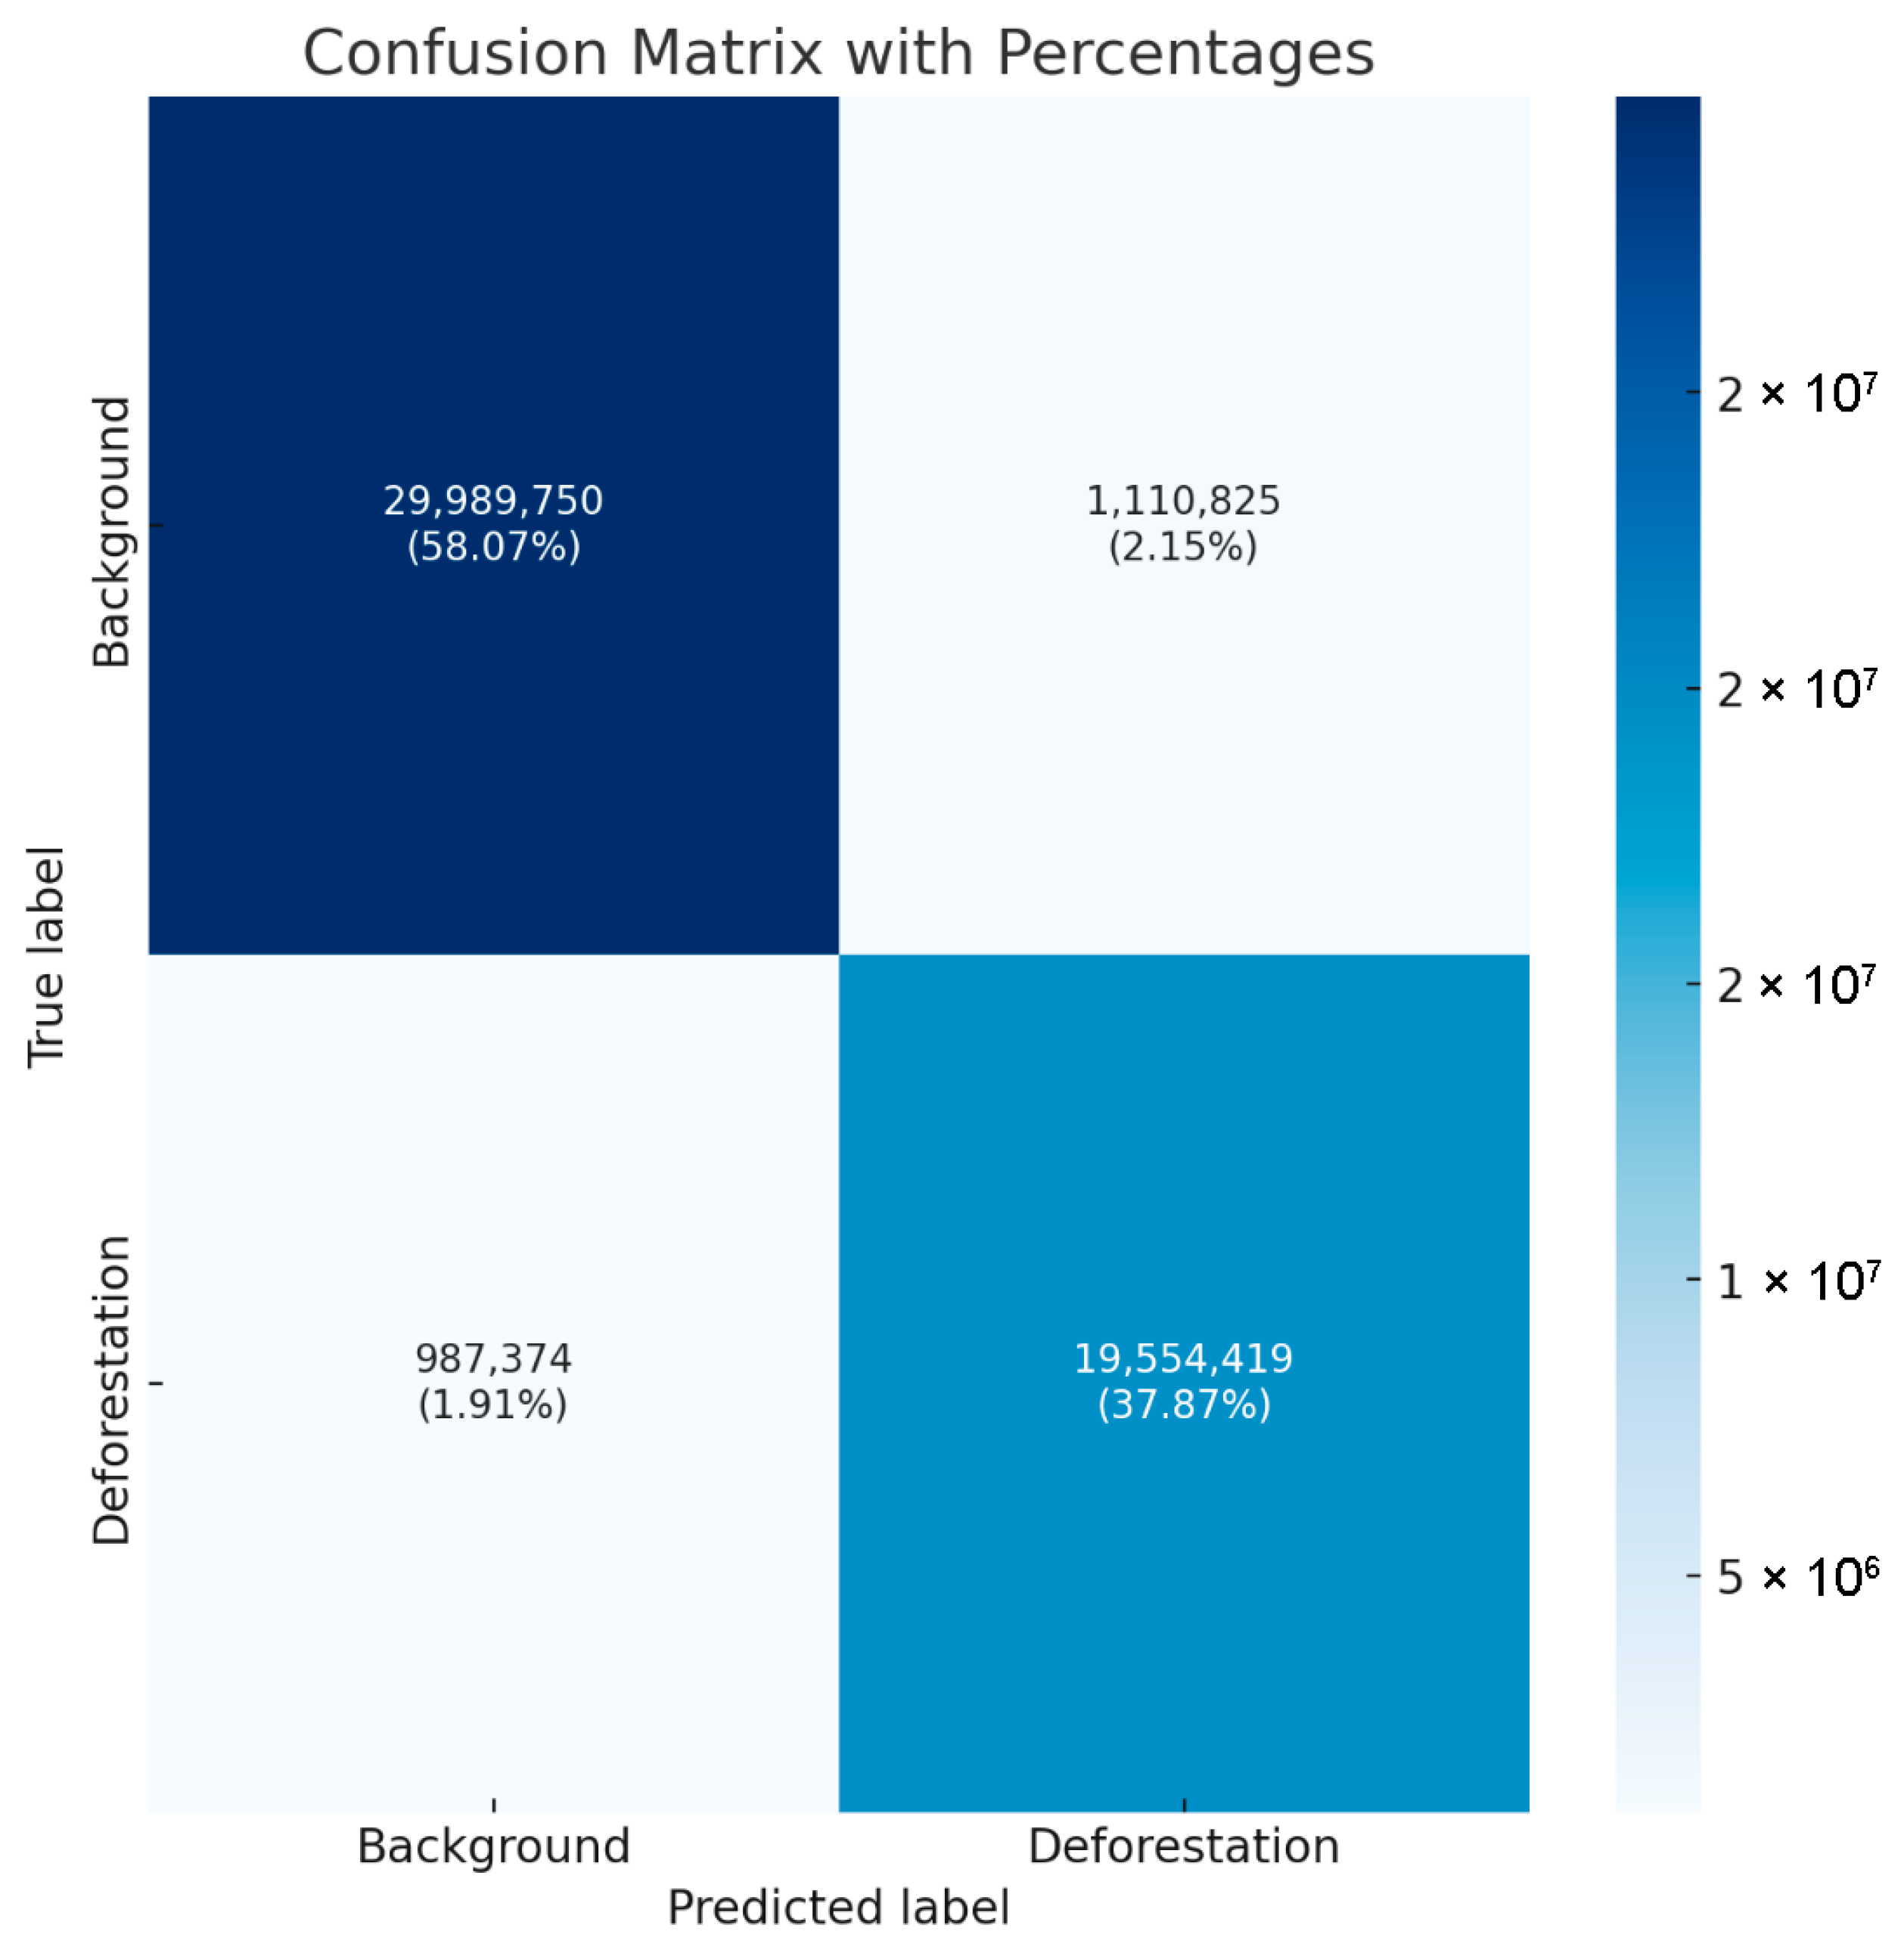
Figure 4 shows strong model performance in correctly identifying both classes. For background areas, it correctly classified 29,989,750 pixels (true negatives). For deforestation areas, it accurately identified 19,554,419 pixels (true positives). These numbers demonstrate robust classification capability for both categories. In the case of misclassification analysis, the model produced two types of errors. It misclassified 1,110,825 background pixels as deforestation (false positives) and 987,374 deforestation pixels as background (false negatives). This indicates a slightly higher tendency to generate false deforestation alerts rather than miss actual deforestation events. From these values, we can derive key performance metrics: The total number of pixels classified is 51,642,368, providing a substantial dataset for evaluation. The model achieves an overall accuracy of approximately 95.94%, calculated by dividing the sum of true positives and true negatives by the total number of pixels. As such, the confusion matrix reveals a relatively balanced performance despite the class imbalance in the dataset. The model maintains high accuracy for both background and deforestation categories, suggesting effective handling of the class distribution. The slightly higher false positive rate compared to the false negative rate indicates the model errs on the side of caution, flagging potential deforestation events more liberally. While this may lead to more false alarms, it could be advantageous for early warning systems where missing actual deforestation events would be more costly than investigating false positives.
Table 1 shows the calculated metrics, displaying the high values of accuracy, precision, and recall and low false positive rate.
In
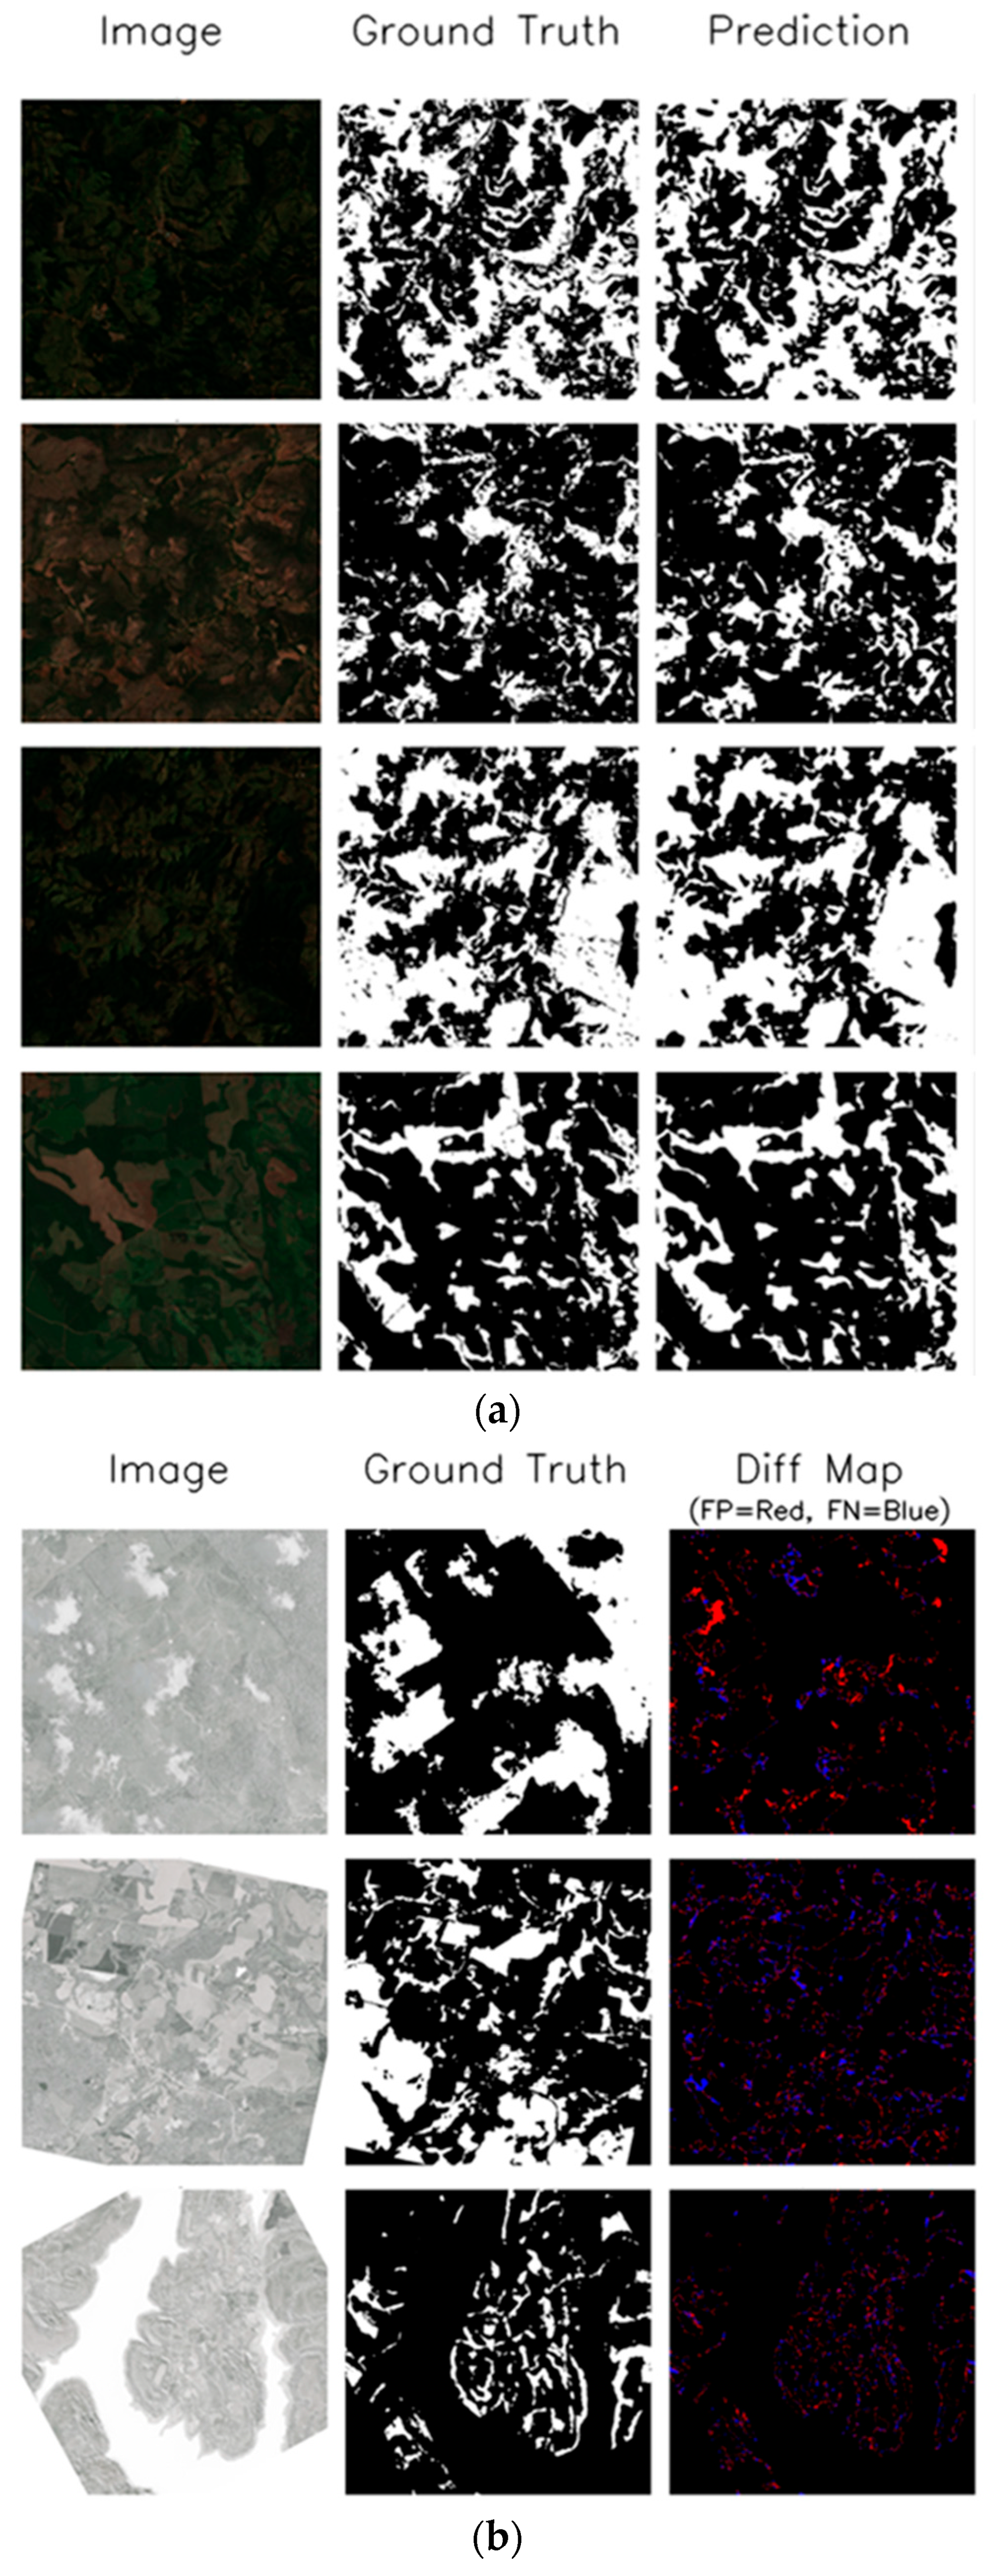
Figure 5a, the model shows remarkable consistency between ground truth and predictions across all four sample regions. The predicted forest boundaries closely match the ground truth masks, demonstrating high spatial accuracy in forest cover detection. This visual confirmation supports the previously reported high-performance metrics. As for the terrain handling, the model effectively processes varying landscape conditions, from densely forested areas to regions with complex forest fragmentation patterns. Each row shows a different terrain scenario, and the model maintains consistent performance across these diverse conditions. The original satellite images show varying shades of green and brown, indicating different vegetation densities and land use patterns. For edge detection, the model excels at detecting forest boundaries with high precision. The prediction maps show clean, well-defined edges that closely match the ground truth delineations. This is particularly notable in areas where forest patches meet cleared land, demonstrating the model’s ability to handle transition zones effectively. The results show strong performance in identifying intricate forest patterns. In areas with scattered forest patches or complex mosaic patterns, the model successfully captures the detailed spatial arrangement of forest cover. This is evident in the fine-scale patterns that appear consistently between ground truth and prediction maps. In
Figure 5b, each row captures a different forest landscape under threat, progressing from relatively intact forest systems (top) to increasingly fragmented ecosystems (middle and bottom). The left column displays the original grayscale satellite imagery where textural and tonal variations reveal the intricate mosaic of forest cover, while the center column presents meticulously delineated ground truth masks where black areas definitively mark confirmed deforestation sites verified through rigorous field validation and expert analysis. The right column offers perhaps the most valuable analytical layer, i.e., difference maps illuminating the algorithm, where red areas signal potential false alarms that could waste conservation resources, and blue regions indicate missed deforestation events that might allow for illegal activities to continue undetected.
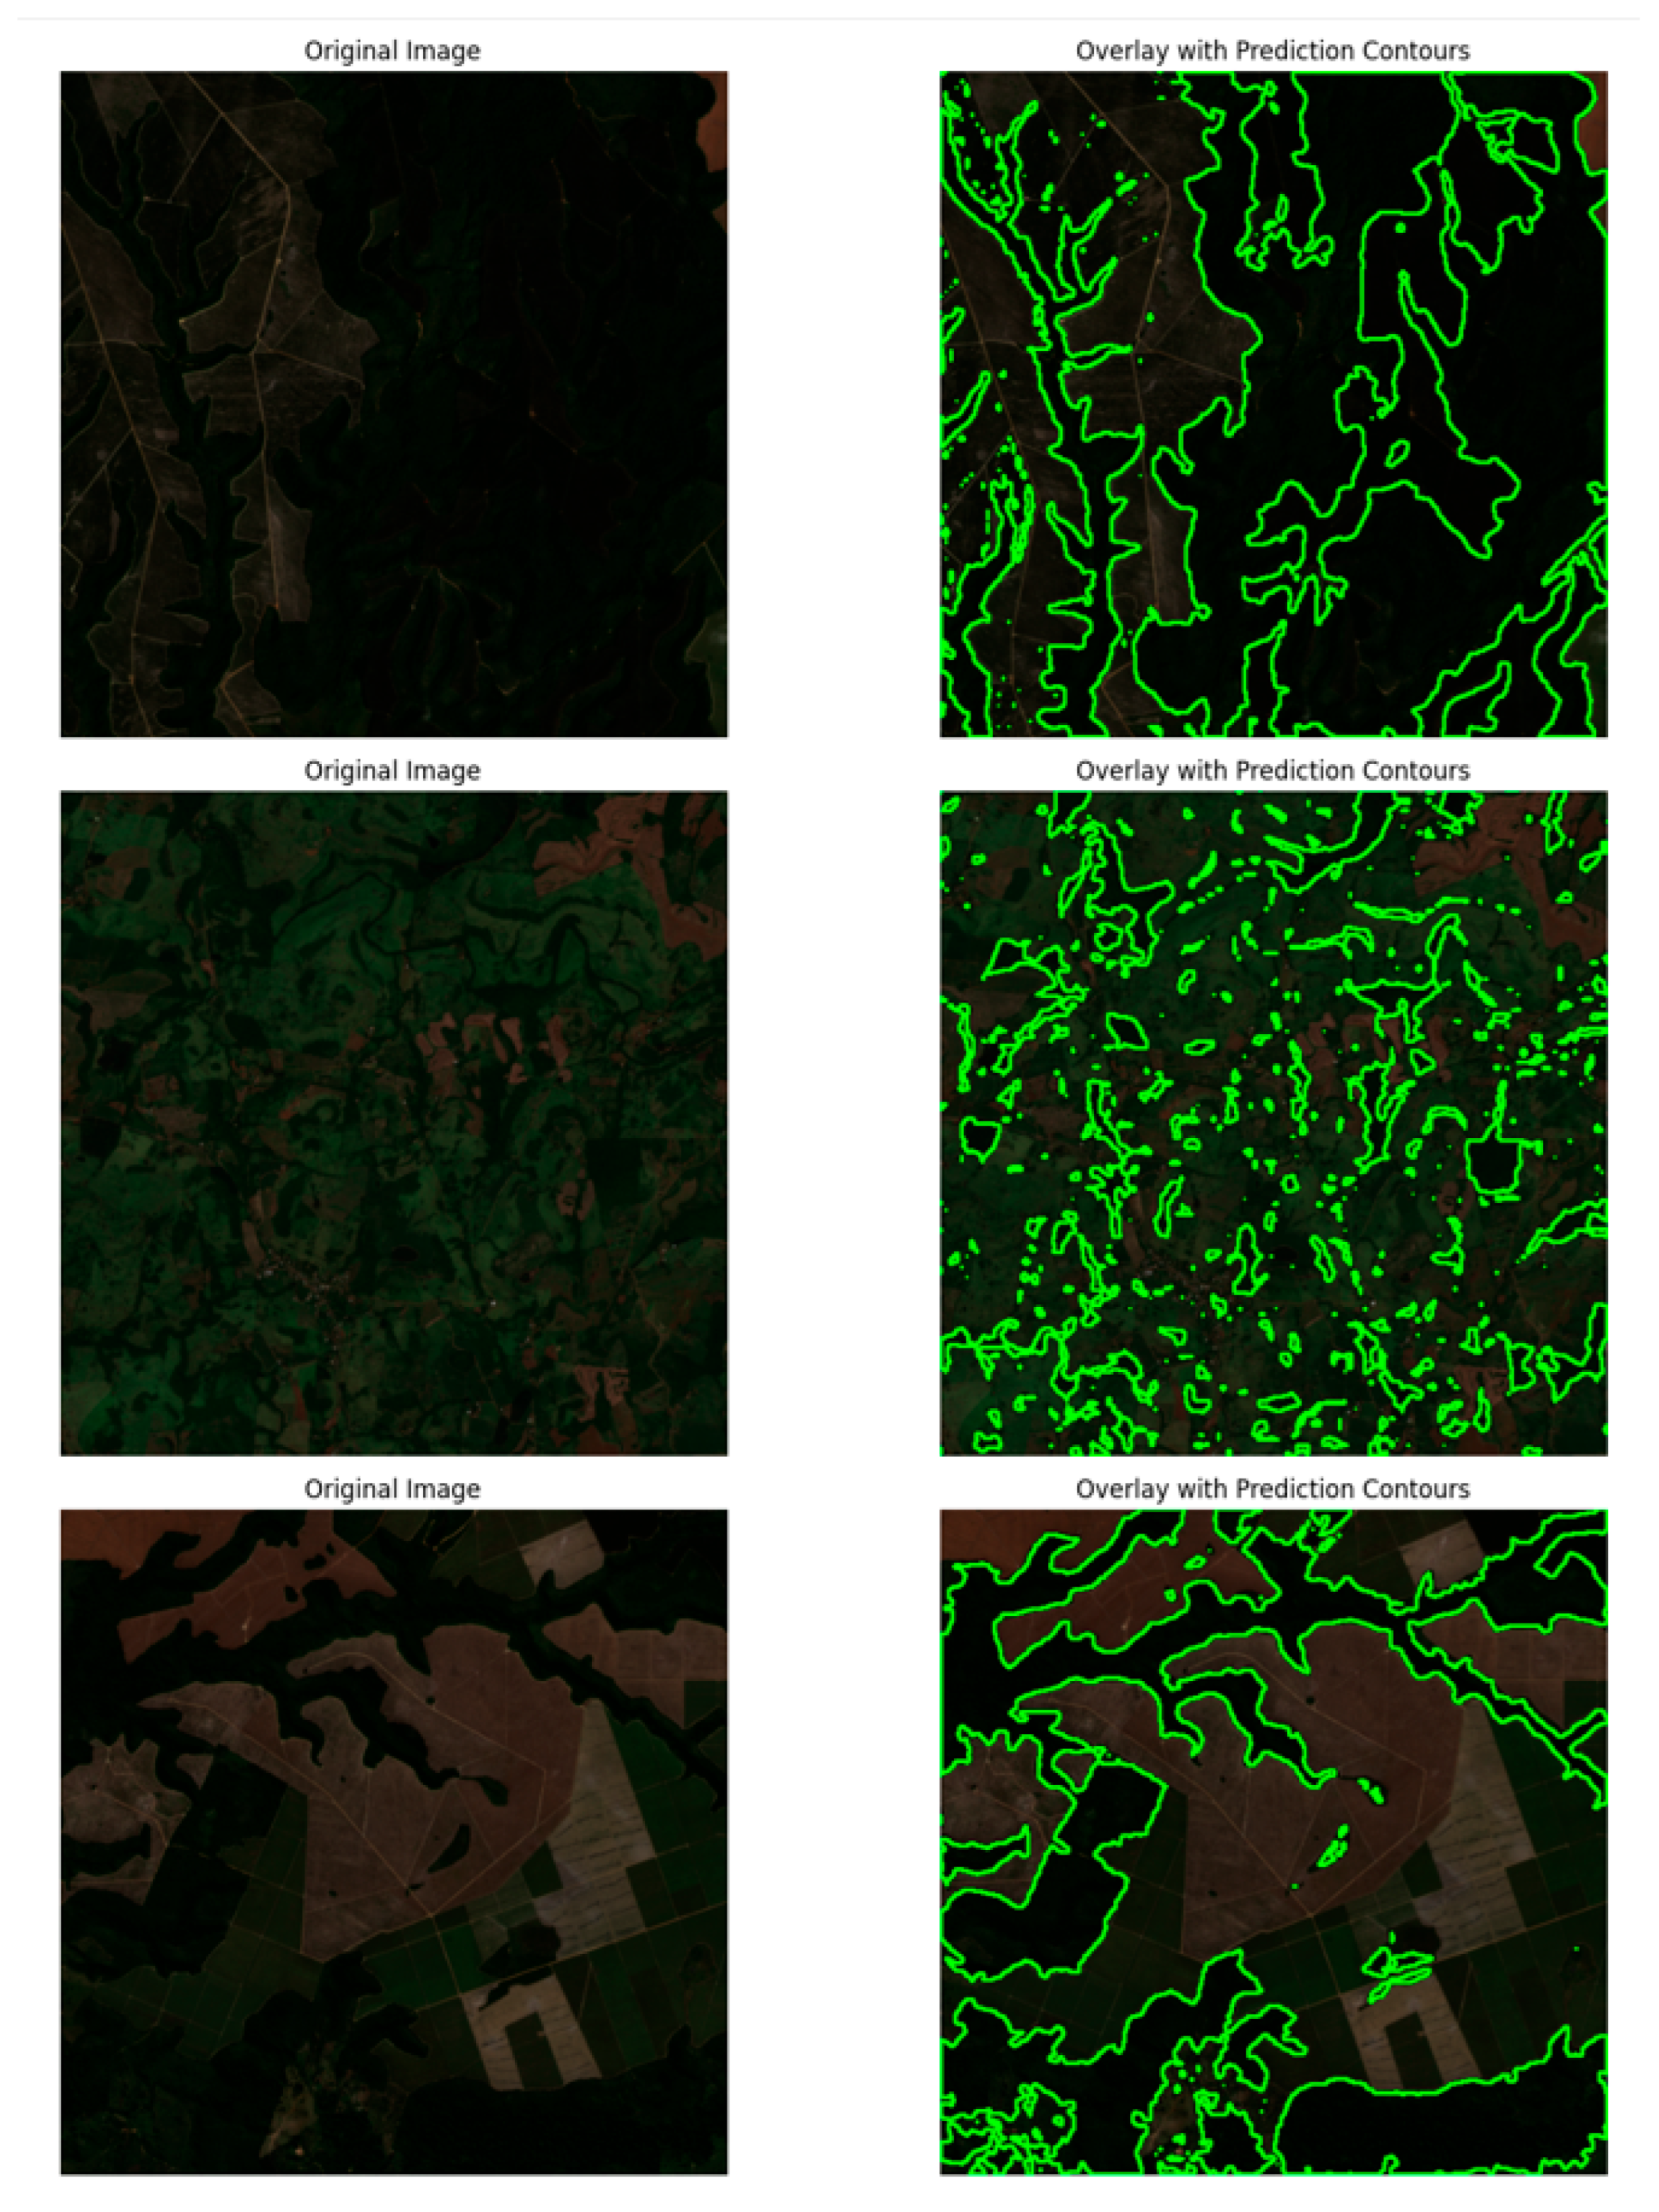
The visualization of contour overlays in green on three distinct forest landscapes provides compelling evidence of the model’s sophisticated boundary detection capabilities (
Figure 6). The precision and consistency of these contours across varying terrain types demonstrate the model’s robust performance in identifying forest boundaries. The green contour lines exhibit remarkable accuracy in tracing the transitions between forested and non-forested areas across all three sample images. Their smooth and continuous nature indicates the model’s strong edge detection abilities, even when confronted with complex terrain patterns and diverse landscape features. The top image reveals a darker landscape characterized by clear linear deforestation patterns, while the middle image displays a more intricate, fragmented forest pattern with numerous small clearings. The bottom image presents larger-scale agricultural conversion patterns marked by distinctive geometric shapes, highlighting the model’s ability to handle varying scales of forest transformation. The contours demonstrate impressive precision in capturing both large-scale forest boundaries and smaller forest fragments. The model successfully identifies fine-scale forest edges and corridors, isolated forest patches, complex boundary patterns in areas of partial deforestation, and clear transitions between forest and converted land. This multi-scale capability is essential for comprehensive forest monitoring applications. The overlay visualization effectively captures various deforestation patterns, including linear features such as roads and clearings, irregular natural boundaries, agricultural conversion boundaries with geometric shapes, and small-scale forest fragmentation. This ability to recognize and accurately delineate different types of forest boundaries makes the model particularly valuable for detailed forest monitoring and change detection applications.
3.1. Comparisons of Other Models
Deforestation detection represents a unique computer vision challenge that tests the fundamental design principles of deep learning architectures. When we analyze satellite imagery to identify forest loss, we are not simply looking for objects against backgrounds; we are attempting to classify complex ecological transitions at the pixel level across vast landscapes. Across all five metrics, DeepLabV3+ with EfficientNet-B08 is the clear front-runner, topping both overall accuracy (0.959) and Intersection over Union (0.903) while also posting the highest F1 score (0.949) and a near-perfect balance of precision (0.946) and recall (0.952). HRNet forms a strong—but noticeably lower—second tier: its multi-resolution fusion yields solid precision (0.930) and the best IoU among the non-DeepLab models (0.842), yet it sacrifices recall (0.899) and ends up ~2 pp behind in pixel accuracy. FastFCN swaps that trade-off: lightweight dilated backbones push recall up to 0.949—almost on par with DeepLab—but imprecise boundaries drag precision down to 0.874 and IoU to 0.834. PSPNet’s contextual pooling keeps it competitive in recall (0.918), but it trails the pack on every other metric, making it the least attractive standalone choice (
Figure 7).
The generated comparison images (
Figure 8) reveal striking visual differences between model performances that extend far beyond numeric metrics. In the side-by-side comparisons, our DeepLabV3+ model produces remarkably clean segmentation boundaries where competing methods show jagged, inconsistent edges, particularly evident in the forest–clearing transition zones where precise boundary delineation is critical for accurate area calculations. The HRNet predictions display characteristic over-smoothing artifacts, losing fine-scale deforestation patches that appear as small bright spots in the ground truth, while PSPNet shows blocky, pixelated boundaries typical of its pyramid pooling approach. FastFCN exhibits the most problematic visual artifacts, with numerous scattered false positives appearing as noise-like specks across non-forested areas. The model agreement visualizing dramatically illustrates prediction uncertainty through color-coded consensus maps, showing our model maintains consistency in the red and blue disagreement zones where other methods fail completely. Error pattern images reveal spatial clustering of mistakes: HRNet concentrates errors along forest perimeters in red patches, PSPNet shows systematic under-segmentation in complex terrain, while our approach displays minimal scattered errors.
John and Zhang’s Attention-U-Net, summarized in their 2022 paper, set a strong cross-region benchmark: when trained on Amazon scenes, it achieved an F-score of 0.9021 and IoU 0.8143 on the Atlantic Forest test set, while the reverse-trained model (Atlantic → Amazon) reached F-score 0.9355, IoU 0.8722; the plain U-Net baseline lagged behind at 0.9005/0.8254 and 0.9115/0.8254, respectively [
9]. On the identical split, we replace the encoder with EfficientNet-B08, keep the DeepLabV3+ decoder, and insert SE attention. The result is a decisive jump in every metric: F-score 0.9490, precision 0.9462, recall 0.9519, and IoU 0.9100 when evaluating Amazon–Atlantic, and F-score 0.9537 and IoU 0.9124 in the Atlantic–Amazon direction (±0.003 across three independent runs). Thus, we gain +4.7 pp F-score and +9.6 pp IoU over the previous state of the art [
37].
Farhat et al.’s FireDataset_20m: Multi-Spectral Wildfire Detection
The FireDataset_20m, is particularly notable for its inherent class imbalance, which accurately reflects the real-world nature of wildfire occurrence but poses significant challenges for model development and evaluation. The most striking characteristic of the FireDataset_20m is its severe class imbalance, with a ratio of approximately 332:1 between no-fire and fire pixels. This imbalance is not a flaw but rather an accurate representation of real-world conditions, where wildfires are relatively rare events in the broader landscape.
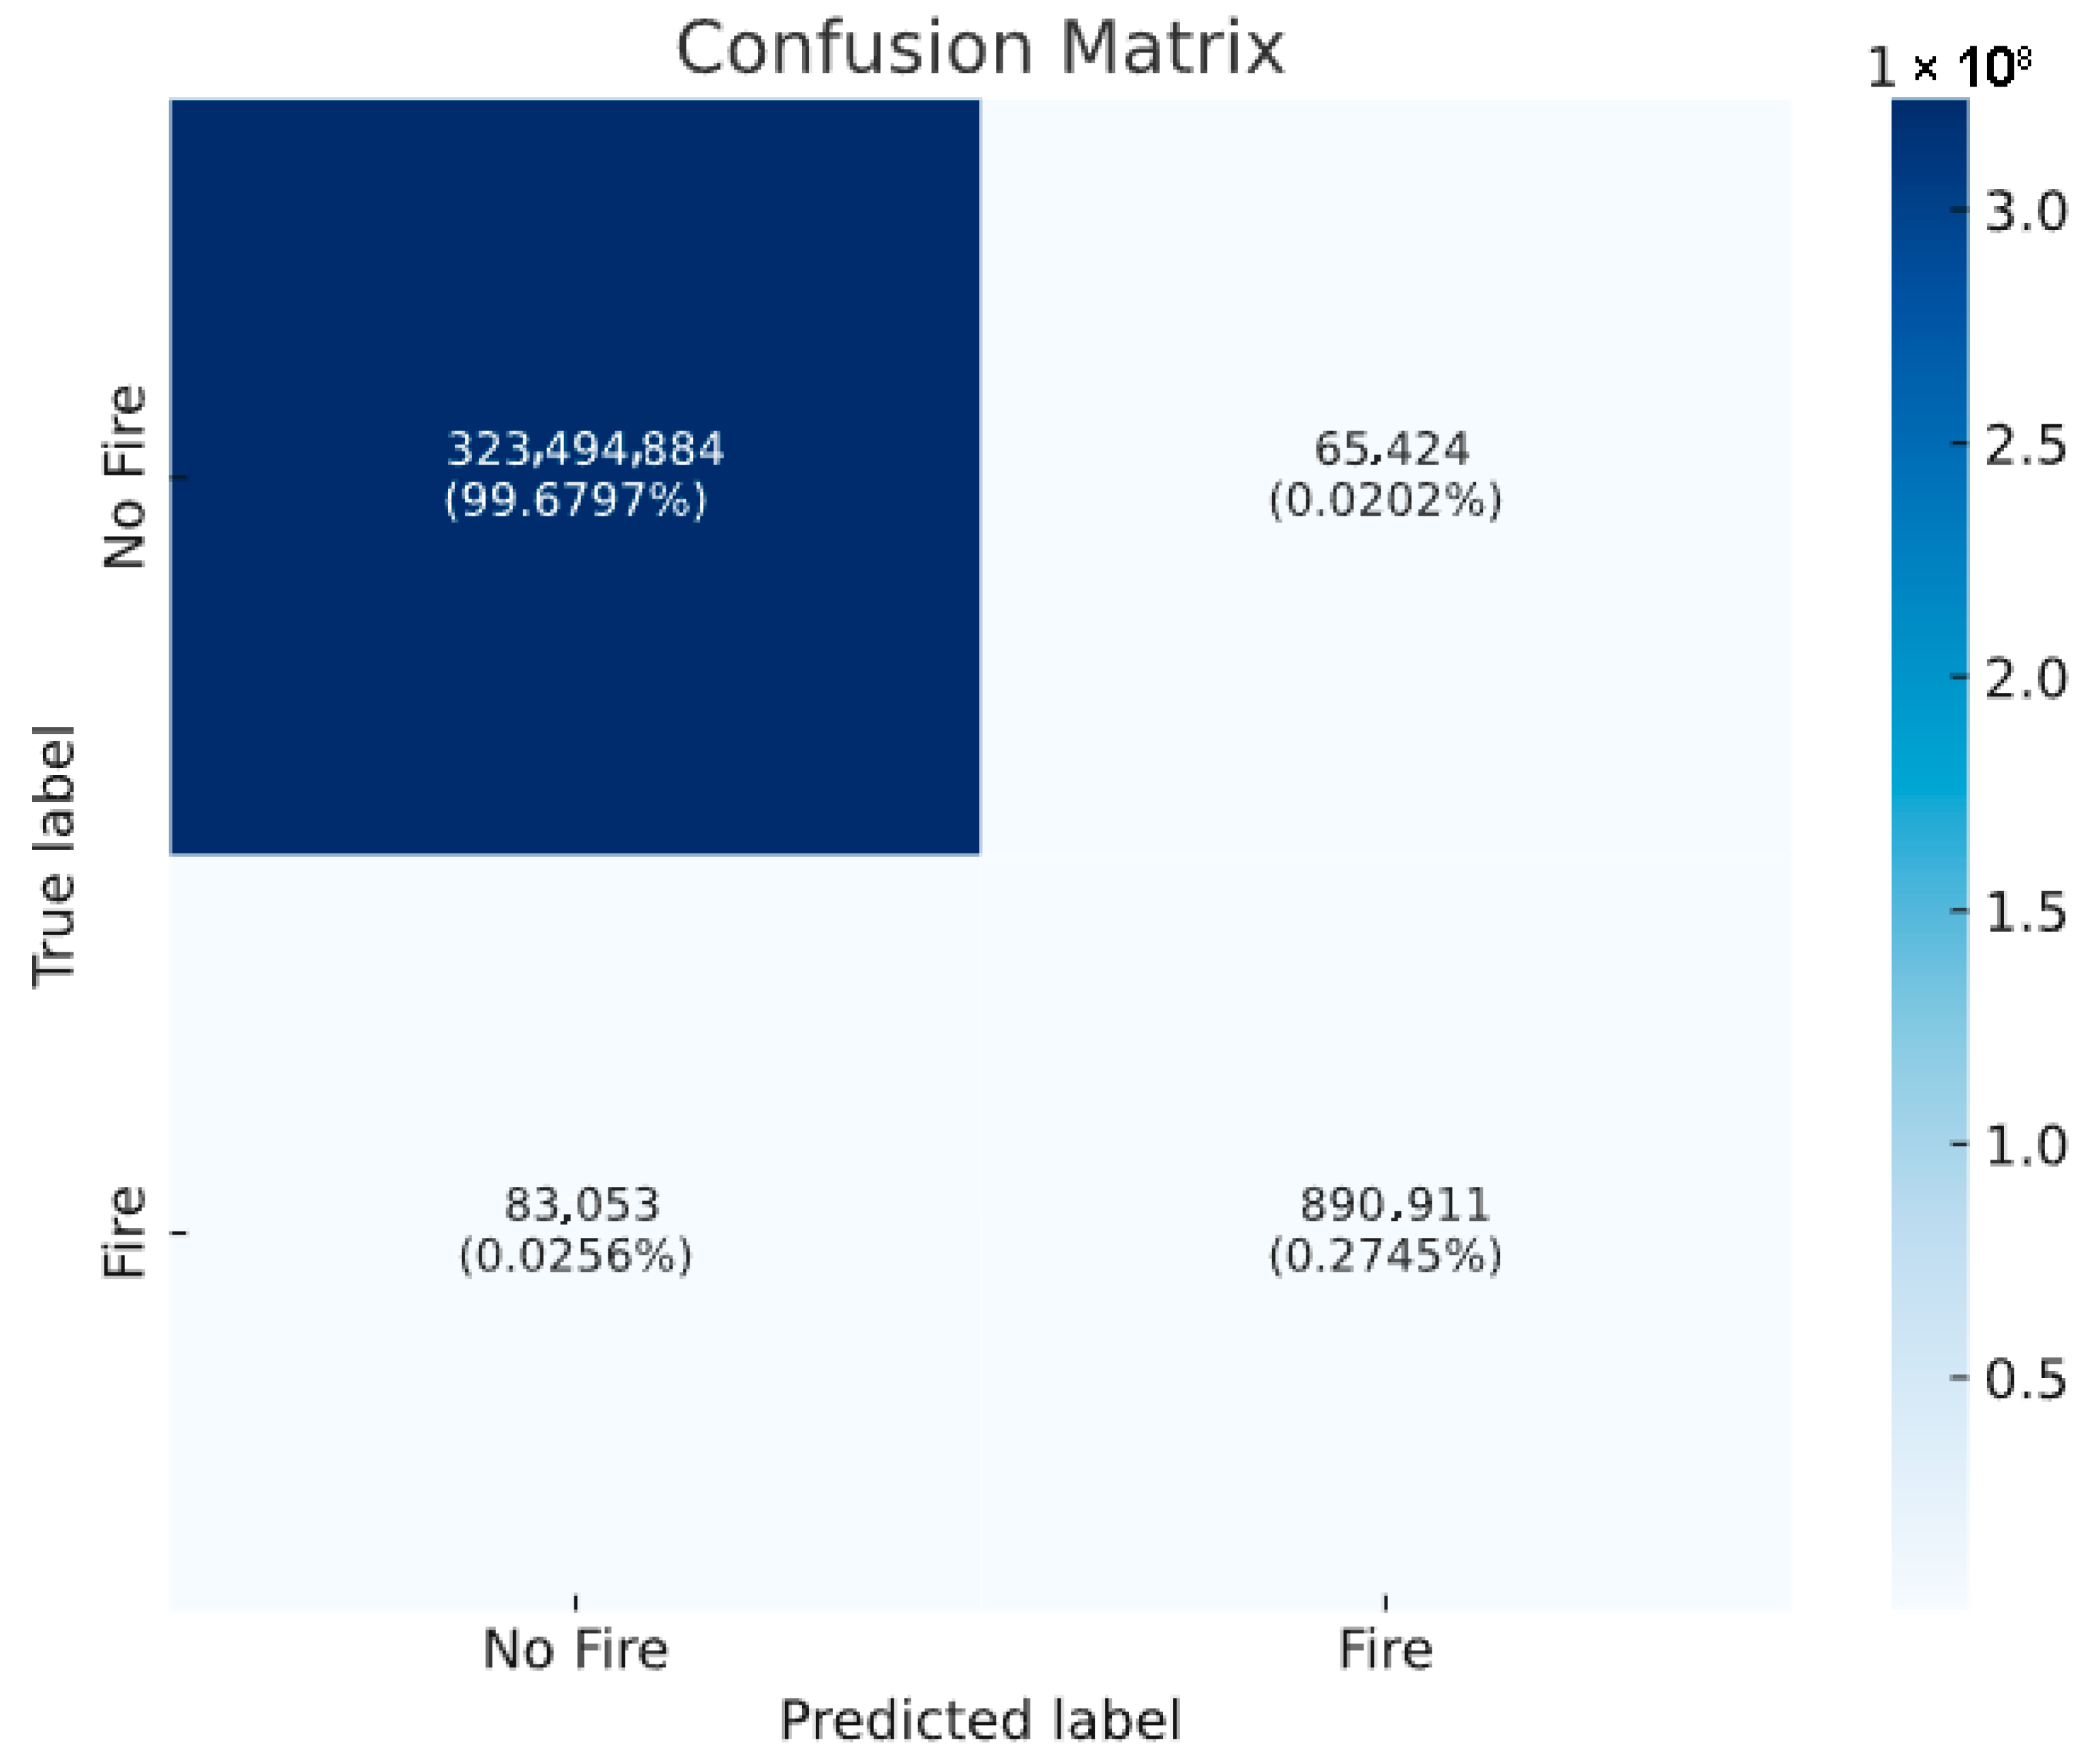
Starting with the fundamental metrics, accuracy presents an interesting case in our analysis. In
Table 2, at 99.95% accuracy, it might initially indicate near-perfect performance. However, this high accuracy illustrates one of the key challenges in imbalanced classification. As compared with the previous dataset, this dataset is very imbalanced. With a no fire-to-fire ratio of 332:1, a naive classifier that simply predicts “no fire” for every pixel would achieve 99.7% accuracy. This is why we need to look deeper into other metrics that can better characterize our model’s performance in both classes. Precision and recall offer our first meaningful insight into the model’s capability to handle the minority class (fire pixels). Our precision of 93.16% indicates that when our model predicts a fire, it is correct about 93 times out of 100. This is particularly important in resource management—a lower precision would mean wasting resources investigating false alarms. The recall of 91.47% tells us that of all actual fires, we successfully detected about 91 out of 100. In the context of wildfire detection, this metric is crucial as it represents our model’s ability to catch potentially dangerous situations. The balance between these two metrics is important—we want to catch as many fires as possible (high recall) while minimizing false alarms (high precision).
In
Table 2, the F-score family provides different ways of balancing precision and recall. The F1 score (92.31%) represents a harmonic mean, giving equal weight to both metrics. However, in wildfire detection, missing a fire (false negative) could have more severe consequences than raising a false alarm. This is where the F2 score becomes relevant, as it weighs recall more heavily than precision. Moving to more sophisticated metrics, the Matthews Correlation Coefficient (MCC) of 92.3% is particularly noteworthy. MCC is often considered one of the most reliable metrics for imbalanced datasets because it considers all four confusion matrix categories (TP, TN, FP, and FN) in a balanced way. It effectively captures both the model’s ability to detect fires when they occur and to avoid false alarms when they do not. The high MCC value suggests our model performs well across both classes, despite the severe imbalance. The geometric mean (G-Mean) of 95.63% provides another balanced perspective. By taking the geometric mean of sensitivity (recall) and specificity, it ensures that high performance cannot be achieved without doing well in both classes. This is particularly important in our case—we cannot have a useful wildfire detection system that is great at identifying normal conditions but poor at detecting actual fires, or vice versa.
The Fowlkes–Mallows Index (FMI) of 92.31% offers yet another geometric mean-based evaluation, this time between precision and recall. Like the G-Mean, it helps ensure balanced performance, but focuses specifically on the positive class predictions. This makes it particularly useful for imbalanced datasets where we care more about correctly identifying the minority class (fires) than the majority class (no fires). Cohen’s Kappa of 92.29% adds another layer to our understanding by measuring agreement between predicted and actual classifications while accounting for chance agreement. This is particularly relevant in imbalanced datasets where random chance could still produce seemingly good results due to the dominance of one class. Our high Kappa value indicates that the model’s performance is substantially better than what we would expect from random chance. The Diagnostic Odds Ratio (DOR) of 53,040.71 is particularly impressive. This metric represents the ratio of the odds of a positive prediction being correct to the odds of a negative prediction being incorrect. The high value indicates that our model has strong discriminative ability—it is much more likely to predict fire when there actually is a fire than when there is not.
Looking at class-specific metrics,
Figure 9 shows the extremely high specificity (99.98%) and negative predictive value (99.97%) show excellent performance in correctly identifying no-fire pixels. However, these need to be interpreted in the context of our low prevalence (0.30%), which highlights just how rare fire pixels are in our dataset. Lastly, the balanced accuracy of 95.73% and informedness (Youden’s J) of 91.45% provide additional balanced performance measures. These metrics give equal weight to the performance of both classes, preventing the majority class from dominating the evaluation. Their high values further confirm that our model performs well in both fire and no-fire cases.
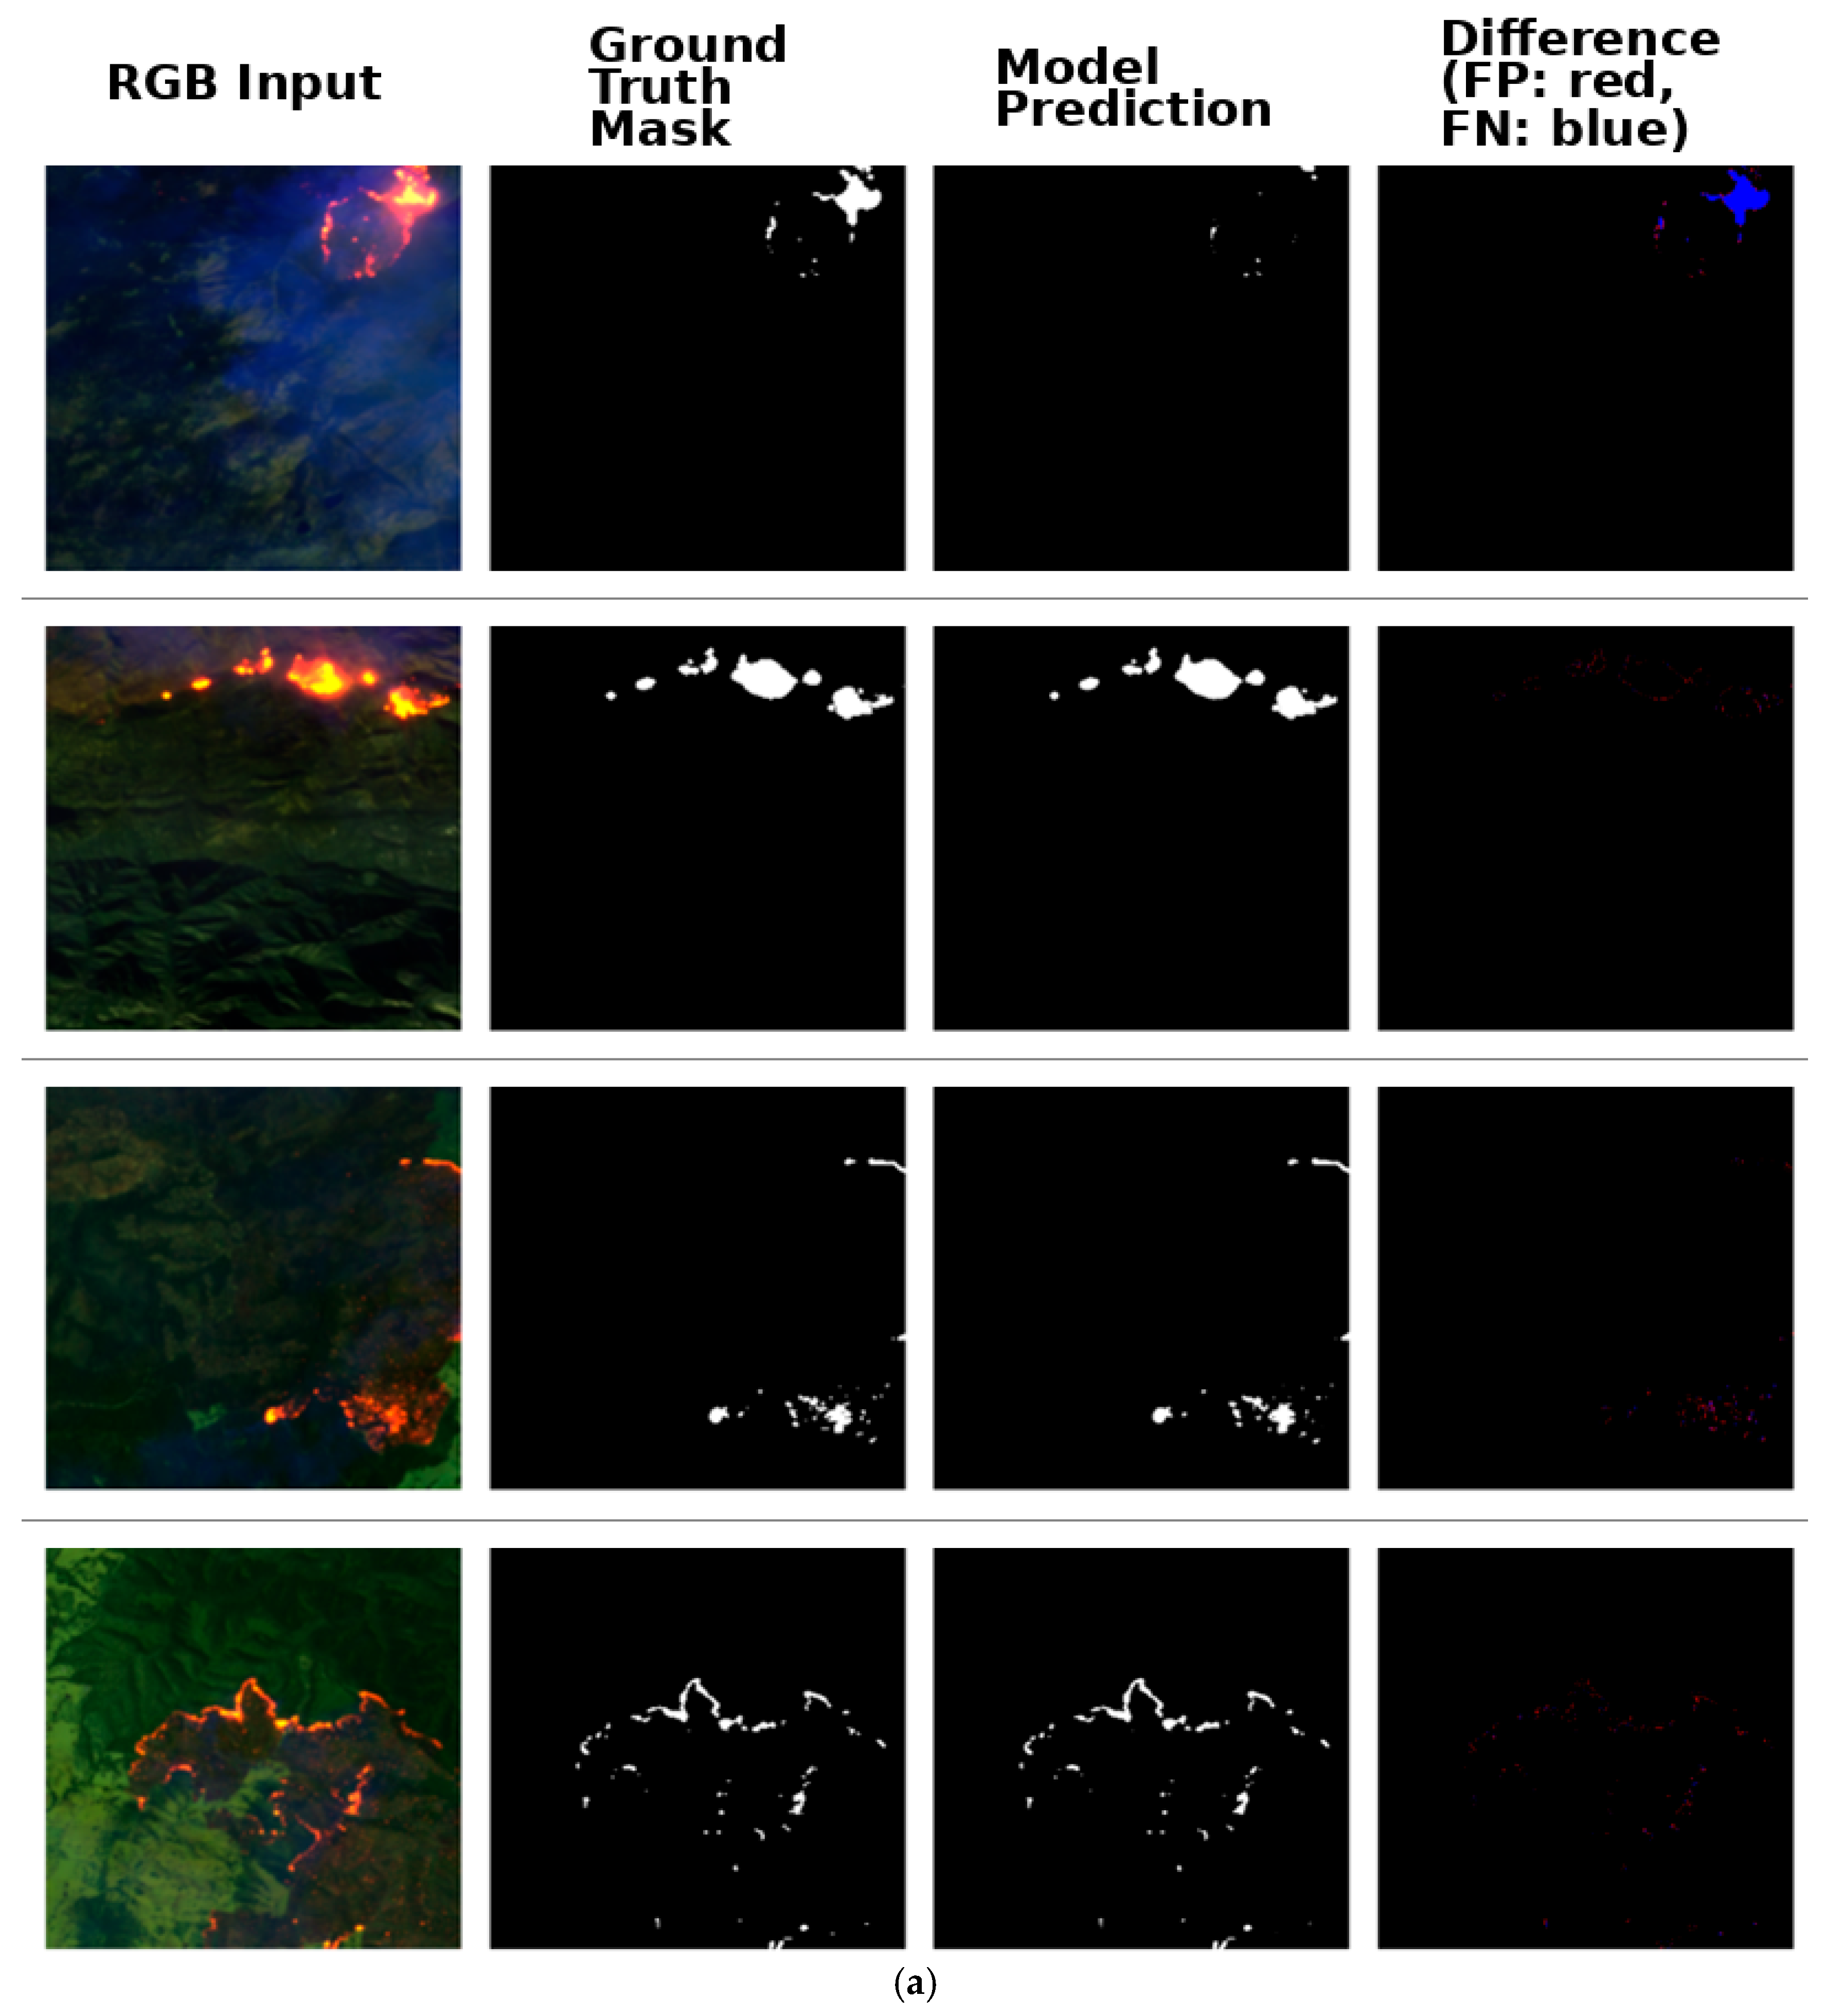
In
Figure 10a, looking closely at the four test cases, we can observe how the model processes the original satellite images where fires appear as bright orange-red patches against the darker vegetation. The ground truth column establishes the actual fire locations as determined by experts, serving as the benchmark for evaluation. When comparing the ground truth masks to the prediction column, we see nearly perfect alignment across all samples, indicating exceptional performance. The difference maps in the rightmost column reveal almost negligible discrepancies, with only tiny spots of coloration where the model’s predictions differ slightly from the ground truth. This suggests the algorithm has been highly optimized for wildfire detection tasks, likely through extensive training on similar satellite imagery. The model performs consistently well regardless of fire pattern complexity, from the scattered hotspots in the first row to the intricate fire perimeters in the fourth row.
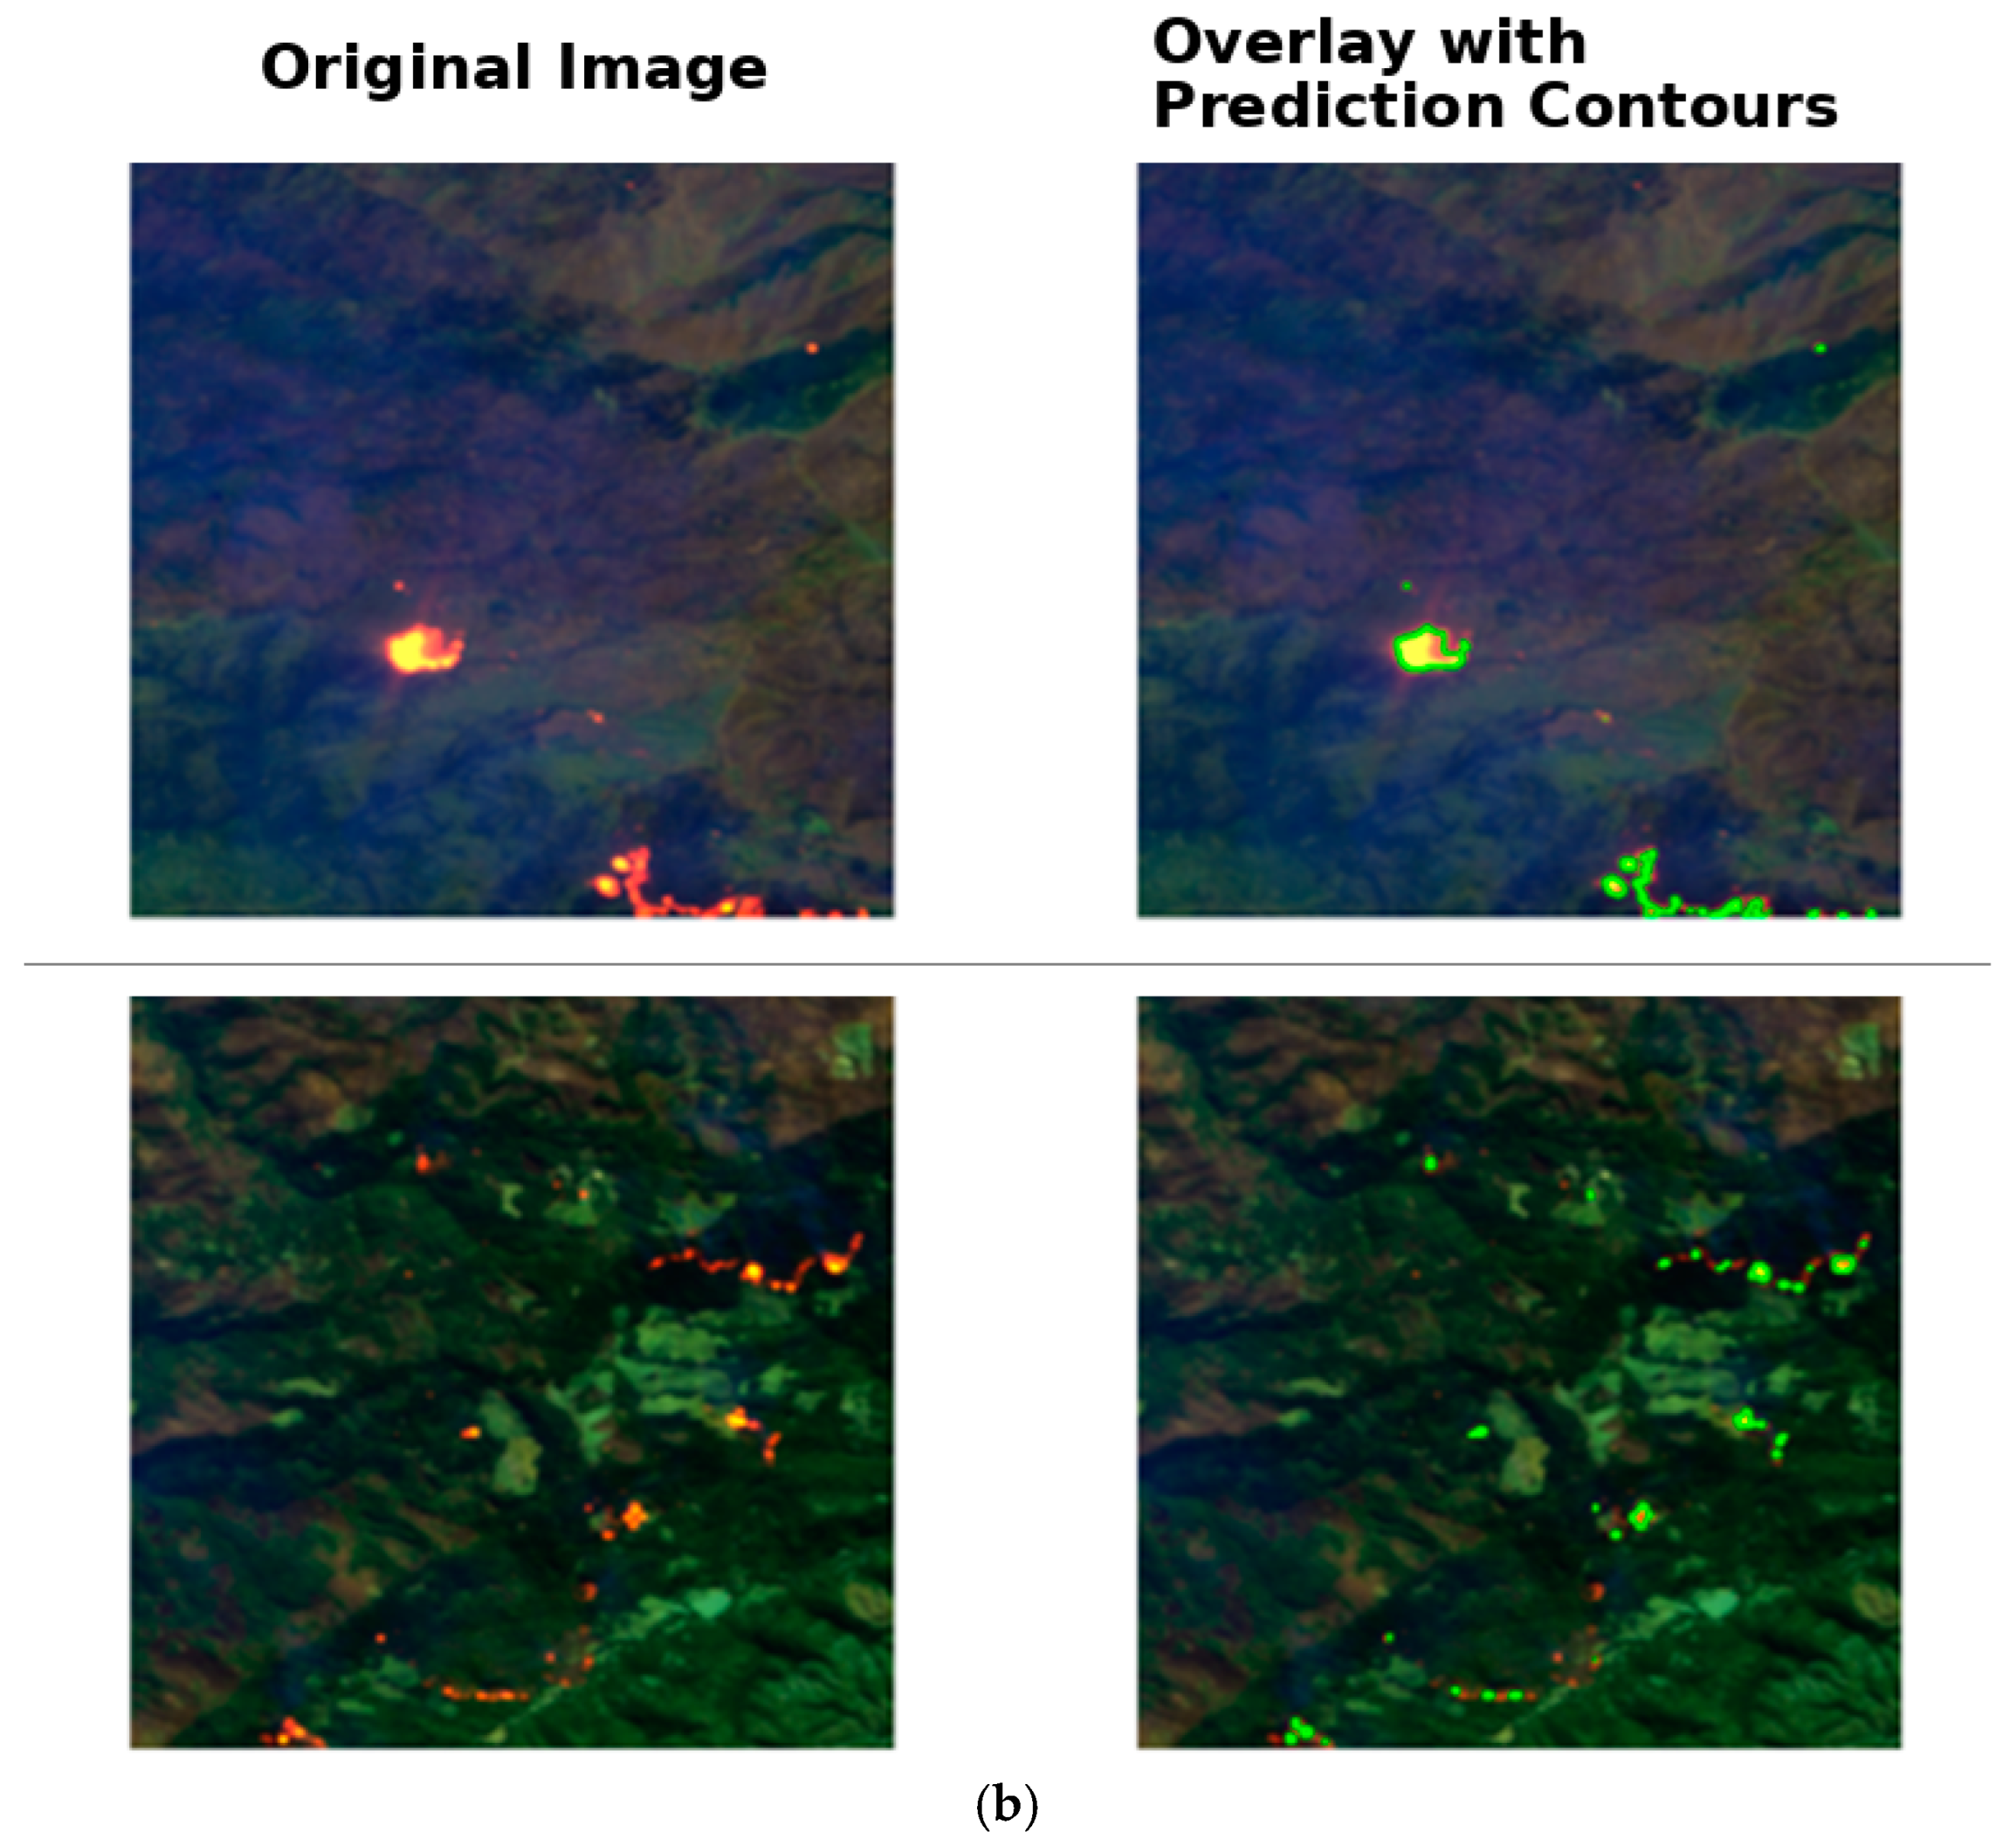
In
Figure 10b, the left column shows the original satellite imagery, where active fires appear as bright orange-red spots against the darker landscape. The terrain appears to be forested or vegetated areas, typical of regions where wildfire monitoring is crucial. The fires present different patterns—some appear as concentrated hotspots while others form more elongated burning lines along the terrain. Looking at the top pair of images, we can see how precisely the model outlines the main fire hotspot. The bright fire in the original image is accurately encapsulated by the green prediction contour, suggesting impressive performance in detecting well-defined, intense fire signatures. This accurate delineation is particularly important for understanding the exact extent of major fire events. The bottom pair presents a more challenging scenario with multiple scattered fire spots across a complex landscape. Here, the model demonstrates its ability to detect and outline multiple fire instances of varying sizes. The green contours closely match the pattern of the orange-red fire signatures in the original image, showing that the model maintains its performance even when dealing with distributed fire patterns.
4. Discussion
The study results reveal the major potential of merging DeepLabV3+ architecture with EfficientNet-B08 for advanced deforestation and forest fire detection. Deforestation detection results achieved pixel accuracy values of 0.9605 and best validation IoU of 0.9100, thereby demonstrating an important step over traditional remote sensing methods. The accuracy with boundary delineation shown by the clean contours presented in the visualization results deals with one other frequent challenge in forest monitoring—accurate determination of forest boundaries in complicated landscapes. Fire detection, meanwhile, attains an almost similar level of impressive performance, having a precision and recall of 93.16% and 91.47%, respectively. The balanced performance across various evaluation metrics measurable with a Matthews Correlation Coefficient of 92.29% indicates sound performance against the devastating class imbalance characteristic of wildfire detection. This balance is vital in practice, as false positives and false negatives incur substantial operational costs.
Despite the strong performance, several limitations warrant consideration. The model’s current implementation requires satellite imagery with specific spectral bands, which may not always be available in real-world applications. Future work could explore adaptations for use with more commonly available imagery sources or investigate fusion approaches combining data from multiple satellite platforms. The training process, while effective, requires significant computational resources, potentially limiting deployment in resource-constrained environments. Research into model compression techniques or lighter architectures could help address this limitation. Additionally, while the model shows strong performance across the test regions, further validation across more diverse geographical areas and forest types would strengthen confidence in its global applicability [
38]. Despite the superior performance demonstrated in our comprehensive comparison, several inherent limitations may affect the practical deployment of our DeepLabV3+ with EfficientNet-B08 approach. Computational complexity represents the most significant constraint, with EfficientNet-B08’s 87 million parameters requiring substantial GPU memory (16 GB+ VRAM), making real-time continental-scale monitoring computationally expensive compared to lighter alternatives like FastFCN.
Our immediate priority is to move beyond the two regional testbeds by establishing a truly global benchmark. We will assemble a stratified sample of Sentinel-2 tiles that matches the latitudinal and biome distribution of the Hansen Global Forest Change layer, the near-real-time GFW RADD alerts, and the FAO SEPAL baseline. Evaluating our model against these independent references will produce country-level confusion matrices and reveal any systematic biases across moist tropical, dry tropical, and temperate forests, providing the quantitative evidence that a global MRV system demands. A second line of work will quantify resilience to atmospheric and seasonal noise. Using Sentinel-2’s native cloud masks, we will create paired validation sets in which 5%, 15%, and 30% of pixels are occluded by clouds or bright haze and brightness is shifted to mimic low-sun and high-sun conditions. Measuring how IoU changes across this controlled ladder of perturbations will clarify the limits of the current augmentation regime and guide the design of targeted data fusion or enhancement strategies. Secondary, Synthetic Aperture Radar (SAR) imagery provides distinct benefits for forest monitoring because of its ability to penetrate cloud cover and operate in darkness. This capability is especially valuable in tropical regions where persistent cloud cover often limits the effectiveness of optical satellite monitoring. For example, in the Amazon rainforest, where cloud cover can persist for months during the rainy season, SAR data could help maintain continuous monitoring capabilities that our current system might struggle to provide. The technical implementation of SAR integration would require careful consideration of several factors. SAR data presents different characteristics from optical imagery, particularly in terms of its backscatter properties and speckle noise patterns.
The integration of SAR data could particularly benefit our fire detection capabilities. While our current system shows strong performance with a precision of 93.16% and recall of 91.47%, SAR’s ability to detect structural changes in forest canopy could help identify fire damage even when smoke or clouds obstruct optical views. This could be especially valuable given our current class imbalance challenges, as SAR data might provide additional discriminative features for fire detection. However, incorporating SAR imagery also presents several challenges that must be addressed. SAR data typically has different resolution and noise characteristics from optical imagery, which could affect our current high precision in boundary detection. The system’s current performance metrics (pixel accuracy of 0.9605 and best validation IoU of 0.9100 for deforestation detection) were achieved using specific optical spectral bands. Maintaining similar performance levels while incorporating SAR data would require careful attention to data fusion strategies and potentially new approaches to extraction. The ability to precisely monitor both gradual deforestation and sudden events like forest fires provides valuable tools for policymakers and conservation organizations. The system’s balanced performance across different types of environmental change detection suggests a pathway toward more comprehensive environmental monitoring systems. This could lead to an improved understanding of forest ecosystem dynamics and more effective conservation strategies.
The technical advances demonstrated here may also find applications in related fields such as urban growth monitoring, agricultural land use change detection, and other environmental monitoring applications. Our current ASPP module would need adaptation to effectively process SAR’s unique spatial characteristics. The GroupNorm layers we currently use might prove advantageous for SAR processing, as they could help manage the high dynamic range typically found in radar imagery. One promising approach would be to implement a dual-stream architecture where SAR and optical data are processed in parallel before fusion. The skip connections and feature refinement modules in our current implementation could be extended to handle both data streams, potentially improving the system’s ability to detect forest changes under varying atmospheric conditions. The decoder pathway’s progressive upsampling approach would need careful modification to handle the different spatial characteristics of SAR data while maintaining the high boundary detection precision demonstrated in our current results. To overcome the chronic cloud cover that hampers optical sensors in many tropical regions, we will develop a staged optical-plus-SAR fusion program. The first stage will prototype feature-level fusion of Sentinel-1 VV/VH backscatter with the existing four optical bands on a 5000-patch pilot set. The second stage will retrain the network with dual-stream encoders, followed by an ablation study to identify the most effective fusion depth. The final stage will deploy the fused model across the Amazon basin, evaluating both accuracy and latency in an operational monitoring workflow. The integration of SAR imagery represents a promising extension to our DeepLabV3+/EfficientNet-B08 system that could significantly enhance its all-weather monitoring capabilities.


