Abstract
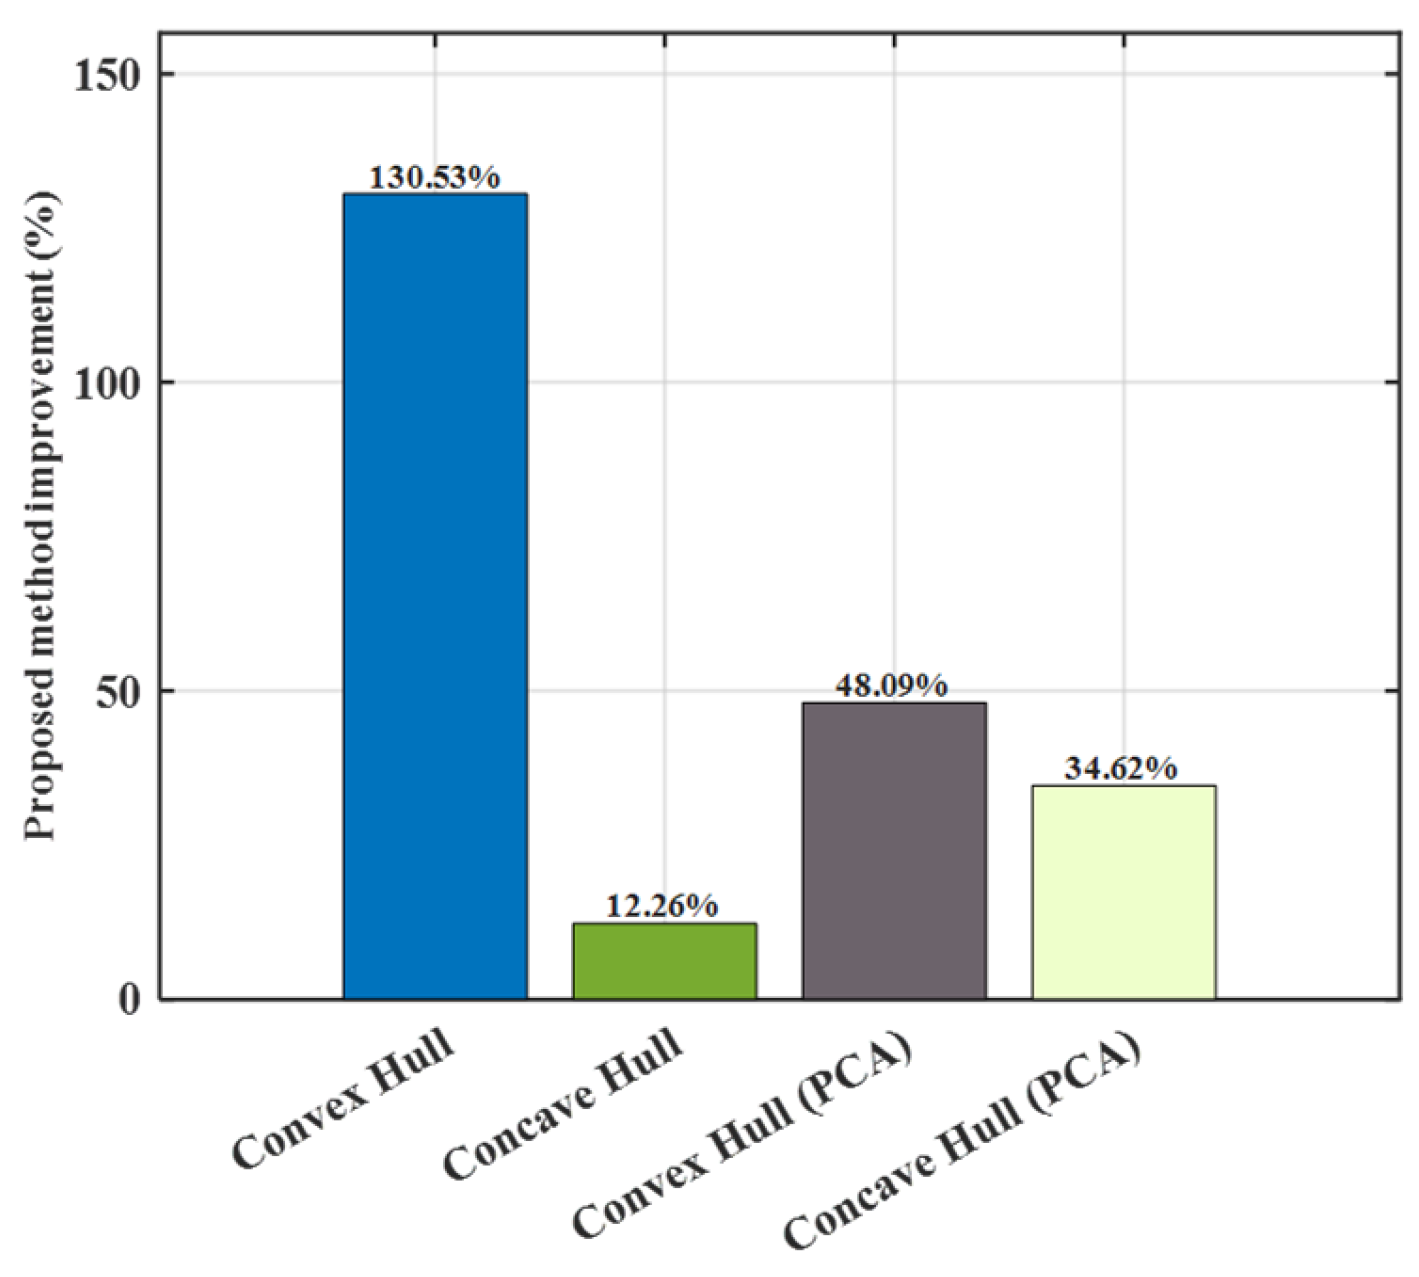
Multi-feature radar target detection enhances the discrimination between targets and clutter, thereby improving detection accuracy. However, the complex nonlinear dependencies among features present significant challenges for precise control of the false alarm rate (FAR). In this paper, a novel constant false alarm rate (CFAR) framework for multi-feature detection is proposed. First, a Copula-CFAR theorem is established, which models the feature dependence structure and enables the derivation of closed-form expressions for probability of false alarm (PFA) and detection probability across various Copula models. Based on this theory, a multi-feature target detection algorithm is developed to achieve a predefined PFA. Simulation and experimental results validate the effectiveness of the approach. The method outperforms conventional CFAR detectors, including CA-CFAR, OS-CFAR, GO-CFAR, and SO-CFAR. Furthermore, compared to state-of-the-art detectors that utilize three features derived from convex hull, concave hull, convex hull principal component analysis (PCA), and concave hull PCA, the proposed method, which uses only two features, achieves relative improvements of 130.53%, 12.26%, 48.09%, and 34.62%, respectively, at a measured FAR of 0.001.
1. Introduction
Radar target detection is a fundamental task in maritime remote sensing, underpinning critical applications such as ocean surveillance, navigation safety, and environmental monitoring [1,2,3,4]. A key performance indicator in such systems is the false alarm rate (FAR). An excessively high FAR can not only lead to missed detections but also trigger unnecessary alarms, which can affect system efficiency and decision-making quality. Therefore, maintaining a stable constant false alarm rate (CFAR) in complex environments is one of the core challenges in radar target detection [5,6]. Therefore, the design of detectors with stable and controllable CFAR characteristics is vital, especially in complex and nonhomogeneous sea clutter environments.
Numerous approaches have been developed to enhance FAR control by adopting more accurate clutter models. For instance, Liu et al. utilized higher-order cumulants to reduce the minimum signal-to-noise ratio (SNR) and achieved FAR control under Gaussian and Weibull clutter conditions [7]. Mbouombouo et al. investigated the problem of FAR control in mixed Weibull-distributed sea clutter environments, effectively enhancing target detection performance [8]. Additionally, Zhang et al. developed a new detector based on Bayesian inference, achieving effective FAR control in Weibull clutter environments [9]. Wu et al. studied radar target detection in non-zero mean compound Gaussian sea clutter with inverse gamma, gamma, or inverse Gaussian random texture variables, controlling the FAR and improving detection accuracy [10].
In recent years, the integration of multi-dimensional and multi-domain features has significantly enhanced detection performance [11,12,13,14,15]. However, extending conventional CFAR techniques to multi-feature detection remains a challenge. These methods typically rely on assumptions about the distribution of background clutter, which may not hold when the feature space becomes high-dimensional or when the statistical properties of sea clutter are highly uncertain. This issue is further exacerbated in nonstationary or dynamic maritime environments.
To address FAR control in multi-feature detection scenarios, several recent works have explored advanced feature space transformations, statistical dependency modeling, and geometric decision strategies. Coluccia et al. mapped and analyzed the data within the CFAR feature plane, deriving analytical expressions for the trajectories and shapes of clusters within this plane [16]. Subsequently, Coluccia et al. used two maximum invariant statistics to construct the CFAR feature plane, mapping the observation data onto this plane, and designed detectors by analytically describing the shapes and trajectories of data clusters within the CFAR feature plane [17]. Taheri-Kalani et al. employed an iterative Markov chain model to solve the joint probability of false alarm under multi-dimensional joint distributions, thereby avoiding high-dimensional integration and computing the probability distribution of alarm signals in the steady state [18]. Other studies have designed shape-aware detection rules using convex/concave hulls and adaptive thresholding techniques [19,20,21].
Meanwhile, the rise of machine learning (ML) and deep learning (DL) techniques has stimulated a wave of CFAR-related research. Li et al. combined CFAR with density-based clustering for ship detection in SAR images [22]. Diskin et al. developed a deep learning framework by constructing a neural network and incorporating a CFAR loss function during the training process, ensuring that the neural network could learn to control the FAR in various environments [23]. Chen et al. utilized Point-Net to extract global and local features and employed a Monte Carlo simulation method to determine threshold values for FAR control [24]. Zhou et al. controlled the FAR by adjusting the minimum leaf node size in decision trees, thereby meeting the target detection requirements in different sea surface environments and improving detection probability [25]. Zeng et al. proposed CFAR-based polarimetric detectors, CFAR field generators, and CFAR-guided polarimetric networks to enhance detection sensitivity in large-scale SAR ship detection using deep learning techniques [26].
Despite these advances, two critical limitations persist. First, conventional CFAR detectors lack the flexibility to model complex nonlinear dependencies among features in high-dimensional spaces. Second, most ML- and DL based approaches function as black-box models, making it difficult to establish an interpretable or analytical relationship between the detection thresholds and probability of false alarm (PFA). These limitations highlight an urgent need for a theoretically grounded framework capable of explicitly modeling multi-feature dependencies and deriving analytical expressions for FAR control.
In recent years, Copula theory has attracted widespread attention in various fields such as structural reliability analysis, radar detection, and image recognition due to its powerful capability in modeling complex dependencies among random variables. In the field of structural reliability analysis, Lu et al. proposed a dimensional synchronous modeling-based enhanced Kriging algorithm combined with an adaptive Copula approach [27], which effectively enables synchronized reliability modeling and correlation analysis for multi-objective systems. In the domain of distributed radar detection, Ni et al. further advanced the Copula-based fusion framework [28] by introducing a fast Copula-based decision fusion algorithm. This method maintains modeling accuracy for statistical dependencies while substantially reducing computational complexity, making it particularly suitable for multi-sensor systems with correlated node observations. Additionally, in radar image target recognition, Karine et al. adopted a multivariate Copula statistical modeling approach to characterize radar images in the complex wavelet domain. By combining this with a weighted sparse representation-based classifier, their method achieved notable improvements in target recognition performance for both SAR and ISAR images [29]. While Copula models have been widely applied in domains such as finance [30], structural reliability [31], hydrological modeling [32], and drought management [33], their application in radar detection remains limited. A few recent efforts have explored Copula theory in remote sensing tasks such as change detection [34], PolSAR classification [35], and decision-level fusion in distributed radar networks [28]. However, its capabilities for multi-feature CFAR detection have yet to be fully realized. To address this challenge, we propose a Copula-based multi-feature CFAR detection framework. Copula theory enables the decomposition of multivariate joint distributions into marginal distributions and a dependence structure, making it particularly suited for flexible and accurate modeling of nonlinear and heterogeneous feature relationships [36].
Furthermore, a theoretical framework that derives explicit analytical expressions linking the PFA and detection threshold for multi-feature radar detection remains underdeveloped. This paper makes the following key contributions:
- Copula-based modeling of feature dependence: We propose a Copula-based feature fusion method to flexibly capture nonlinear dependencies among radar features under complex sea clutter conditions.
- Analytical PFA control: We derive explicit mathematical expressions linking the detection threshold to the PFA using the Copula framework, enabling interpretable FAR control in high-dimensional feature spaces.
- Copula-CFAR detection framework: We design a complete Copula-CFAR detection framework and validate its performance through simulations and real-scene experiments, demonstrating superior robustness and detection accuracy compared to existing methods.
The remainder of this paper is organized as follows. Section 2 introduces the problem formulation and develops the Copula-based CFAR theory and detection algorithm in detail. Section 3 discusses simulation experiments and provides experimental validations. Finally, the discussion and conclusions are provided in Section 4 and Section 5.
2. Method
Let , for , represent the received signal across range cells. Assuming the noise energy is significantly weaker than that of the sea clutter, the noise component is neglected in this analysis. If a range cell contains a target, comprises both the target signal and sea clutter; otherwise, it contains only sea clutter. Target detection in sea clutter is formulated as the following binary hypothesis test [10,14,21,37]:
where and denote the signals in the cell under test (CUT) and the reference cell, respectively. Here, is the number of reference units, represents the target signal, and and denote the sea clutter signals in the CUT and the reference cell. Under , the CUT contains only sea clutter; Under , it contains both a target signal and sea clutter. Furthermore, the spatial homogeneity assumption implies that the clutter in the reference cell shares identical statistical properties.
Building upon the problem formulation introduced in the previous section, this paper presents the Copula-based constant false alarm rate (Copula-CFAR) theory and derives the mathematical relationship between the specified PFA () and the corresponding detection thresholds under commonly used Copula structures.
2.1. Detection Theorem
Copula functions provide a robust framework for capturing complex dependencies among random variables by decomposing the joint distribution into marginal distributions. Especially in complex sea conditions, sea clutter exhibits extreme values and heavy-tailed distributions due to sea surface fluctuations, wind waves, and other environmental influences. These characteristics present significant challenges for traditional modeling approaches. Copulas facilitate a more detailed evaluation of tail dependencies and nonlinear relationships, offering a more accurate and refined analysis.
Lemma 1
[38]. For any set of random variables , the joint cumulative distribution function (CDF) can be expressed as:
where denotes the Copula function, and represent the marginal CDF of , respectively.
Theorem 1 (Copula-CFAR).
Let represent the features extracted from the sea clutter range cell, the is defined as:
under the null hypothesis
where is the threshold, is the marginal distribution function.
Define detection probability , it follows that:
The statistic is defined as:
when , reject the null hypothesis .
Proof.
Let the random vector represent the features extracted from the sea clutter range cell. Its joint CDF under hypothesis is given by
According to Sklar’s theorem, this joint distribution can be expressed in terms of the marginal distributions and a copula function:
given that the PFA is defined as by complementary probability as well as the definitions of the joint distribution and the copula function, it follows that
Similarly, the probability of detection under hypothesis is given by
Define the statistic , so it satisfies.
Then, the decision rule is as follows: if , we decide hypothesis ; otherwise, we decide .□
2.2. Corollaries for Different Copula Function
To further explain Theorem 1, three corollaries are presented, each corresponding to different Copula types and distribution characteristics. Analytical expressions for the feature thresholds associated with a specified are derived, followed by the derivation of the detection probability . These derivations assume equal contribution from each feature, assigning them equal significance in the radar target detection process. Specifically, under the equal contribution assumption, we set , where and represent the distribution functions of two features, and and are the corresponding thresholds for these features. The adoption of the equal contribution assumption helps simplify the complexity of the model and ensures a fair contribution from each feature during the analysis.
Corollary 1.
Independent Copula with identical marginal distributions.
Assume that the features and follow exponential distributions with parameter . Their CDFs at thresholds for the feature , are given by
where and are independent random variables, and their dependence structure is described by the independent Copula
under the equal contribution assumption, set
for a given , Theorem 1 implies
therefore,
which results in
Furthermore, under hypothesis, the features still follow exponential distributions but with a different parameter . Then the survival function under is
the detection probability is
since,
where is the Copula function under the hypothesis. According to the independent Copula and the equal contribution assumption,
with
Since which simplifies to
Corollary 2.
Clayton Copula with the same distribution type but different parameter marginal distributions.
For emphasizing lower-tail dependency of features, the Clayton Copula is considered. Its form is given by
Assume that feature follows an exponential distribution with parameter and the feature follows an exponential distribution with parameter . At thresholds for the feature , we have ,.
Under the equal contribution assumption, set
according to Theorem 1, the following relationship holds
solving these yields
and the detection thresholds are then given by
Under the alternative hypothesis, the detection probability is defined the same as in Equation (17). Since the joint CDF under is modeled by the Clayton Copula with parameter , we have
under the equal contribution assumption under condition, , according to , the detection probability is given by
Corollary 3.
Gumbel Copula with different marginal distributions.
Focusing on the upper-tail dependency among features, the dependency structure is modeled by the Gumbel Copula, which is expressed as
if follows an exponential distribution with parameter and follows a uniform distribution , then under the equal contribution assumption, the Copula structure becomes
according to Theorem 1, the expression for is derived as
the analytical expressions for the detection thresholds are given by
Furthermore, using the Gumbel Copula and the equal contribution Thus, the joint CDF is . Consequently, the detection probability is
2.3. Copula-Based Target Detection Algorithm
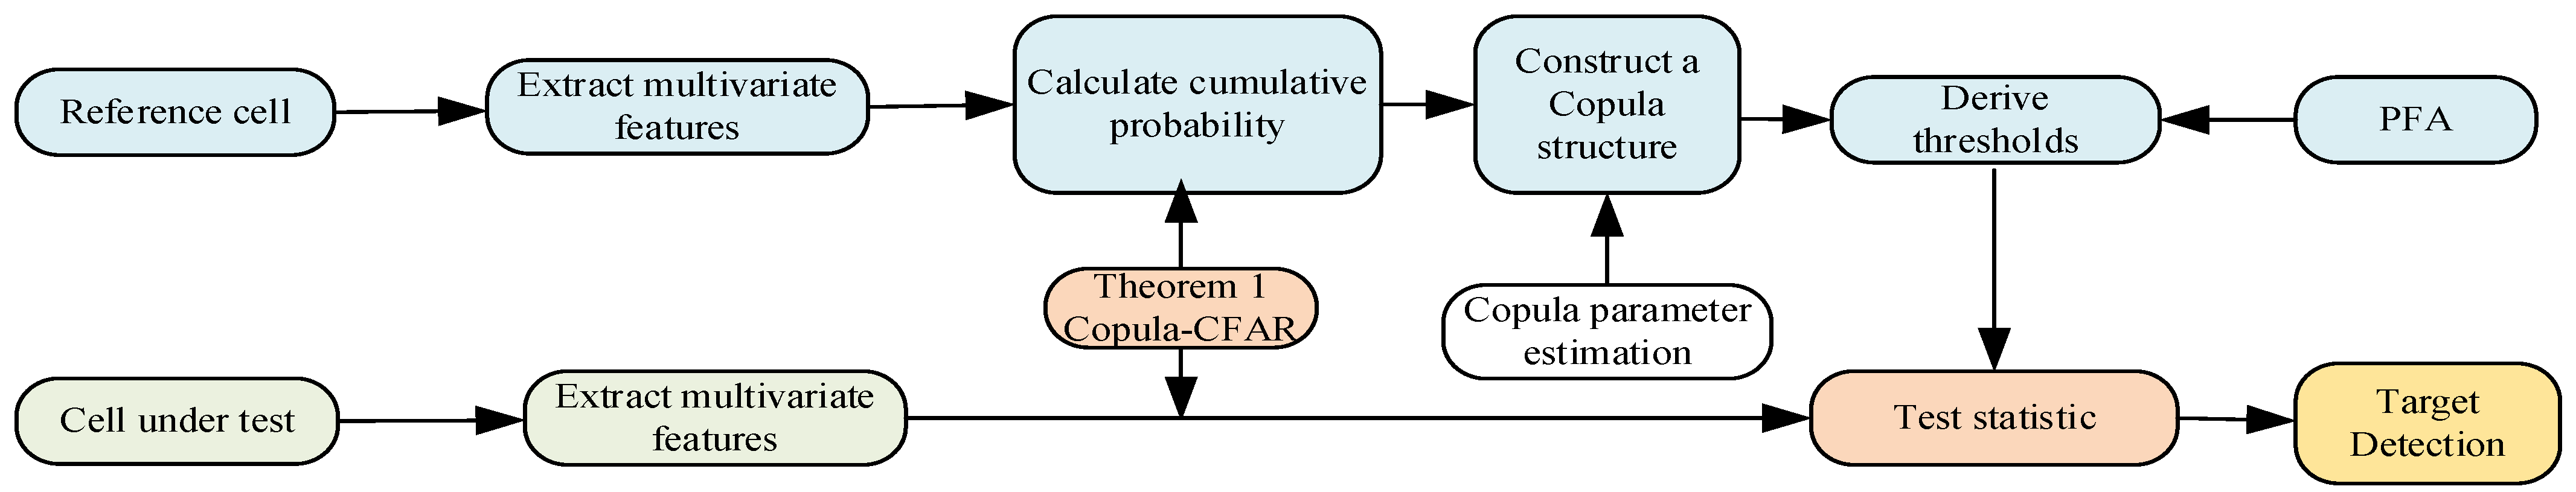
In this section, a novel radar target detection algorithm based on the Copula-CFAR theory is proposed. This approach allows for efficient fusion of the features while maintaining strict control of the FAR. The algorithm is divided into three main steps, as described below:
Step 1: Threshold determination.
- Extract multivariate features from the radar echo signals, and estimate the marginal CDF for each feature .
- For each observed feature value , calculate its cumulative probability
- Construct a Copula structure based on the marginal distributions of the features and estimate the parameters of Copula function.
- For a given , the thresholds are derived by this equation .
Step 2: Definition of the test statistic .
- Using the thresholds calculated in Step 1, transform each feature value as follows:
- Define the test statistic as the maximum value of the transformed features:
Step 3: Target detection decision.
The decision rule is defined as follows:
- If conclude that a target is present.
- If , we fail to reject the null hypothesis , indicating that the observed signal is attributable to sea clutter.
The framework diagram of the algorithm is shown in Figure 1.

Figure 1.
Framework diagram of the detection algorithm.
3. Result
3.1. Simulation Validation
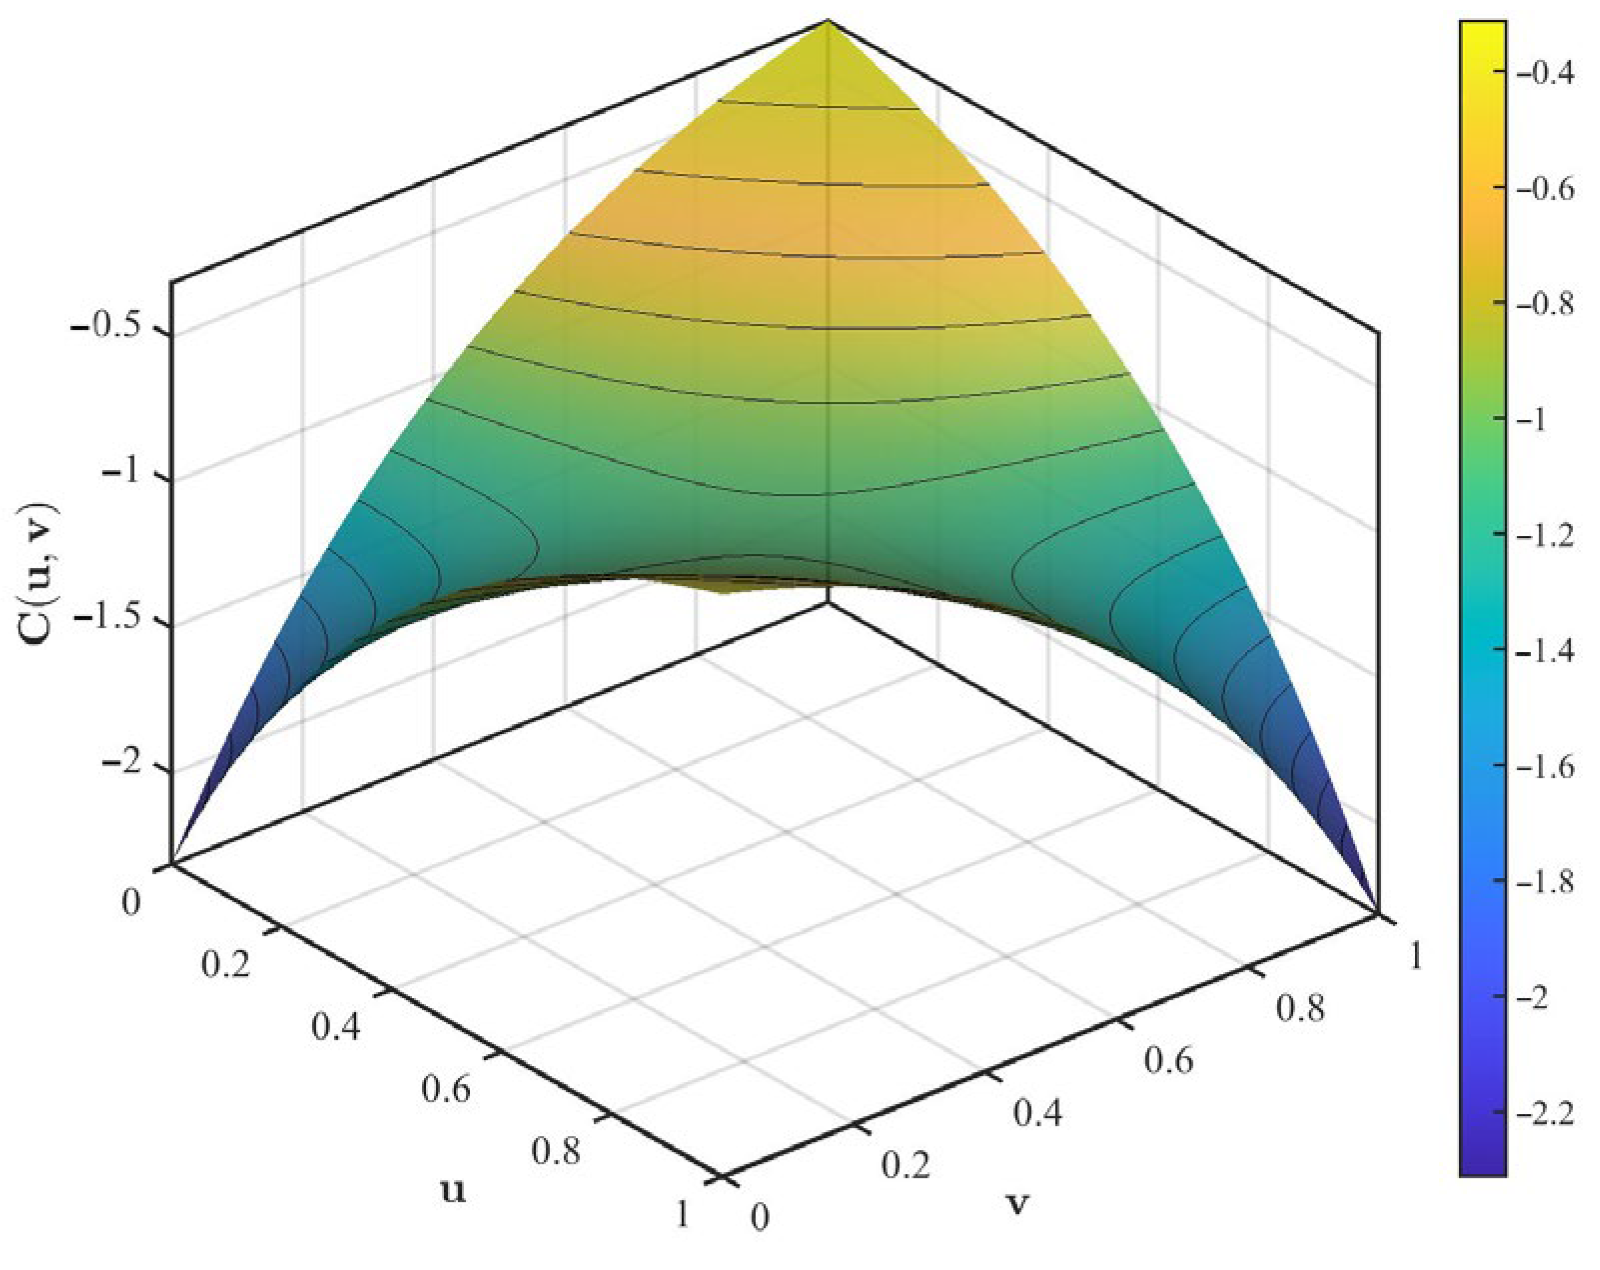
The Frank Copula is employed to capture both the upper tail and lower tail nonlinear correlation dependencies between and . This Copula is expressed as follows:
Two features and are extracted from reference cell, following Beta distributions with parameters , for and , for . The Frank Copula parameter is set as . This simulation validates the FAR control capability of the multivariate features based on the Copula-CFAR method. Figure 2 presents the joint probability density functions of the features and with the Frank Copula.
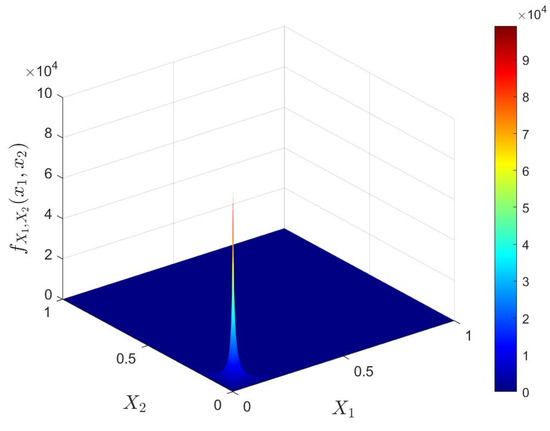
Figure 2.
Joint density functions with Frank Copula.
The Frank Copula structure for and is depicted in Figure 3, where providing a clear visualization of their nonlinear dependencies.

Figure 3.
Frank Copula for .
According to Theorem 1, the boundary thresholds can be derived as
with .
The detailed derivation is provided in Appendix A. Furthermore, the CDF of features and under the target present hypothesis are , respectively. Under the equal contribution assumption for detection, we set , and the detection probability is
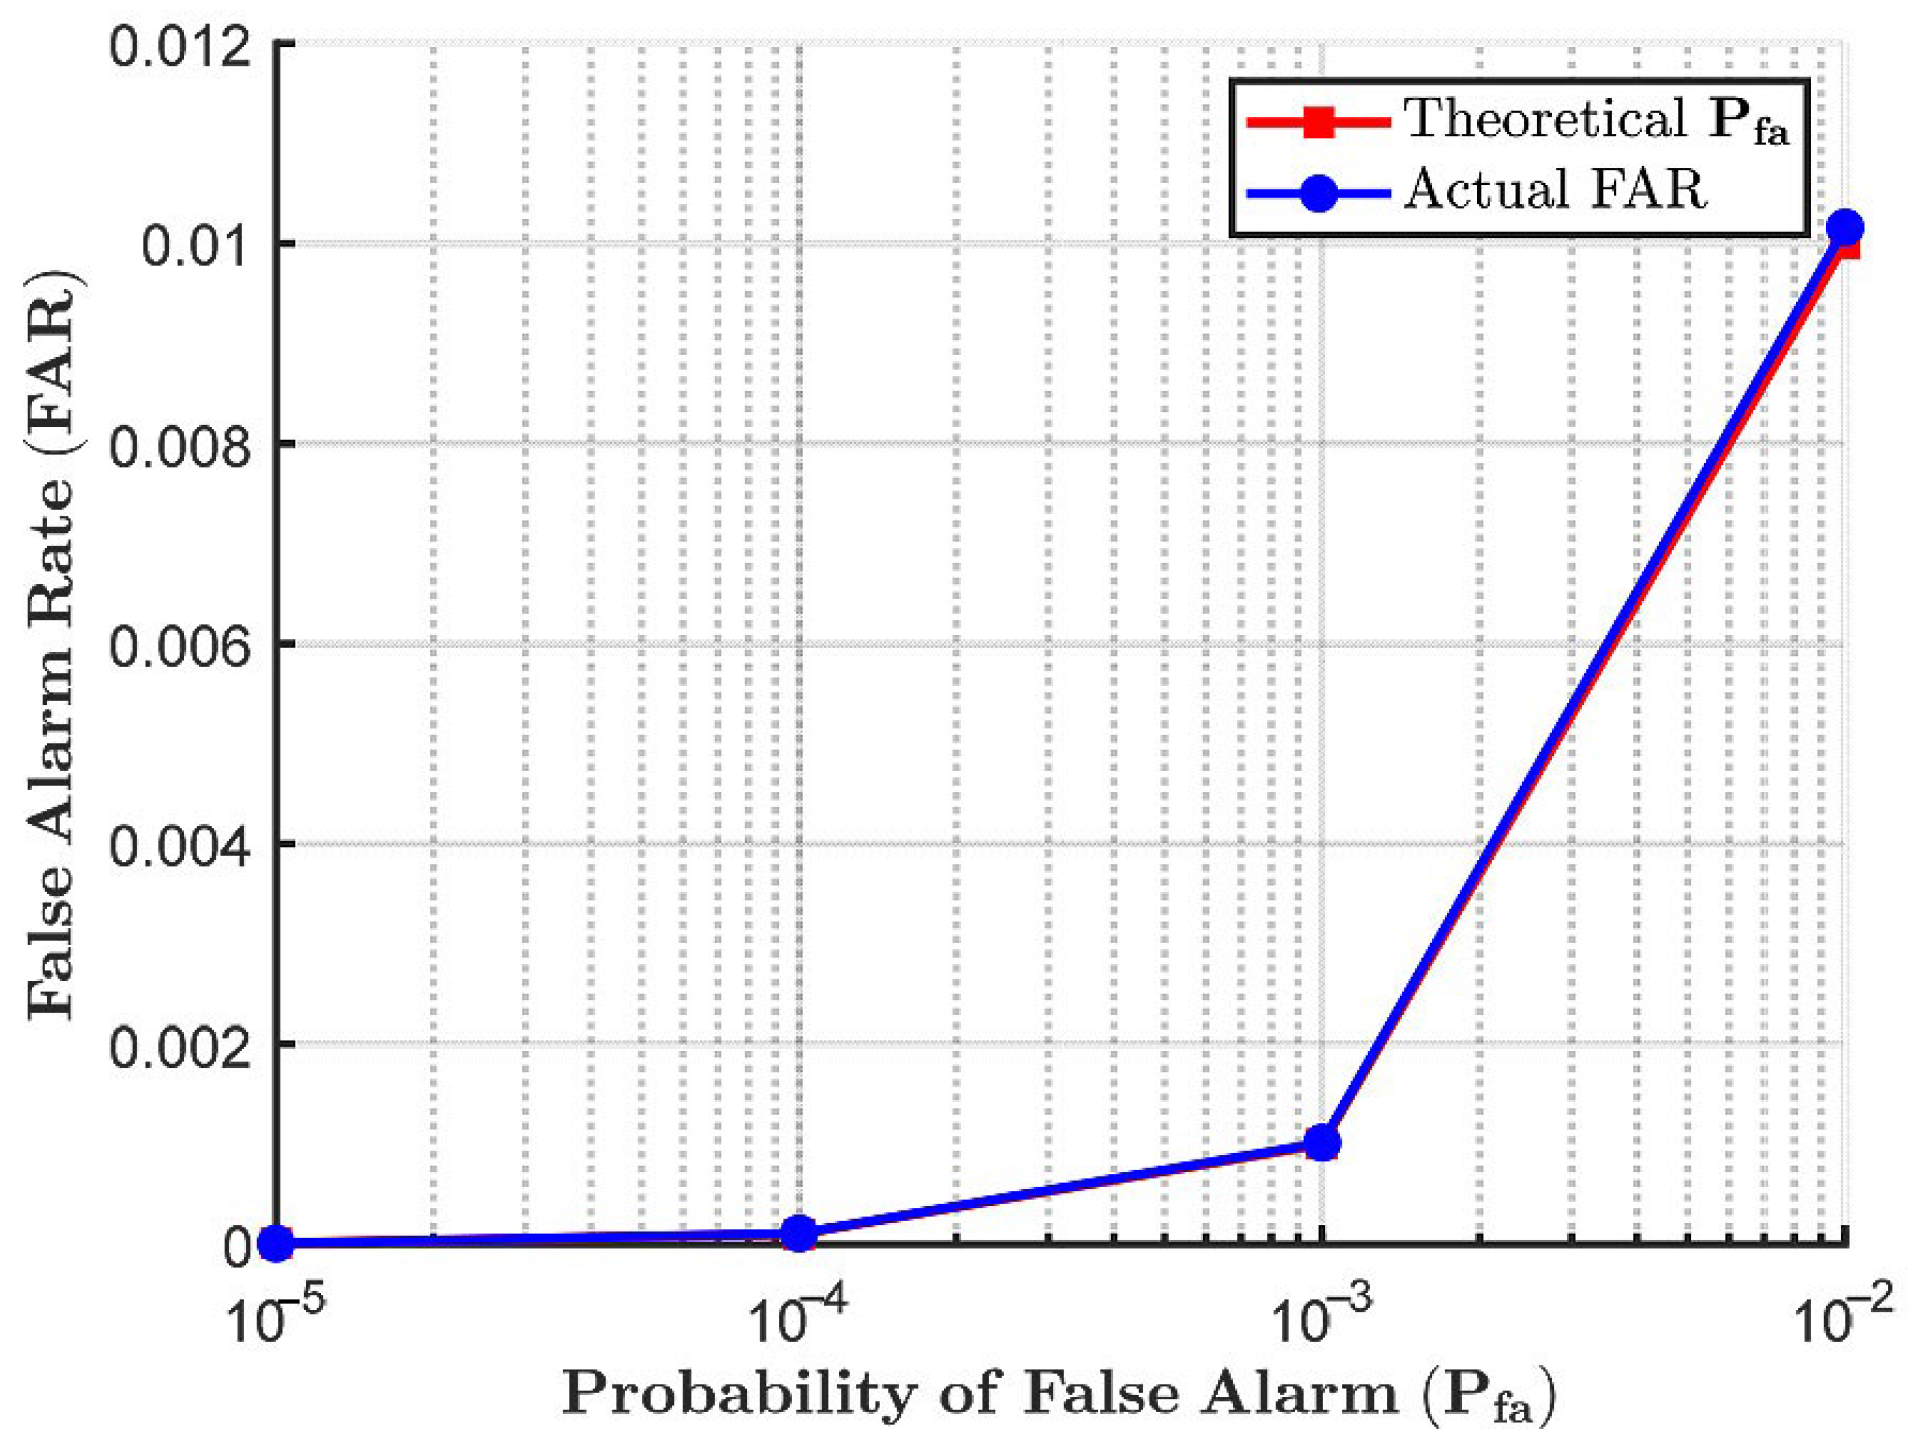
To further validate the false alarm control capability of the proposed method, we evaluate its performance for different false alarm probabilities at , , and with a sample size of . The comparison between the actual FAR and the given is shown in Figure 4. As observed, the actual calculated FARs are very close to the theoretical at different PFA levels.
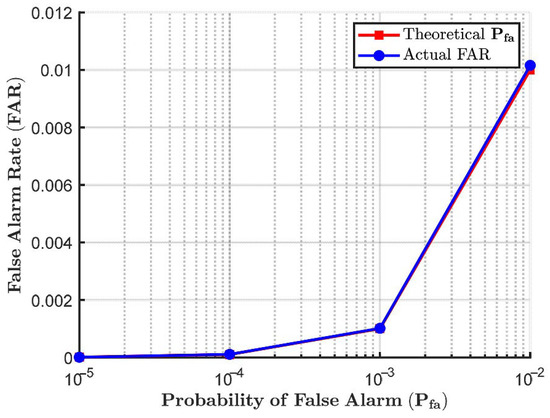
Figure 4.
Validation of FAR using simulated data.
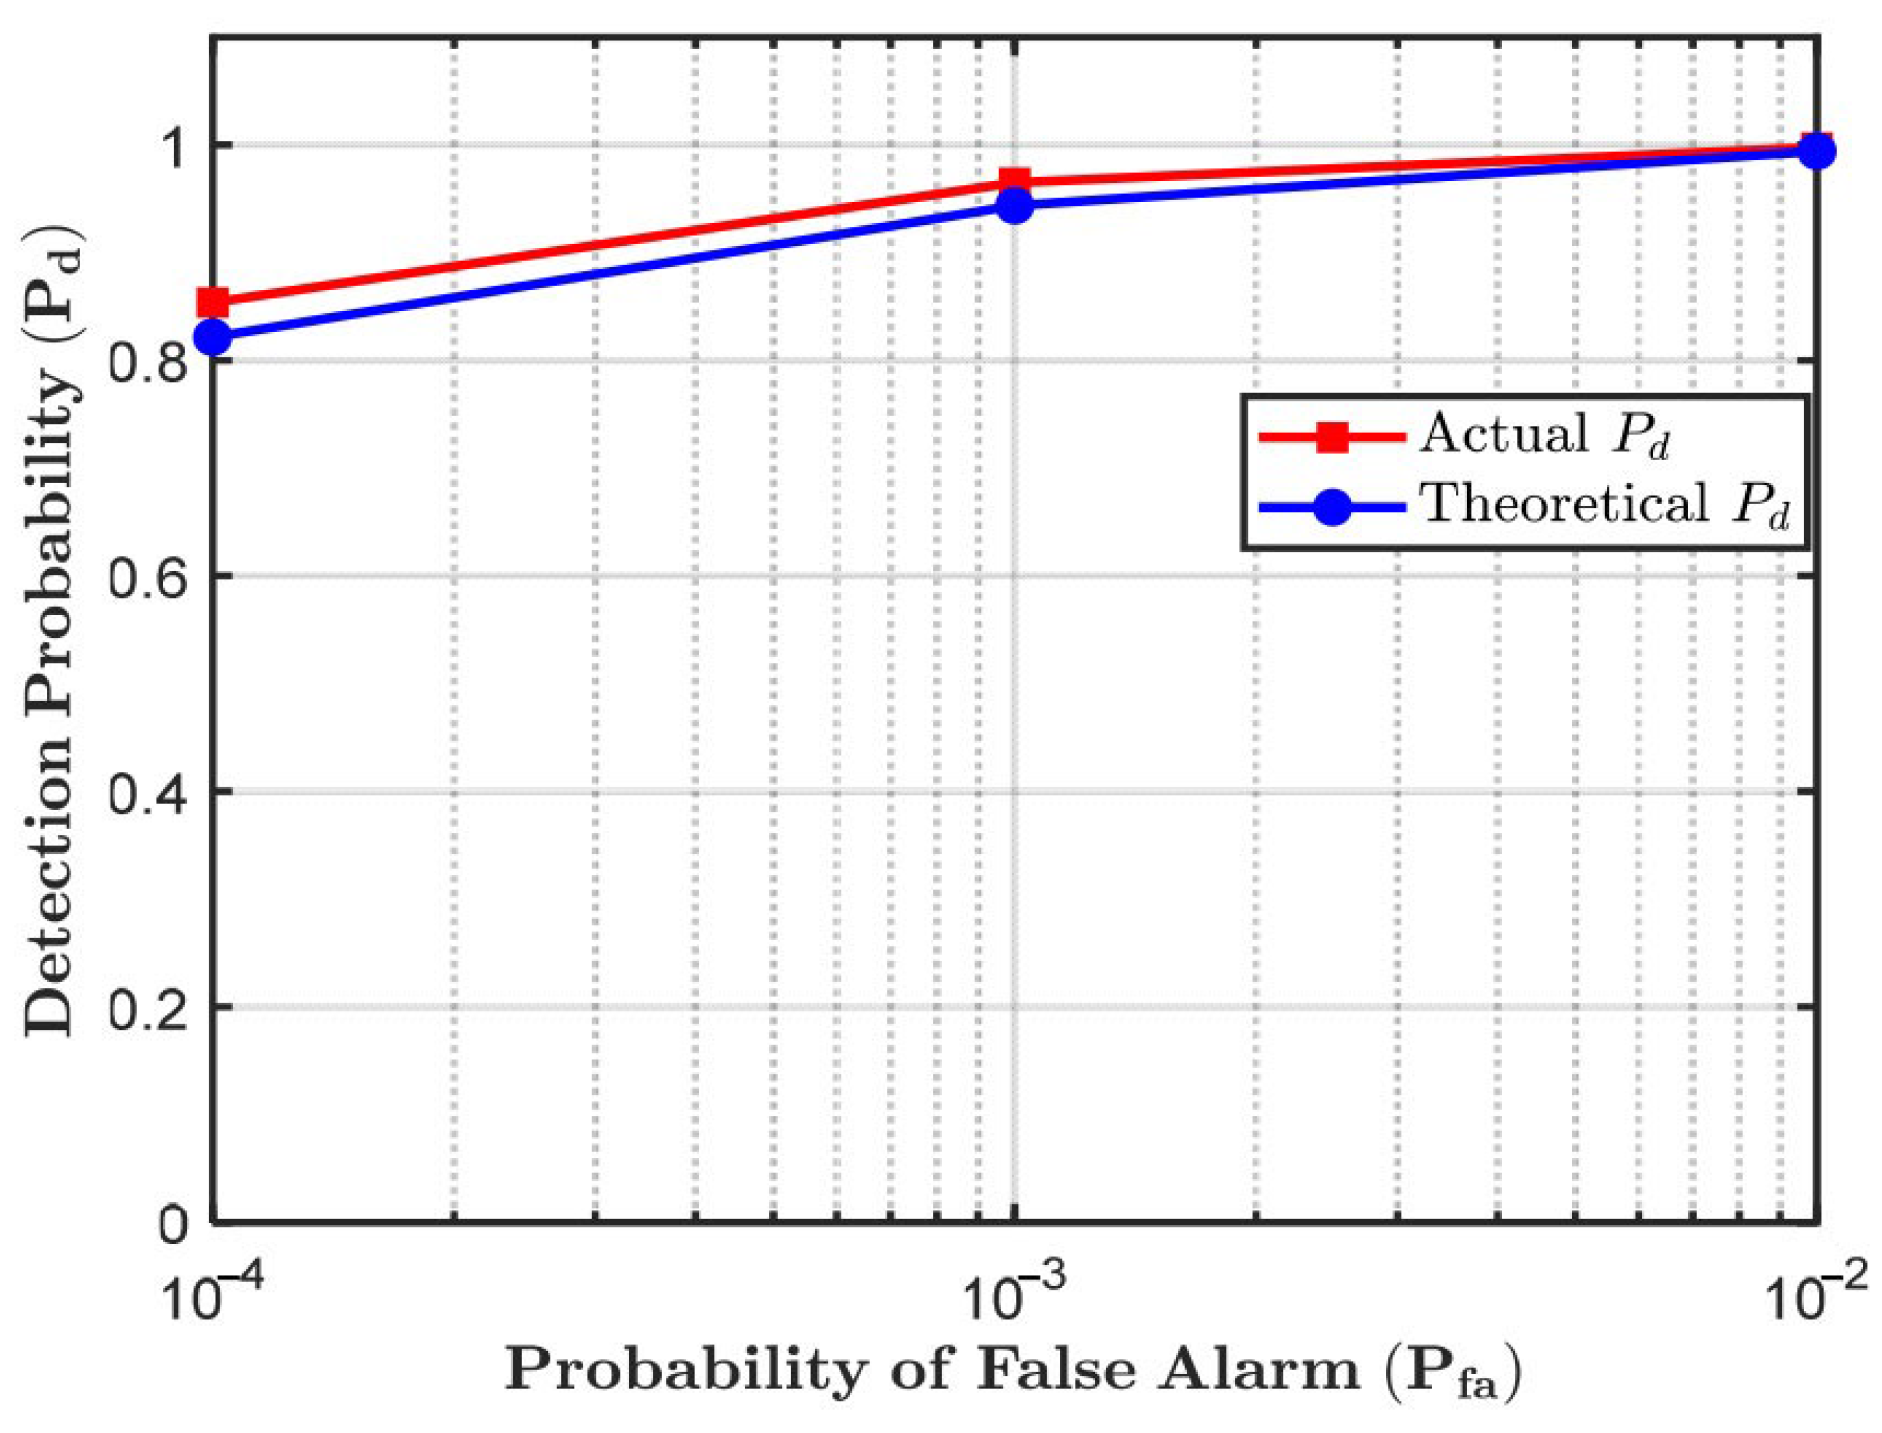
Assuming that the target cell features and follow Beta distributions with parameters , for , and , for . The comparison between the actual and theoretical detection probabilities is presented in Figure 5. Both the actual and theoretical detection probabilities exhibit consistent trends, and the numerical values are quite close, demonstrating that the proposed theoretical model effectively characterizes the detection performance.
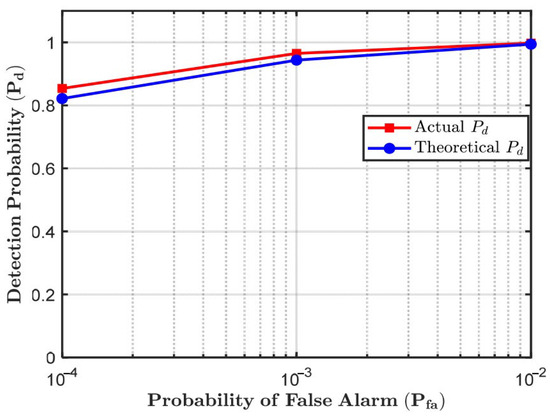
Figure 5.
Validation of detection rates using simulated data.
3.2. Experimental Validation
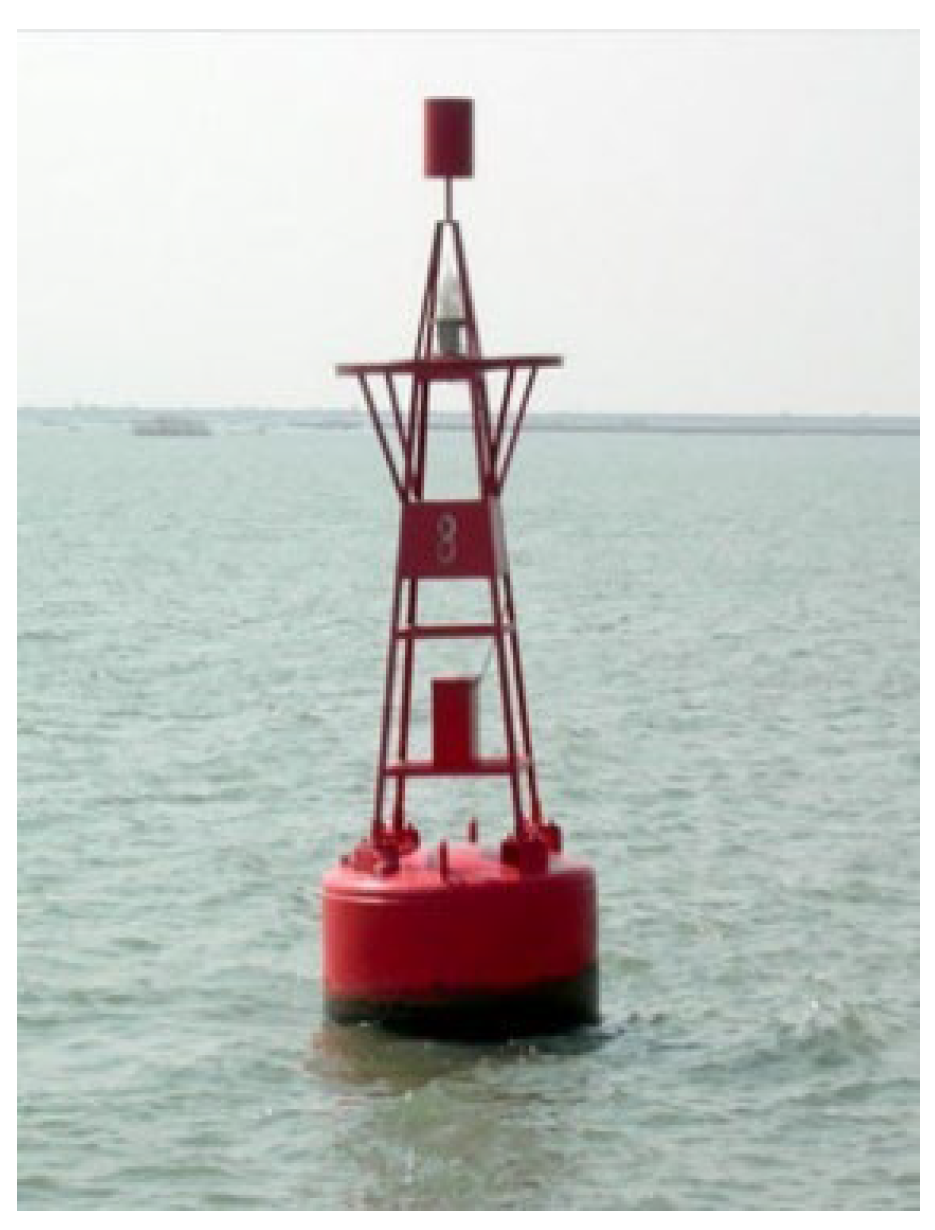
A Sea Detecting Radar Data Sharing Program (SDRDSP) has been developed by our team. Utilizing the acquired data, we performed several preprocessing steps, including quadrature demodulation, pulse compression, data segmentation, and target position labeling. These steps facilitated the creation of a dataset containing dual-polarization scattering characteristics of maritime targets under various sea states. Detailed information on the experiments and the dataset developed by our team can be found in References [39,40,41,42]. The target detected in this study is a light buoy, located 2.97 nautical miles from the radar setup point, with an azimuth angle of 10.7°, and in an anchored floating state. The target has a cylindrical shape with a red color. It is made of steel, with a floating body diameter of 2.4 m and a height of approximately 4.1 m above the sea surface, as shown in Figure 6.

Figure 6.
Light buoy.
The radar system employed in the experiment consists of two custom-built X-band solid-state amplifier test radars. The two radars operate with HH and VV polarizations, respectively, with the HH-polarized radar featuring an antenna length of approximately 2 m and the VV-polarized radar featuring an antenna length of about 2.5 m, both transmitting at a power of 100 W.
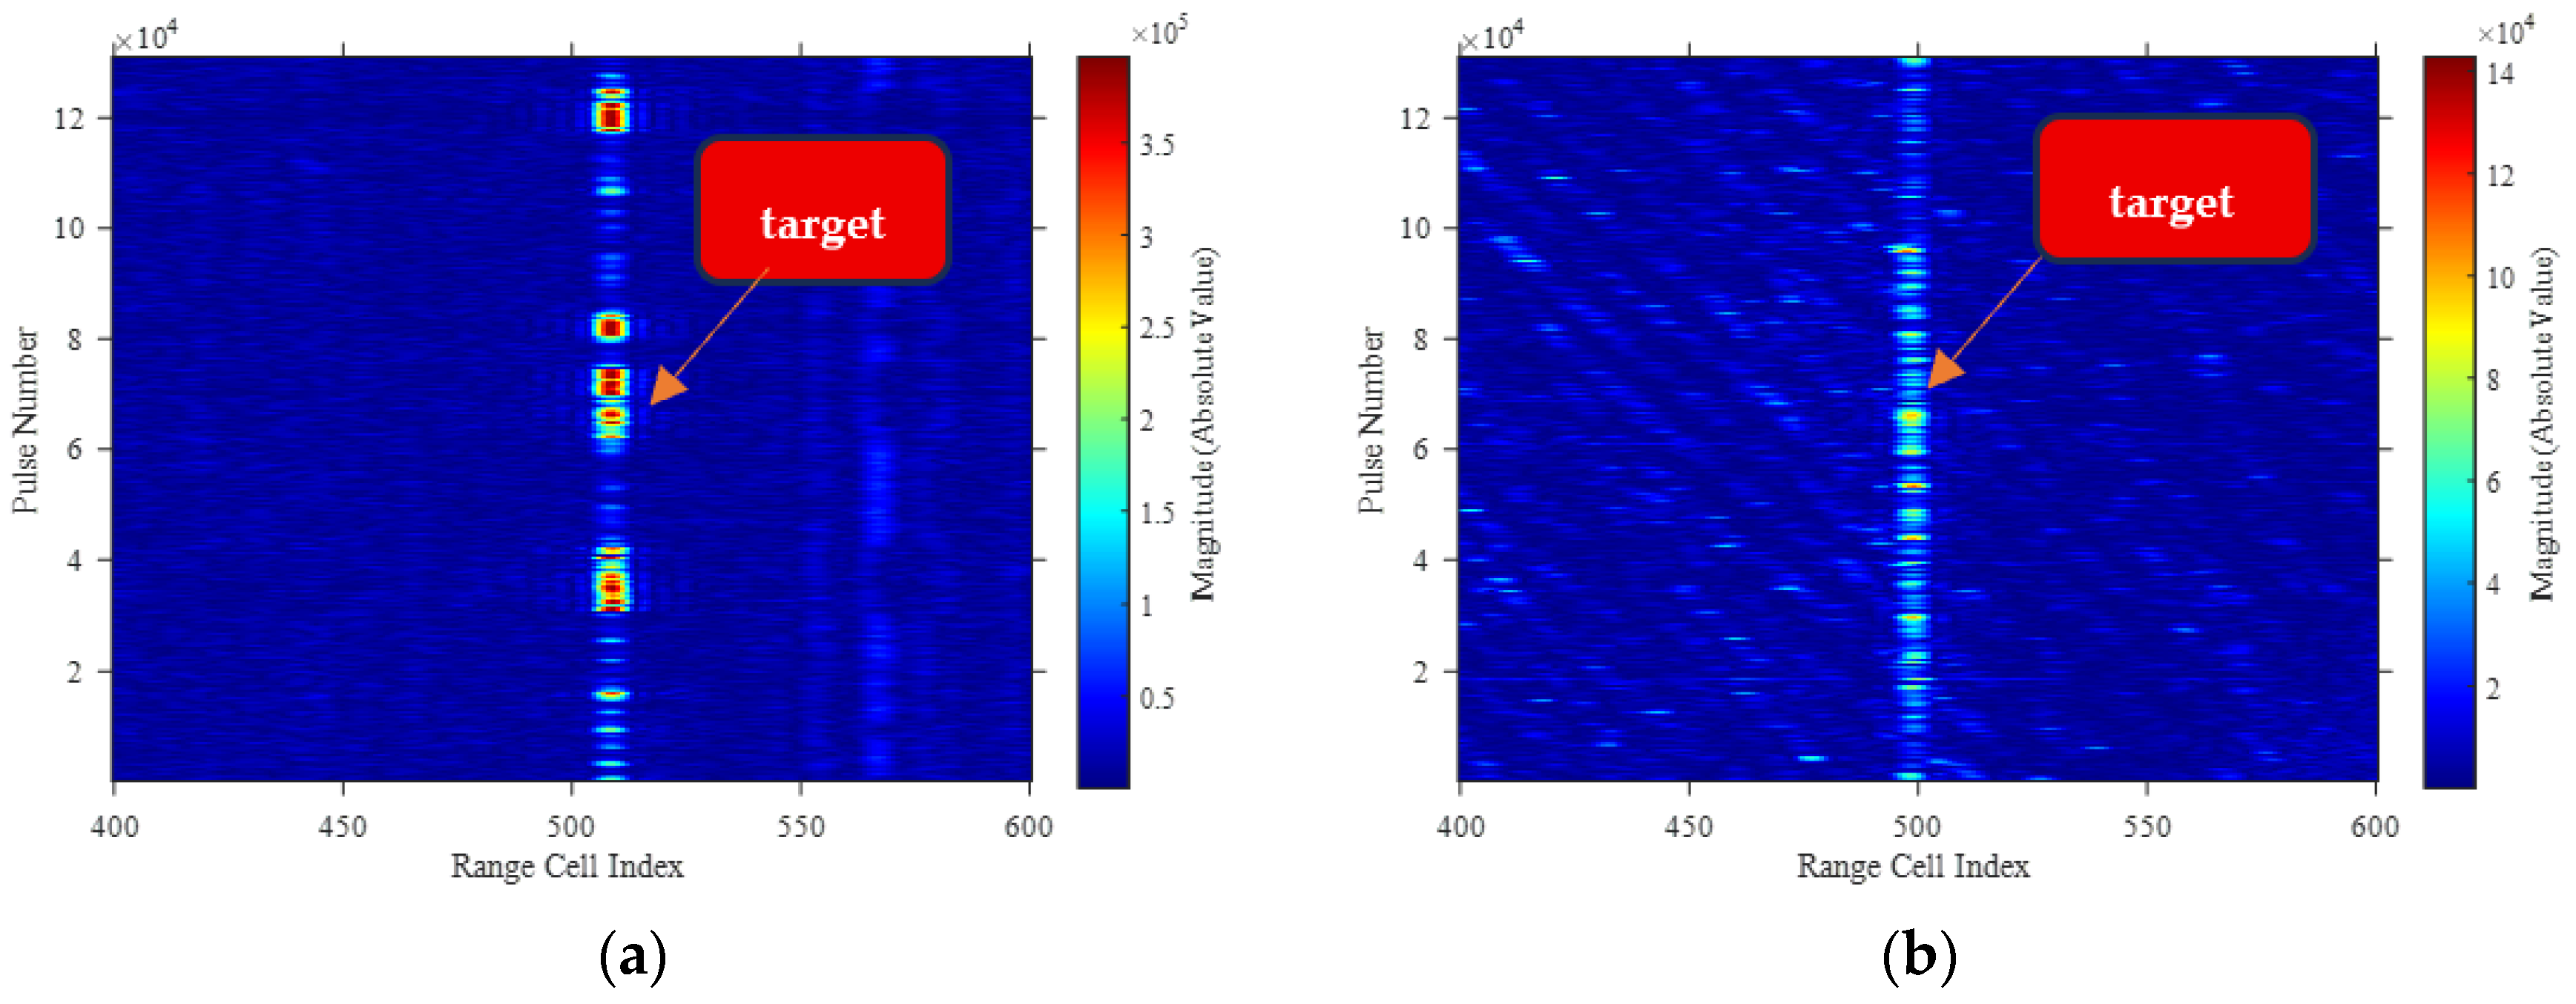
In order to assess the effectiveness of the proposed method in real-world scenarios, two datasets were selected, covering both high and low sea states as well as HH and VV polarization configurations. The first dataset, 20221115050036_stare_VV, contains low sea state data with VV polarization. It consists of pulses, a wave height of 0.4 m, waves approaching from the west, and is classified as sea state Level 2. The target is located at the 508th range cell. The second dataset, 20221113210051_stare_HH, includes high sea state data with HH polarization, also containing pulses, but with a wave height of 1.3 m, wave directions from the northeast and north, and is classified as sea state Level 4. The target is located at the 499th range cell. As depicted in Figure 7, the amplitude magnitude heatmap shows that under low sea state conditions, the target at the 508th cell exhibits distinct differentiation from other cells. Conversely, under high sea state conditions, strong sea clutter echoes induced by wave activity are observed, which lead to a reduction in the distinguishability between the target and the sea clutter cells. Additionally, multiple bright spots emerge within the sea clutter cells, which can readily induce false alarms.

Figure 7.
Heatmap visualizations for different sea states: (a) Low sea state; (b) High sea state.
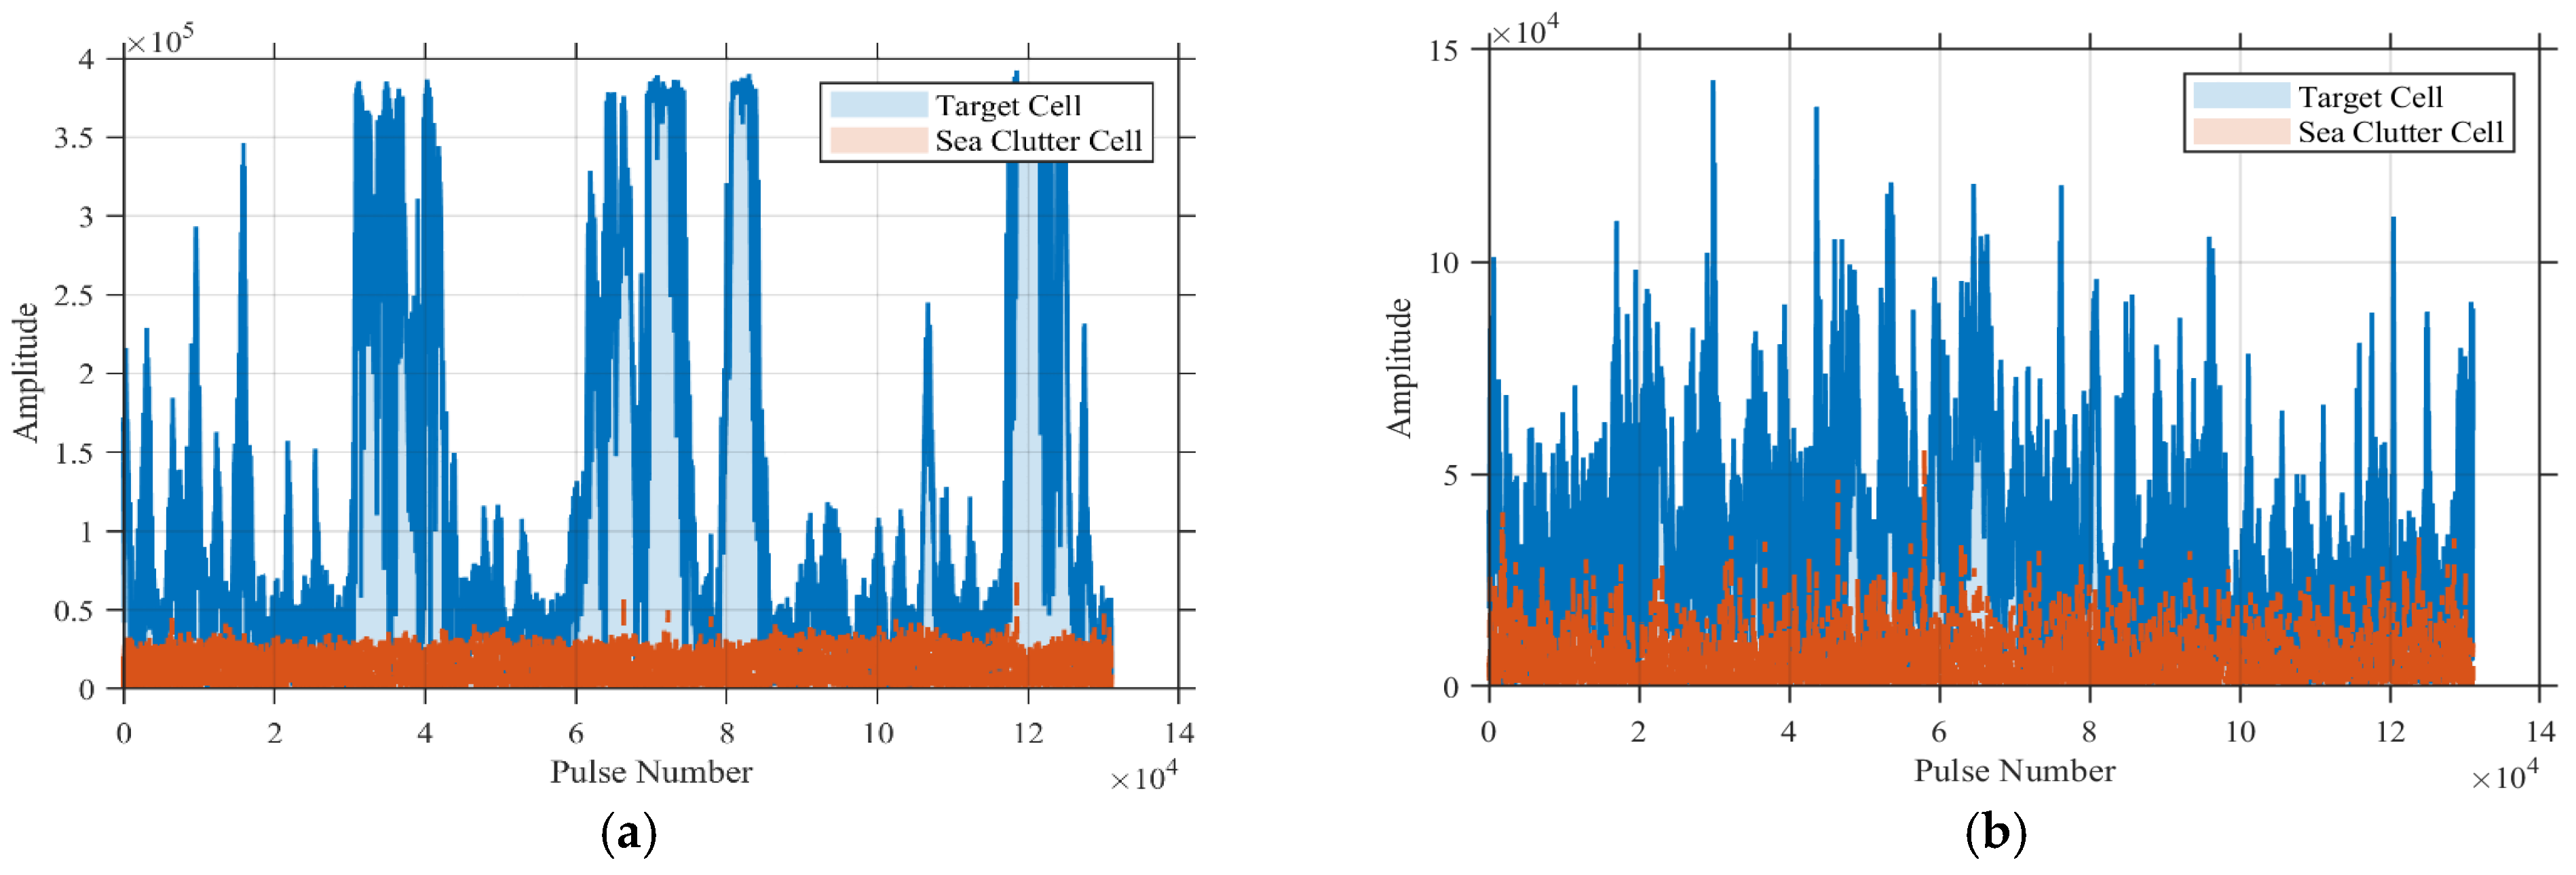
Further analysis is performed to compare the amplitude characteristics of a specific sea clutter cell and a target cell under both low and high sea state conditions. The absolute amplitude values for these conditions are presented in Figure 8. It can be observed that, before feature extraction, the amplitude signals of the target and sea clutter are closely intertwined, making their discrimination challenging.
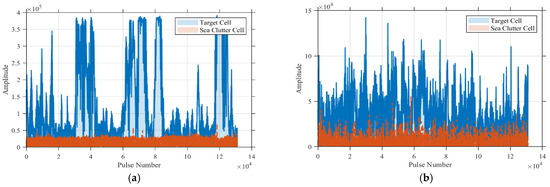
Figure 8.
Amplitude data before feature extraction: (a) Low sea state; (b) High sea state.
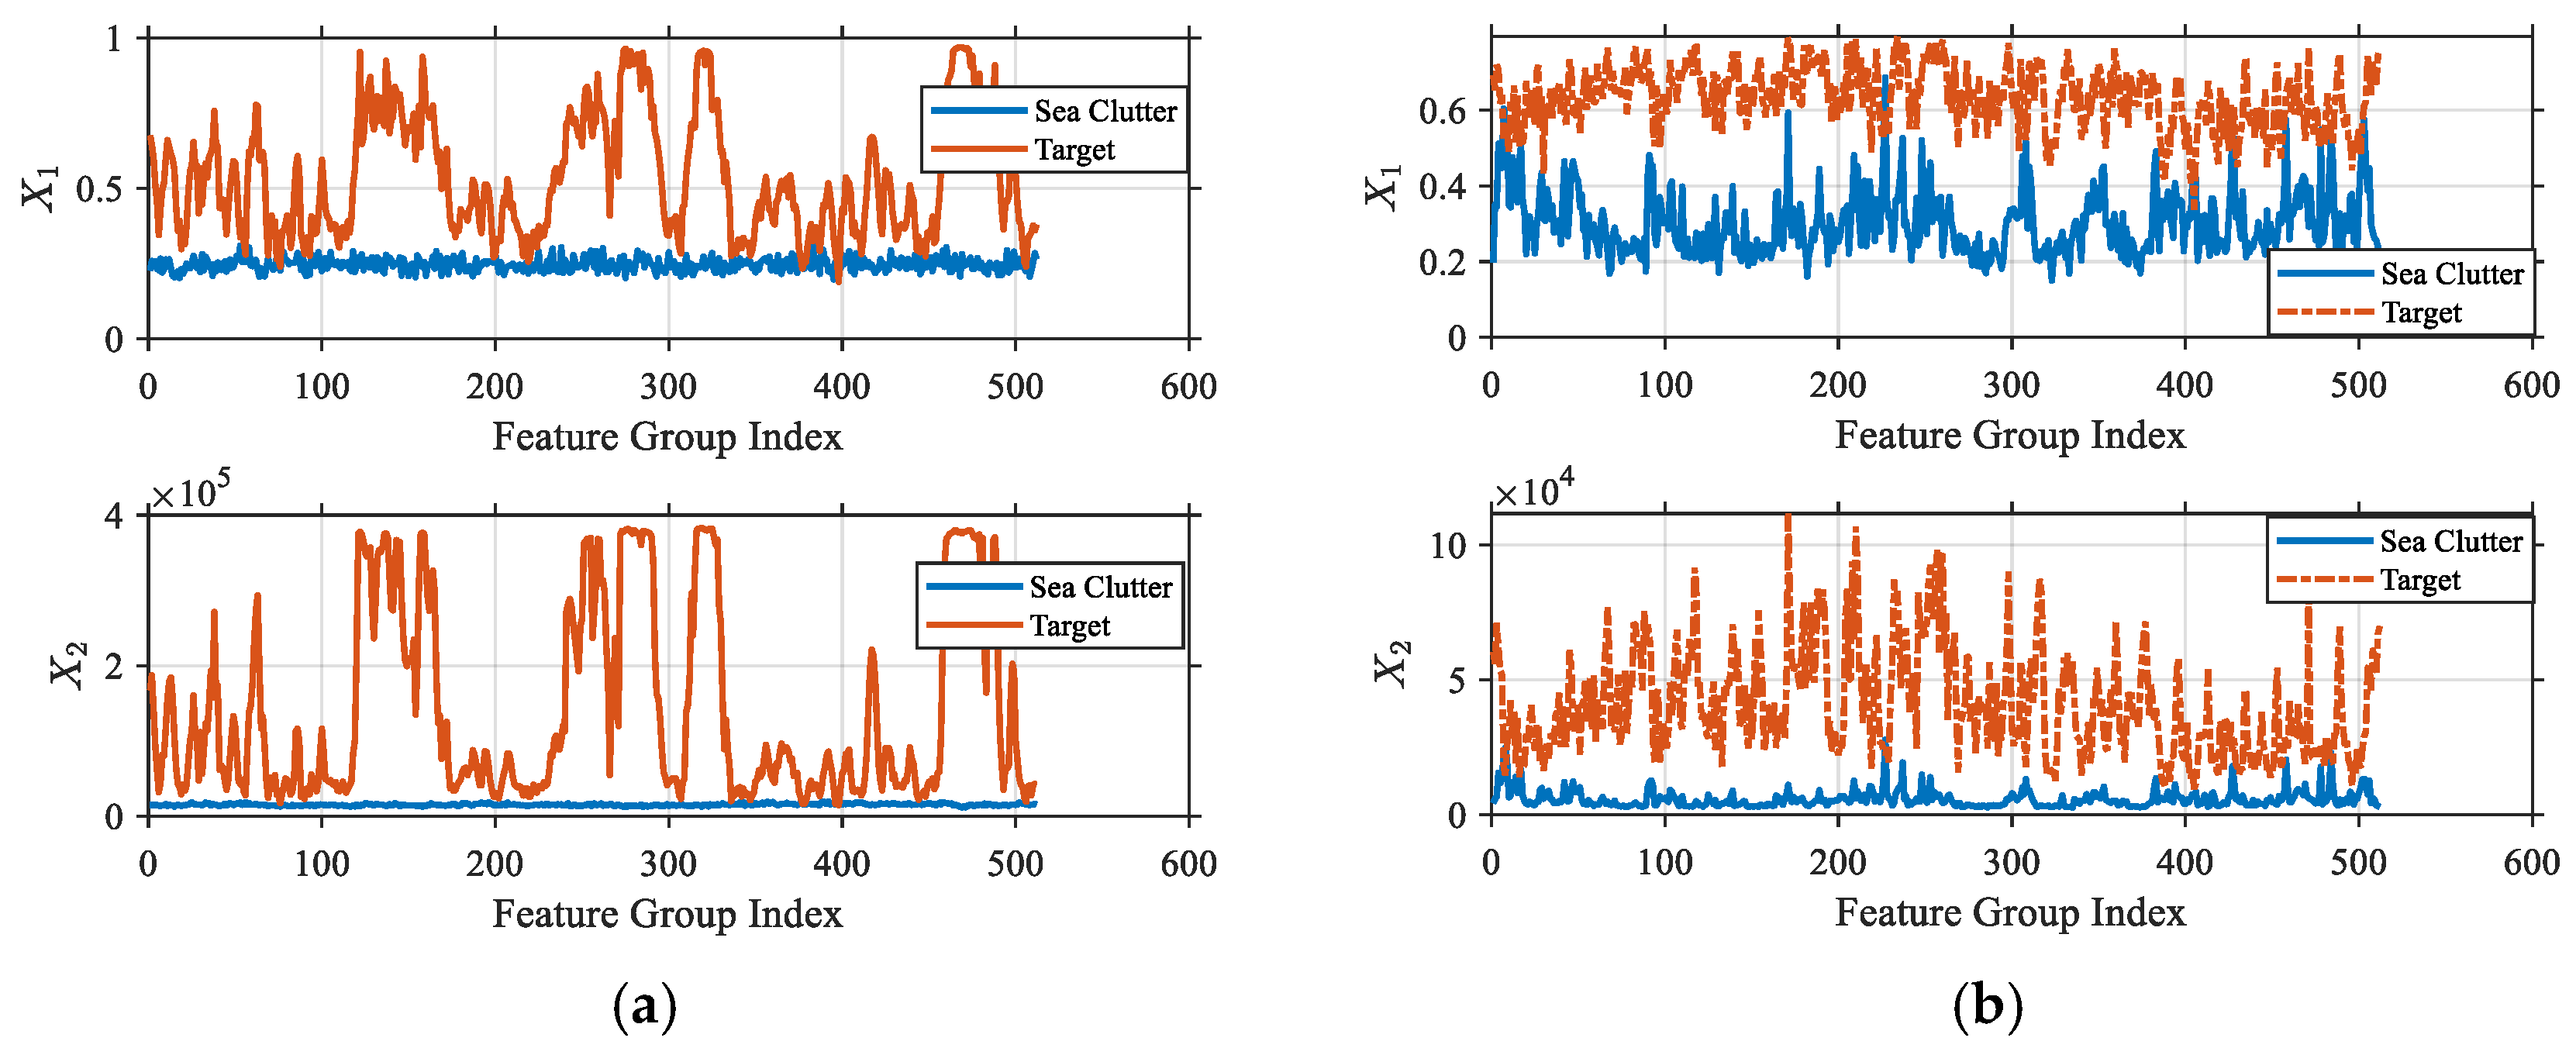
To further demonstrate the validity of the proposed theorem across different domains and feature distributions, this study selects both a time-domain quantile feature and a frequency-domain spectral feature for verification. The 75% quantile feature, it is calculated as the value at the 75th percentile of the sorted data. As a non-parametric feature, focuses on the upper-tail distribution of signal intensity and is robust against noise and outliers [43]. Moreover, based on the Central Limit Theorem and the heteroscedasticity of sea clutter signals, the logarithm of the quantile feature exhibits asymptotic normality. Spectral flatness, as a frequency-domain feature, is defined as the ratio of the geometric mean to the arithmetic mean of the power spectrum [44]. In practice, it often exhibits skewed, bounded, and asymmetric distribution characteristics, which are well modeled by the Beta distribution. In this study, sea clutter and target features were extracted from segments, each consisting of pulses as a group. Two features, spectral flatness and the 75% quantile , were considered. To ensure consistency between the magnitudes of target features and clutter features, the first feature is defined as , and the second feature is denoted as . The feature values for low and high sea states are shown in Figure 9. It can be seen that feature extraction effectively improves the separation between targets and clutter.
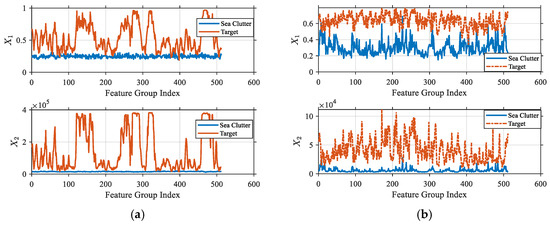
Figure 9.
Features data after feature extraction: (a) Low sea state; (b) High sea state.
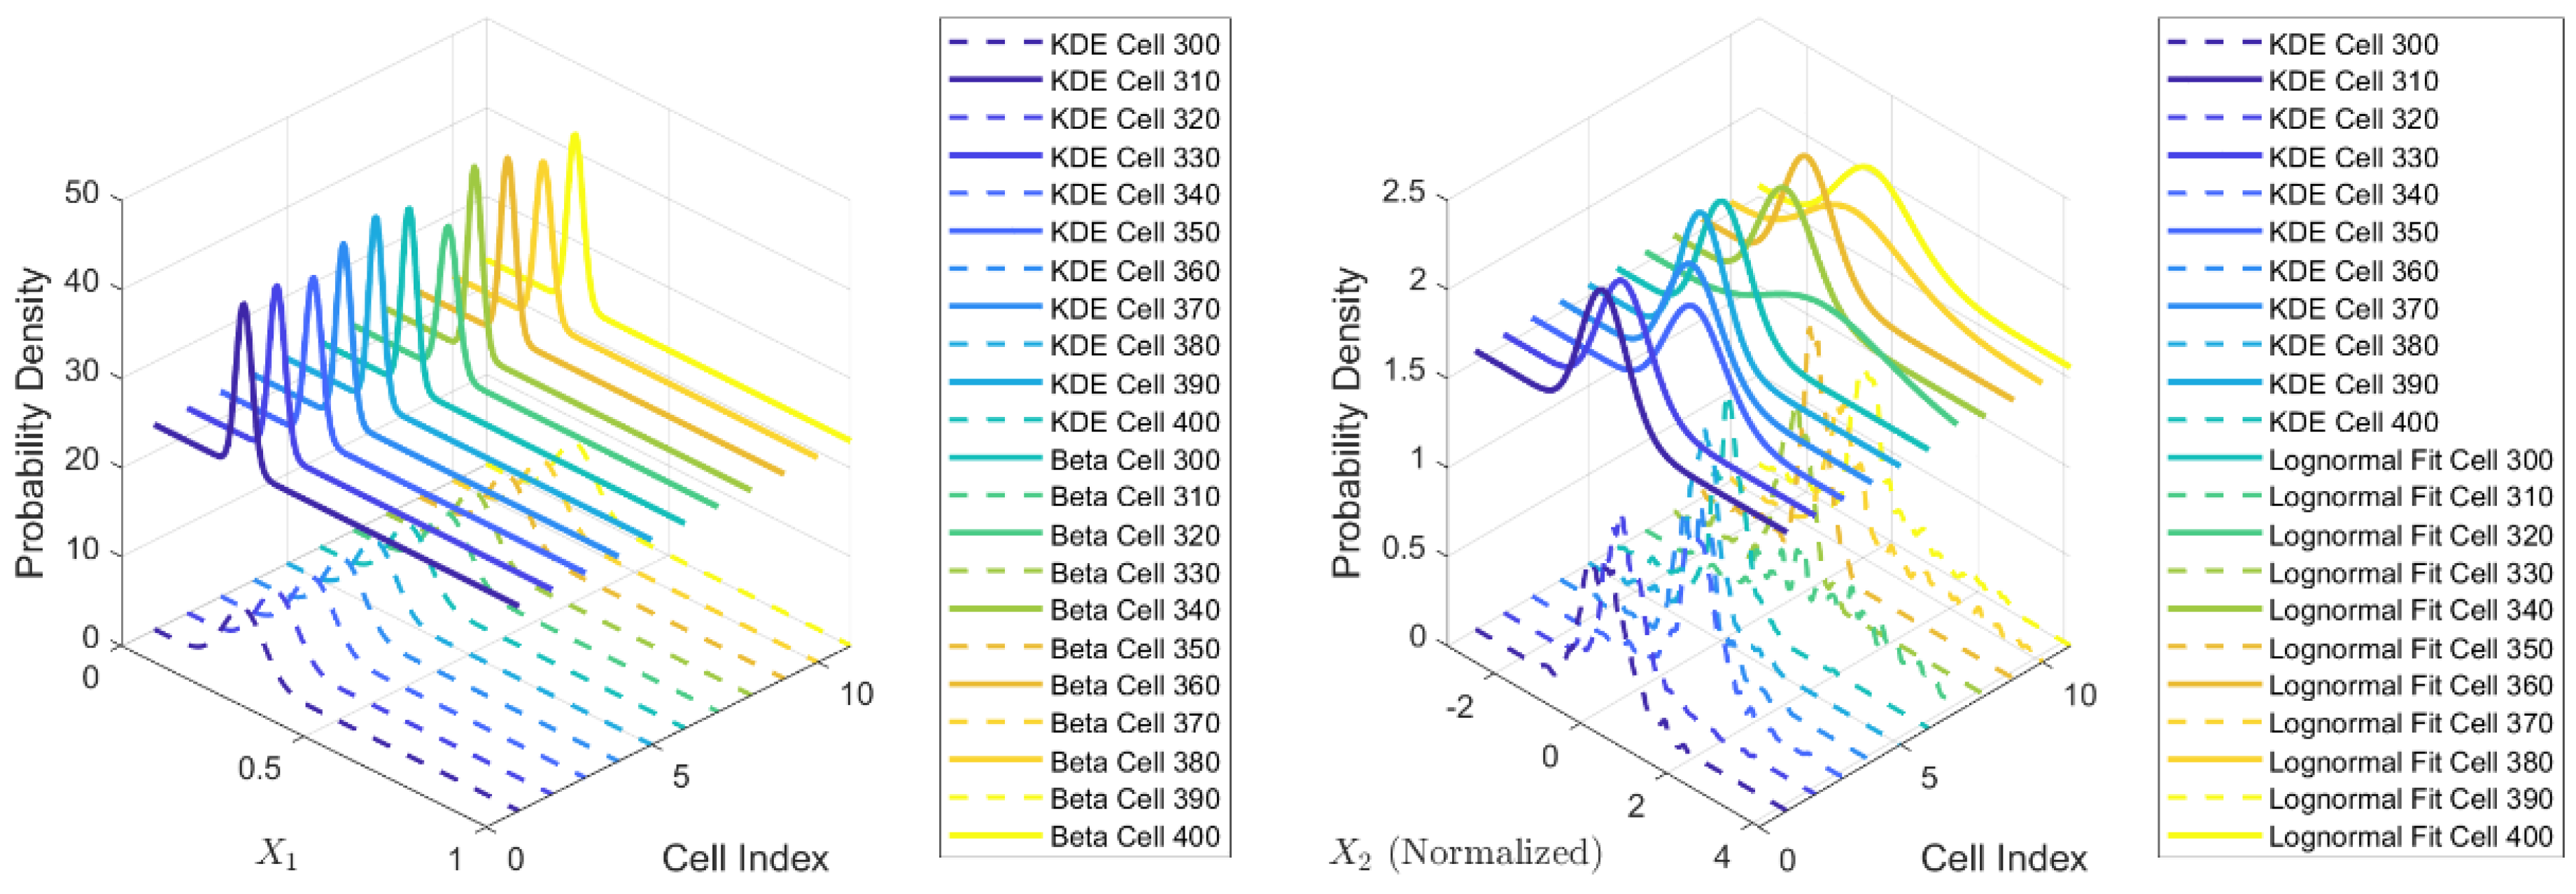
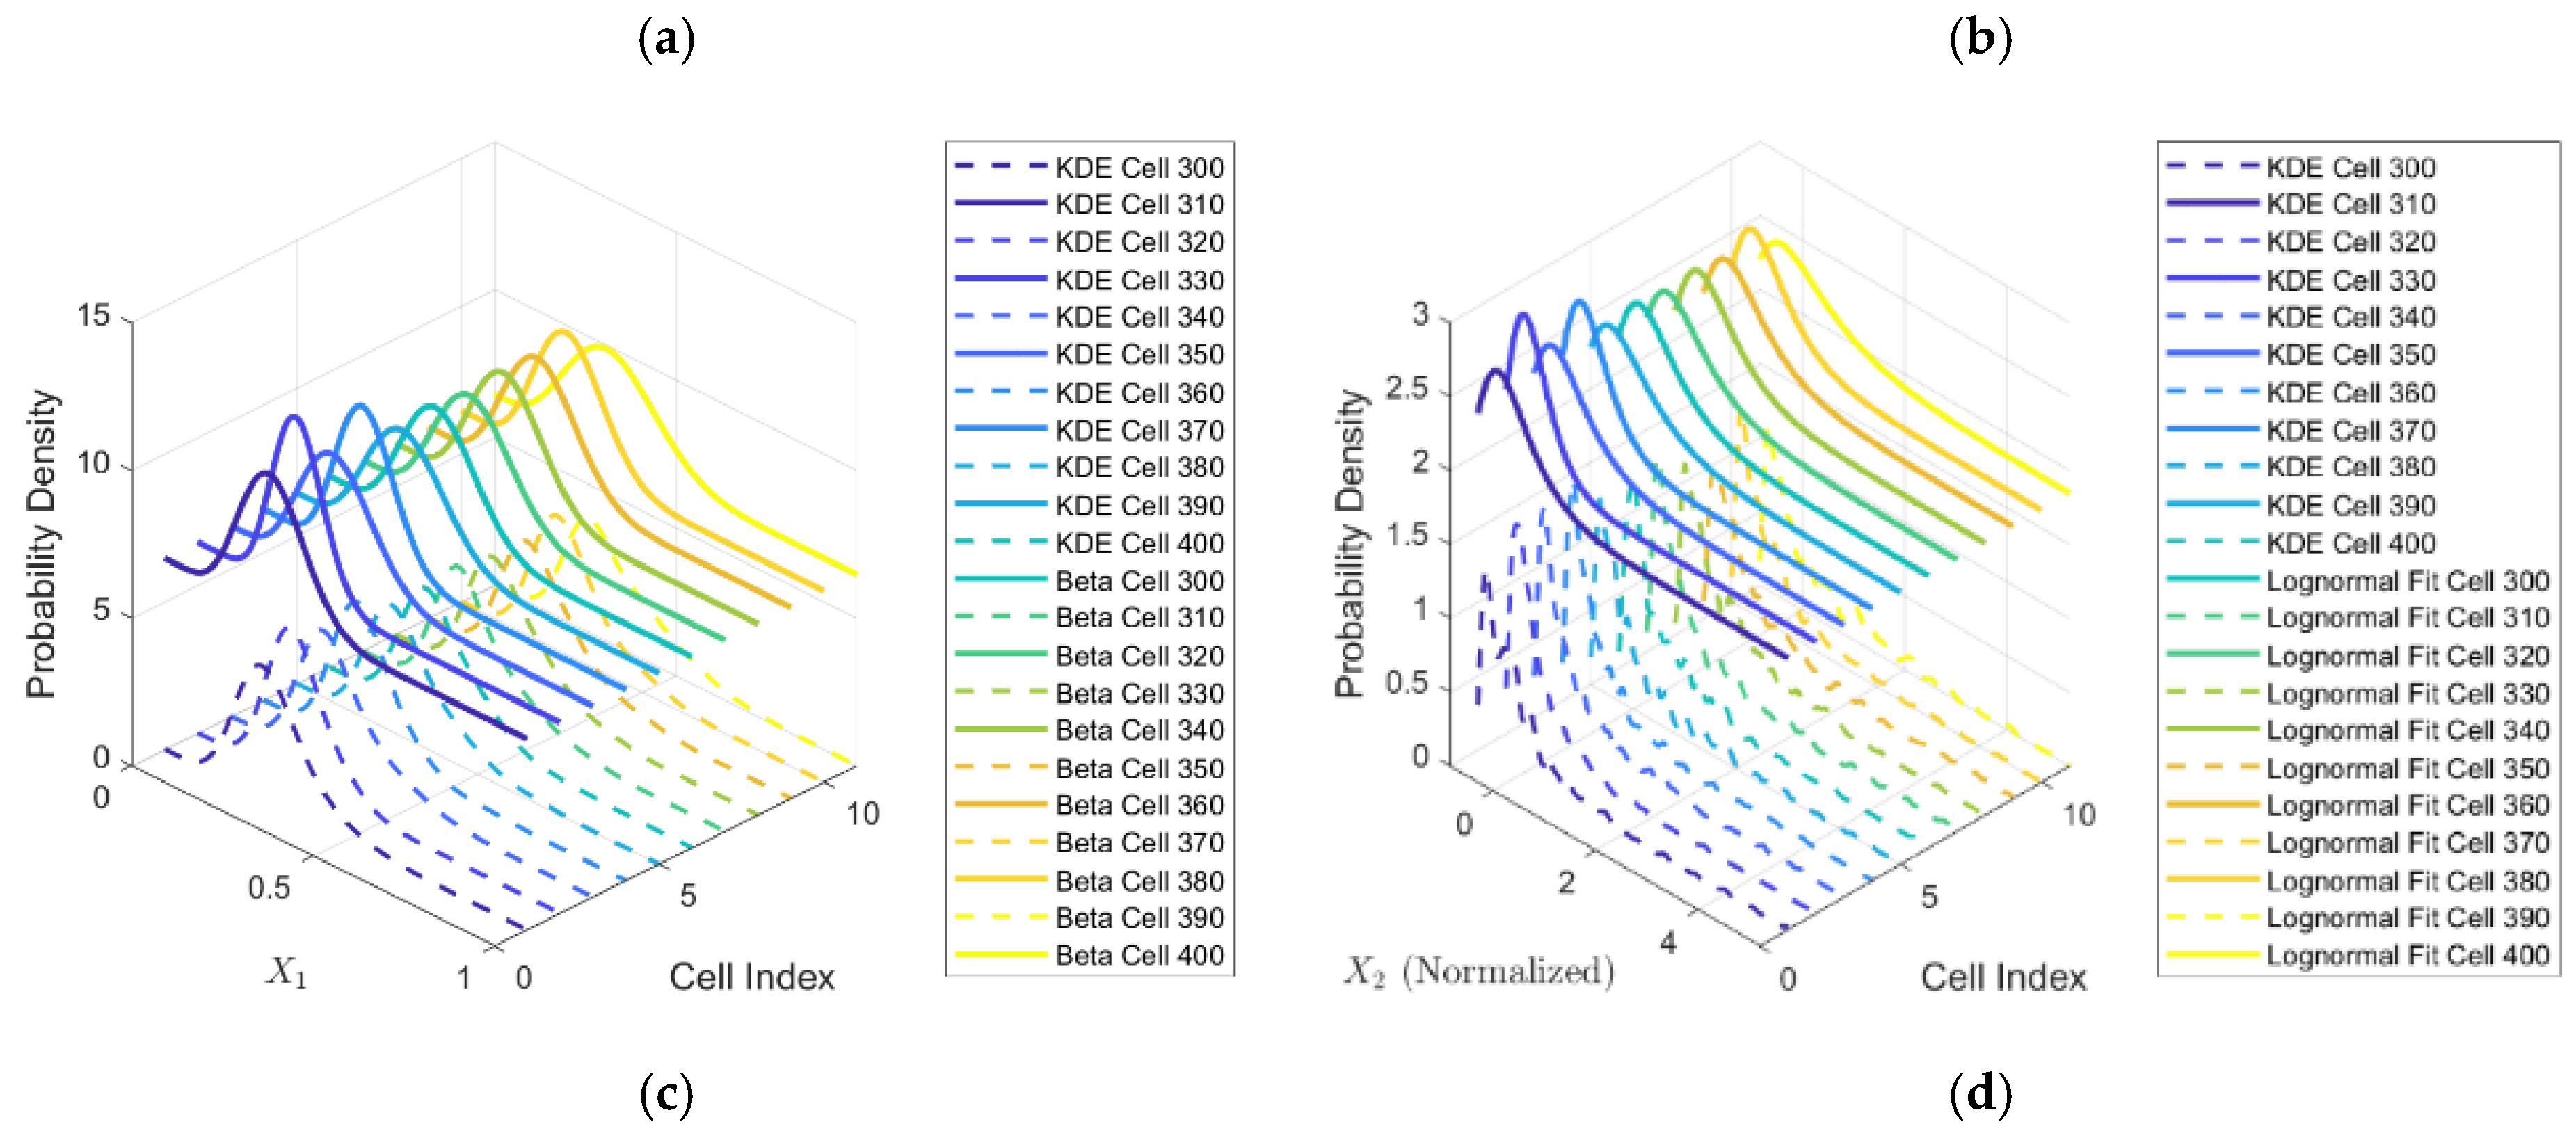
Beta distribution was fitted to feature , and lognormal distribution was fitted to feature . Figure 10 illustrates the comparison between the fitted distributions and the Kernel Density Estimation (KDE) distributions. The PDFs of and across different cells closely approximate their respective KDE curves. Moreover, incorporating the additional feature effectively overcomes the limitations associated with single-feature detection.
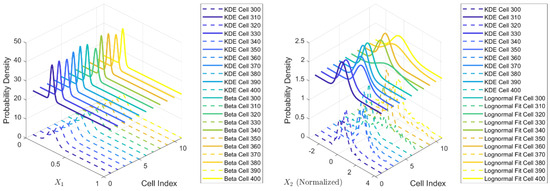
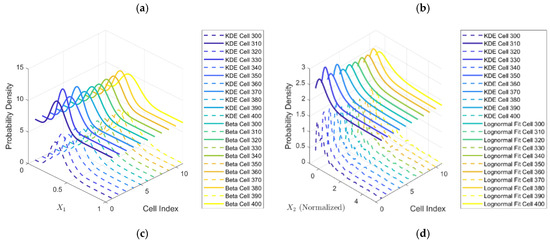
Figure 10.
Features distribution fitting: (a) Low sea state ; (b) Low sea state ; (c) High sea state ; (d) High sea state .
For the cell under test, a guard band of 2 cells is set with 16 reference cells on each side for statistical analysis. Under low sea state conditions, feature is modeled by a Beta distribution with parameters and , while feature follows a lognormal distribution with parameters and . In contrast, under high sea state conditions, feature is modeled by a Beta distribution with parameters and , and follows a lognormal distribution with parameters and . The density functions are defined as:
where , , and is the Gamma function.
The correlation between the upper and lower tails of the features is measured using the Frank Copula. The threshold is provided with Equation (37). The distinction in this case is that represents the inverse CDF of the Beta distribution, while represents the inverse CDF of the lognormal distribution.
The Copula parameter can be estimated using the relationship between the rank correlation coefficient and the Frank Copula parameter :
where is the Debye function [45],
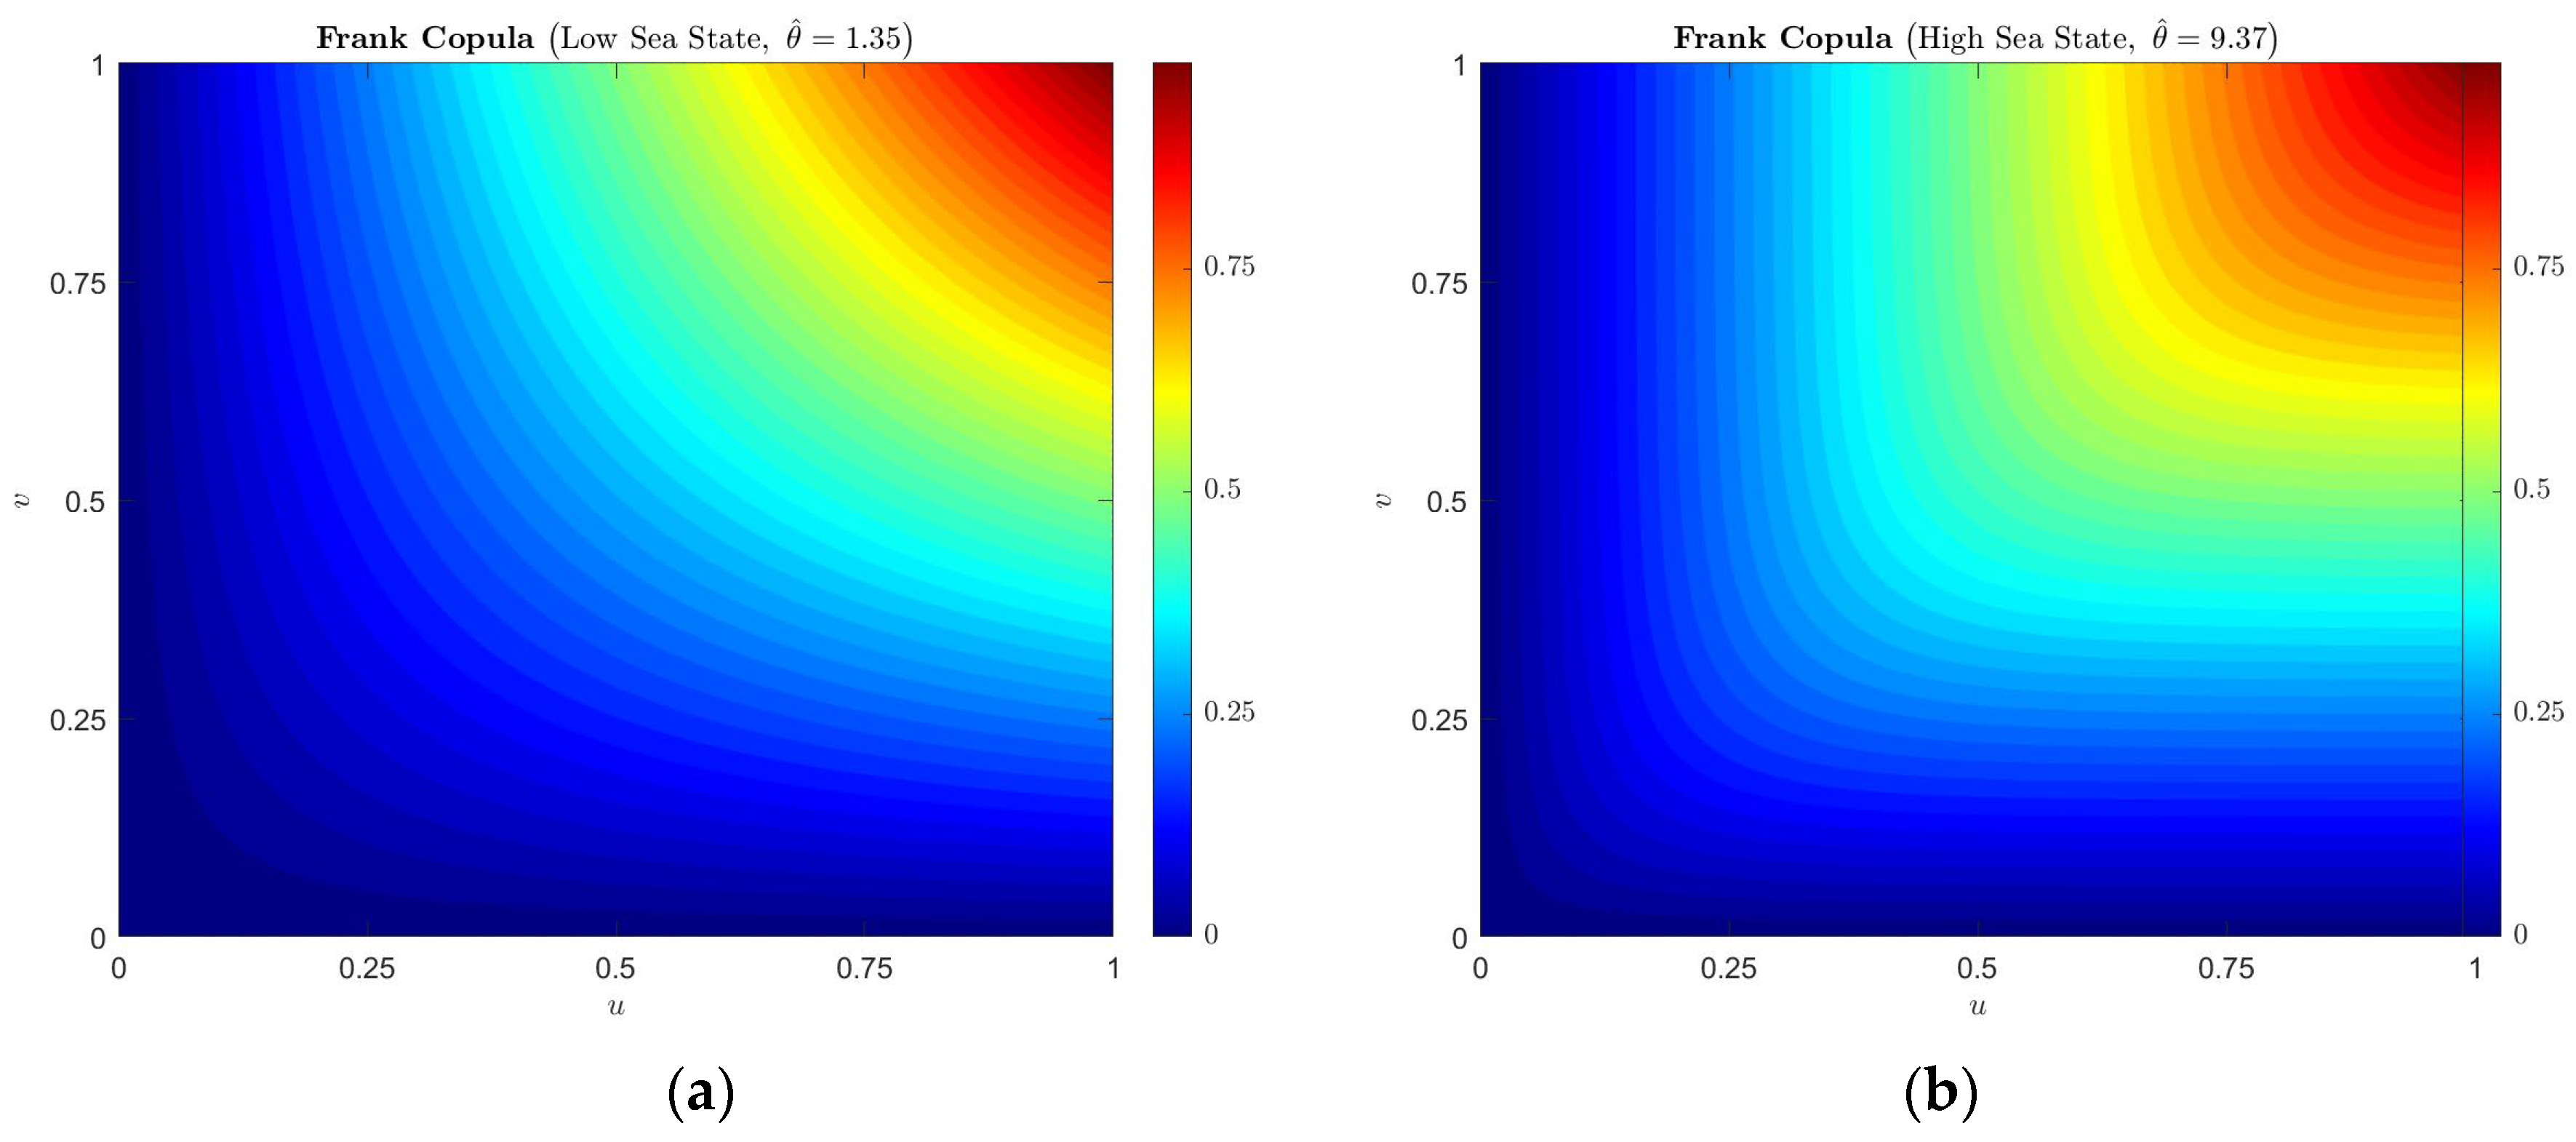
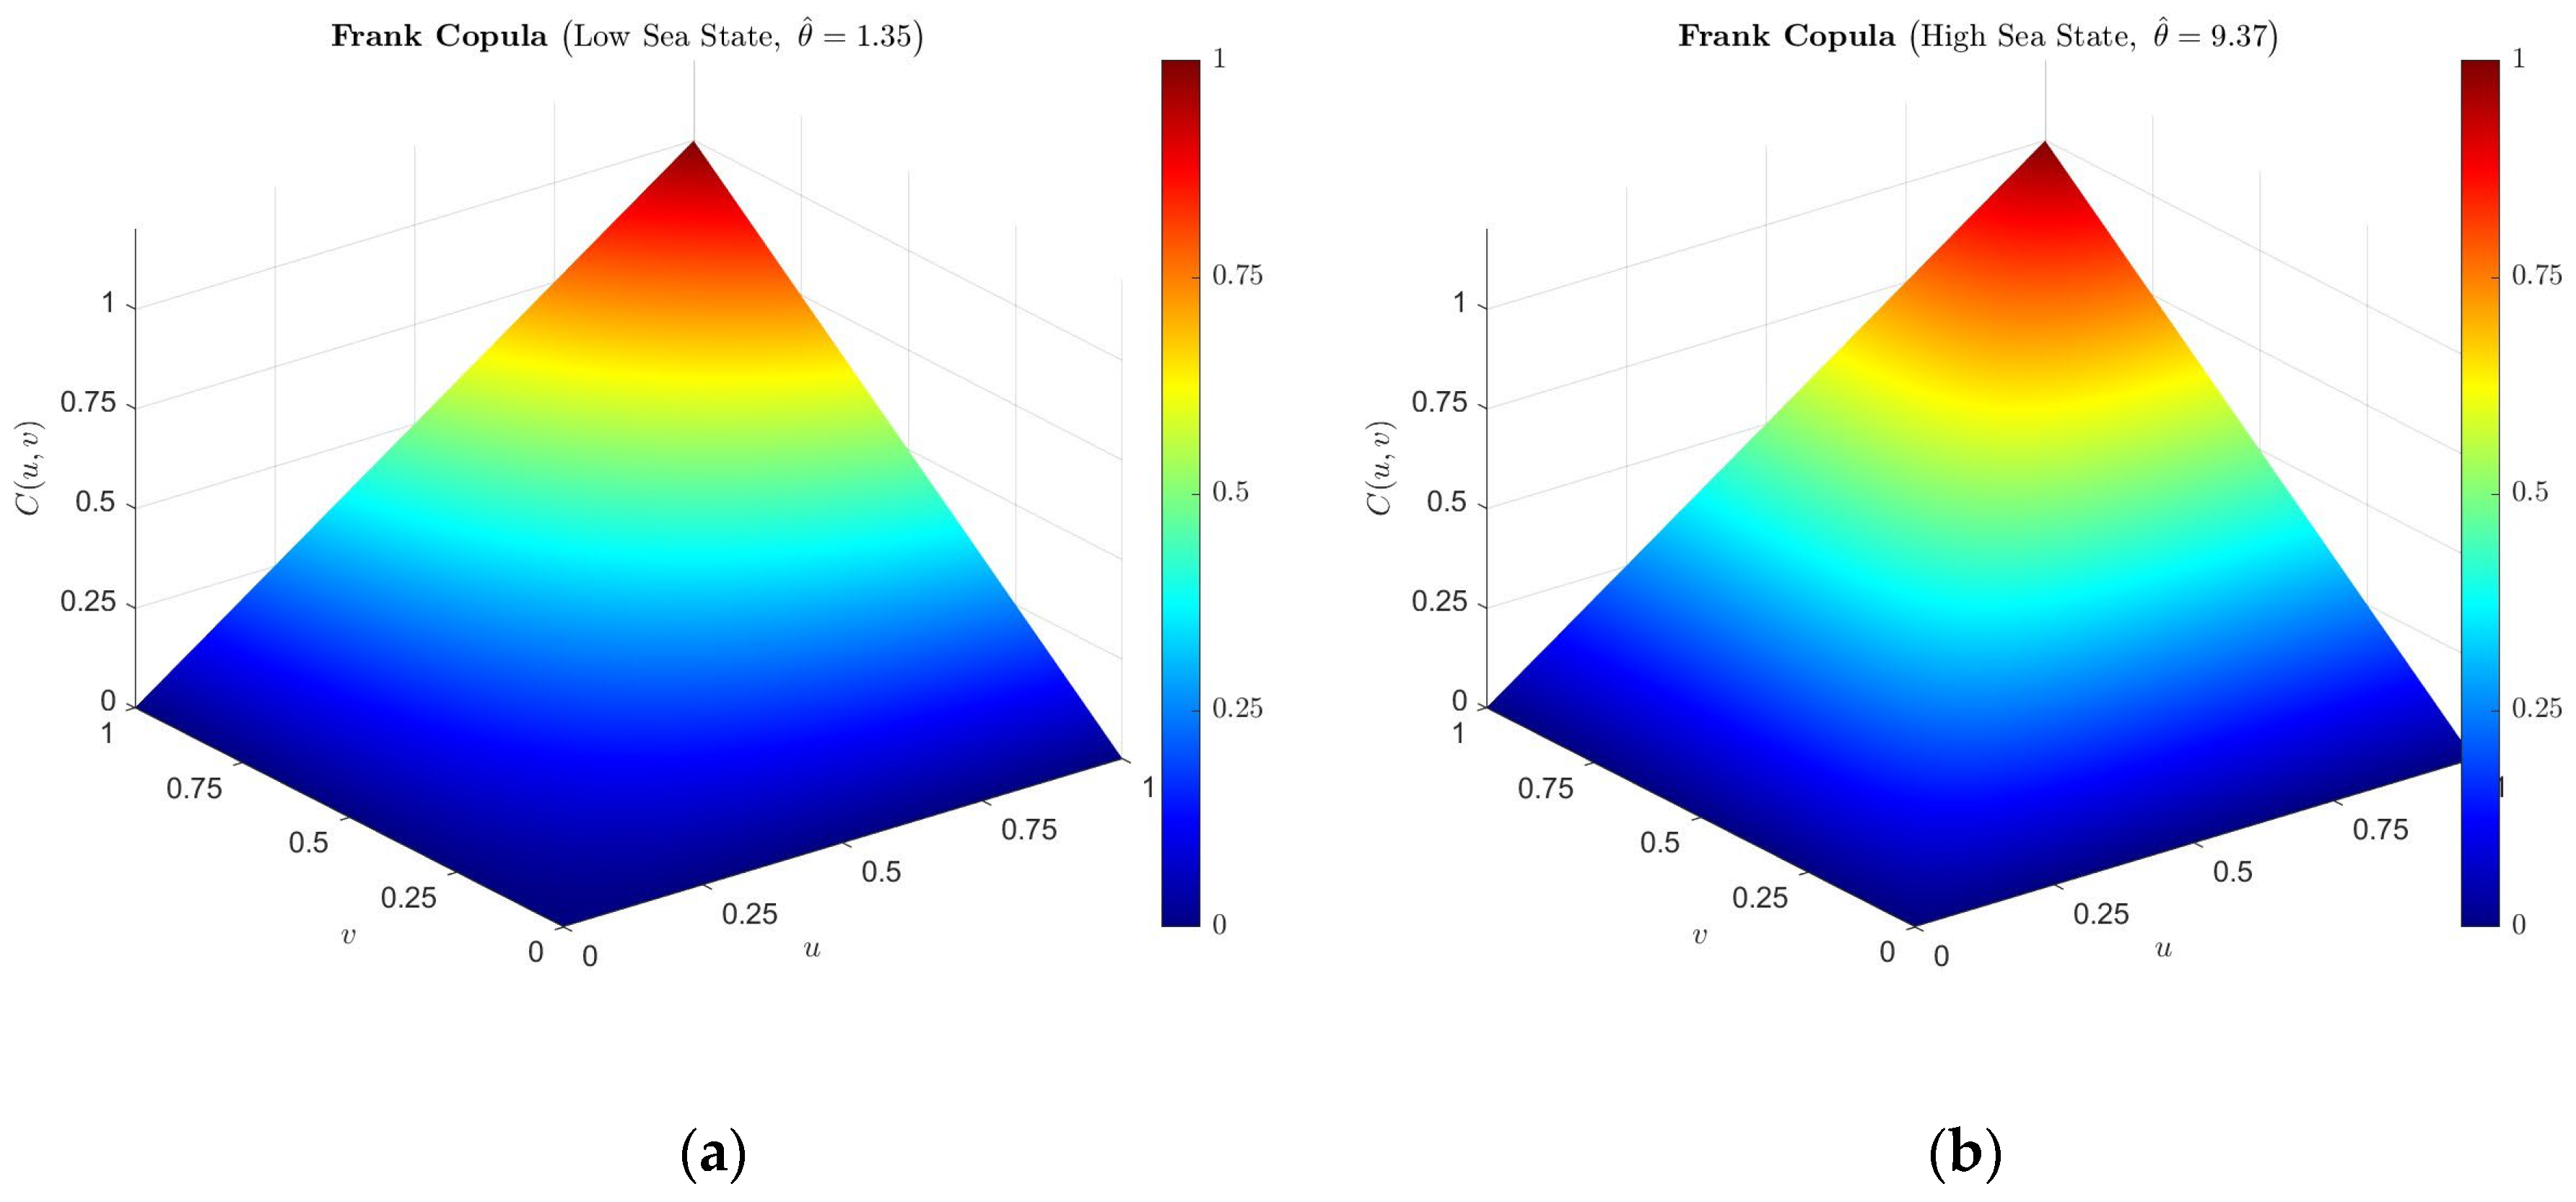
Under low sea state conditions, the obtained parameter is , while under high sea state conditions, . As shown in Figure 11 and Figure 12, the Frank Copula contours and structures for the features under low and high sea states exhibit significant differences. This illustrates that the Copula-CFAR method proposed in this paper, by incorporating nonlinear dependence structures, enhances the ability to differentiate between different sea states and accurately model their varying dependencies.

Figure 11.
Frank Copula contours: (a) Low sea state; (b) High sea state.

Figure 12.
Frank Copula structure: (a) Low sea state; (b) High sea state.
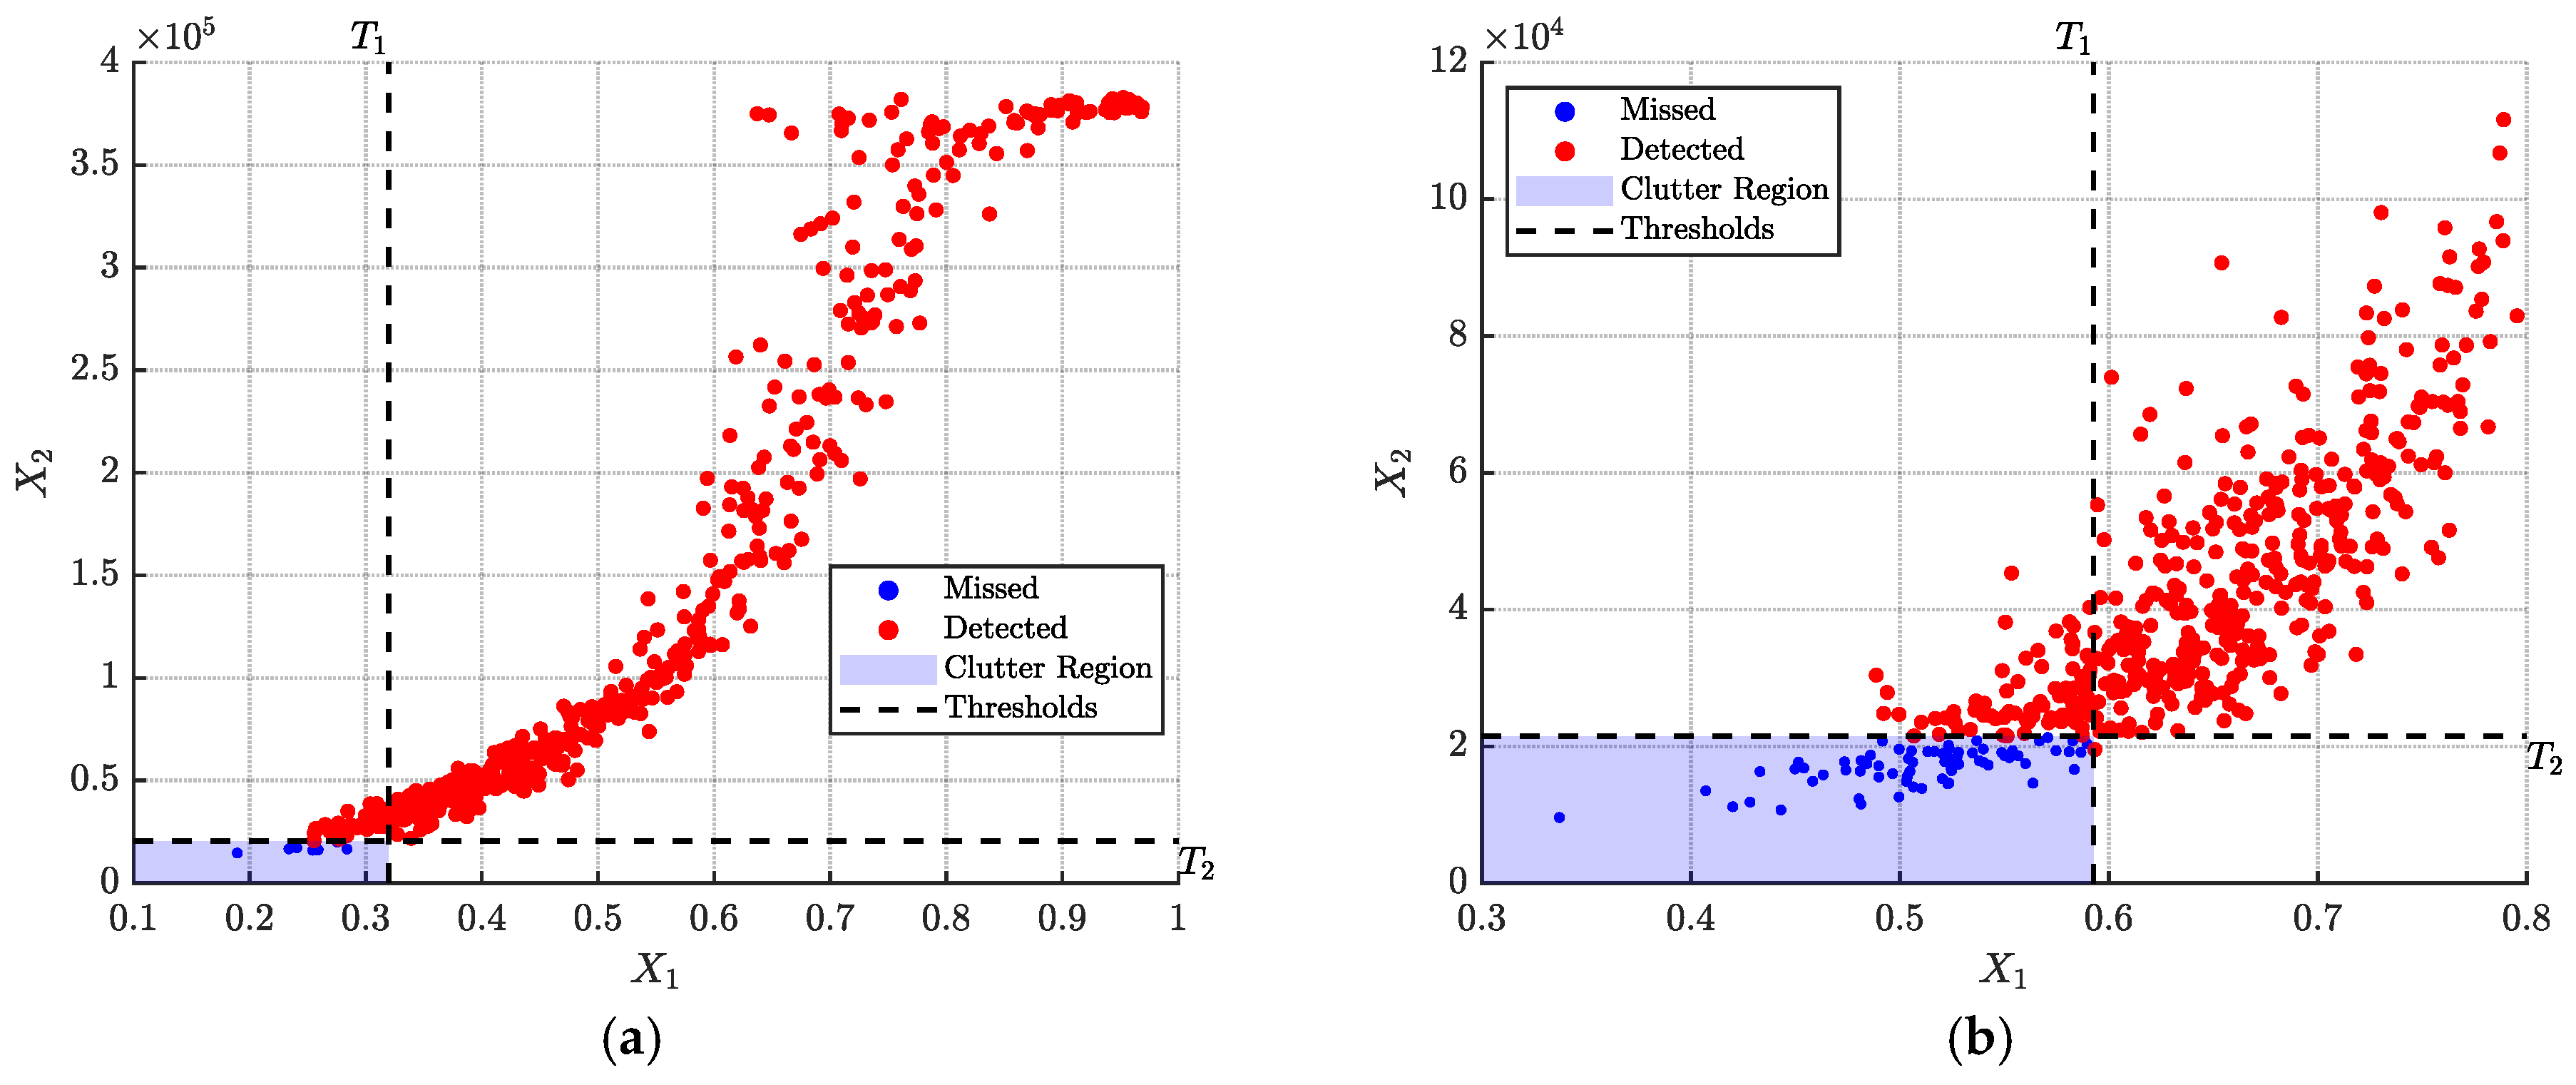
Given , based on Theorem 1 and Equation (37), the feature threshold values under low sea state conditions are and , while under high sea state conditions, they are and . The detection results are presented in Figure 13, with red markers indicating successfully detected targets and blue markers denoting missed detections. According to the CFAR-Copula theorem, samples are classified as sea clutter when their two-dimensional features fall within the region bounded by thresholds and . The proposed method achieves detection probabilities of 98.44% and 86.13% under low and high sea state conditions, respectively.

Figure 13.
Target detection: (a) Low sea state; (b) High sea state.
The proposed detector was utilized to assess the FAR. As illustrated in Figure 14, the colored area represents the sea clutter region in the feature space. Any two-dimensional feature vector located outside this region will be identified as a false alarm, marked by red points in the figure. Experimental results demonstrate false alarm rates of 0.003 and 0.008 under low and high sea state conditions, respectively.
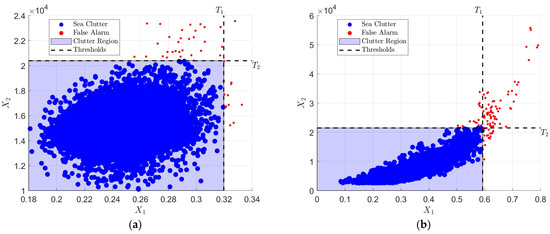
Figure 14.
FAR: (a) Low sea state; (b) High sea state.
4. Discussion
The proposed method not only achieves CFAR detection but also establishes an exact analytical relationship between the and detection thresholds. To validate its superiority, we conduct comparative evaluations against four established CFAR detectors: cell-averaging CFAR (CA-CFAR), ordered statistics CFAR (OS-CFAR), greatest of CFAR (GO-CFAR), and smallest of CFAR (SO-CFAR). To ensure a fair comparison, since the proposed method extracts one feature per 256 pulses, the conventional CFAR methods were applied with non-coherent integration over 256 pulses.
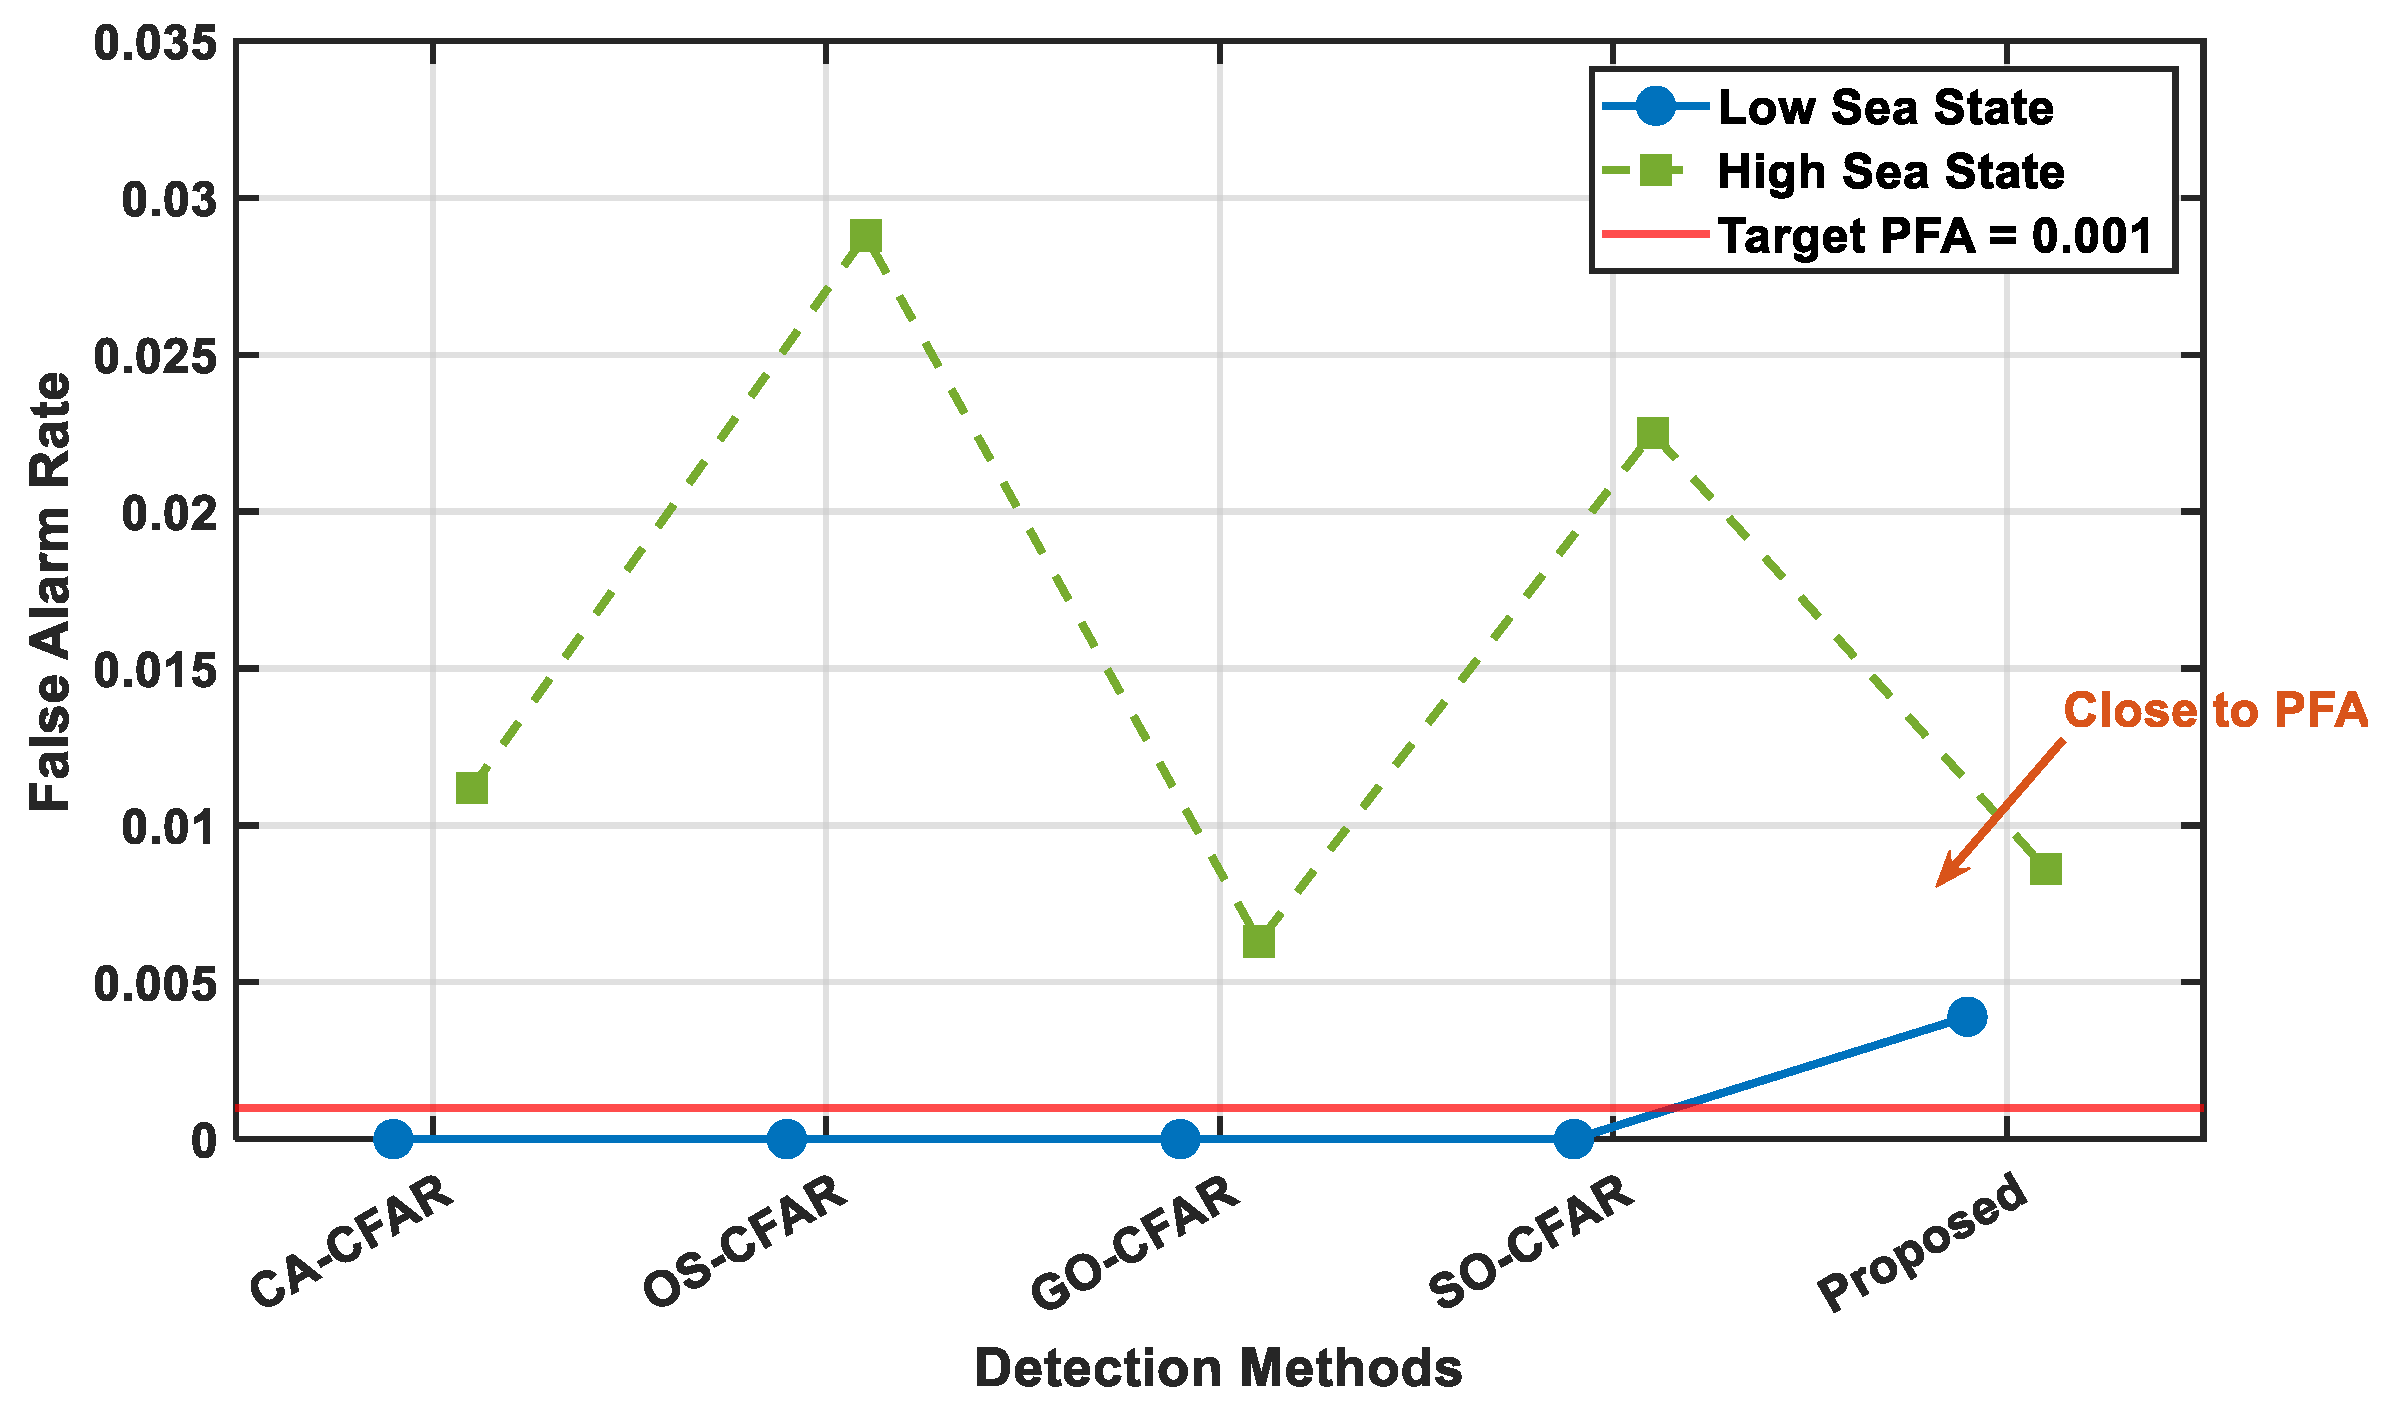
Figure 15 presents the measured FARs of the five detection methods, where the red line indicates the theoretical . Experimental results demonstrate that the proposed method significantly outperforms conventional CFAR detectors in false-alarm control accuracy.
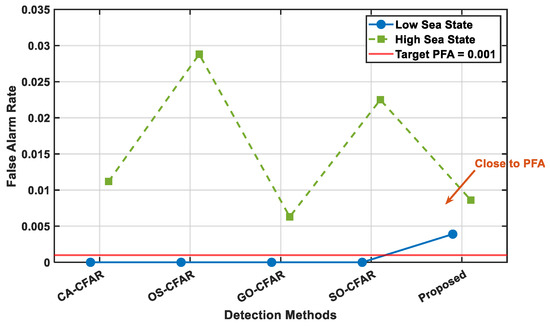
Figure 15.
Comparison of FARs for CFAR method.
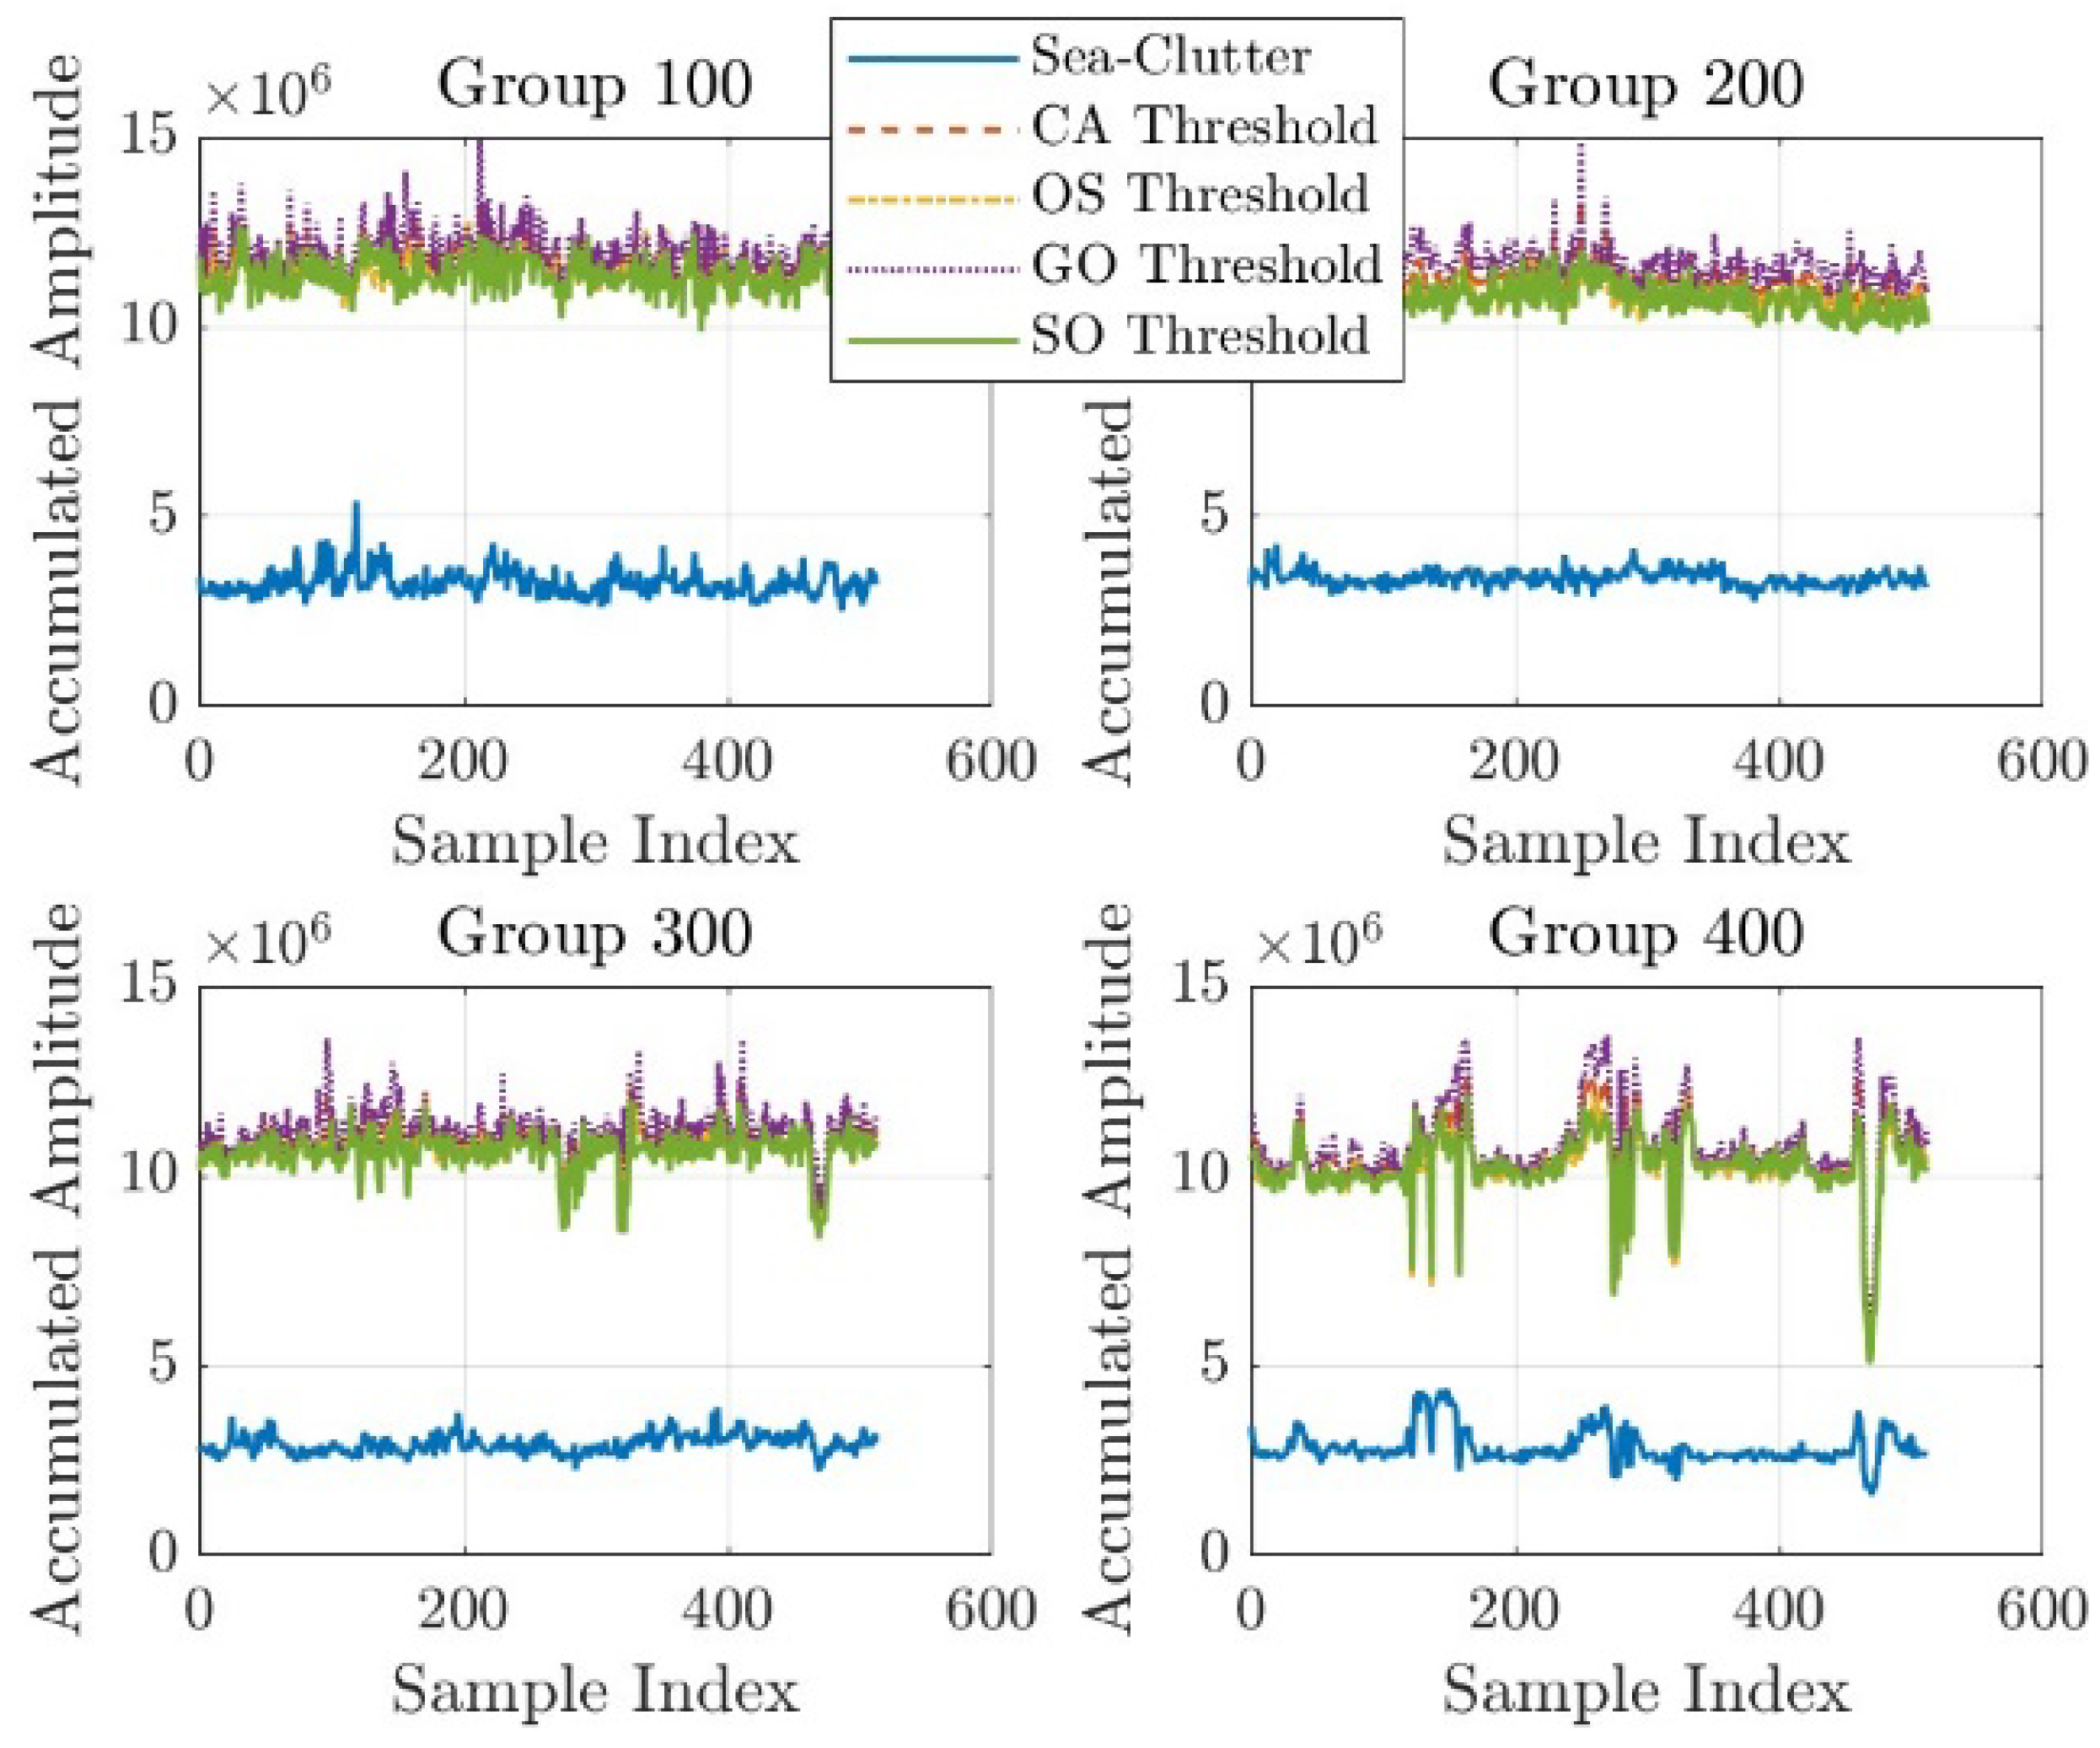
It should be specially noted that under low sea state conditions, traditional CFAR detectors exhibit significant FAR mismatch phenomenon. When sea clutter energy decreases substantially in low sea states, the detection thresholds calculated by conventional CFAR algorithms significantly exceed actual clutter levels, making them unable to detect false alarms, as shown in Figure 16. In contrast, our proposed method, which performs false alarm control based on feature extraction, can effectively avoid this problem.
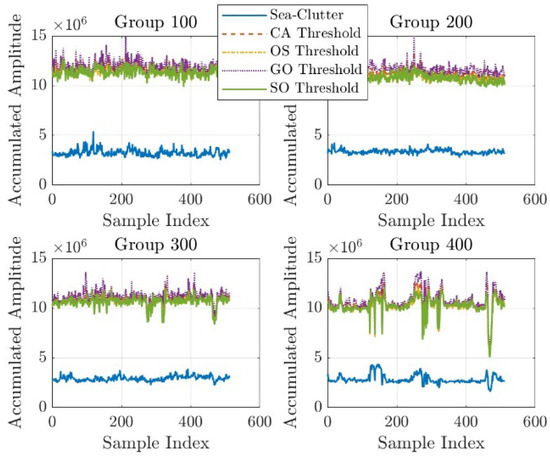
Figure 16.
FAR mismatch of classical CFAR detectors.
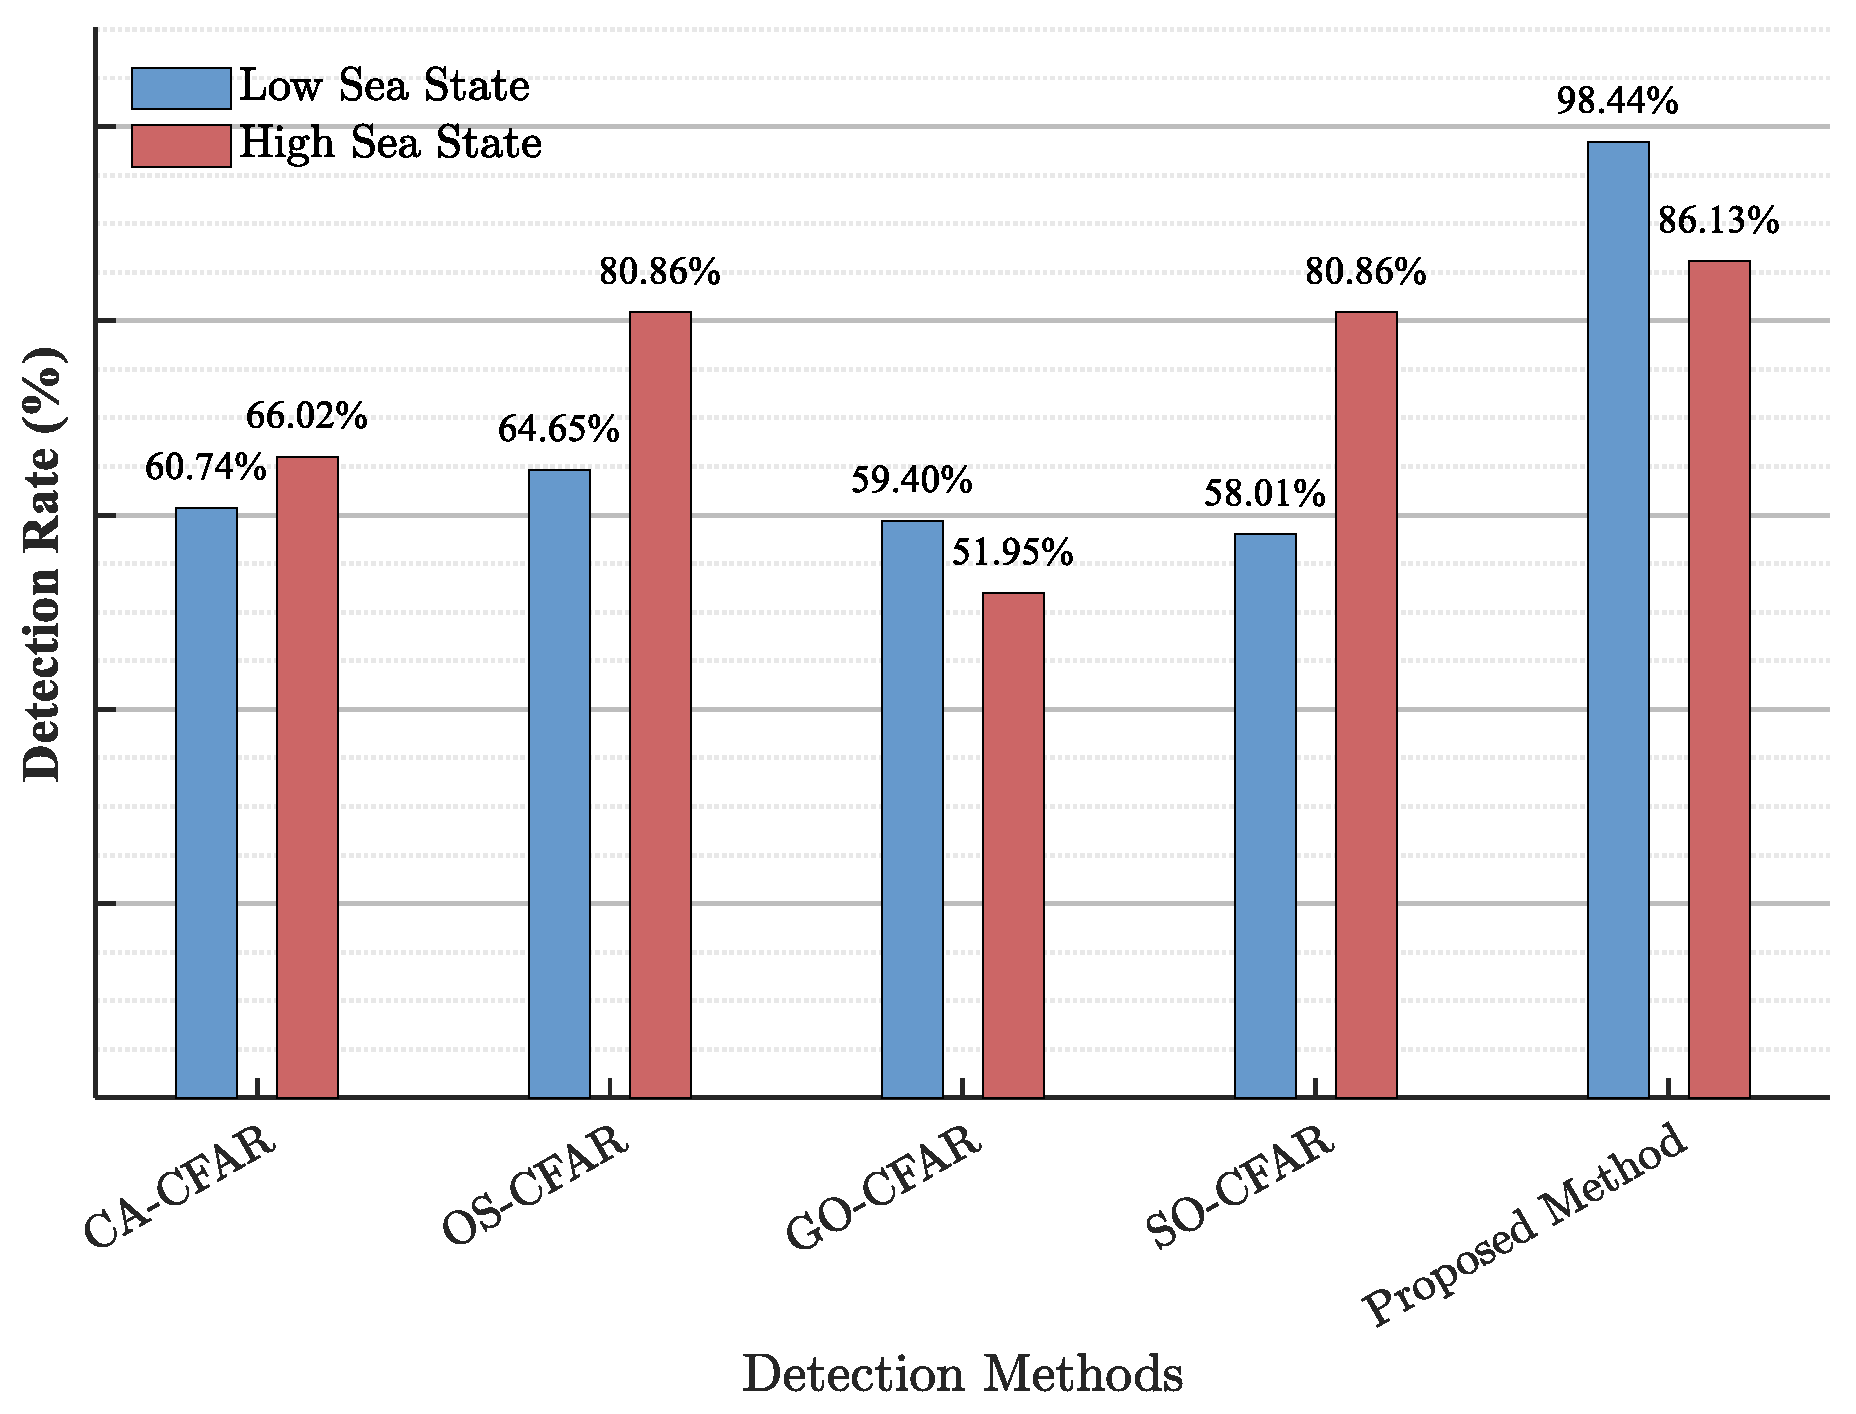
Under low sea state conditions, the proposed method achieves detection probability improvements of 37.70%, 33.79%, 39.04%, and 46.49% over CA-CFAR, OS-CFAR, GO-CFAR, and SO-CFAR, respectively. Corresponding improvements of 20.11%, 21.48%, 28.12%, and 27.33% are observed under high sea state conditions, as shown in Figure 17. These results demonstrate that the proposed method not only provides effective false alarm control capabilities but also delivers superior detection performance.
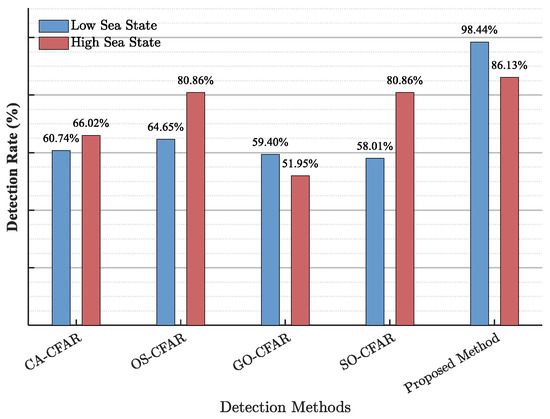
Figure 17.
Comparison of detection rate for CFAR method.
Next, we compare the proposed method with state-of-the-art detectors under complex high sea state conditions with identical feature sample sizes of 512 for comparative analysis. Table 1 summarizes the performance comparison of several advanced detectors. In this table, RAA represents Relative Average Amplitude, RPH represents Relative Peak Height, and RVE represents Relative Vector Entropy. The proposed method achieves a detection rate of 75.20% while maintaining an FAR of 0.5%. In contrast, the concave hull three-feature approach demonstrates a higher detection rate of 92.77%, and the concave hull PCA method achieves 84.57%. However, these methods exhibit significantly higher FARs of 29.69% and 25.00%, respectively. Moreover, these comparative methods fail to establish an explicit relationship between PFA and detection threshold.

Table 1.
Relative Comparison of detectors in the same sample size 512.
To ensure a fair comparison, we further increased the feature sample size of the competing methods while maintaining their FARs at the same order of 0.001 magnitude with the proposed method. The comparative results are presented in Table 2.
Table 2.
Comparison of detectors at the same false alarm rate level.
The proposed method demonstrates a significant detection rate improvement compared to state-of-the-art approaches, as shown in Figure 18.
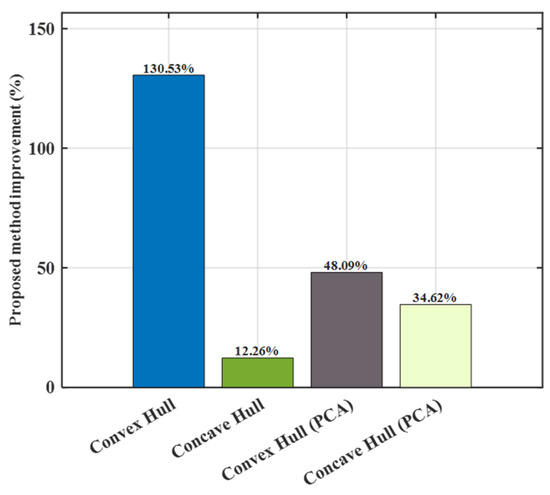
Figure 18.
Relative improvement in detection rate compared to state-of-the-art approaches.
5. Conclusions
In summary, this paper develops a novel multi-feature radar CFAR detection framework grounded in Copula theory to address the challenges of false alarm control under complex sea clutter conditions. The main contributions and findings are as follows:
- A Copula-CFAR theorem is established to rigorously characterize the nonlinear dependence among multiple features, providing a theoretical foundation for multi-feature target detection with controlled false alarm performance.
- Analytical formulas relating detection thresholds to PFA are derived for various Copula structures, enabling the design of an effective multi-feature Copula-CFAR detection algorithm.
- Extensive real-world data experiments demonstrate that the proposed method achieves a detection rate of 75.20% in a high state at a given PFA of 0.001 using only two features and 512 samples, significantly surpassing advanced multi-feature detectors.
Future work will explore extending the framework to incorporate additional Copula functions to better adapt to more complex and variable marine environments. Additionally, we plan to investigate adaptive Copula parameter estimation and implement the framework in real-time radar systems to evaluate
Author Contributions
Conceptualization, J.L., Y.D. and N.L.; methodology, J.L. and Y.H.; software, J.L. and X.J.; validation, N.L.; formal analysis, J.L.; investigation, N.L.; resources, Y.D.; data curation, N.L.; writing—original draft preparation, J.L.; writing—review and editing, J.L. and N.L.; visualization, J.L.; supervision, J.S.; project administration, Y.D.; funding acquisition, N.L. All authors have read and agreed to the published version of the manuscript.
Funding
This research was funded by the National Natural Science Foundation of China under Grant 62388102, Grant 62101583 and Taishan Scholars Program (tsqn202211246).
Data Availability Statement
The sea detecting radar dataset used in this study is openly available through the Sea Detecting Radar Data Sharing Program (SDRDSP), developed by our research team. Researchers can access and download the dataset at: https://radars.ac.cn/web/data/getData?dataType=DatasetofRadarDetectingSea (accessed on 1 January 2022). Readers can use the data for free for teaching, research, etc., but they need to quote or acknowledge them in papers, reports and other achievements. The data is forbidden to be used for commercial purposes. If you have any commercial needs, please contact the editorial department of “Journal of Radars”.
Conflicts of Interest
The authors declare no conflicts of interest.
Appendix A
From the reference cells of sea clutter, two features, and , are extracted. The feature follows a Beta distribution with parameters and , while the feature follows a Beta distribution with parameters and with CDF The CDF is given by
where .
The Frank Copula is employed to measure the nonlinear dependence between the features and
in order to establish the mathematical relationship between the thresholds , and the given , the equal contribution assumption is required
by Theorem 1, the Copula is
noting that for and we have , it follows that
the detection thresholds are obtained via the inverse CDF, , where and denote the inverse functions of the Beta distributions with parameters and , respectively.
Furthermore, under the target cell hypothesis , the marginal CDF of the features are defined as follows:
the joint CDF under is modeled via the Frank Copula,
hence, the detection probability is given by
under the equal contribution assumption, we set , so that the detection probability is
References
- Richter, Y.; Zach, S.; Blum, M.Y.; Pinhasi, G.A.; Pinhasi, Y. Tracking of low radar cross-section super-sonic objects using millimeter wavelength doppler radar and adaptive digital signal processing. Remote Sens. 2025, 17, 650. [Google Scholar] [CrossRef]
- Wang, F.; Qian, W.; Ren, K.; Wan, M.; Gu, G.; Chen, Q. Maritime small target detection based on appearance stability and depth-normalized motion saliency in infrared video with dense sunglints. IEEE Trans. Geosci. Remote Sens. 2023, 61, 5605919. [Google Scholar] [CrossRef]
- He, Z.; Chen, W.; Yang, Y.; Weng, D.; Cao, N. Maritime ship target imaging with GNSS-based passive multistatic radar. IEEE Trans. Geosci. Remote Sens. 2023, 61, 5800918. [Google Scholar] [CrossRef]
- Yu, H.; Ding, H.; Cao, Z.; Liu, N.; Wang, G.; Zhang, Z. A floating small target identification method based on doppler time series information. Remote Sens. 2024, 16, 505. [Google Scholar] [CrossRef]
- Yang, B.; Zhang, H. A cfar algorithm based on monte carlo method for millimeter-wave radar road traffic target detection. Remote Sens. 2022, 14, 1779. [Google Scholar] [CrossRef]
- Chu, T.; Zhou, H.; Ren, Z.; Ye, Y.; Wang, C.; Zhou, F. Intelligent detection of low–slow–small targets based on passive radar. Remote Sens. 2025, 17, 961. [Google Scholar] [CrossRef]
- Liu, X.; Bai, X.; Wang, D. Multi-fold high-order cumulants based CFAR detector for radar weak target detection. Digit. Signal Process. 2023, 139, 104076. [Google Scholar] [CrossRef]
- Mboungam, A.H.M.; Zhi, Y.; Monguen, C.K.F. Constant false alarm rate detection method in mixed weibull distribution sea clutter. Digit. Signal Process. 2024, 149, 104494. [Google Scholar] [CrossRef]
- Zhang, B.; Xie, J.; Zhou, W. A bayesian CFAR detector for interference control in weibull clutter. Digit. Signal Process. 2020, 104, 102781. [Google Scholar] [CrossRef]
- Wu, H.; Wang, Z.; Guo, H.; He, Z. Adaptive radar target detection in nonzero-mean compound gaussian sea clutter with random texture. Signal Process. 2025, 227, 109720. [Google Scholar] [CrossRef]
- Wijaya, K.T.; Paek, D.; Kong, S. Advanced feature learning on point clouds using multi-resolution features and learnable pooling. Remote Sens. 2024, 16, 1835. [Google Scholar] [CrossRef]
- Zhang, J.; Wang, L.; Zheng, F.; Wang, X.; Zhang, H. An enhanced feature extraction framework for cross-modal image–text retrieval. Remote Sens. 2024, 16, 2201. [Google Scholar] [CrossRef]
- Wei, H.; Fang, M.; Li, H.; Wang, Y.; Zheng, Z. Prototype-based dual-alignment of multi-source domain adaptation for radar emitter recognition. Signal Process. 2025, 230, 109853. [Google Scholar] [CrossRef]
- Guan, J.; Jiang, X.; Liu, N.; Ding, H.; Dong, Y.; Liu, T. Target detection in sea clutter based on feature re-expression using spearman’s correlation. IEEE Sens. J. 2024, 24, 30435–30450. [Google Scholar] [CrossRef]
- Guo, Z.; Bai, X.; Li, J.; Shui, P.; Su, J.; Wang, L. Small target detection in sea clutter using dominant clutter tree based on anomaly detection framework. Signal Process. 2024, 219, 109399. [Google Scholar] [CrossRef]
- Coluccia, A.; Fascista, A.; Ricci, G. Cfar feature plane: A novel framework for the analysis and design of radar detectors. IEEE Trans. Signal Process. 2020, 68, 3903–3916. [Google Scholar] [CrossRef]
- Coluccia, A.; Fascista, A.; Ricci, G. Design of customized adaptive radar detectors in the CFAR feature plane. IEEE Trans. Signal Process. 2022, 70, 5133–5147. [Google Scholar] [CrossRef]
- Taheri-Kalani, J.; Latif-Shabgahi, G.; Shoorehdeli, M.A. Optimizing multivariate alarm systems: A study on joint false alarm rate, and joint missed alarm rate using linear programming technique. Process Saf. Environ. Prot. 2024, 191, 1775–1783. [Google Scholar] [CrossRef]
- Liang, Z.; Chen, J.; Jiang, J. A multi-featured detection method for small target on sea surface based on GSP. IEEE Geosci. Remote Sens. Lett. 2023, 20, 1502305. [Google Scholar] [CrossRef]
- Wu, X.; Ding, H.; Liu, N.; Guan, J. A method for detecting small targets in sea surface based on singular spectrum analysis. IEEE Trans. Geosci. Remote Sens. 2022, 60, 5110817. [Google Scholar] [CrossRef]
- Shui, P.; Li, D.; Xu, S. Tri-feature-based detection of floating small targets in sea clutter. IEEE Trans. Aerosp. Electron. Syst. 2014, 50, 1416–1430. [Google Scholar] [CrossRef]
- Li, Y.; Wang, Z.; Chen, H.; Li, Y. A density clustering-based CFAR algorithm for ship detection in SAR images. IEEE Geosci. Remote Sens. Lett. 2024, 21, 4009505. [Google Scholar] [CrossRef]
- Diskin, T.; Beer, Y.; Okun, U.; Wiesel, A. Cfarnet: Deep learning for target detection with constant false alarm rate. Signal Process. 2024, 223, 109543. [Google Scholar] [CrossRef]
- Chen, X.; Liu, K.; Zhang, Z. A pointnet-based CFAR detection method for radar target detection in sea clutter. IEEE Geosci. Remote Sens. Lett. 2024, 21, 3502305. [Google Scholar] [CrossRef]
- Zhou, H.; Jiang, T. Decision tree based sea-surface weak target detection with false alarm rate controllable. IEEE Signal Process. Lett. 2019, 26, 793–797. [Google Scholar] [CrossRef]
- Zeng, T.; Zhang, T.; Shao, Z.; Xu, X.; Zhang, W.; Shi, J. Cfar-dp-fw: A cfar-guided dual-polarization fusion framework for large-scene SAR ship detection. IEEE J. Sel. Top. Appl. Earth Obs. Remote Sens. 2024, 17, 7242–7259. [Google Scholar] [CrossRef]
- Lu, C.; Feng, Y.; Fei, C.; Teng, D. Dimensional synchronous modeling-based enhanced kriging algorithm and adaptive copula method for multi-objective synthetical reliability analyses. Chin. J. Aeronaut. 2025, 103652. [Google Scholar] [CrossRef]
- Ni, L.; Zhang, D.; Wang, Z.; Liang, J.; Zhuang, J.; Wan, Q. Fast copula-based fusion of correlated decisions for distributed radar detection. Signal Process. 2022, 201, 108676. [Google Scholar] [CrossRef]
- Karine, A.; Toumi, A.; Khenchaf, A.; Hassouni, M.E. Multivariate copula statistical model and weighted sparse classification for radar image target recognition. Comput. Electr. Eng. 2020, 84, 106633. [Google Scholar] [CrossRef]
- Anatolyev, S.; Pyrlik, V. Copula shrinkage and portfolio allocation in ultra-high dimensions. J. Econ. Dyn. Control. 2022, 143, 104508. [Google Scholar] [CrossRef]
- Li, Y.; Chen, H.; Yi, M.; Li, J.; Fang, C. Seismic vulnerability analysis of bridges incorporating scour uncertainty using a copula-based approach. Ocean. Eng. 2025, 323, 120598. [Google Scholar] [CrossRef]
- Peng, C.; Shangguan, W.; Wang, Z.; Peng, J.; Chai, L.; Xing, Y.; Cai, B. Reliability assessment of urban rail transit vehicle on-board controller with multi-component failure dependence based on r-vine-copula. Reliab. Eng. Syst. Saf. 2025, 257, 110795. [Google Scholar] [CrossRef]
- Li, Y.; Yang, J.; Wu, J.; Zhang, Z.; Xia, H.; Ma, Z.; Gao, L. Spatiotemporal responses and vulnerability of vegetation to drought in the Ili river transboundary basin: A comprehensive analysis based on copula theory, SPEI, and NDVI. Remote Sens. 2025, 17, 801. [Google Scholar] [CrossRef]
- Li, W.; Wang, X.; Li, G.; Geng, B.; Varshney, P.K. A copula-guided in-model interpretable neural network for change detection in heterogeneous remote sensing images. IEEE Trans. Geosci. Remote Sens. 2025, 63, 4700817. [Google Scholar] [CrossRef]
- Dong, H.; Xu, X.; Sui, H.; Xu, F.; Liu, J. Copula-based joint statistical model for polarimetric features and its application in polsar image classification. IEEE Trans. Geosci. Remote Sens. 2017, 55, 5777–5789. [Google Scholar] [CrossRef]
- Lei, L.; Peng, Y.; Fu, M.C.; Hu, J. Copula sensitivity analysis for portfolio credit derivatives. Eur. J. Oper. Res. 2022, 308, 455–466. [Google Scholar] [CrossRef]
- Wu, X.; Ding, H.; Liu, N.; Dong, Y.; Guan, J. Priori information-based feature extraction method for small target detection in sea clutter. IEEE Trans. Geosci. Remote Sens. 2022, 60, 5115315. [Google Scholar] [CrossRef]
- Nelsen, R.B. An Introduction to Copulas; Springer: Berlin/Heidelberg, Germany, 2006. [Google Scholar]
- Guan, J.; Liu, N.; Wang, G.; Ding, H.; Dong, Y.; Huang, Y.; Tian, K.; Zhang, M. Sea-detection radar experiment and target feature data acquisiton for dual polarization multistate scattering dataset of marine target. J. Radars 2023, 12, 456–469. [Google Scholar] [CrossRef]
- Liu, N.; Ding, H.; Huang, Y.; Dong, Y.; Wang, G.; Dong, K. Annual progress of the sea-detecting x-band radar and data acquisition program. J. Radars 2021, 10, 173–182. [Google Scholar] [CrossRef]
- Liu, N.; Dong, Y.; Wang, Q.; Ding, H.; Huang, Y.; Guan, J.; Chen, X.; He, Y. Sea-detecting x-band radar and data acquisition program. J. Radars 2019, 8, 656–667. [Google Scholar] [CrossRef]
- Liu, N.; Li, J.; Wang, G.; Chen, B.; Cao, Z.; Dong, Y.; Guan, J.; Jiang, X.; Zhang, Z.; Xue, W. Sea-detecting radar experiment and target feature data acquisition for multisource observation dataset of maritime targets. J. Radars 2025, 14, 754–780. [Google Scholar] [CrossRef]
- Juan, L.; Bo, J.; Xiaoqing, Q.; Xiaodong, L. Fault states feature extraction and experimental study for airborne fuel pumps based on sample quantile. Acta Aeronaut. Astronaut. Sin. 2016, 37, 2851–2863. [Google Scholar]
- Ikizler, N.; Ekim, G. Investigating the effects of gaussian noise on epileptic seizure detection: The role of spectral flatness, bandwidth, and entropy. Eng. Sci. Technol. Int. J. 2025, 64, 102005. [Google Scholar] [CrossRef]
- Çopuroğlu, E. Theoretical estimation of entropy of solids by using integer and non-integern -dimensional debye functions. Phys. A Stat. Mech. Its Appl. 2022, 593, 126915. [Google Scholar] [CrossRef]
- Shi, Y.; Hu, Y. MRMR-tri-concavehull detector for floating small targets in sea clutter. IEEE J. Sel. Top. Appl. Earth Obs. Remote Sens. 2023, 16, 6799–6811. [Google Scholar] [CrossRef]
- Wei, Y.; Liu, Y.; Song, H.; Lu, Z. A method of rainfall detection from x-band marine radar image based on the principal component feature extracted. IEEE Geosci. Remote Sens. Lett. 2023, 20, 3501105. [Google Scholar] [CrossRef]


Disclaimer/Publisher’s Note: The statements, opinions and data contained in all publications are solely those of the individual author(s) and contributor(s) and not of MDPI and/or the editor(s). MDPI and/or the editor(s) disclaim responsibility for any injury to people or property resulting from any ideas, methods, instructions or products referred to in the content. |
© 2025 by the authors. Licensee MDPI, Basel, Switzerland. This article is an open access article distributed under the terms and conditions of the Creative Commons Attribution (CC BY) license (https://creativecommons.org/licenses/by/4.0/).