Abstract
Water vapor plays a crucial role in maintaining global energy balance and water cycle, and it is closely linked to various meteorological disasters. Precipitable water vapor (PWV), as an indicator of variations in atmospheric water vapor content, has become a key parameter for meteorological and climate monitoring. However, due to limitations in observation costs and technology, traditional atmospheric monitoring techniques often struggle to accurately capture the distribution and variations in space–time water vapor. With the continuous advancement of Global Navigation Satellite System (GNSS) technology, ground-based GNSS monitoring technology has shown rapid development momentum in the field of meteorology and is considered an emerging monitoring tool with great potential. Hence, based on the GNSS observation data from July 2023, this study retrieves PWV using the Global Pressure and Temperature 3 (GPT3) model and evaluates its application performance in the “7·31” extremely torrential rain event in Beijing in 2023. Research has found the following: (1) Tropospheric parameters, including the PWV, zenith tropospheric delay (ZTD), and zenith wet delay (ZWD), exhibit high consistency and are significantly affected by weather conditions, particularly exhibiting an increasing-then-decreasing trend during rainfall events. (2) Through comparisons with the PWV values through the integration based on fifth-generation European Centre for Medium-Range Weather Forecasts (ERA-5) reanalysis data, it was found that results obtained using the GPT3 model exhibit high accuracy, with GNSS PWV achieving a standard deviation (STD) of 0.795 mm and a root mean square error (RMSE) of 3.886 mm. (3) During the rainfall period, GNSS PWV remains at a high level (>50 mm), and a strong correlation exists between GNSS PWV and peak hourly precipitation. Furthermore, PWV demonstrates the highest relative contribution in predicting extreme precipitation, highlighting its potential value for monitoring and predicting rainfall events.
1. Introduction
The intensification of global warming has significantly elevated the frequency and intensity of extreme weather events, posing formidable challenges to global socio-economic systems and ecological stability [1,2,3,4]. Urban areas, in particular, face escalating risks from catastrophic precipitation such as heavy rainfall and floods, which increasingly threaten critical infrastructure, transportation networks, and human lives [5,6]. On 31 July 2023, Beijing experienced an unparalleled extreme rainstorm, resulting in record-breaking precipitation accumulations and catastrophic flooding. Statistical analyses confirm that rainfall intensity during this event surpassed historical benchmarks, straining the city’s flood prevention infrastructure to its limits [7]. Consequently, the precise monitoring of atmospheric water vapor dynamics, acting as a critical precursor to precipitation, has emerged as an urgent priority for enhancing disaster preparedness and response capabilities.
Water vapor is an essential component of the atmosphere and plays a crucial role in weather forecasting and monitoring and early warning [8]. Advancements in remote sensing technologies have underscored the paramount importance of high-resolution water vapor monitoring for disentangling the mechanisms governing extreme meteorological events. In recent years, ground-based Global Navigation Satellite System (GNSS) technology has become an effective tool for water vapor monitoring due to its high precision, broad coverage, and real-time capabilities [9,10,11]. GNSS receivers enable a capability unmatched by conventional meteorological networks in terms of spatial coverage and temporal resolution.
Research on GNSS meteorology was initiated by scholars as early as the last century. In 1992, Bevis et al. [12] first proposed water vapor remote sensing technology based on Global Positioning System (GPS), which promoted the application and development of a GNSS in the field of meteorology. In 1993, Rocken et al. [13] successfully obtained the zenith path delay (ZPD) using GPS observation data and generated a dataset with a two-hour time resolution. This study demonstrates that GPS technology can obtain PWV results with accuracy at a sub-millimeter level. Jiang et al. [14] found that the Beidou Navigation Satellite System (BDS-3) has a PWV retrieval performance comparable to that of the GPS and achieved better results with the combination of GPS and BDS-3 data. This study has significant guiding value for the fields of short-term meteorological forecasting and climate analysis. Yao et al. [15] developed and validated a short-term rainfall prediction technique based on the correlation between GNSS-derived PWV and actual rainfall. The technology can accurately predict rainfall events with a probability of 80%, and its applicability is very wide, enabling its use for short-term rainfall prediction in various regions, durations, and types of rainfall. Zhang et al. [16] conducted in-depth research on the applicability of GPS water vapor retrieval in the Chinese region, particularly using the fifth-generation European Centre for Medium-Range Weather Forecasts (ERA-5) reanalysis dataset for validation. Research has revealed that the ERA-5 dataset can support high-precision GPS water vapor retrieval at hourly intervals. Overall, numerous studies have conducted extensive research on the feasibility and accuracy of implementing GNSS PWV [17,18,19].
Based on the aforementioned research, this paper proposes a simple PWV monitoring method that can be applied to precipitation monitoring. The purpose of this work is to deeply study the rainstorm event in Beijing by analyzing the PWV data retrieved from the GNSS station in BJFS. Through the combination of other meteorological elements, the evolution characteristics of key meteorological parameters such as rainfall, PWV, and the synoptic situation during the “7·31” extremely torrential rain in time and space, and their interrelationship is analyzed in detail. This study will help us not only better understand the causes and evolution of rainstorm but also provide valuable reference for future rainstorm weather forecasts and analysis.
2. Data and Methods
We first introduce the data and methodologies, followed by their application in precipitation monitoring.
2.1. Data
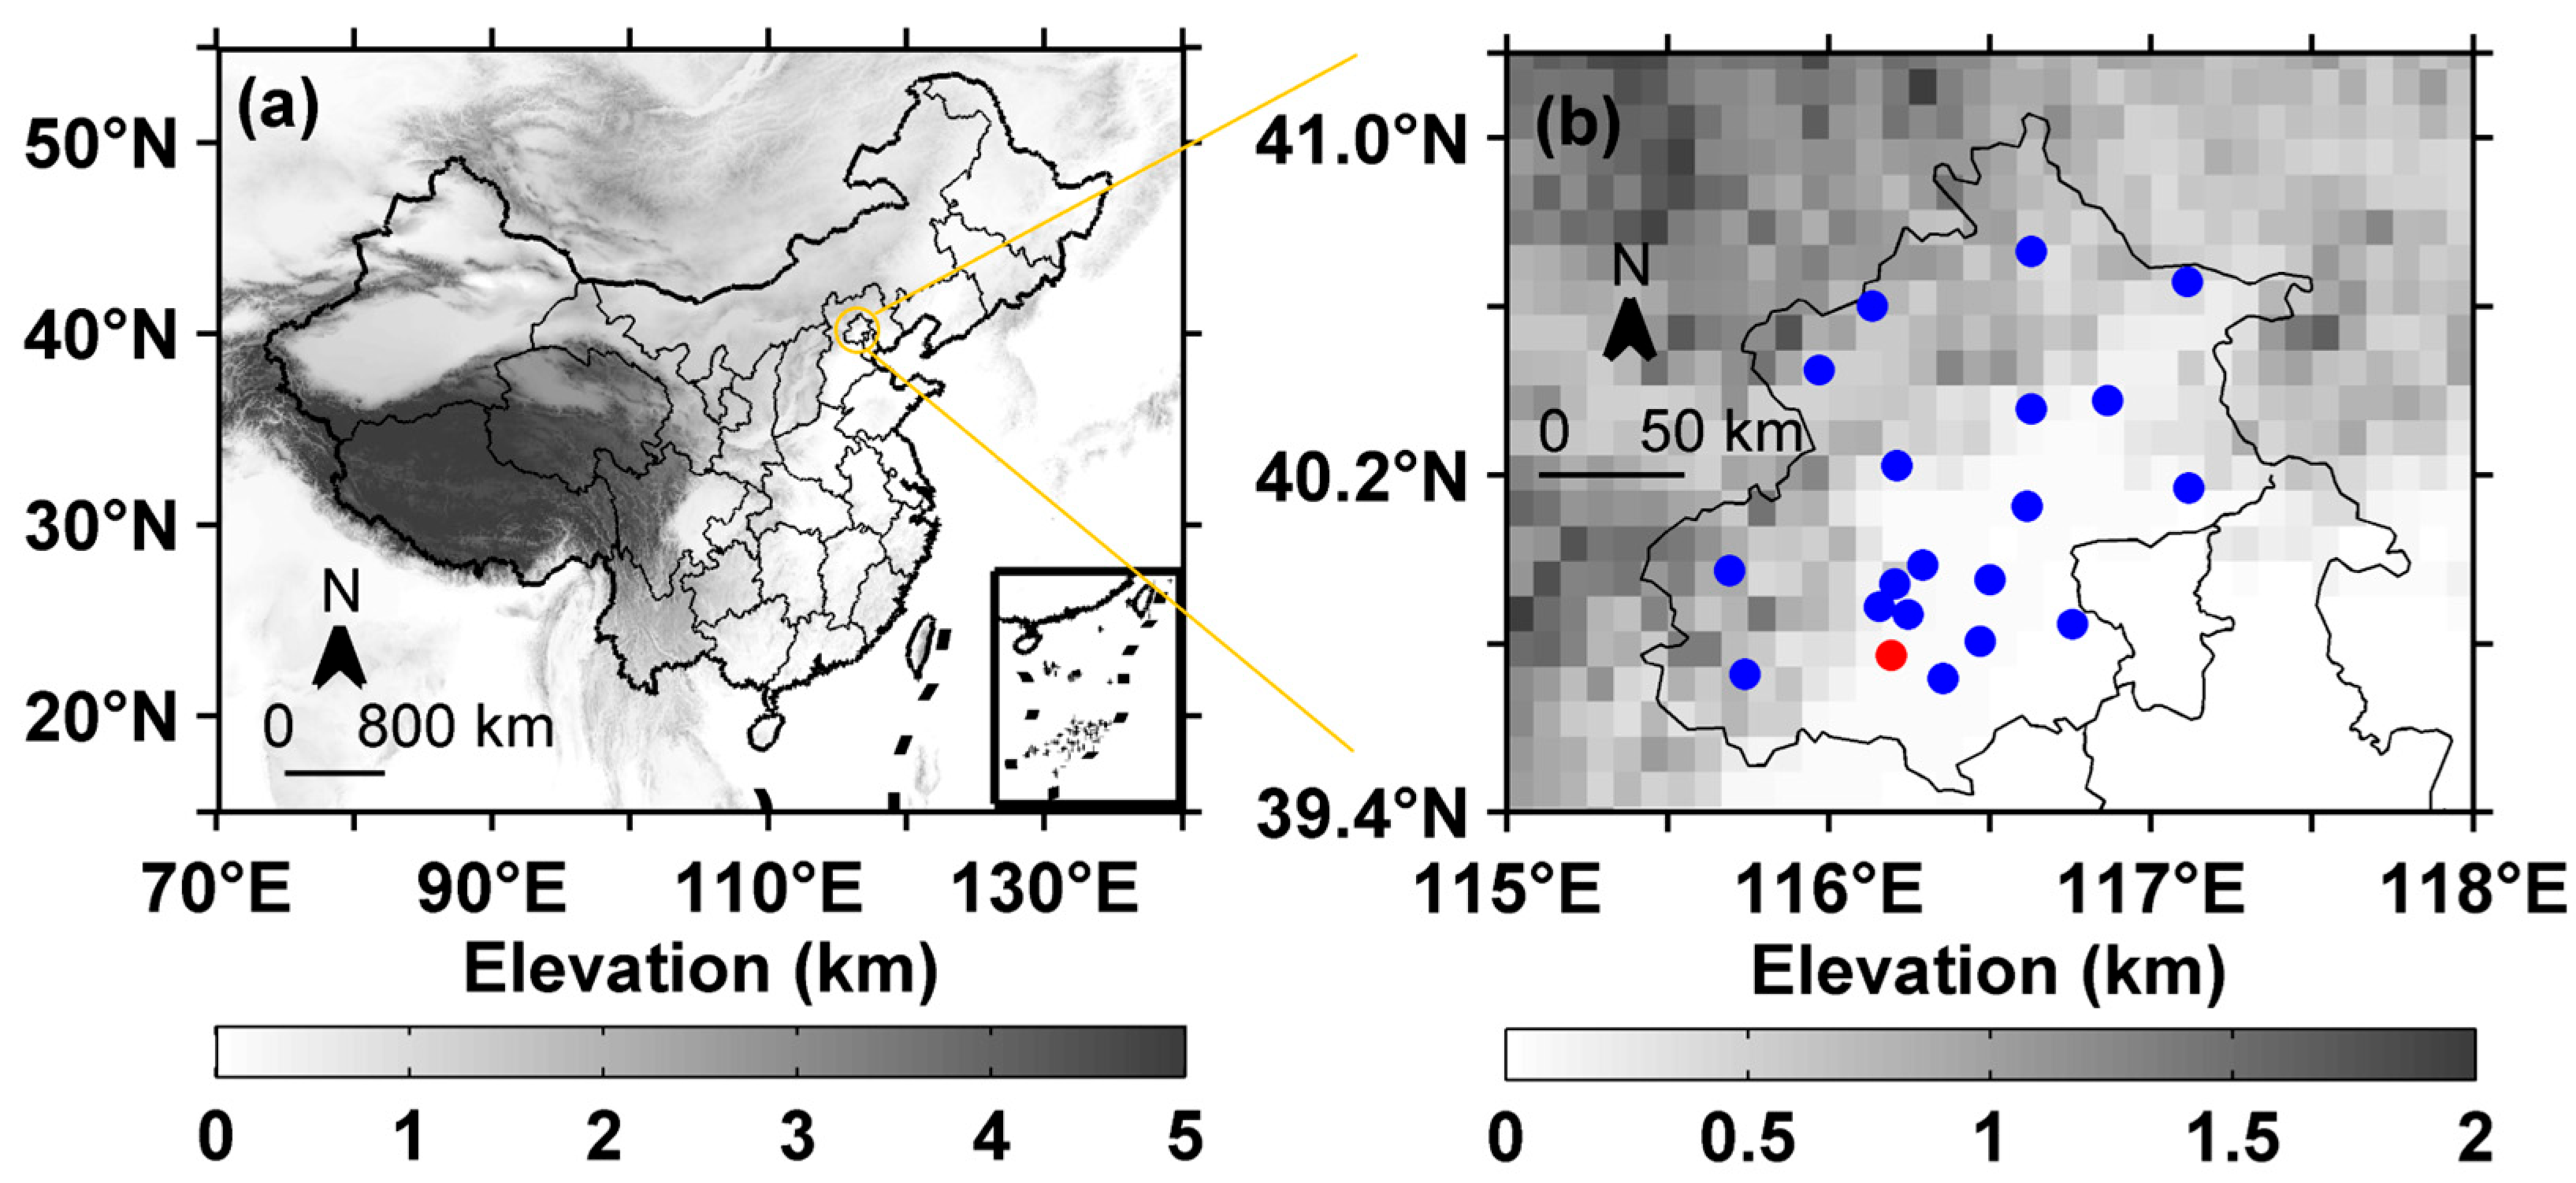
The ground hourly rainfall observation and radiosonde data used in this study are from national surface stations (http://data.cma.cn/en (accessed on 1 May 2025)). The distribution of GNSS and meteorological stations is illustrated in Figure 1, where the BJFS station (red dot) integrates both GNSS receivers and meteorological sensors, while blue dots represent other meteorological stations. The profiles of the temperature, pressure, geopotential height, wind vector, and relative humidity with a temporal resolution of 1 h and a spatial resolution of 0.25° × 0.25° were obtained from ERA-5 reanalysis data (European Centre for Medium-Range Weather Forecasts (ECMWF)) [20]. The GNSS data processing strategy is shown in Table 1. For the BJFS station, ZTD data from 1 July to 1 August 2023 were resampled from the original 5 min interval to a 1 h resolution.
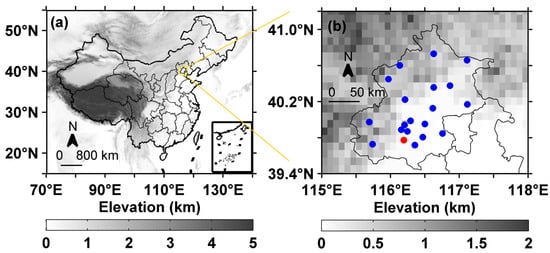
Figure 1.
(a) Distribution of elevation (shaded) in China and (b) observations (dot) in Beijing. The red dot represents BJFSs, which includes GNSS stations and meteorological stations, while the blue dots represent meteorological stations.

Table 1.
GNSS data processing strategy.
From 1 July to 1 August 2023, the BJFS observation station recorded 7 significant rainfall events, with the following specific times: 17:00 on 3 July to 1:00 on 4 July, 15:00 on 11 July to 7:00 on 13 July, 15:00 on 20 July to 3:00 on 22 July, 13:00 on 24 July to 15:00 on 24 July, 8:00 on 26 July to 10:00 on 26 July, 11:00 on 27 July to 18:00 on 27 July, and 3:00 on 29 July to 23:00 on 1 August. The cumulative rainfall amounts of these rainfall events are 17.1 mm, 31.3 mm, 39.5 mm, 14.8 mm, 3.1 mm, 2.9 mm, and 369.7 mm, respectively. According to China standard of precipitation levels (https://www.cma.gov.cn/ (accessed on 1 May 2025)), rainfall is divided into 7 levels based on the accumulated precipitation within 24 h. Table 2 provides the classification of rainfall levels. As shown in Table 2, these rainfall events are classified into micro rain, light rain, moderate rain, heavy rain, rainstorm, heavy rainstorm, and extremely heavy rainstorm according to different rainfall intensity standards.
Table 2.
Classification of rainfall levels.
2.2. GNSS PWV Retrieval
2.2.1. ZTD
The speed of the radio signal transmitted by GNSS satellites when crossing the troposphere is , where c is the true propagation speed of light. is the atmospheric refractive index, while is the propagation speed of light in vacuum. is the atmospheric refractive index, which is influenced by meteorological factors such as temperature, pressure, and relative humidity. This refractive index directly governs the propagation delay of GNSS signals through the atmosphere, and their quantitative relationship is expressed as [27]
where represents the straight-line distance between the satellite and the GNSS receiver, while represents the actual curved path distance traveled by the electromagnetic wave signal due to atmospheric refraction. The proportion of geometric path growth caused by refraction relative to the total distance is very small, usually around 0.1%, so this part is often ignored in calculations. Among them, is the tropospheric delay, while is the correction of tropospheric delay.
2.2.2. ZHD
Zenith Hydrostatic Delay (ZHD) is caused by the effect of the polarity characteristics of water vapor molecules in the troposphere on the atmospheric refractive index [28]. It can be calculated by integrating the atmospheric static refractive index along the zenith direction, and its calculation formula is
Generally speaking, the value of ZTD is mostly between 2 and 2.5 m, with static delay accounting for the vast majority of this value, approximately exceeding 90%. Thanks to its stability, ZTD can be calculated using pressure and temperature data from ground weather stations, combined with existing empirical models. The accuracy of these models is usually based on the observation parameters of ground meteorological stations, the latitude and altitude information of geographical locations, to achieve a precise estimation of the ZHD at specific locations. The accuracy of this estimation can reach millimeter or even sub-millimeter levels, meeting the requirements of high-precision PWV retrieval. Among these models, the most commonly used and highly accurate one is the Saastamoinen model. Saastamoinen [29] and Davis [30] proposed the following formula for calculating the ZHD:
where is the ground pressure of the measuring station, measured in hPa; represents the elevation of the station, in km; and is the geographic latitude of the station.
2.2.3. PWV Retrieval
PWV usually refers to the total depth at which all water vapor in the atmosphere is converted into liquid water. It is an important indicator used to measure water vapor content in the atmosphere and water resources in the air. At present, PPP can accurately extract ZTD information from GNSS signals. In addition, with the Saastamoinen model or atmospheric reanalysis data, the ZHD can be accurately calculated. Through the combination of these data, high-precision ZWD information can be obtained according to the following formula [31]:
PWV is then calculated according to the following equation:
Here, is the water vapor conversion factor, which can be calculated according to the following formula:
where is the weighted average temperature, measured in K; is the density of liquid water, with a value of 103 kg/m3; is the gas constant of water vapor, with = 461.51 J/(K·kg); and is the gas constant, with = 17 ± 10 K/hPa.
Here, the calculation of is carried out using the model proposed by Zhang et al. [16], which is a multi-factor model based on the surface temperature , surface pressure , and water vapor pressure of the measurement station [32]:
In this study, the Global Pressure and Temperature 3 (GPT3) model [33] was used for the calculation, and the PWV generated by this method was referred to as GNSS PWV. The GPT series models, since their initial stage as GPT models, all use order spherical harmonics to represent meteorological parameters. The GPT2 model [34] and GPT2w model [35] were subsequently developed to express meteorological parameters using grid data, and their accuracy continued to improve with the development of the models. The GPT3 model [33], as the latest temperature and pressure model in the series, uses the GMF as the GPT2w model. This design effectively solves the problem of time delay and significantly reduces function errors at low truncation angles by optimizing the parameters of the mapping function.
The GPT3 model can provide the horizontal resolution parameters of 1° × 1°, which include atmospheric weighted average temperature (), water vapor pressure (), surface temperature (), ground pressure (), and the water vapor pressure reduction factor (λ). The relevant calculation formula is as follows [36]:
where represents meteorological parameters such as air pressure, temperature, and specific humidity; is the annual average value; and are annual cycle amplitudes; and represent the amplitude of the six-month cycle; and doy represents the day of the year (DOY).
2.3. ERA5 PWV Retrieval
The method for calculating PWV is based on the ideal gas law and the equation of state. The total water vapor content is obtained by calculating the water vapor density of each layer in the atmosphere and integrating it. The specific calculation formula is [37]
where is the gravitational acceleration, measured in m/s2; is the pressure, measured in hPa; is the density of liquid water, measured in kg/m3; and is the specific humidity, measured in kg/kg.
Here, can be calculated using temperature and relative humidity, which can be expressed as follows:
where is the saturated vapor pressure; is temperature; and is relative humidity.
2.4. Pseudo-Equivalent Potential Temperature
Based on sounding data of temperature, pressure, and relative humidity, pseudo-equivalent potential temperature () can be calculated as [2]
where is specific humidity, and is temperature at the lifting condensation level.
2.5. Calculation of Accuracy Evaluation Index and Relative Contribution
In this study, bias and root mean square error (RMS) are used to evaluate the accuracy of GNSS PWV error, and the specific calculation methods for these two parameters are as follows:
where represents the number of data samples, represents the observed value, and is the reference value.
Through the multiple linear regression analysis of standardized variables [38], this study quantified the impact of different factors on precipitation using the following equation:
where xi represents meteorological factors, including , , dew point temperature (), RH, and PWV. ki is the correlation coefficient, c is the constant term, and ϵ is the residual of the equation. For each xi, under the control of other variables, the contribution of that factor can be extracted by calculating the change in the interpretation rate of equation variance after removing a specific factor.
This method can simultaneously consider the influence of multiple meteorological factors on precipitation. However, it is necessary to emphasize that this method assumes a linear relationship between the independent variables and the dependent variable. In reality, the relationship between them may be nonlinear, and this limitation may lead to biases in the model’s predictions or interpretations of precipitation.
3. Result Analysis
3.1. Synoptic Situation and Conditions
3.1.1. Precipitation Amount and Intensity
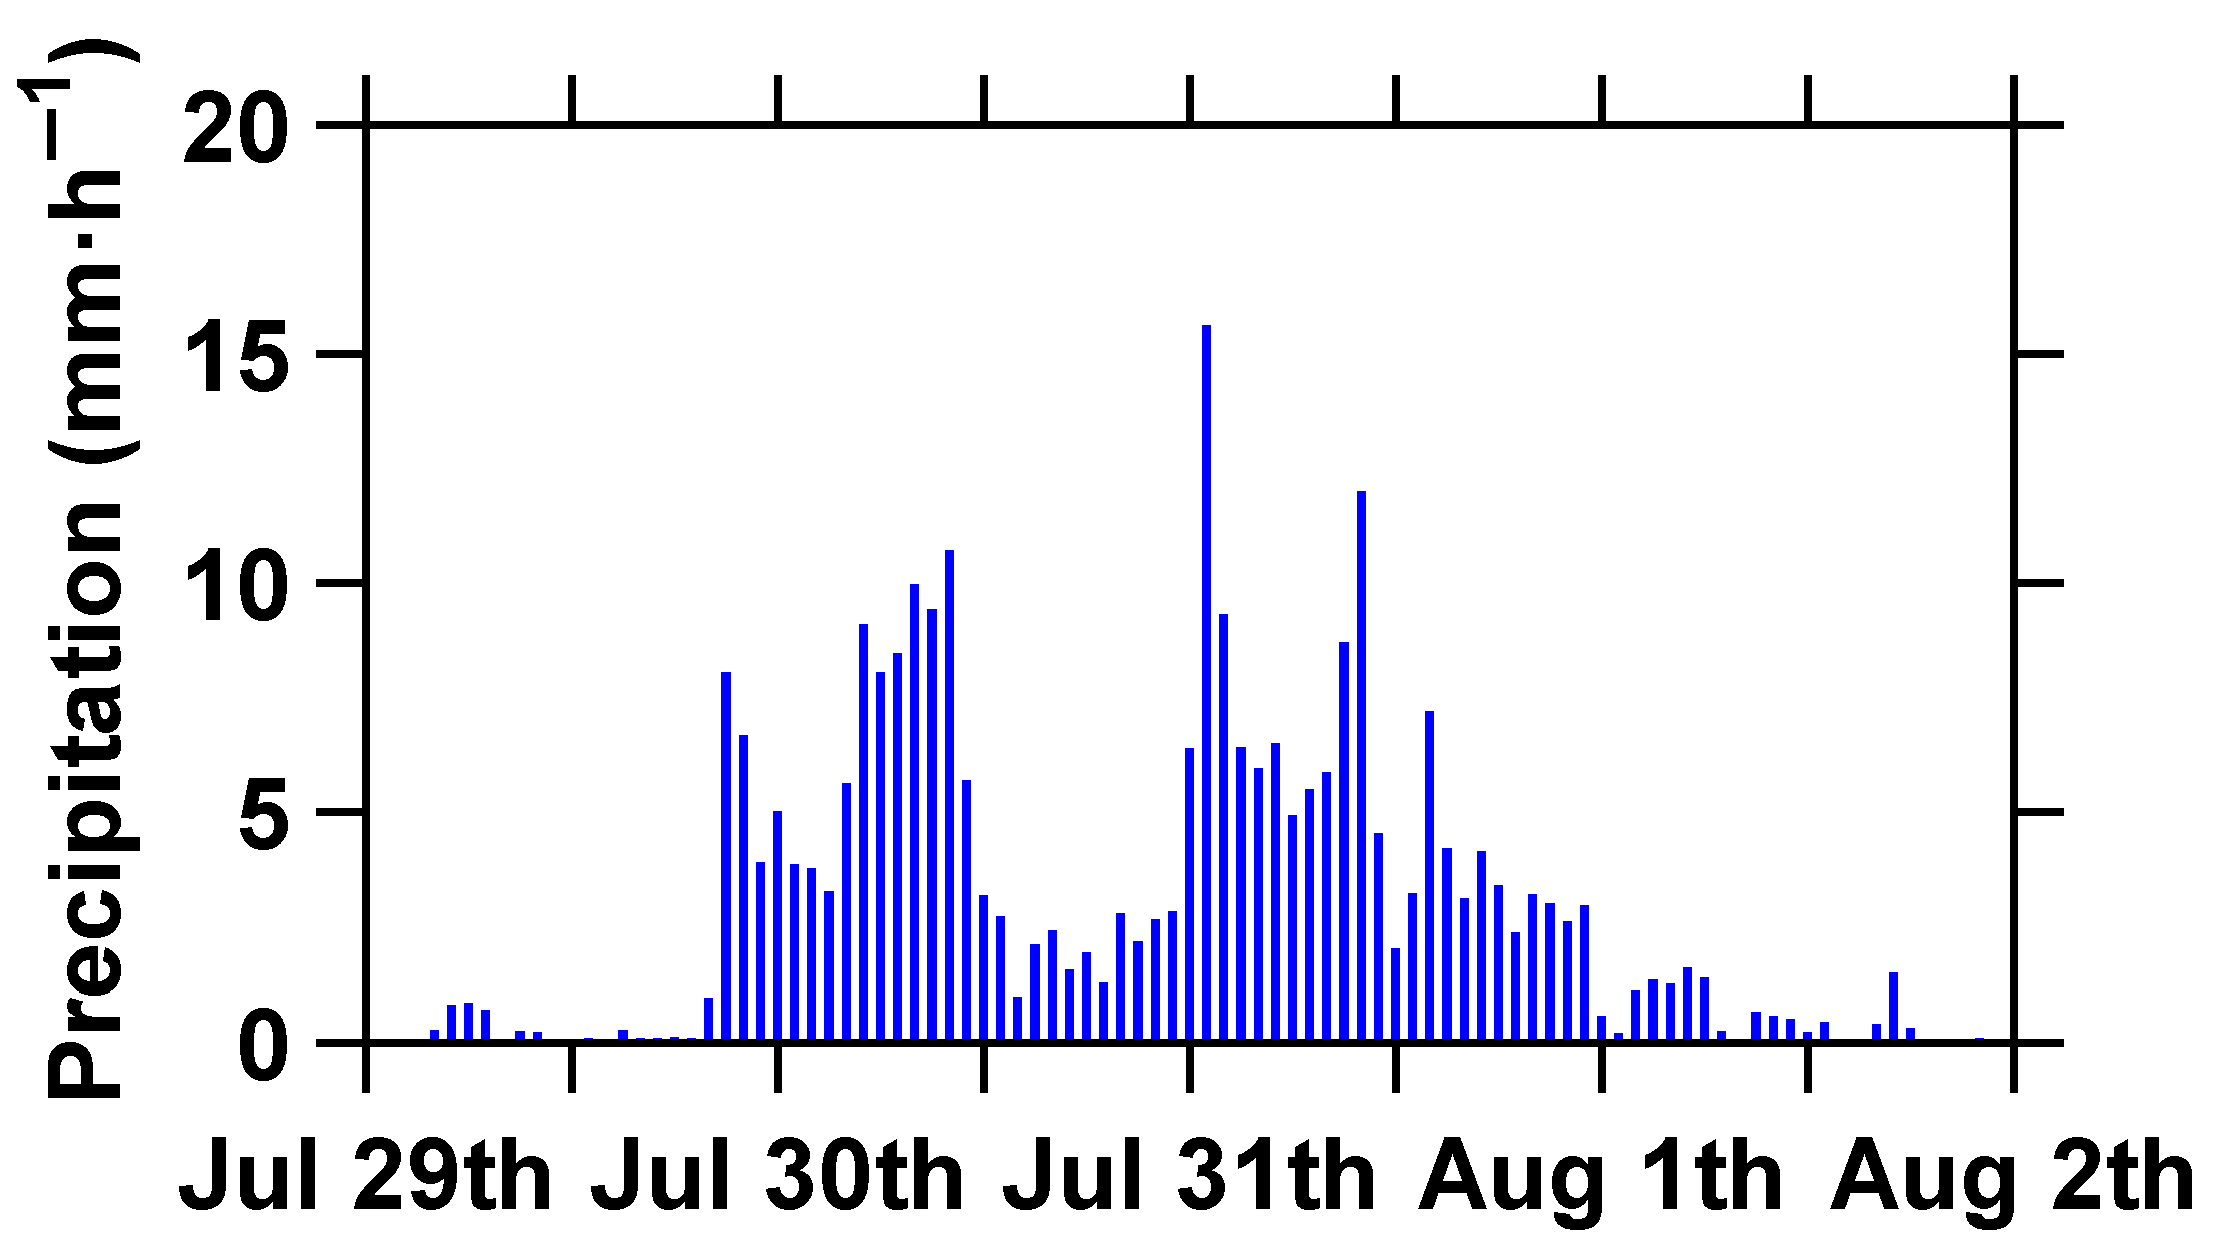
The “7·31” extremely torrential rain event in Beijing started at 5:00 UTC (13:00 local time) on 29 July 2023 and ended at 00:00 UTC on 2 August 2023, with a total duration of 92 h (Figure 2). The “7·31” Beijing rainstorm, fueled by Typhoon Doksuri’s remnants, marked one of Beijing’s most catastrophic extreme weather events. It triggered unprecedented urban flooding, paralyzing transportation, damaging infrastructure, and causing significant loss of life and property. In the meteorological stations in Beijing, 80% of the stations have accumulated precipitation exceeding 200 mm, and 30% of the stations have accumulated precipitation exceeding 300 mm (with the station with the highest rainfall being 772.2 mm).

Figure 2.
Time series of average rainfall intensity in Beijing from 0:00 UTC 29 July to 0:00 UTC 2 August 2023.
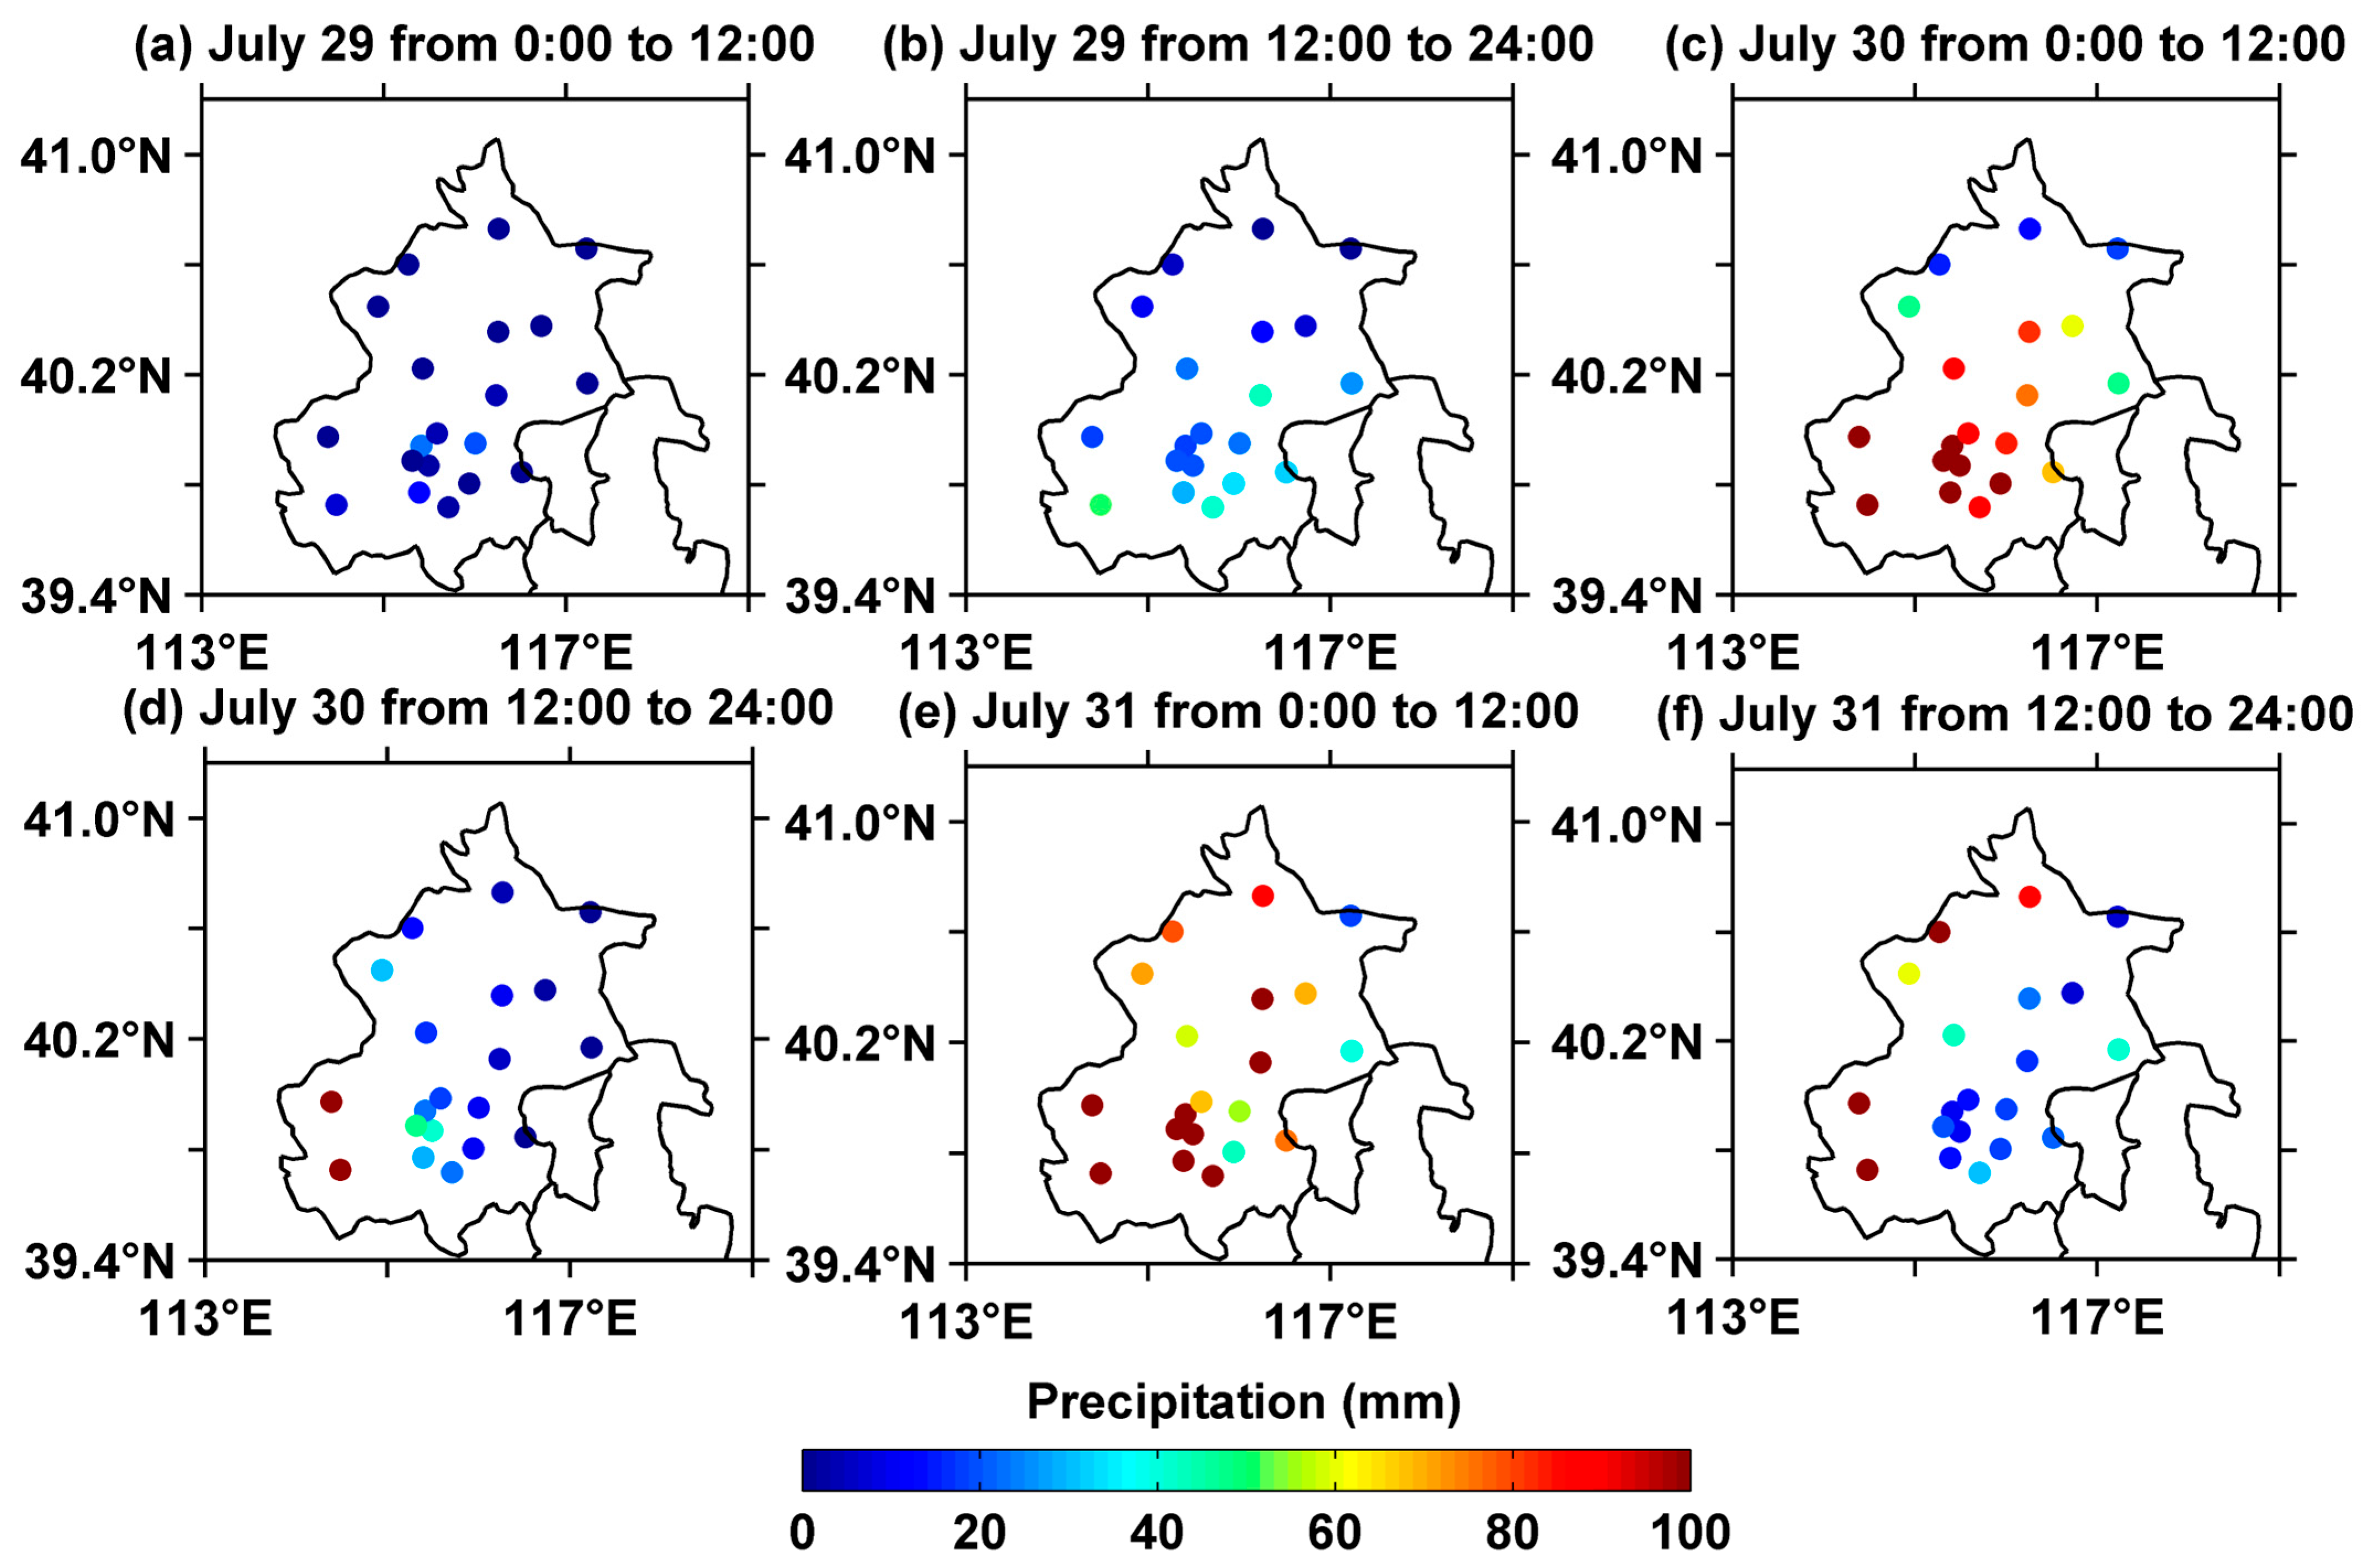
The accumulated rainfall is distributed in the southwest northeast direction, and the rainstorm center is located in the southwest mountain area, which is shown in Figure 3. From the time series diagram of precipitation, it can be found that the rainfall process is mainly composed of two rounds of heavy rainstorm [36]. The first round of heavy rainstorm was concentrated from 20:00 UTC on 29 July to 14:00 UTC on 30 July, with a cumulative precipitation of 111.3 mm. The second round of heavy rainstorm was concentrated from 15:00 UTC on 30 July to 0:00 UTC on 1 August, with a cumulative precipitation of 156.9 mm, making it the strongest rainfall period of the entire precipitation event.
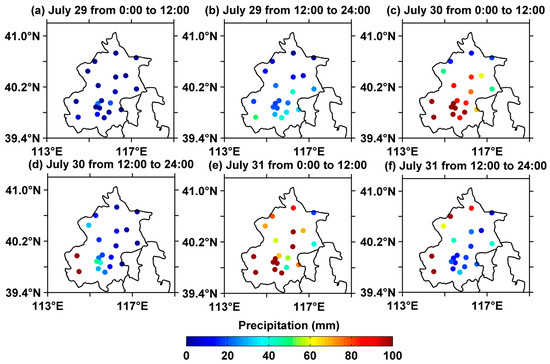
Figure 3.
Accumulated precipitation distribution every 12 h in Beijing area.
3.1.2. Synoptic Situation
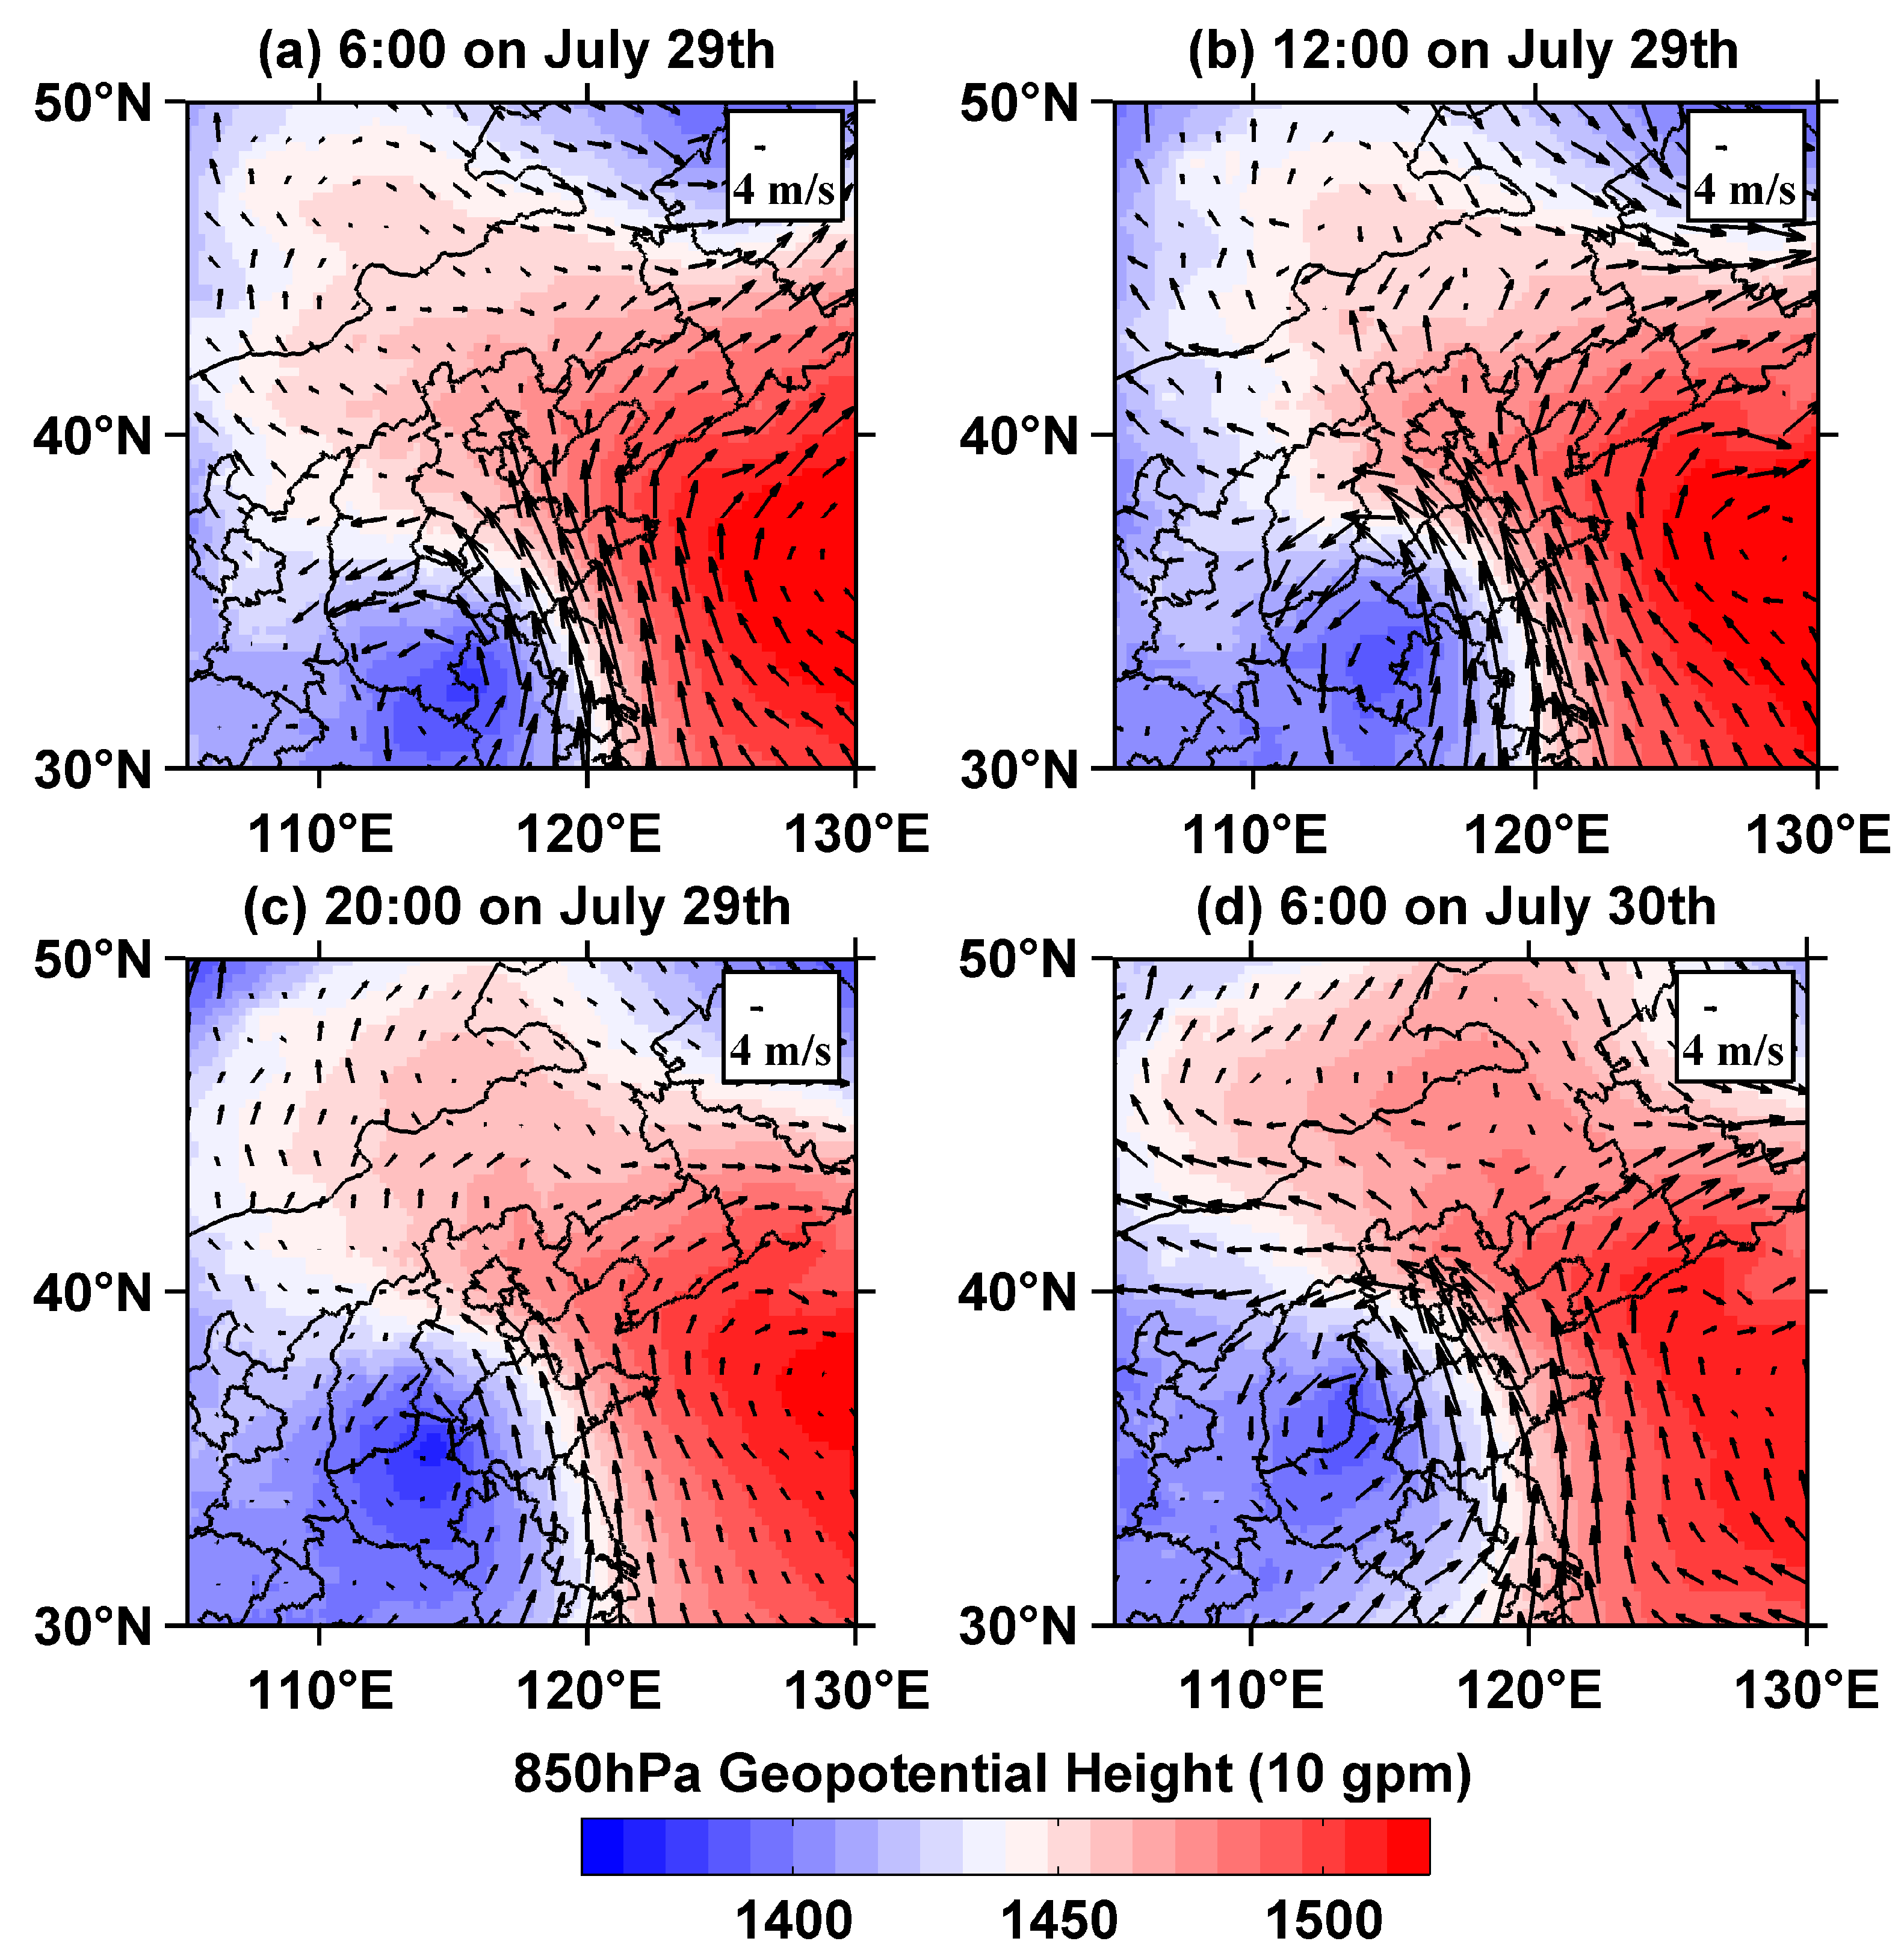
According to the analysis of 850 hPa geopotential height shown in Figure 4, the “7·31” extremely torrential rain event in 2023 formed against the background that the residual vortex of typhoon “Doksuri” was blocked by the subtropical high in the north. The strong pressure gradient between the two continuously strengthened the southeast wind in Beijing area so that the abundant water vapor near typhoon “Khanun” in the western Pacific Ocean was continuously transported to the Beijing area, which was conducive to the formation of this rainstorm event.
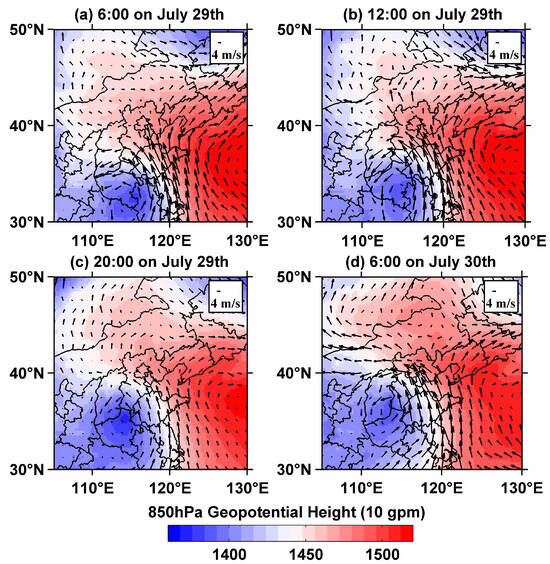
Figure 4.
The 850 hPa geopotential height field and wind field on (a) 29 July 6:00 UTC, (b) 29 July 12:00 UTC, (c) 29 July 20:00 UTC, and (d) 30 July 6:00 UTC.
In terms of the atmospheric thermal profiles shown in Figure 5, as the flow of warm and humid gases strengthened, the potential pseudo-equivalent temperature of the lower atmosphere (925 hPa) in the Beijing area gradually increased, and the instability of the atmosphere increased, transitioning from a neutral layer to an unstable layer, thereby promoting the formation of convection.
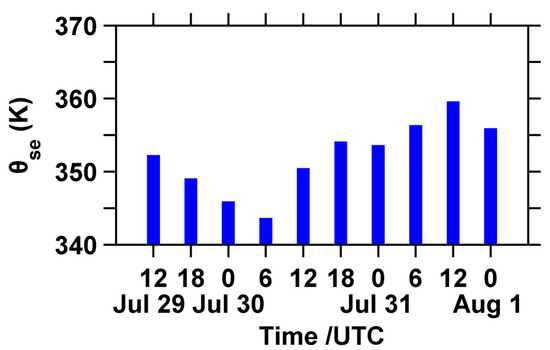
Figure 5.
The 925 hPa potential pseudo-equivalent temperature from 29 July 12:00 UTC to 1 August 0:00 UTC at the Beijing station.
In addition, it can be observed from Figure 3 that the accumulated precipitation during this rainfall process is distributed in the western mountainous areas and along the mountains of Beijing, indicating that terrain also plays a significant role. Beijing is located southeast of the Yanshan mountain range. Therefore, when the airflow is transported to Beijing, it is lifted by the terrain, resulting in strong convergence. With the strengthening of the southeast warm and humid airflow, water vapor accumulates more clearly in front of the mountains. At the same time, under the influence of heat, favorable conditions are created for increased rainfall in mountainous areas. Overall, the interaction between atmospheric dynamics, thermodynamics, and terrain forcing resulted in this extreme precipitation.
3.2. GNSS PWV Feature Analysis
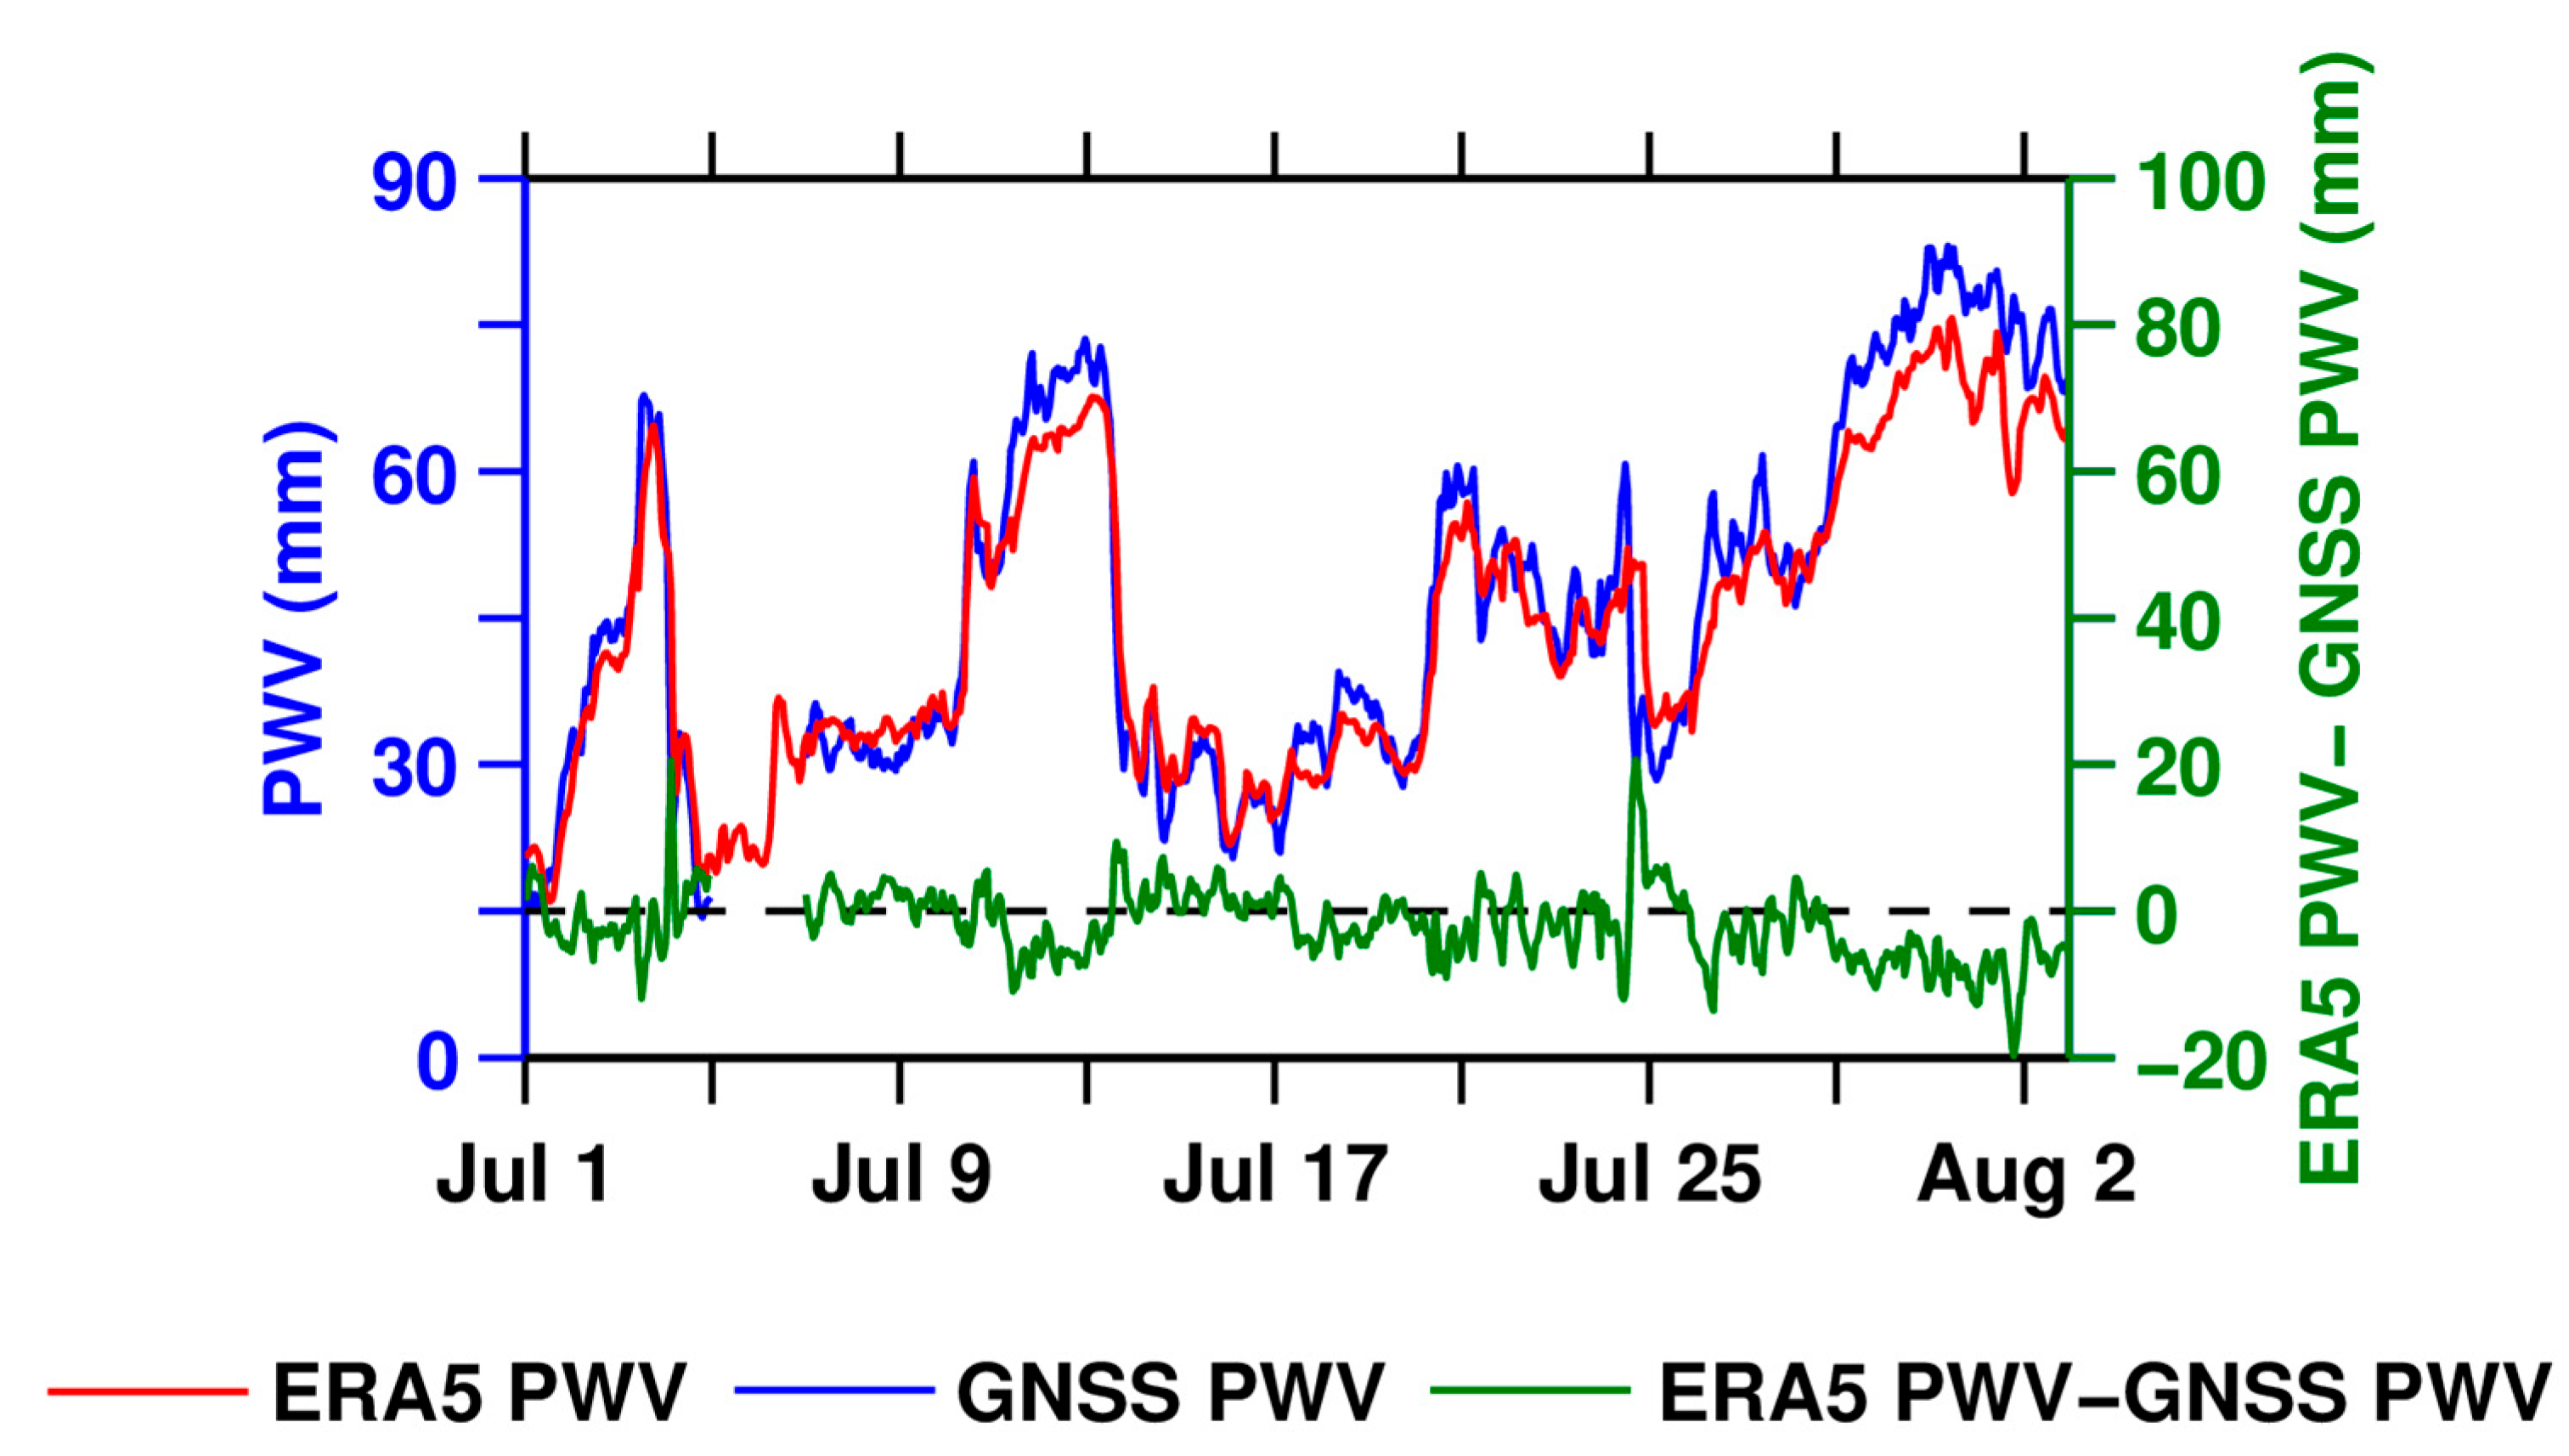
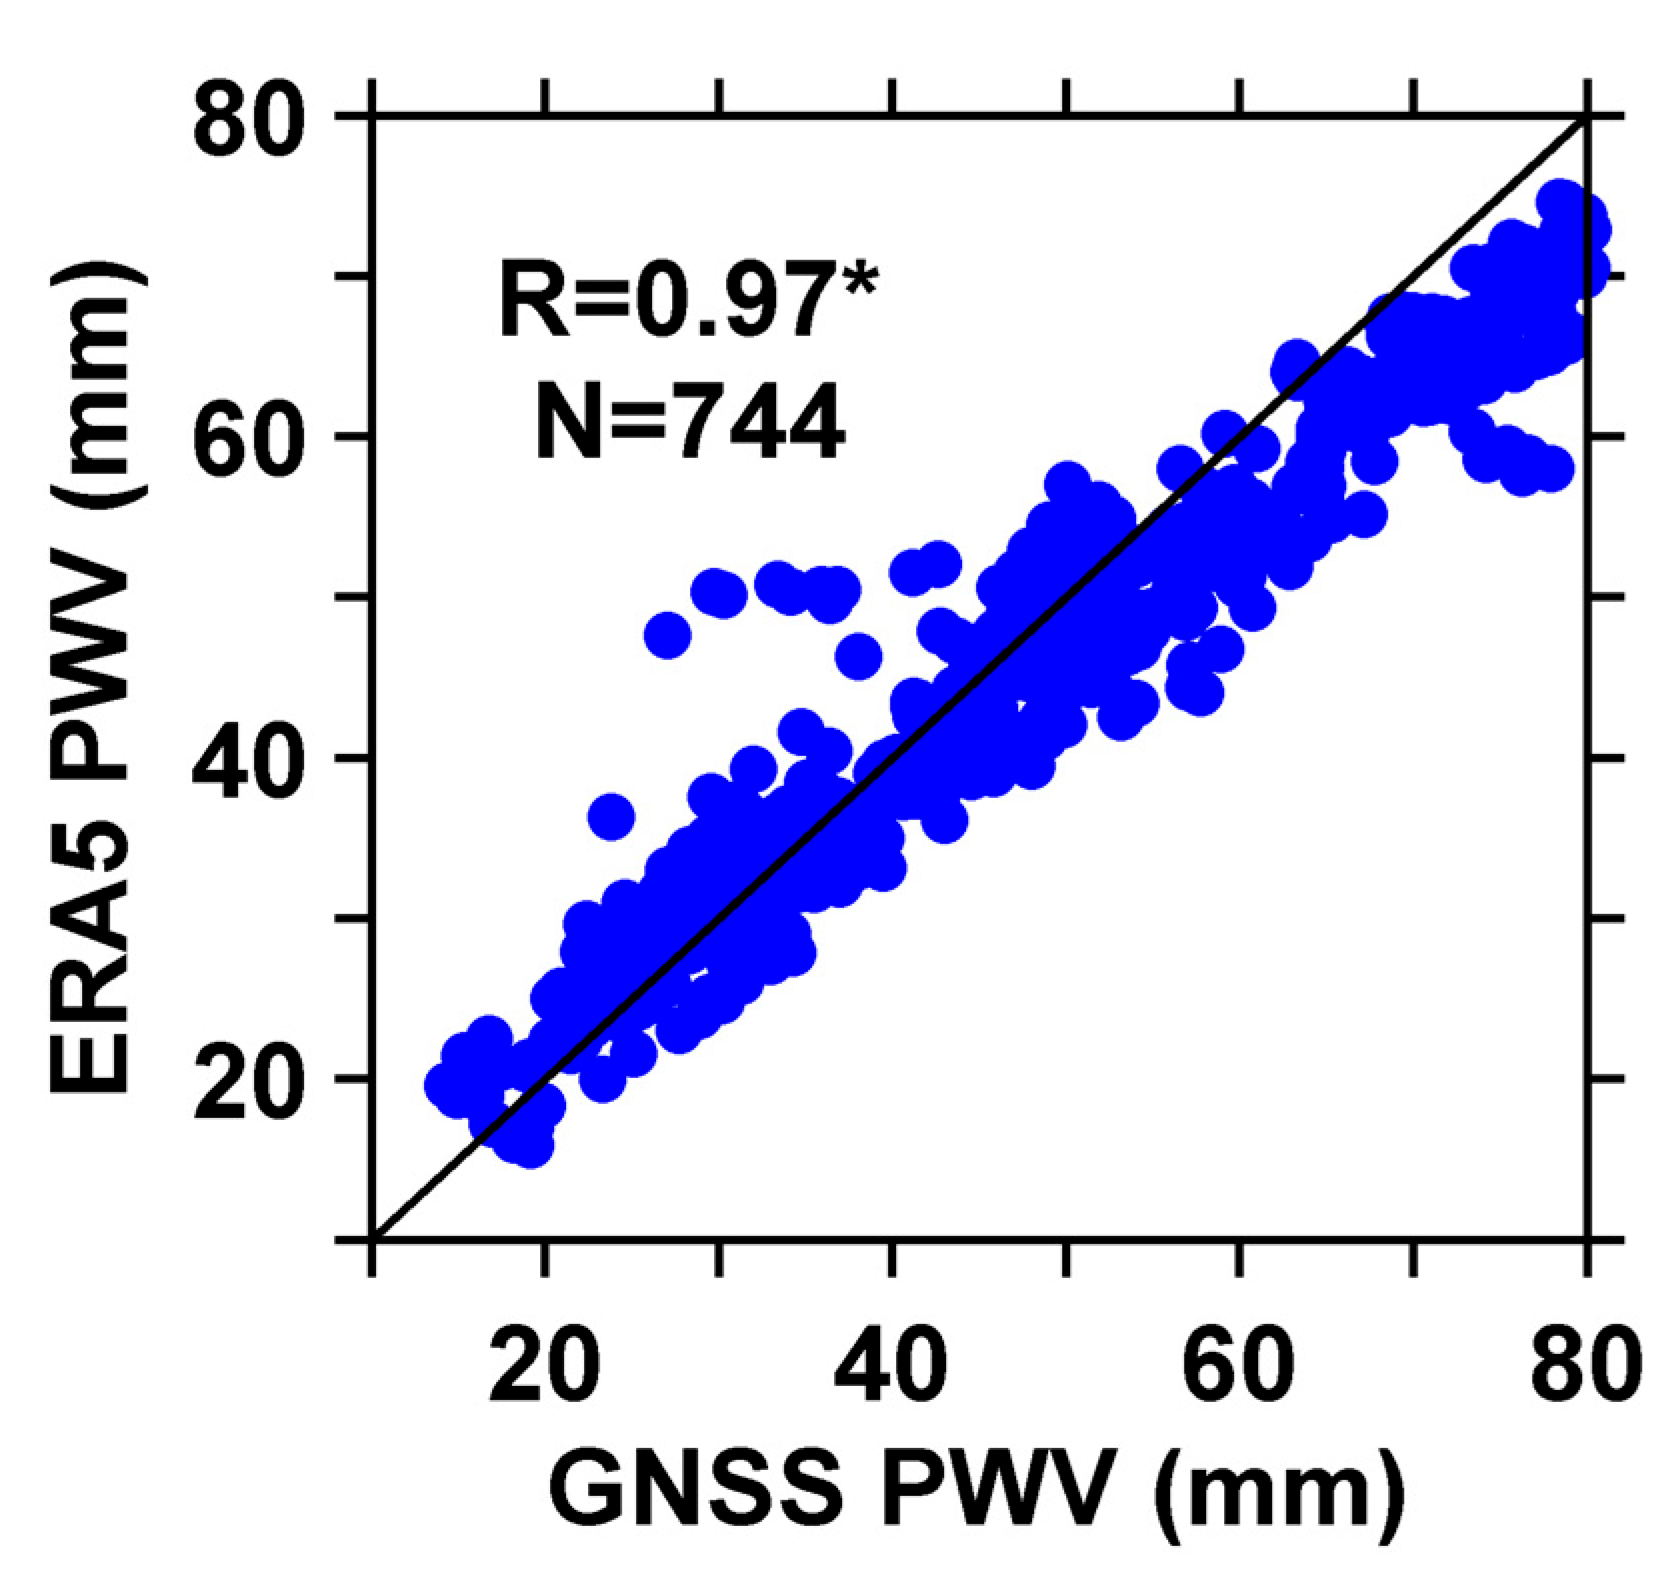
Due to the high accuracy of PWV obtained by ERA5 retrieval, it can usually be used as a true value to evaluate the accuracy of GNSS PWV [20]. When ERA5 PWV is used as the reference value, the average error bias, RMS, and Pearson correlation coefficient R of obtaining GNSS PWV by combining GNSS data with GPT3 model retrieval are 0.795 mm, 3.886 mm, and 0.972, respectively.
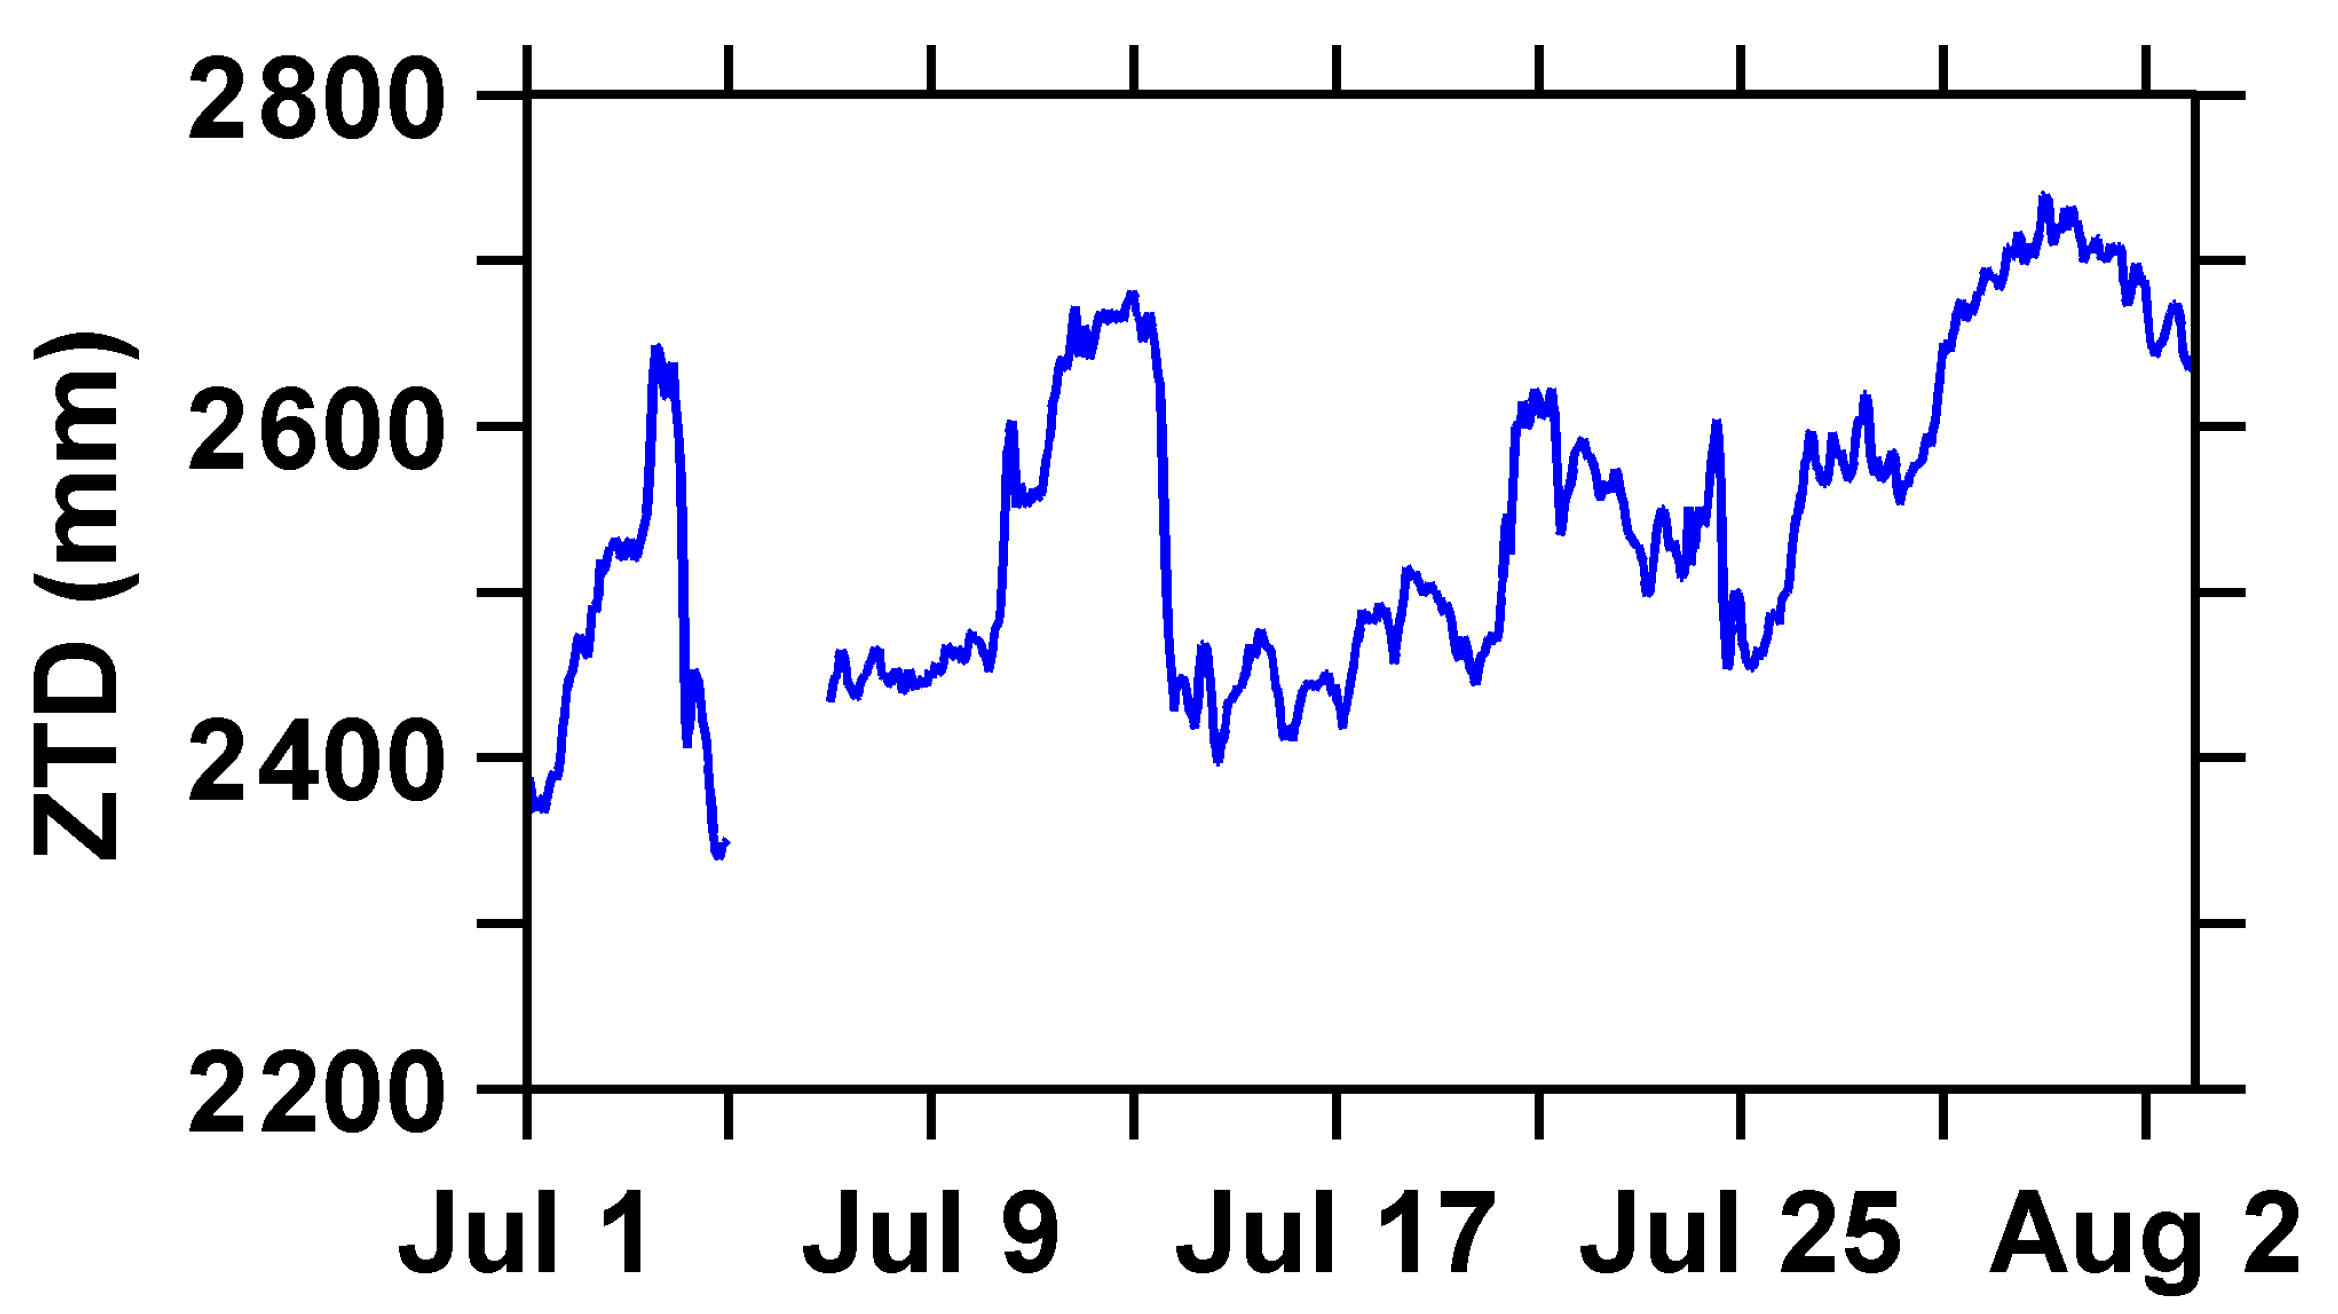
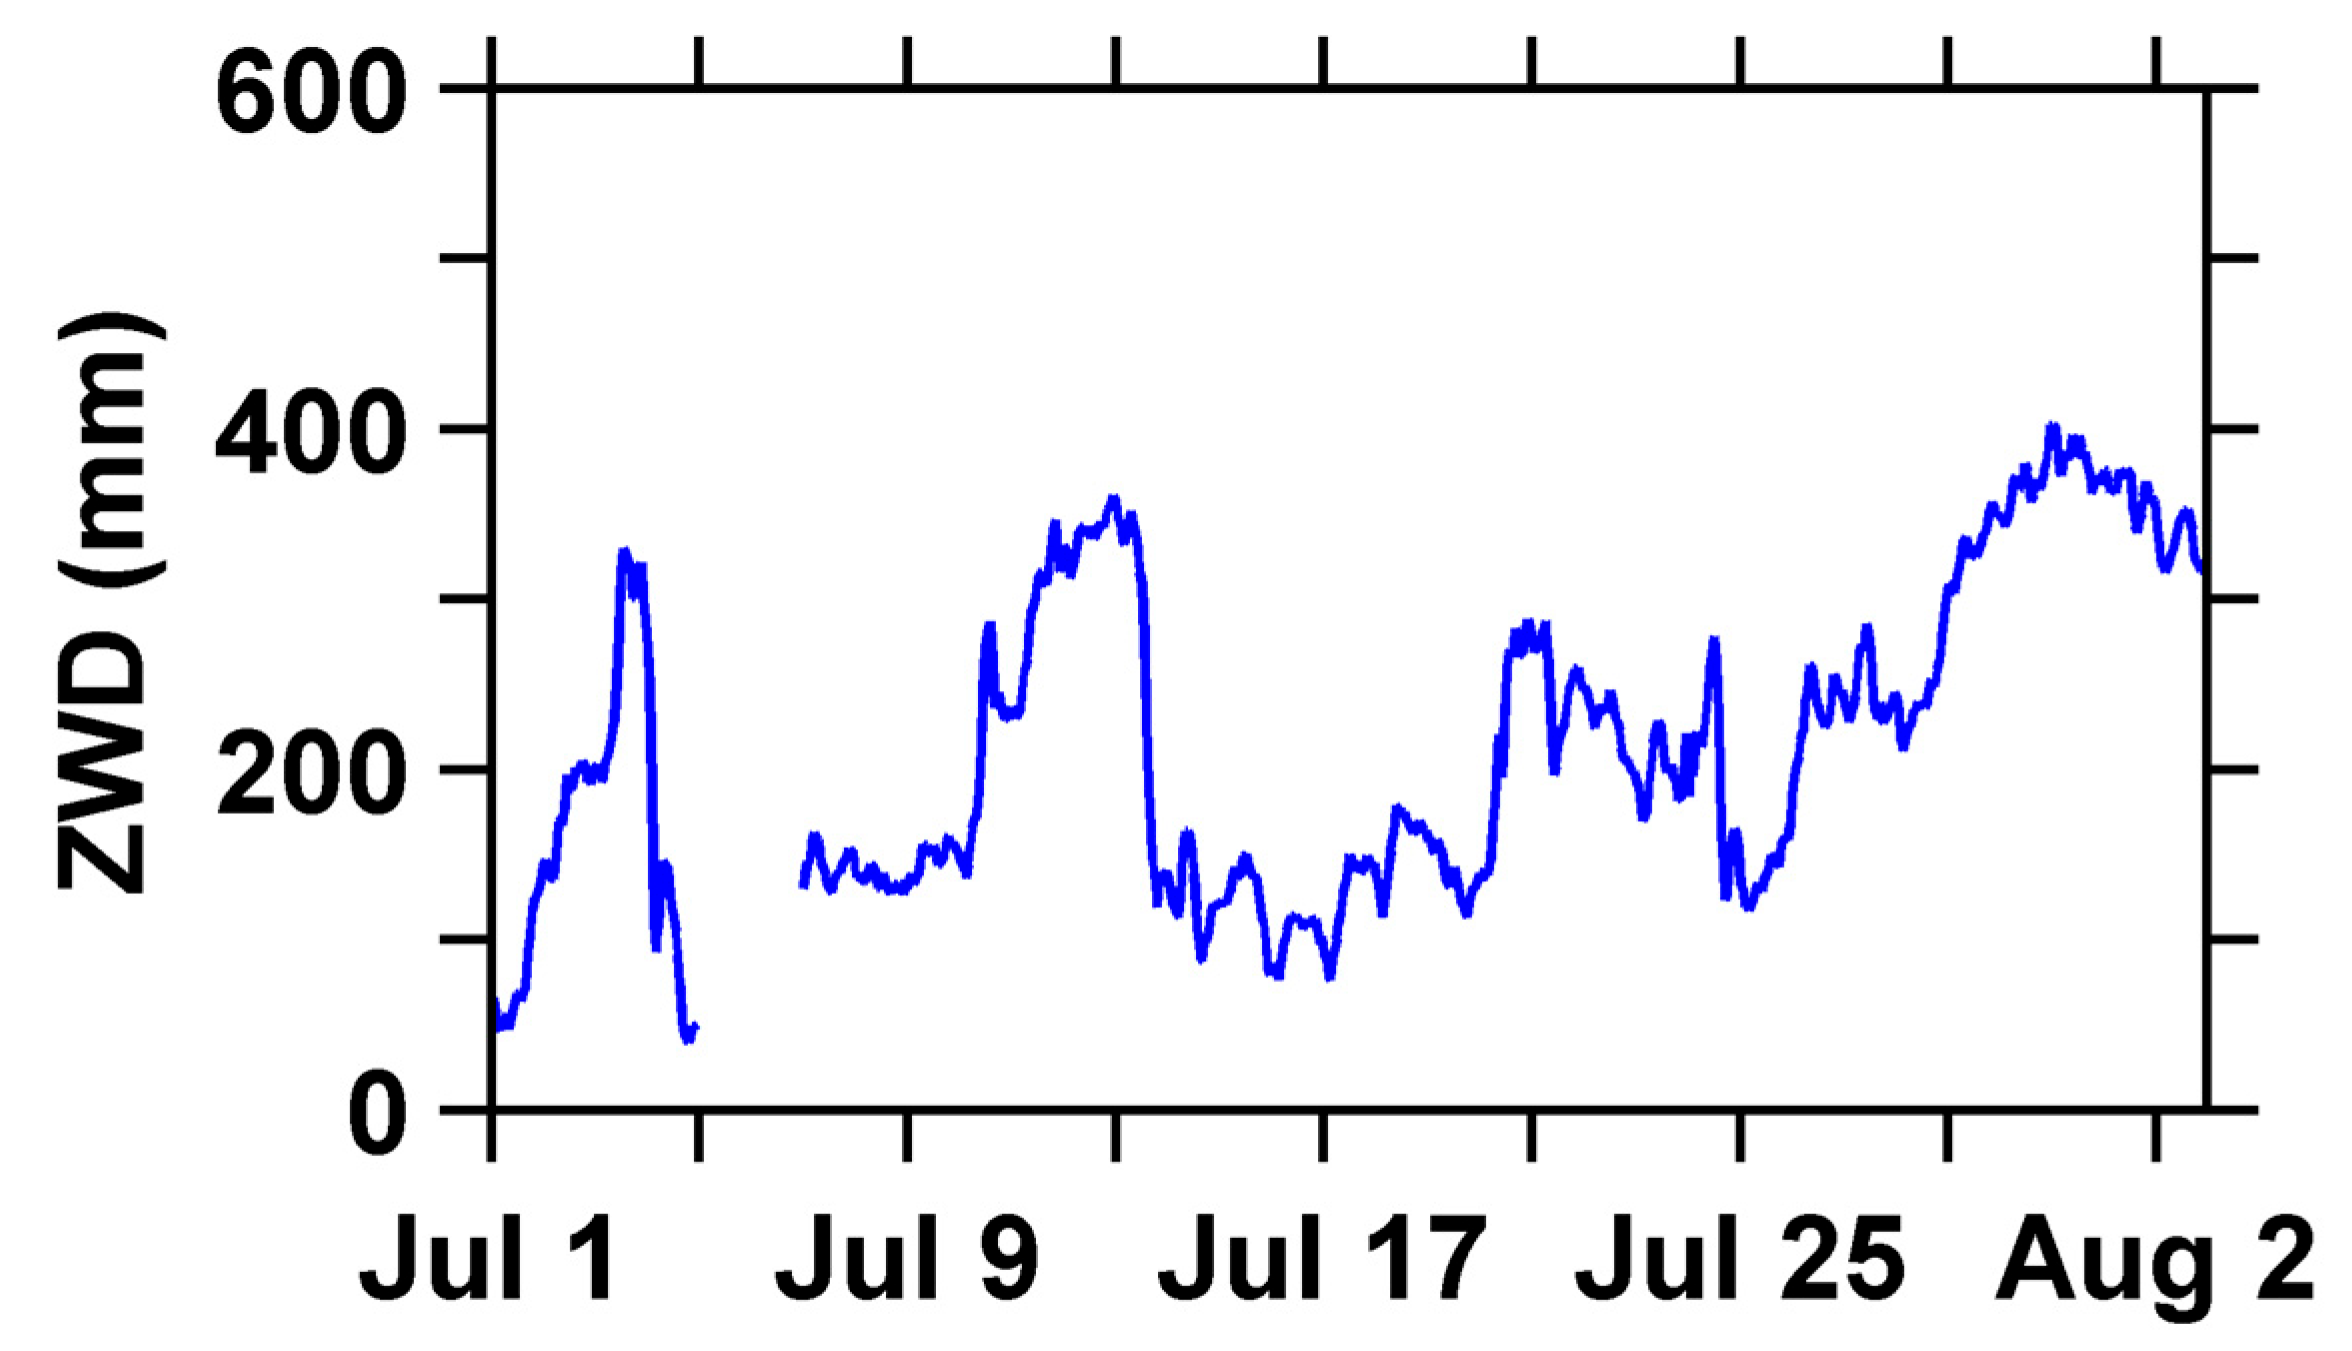
Figure 6 shows the PWV time series obtained by retrieving GNSS data using either the GPT3 model or ERA5 data. Considering the different spatial resolutions of the two datasets, this study selected the dataset with lower resolution as the reference for comparison. Figure 7 depicts the ZTD time series of the BJFS station from 1 July to 1 August 2023. Figure 8 depicts the time series of GPT3 ZWD at the BJFS station from 1 July to 1 August 2023. As shown in the figures, from 1 July to 1 August 2023, the PWV values at the BJFS station ranged from 10 mm to 80 mm. Among them, during the six time periods with annual product days of 1 July to 4 July, 10 July to 13 July, 19 July to 22 July, 24 July, 25 July to 27 July, and 28 July to 31 July, the PWV values showed drastic fluctuations. Except for the period from 28 July to 31 July, PWV showed a sharp increase followed by a sharp decrease in the other five time periods. During the six time periods, the change in PWV exceeded 23 mm. During other time periods, the amplitude of PWV changes was relatively small. The water vapor GNSS PWV obtained using GNSS data combined with the GPT3 model or ERA5 data retrieval has good consistency with ERA5 PWV, and the overall temporal trend of the two is consistent. The difference between ERA5 PWV and GNSS PWV is evenly distributed around 0, and the difference variation in PWV is mainly concentrated in the range of −5 mm to 5 mm. In addition, the trend of PWV over the BJFS station was almost the same as ZTD in Figure 7 and ZWD in Figure 8, indicating a strong correlation between ZTD, ZWD, and PWV values.
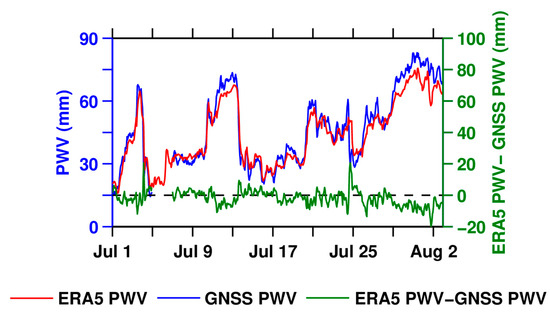
Figure 6.
Time series of GNSS PWV (blue line), ERA5 PWV (red line), and their difference (green line) at BJFS station from 1 July to 1 August 2023.

Figure 7.
ZTD time series of BJFS station from 1 July to 1 August 2023.

Figure 8.
Time series of GPT3 ZWD at BJFS station from 1 July to 1 August 2023.
In order to provide a more intuitive analysis of the correlation between GNSS PWV and ERA5 PWV obtained using GNSS data combined with GPT3 model retrieval, scatter plots of GNSS PWV and ERA5 PWV were plotted, as shown in Figure 9. The results indicate good correlation between GNSS PWV and ERA5 PWV. Due to the delay of ERA5 data, results are difficult to obtain in real time. Hence, in the scenario of real-time water vapor retrieval, combining GNSS data with the GPT3 model has significant advantages for real-time water vapor retrieval.

Figure 9.
Correlation between GNSS PWV and ERA5 PWV retrieval using GNSS data combined with the GPT3 model, and the superscript * for R indicates that the regression slope is statistically significant at p < 0.01.
3.3. GNSS PWV and Rainfall Correlation Analysis
To analyze the correlation between GNSS PWV and rainfall in detail, Figure 10 depicts the time series of GNSS PWV and precipitation obtained from GNSS retrieval, both with a time resolution of 1 h. As shown in the figure, GNSS PWV exhibits a rapid and steep increase before rainfall events of different intensities occur, and during the rainfall process, especially after the rainfall ends, GNSS PWV rapidly decreases. Abundant water vapor over the station area is a necessary condition for generating rainfall. As rainfall occurs and ends, the water vapor over it continuously decreases. Therefore, GNSS PWV shows a trend of initially increasing and then decreasing throughout the entire precipitation process. During the rainfall event, the value of GNSS PWV remained above 50 mm, and there was a strong correlation between GNSS PWV and the peak hourly precipitation. In the seven concentrated rainfall events mentioned above, the peak of GNSS PWV appeared 7 h earlier, 26 h later, 20 h earlier, 3 h earlier, 2 h earlier, 2 h earlier, and 8 h later than the peak precipitation, respectively. Before the rainfall, GNSS PWV began to rapidly climb 14 h, 12 h, 6 h, 14 h, 15 h, 10 h, and 10 h in advance. The minimum value of GNSS PWV was before the rainfall reached its maximum peak, and the change in GNSS PWV value during this process was recorded as ΔPWV. The corresponding ΔPWVs for the seven rainfall events were +24.48 mm, +23.32 mm, +17.03 mm, +19.36 mm, +23.53 mm, +11.54 mm, and +30.12 mm, respectively. The above indicates that the greater the rainfall intensity, the greater the incremental ΔPWV value of GNSS PWV, and the magnitude of the ΔPWV value is positively correlated with cumulative precipitation during the same rainfall period.
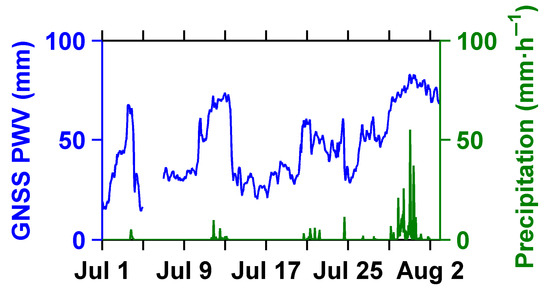
Figure 10.
Time series of hourly GNSS PWV and precipitation.
3.4. Relative Contribution of Multiple Meteorological Factors to Precipitation Events
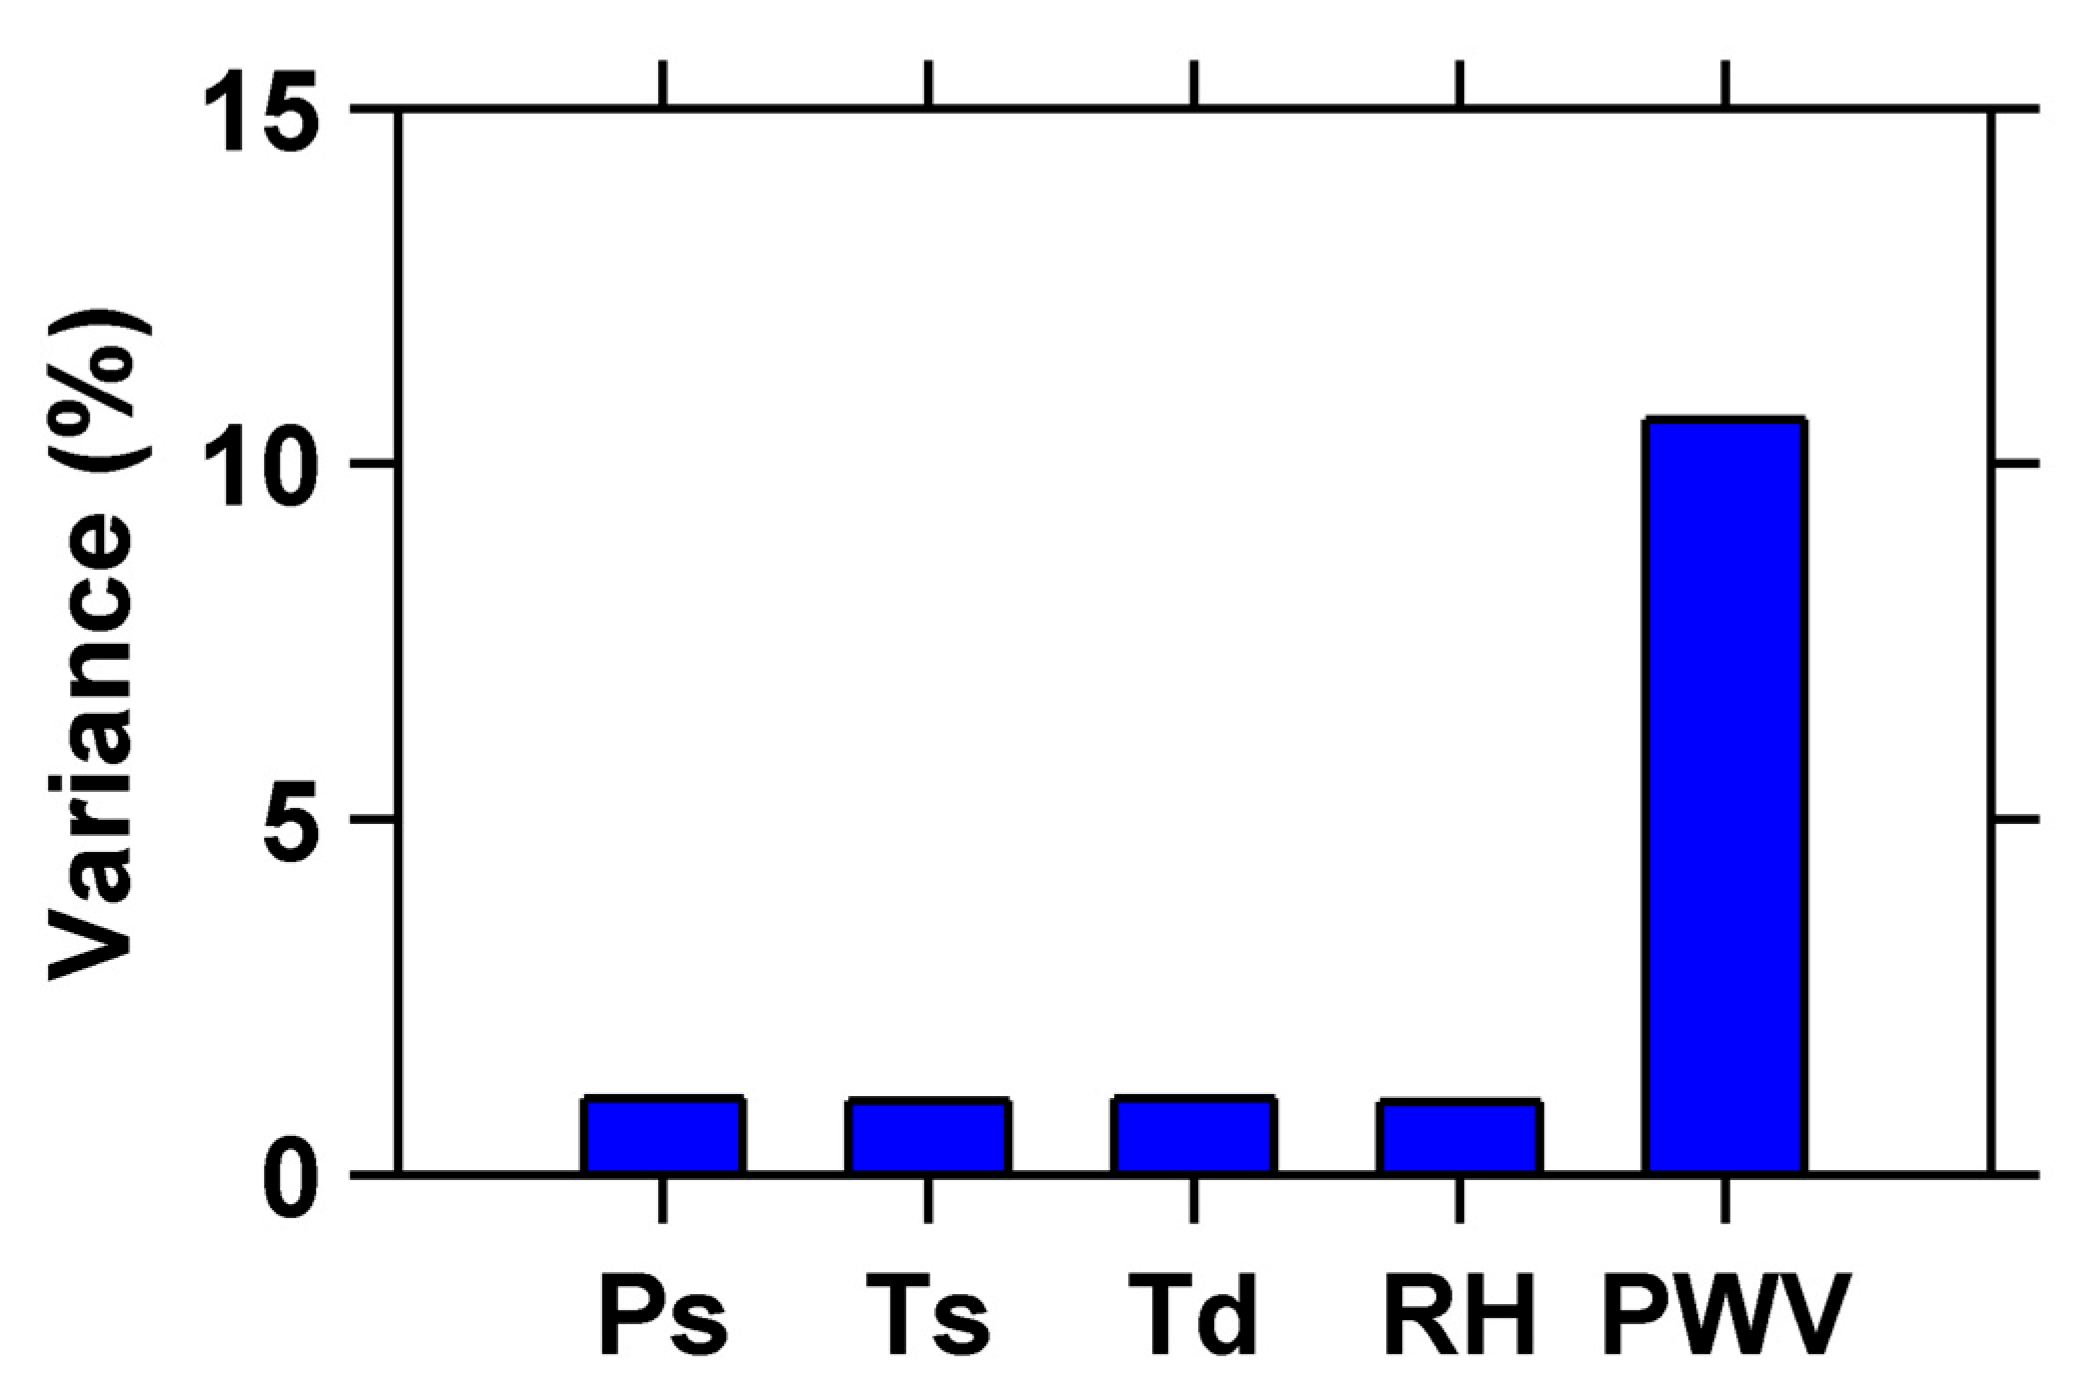
Figure 11 depicts the relative contributions of various meteorological factors to extreme precipitation events. Research has shown that the formation of extreme precipitation events is the result of the combined action of multiple meteorological factors [39,40]. Among them, factors such as , , , RH, and PWV have varying degrees of impact on rainfall. The maximum contribution of PWV to extreme precipitation is 10.6%, while other factors such as (1.07%), (1.03%), (1.08%), and RH (1.02%) contribute relatively little (Figure 11), but they work together to form a complex system that affects the occurrence and intensity of rainfall.

Figure 11.
Relative contributions of various meteorological factors to extreme precipitation events.
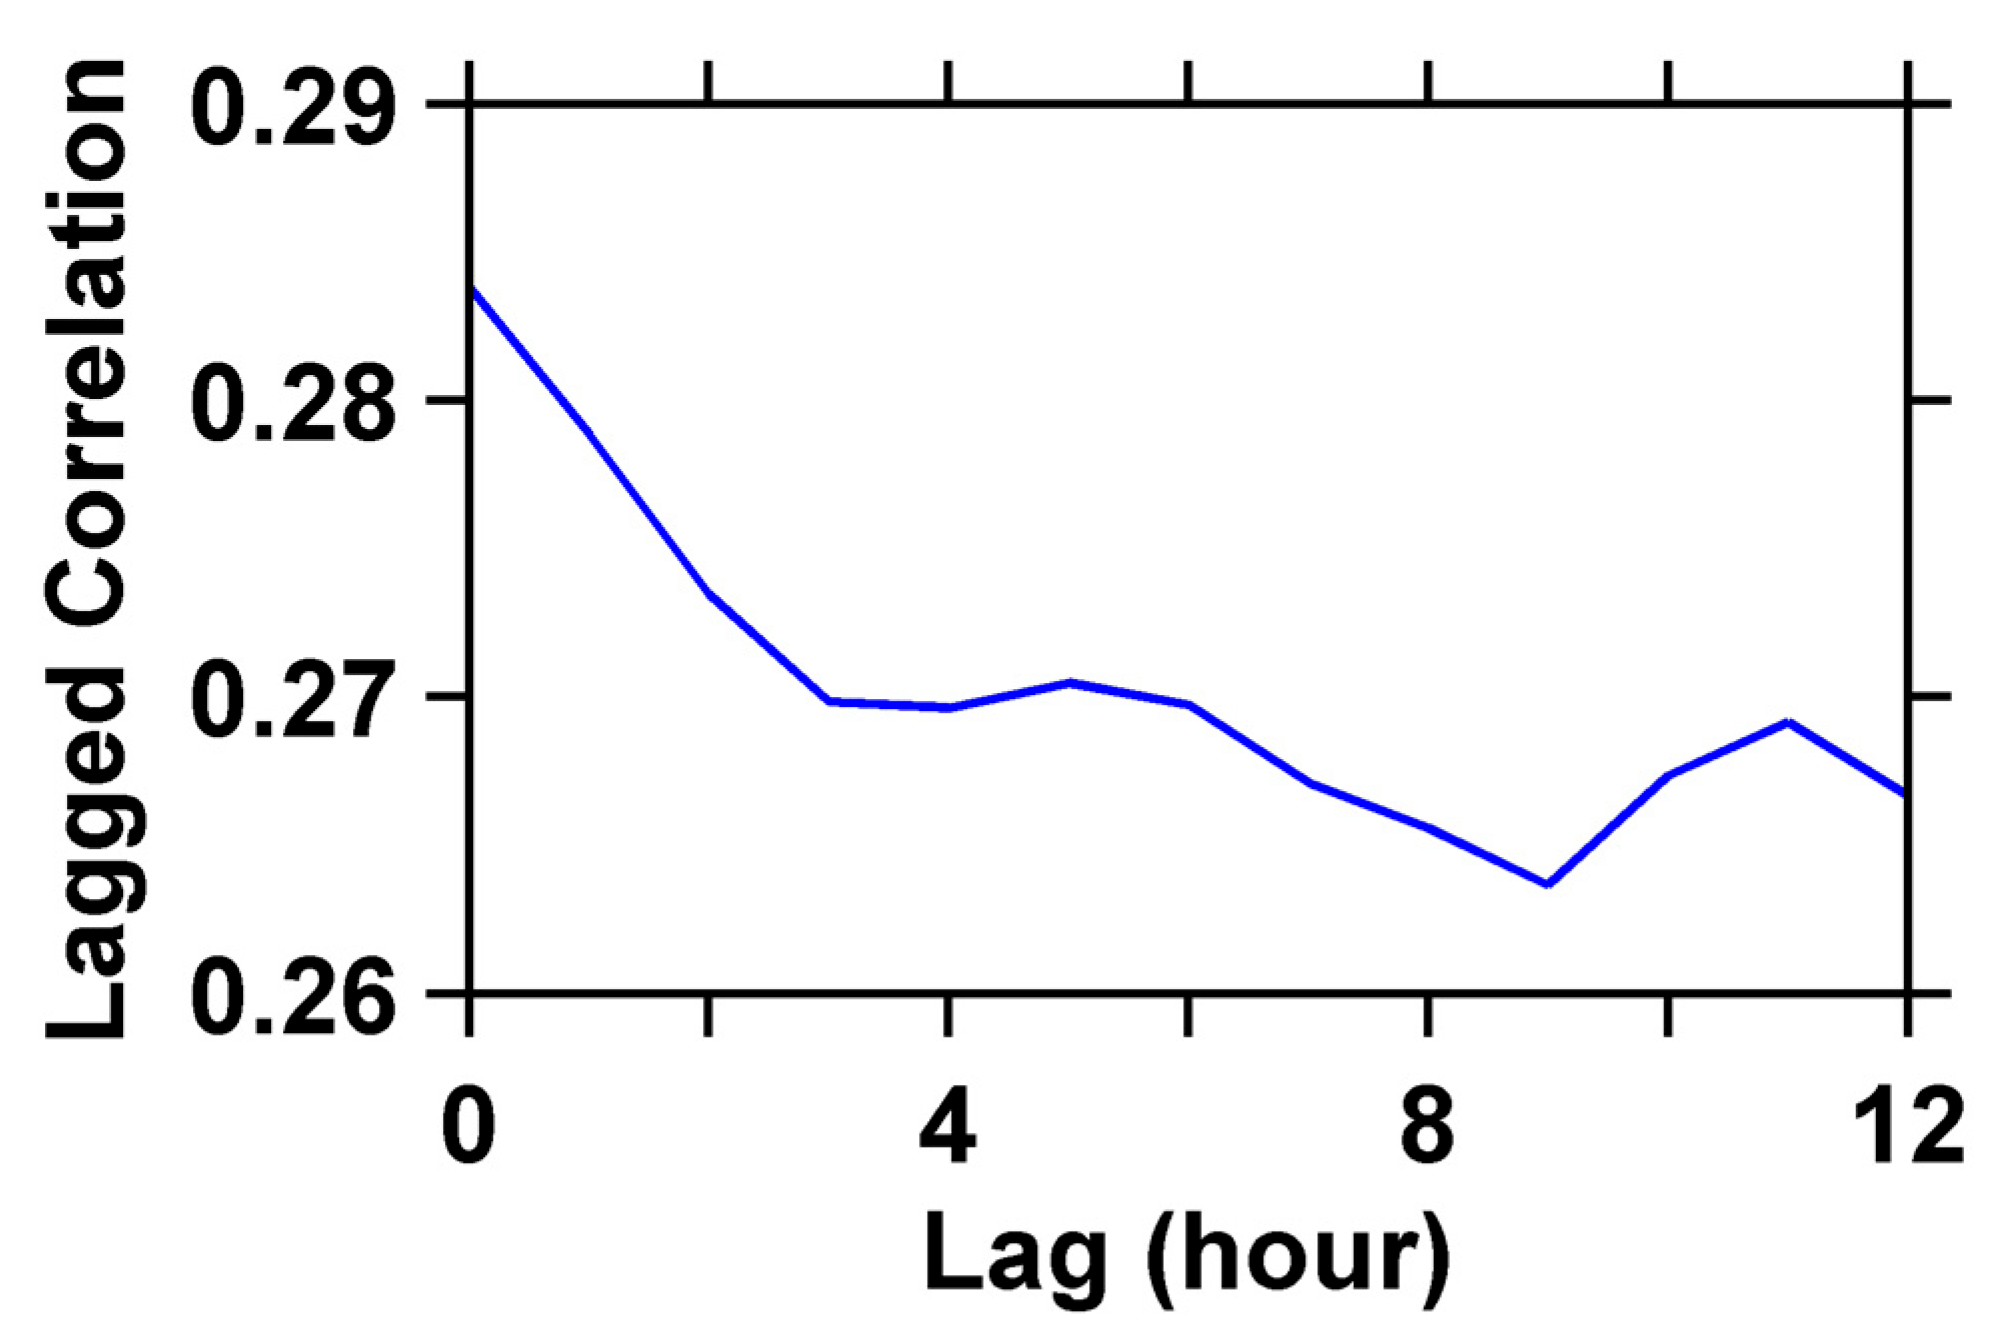
Figure 11 provides lagged correlation between PWV and precipitation. The results show that PWV can serve as an early signal factor for precipitation events. To further explore the role of PWV, we calculated the lagged correlation between PWV and precipitation, revealing that the strongest correlation occurs at a lag time of 0 (Figure 12). This finding suggests that PWV has a significant predictive capability for precipitation events.
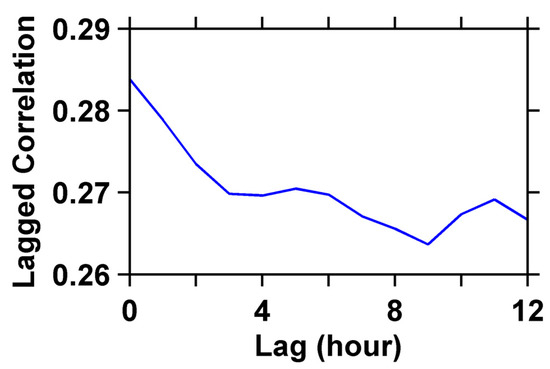
Figure 12.
Lagged correlation between PWV and precipitation.
This result emphasizes the need to comprehensively consider multiple meteorological parameters, especially changes in atmospheric water vapor, when predicting extreme weather events. The increase in water vapor content caused by climate change may exacerbate the frequency and intensity of future extreme precipitation events, which is of great significance for the development of disaster warning systems and mitigation strategies.
4. Discussion
This study reveals critical insights into the application of GNSS-derived PWV for extreme rainfall monitoring, with implications for both the GNSS’s theoretical understanding and operational meteorology.
The strong temporal correlation among PWV, ZTD, and ZWD underscores the integrated nature of tropospheric parameters in responding to weather systems. During non-rainfall periods, these parameters exhibit stable fluctuations, reflecting background meteorological variability. However, during extreme events like the “7·31” rainstorm, their rapid increase-then-decrease pattern aligns with atmospheric instability and moisture convergence mechanisms. This dynamic behavior is consistent with previous findings on tropospheric delay sensitivity to abrupt weather changes, but our analysis quantifies this relationship at sub-hourly scales for the first time in Beijing. The validation of GNSS PWV using ERA5 reanalysis data confirms the feasibility of real-time PWV retrieval using the GPT3 model. While ERA5 provides high-resolution atmospheric profiles, its inherent latency limits utility for nowcasting. In contrast, GNSS PWV offers near-instantaneous moisture estimates, which is critical for early warning systems.
The ΔPWV–rainfall intensity relationship reveals a dose–response gradient. The threshold behavior mirrors thermodynamic theories linking water vapor availability to precipitation efficiency. Notably, PWV’s dominance in predicting extreme precipitation exceeds traditional predictors like temperature and pressure, supporting its integration into statistical prediction models.
It should be noted that the precision of tropospheric parameters can be enhanced through modeling approaches, such as estimating tropospheric horizontal gradients and imposing external virtual parameter constraints. This study acknowledges several limitations that warrant further investigation. Limitations include reliance on single-station data, which may not capture Beijing’s spatial heterogeneity. Future work should incorporate the dense regional networks to resolve microscale gradients. In addition, while GPT3 improves temporal resolution, its empirical basis may underperform during abrupt synoptic transitions.
5. Conclusions
This study selected BJFS station observation data from 1 July to 1 August 2023, used GNSS data combined with the GPT3 model to retrieve GNSS PWV, and analyzed the correlation between GNSS PWV and rainfall events. The main conclusions are as follows:
- (1)
- During July 2023, the temporal trend of PWV over the BJFS station was almost identical to that of ZTD and ZWD, indicating a strong correlation among the values of ZTD, ZWD, and PWV. ZTD, ZWD, and PWV are greatly affected by weather. When extreme weather events such as rainfall occur, their values show a trend of rapid increase followed by rapid decrease. When there are no extreme weather events such as rainfall, their values change relatively steadily.
- (2)
- When using ERA5 PWV as a reference value, we found that the deviation in GNSS PWV was mainly distributed within 5 mm, with a root mean square error of 3.886 mm and a correlation coefficient of 0.972. This demonstrates the reliability and accuracy of using GNSS to retrieve PWV.
- (3)
- During the rainfall event, the value of GNSS PWV remained above 50 mm. The greater the rainfall intensity, the greater the increment ΔPWV value of GNSS PWV, and the magnitude of the ΔPWV value was positively correlated with the cumulative precipitation during the same rainfall period.
In addition, this study also conducted an in-depth analysis of the relative contributions of different meteorological factors to extreme precipitation events. It turns out that the contribution of PWV changes to predicting extreme precipitation is much higher than that of other factors (including temperature, humidity, sea level pressure, and dew point temperature), which further validates the effectiveness and uniqueness of GNSS technology as an extreme precipitation monitoring and warning tool.
These findings suggest that precipitation prediction models should prioritize the integration of GNSS-derived PWV data, potentially combining it with other data sources such as satellite remote sensing and ground observation stations to further improve forecasting accuracy. Further research should investigate optimal methods for integrating GNSS-PWV data into existing weather models and explore its applicability in diverse geographical regions and climate conditions.
Author Contributions
Conceptualization, T.X. and K.S.; methodology, T.X. and K.S.; software, T.X. and J.Z.; validation, K.S.; formal analysis, T.X. and J.Z.; investigation, K.S. and H.H.; resources, K.S. and H.H.; data curation, T.X.; writing—original draft preparation, J.Z. and T.X.; writing—review and editing, K.S.; visualization, H.W.; supervision, K.S.; project administration, K.S.; funding acquisition, H.H. All authors have read and agreed to the published version of the manuscript.
Funding
The research was funded by the Key Laboratory Fund (No. 614201004012209; SYS-ZX02-2024-01) and Education Innovation Project (145AXL250004000X).
Data Availability Statement
Meteorological data and reanalysis data [41] were used in the creation of this manuscript.
Conflicts of Interest
The authors declare no conflict of interest.
References
- Intergovernmental Panel on Climate Change; World Meteorological Organization: Geneva, Switzerland, 2007; Volume 52, p. 1.
- Zhu, H.; Chen, K.; Chai, H.; Ye, Y.; Liu, W. Characterizing extreme drought and wetness in Guangdong, China using global navigation satellite system and precipitation data. Satell. Navig. 2024, 5, 1. [Google Scholar] [CrossRef]
- Jin, S.; Camps, A.; Jia, Y.; Wang, F.; Martin-Neira, M.; Huang, F.; Yan, Q.; Zhang, S.; Li, Z.; Edokossi, K. Remote sensing and its applications using GNSS reflected signals: Advances and prospects. Satell. Navig. 2024, 5, 19. [Google Scholar] [CrossRef]
- Li, W.; Jiang, Y. Equatorial plasma bubble model and integrity risk evaluation for ground based augmentation system in Hong Kong. Satell. Navig. 2024, 5, 32. [Google Scholar] [CrossRef]
- Klein, C.; Belušić, D.; Taylor, C.M. Wavelet scale analysis of mesoscale convective systems for detecting deep convection from infrared imagery. J. Geophys. Res. Atmos. 2018, 123, 3035–3050. [Google Scholar] [CrossRef]
- Raymond, C.; Horton, R.M.; Zscheischler, J.; Martius, O.; AghaKouchak, A.; Balch, J.; Bowen, S.G.; Camargo, S.J.; Hess, J.; Kornhuber, K. Understanding and managing connected extreme events. Nat. Clim. Change 2020, 10, 611–621. [Google Scholar] [CrossRef]
- Ma, J.; Gao, H.; Xu, C.; Qi, S. Characterization and formation mechanism of the catastrophic flash flood-debris flow hazard triggered by the July 2023 extreme rainstorm in Hantai Gully of Beijing, China. Landslides 2025, 22, 877–893. [Google Scholar] [CrossRef]
- Held, I.M.; Soden, B.J. Water vapor feedback and global warming. Annu. Rev. Energy Environ. 2000, 25, 441–475. [Google Scholar] [CrossRef]
- Gao, W.; Zhou, W.; Tang, C.; Li, X.; Yuan, Y.; Hu, X. High-precision services of BeiDou navigation satellite system (BDS): Current state, achievements, and future directions. Satell. Navig. 2024, 5, 20. [Google Scholar] [CrossRef]
- Yuan, M.; Tang, X.; Ou, G. Authenticating GNSS civilian signals: A survey. Satell. Navig. 2023, 4, 6. [Google Scholar] [CrossRef]
- Zhang, W.; Zhang, S.; Chang, G.; Ding, N.; Wang, X. A new hybrid observation GNSS tomography method combining the real and virtual inverted signals. J. Geod. 2021, 95, 128. [Google Scholar] [CrossRef]
- Bevis, M.; Businger, S.; Herring, T.A.; Rocken, C.; Anthes, R.A.; Ware, R.H. GPS meteorology: Remote sensing of atmospheric water vapor using the global positioning system. J. Geophys. Res. Atmos. 1992, 97, 15787–15801. [Google Scholar] [CrossRef]
- Rocken, C.; Ware, R.; Van Hove, T.; Solheim, F.; Alber, C.; Johnson, J.; Bevis, M.; Businger, S. Sensing atmospheric water vapor with the Global Positioning System. Geophys. Res. Lett. 1993, 20, 2631–2634. [Google Scholar] [CrossRef]
- Jiang, N.; Gao, Z.; Wu, Y.; Xu, Y.; Xu, T.; Li, S.; Guo, A. PWV Retrieval Performance Evaluation for the Fresh BDS-3 With Multisource Data. Earth Space Sci. 2023, 10, e2023EA002923. [Google Scholar] [CrossRef]
- Yao, Y.; Shan, L.; Zhao, Q. Establishing a method of short-term rainfall forecasting based on GNSS-derived PWV and its application. Sci. Rep. 2017, 7, 12465. [Google Scholar] [CrossRef]
- Zhang, W.; Zhang, H.; Liang, H.; Lou, Y.; Cai, Y.; Cao, Y.; Zhou, Y.; Liu, W. On the suitability of ERA5 in hourly GPS precipitable water vapor retrieval over China. J. Geod. 2019, 93, 1897–1909. [Google Scholar] [CrossRef]
- Kim, Y.-J.; Jee, J.-B.; Lim, B. Investigating the influence of water vapor on heavy rainfall events in the southern Korean peninsula. Remote Sens. 2023, 15, 340. [Google Scholar] [CrossRef]
- Wang, M.; Lv, Z.; Wu, W.; Li, D.; Zhang, R.; Sun, C. Multiscale spatiotemporal variations of GNSS-derived precipitable water vapor over Yunnan. Remote Sens. 2024, 16, 412. [Google Scholar] [CrossRef]
- Cao, Y.; Cheng, Z.; Liang, J.; Zhao, P.; Cao, Y.; Wang, Y. Performance of Ground-Based Global Navigation Satellite System Precipitable Water Vapor Retrieval in Beijing with the BeiDou B2b Service. Remote Sens. 2024, 16, 2902. [Google Scholar] [CrossRef]
- Simmons, A.; Uppala, S.; Fuentes, M. European Centre for Medium-Range Weather Forecasts. 2010. Available online: http://ams.confex.com (accessed on 1 May 2025).
- Khodarahmi, M.; Maihami, V. A review on Kalman filter models. Arch. Comput. Methods Eng. 2023, 30, 727–747. [Google Scholar] [CrossRef]
- Zhang, W.; Wang, J. Integrity monitoring scheme for single-epoch GNSS PPP-RTK positioning. Satell. Navig. 2023, 4, 10. [Google Scholar] [CrossRef]
- Su, K.; Jiao, G. Estimation of BDS pseudorange biases with high temporal resolution: Feasibility, affecting factors, and necessity. Satell. Navig. 2023, 4, 17. [Google Scholar] [CrossRef]
- Steigenberger, P.; Boehm, J.; Tesmer, V. Comparison of GMF/GPT with VMF1/ECMWF and implications for atmospheric loading. J. Geod. 2009, 83, 943–951. [Google Scholar] [CrossRef]
- Gu, S.; Fang, L.; Jiang, W. Multiple integer candidates ambiguity resolution: A unification ambiguity resolution algorithm. Satell. Navig. 2024, 5, 21. [Google Scholar] [CrossRef]
- Wu, J.; Li, X.; Yuan, Y.; Zhang, K.; Li, X.; Lou, J.; Xiong, Y. Orbit and clock products for quad-system satellites with undifferenced ambiguity fixing approach. Satell. Navig. 2024, 5, 8. [Google Scholar] [CrossRef]
- Nzelibe, I.U.; Tata, H.; Idowu, T.O. Assessment of GNSS zenith tropospheric delay responses to atmospheric variables derived from ERA5 data over Nigeria. Satell. Navig. 2023, 4, 15. [Google Scholar] [CrossRef]
- Yang, F.; Sun, Y.; Meng, X.; Guo, J.; Gong, X. Assessment of tomographic window and sampling rate effects on GNSS water vapor tomography. Satell. Navig. 2023, 4, 7. [Google Scholar] [CrossRef]
- Saastamoinen, J. Contributions to the theory of atmospheric refraction. Bull. Géodésique (1946–1975) 1972, 105, 279–298. [Google Scholar] [CrossRef]
- Davis, J.L.; Herring, T.; Shapiro, I.; Rogers, A.; Elgered, G. Geodesy by radio interferometry: Effects of atmospheric modeling errors on estimates of baseline length. Radio Sci. 1985, 20, 1593–1607. [Google Scholar] [CrossRef]
- Li, Z.; Guo, F.; Chen, F.; Zhang, Z.; Zhang, X. Wind speed retrieval using GNSS-R technique with geographic partitioning. Satell. Navig. 2023, 4, 4. [Google Scholar] [CrossRef]
- Xu, Y.; Yang, Z.; Zhou, H.; Zhang, F. An initial investigation of the non-isotropic feature of GNSS tropospheric delay. Satell. Navig. 2024, 5, 2. [Google Scholar] [CrossRef]
- Landskron, D.; Böhm, J. VMF3/GPT3: Refined discrete and empirical troposphere mapping functions. J. Geod. 2018, 92, 349–360. [Google Scholar] [CrossRef] [PubMed]
- Lagler, K.; Schindelegger, M.; Böhm, J.; Krásná, H.; Nilsson, T. GPT2: Empirical slant delay model for radio space geodetic techniques. Geophys. Res. Lett. 2013, 40, 1069–1073. [Google Scholar] [CrossRef]
- Böhm, J.; Möller, G.; Schindelegger, M.; Pain, G.; Weber, R. Development of an improved empirical model for slant delays in the troposphere (GPT2w). GPS Solut. 2015, 19, 433–441. [Google Scholar] [CrossRef]
- Xu, H.; Chen, X.; Ou, J.; Yuan, Y. Crowdsourcing RTK: A new GNSS positioning framework for building spatial high-resolution atmospheric maps based on massive vehicle GNSS data. Satell. Navig. 2024, 5, 13. [Google Scholar] [CrossRef]
- Huang, L.; Pan, A.; Chen, F.; Guo, F.; Li, H.; Liu, L. A novel global grid model for soil moisture retrieval considering geographical disparity in spaceborne GNSS-R. Satell. Navig. 2024, 5, 29. [Google Scholar] [CrossRef]
- Roy, I.; Haigh, J. The influence of solar variability and the quasi-biennial oscillation on lower atmospheric temperatures and sea level pressure. Atmos. Chem. Phys. 2011, 11, 11679–11687. [Google Scholar] [CrossRef]
- Utsumi, N.; Seto, S.; Kanae, S.; Maeda, E.E.; Oki, T. Does higher surface temperature intensify extreme precipitation? Geophys. Res. Lett. 2011, 38, 16. [Google Scholar] [CrossRef]
- Zhang, X.; Zwiers, F.W.; Li, G.; Wan, H.; Cannon, A.J. Complexity in estimating past and future extreme short-duration rainfall. Nat. Geosci. 2017, 10, 255–259. [Google Scholar] [CrossRef]
- European Centre for Medium-Range Weather Forecasts. European Centre for Medium-Range Weather Forecasts, ECMWF. 2020. Available online: https://www.ecmwf.int/ (accessed on 1 May 2025).


Disclaimer/Publisher’s Note: The statements, opinions and data contained in all publications are solely those of the individual author(s) and contributor(s) and not of MDPI and/or the editor(s). MDPI and/or the editor(s) disclaim responsibility for any injury to people or property resulting from any ideas, methods, instructions or products referred to in the content. |
© 2025 by the authors. Licensee MDPI, Basel, Switzerland. This article is an open access article distributed under the terms and conditions of the Creative Commons Attribution (CC BY) license (https://creativecommons.org/licenses/by/4.0/).