Article

Automated Detection of Center-Pivot Irrigation Systems from Remote Sensing Imagery Using Deep Learning

1
Department of Agricultural and Biosystems Engineering, North Dakota State University, Fargo, ND 58102, USA
2
Department of Plant, Soil and Microbial Sciences, Michigan State University, East Lansing, MI 48824, USA
3
USDA, Agricultural Research Service, Fargo, ND 58102, USA
*
Author to whom correspondence should be addressed.
Remote Sens. 2025, 17(13), 2276; https://doi.org/10.3390/rs17132276
Submission received: 8 May 2025 / Revised: 25 June 2025 / Accepted: 30 June 2025 / Published: 3 July 2025
(This article belongs to the Special Issue Remote Sensing of Agricultural Water Resources)

Abstract

Effective detection of center-pivot irrigation systems is crucial in understanding agricultural activity and managing groundwater resources for sustainable uses, especially in semi-arid regions such as North Dakota, where irrigation primarily depends on groundwater resources. In this study, we have adopted YOLOv11 to detect the center-pivot irrigation systems using multiple remote sensing datasets, including Landsat 8, Sentinel-2, and NAIP (National Agriculture Imagery Program). We developed an ArcGIS custom tool to facilitate data preparation and large-scale model execution for YOLOv11, which was not included in the ArcGIS Pro deep learning package. YOLOv11 was compared against other popular deep learning model architectures such as U-Net, Faster R-CNN, and Mask R-CNN. YOLOv11, using Landsat 8 panchromatic data, achieved the highest detection accuracy (precision: 0.98; recall: 0.91; and F1-score: 0.94) among all tested datasets and models. Spatial autocorrelation and hotspot analysis revealed systematic prediction errors, suggesting a need to adjust training data regionally. Our research demonstrates the potential of deep learning in combination with GIS-based workflows for large-scale irrigation system analysis, adopting precision agricultural technologies for sustainable water resource management.

1. Introduction

Groundwater is the primary source of drinking water for nearly half the world’s population and a critical component of food production through irrigation [1]. Groundwater also serves as a critical buffer against droughts and climate variability, particularly in arid and semi-arid regions where surface water is scarce [2]. In North Dakota, the shallow glaciofluvial aquifer systems meet much of the state’s irrigation and domestic water demand. They are also essential for municipal and industrial uses, including hydraulic fracturing in the western part of the state [3,4,5,6]. However, these aquifers are facing threats of over-extraction and pollution from agricultural and industrial activities [7]. Sustaining North Dakota’s groundwater supply is essential for long-term food and water security and requires regular monitoring and sustainable management of the state’s limited groundwater resources [8].
Modern center-pivot irrigation technology has been widely used to improve crop yields and reduce labor costs in worldwide farmlands [9]. But the rapid spread of center-pivot irrigation systems (CPISs) has caused over-extraction of groundwater and falling levels of aquifers, particularly in arid and semi-arid regions where irrigation relies heavily on groundwater sources [10]. Groundwater depletion threatens the long-term sustainability of agriculture in the regions where CPISs have been deployed on large scales [11]. Due to the environmental and economic effects of groundwater overuse, monitoring and managing CPIS installations have become increasingly important to encourage sustainable water use [12]. Therefore, accurate detection and mapping of CPISs are important for assessing irrigation impact on groundwater resources and planning agricultural water management strategies to ensure sustainability [13].
The integration of deep learning and remote sensing has revolutionized the detection of center-pivot irrigation systems. Traditional methods often rely on manual interpretation, which is labor-intensive, time-consuming, and prone to human error. However, deep learning techniques, particularly convolutional neural networks (CNNs), have demonstrated high accuracy and high efficiency in detecting CPISs from satellite images [14]. Deep learning object detection algorithms such as Progressive Visual Attention Network (PVANET) and Mask Region-based Convolutional Neural Networks (Mask R-CNNs) have also been used to process Sentinel-2 and Landsat 8 imagery to improve the precision and recall of CPIS identification [15]. These models are able to leverage spectral and spatial information to differentiate CPISs from surrounding agricultural features, reducing false positives and improving mapping efficiency [16]. Moreover, advancements in remote sensing techniques, such as multi-temporal synthetic aperture radar (SAR) imaging, have enhanced CPIS detection even in cloudy conditions [16].
Despite significant advancements in deep learning and remote sensing for irrigation system detection, several research gaps remain. First, while deep learning has shown potential in remote sensing applications, model performance often varies based on dataset characteristics and preprocessing techniques [17]. Prior studies have shown varying performances of Sentinel-2 and Landsat 8 imagery for different agricultural and environmental applications [18]. However, no research has systematically compared these datasets for CPIS detection using different deep learning models such as YOLOv11 (You Only Look Once version 11). Second, while semantic segmentation models (e.g., U-Net and Deep ResUnet) and instance segmentation approaches (e.g., Mask R-CNN) have been successfully applied to Landsat 8 and multi-temporal Sentinel-1 SAR data for CPIS detection [16,19], YOLO-based architectures remain underexplored for this specific task. This gap is particularly notable given the real-time detection capabilities and computational efficiency of YOLO models. Third, most existing studies rely on single-source satellite imagery, which constrains the ability to assess the generalizability and scalability of deep learning models across diverse spatial and spectral resolutions. For instance, the effectiveness of U-Net for CPIS detection from high-resolution PlanetScope imagery has been well-documented [19], but these results are not easily transferable to moderate-resolution sensors like Sentinel-2 or Landsat 8 without further evaluation. Similarly, although prior work has successfully mapped CPISs across extensive regions such as the Ogallala Aquifer using modified U-Net architectures with Landsat data [20], a direct comparison across multiple sensor types within a unified framework remains absent.
The primary goal of this research is to develop and evaluate an advanced deep learning-based framework for detecting center-pivot irrigation systems from remote sensing imagery, with a particular focus on North Dakota. This study is the first to implement YOLOv11 for detecting center-pivot irrigation systems and systematically compare its performance with other deep learning models, including convolutional neural networks and transformer-based approaches. Additionally, this study evaluates multiple remote sensing datasets—Landsat 8, Sentinel-2, and National Agriculture Imagery Program (NAIP) imagery—to determine the optimal dataset for CPIS detection.
Furthermore, while many previous studies rely on programming-based implementations, this research uniquely integrates deep learning models into ArcGIS Pro (ERSI, Redlands, CA), a widely used GIS platform, enabling non-programmers to leverage deep learning models for CPIS detection. To the best of the authors’ knowledge, this is the first study that has examined the operational integration of new versions of the YOLO model within ArcGIS Pro, which could support scalable, non-coding-based workflows for practitioners. The results of this study contribute to the growing body of knowledge on AI-driven remote sensing applications and provide insights into the effectiveness of using different satellite datasets for irrigation system detection and monitoring.

2. Materials and Methods
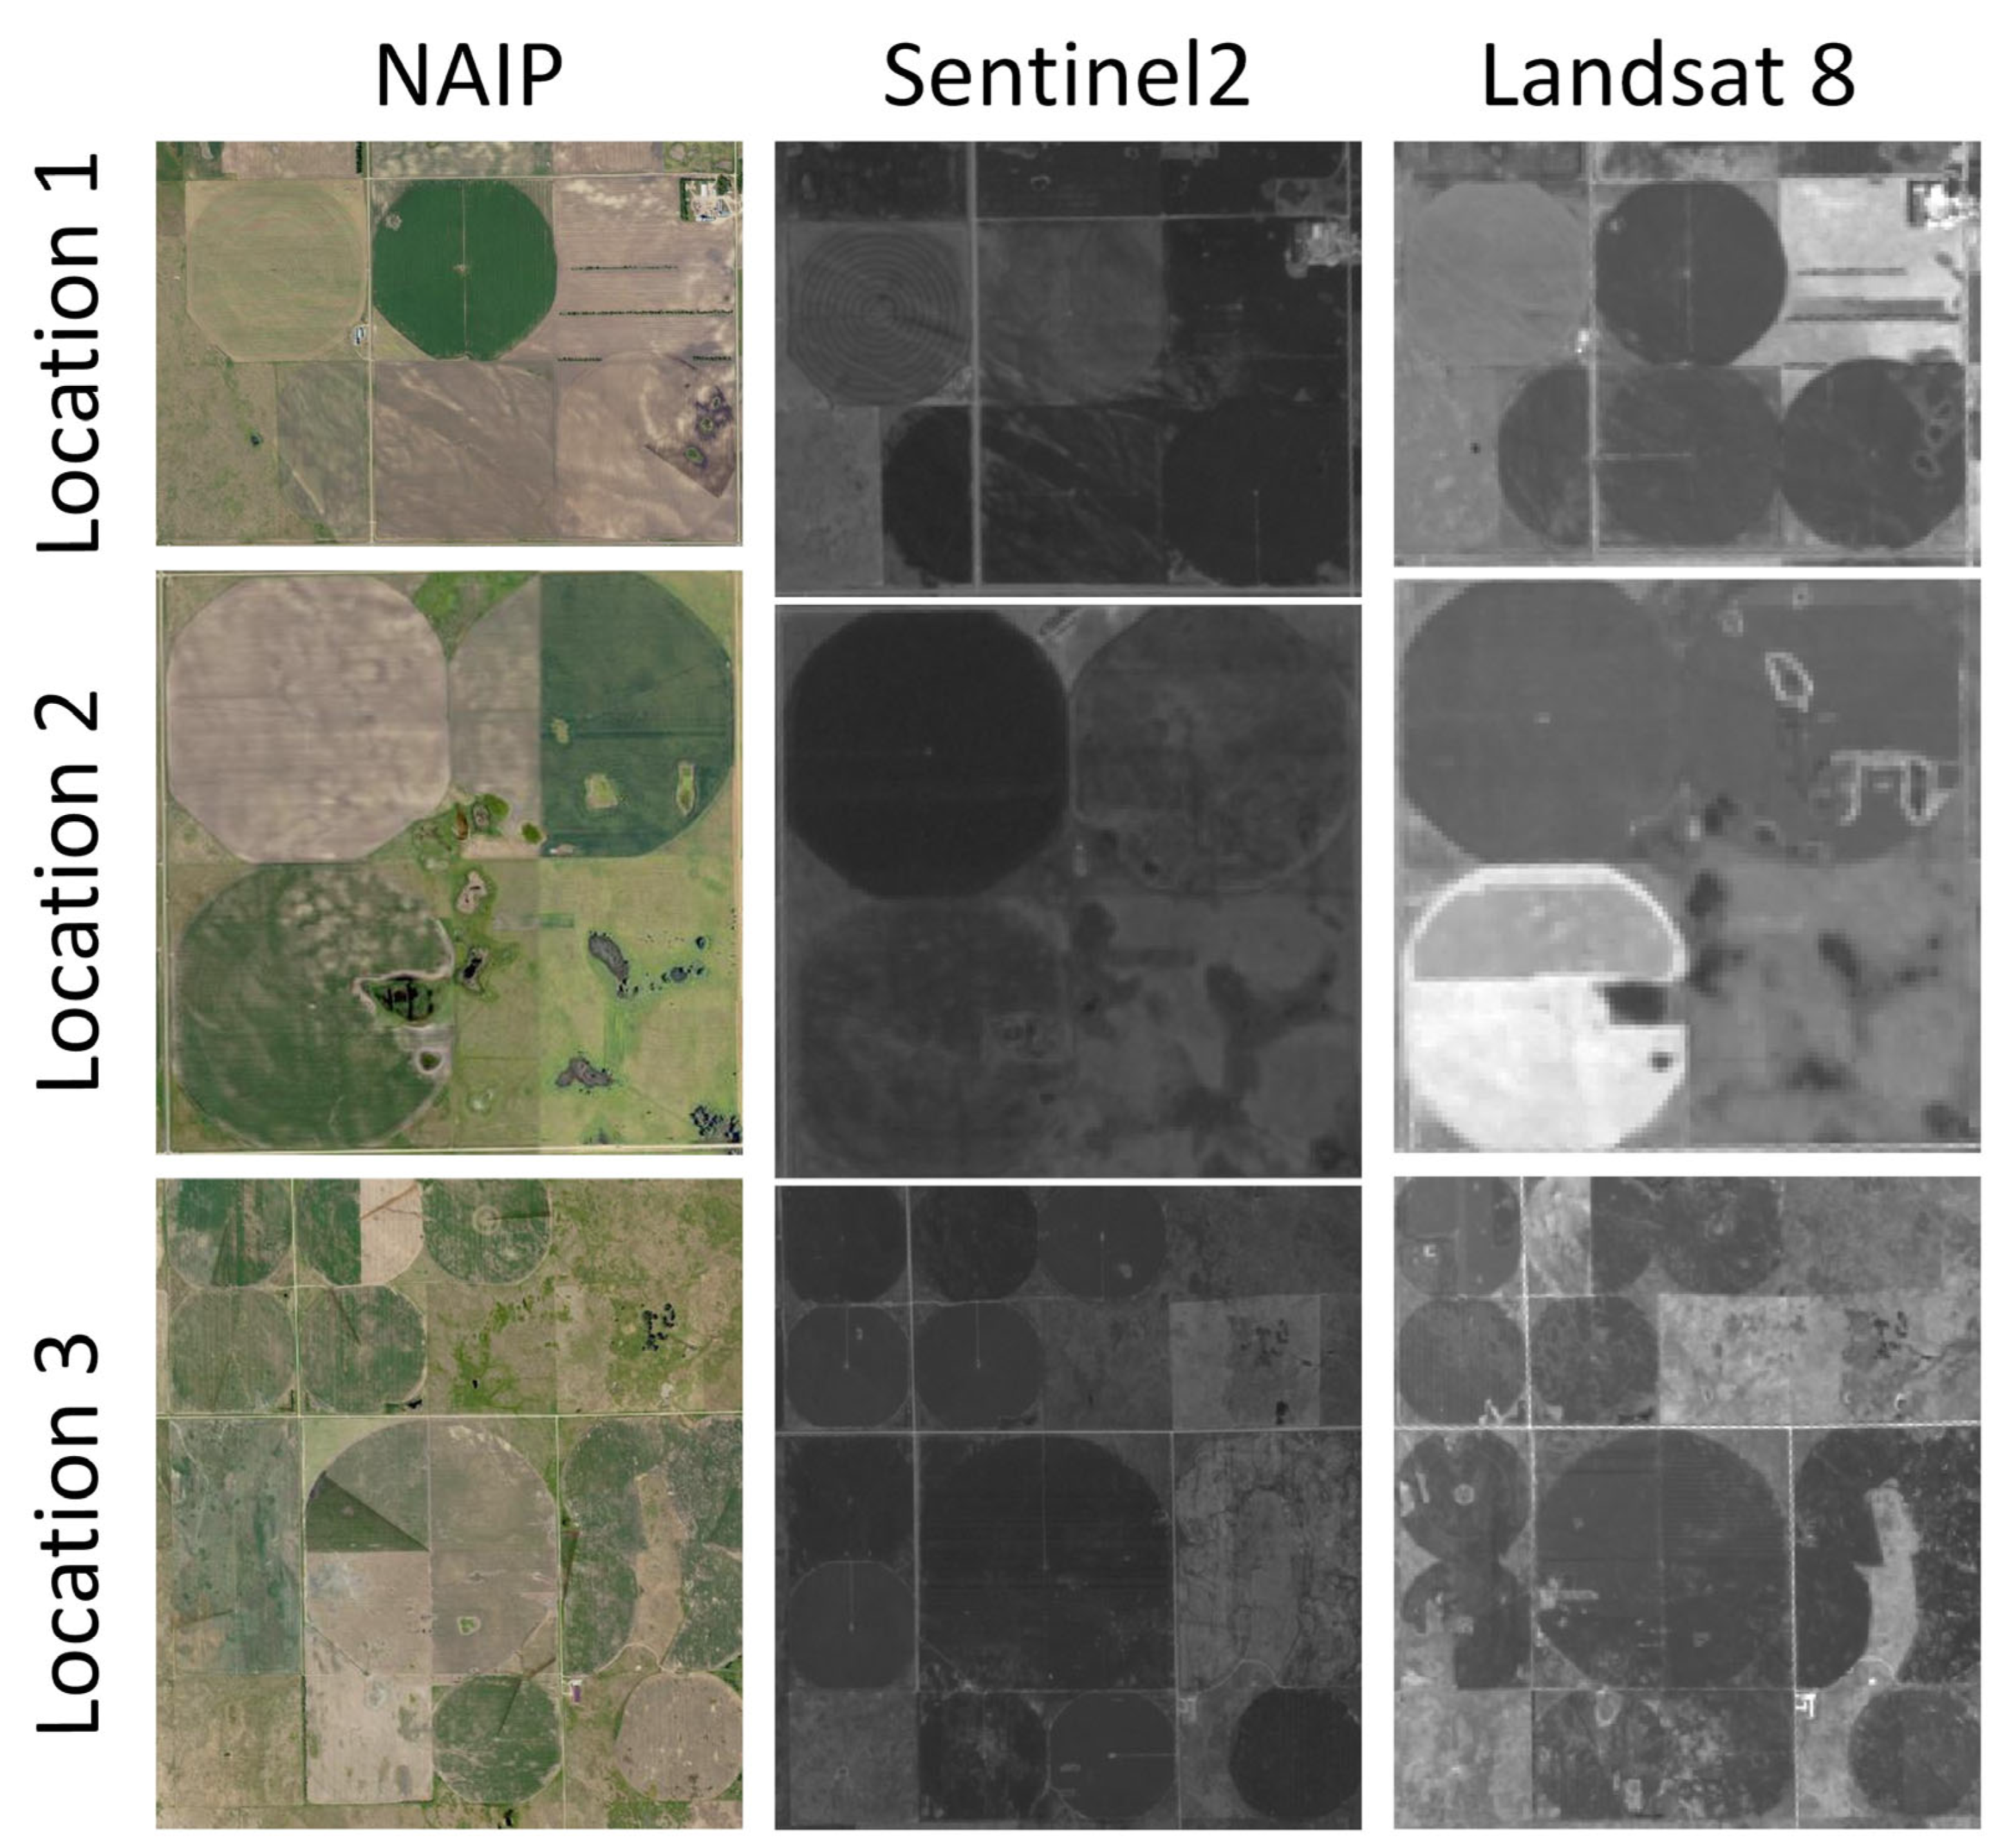
In this study, we developed a systematic deep learning-based method to detect center-pivot irrigation systems using remote sensing data. The workflow is shown in Figure 1.

2.1. Study Area

The study area for this research encompasses the entire state of North Dakota, a region located in the north-central United States (Figure 2). North Dakota is characterized by a diverse landscape that includes the Red River Valley in the east, known for its fertile agricultural land, and the more rugged Badlands and Missouri Plateau in the west. The state experiences a continental climate with cold winters and warm summers, with precipitation levels varying significantly across different regions [21]. These climatic conditions, along with seasonal variations, influence the presence and operation of irrigation systems.

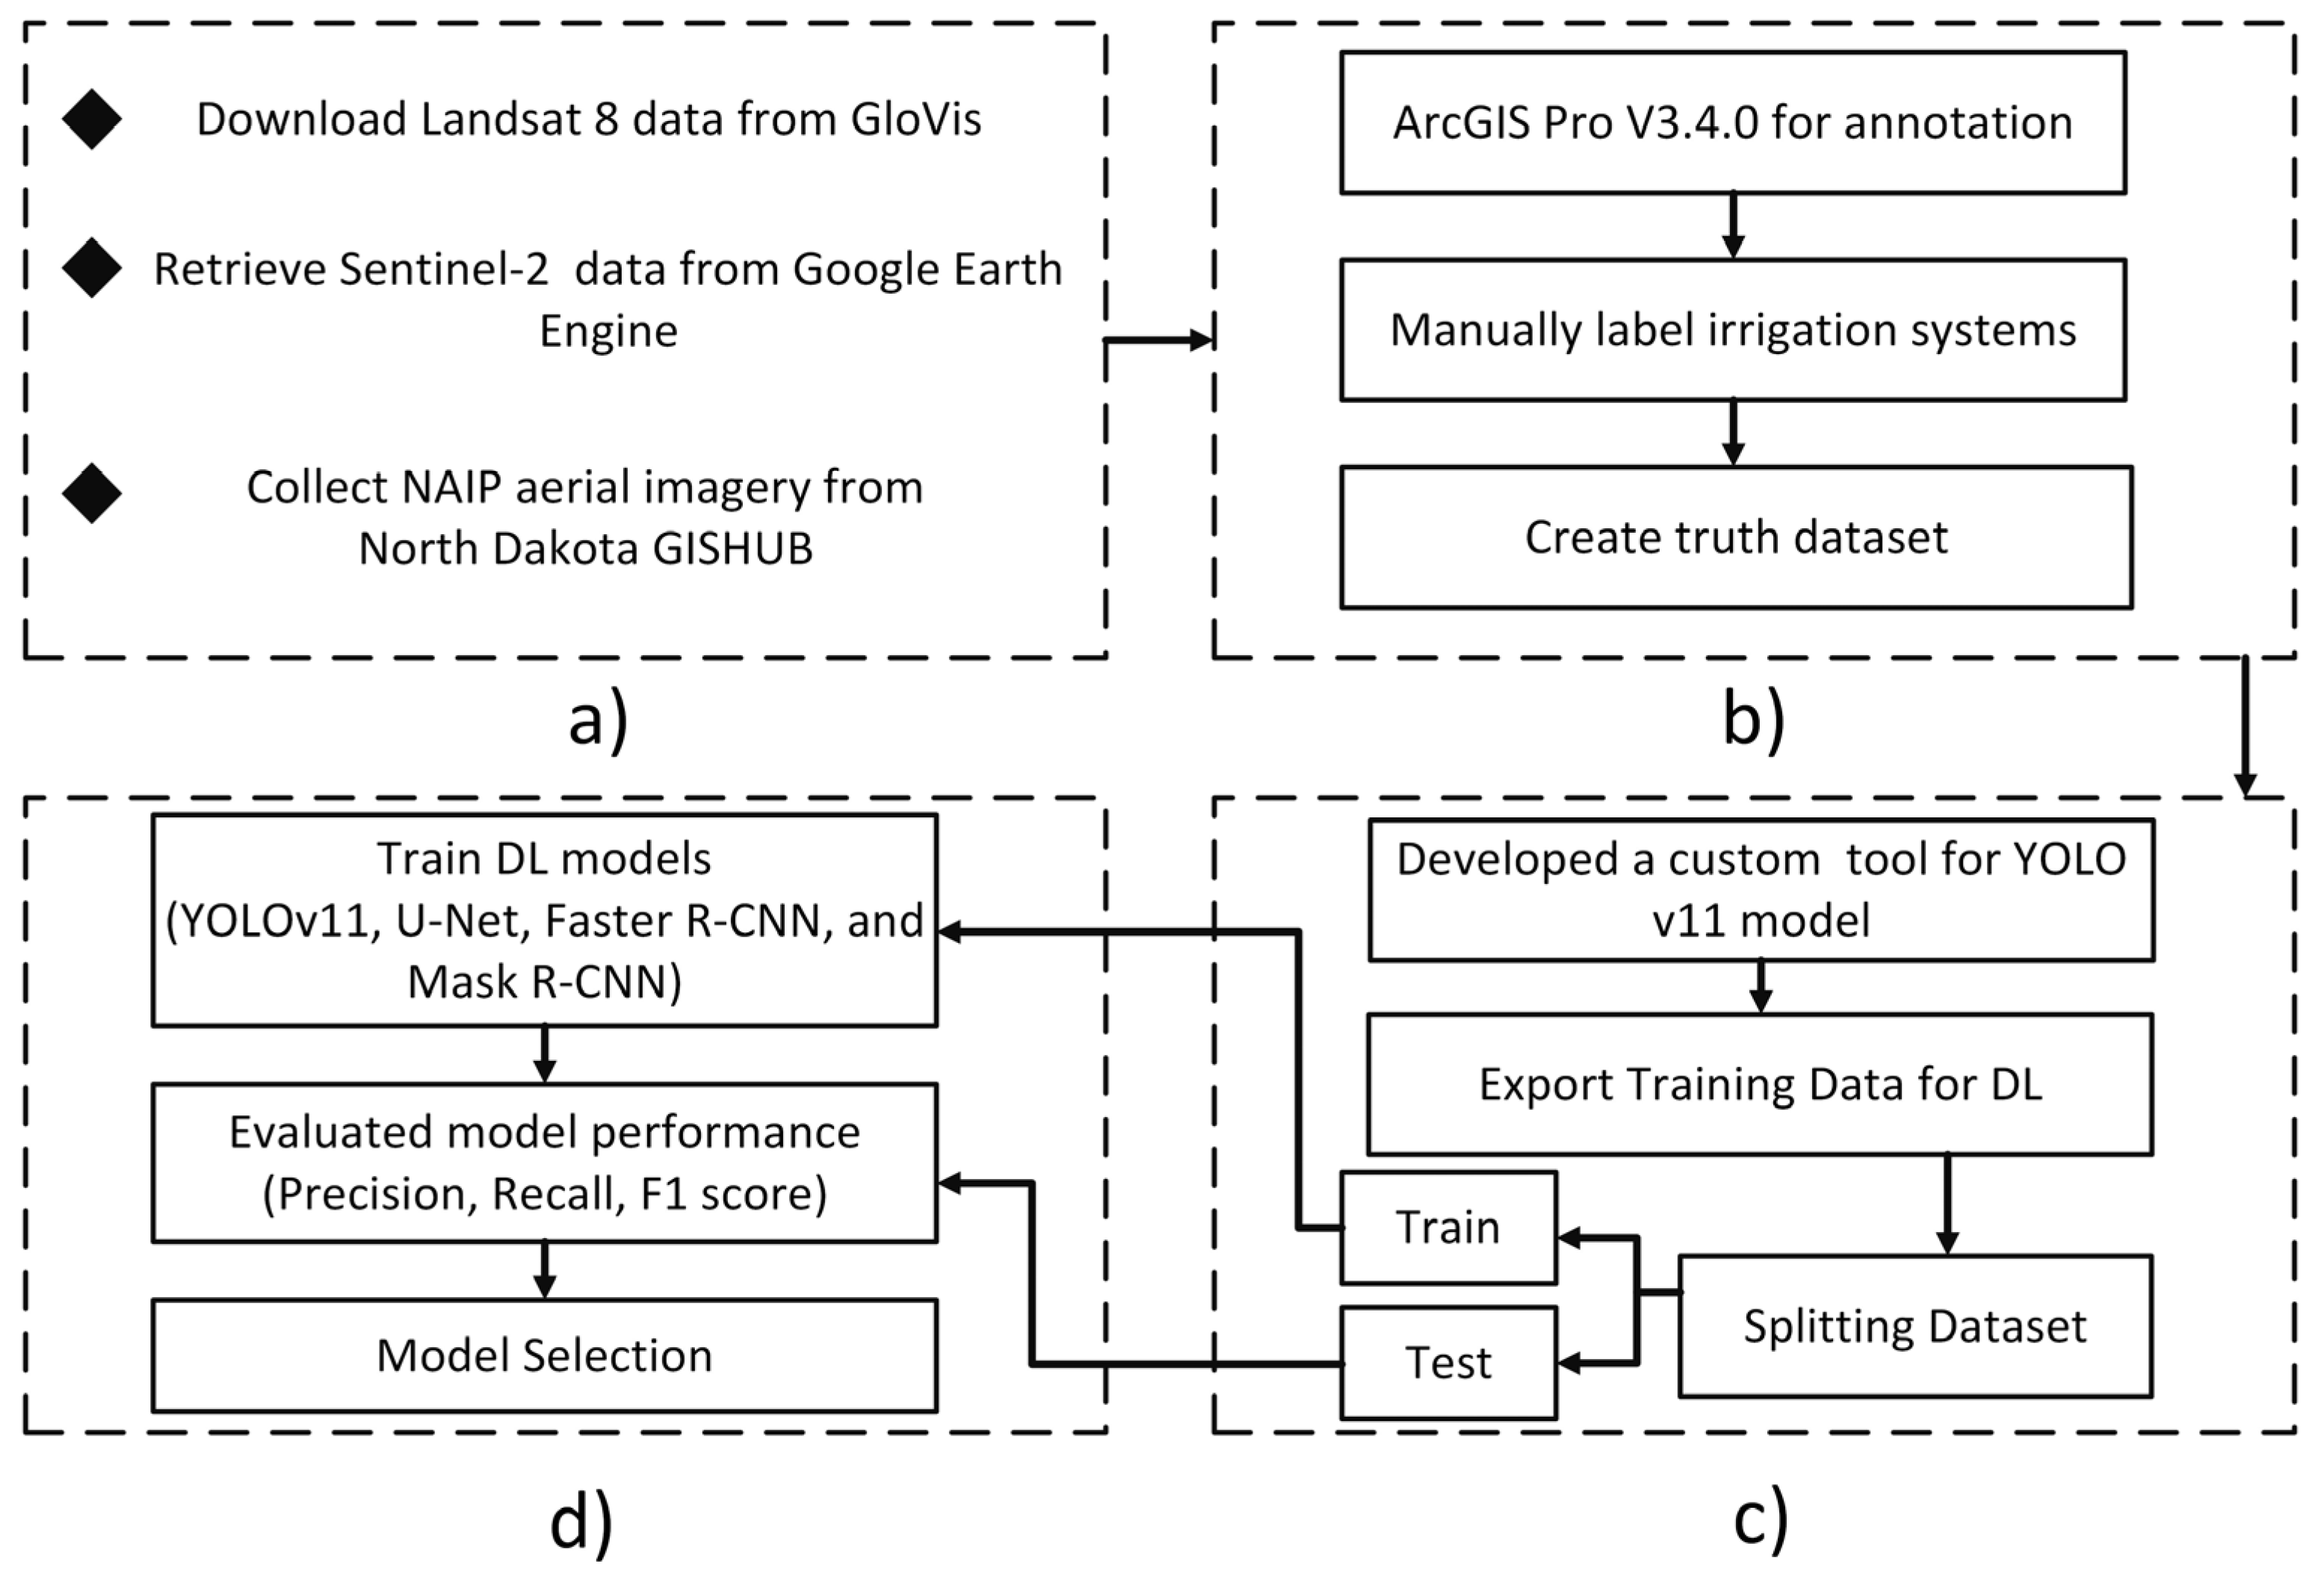
2.2. Dataset Creation

We utilized optical satellite imagery and high-resolution aerial imagery to enhance the detection of irrigation systems across North Dakota. Landsat 8, provided by NASA and USGS, offers 11 bands of multispectral and thermal imagery with a moderate spatial resolution (30 m) and a 16-day revisit time, making it a valuable resource for long-term monitoring of land cover changes [22]. Sentinel-2, operated by the European Space Agency (ESA), provides multiple bands of multispectral imagery with a higher resolution (10 m) and a shorter (5-day) revisit time [23], which improves the temporal analysis of irrigation systems. Lastly, the USDA National Agriculture Imagery Program provides high-resolution (1 m) aerial imagery [24], which is particularly useful for refining irrigation detection and validating satellite-derived results. The NAIP dataset was downloaded using the North Dakota GIS Hub (https://www.gis.nd.gov, accessed on 30 June 2025).
Table 1 shows a summary of the key characteristics of each dataset. For Landsat 8, the panchromatic band was used in this study. While the panchromatic band (Band 8) from Collection 2 Level-1 imagery is not processed for surface reflectance, our selection was guided by the superior spatial resolution (15 m), which proved critical for capturing the geometric structure and spatial patterns of center-pivot irrigation systems. Additionally, since the panchromatic band consists of a single band combined from three visible bands (red, green, and blue) rather than multiple spectral bands, it significantly reduces the data size, making it easier for users to download and process. This approach eliminates the need to process large, multi-band datasets, thereby streamlining data acquisition and analysis while leveraging the Landsat 8 panchromatic band’s 15 m spatial resolution. This finer spatial detail is particularly advantageous for detecting the geometric patterns of center-pivot irrigation systems, which are readily identifiable based on shape and contrast. Previous studies have demonstrated that high spatial resolution can significantly improve the detection of circular agricultural features, even when spectral information is limited [25]. Regarding Sentinel-2, only the four multispectral bands with 10 m spatial resolution were used (Bands 2, 3, 4, and 8 or blue, green, red, and near-infrared, respectively). These bands were selected to maximize spatial detail and maintain consistency with the resolution requirements of the object detection models. This selection allows for a comparison of the capabilities of RGB imagery (NAIP), a single-band image (the panchromatic band of Landsat 8), and multispectral data in detecting the locations of CPISs.
The performance of different deep learning models was evaluated using satellite and aerial images captured during the summer of 2024. The NAIP imagery used in this study represents a mosaic of acquisition dates, with 19 different acquisition dates ranging from 12 July to 25 September 2024, as published by the USDA NAIP. The variability in the acquisition dates for the NAIP imagery introduces a confounding variable that must be considered when evaluating the suitability of this dataset for CPIS detection. Since most irrigation systems are actively in use during the summer months, the presence of water application and vegetation response is more pronounced, making it the most suitable season for model training. By focusing on summer imagery, we ensured that the models were tested under optimal conditions for detecting irrigation infrastructure.
The GloVis (USGS Global Visualization Viewer) platform was used to download the Landsat 8 data. This platform provides an efficient way to search, preview, and download Landsat imagery, allowing users to access specific bands, including the high-resolution panchromatic band, without downloading the full multi-band dataset. For Sentinel-2, Google Earth Engine (GEE) was used. GEE offers cloud-based access to vast archives of satellite imagery, enabling users to process and analyze data without requiring local storage or computational resources. The NAIP dataset was downloaded using the North Dakota GIS Hub.
To obtain satellite-based observations for the study area, we acquired the panchromatic band and multispectral surface reflectance imagery from the Landsat 8 and Sentinel-2 missions, respectively. Landsat 8 Collection 2 Tier 1 Level-2 surface reflectance products were accessed via the Glovis platform, filtered to include only images with <20% cloud cover collected during the summer season (1 June to 31 August 2024) over North Dakota, using the appropriate WRS-2 path/row boundaries. Similarly, Sentinel-2 Level-2A surface reflectance images were obtained from the COPERNICUS/S2_SR GEE Image Collection, constrained by the same spatial and temporal filters and by the CLOUDY_PIXEL_PERCENTAGE metadata field. The filtered metadata (including acquisition date, cloud percentage, and image ID) were exported in tabular format (Tables S1 and S2) for further inspection and scene selection. Figure S1 provides a map of the tiles covering the entire state of North Dakota for both satellites.

2.3. Model Selection
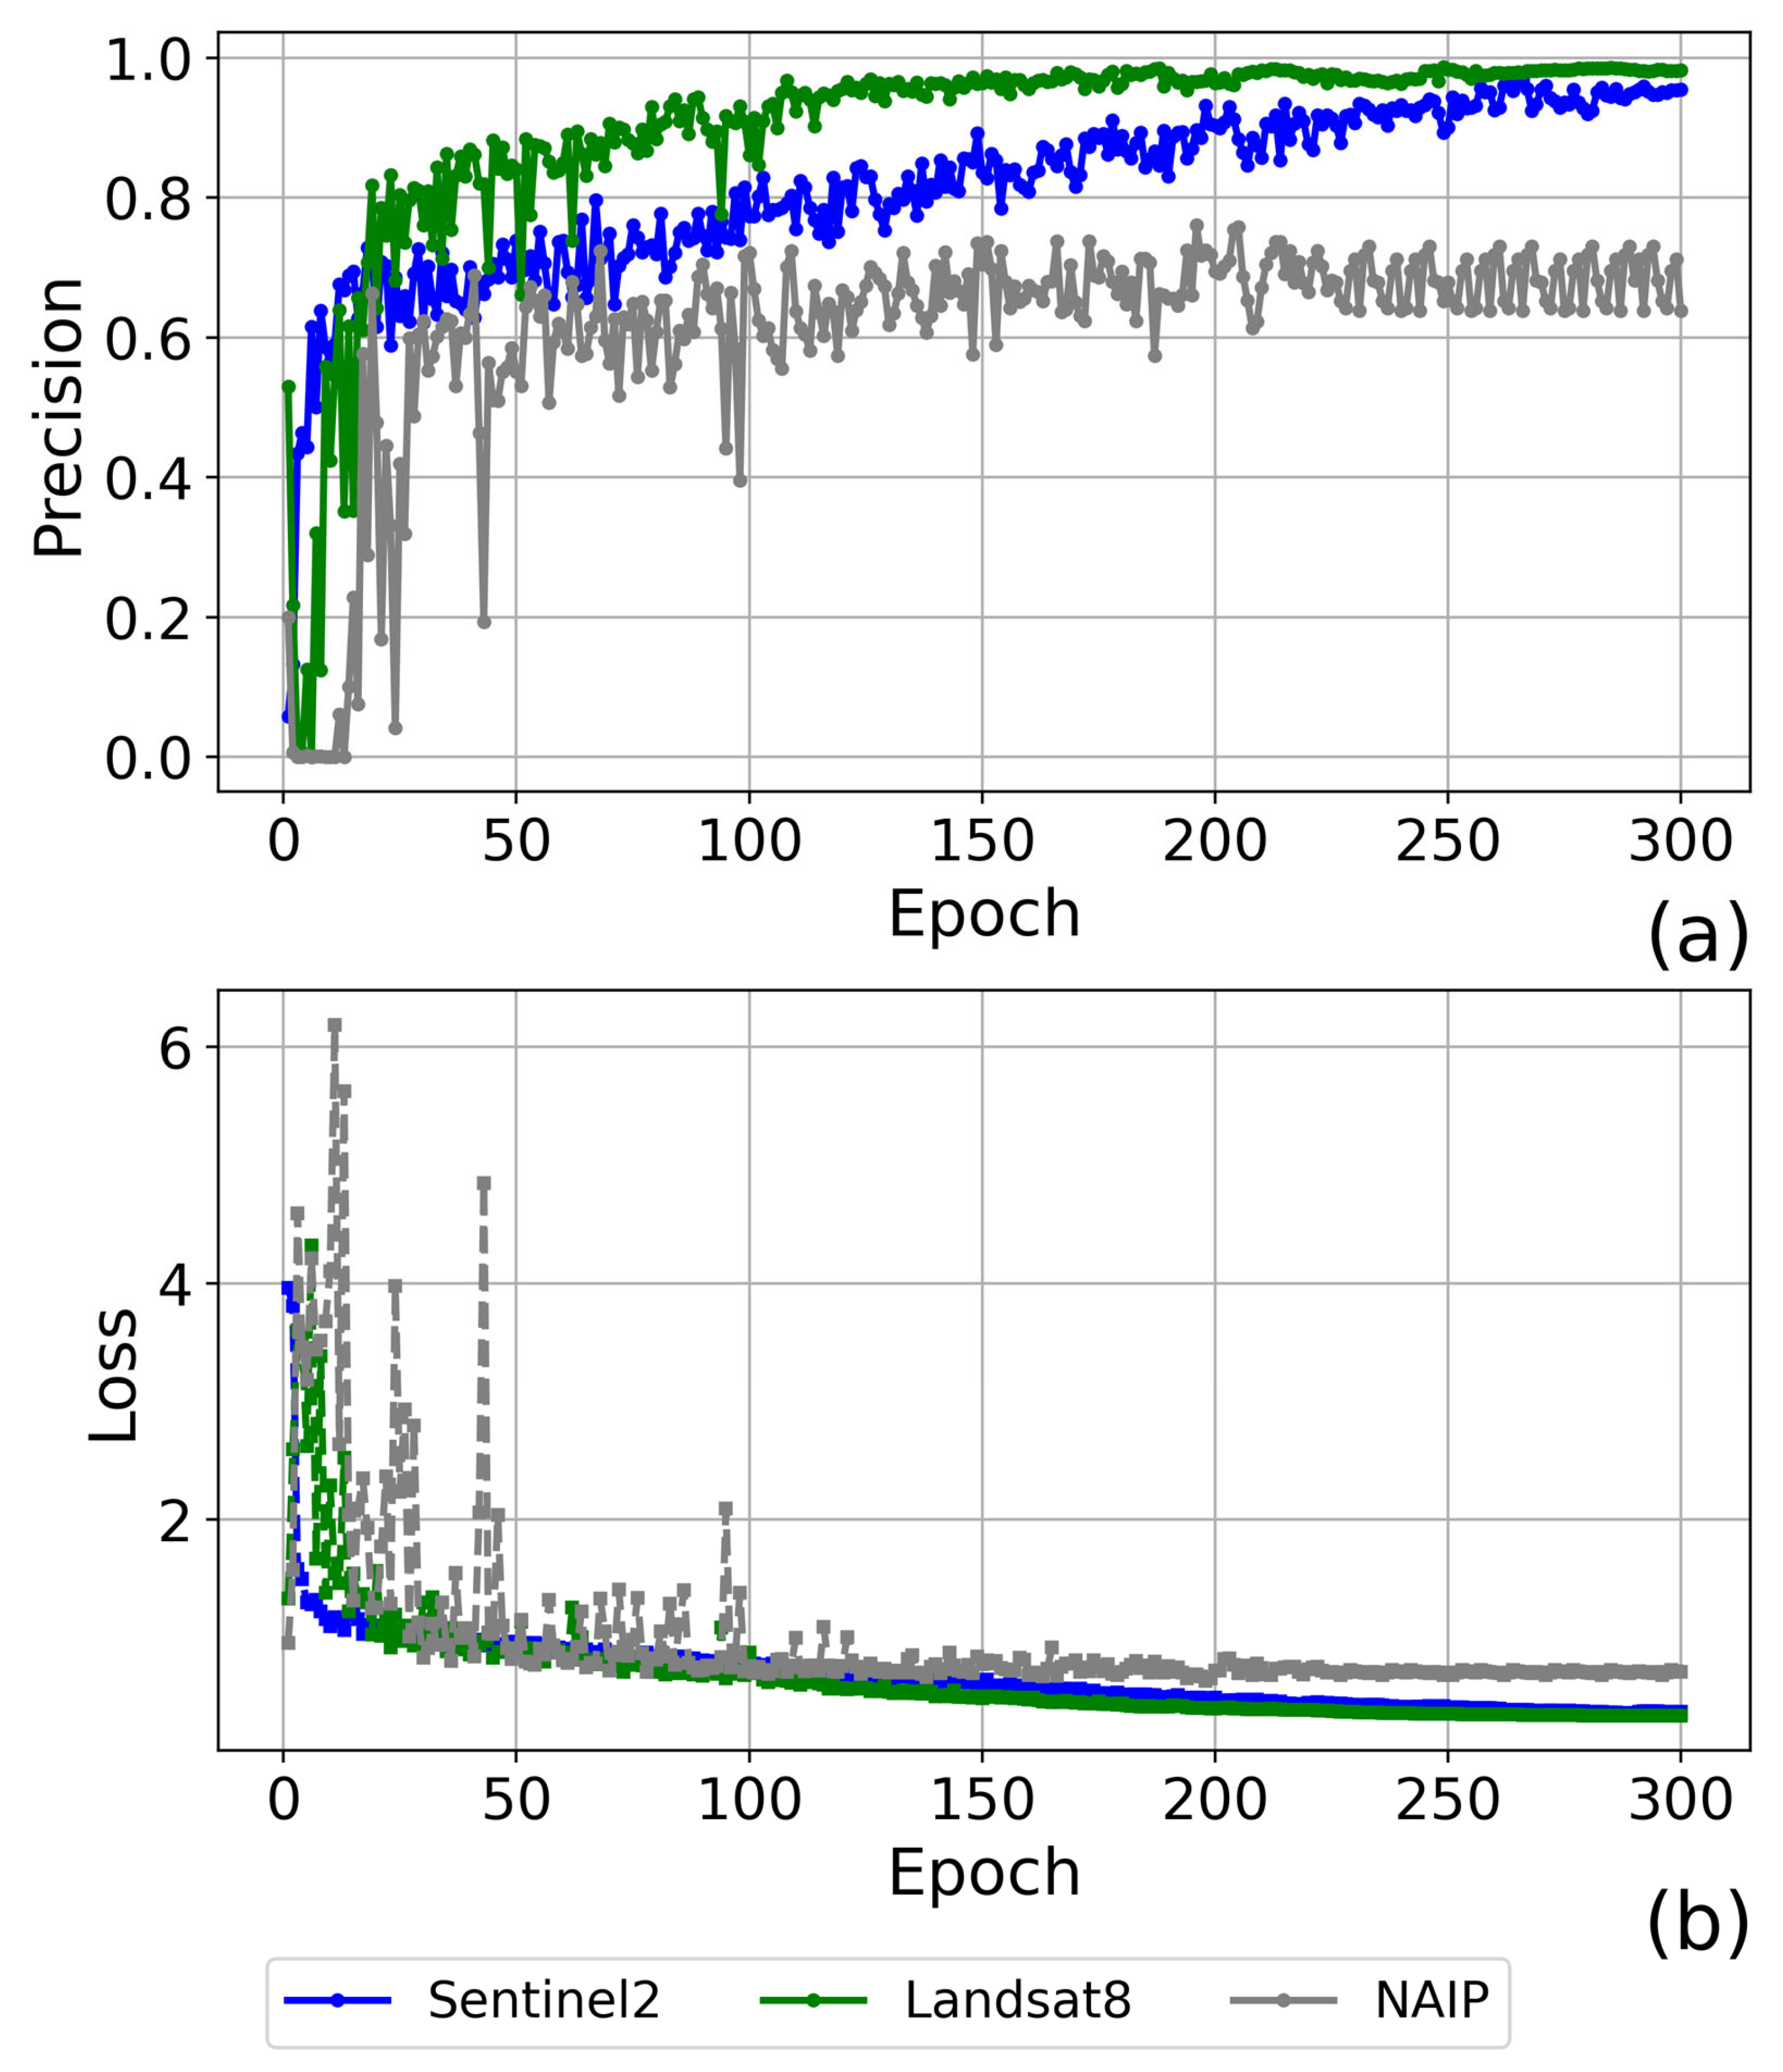
The selection of deep learning models for object detection in this study—YOLOv11 [26], U-Net [27], Faster R-CNN [28], and Mask R-CNN [29]—was driven by several key considerations, including model efficiency, accuracy, and compatibility with annotation tools such as ArcGIS Pro version 3.4.0. One of the primary reasons for choosing these models was their ability to efficiently handle large remote sensing datasets [30], enabling fast and precise detection of irrigation systems. YOLOv11 was selected for its real-time detection capabilities and high speed [31], making it ideal for rapid analysis of large imagery datasets. U-Net, a popular model in semantic segmentation, was chosen due to its ability to capture fine details in irrigation structures [32], particularly in high-resolution imagery like NAIP. Faster R-CNN and Mask R-CNN were included because of their robust feature extraction [33] and ability to detect complex irrigation patterns with high accuracy.
ArcGIS Pro provides a streamlined workflow for creating high-quality labeled datasets, which are essential for training these models effectively [27]. Furthermore, its deep learning integration allows for seamless application of these models in an efficient and user-friendly manner, reducing computational overhead and making it easier to scale the analysis across large areas such as North Dakota. By leveraging these models within ArcGIS Pro, this study ensured a fast, efficient, and accurate detection process, optimizing both annotation and model implementation for irrigation system mapping.
Since ArcGIS Pro does not support newer versions of YOLO, such as YOLOv11, we developed a custom tool using the arcpy package of Python (version 3.9.13) to bridge this gap and facilitate dataset preparation for the state-of-the-art object detection models. As an innovative solution, this tool automates the conversion of PASCAL VOC annotation format to YOLO-compatible format, making it possible to train YOLOv11 models efficiently within ArcGIS workflows. The tool works by extracting bounding box annotations from XML files, normalizing them to YOLO format, and organizing the dataset into structured training and validation subsets. It preserves high-resolution PNG images, ensuring no quality loss, and allows users to specify a custom validation split ratio. The tool also automatically generates the necessary metadata files (e.g., classes.txt and data.yaml), making the dataset ready for YOLOv11 training without additional manual processing. This streamlined approach not only ensures compatibility with new YOLO versions but also enhances efficiency, automation, and accessibility for ArcGIS Pro users working with deep learning-based object detection tasks.

2.4. Model Training

In this study, the training and testing datasets were prepared using the Deep Learning package of the Image Analyst extension in ArcGIS Pro version 3.4. The Export Training Data for Deep Learning tool was specifically used to annotate irrigation systems, ensuring high-quality labeled data for model training. A visual-based annotation approach was employed, by which 1845 center-pivot irrigation systems of varying sizes (5.1–218 hectares) at different locations (Figure 3) were manually identified and labeled. The images were clipped from the original tiles with a size of 480 × 480 pixels and a stride of 240 pixels, resulting in a 50% overlap between consecutive images. This overlap was intentionally introduced to ensure that irrigation systems located near the edge of one image would also be partially or fully captured in adjacent image chips. Such redundancy helps reduce edge effects and improves model robustness by providing additional training samples with varied spatial contexts for the same object. To ensure a balanced dataset, an 85:15 split ratio was applied, with 85% of the dataset allocated for training and 15% reserved for testing. While 70:30 or 80:20 dataset partitions are common in machine learning workflows, this study employed an 85:15 split ratio to increase the volume of training data available to the deep learning models. Given the relatively limited size of the annotated dataset and the complexity of object detection tasks in high-resolution imagery, maximizing the training set was essential for model convergence and generalization. Similar strategies have been adopted in remote sensing applications where high annotation costs or small target classes necessitate more training data [34]. This systematic data preparation process ensured a robust training pipeline, allowing for the precise detection of irrigation systems using advanced deep learning techniques.

2.5. Model Evaluation

Since no official ground-truth dataset exists for the number of irrigation systems in each county or location, a systematic approach was developed to create a reliable truth dataset for model validation. In this approach, 30 locations, each covering an area of at least 65 hectares, were randomly selected across North Dakota. Using high-resolution Google Earth imagery with a spatial resolution of 50 cm, irrigation systems within these selected areas were manually digitized as polygons. The total number of irrigation systems in each area was then calculated and compiled to serve as the truth dataset (1845 CPIS). This dataset was crucial for evaluating the performance of the deep learning models by providing a reference for comparison, ensuring that the models’ detection capabilities were assessed against a systematically derived real-world representation of irrigation system distribution.
To evaluate the performance of the deep learning models in detecting irrigation systems, several standard evaluation metrics were used, including precision (Pr), recall (Rc), F1-score [35], and a confusion matrix. The confusion matrix was constructed based on the test dataset (277 CPIS), providing a detailed breakdown of true positives (TP), false positives (FP), true negatives (TN), and false negatives (FN). Additionally, a Taylor Plot was used to visually compare the truth values (manually derived dataset) with the predicted values from the models. The Taylor Plot allows for a statistical assessment of how well the predictions match the actual values by analyzing the correlation, standard deviation, and centered root mean square error (RMSE) [36]. This visualization helps in understanding the strength and consistency of the model’s predictions in relation to real-world irrigation system distributions. By combining quantitative evaluation (confusion matrix, precision, recall, and F1-score) with visual validation (Taylor Plot), the performance assessment ensured a comprehensive evaluation of the models’ effectiveness in accurately detecting irrigation systems across North Dakota.
P r = T P T P + F P
R c = T P T P + F N
F 1 - s c o r e = 2 R c P r P r + R c
An ANOVA test [37] was also conducted to determine whether there is a statistically significant difference between the accuracy of the model predictions and the ground-truth datasets.

2.5.1. Spatial Autocorrelation Analysis (Moran’s I)

To evaluate whether the prediction errors of detected irrigation systems exhibit a spatial clustering pattern or are randomly distributed, we conducted Moran’s I analysis [38] using ArcGIS Pro. First, a point feature class was created to represent the 30 validation locations, where the difference between predicted and actual irrigation system counts was calculated and stored in an “Error” field. This dataset served as the basis for the spatial autocorrelation analysis. The Moran’s I tool (Analysis → Spatial Statistics Tools → Analyzing Patterns → Spatial Autocorrelation) was applied using Inverse Distance conceptualization and Euclidean Distance as the distance method. The analysis generated Moran’s I index, z-score, and p-value, which provide insights into whether prediction errors exhibited a statistically significant clustering pattern. The results allowed us to assess the spatial distribution of model inaccuracies, guiding targeted model refinements, such as region-specific training data enhancements and parameter adjustments, to improve detection accuracy.

2.5.2. Hotspot Analysis (Getis-Ord Gi*)

To identify statistically significant spatial clusters of prediction errors, we performed a hotspot analysis (Getis-Ord Gi*) in ArcGIS Pro [39]. Using the same error point dataset prepared for Moran’s I analysis, the tool was accessed via Analysis → Spatial Statistics Tools → Mapping Clusters → Hot Spot Analysis (Getis-Ord Gi*). The “Error” field, representing the difference between predicted and actual irrigation system counts, was used as the input variable. The conceptualization of spatial relationships was set to Inverse Distance, ensuring consistency with Moran’s I analysis, while the distance threshold was determined based on ArcGIS recommendations. The results generated z-scores and p-values that classified locations into hotspots (over-predictions) and coldspots (under-predictions) with varying confidence levels (99%, 95%, and 90%). This analysis provided valuable insights into spatial trends in modeling errors, enabling the refinement of training datasets, parameter adjustments, and region-specific model improvements to enhance the accuracy of irrigation system detection.

3. Results

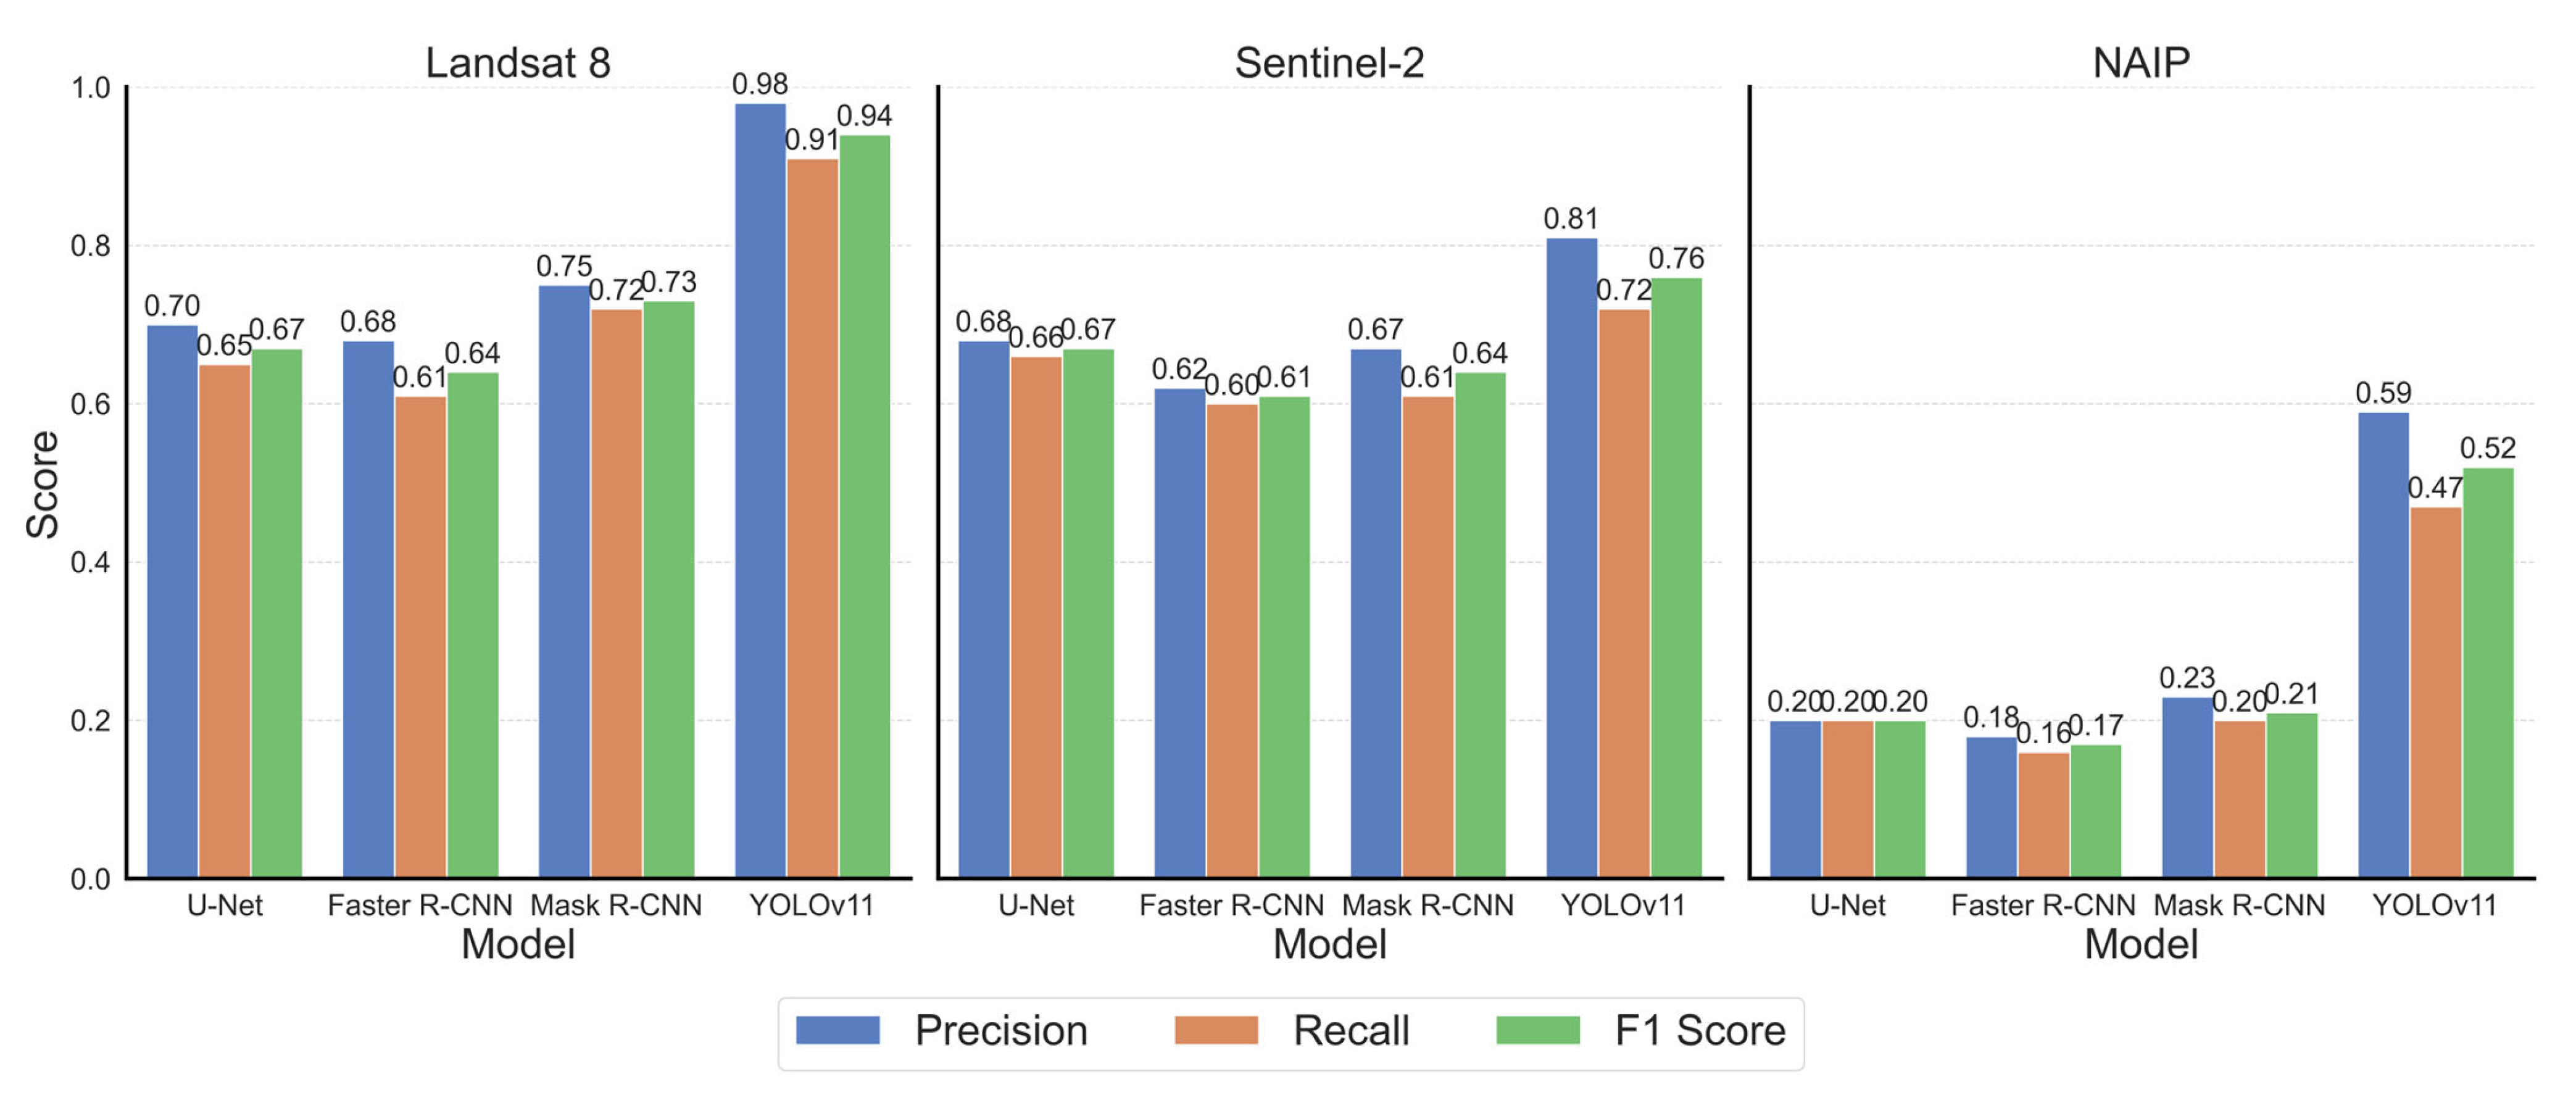
3.1. Detection Performance

Figure 4 compares the four deep learning models’ performance for detecting CPISs using the three imagery sources. YOLOv11 performed consistently better than the other three models, regardless of which imagery dataset was used. The performances of the other three models, namely U-Net, Faster R-CNN, and Mask R-CNN, are comparable, with Faster R-CNN’s performance slightly worse than U-Net and Mask R-CNN. The results highlight the superior performance of YOLOv11 when combined with the panchromatic band of Landsat 8 for detecting center-pivot irrigation systems. This combination achieved the highest precision (0.98) and F1-score (0.94), significantly outperforming other combinations of deep learning models and datasets. An ANOVA test also confirms a statistically significant difference between the performance of YOLOv11 with Landsat 8 panchromatic bands and other models and datasets (p-value < 0.05). These findings led to the selection of YOLOv11 as the preferred model and Landsat 8 panchromatic band as the optimal dataset for further analyses.
Unlike the strong performance of YOLOv11 on Landsat 8, other combinations of deep learning models and datasets exhibited less satisfactory performance. Sentinel-2 multispectral imagery, although widely used in agricultural remote sensing, showed a decline in detection accuracy compared to Landsat 8. The best performance on Sentinel-2 was observed with YOLOv11 (F1-score: 0.76), which was considerably lower than the corresponding performance on Landsat 8. This result is consistent with findings from [15], who demonstrated that the PVANET–Hough model, when applied to Sentinel-2 images, could detect CPISs with high precision but required additional post-processing steps for accurate delineation.
Figure 5 illustrates the performance of the YOLOv11 model with the different datasets in detecting the center-pivot irrigation systems in North Dakota, based on the testing dataset in the summer season for 300 epochs. This figure shows the comparative results of YOLOv11’s ability to generalize the identifications of center-pivot irrigation systems using three different data sources, reinforcing the effectiveness of the YOLOv11-Landsat 8 panchromatic combination for this application.
To compare the actual number of irrigation systems with the predicted values generated by the trained YOLOv11 models using different datasets, the trained models were applied to the 30 randomly selected locations across North Dakota as the ground-truth dataset. Figure 6 presents the results of this comparison using a Taylor Plot, which provides a statistical assessment of model accuracy by visualizing key performance metrics such as correlation, standard deviation, and centered RMSE. The results demonstrate that the combination of YOLOv11 and the Landsat 8 panchromatic band achieved the highest accuracy among all datasets. This suggests that, despite its lower spatial resolution, the generalized granularity of the Landsat 8 panchromatic band allows the deep learning model to better distinguish irrigation system patterns, leading to improved detection performance compared to higher-resolution datasets that introduce more complexity and noise.
Interestingly, our results indicate that the Landsat 8 panchromatic band outperforms higher-resolution imagery like NAIP in detecting irrigation systems using deep learning models. This counterintuitive outcome can be attributed to the greater level of detail and complexity present in high-resolution images (Figure 7). While NAIP provides fine-grained spatial information, the increased level of texture and intricate details can introduce more variability, making it harder for deep learning models to generalize patterns effectively. This effect is particularly noticeable in complex landscapes where high-resolution imagery captures finer-scale noise and variations that may not be directly relevant for irrigation detection. To further analyze this phenomenon, we computed the fractal dimension of different image categories. The fractal dimension quantifies the complexity and self-similarity of an image, providing a measure of image structure intricacy [40].
The fractal dimension analysis reveals a critical relationship between image complexity and deep learning model performance in detecting irrigation systems. Higher-resolution imagery, such as NAIP (60 cm), exhibits increased structural complexity as shown by its greater fractal dimensions. While these images capture fine-scale variations, they also introduce noise and intricate details that can hinder model generalization, reducing detection accuracy. This observation supports existing research on the challenges of using high-resolution imagery in deep learning-based remote sensing. Excessive texture details in such imagery can lead to overfitting and reduced classification accuracy [41].
Conversely, lower-resolution imagery like the Landsat 8 panchromatic band has a lower fractal dimension, emphasizing broader landscape features with smoother textures. This makes it easier for models to identify larger-scale irrigation patterns, improving detection accuracy. Studies have shown that moderate-resolution imagery often strikes a balance between sufficient detail and computational efficiency, resulting in improved performance in remote sensing tasks [42]. Sentinel-2 imagery falls between NAIP and Landsat 8 in terms of complexity, providing more detail than Landsat 8 but avoiding the excessive complexity of NAIP. This intermediate complexity level contributes to relatively stable detection accuracy. Research on deep learning and image super-resolution has demonstrated that excessive spatial resolution does not always yield better classification accuracy, as models need an optimal level of complexity to perform efficiently [43].
Overall, the findings suggest that higher spatial resolution does not always enhance model performance. Instead, imagery with optimal complexity, assessed through fractal dimension, can offer better results. This underscores the importance of considering both resolution and texture complexity when selecting datasets for deep learning applications. Future research should explore integrating super-resolution techniques to improve the utility of lower-resolution images without compromising model generalization, in line with recent findings [44].

3.2. Moran’s I (Spatial Autocorrelation)

Moran’s I analysis of the errors in the predicted irrigation system detections across North Dakota reveals a moderate and statistically significant positive spatial autocorrelation (Figure 8; Moran’s I = 0.2788, p-value = 0.0416). This indicates that the errors are not randomly distributed but instead exhibit a clustering pattern, where areas with overestimations or underestimations in the predicted values tend to be spatially grouped. Similar spatial dependencies in model errors have been observed in remote sensing applications, where environmental factors, land-use variations, and training data distribution significantly influence model performance [45]. The presence of such clustering suggests that certain spatial factors, such as variations in landscape characteristics, irrigation system density, or dataset resolution differences, may be influencing the model’s predictive accuracy in specific regions. Studies have shown that spatial autocorrelation plays a crucial role in machine learning-based geospatial modeling, affecting how models generalize across different landscapes [46]. The statistically significant z-score of 2.0372 and p-value of 0.0416 (Figure 8) indicate a non-random, clustered spatial pattern in the data. This spatial clustering implies that the performance of the deep learning model may be influenced by localized spatial characteristics, such as land use, irrigation practices, or image quality differences. To assess this, Moran’s I spatial autocorrelation analysis was conducted specifically for the YOLOv11 model using Landsat 8 PAN imagery, which was the best-performing model in this study. The results highlight the need for region-specific model tuning or refinement of the training dataset to account for these spatial dependencies.

3.3. Hotspot Analysis (Getis-Ord Gi*)

The hotspot analysis (Figure 9), conducted specifically for the YOLOv11 model using Landsat 8 PAN imagery, reveals distinct clusters of prediction errors, with hotspots (over-predictions) concentrated in the western regions and coldspots (under-predictions) predominantly in the eastern regions of North Dakota. This spatial pattern highlights regional variations in model accuracy, likely influenced by differences in landscape characteristics, irrigation density, and dataset suitability. Such findings align with previous studies that emphasize the importance of spatial variability when evaluating deep learning model performance in remote sensing applications [47]. These results provide actionable insights for refining the model by enabling targeted improvements in training data collection, model parameter adjustments, and adaptive training strategies.
The presence of hotspots suggests that the model is over-detecting irrigation systems in certain areas, possibly due to an imbalance in training data representation (Figure S2). This occurs when the model is trained on a spatially biased dataset, such as one dominated by irrigation systems from specific regions (e.g., eastern North Dakota), leading it to overgeneralize features and produce false positives in less-represented regions (e.g., western North Dakota). In contrast, coldspots indicate areas where the model is under-detecting irrigation systems, which may be attributed to limitations in the input imagery. For example, irrigation features in these regions might be less distinguishable due to coarse spatial resolution, suboptimal seasonal imagery, or spectral ambiguity. In such cases, incorporating higher-resolution reference data or seasonal imagery (e.g., from peak irrigation periods) could enhance the model’s ability to extract relevant features and reduce false negatives. A similar approach was suggested in previous research, where the incorporation of localized training data enhanced the classification performance of deep learning models for land-use mapping [48].
Although the Landsat 8 PAN-based model outperformed the Sentinel-2 model despite having lower spectral resolution, this finding underscores the value of spatial clarity and strong object-level contrast in detecting center-pivot irrigation systems. Nevertheless, in certain coldspot regions where detection was poor, additional spectral information or structural cues may still be beneficial. In such cases, multi-source data fusion, such as the integration of hyperspectral and SAR imagery, can provide complementary insights that help the model better distinguish irrigated fields, particularly in spectrally ambiguous or heterogeneous landscapes [49]. Adjusting model parameters and applying region-specific data augmentation techniques may also help reduce false positives in hotspot areas while improving recall in under-represented regions.

4. Discussion

The best performance of YOLOv11 achieved in this study is similarly high in CPIS detection to a previous study that implemented a U-Net model on high-resolution PlanetScope imagery (3 m resolution) and achieved a precision of 99% and recall of 88% for CPIS mapping [19]. The enhanced spatial detail significantly improved the model’s ability to detect circular irrigation patterns, as evidenced by the superior precision and F1-score achieved in our results. In contrast, using atmospherically corrected surface reflectance products such as Band 4 (30 m) would offer improved radiometric fidelity but at the cost of reduced spatial resolution, which could hinder the identification of CPIS features. Although integrating surface reflectance data or employing image fusion techniques (e.g., pansharpening) may offer an optimal balance between spatial and spectral information, such methods introduce additional processing complexity and were beyond the scope of this study. We recommend that future work explore hybrid approaches that combine atmospheric correction with spatial enhancement for improved generalizability across different sensor types and environmental conditions.
The results of this study also reinforce the importance of selecting appropriate spectral bands and spatial resolutions for deep learning applications in agricultural monitoring. Previous research by [50] demonstrated that combining deep learning models with Sentinel-2 and shape-detection algorithms such as the Hough transform could significantly improve CPIS detection accuracy. However, in this study, the panchromatic band of Landsat 8 proved to be more suitable for CPIS detection. These findings provide valuable insights for future CPIS monitoring and model selection. The use of YOLOv11, in particular, demonstrates the potential for rapid and accurate CPIS mapping across large areas. However, further research is needed to refine detection models for high-resolution imagery, such as NAIP, and to explore multi-temporal approaches for improving detection reliability across different seasons.
Our results show that the effectiveness of using NAIP imagery for detecting CPISs was notably low across all models, with YOLOv11 achieving the highest F1-score of only 0.52. This suggests that despite the high spatial resolution of NAIP, its use in CPIS detection presents challenges. One possible explanation is that the increased detail in NAIP imagery introduces more noise and spectral variability, making it difficult for deep learning models to generalize patterns effectively [51]. This issue might also be influenced by differences in acquisition time across the imagery sources. Vegetation properties can change rapidly in the summer, and variations in acquisition dates between NAIP and other datasets may contribute to the observed challenges. This observation is supported by [16], who noted that spectral complexity within CPIS regions could hinder automatic detection models when using high-resolution imagery.
Higher fractal dimensions indicate greater complexity, which can challenge deep learning models by increasing the number of non-essential details that they must process. By comparing the fractal dimensions of different image types (Landsat 8, Sentinel-2, and NAIP), we observe that while higher-resolution imagery often provides more detail, in certain tasks like irrigation detection, simpler, lower-resolution imagery may sometimes yield better model performance. This could be due to the model’s ability to focus on broader, more relevant patterns when higher spatial detail introduces excessive noise or complexity. However, it is important to note that high-quality data with proper annotations generally allow the model to distinguish relevant features from irrelevant ones, leading to improved inference capabilities.
To address the limitations observed in the current study, future research should explore data preprocessing strategies such as spatial filtering or noise suppression to mitigate high-resolution image complexity. Additionally, implementing multi-scale learning architectures or feature selection techniques may help deep learning models better manage fine spatial variability. Hybrid approaches that combine the strengths of both high- and low-resolution imagery may also improve model robustness. Finally, leveraging transfer learning from large annotated datasets and incorporating more diverse training samples can further enhance model generalizability across different image types.
Moreover, integrating spatial autocorrelation techniques into machine learning workflows has been shown to enhance predictive accuracy by accounting for spatial dependencies in training data [52]. These findings underscore the importance of considering spatial autocorrelation when evaluating deep learning models for remote sensing applications. Addressing spatially clustered errors through targeted model adjustments, additional training data collection in affected regions, or the incorporation of spatially aware deep learning techniques could further enhance the accuracy of irrigation system detection [48]. Understanding these spatial error distributions is crucial for refining deep learning models and improving the accuracy of irrigation system detection across diverse landscapes [48].
Furthermore, the clustering of prediction errors suggests that a single, globally trained model may not perform equally well across the entire study area, and implementing region-specific fine-tuning could enhance accuracy. This concept has been widely discussed in the remote sensing literature, where transfer learning approaches have been employed to improve model generalizability across different geographical contexts [53].
By leveraging these insights, the hotspot analysis serves as a diagnostic tool to refine deep learning model performance, ensuring more reliable irrigation system detection and improved decision-making in water resource management. Such spatially explicit error analysis has been shown to be a crucial component in optimizing remote sensing-based monitoring systems [54]. These findings reinforce the necessity of integrating spatial pattern recognition in model evaluation to improve the precision and reliability of irrigation mapping techniques.
Finally, while YOLOv11 combined with Landsat 8 panchromatic imagery demonstrated superior detection performance in this study, its transferability and robustness across different geographic regions remain to be tested. Variability in land-use patterns, image quality, and irrigation infrastructure may impact model generalization. Future work should investigate the model’s adaptability through transfer learning and domain adaptation techniques using diverse datasets from other agricultural regions. This would help assess the universality of the proposed approach and support its broader application in irrigation monitoring across different environmental and operational contexts.

5. Conclusions

This study evaluated the effectiveness of several deep learning models, YOLOv11, U-Net, Faster R-CNN, and Mask R-CNN, for detecting center-pivot irrigation systems using three remote sensing datasets: Landsat 8, Sentinel-2, and NAIP. Among the tested combinations, the YOLOv11 model applied to Landsat 8 panchromatic imagery achieved the highest detection accuracy, demonstrating that, in certain applications, lower spectral but higher spatial resolution data can yield superior results. Spatial statistical analyses, including Moran’s I and hotspot analysis, further revealed systematic regional prediction patterns, informing future improvements in training data selection and model calibration. A major contribution of this work is the development of a custom ArcGIS Pro tool that facilitates training data preparation and YOLOv11 model execution, bridging a technical gap in GIS-based deep learning workflows. This tool empowers GIS practitioners without deep programming experience to implement state-of-the-art object detection on large area mosaicked imagery. Additionally, our automated pipeline enables the processing of composite statewide datasets, expanding the applicability of deep learning for landscape-scale monitoring. The findings have direct implications for agricultural water resource management. Accurate detection and mapping of irrigation infrastructure are essential for understanding water distribution patterns, improving irrigation efficiency, and guiding sustainable groundwater use. This study’s approach provides a scalable solution for policymakers, agronomists, and water managers seeking to monitor and manage irrigated agriculture under growing environmental pressures.
Despite these advances, challenges remain. High-resolution imagery introduces noise that can impair model generalization, and the limited availability of annotated ground-truth data restricts broader model applicability. Future research should focus on integrating multi-temporal datasets, applying data fusion methods, and incorporating attention-based deep learning architectures to improve robustness. Moreover, linking irrigation detection outputs with hydrological and economic models could enhance decision-making for sustainable water use. Finally, while this study focused on object-level detection, future work should incorporate land cover classification data (e.g., USDA Cropland Data Layer) to estimate actual irrigated area. This would provide a more comprehensive assessment of agricultural water use. Additionally, a direct comparison of spatial vs. spectral resolution impacts, such as constructing a synthetic panchromatic band from Sentinel-2, could further disentangle the factors influencing detection accuracy. Together, these efforts will strengthen the role of AI-driven remote sensing in advancing sustainable agriculture and water resource planning.

Supplementary Materials

The following supporting information can be downloaded at https://www.mdpi.com/article/10.3390/rs17132276/s1, Table S1: List of tile images from Landsat 8 with cloud cover less than 20% acquired during June–August 2024 covering the entire state of North Dakota; Table S2: List of tile images from Sentinel-2 with cloud cover less than 20% acquired during June–August 2024 covering the entire state of North Dakota; Figure S1: Spatiotemporal structure of tile images over North Dakota (purple color), labeled with acquisition dates during June–August 2024: (a) Landsat 8 and (b) Sentinel-2; Figure S2: The locations of training data sites across North Dakota.

Author Contributions

Conceptualization, A.B. and J.K.; methodology, A.B.; software, A.B.; validation, A.B., J.K., R.P. and Z.L.; formal analysis, A.B.; investigation, A.B., J.K., R.P. and Z.L.; resources, J.K., R.P. and Z.L.; data curation, A.B.; writing—original draft, A.B.; writing—review and editing, A.B., J.K., R.P. and Z.L.; visualization, A.B.; supervision, R.P. and Z.L.; project administration, R.P. and Z.L.; funding acquisition, R.P. and Z.L. All authors have read and agreed to the published version of the manuscript.

Funding

This study is supported by the United States Department of Agriculture (project no. 3060–21000-045–000-D), the North Dakota Irrigation Association, North Dakota Department of Water Resources, Garrison Diversion Conservancy District, and NDSU Office of Research and Creative Activity (the North Dakota Economic Diversification Research Fund).

Data Availability Statement

The data used in this research are available upon request to the corresponding author. The link to access the developed tool in ArcGIS Pro to convert a PASCAL VOC dataset into the YOLO format: https://github.com/AliBgisrs/VOCtoYOLLO11 (accessed on 30 June 2025).

Acknowledgments

The authors would like to express their gratitude to Tom Scherer, David Franzen, and Paulo Flores for their expertise and assistance in this project. We used Grammarly and ChatGPT with GPT-3.5 for grammar checking and sentence polishing.

Conflicts of Interest

The authors declare no conflicts of interest.

References

  1. Ogunba, A. Threats to Groundwater: Lessons from Canada and Selected Jurisdictions. J. Energy Nat. Resour. Law 2012, 30, 159–184. [Google Scholar] [CrossRef]
  2. Proulx, R.A.; Knudson, M.D.; Kirilenko, A.; VanLooy, J.A.; Zhang, X. Significance of surface water in the terrestrial water budget: A case study in the Prairie Coteau using GRACE, GLDAS, Landsat, and groundwater well data. Water Resour. Res. 2013, 49, 5756–5764. [Google Scholar] [CrossRef]
  3. McShane, R.R.; Barnhart, T.B.; Valder, J.F.; Haines, S.S.; Macek-Rowland, K.M.; Carter, J.M.; Delzer, G.C.; Thamke, J.N. Estimates of Water Use Associated with Continuous Oil and Gas Development in the Williston Basin, North Dakota and Montana, 2007–17; US Geological Survey: Reston, VA, USA, 2020.
  4. Lin, Z.; Lin, T.; Lim, S.H.; Hove, M.H.; Schuh, W.M. Impacts of Bakken Shale Oil Development on Regional Water Uses and Supply. J. Am. Water Resour. Assoc. 2018, 54, 225–239. [Google Scholar] [CrossRef]
  5. Lin, Z.; Lim, S.H.; Lin, T.; Borders, M. Using Agent-Based Modeling for Water Resources Management in the Bakken Region. J. Water Resour. Plan. Manag. 2020, 146, 05019020. [Google Scholar] [CrossRef]
  6. Lin, T.; Lin, Z.; Lim, S.H.; Jia, X.; Chu, X. A Spatial Agent-Based Model for Hydraulic Fracturing Water Distribution. Front. Environ. Sci. 2022, 10, 1025559. [Google Scholar] [CrossRef]
  7. Li, R.; Merchant, J.W. Modeling Vulnerability of Groundwater to Pollution under Future Scenarios of Climate Change and Biofuels-Related Land Use Change: A Case Study in North Dakota, USA. Sci. Total Environ. 2013, 447, 32–45. [Google Scholar] [CrossRef]
  8. Nustad, R.A.; Damschen, W.C.; Vecchia, A.V. Interactive Tool to Estimate Groundwater Elevations in Central and Eastern North Dakota; US Geological Survey: Reston, VA, USA, 2018.
  9. Hill, R.; Keller, J. Irrigation System Selection for Maximum Crop Profit. Trans. ASAE 1980, 23, 366–372. [Google Scholar] [CrossRef]
  10. Hassani, K.; Taghvaeian, S.; Gholizadeh, H. A Geographical Survey of Center Pivot Irrigation Systems in the Central and Southern High Plains Aquifer Region of the United States. Appl. Eng. Agric. 2021, 37, 1139–1145. [Google Scholar] [CrossRef]
  11. Wenger, K.; Vadjunec, J.M.; Fagin, T. Groundwater Governance and the Growth of Center Pivot Irrigation in Cimarron County, OK and Union County, NM: Implications for Community Vulnerability to Drought. Water 2017, 9, 39. [Google Scholar] [CrossRef]
  12. Lian, J.; Li, Y.; Li, Y.; Zhao, X.; Zhang, T.; Wang, X.; Wang, X.; Wang, L.; Zhang, R. Effect of Center-Pivot Irrigation Intensity on Groundwater Level Dynamics in the Agro-Pastoral Ecotone of Northern China. Front. Environ. Sci. 2022, 10, 892577. [Google Scholar] [CrossRef]
  13. Sabir, R.M.; Sarwar, A.; Shoaib, M.; Saleem, A.; Alhousain, M.H.; Wajid, S.A.; Rasul, F.; Adnan Shahid, M.; Anjum, L.; Safdar, M.; et al. Managing Water Resources for Sustainable Agricultural Production. In Transforming Agricultural Management for a Sustainable Future: Climate Change and Machine Learning Perspectives; Springer: Berlin/Heidelberg, Germany, 2024; pp. 47–74. [Google Scholar]
  14. de Albuquerque, A.O.; de Carvalho, O.L.F.; e Silva, C.R.; Luiz, A.S.; de Bem, P.P.; Gomes, R.A.T.; Guimarães, R.F.; de Carvalho Júnior, O.A. Dealing with Clouds and Seasonal Changes for Center Pivot Irrigation Systems Detection Using Instance Segmentation in Sentinel-2 Time Series. IEEE J. Sel. Top. Appl. Earth Obs. Remote Sens. 2021, 14, 8447–8457. [Google Scholar] [CrossRef]
  15. Tang, J.; Arvor, D.; Corpetti, T.; Tang, P. Pvanet-Hough: Detection and Location of Center Pivot Irrigation Systems from Sentinel-2 Images. ISPRS Ann. Photogramm. Remote Sens. Spat. Inf. Sci. 2020, 3, 559–564. [Google Scholar] [CrossRef]
  16. de Albuquerque, A.O.; de Carvalho, O.L.F.; e Silva, C.R.; de Bem, P.P.; Gomes, R.A.T.; Borges, D.L.; Guimarães, R.F.; Pimentel, C.M.M.; de Carvalho Júnior, O.A. Instance Segmentation of Center Pivot Irrigation Systems Using Multi-Temporal SENTINEL-1 SAR Images. Remote Sens. Appl. Soc. Environ. 2021, 23, 100537. [Google Scholar] [CrossRef]
  17. Pang, S.; Sun, L.; Tian, Y.; Ma, Y.; Wei, J. Convolutional Neural Network-Driven Improvements in Global Cloud Detection for Landsat 8 and Transfer Learning on Sentinel-2 Imagery. Remote Sens. 2023, 15, 1706. [Google Scholar] [CrossRef]
  18. Kazemi Garajeh, M.; Blaschke, T.; Hossein Haghi, V.; Weng, Q.; Valizadeh Kamran, K.; Li, Z. A Comparison between Sentinel-2 and Landsat 8 OLI Satellite Images for Soil Salinity Distribution Mapping Using a Deep Learning Convolutional Neural Network. Can. J. Remote Sens. 2022, 48, 452–468. [Google Scholar] [CrossRef]
  19. Saraiva, M.; Protas, É.; Salgado, M.; Souza Jr, C. Automatic Mapping of Center Pivot Irrigation Systems from Satellite Images Using Deep Learning. Remote Sens. 2020, 12, 558. [Google Scholar] [CrossRef]
  20. Cooley, D.; Maxwell, R.M.; Smith, S.M. Center Pivot Irrigation Systems and Where to Find Them: A Deep Learning Approach to Provide Inputs to Hydrologic and Economic Models. Front. Water 2021, 3, 786016. [Google Scholar] [CrossRef]
  21. Badh, A.; Akyuz, A.; Vocke, G.; Mullins, B. Impact of Climate Change on the Growing Seasons in Select Cities of North Dakota, United States of America. Int. J. Clim. Chang. Impacts Responses 2009, 1, 105. [Google Scholar] [CrossRef]
  22. Ustin, S.L.; Middleton, E.M. Current and Near-Term Earth-Observing Environmental Satellites, Their Missions, Characteristics, Instruments, and Applications. Sensors 2024, 24, 3488. [Google Scholar] [CrossRef]
  23. Razzak, M.T.; Mateo-García, G.; Lecuyer, G.; Gómez-Chova, L.; Gal, Y.; Kalaitzis, F. Multi-Spectral Multi-Image Super-Resolution of Sentinel-2 with Radiometric Consistency Losses and Its Effect on Building Delineation. ISPRS J. Photogramm. Remote Sens. 2023, 195, 1–13. [Google Scholar] [CrossRef]
  24. USDA-FSA-APFO Aerial Photography Field Office. National Agriculture Imagery Program (NAIP) Orthoimagery for Zone 12 Arizona State Quarter Quadrangle Pedregosa Mountains East, Ne and ID# M_3110930_ne_12_1_20070609. Tif; USDA-FSA-APFO Aerial Photography Field Office: Salt Lake City, UT, USA, 2008.
  25. Johansen, K.; Lopez, O.; Tu, Y.-H.; Li, T.; McCabe, M.F. Center Pivot Field Delineation and Mapping: A Satellite-Driven Object-Based Image Analysis Approach for National Scale Accounting. ISPRS J. Photogramm. Remote Sens. 2021, 175, 1–19. [Google Scholar] [CrossRef]
  26. Lee, Y.-H.; Kim, H.-J. Comparative Analysis of YOLO Series (from V1 to V11) and Their Application in Computer Vision. J. Semicond. Disp. Technol. 2024, 23, 190–198. [Google Scholar]
  27. Bazrafkan, A.; Das, A.K.; Miranda, A.; Shah, R.; Green, A.; Flores, P. The Efficacy of UAS RGB Imagery and Deep Learning for Cereal Crop Lodging Detection. In Proceedings of the 2024 ASABE Annual International Meeting, Anaheim, CA, USA, 28–31 July 2024; American Society of Agricultural and Biological Engineers: St. Joseph, MI, USA, 2024; p. 1. [Google Scholar]
  28. Girshick, R. Fast R-Cnn. In Proceedings of the IEEE International Conference on Computer Vision, Santiago, Chile, 7–13 December 2015; pp. 1440–1448. [Google Scholar]
  29. He, K.; Gkioxari, G.; Dollár, P.; Girshick, R. Mask R-Cnn. In Proceedings of the IEEE International Conference on Computer Vision, Venice, Italy, 22–29 October 2017; pp. 2961–2969. [Google Scholar]
  30. Bazrafkan, A.; Kim, J.; Navasca, H.; Bandillo, N.; Flores, P. Assessing Dry Pea Stands Using Deep Learning Models in ArcGIS Pro. In Proceedings of the 2024 ASABE Annual International Meeting, Anaheim, CA, USA, 28–31 July 2024; American Society of Agricultural and Biological Engineers: St. Joseph, MI, USA, 2024; p. 1. [Google Scholar]
  31. Sapkota, R.; Qureshi, R.; Calero, M.; Badjugar, C.; Nepal, U.; Poulose, A.; Zeno, P.; Vaddevolu, U.B.P.; Khan, S.; Shoman, M.; et al. Yolo11 to Its Genesis: A Decadal and Comprehensive Review of the You Only Look Once (Yolo) Series. arXiv 2025, arXiv:2406.19407. [Google Scholar]
  32. de Albuquerque, A.O.; de Carvalho Júnior, O.A.; Carvalho, O.L.F.d.; de Bem, P.P.; Ferreira, P.H.G.; de Moura, R.; dos, S.; Silva, C.R.; Trancoso Gomes, R.A.; Fontes Guimarães, R. Deep Semantic Segmentation of Center Pivot Irrigation Systems from Remotely Sensed Data. Remote Sens. 2020, 12, 2159. [Google Scholar] [CrossRef]
  33. Liang, L.; Huang, W.; Awan, M.; Parveen, A.; Li, R.; Bi, F.; Shao, J.; Liang, X.; Wu, C.; Liu, Z. Study and application of image water level recognition calculation method based on mask rcnn and faster r-cnn. Appl. Ecol. Environ. Res. 2023, 21, 5039–5053. [Google Scholar] [CrossRef]
  34. Ma, L.; Liu, Y.; Zhang, X.; Ye, Y.; Yin, G.; Johnson, B.A. Deep Learning in Remote Sensing Applications: A Meta-Analysis and Review. ISPRS J. Photogramm. Remote Sens. 2019, 152, 166–177. [Google Scholar] [CrossRef]
  35. Bazrafkan, A.; Navasca, H.; Worral, H.; Oduor, P.; Delavarpour, N.; Morales, M.; Bandillo, N.; Flores, P. Predicting Lodging Severity in Dry Peas Using UAS-Mounted RGB, LIDAR, and Multispectral Sensors. Remote Sens. Appl. Soc. Environ. 2024, 34, 101157. [Google Scholar] [CrossRef]
  36. Uppalapati, S.; Paramasivam, P.; Kilari, N.; Chohan, J.S.; Kanti, P.K.; Vemanaboina, H.; Dabelo, L.H.; Gupta, R. Precision Biochar Yield Forecasting Employing Random Forest and XGBoost with Taylor Diagram Visualization. Sci. Rep. 2025, 15, 7105. [Google Scholar] [CrossRef]
  37. Cuevas, A.; Febrero, M.; Fraiman, R. An Anova Test for Functional Data. Comput. Stat. Data Anal. 2004, 47, 111–122. [Google Scholar] [CrossRef]
  38. Anselin, L. The Moran Scatterplot as an ESDA Tool to Assess Local Instability in Spatial Association. In Spatial Analytical Perspectives on GIS; Routledge: London, UK, 2019; pp. 111–126. [Google Scholar]
  39. Kumar, S.D.P.; Angadi, D.P. GIS-Based Analysis and Assessment of Spatial Correlation of Road Accidental Hotspots: A Case Study of Mangaluru City, Karnataka. In Humanities and Sustainability from Glocal Perspectives Towards Future Earth, Proceedings of the IGU Thematic Conference 2022, Mahendragarh, India, 24–25 November 2022; Springer Nature: Berlin/Heidelberg, Germany, 2025; p. 161. [Google Scholar]
  40. Theiler, J. Estimating Fractal Dimension. J. Opt. Soc. Am. A 1990, 7, 1055–1073. [Google Scholar] [CrossRef]
  41. Xie, X.; Tian, Y.; Zhu, Z. Application of Deep Learning in High-Resolution Remote Sensing Image Classification. In Proceedings of the International Conference on Electronic Information Engineering and Computer Communication (EIECC 2021), Online, 18 December 2021; SPIE: Bellingham, WA, USA, 2022; Volume 12172, pp. 536–541. [Google Scholar]
  42. Huang, X. High Resolution Remote Sensing Image Classification Based on Deep Transfer Learning and Multi Feature Network. IEEE Access 2023, 11, 110075–110085. [Google Scholar] [CrossRef]
  43. Sustika, R.; Suksmono, A.B. Evaluation of Deep Convolutional Neural Network with Residual Learning for Remote Sensing Image Super Resolution. Comput. Eng. Appl. J. 2021, 10, 1–8. [Google Scholar] [CrossRef]
  44. Rajeshwari, P.; Priya, P.L.; Pooja, M.; Abhishek, G. Remote Sensing Image Super-Resolution Using Deep Learning. In Proceedings of the 2024 IEEE Space, Aerospace and Defence Conference (SPACE), Bangalore, India, 22–23 July 2024; IEEE: Piscataway, NJ, USA, 2024; pp. 665–668. [Google Scholar]
  45. Karasiak, N.; Dejoux, J.-F.; Monteil, C.; Sheeren, D. Spatial Dependence between Training and Test Sets: Another Pitfall of Classification Accuracy Assessment in Remote Sensing. Mach. Learn. 2022, 111, 2715–2740. [Google Scholar] [CrossRef]
  46. Gazis, I.-Z.; Greinert, J. Importance of Spatial Autocorrelation in Machine Learning Modeling of Polymetallic Nodules, Model Uncertainty and Transferability at Local Scale. Minerals 2021, 11, 1172. [Google Scholar] [CrossRef]
  47. Bai, Y.; Sun, X.; Ji, Y.; Huang, J.; Fu, W.; Shi, H. Bibliometric and Visualized Analysis of Deep Learning in Remote Sensing. Int. J. Remote Sens. 2022, 43, 5534–5571. [Google Scholar] [CrossRef]
  48. Zhang, L.; Li, Y.; Hou, Z.; Li, X.; Geng, H.; Wang, Y.; Li, J.; Zhu, P.; Mei, J.; Jiang, Y.; et al. Deep Learning and Remote Sensing Data Analysis. Geomat. Inf. Sci. Wuhan Univ. 2020, 45, 1857–1864. [Google Scholar]
  49. Chen, Y.; Li, C.; Ghamisi, P.; Jia, X.; Gu, Y. Deep Fusion of Remote Sensing Data for Accurate Classification. IEEE Geosci. Remote Sens. Lett. 2017, 14, 1253–1257. [Google Scholar] [CrossRef]
  50. Tang, J.; Arvor, D.; Corpetti, T.; Tang, P. Mapping Center Pivot Irrigation Systems in the Southern Amazon from Sentinel-2 Images. Water 2021, 13, 298. [Google Scholar] [CrossRef]
  51. Zhu, X.X.; Tuia, D.; Mou, L.; Xia, G.-S.; Zhang, L.; Xu, F.; Fraundorfer, F. Deep Learning in Remote Sensing: A Comprehensive Review and List of Resources. IEEE Geosci. Remote Sens. Mag. 2017, 5, 8–36. [Google Scholar] [CrossRef]
  52. Huang, C.; Shibuya, A. High Accuracy Geochemical Map Generation Method by a Spatial Autocorrelation-Based Mixture Interpolation Using Remote Sensing Data. Remote Sens. 2020, 12, 1991. [Google Scholar] [CrossRef]
  53. Parelius, E.J. A Review of Deep-Learning Methods for Change Detection in Multispectral Remote Sensing Images. Remote Sens. 2023, 15, 2092. [Google Scholar] [CrossRef]
  54. Audebert, N.; Boulch, A.; Randrianarivo, H.; Le Saux, B.; Ferecatu, M.; Lefevre, S.; Marlet, R. Deep Learning for Urban Remote Sensing. In Proceedings of the 2017 Joint Urban Remote Sensing Event (JURSE), Dubai, United Arab Emirates, 6–8 March 2017; IEEE: Piscataway, NJ, USA, 2017; pp. 1–4. [Google Scholar]
Figure 1. Workflow for detecting irrigation systems using deep learning models: (a) data acquisition, (b) annotation and ground-truth creation, (c) dataset preparation, and (d) model training, testing, and evaluating.
Remotesensing 17 02276 g001
Figure 2. Study area: (a) North Dakota map, and (b) examples of center-pivot irrigation systems.
Remotesensing 17 02276 g002
Figure 3. Examples of spatially aligned image clips from three different datasets (Landsat 8 PAN, Sentinel-2, and NAIP), illustrating variations in resolution and visual detail. All clips were extracted using the same geographic extent, though differences in spatial resolution may give the impression of misalignment.
Remotesensing 17 02276 g003
Figure 4. Performance of detection models across three imagery datasets.
Remotesensing 17 02276 g004
Figure 5. Performance of YOLOv11 against the testing dataset (a) precision and (b) loss.
Remotesensing 17 02276 g005
Figure 6. The performance of the YOLOv11 model and different datasets for the 30 randomly selected locations in North Dakota. RMSD—root mean standard deviation.
Remotesensing 17 02276 g006
Figure 7. Fractal dimension of clipped images: (a) Landsat 8, (b) Sentinel-2 (NIR band), and (c) NAIP.
Remotesensing 17 02276 g007
Figure 8. Spatial autocorrelation based on the YOLOv11 model using Landsat 8 PAN imagery.
Remotesensing 17 02276 g008
Figure 9. Hotspot analysis results (Getis-Ord Gi*) based on the actual and predicted number of irrigation systems across selected areas, derived from the YOLOv11 model using Landsat 8 PAN imagery.
Remotesensing 17 02276 g009
Table 1. Specification of satellite and aerial imagery datasets.
DatasetBest Spatial
Resolution (m)
Spectral ResolutionRevisit TimeNumber of Frames
Covering North Dakota
Tile SizeTotal Data Volume (Approx.)
Landsat 8151 band16 days~14185 × 185 km~5 GB
Sentinel-21013 bands5 days~18100 × 100 km~120 GB
NAIP0.64 bands (RGB + NIR)Every 2–3 years~120Varies~500 GB
Disclaimer/Publisher’s Note: The statements, opinions and data contained in all publications are solely those of the individual author(s) and contributor(s) and not of MDPI and/or the editor(s). MDPI and/or the editor(s) disclaim responsibility for any injury to people or property resulting from any ideas, methods, instructions or products referred to in the content.

