Abstract
Floods, exacerbated by climate change, necessitate timely and accurate situational awareness to support effective disaster response. While electro-optical (EO) satellite imagery has been widely employed for flood assessment, its utility is significantly limited under conditions such as cloud cover or nighttime. Synthetic Aperture Radar (SAR) provides consistent imaging regardless of weather or lighting conditions but it remains challenging for human analysts to interpret. To bridge this modality gap, we present diffusion-based SAR-to-EO image translation (DSE), a novel framework designed specifically for enhancing the interpretability of SAR imagery in flood scenarios. Unlike conventional GAN-based approaches, our DSE leverages the Brownian Bridge Diffusion Model to achieve stable and high-fidelity EO synthesis. Furthermore, it integrates a self-supervised SAR denoising module to effectively suppress SAR-specific speckle noise, thereby improving the quality of the translated outputs. Quantitative experiments on the SEN12-FLOOD dataset show that our method improves PSNR by 3.23 dB and SSIM by 0.10 over conventional SAR-to-EO baselines. Additionally, a user study with SAR experts revealed that flood segmentation performance using synthetic EO (SynEO) paired with SAR was nearly equivalent to using true EO–SAR pairs, with only a 0.0068 IoU difference. These results confirm the practicality of the DSE framework as an effective solution for EO image synthesis and flood interpretation in SAR-only environments.
1. Introduction
Floods are among the most frequent and destructive natural disasters worldwide, with their frequency and severity increasing due to climate change [1,2,3]. Effective disaster response hinges on rapid access to reliable geospatial information to assess inundation extent and allocate emergency resources accordingly.
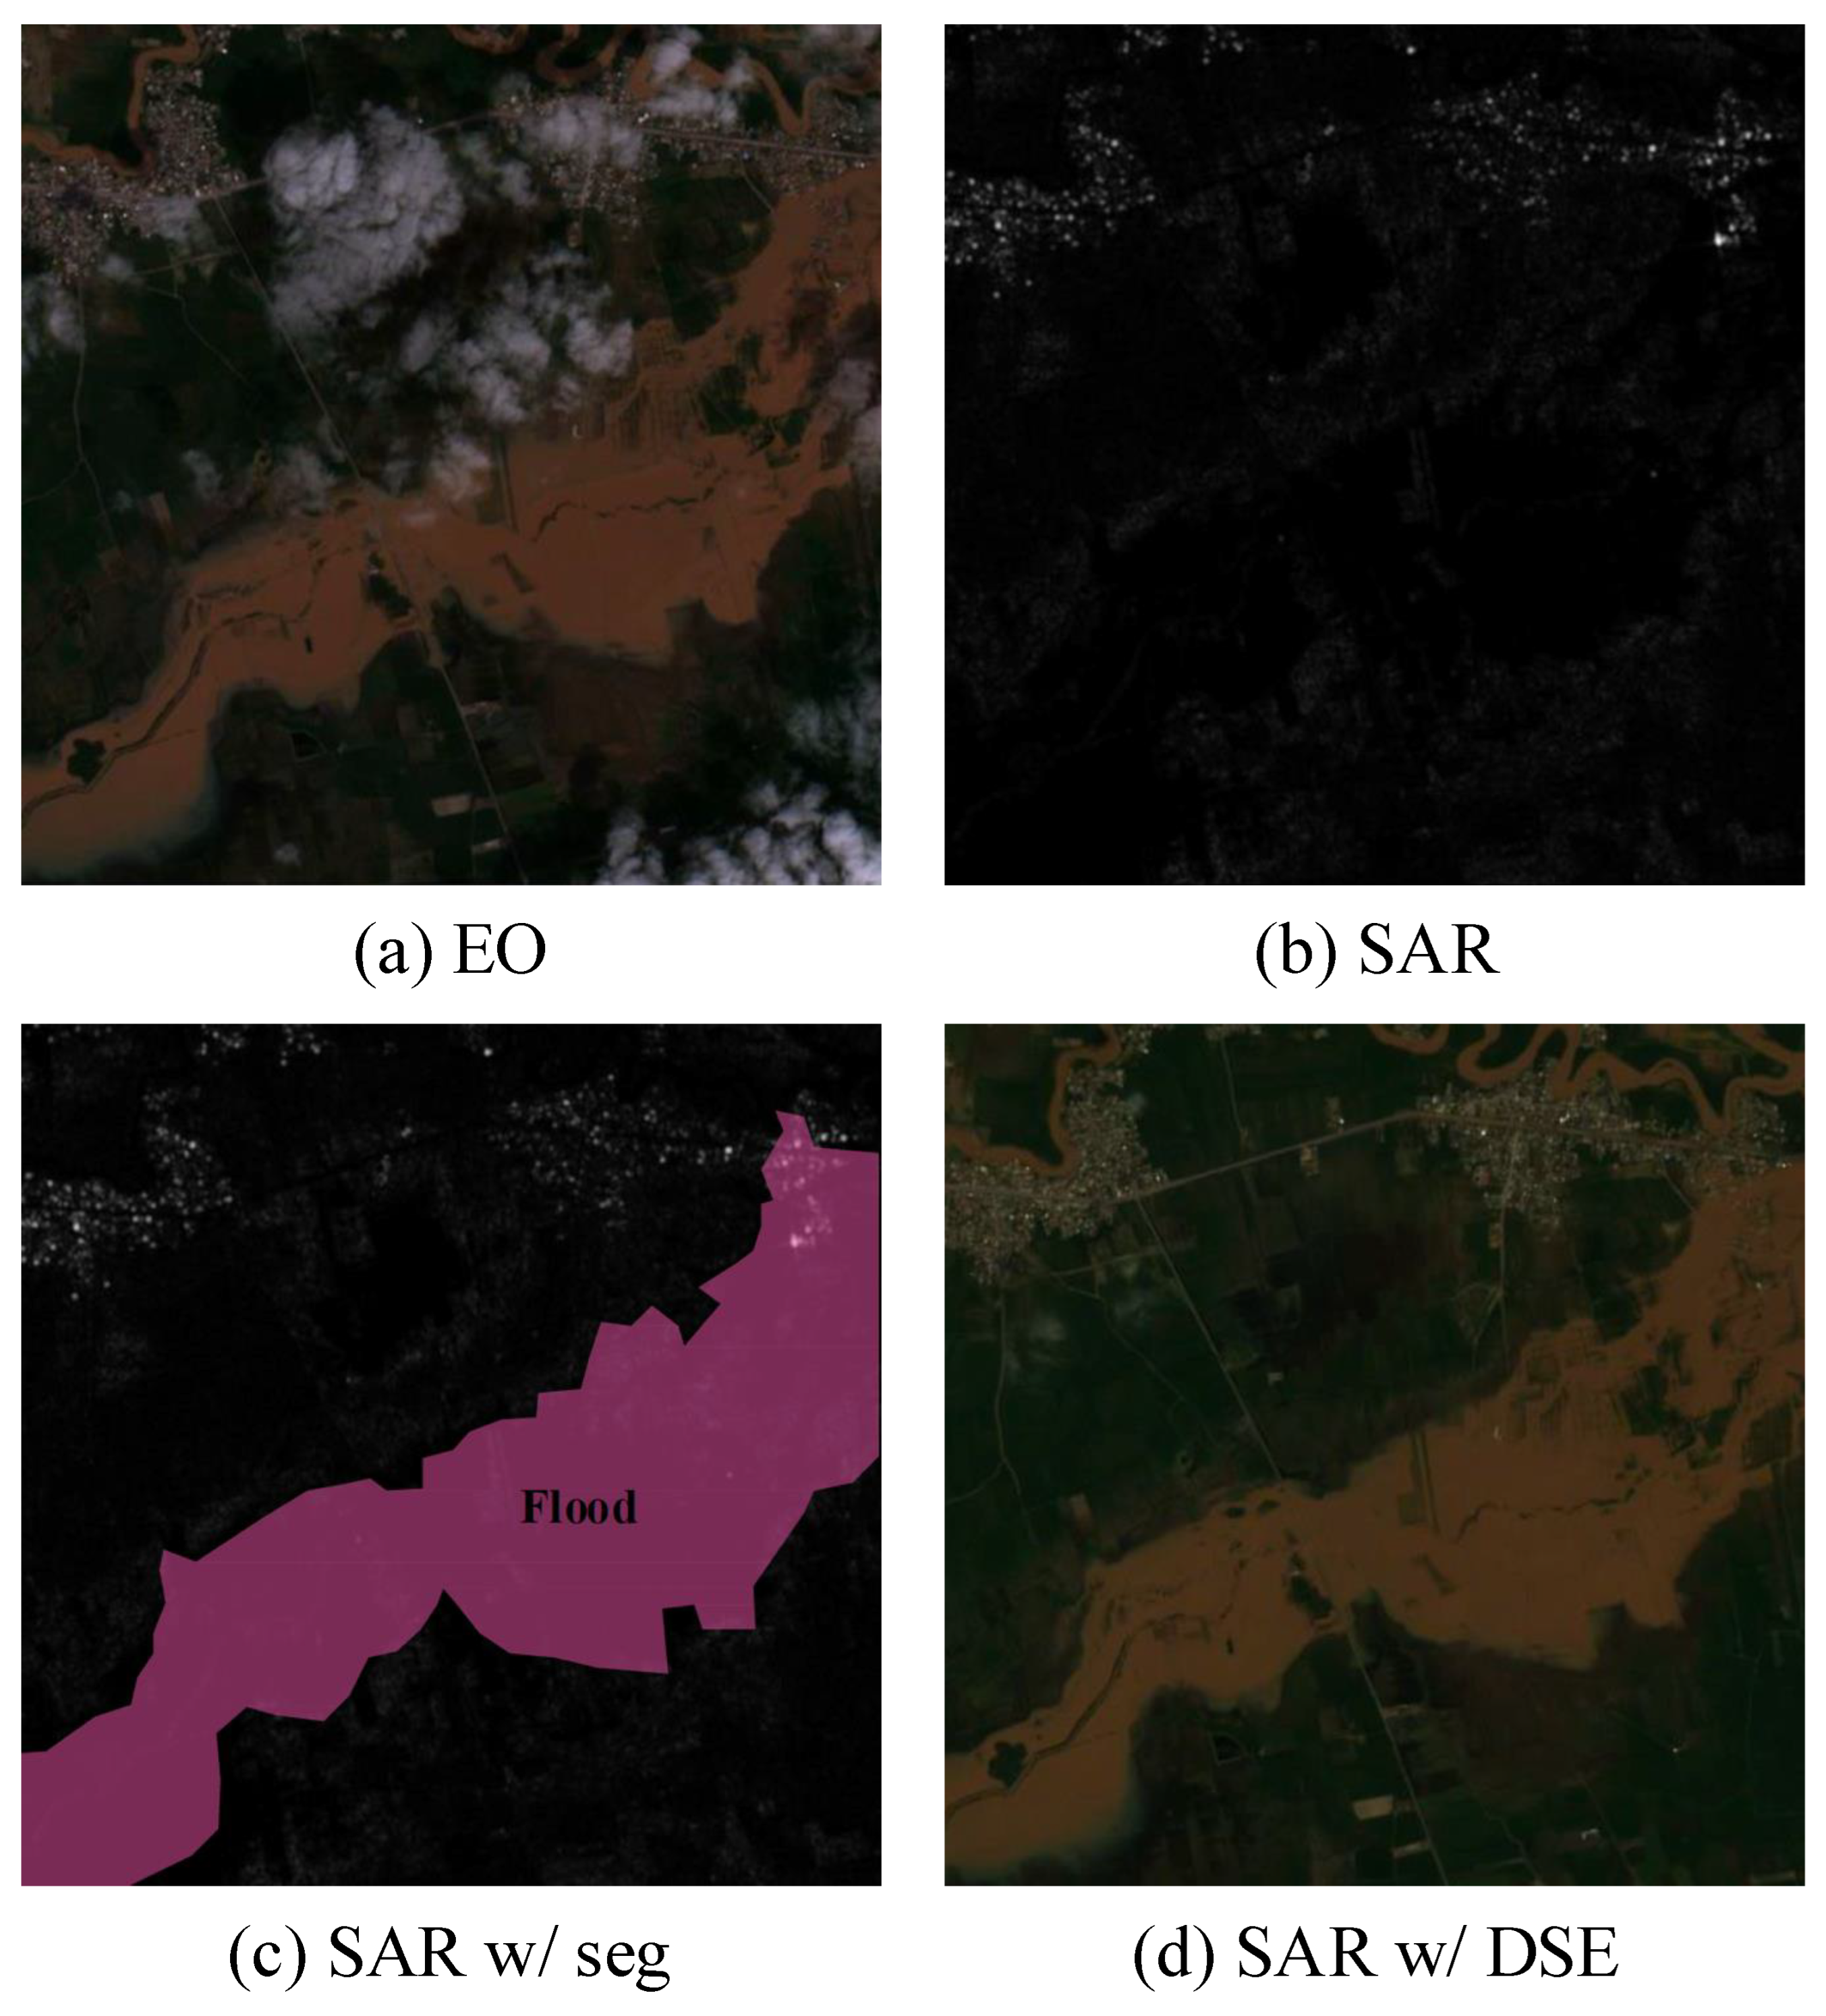
Satellite-based remote sensing provides critical data for flood monitoring. Electro-optical (EO) imagery, in particular, has been widely used in water detection tasks via spectral indices such as NDWI [4] and MNDWI [5]. However, EO observations are fundamentally limited by atmospheric conditions. During floods, cloud cover and low illumination frequently obscure surface features, rendering EO imagery unusable in many real-world scenarios [6]. As shown in Figure 1a, clouds and shadows severely degrade EO visibility, making timely analysis unreliable.
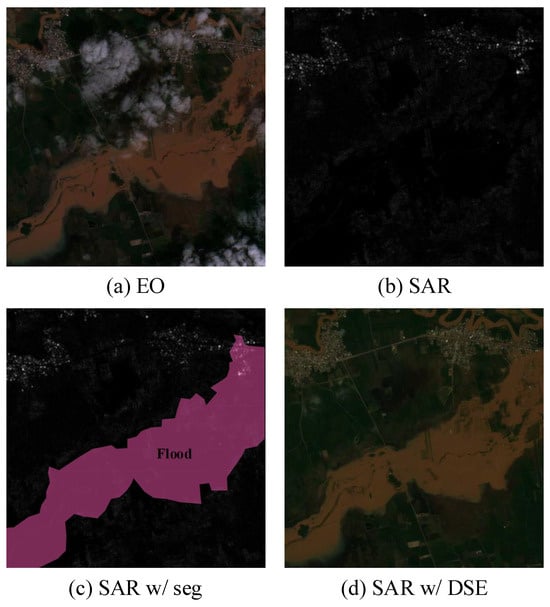
Figure 1.
Examples of EO images and unprocessed SAR images from a flood-affected region. (a) depicts an EO image, (b) shows a SAR image, (c) presents the result of flood area segmentation using SAR imagery, and (d) displays a SynEO sample generated through the DSE framework.
However, as shown in Figure 1b, SAR images often contain interpretation challenges such as speckle noise and low visual familiarity. Consequently, even when a model successfully estimates flooded regions—as illustrated in Figure 1c—it remains difficult for human analysts to confidently verify these predictions without reference to an EO image, such as the one shown in Figure 1a.
To improve SAR interpretability, SAR-to-EO (SAR2EO) image translation has gained interest. Early methods based on Generative Adversarial Networks (GANs) [7,8] demonstrated feasibility but suffered from training instability and inconsistent outputs, particularly in noisy or low-quality SAR scenarios. Moreover, most prior work [9] does not consider flood-specific challenges or human-in-the-loop usage.
Diffusion-based models, particularly the Brownian Bridge Diffusion Model (BBDM) [10], offer improved stability and high-fidelity synthesis in image-to-image translation tasks. Their iterative denoising process makes them especially suited for structured domain mappings such as SAR2EO. However, their application in disaster response, and specifically flood monitoring, remains largely unexplored.
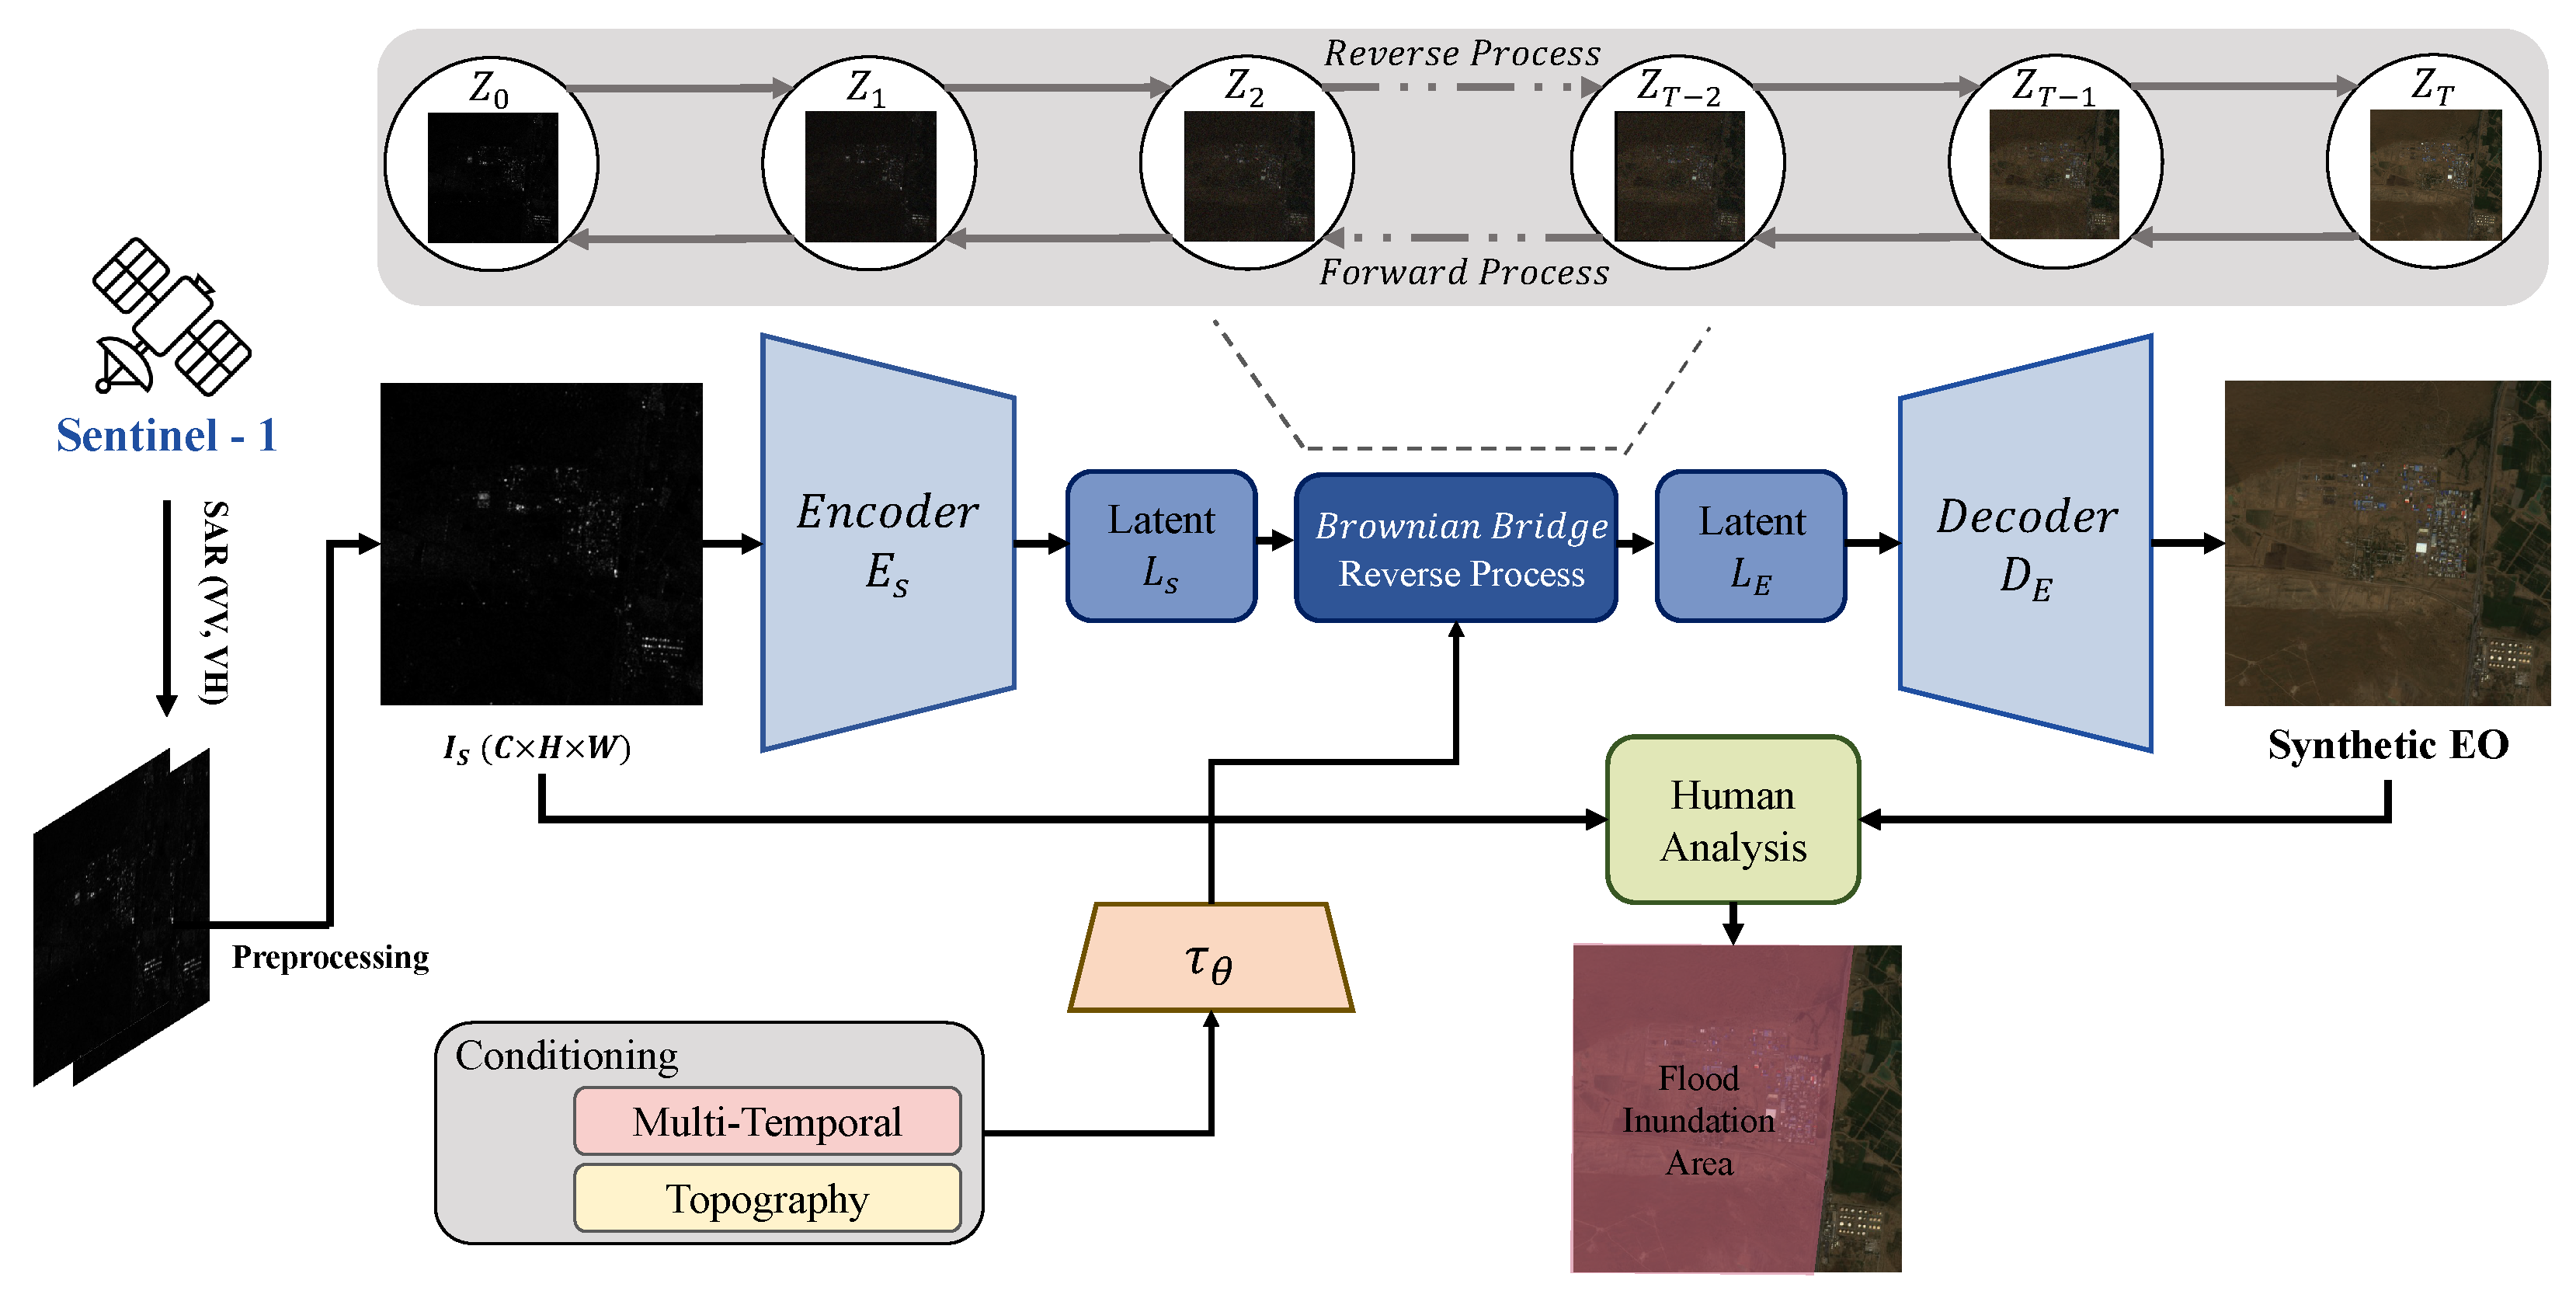
In this work, we propose the diffusion-based SAR-to-EO image translation (DSE) framework, illustrated in Figure 2. DSE leverages BBDM for robust cross-modal synthesis and integrates a blind-spot self-supervised denoising module to suppress SAR-specific noise. The resulting Synthetic EO (SynEO) images are visually aligned with real EO imagery and can support expert interpretation and downstream analysis tasks such as flood segmentation. As shown in Figure 1d, SynEO provides an intuitive, cloud-free visualization that complements SAR, especially when EO data are unavailable.
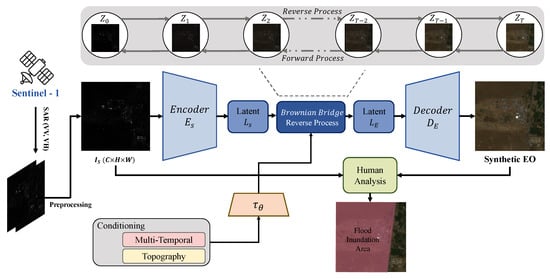
Figure 2.
Overview of the DSE framework. The DSE framework takes in the SAR image, applies a self-supervised denoising method, and then carries out diffusion-based SAR2EO image translation. Subsequently, the generated EO and corresponding SAR images are reviewed by the analysts for the purpose of flood mapping.
We validate our method using two benchmark datasets: Sen1Floods11 [11] and SEN12-FLOOD [12]. Sen1Floods11 offers pixel-aligned SAR–EO pairs with flood annotations, while SEN12-FLOOD provides multi-temporal SAR and EO observations across diverse flood events. Quantitative evaluations show that DSE improves PSNR by 3.23 dB, SSIM by 0.10, and reduces LPIPS by 0.015 compared to baseline models. Furthermore, expert studies reveal that SynEO+SAR achieves flood segmentation performance nearly equivalent to EO+SAR, with only a 0.0068 drop in IoU, confirming its value in EO-limited scenarios.
- Our Contributions.
The main contributions of this work are three-fold:
- We propose DSE, the first diffusion-based SAR-to-EO translation framework explicitly designed for flood monitoring. Built on a Brownian Bridge formulation, DSE delivers stable training and high-fidelity EO synthesis even when optical imagery is completely unavailable at inference time.
- We integrate a blind-spot, self-supervised SAR denoising module directly into the diffusion pipeline, effectively suppressing speckle noise and boosting translation quality by up to 3.23 dB in PSNR and 0.10 in SSIM over conventional SAR2EO baselines.
- We conduct the first large-scale quantitative and human-in-the-loop evaluation on two public flood benchmarks (Sen1Floods11 and SEN12-FLOOD), and we publicly release our code, trained weights, and variance-map visualization tools to establish an open baseline for future SAR-only disaster-response research.
2. Materials and Methods
2.1. Related Work
2.1.1. EO Imagery for Disaster Management
Satellite-based Earth observation (EO) has become an indispensable asset in the domain of disaster risk reduction and management [13,14,15,16,17,18]. The integration of EO data with weather forecasting [19,20,21,22,23,24,25] allows for a comprehensive and proactive approach to hazard detection, enabling governments and organizations to anticipate, prepare for, and respond to disasters with greater speed and accuracy.
EO satellite imagery has been widely utilized to monitor a diverse spectrum of natural and anthropogenic hazards. These include inland flooding [26,27,28], land subsidence due to groundwater extraction or mining activities [29,30,31], landslides triggered by rainfall or seismic activity [32,33,34,35,36,37], and geological phenomena such as earthquakes and volcanic eruptions [38,39,40]. EO imagery has also played a crucial role in wildfire surveillance and damage assessment [41,42,43,44]. Among these hazards, flooding remains one of the most frequent and economically devastating, particularly in regions with dense population or inadequate infrastructure [11].
To support efficient flood monitoring using EO imagery, both traditional and data-driven methodologies have been explored. Classical remote sensing techniques often employ spectral indices, such as the Normalized Difference Vegetation Index (NDVI), the Normalized Difference Water Index (NDWI), and the Modified Normalized Difference Water Index (MNDWI), to distinguish water bodies from land surfaces [28]. These index-based methods are computationally lightweight and interpretable, making them highly practical for large-scale applications and rapid deployments, particularly when timely decision-making is critical [11]. However, their effectiveness may degrade under complex background conditions, such as urban environments or mixed land covers.
To overcome the limitations of rule-based techniques, the community has increasingly turned to supervised machine learning (ML) models. These models have demonstrated significant improvements in classification accuracy and generalizability. Random Forests [45], decision trees [46], Support Vector Machines (SVMs) [47], perceptron models [48], and neural networks [49] have been widely applied to EO imagery for flood detection and mapping tasks. These approaches often utilize multi-spectral or multi-temporal features to capture dynamic patterns in flood evolution. Nonetheless, their dependency on annotated ground truth data presents a challenge, especially in regions with limited historical records or where rapid labeling is infeasible during emergencies.
Moreover, EO systems are inherently constrained by environmental and atmospheric conditions. Optical sensors on EO satellites are susceptible to interference from cloud cover, shadows, and nighttime imaging conditions [50]. These limitations are especially problematic during extreme weather events, where real-time, uninterrupted observation is critical. Consequently, while EO provides high-resolution and multi-spectral information, its operational effectiveness for disaster management is significantly compromised in scenarios where visibility is reduced.
Recent advances in EO processing include the integration of deep learning architectures, such as convolutional neural networks (CNNs) and vision transformers (ViTs), trained on large-scale annotated datasets. These models are capable of capturing complex spatial patterns and learning hierarchical representations of flood extents [11]. Additionally, efforts to fuse EO data with auxiliary sources such as meteorological models, hydrological simulations, or crowd-sourced information have been explored to enhance temporal continuity and predictive performance.
2.1.2. SAR Imagery for Disaster Management
In contrast to optical EO systems, Synthetic Aperture Radar (SAR) provides a powerful alternative modality for Earth observation, particularly in disaster management scenarios where optical imagery may be unavailable or unreliable. SAR systems utilize active microwave signals to generate high-resolution images regardless of solar illumination or weather conditions, offering all-weather, day-and-night imaging capabilities [28]. This makes SAR an essential complement to EO systems, particularly for real-time disaster response in regions prone to frequent cloud cover or in high-latitude areas where sunlight may be limited.
SAR imagery has proven to be particularly effective in detecting and characterizing flood events [50,51,52,53,54]. The sensitivity of SAR backscatter to surface roughness and dielectric properties allows it to differentiate between inundated and non-inundated areas, even in vegetated terrains. Furthermore, its ability to penetrate canopy layers provides a critical advantage in regions where EO systems struggle due to vegetation occlusion.
Beyond flooding, SAR has also been extensively used for landslide mapping [55,56,57,58], tsunami impact assessment [59,60,61], and earthquake-induced surface deformation analysis using interferometric SAR techniques [62,63,64].
An important technical limitation of EO imagery lies in the spatial resolution trade-off between different spectral bands. Near-infrared (NIR) and shortwave infrared (SWIR) bands—often used in water detection—typically offer lower spatial resolution compared to visible bands, leading to suboptimal performance in high-resolution flood delineation tasks. SAR, by contrast, maintains high spatial consistency across its frequency bands, making it more suitable for fine-grained water body detection and change analysis [65].
For flood detection, SAR-based thresholding techniques have historically provided simple yet robust baseline methods [66]. These techniques leverage changes in backscatter intensity to identify inundated regions, often using pre- and post-event image differencing or time-series analysis. In recent years, more advanced machine learning and deep learning approaches have been introduced, which exploit spatial patterns, temporal trends, and even polarimetric SAR features for improved classification accuracy [67]. These methods demonstrate better generalization across different geographical regions and hydrological contexts, addressing one of the major limitations of heuristic-based approaches.
Furthermore, multi-source data fusion strategies combining SAR and EO imagery are gaining traction as a means of leveraging the complementary strengths of each modality. Techniques such as data-level fusion (e.g., image stacking), feature-level fusion (e.g., concatenation of learned embeddings), and decision-level fusion (e.g., ensemble models) have been employed to achieve more robust and comprehensive flood mapping outputs. These hybrid systems are particularly effective in scenarios where partial EO data is available, thereby mitigating the impact of cloud-induced data gaps.
2.1.3. SAR-to-EO Image Translation
Despite the promising performance of SAR-based models, they possess an intrinsic limitation: SAR images are inherently difficult to interpret due to speckle noise and the fundamentally different data representation compared to EO imagery. These interpretation challenges often necessitate annotated data for effective analysis [68,69]. As recent disaster monitoring approaches increasingly rely on neural networks, which are inherently data-driven [50,70], the scarcity of high-quality, labeled SAR datasets has become a critical bottleneck limiting the potential of SAR in various applications. To mitigate the interpretability issue of SAR imagery, several visualization techniques have been explored. The most straightforward methods include contrast enhancement techniques such as histogram equalization [71] and threshold-based normalization approaches [72]. While these techniques help in identifying the general structure of a scene, they still fall short in conveying fine-grained details essential for disaster assessment. A direct approach to enhance SAR interpretability is speckle noise reduction [73], which has shown effectiveness in specific environments but lacks general applicability. Consequently, recent research has proposed SAR-to-EO image translation techniques, motivated by the fact that EO images are more intuitive and accessible for human interpretation [74].
Among these, image translation models based on Generative Adversarial Networks (GANs) have been widely studied [68,75]. However, GAN-based approaches often suffer from mode collapse and instability during training, which can significantly compromise the quality of the generated images. This instability often manifests as visual artifacts, a lack of fine-grained detail, or limited diversity in the generated outputs, directly impacting the reliability and accuracy required for critical applications like flood extent mapping and damage assessment.
To overcome these limitations, we propose a novel framework, diffusion-based SAR-to-EO image translation (DSE), which leverages the advanced capabilities of diffusion models. In contrast to GANs, our DSE framework is characterized by superior training stability and a reduced susceptibility to mode collapse, thereby ensuring the generation of higher-fidelity and more consistent EO-like images from SAR inputs. This inherent robustness of diffusion models is particularly vital for real-world disaster monitoring, where accurate and reliable visual information is paramount for effective response and analysis. To the best of our knowledge, this work is among the first to systematically apply advanced diffusion models for SAR-to-EO image translation, specifically targeting flood disaster monitoring, providing a robust generative approach that addresses the noted challenges of SAR interpretability and data scarcity.
2.1.4. Diffusion Models
Diffusion models have recently emerged as a powerful class of generative models, attracting considerable attention in the machine learning community [76]. These models generate data through a series of sequential denoising steps. Initially conceptualized as a Markov chain with additive Gaussian noise, diffusion models are now more commonly interpreted within the framework of stochastic differential equations (SDEs). An important advancement in this area is the discovery that such SDEs have an equivalent formulation as ordinary differential equations (ODEs), known as Probability Flow (PF) ODEs, as introduced by [77].
While diffusion models have achieved remarkable success in unconditional image generation tasks, their application to conditional generation, particularly for complex image translation tasks, has presented distinct challenges [78]. Standard diffusion models may struggle with precisely controlling the output given a specific input, or require substantial computational resources for direct, high-resolution translation. To address these limitations in image translation, the Brownian Bridge Diffusion Model (BBDM) [10] proposed a novel approach that models the stochastic process in latent space using a Brownian Bridge formulation. This method allows for more structured and controllable translation between image domains by defining a fixed trajectory between a starting point (source image) and an end point (target image).
In the field of satellite imagery, diffusion models have also gained traction due to their superior generative performance and flexibility [79]. Crucially, unlike Generative Adversarial Networks (GANs), which often suffer from training instability and mode collapse—leading to synthesized images that may lack detail or diversity (as discussed in Section 2.1.3)—diffusion models inherently offer more stable training dynamics and produce higher-fidelity outputs with greater consistency. This makes them particularly well-suited for critical applications like SAR-to-EO image translation in flood disaster monitoring, where the accuracy and reliability of the generated visual information are paramount. Our proposed method leverages these powerful generative capabilities of diffusion models, specifically adopting the Brownian Bridge formulation, to enhance the interpretability and quality of SAR images for effective disaster assessment. For a detailed description of our proposed framework and its implementation, we refer the reader to the subsequent sections.
2.1.5. Self-Supervised SAR Denoising
Synthetic Aperture Radar (SAR) imagery is inherently susceptible to speckle noise, a granular interference that significantly impedes visual interpretation and subsequent processing. Traditional denoising methodologies [80,81,82], primarily relying on statistical models or pre-defined filters, often exhibit limitations in effectively addressing complex and spatially varying noise patterns. Recent advancements in deep learning have spurred the development of sophisticated denoising techniques, with particular emphasis on self-supervised learning approaches that eliminate the need for paired noisy-clean image datasets. For instance, Noise2Void [83] presents an approach that learns and removes noise from single noisy images by assuming each pixel is corrupted by noise independent of its neighbors. Similarly, Noise2Self [84] demonstrates robustness against diverse noise distributions by leveraging pixel dependencies to identify and eliminate noise. Furthermore, various blind-spot network-based methodologies, such as the Multi-Modality Blind-Spot Network (MM-BSN) [85], exploit the intrinsic statistical properties within an image to disentangle noise from true content, proving effective across a wide range of noise characteristics. In this study, we integrate a dedicated self-supervised SAR denoising module within our proposed DSE framework. This integration facilitates the learning and removal of noise characteristics directly from the input SAR imagery, thereby obviating the requirement for external denoised SAR datasets. Consequently, this module enables the synthesis of cleaner and more accurate EO-like images in the subsequent SAR-to-EO translation stage. Unlike many existing SAR-to-EO translation studies that either overlook denoising or relegate it to a separate, preliminary processing step, our approach internalizes the denoising process within the unified framework, thereby maximizing the overall efficiency and performance.
2.2. Method
In this section, we first provide a brief overview of the Brownian Bridge Diffusion Model (BBDM) [10], which forms the foundation of our proposed diffusion-based SAR-to-EO image translation (DSE) framework. We then describe the pre-processing steps, model architecture, and the core components of the framework. The overall structure of the proposed DSE framework is illustrated in Figure 2. In particular, since the reverse process in DSE is identical to that of BBDM, we omit a detailed explanation of the reverse process in this paper.
2.2.1. Brownian Bridge Diffusion Model (BBDM)
Given two datasets, and , from domains A and B, respectively, the objective of image-to-image translation is to learn a function that maps an image from domain A to domain B. While numerous methods based on conditional diffusion models have been proposed for this task, many of them are not inherently designed for direct image-to-image translation. These models typically operate by transforming random noise into an image and often involve complex attention-based conditioning mechanisms, which lack clear theoretical guarantees. In contrast, BBDM offers a principled diffusion-based formulation specifically tailored for image-to-image translation, without relying on such intricate conditioning schemes.
Following the original BBDM, we also operate in the latent space of a pretrained VQGAN [86]. Let denote a pair of training samples from and , respectively. For simplicity, we refer to their latent representations as and , where and are the respective latent encoders. The forward diffusion process of the Brownian Bridge is defined as
where T is the total number of diffusion steps and is the variance at time step t.
This forward diffusion process describes only the marginal distribution at each time step t, as shown in (1). However, for training and inference, it is also necessary to infer the stepwise forward transition probability . In discrete form, the intermediate states can be calculated as follows:
where .
In contrast to general generative tasks, diversity is less critical in SAR-to-EO translation. The goal is not to generate varied styles or textures, but rather to produce images that closely align with the actual EO image or match the training distribution of EO imagery. To reflect this objective, we modify the diffusion process: instead of sampling from the standard normal distribution , we draw it from the target distribution. Additionally, in the reverse process, we scale the noise component by a factor of (i.e., ). This adjustment shifts the model behavior from generative sampling toward deterministic prediction, which is more suitable for the SAR-to-EO translation task.
2.2.2. Pre-Processing
SAR images are inherently affected by speckle noise due to the coherent nature of their acquisition process. This phenomenon can be mathematically represented as a multiplicative noise model:
where Y denotes the observed SAR intensity image, X is the underlying clean (speckle-free) image, and N represents the multiplicative speckle noise.
Typically, the noise component N is assumed to follow a Gamma distribution with a mean of 1 and a variance of , where L denotes the number of looks in the multi-look processing. The corresponding probability density function is given by
where is the Gamma function. This model provides a more comprehensive understanding of the statistical characteristics of speckle noise in SAR imagery.
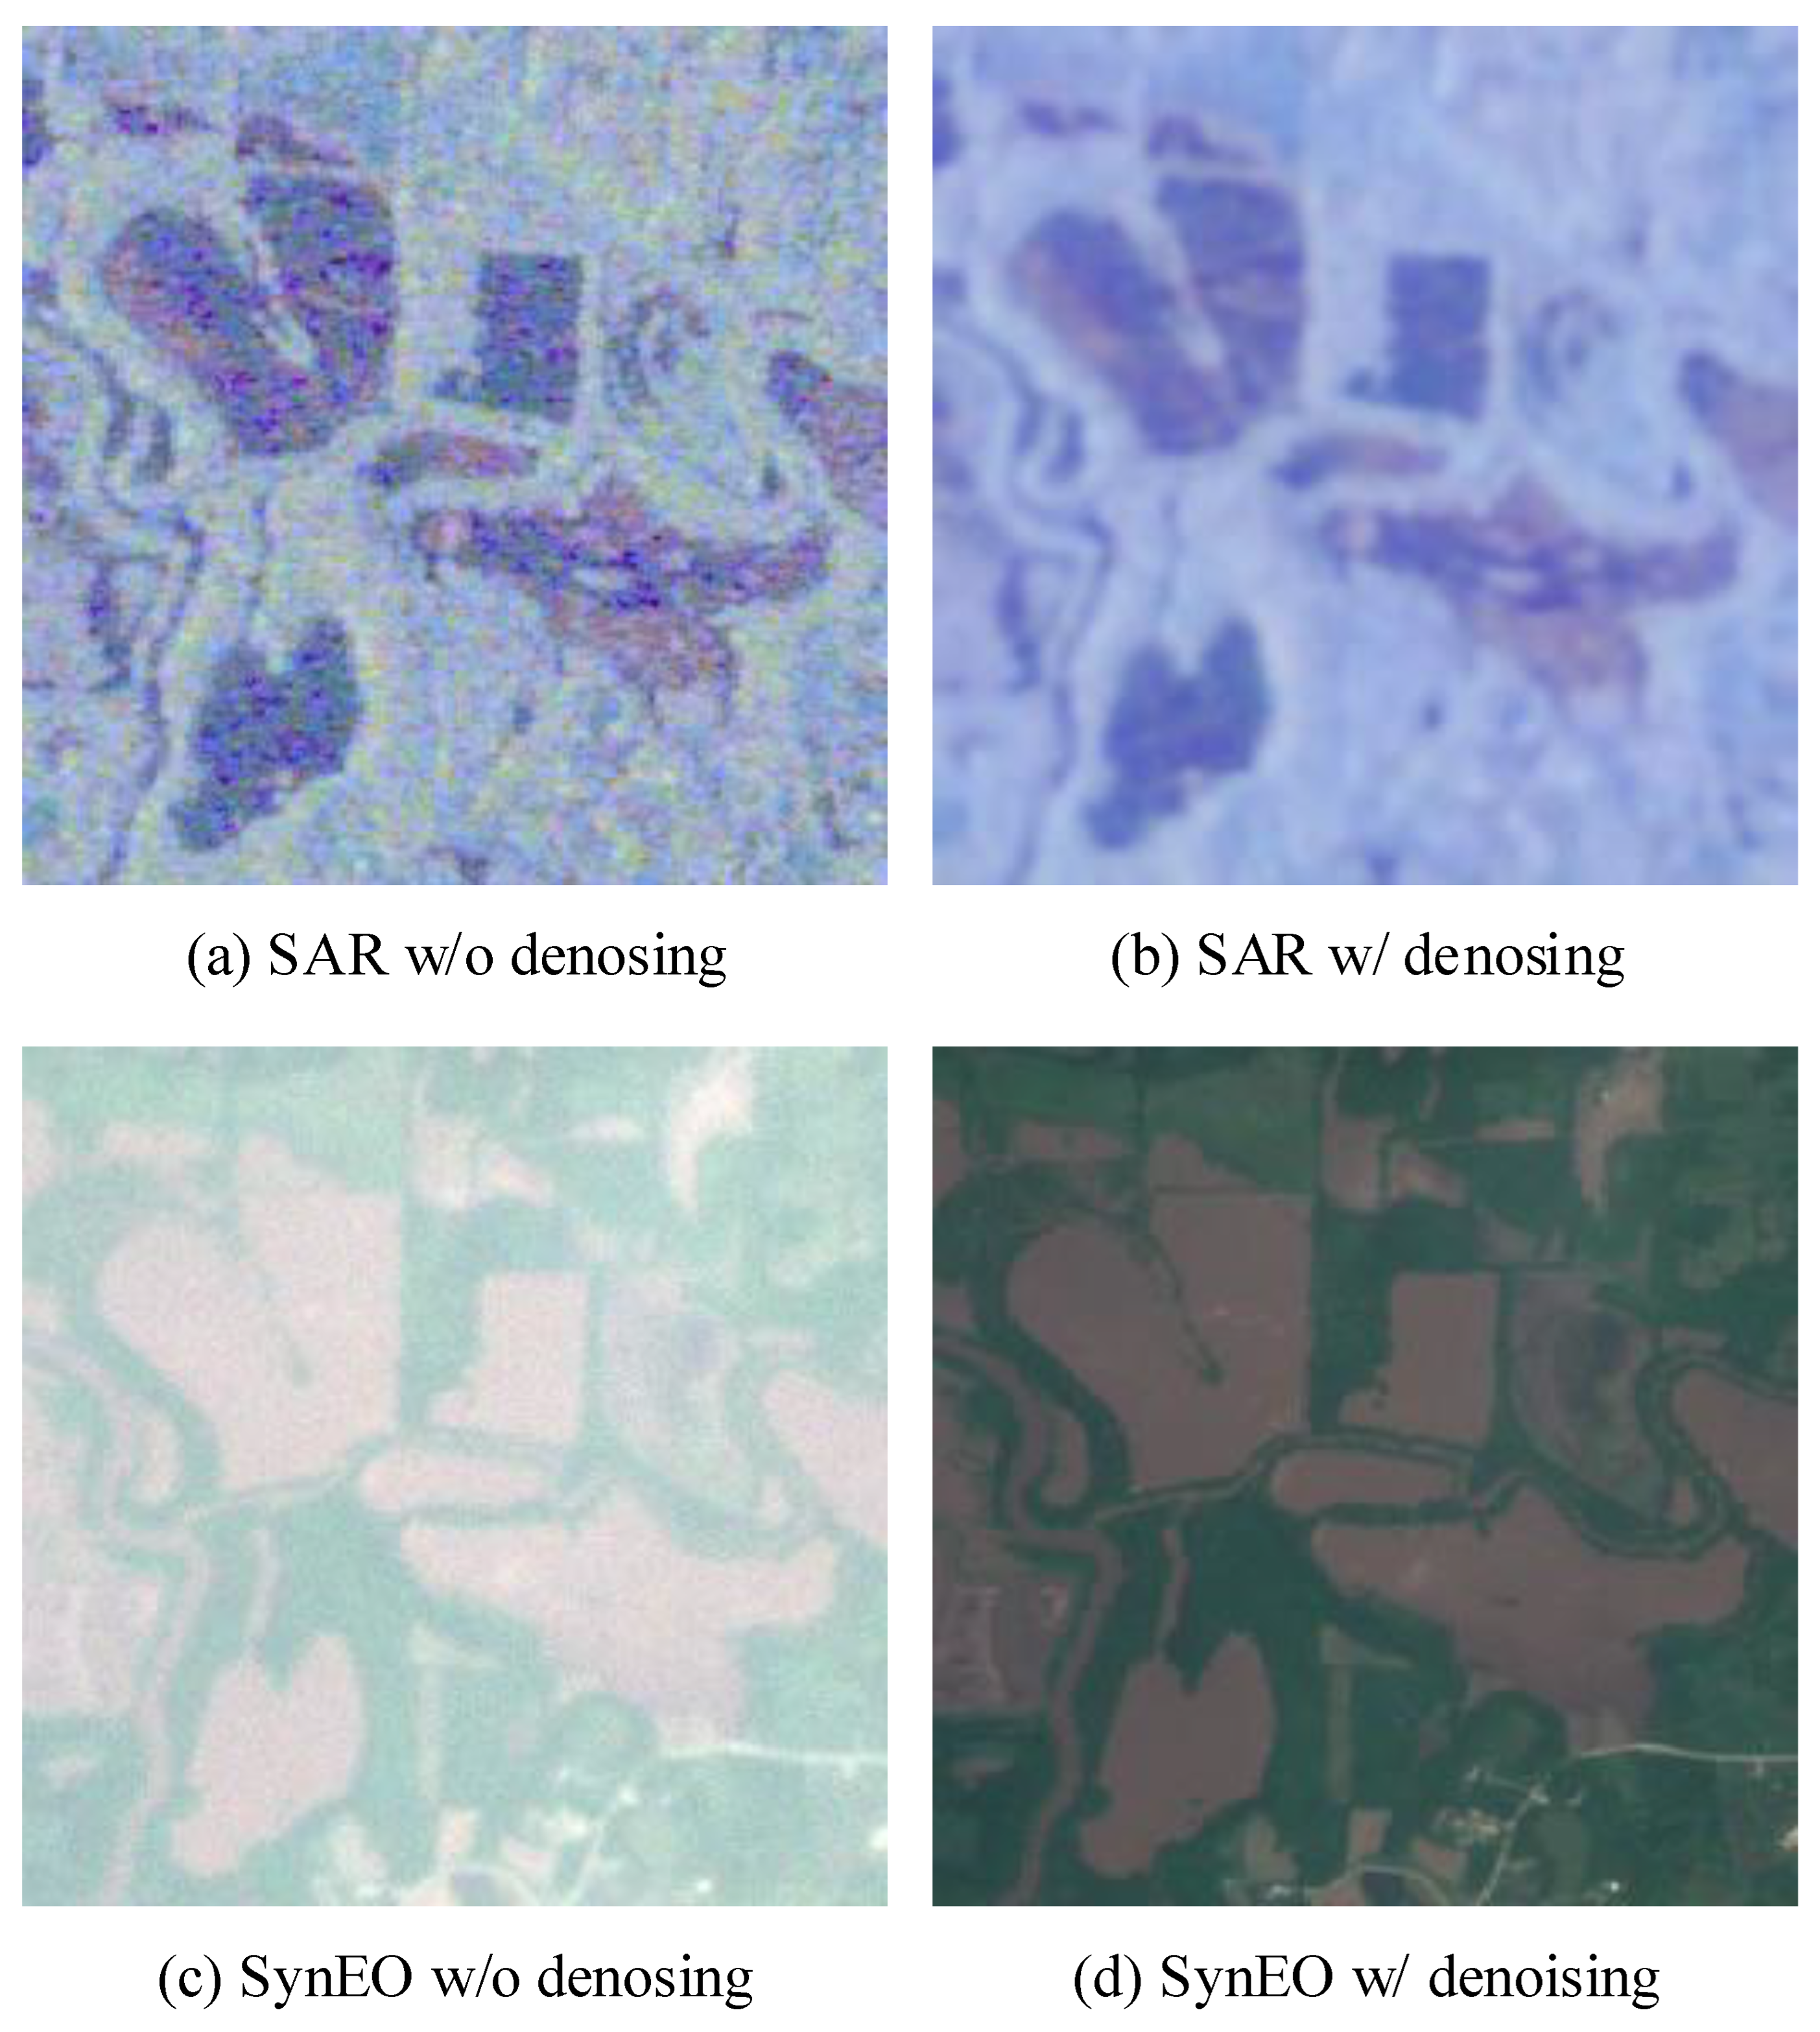
The DSE framework, which is based on a diffusion-driven image-to-image translation model, aims to predict both the SAR image and the artificial noise introduced during the forward diffusion process. However, the model may encounter difficulty distinguishing between the intrinsic speckle noise (as described in Equation (6)) and the artificial noise injected during the forward diffusion. As a result, residual noise may remain even after the application of the DSE model, as illustrated in Figure 3b.

Figure 3.
Qualitative comparison between original SAR images (denoted as “w/o denoising”) and SAR images denoised using the self-supervised method (denoted as “w/ denoising”).
To address this issue, we apply a blind-spot-based self-supervised denoising technique to the SAR image prior to using it in the image-to-image translation pipeline. Conventional blind-spot methods assume that the noise is independent of the clean image [87], a condition that does not hold for SAR data due to the multiplicative nature of the noise model in Equation (5). To overcome this limitation, we adopt the method proposed in [85], a variant of blind-spot approaches that utilizes diverse convolutional kernels to adapt to non-independent noise conditions.
Figure 3a,c show the SAR image and the corresponding SAR-to-EO translation result obtained using the DSE framework, both without applying any denoising. In contrast, Figure 3b,d illustrate the denoised SAR input using the method from [85] and the corresponding translation result with the denoised input. This comparison highlights the effect of SAR denoising on the quality of EO synthesis within the proposed framework.
2.2.3. SAR-to-EO Image Translation via the DSE Framework
Figure 2 presents a schematic overview of the proposed diffusion-based SAR-to-EO (DSE) framework. The input consists of dual-polarized SAR data, specifically the VV and VH channels, which are combined into a 3-channel image represented as (VV, VH, (VV+VH)/2). This composite image is subsequently denoised using the blind-spot self-supervised method described in Section 2.2.2, aiming to reduce the influence of speckle noise inherent in SAR imagery.
The denoised image is then passed through the DSE model, which is based on a diffusion process, to generate a synthetic optical (SynEO) image. This translated image is intended to approximate the characteristics of real EO imagery, thereby enhancing the interpretability of the SAR data.
Finally, the SynEO image is paired with the original SAR image and presented to SAR experts. This paired visualization offers an enriched perspective on flood-affected areas, providing additional context that supports more accurate and confident evaluations of flood extent and severity.
3. Results and Discussion
In this section, we present experimental results on two benchmark flood datasets— Sen1Floods11 [11] and SEN12-FLOOD [12]—to evaluate the effectiveness of the proposed DSE framework. The Sen1Floods11 dataset is notably characterized by a high frequency of cloud cover, whereas SEN12-FLOOD, a multi-temporal dataset, contains relatively fewer cloudy scenes. For both datasets, cloud removal was performed using the QA60 cloud masking method [88] prior to experimentation to ensure fair evaluation.
3.1. Training and Test Datasets
The Sen1Floods11 [11] dataset used in our SAR-to-EO translation task comprises Sentinel-1 SAR and Sentinel-2 optical images capturing flood events, collected via Google Earth Engine. The dataset covers 11 distinct flood events across 6 continents, 14 biomes, and 357 ecoregions, including regions such as Cambodia, Spain, and Bolivia, ensuring diverse geographic representation. Ground truth flood maps were generated by applying threshold-based methods. The data was divided into 512 × 512 pixel tiles, of which 446 tiles were manually annotated and reserved for validation purposes. The remaining data was split randomly into training, validation, and test sets with a 60-20-20 ratio. For weakly supervised training, both labeled and unlabeled Sentinel-1 and Sentinel-2 data were used.
The SEN12-FLOOD [12] dataset was utilized for semantic segmentation and qualitative evaluation. This dataset consists of 336 time-series samples, including paired Sentinel-1 and Sentinel-2 images, capturing areas that experienced significant flooding during the winter season of 2019. The data spans from December 2018 to May 2019, and covers regions in East Africa, Southwest Africa, the Middle East, and Australia. Each time series comprises multiple 512 × 512 tiles extracted from corresponding acquisitions, enabling temporal flood analysis across diverse geographic locations.
Importantly, as our model does not synthesize clouds, cloud-free images of equivalent volume were carefully selected for the test set to ensure fair evaluation. Evaluating on EO images affected by clouds would lead to an inherently biased comparison, as the presence of clouds severely degrades the visibility and quality of EO data, whereas the synthesized outputs from our model remain unaffected. Moreover, cloud-contaminated EO images often obscure critical surface information, making it difficult or even impossible to accurately delineate flooded regions. As a result, performing reliable flood segmentation on such images is not feasible. Therefore, to enable a meaningful and balanced assessment between real and generated EO images, only cloud-free scenes were included in the test set.
3.2. Evaluation Metrics
To evaluate the performance of the proposed method, we adopted different metrics for the two main tasks involved. For the flood segmentation task, we employed standard classification metrics including F1-score, precision, recall, and Intersection over Union (IoU). For the image-to-image translation task, we utilized the Peak Signal-to-Noise Ratio (PSNR), Structural Similarity Index Measure (SSIM), and Learned Perceptual Image Patch Similarity (LPIPS).
It is important to note that PSNR, which measures pixel-wise similarity, may not yield fully meaningful insights in this context due to the absence of color information in SAR images. Therefore, SSIM and LPIPS were included to capture structural and perceptual similarities, respectively.
Although the SAR-to-EO translation task involves deterministic ground truth paired with input data, low PSNR or SSIM values do not necessarily imply erroneous model outputs. Given that SAR and EO images capture fundamentally different physical characteristics—owing to their distinct spectral ranges—there may exist multiple plausible EO representations for a single SAR input, and vice versa. This inherent ambiguity underscores the importance of incorporating LPIPS as a complementary perceptual metric to better reflect the fidelity of translated images from a human visual perspective.
3.3. Implementation Details
The proposed DSE framework consists of two primary components: a pretrained VQGAN model [86] and our newly introduced diffusion-based SAR-to-EO (SAR2EO) model. VQGAN is particularly effective at reducing computational overhead and accelerating inference, making it a suitable choice for constructing an efficient diffusion model. To this end, we adopted the VQGAN architecture utilized in the Latent Diffusion Model (LDM) [89].
For the diffusion process, we set the number of Brownian Bridge time steps to 1000 during training and used 200 sampling steps at inference, which we found to offer a favorable trade-off between generation quality and computational efficiency. Our baseline implementation was based on the official BBDM codebase (https://github.com/xuekt98/BBDM, accessed on 30 June 2025), and all unspecified hyperparameters followed the configurations used in BBDM [10].
For the flood segmentation task, we employed a U-Net model with a ResNet-34 backbone, sourced from an open-source repository (https://github.com/qubvel/segmentation_models.pytorch, accessed on 30 June 2025). All hyperparameters were retained as per the default configuration provided by the repository.
3.4. Quantitative Results
3.4.1. Flood Segmentation
Table 1 presents a quantitative comparison of flood segmentation results using SAR, EO, and SynEO imagery. As shown, segmentation based solely on SAR data yields the lowest performance across recall, F1-score, and IoU metrics. This underperformance is primarily attributed to the irregular patterns of flood regions in the single-temporal SAR setting used in our experiments, in contrast to the more stable patterns obtainable through multi-temporal SAR as employed in previous works [90]. It is also important to note that even when pixel intensities appear similar across different SAR images, they may correspond to entirely different objects or surface types.

Table 1.
Comparison of precision, recall, F1-score, IoU, and accuracy of flood segmentation results for different modalities for the SEN12-FLOOD dataset. In the metrics, 0 is the performance when detecting a background, and 1 is the performance when detecting a flood. Also, in the modalities, the + sign means that each image is concatenated to a channel axis.
The highest segmentation performance is achieved using EO images alone. This result is expected, as the evaluation was conducted on a cloud-free test set. Consequently, EO images offered the clearest and most accurate visual representation of the ground truth flood conditions.
Although segmentation performance using SAR + SynEO is slightly lower than using EO alone, the IoU improves to 0.555, which represents an increase of nearly 30 points compared to using SAR alone. This highlights the added value of SynEO images generated by the DSE framework. Given that EO data is often unavailable at night or under cloudy conditions, these results suggest that SynEO can serve as a viable and informative substitute, offering segmentation performance comparable to clear-sky EO imagery.
3.4.2. Image-to-Image Translation
Table 2 presents the experimental results on the test subset of the SEN12-FLOOD dataset, with cloud-covered and void pixels excluded, to evaluate the performance of the proposed DSE framework in SAR-to-EO image synthesis. It is important to highlight that the SAR and EO imagery in the SEN12-FLOOD dataset are not perfectly temporally aligned. To address this, we selected EO data from the date closest to the reference SAR acquisition.
Table 2.
Comparison results of the DSE framework with the commonly employed SAR2EO baselines, pix2pixHD, using a test set derived from the SEN12-FLOOD dataset, where missing or cloud-affected data points have been excluded.
As illustrated in Table 2, the DSE framework outperforms all baseline models across PSNR, SSIM, and LPIPS metrics, indicating its superior capability in high-fidelity image translation. In particular, the best performance was achieved when the input comprises multi-temporal SAR data that are spatially registered but temporally unaligned. These findings demonstrate the robustness of the DSE framework under such realistic and challenging conditions.
Unfortunately, the current dataset does not include topographic information, preventing us from evaluating the framework under terrain-informed scenarios. In future work, we plan to incorporate topographic priors as an additional condition to further enhance model accuracy and contextual understanding.
3.4.3. Performance Comparison of SAR Image Denoising
Synthetic Aperture Radar (SAR) images inherently suffer from speckle noise, significantly limiting their interpretability and downstream analytical effectiveness, especially in disaster monitoring and assessment scenarios.
To address this challenge, we employed the proposed MM-BSN framework for self-supervised denoising. Unlike conventional supervised approaches, MM-BSN leverages self-supervision, eliminating the need for paired clean–noisy datasets, which are often challenging to obtain in SAR applications.
As illustrated in Table 3, The MM-BSN method achieves superior denoising performance compared to representative self-supervised baselines such as Noise2Void [83] and Noise2Self [84]. Specifically, MM-BSN attains a Peak Signal-to-Noise Ratio (PSNR) of 27.25 and Structural Similarity Index Measure (SSIM) of 0.695, outperforming these comparative methods.
Table 3.
Quantitative comparison with self-supervised denoising methods.
The primary reason for MM-BSN’s superior performance is its utilization of multiple diverse kernels, making it particularly suitable for the complex speckle noise patterns characteristic of SAR imagery. This demonstrates MM-BSN’s capability in effectively suppressing speckle noise, thereby enhancing SAR image interpretability and its suitability for practical remote sensing applications.
3.4.4. Human Analysis
Table 4 presents flood mapping results obtained by SAR experts using (EO, SAR) and (SynEO, SAR) image pairs. As shown, while EO imagery can provide valuable visual information, its utility is often limited in operational scenarios due to obstructions such as clouds, shadows, and adverse atmospheric conditions. In contrast, SynEO images—synthesized exclusively from SAR data—offer a practical alternative when EO imagery is unavailable or compromised.
Table 4.
Comparison of flood detection by SAR experts using pairs of EO and SAR images versus pairs of SynEO and SAR images. Note that this value represents the average result of flood mapping performed by five SAR experts.
Remarkably, despite being generated without any optical input, SynEO images, when paired with SAR, result in segmentation performance that is nearly equivalent to that achieved using true EO–SAR pairs, with only a marginal IoU difference of 0.0068. This finding highlights the potential of SynEO to effectively supplement SAR data, enabling robust flood detection even in SAR-only settings. Importantly, this suggests that in environments where only SAR is accessible, the use of SynEO can significantly bridge the performance gap traditionally addressed by multisensor fusion. Nevertheless, it should be noted that SynEO is not intended to replace EO imagery when high-quality EO–SAR data pairs are available, as its synthetic nature may entail predictive uncertainties. Within the proposed framework, SynEO serves as an auxiliary modality to augment SAR-based interpretation under conditions of limited or degraded EO availability.
3.5. Qualitative Results
3.5.1. Image-to-Image Translation
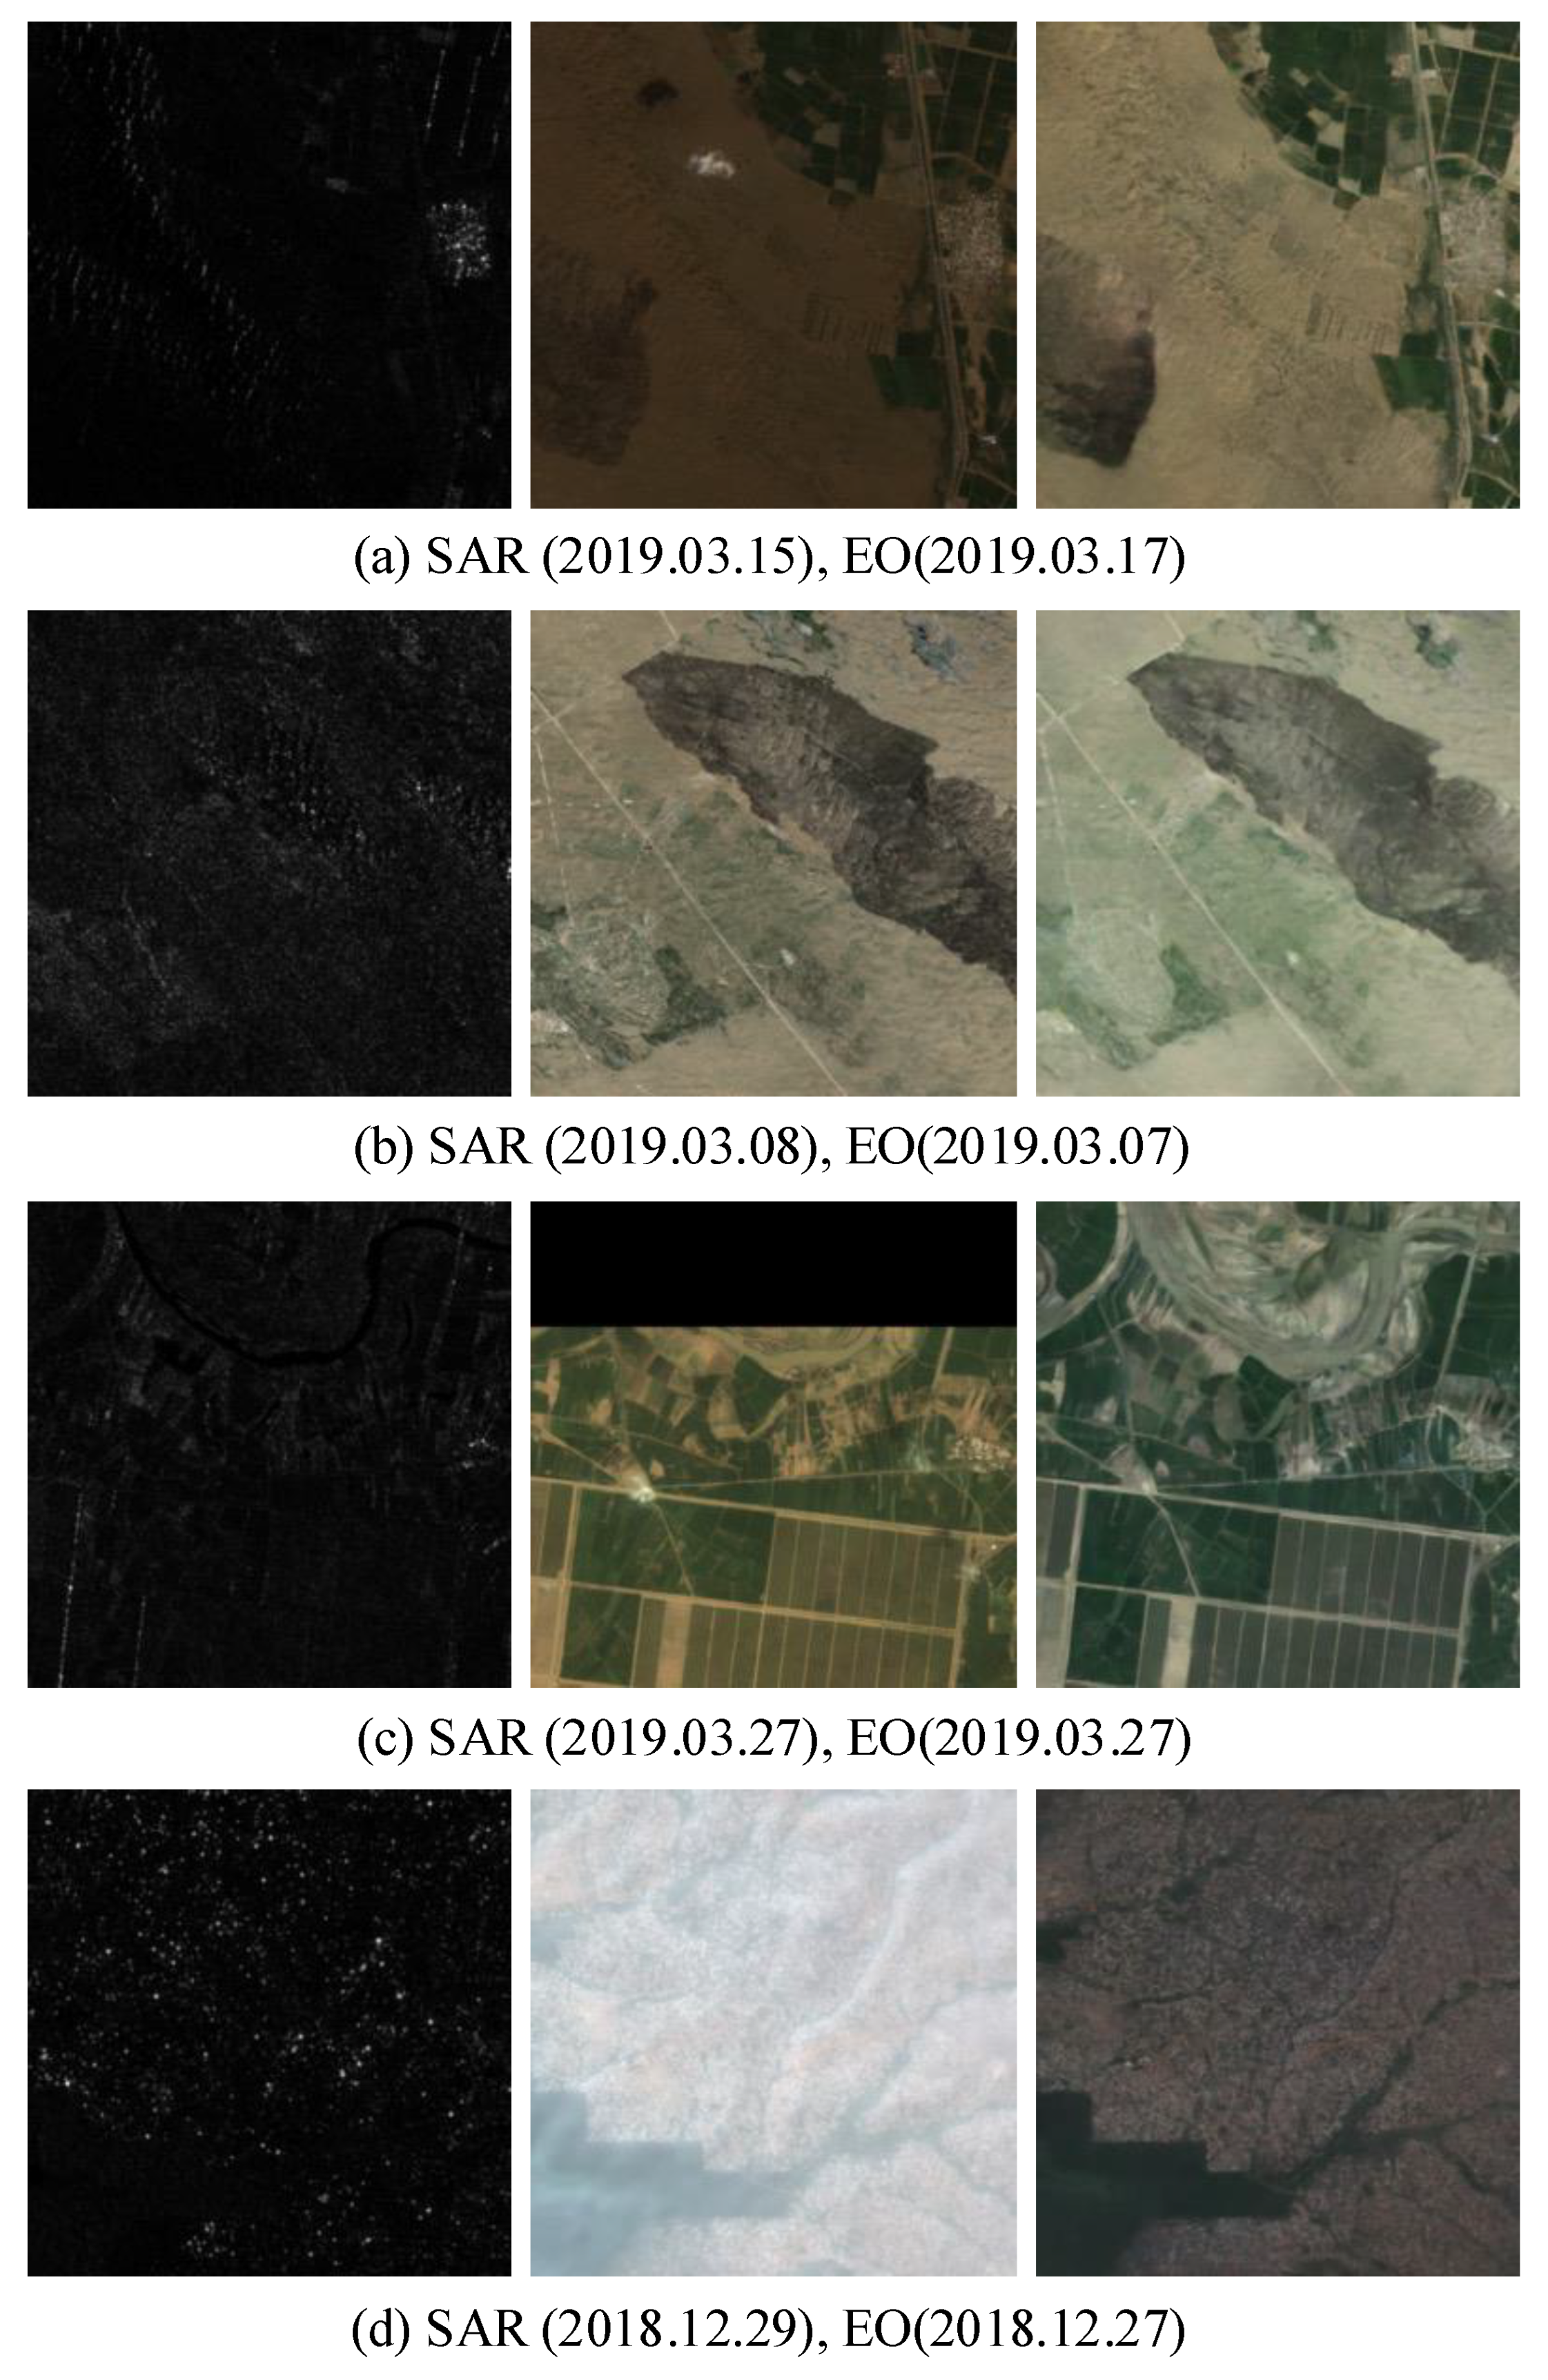
Figure 4 illustrates the application of the DSE framework on the SEN12-FLOOD dataset. Given that the SAR and EO images in this dataset are not always temporally aligned, EO images with the closest acquisition dates were selected for both training and inference.
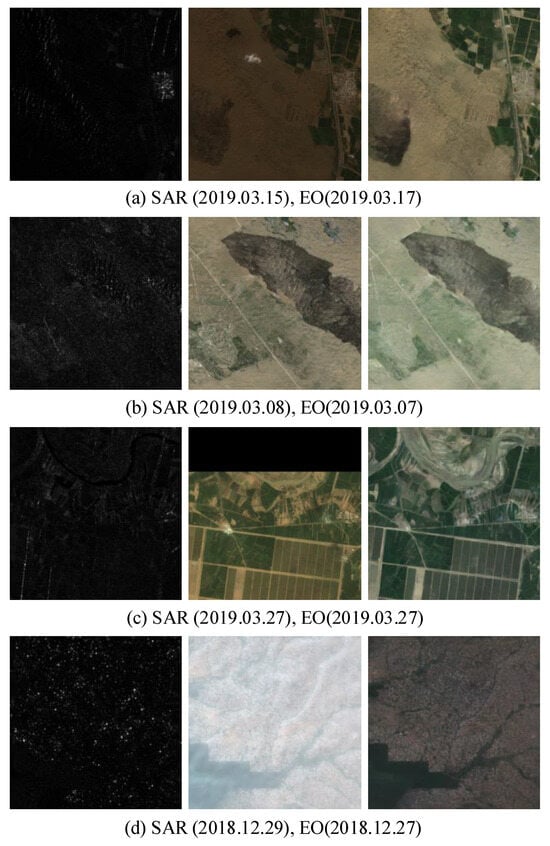
Figure 4.
Results of applying the DSE framework on the SEN12-FLOOD dataset. From left to right: SAR, EO, and Synthetic EO (Note that SAR image is a (VV, VH, (VV + VH)/2) 3-channel image, but it is visualized as a gray scale).
As depicted in the figure, the DSE framework demonstrates the ability to generate synthetic EO (SynEO) images with notable visual clarity. In particular, Figure 4a shows that the flood-affected regions are accurately represented, notably without the introduction of clouds or cloud shadows. Moreover, Figure 4c highlights the framework’s advantage in handling missing data; while the original EO image exhibits loss of information in the upper portion, the corresponding SynEO image derived from SAR data preserves structural integrity across the entire scene. Finally, as observed in Figure 4d, the generated image effectively mitigates the haze that is apparent in the original EO image, thereby enhancing overall visual quality.
3.5.2. Human Analysis
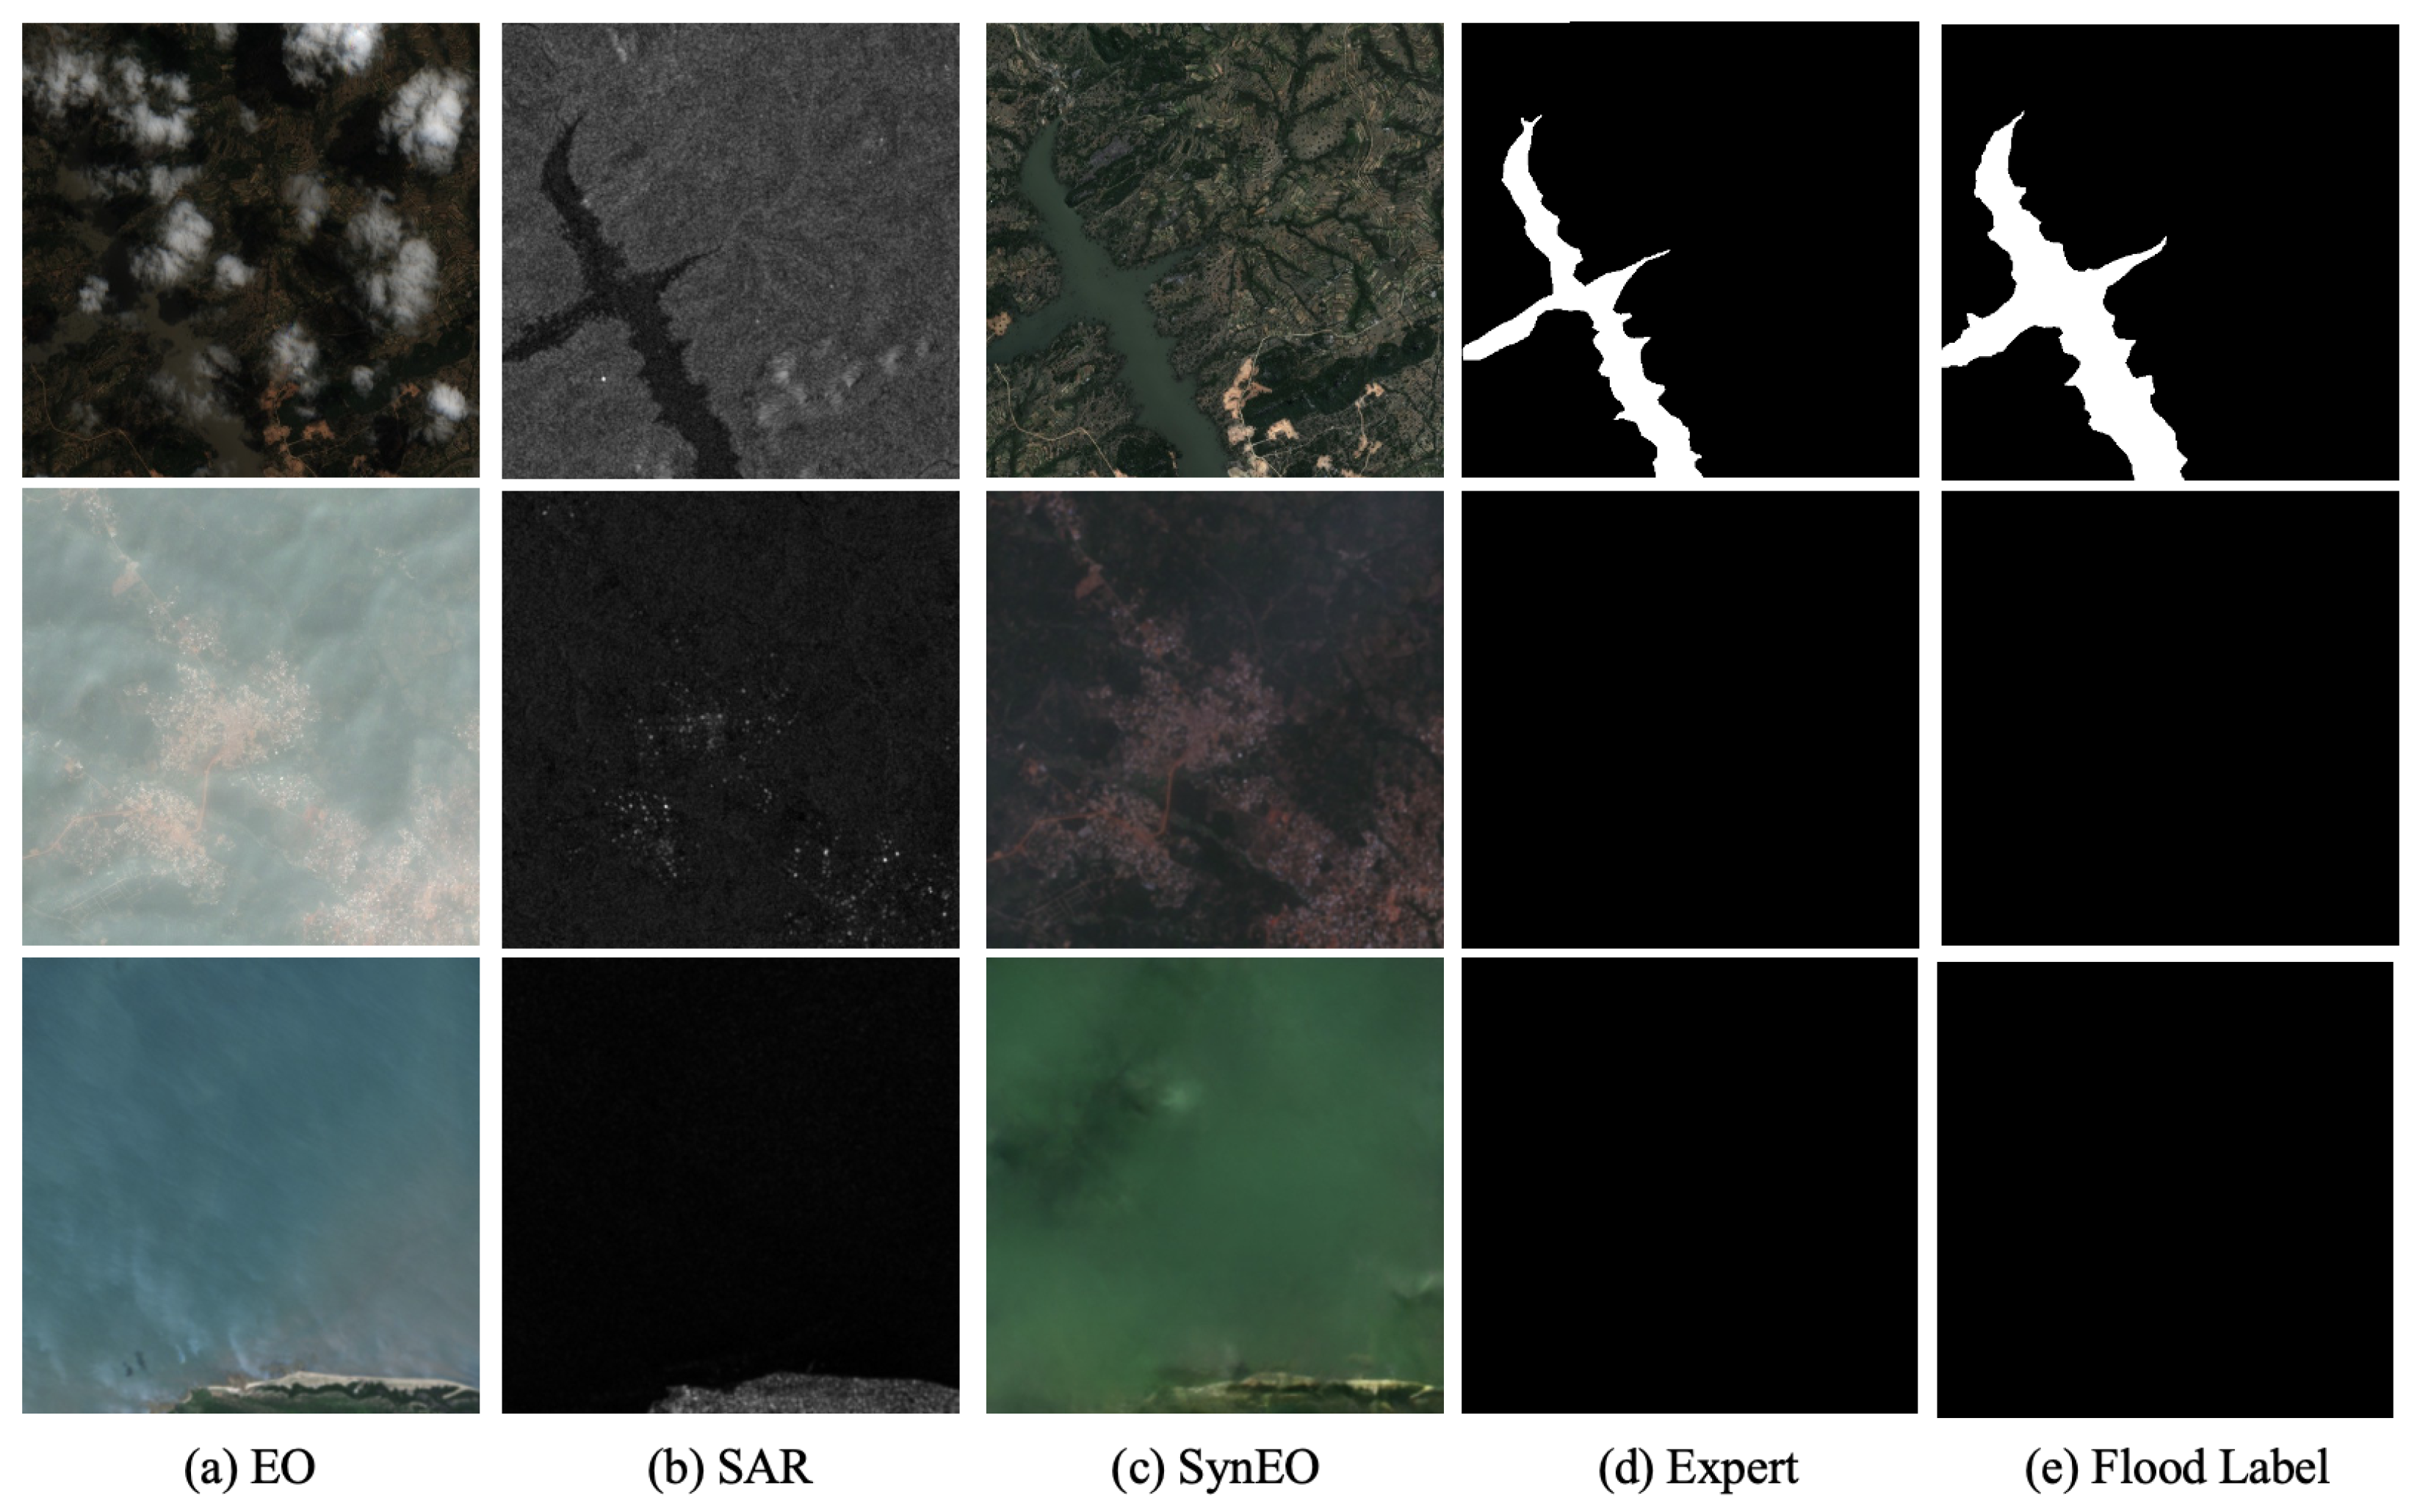
Figure 5 presents a qualitative comparison of flood mapping results derived from (SynEO and SAR) and (EO and SAR) image pairs, as interpreted by SAR experts. As illustrated in the figure, the use of EO imagery becomes notably limited under adverse atmospheric conditions such as cloud cover and fog. Additionally, flood delineation based solely on SAR imagery presents inherent challenges due to the nature of SAR backscatter. Specifically, SAR images often display low-intensity returns over open water surfaces or extremely flat terrain where radar signals are specularly reflected, and in densely vegetated areas where signals are subject to volumetric scattering.
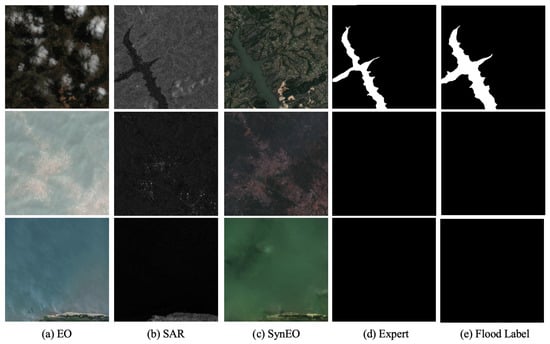
Figure 5.
Comparison of flood detection by SAR experts using pairs of EO and SAR images versus pairs of SynEO and SAR images. Please note that we provided SAR experts with both three-channel SAR images (VV, VH, (VV + VH)/2) and one-channel images simultaneously. The SAR images included in the figure have been identified by SAR experts as being more conducive to their analyses.
In such cases, the SynEO images serve as a valuable supplementary source, providing enhanced visual cues to aid SAR experts in interpreting flood extent. As shown in the figure, SynEO enhances interpretability by offering EO-like visual information without being hindered by atmospheric interference, thereby improving the accuracy and efficiency of expert analysis.
3.5.3. Variance Map
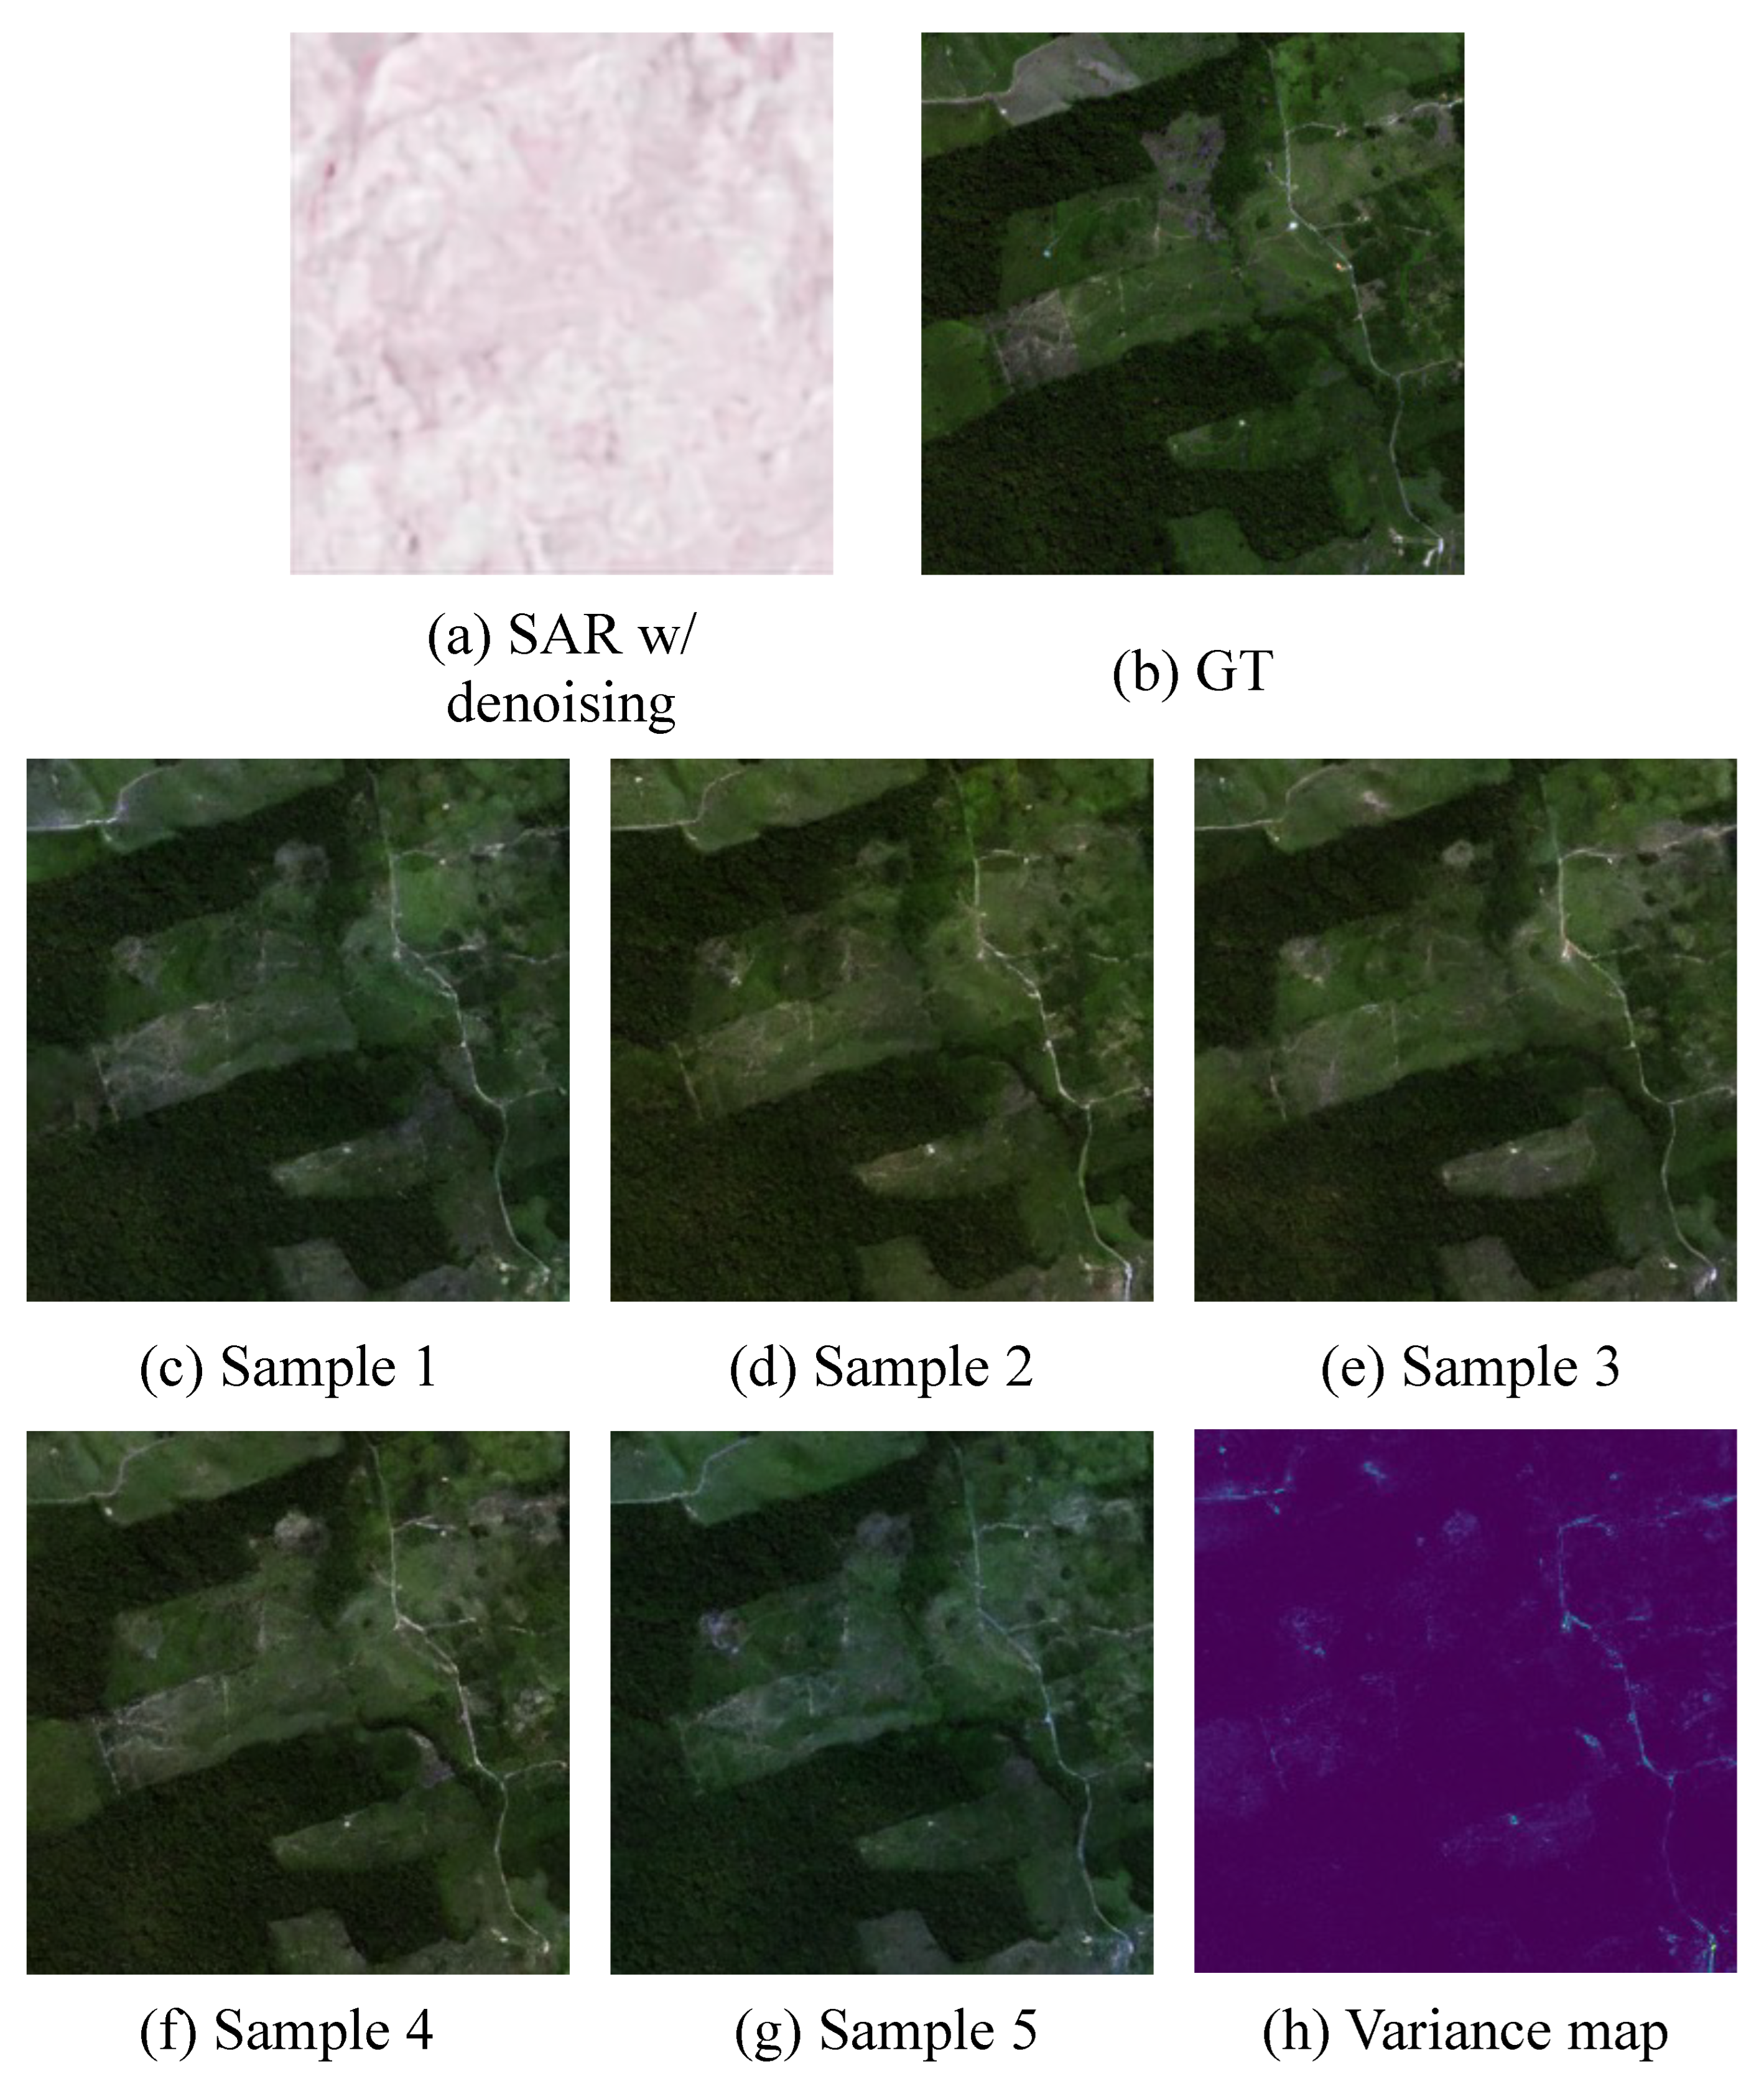
Distinct from existing models, the proposed DSE framework represents the first diffusion-based approach for SAR-to-EO (SAR2EO) translation. This characteristic enables it to generate multiple diverse samples from a single SAR input. While the overarching objective of the SAR2EO task is to synthesize real-time EO-like (SynEO) images that align closely with SAR observations, the absence of actual EO data introduces challenges in determining the reliability of specific regions within the generated imagery.
As illustrated in Figure 6, the DSE framework not only produces multiple plausible SynEO samples but also facilitates the generation of a variance map (Figure 6h), which quantifies the uncertainty across these samples. This variance map provides a valuable interpretive cue: regions exhibiting low variance across samples are likely to be more reliable, while high-variance regions warrant cautious interpretation, with greater reliance on the original SAR data.
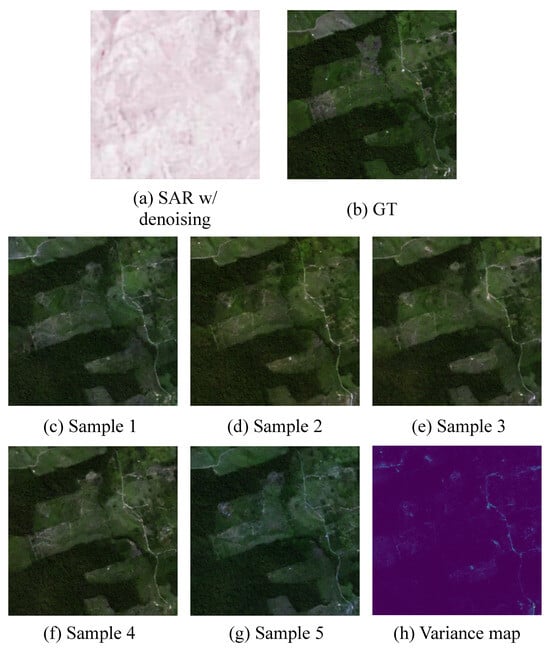
Figure 6.
Examples of various outputs generated by the proposed DSE framework. (a) shows the denoised input SAR image, (b) presents the ground truth EO image paired with the SAR input, (c–g) depict multiple synthetic EO samples generated from the SAR input using the DSE framework, and (h) illustrates the pixel-wise variance map computed from the five synthetic samples, highlighting spatial uncertainty (the variance map was normalized to the 0–1 range for analysis).
This capability offers a notable advantage in expert analysis, allowing practitioners to make more informed decisions by selectively weighing SAR and SynEO information. We believe this property highlights the potential of the DSE framework in advancing the reliability and usability of SAR2EO models.
3.6. Limitation
In this study, we proposed the DSE framework to enhance human interpretability of Synthetic Aperture Radar (SAR) imagery. However, the current implementation of the DSE framework depends heavily on spatially aligned and temporally close pairs of SAR and electro-optical (EO) images for effective image-to-image translation. Although explicit flood annotations are unnecessary, obtaining and precisely aligning such paired datasets is technically demanding and resource-intensive. This dependency significantly restricts the practical scalability and increases the overall cost of the proposed method.
3.7. Future Work
To mitigate these limitations, our future work will explore developing a more cost-effective variant of the DSE framework by utilizing unpaired image-to-image translation techniques for SAR-to-EO synthesis. Additionally, we plan to investigate the integration of multi-temporal and topographic information to further enhance the SAR-to-EO translation capabilities, which was not covered in the current experiments. Furthermore, we aim to extend the DSE framework beyond flood detection and apply it to a wider variety of disaster scenarios, such as earthquakes and wildfires, thus broadening its applicability in remote sensing-based disaster management and response.
4. Conclusions
In this paper, we proposed a diffusion-based SAR-to-EO image translation (DSE) framework to enhance human interpretability in flood analysis. The DSE framework addresses two critical challenges. First, although EO imagery is intuitive and convenient for visual interpretation and labeling, it is often unusable under cloud cover or during nighttime. Second, while deep learning-based SAR flood detection approaches have been developed to overcome this limitation, they typically require a large amount of labeled flood data, which is costly and time-consuming to obtain.
To leverage the complementary strengths of EO and SAR imagery, we introduced the DSE framework—a SAR-to-EO translation method that supports more effective human analysis in flood scenarios. We evaluated the proposed approach on the Sen1Floods11 and SEN12-FLOOD datasets, demonstrating both quantitatively and qualitatively that DSE significantly improves analysis outcomes. We believe that our findings can facilitate the broader adoption of SAR-to-EO frameworks in flood detection and disaster response.
Author Contributions
Conceptualization, M.S. and J.J.; methodology, M.S.; software, M.S. and J.J.; validation, M.S. and J.J.; formal analysis, M.S.; investigation, J.J. and D.-G.C.; resources, D.-G.C.; data curation, J.J.; writing—original draft preparation, M.S.; writing—review and editing, J.J. and D.-G.C.; visualization, M.S.; supervision, D.-G.C.; project administration, M.S.; funding acquisition, D.-G.C. All authors have read and agreed to the published version of the manuscript.
Funding
This work was supported by the National Research Foundation of Korea (NRF) grant funded by the Korean government (MSIT) (No. RS-2023-NR076879).
Data Availability Statement
The SEN12-FLOOD dataset used in this study is openly available from the IEEE DataPort at https://ieee-dataport.org/open-access/sen12-flood-sar-and-multispectral-dataset-flood-detection (accessed on 30 June 2025). The Sen1Floods11 dataset, which was used in conjunction with SEN12-FLOOD for model training and evaluation, is publicly available on GitHub at https://github.com/cloudtostreet/Sen1Floods11?tab=readme-ov-file (accessed on 30 June 2025).
Conflicts of Interest
Author Minseok Seo and Dong-Geol Choi was employed by the company AntLAB. The remaining authors declare that the research was conducted in the absence of any commercial or financial relationships that could be construed as a potential conflict of interest.
References
- Allan, R.P.; Hawkins, E.; Bellouin, N.; Collins, B. IPCC, 2021: Summary for Policymakers. 2021. Available online: https://www.ipcc.ch/report/ar6/wg1/downloads/report/IPCC_AR6_WGI_SPM.pdf (accessed on 30 June 2025).
- Rohde, M.M. Floods and droughts are intensifying globally. Nat. Water 2023, 1, 226–227. [Google Scholar] [CrossRef]
- Rentschler, J.; Salhab, M.; Jafino, B.A. Flood exposure and poverty in 188 countries. Nat. Commun. 2022, 13, 3527. [Google Scholar] [CrossRef] [PubMed]
- McFeeters, S.K. The use of the Normalized Difference Water Index (NDWI) in the delineation of open water features. Int. J. Remote Sens. 1996, 17, 1425–1432. [Google Scholar] [CrossRef]
- Xu, H. Modification of normalised difference water index (NDWI) to enhance open water features in remotely sensed imagery. Int. J. Remote Sens. 2006, 27, 3025–3033. [Google Scholar] [CrossRef]
- Tay, C.W.; Yun, S.H.; Chin, S.T.; Bhardwaj, A.; Jung, J.; Hill, E.M. Rapid flood and damage mapping using synthetic aperture radar in response to Typhoon Hagibis, Japan. Sci. Data 2020, 7, 100. [Google Scholar] [CrossRef]
- Isola, P.; Zhu, J.Y.; Zhou, T.; Efros, A.A. Image-to-image translation with conditional adversarial networks. In Proceedings of the IEEE Conference on Computer Vision and Pattern Recognition, Honolulu, HI, USA, 21–26 July 2017; pp. 1125–1134. [Google Scholar]
- Zhu, J.Y.; Park, T.; Isola, P.; Efros, A.A. Unpaired image-to-image translation using cycle-consistent adversarial networks. In Proceedings of the IEEE International Conference on Computer Vision, Venice, Italy, 22–29 October 2017; pp. 2223–2232. [Google Scholar]
- Ju, J.; Noh, H.; Kim, M.; Choi, D.G. 1st Place Solution to MultiEarth 2023 Challenge on Multimodal SAR-to-EO Image Translation. arXiv 2023, arXiv:2306.12626. [Google Scholar]
- Li, B.; Xue, K.; Liu, B.; Lai, Y. BBDM: Image-to-image Translation with Brownian Bridge Diffusion Models. arXiv 2022, arXiv:2205.07680. [Google Scholar]
- Bonafilia, D.; Tellman, B.; Anderson, T.; Issenberg, E. Sen1Floods11: A georeferenced dataset to train and test deep learning flood algorithms for sentinel-1. In Proceedings of the IEEE/CVF Conference on Computer Vision and Pattern Recognition Workshops, Seattle, WA, USA, 14–19 June 2020; pp. 210–211. [Google Scholar]
- Rambour, C.; Audebert, N.; Koeniguer, E.; Le Saux, B.; Crucianu, M.; Datcu, M. Sen12-flood: A Sar and Multispectral Dataset for Flood Detection. 2020. Available online: https://source.coop/repositories/esa/sen12flood/description (accessed on 30 June 2025).
- Cozannet, G.L.; Kervyn, M.; Russo, S.; Speranza, C.I.; Ferrier, P.; Foumelis, M.; Lopez, T.; Modaressi, H. Space-Based Earth Observations for Disaster Risk Management. Surv. Geophys. 2020, 41, 1209–1235. [Google Scholar] [CrossRef]
- Avalon-Cullen, C.; Caudill, C.; Newlands, N.K.; Enenkel, M. Big data, small island: Earth observations for improving flood and landslide risk assessment in Jamaica. Geosciences 2023, 13, 64. [Google Scholar] [CrossRef]
- Oh, Y.; Seo, M.; Kim, D.; Seo, J. Prototype-oriented Unsupervised Change Detection for Disaster Management. arXiv 2023, arXiv:2310.09759. [Google Scholar]
- Zhao, Q.; Yu, L. Advancing Sustainable Development Goals through Earth Observation Satellite Data: Current Insights and Future Directions. J. Remote Sens. 2025, 5, 0403. [Google Scholar] [CrossRef]
- Huang, Y.; Zhang, J.; He, H.; Jia, Y.; Chen, R.; Ge, Y.; Ming, Z.; Zhang, L.; Li, H. MAST: An earthquake-triggered landslides extraction method combining morphological analysis edge recognition with swin-transformer deep learning model. IEEE J. Sel. Top. Appl. Earth Obs. Remote Sens. 2023, 17, 2586–2595. [Google Scholar] [CrossRef]
- Shukla, J.S.; Pandya, R.J. Deep learning-oriented c-GAN models for vegetative drought prediction on peninsular india. IEEE J. Sel. Top. Appl. Earth Obs. Remote Sens. 2023, 17, 282–297. [Google Scholar] [CrossRef]
- Kim, D.; Seo, M.; Lee, H.; Seo, J. Masked Autoregressive Model for Weather Forecasting. arXiv 2024, arXiv:2409.20117. [Google Scholar]
- Yoon, D.; Seo, M.; Kim, D.; Choi, Y.; Cho, D. Probabilistic Weather Forecasting with Deterministic Guidance-Based Diffusion Model. In Proceedings of the European Conference on Computer Vision, Milan, Italy, 29 September–4 October 2024; pp. 108–124. [Google Scholar]
- Seo, M.; Kim, D.; Shin, S.; Kim, E.; Ahn, S.; Choi, Y. Simple baseline for weather forecasting using spatiotemporal context aggregation network. arXiv 2022, arXiv:2212.02952. [Google Scholar]
- Yu, D.; Li, X.; Ye, Y.; Zhang, B.; Luo, C.; Dai, K.; Wang, R.; Chen, X. Diffcast: A unified framework via residual diffusion for precipitation nowcasting. In Proceedings of the IEEE/CVF Conference on Computer Vision and Pattern Recognition, Seattle, WA, USA, 16–22 June 2024; pp. 27758–27767. [Google Scholar]
- Nguyen, T.; Brandstetter, J.; Kapoor, A.; Gupta, J.K.; Grover, A. Climax: A foundation model for weather and climate. arXiv 2023, arXiv:2301.10343. [Google Scholar]
- Chen, L.; Han, B.; Wang, X.; Zhao, J.; Yang, W.; Yang, Z. Machine learning methods in weather and climate applications: A survey. Appl. Sci. 2023, 13, 12019. [Google Scholar] [CrossRef]
- Nguyen, T.; Shah, R.; Bansal, H.; Arcomano, T.; Maulik, R.; Kotamarthi, R.; Foster, I.; Madireddy, S.; Grover, A. Scaling transformer neural networks for skillful and reliable medium-range weather forecasting. Adv. Neural Inf. Process. Syst. 2024, 37, 68740–68771. [Google Scholar]
- Lei, T.; Wang, J.; Li, X.; Wang, W.; Shao, C.; Liu, B. Flood Disaster Monitoring and Emergency Assessment Based on Multi-Source Remote Sensing Observations. Water 2022, 14, 2207. [Google Scholar] [CrossRef]
- Kordelas, G.A.; Manakos, I.; Lefebvre, G.; Poulin, B. Automatic Inundation Mapping Using Sentinel-2 Data Applicable to BothCamargue and Doñana Biosphere Reserves. Remote Sens. 2019, 11, 2251. [Google Scholar] [CrossRef]
- Kordelas, G.; Manakos, I.; Aragones, D.G.; Díaz-Delgado, R.; Bustamante, J. Fast and Automatic Data-Driven Thresholding for Inundation Mapping with Sentinel-2 Data. Remote. Sens. 2018, 10, 910. [Google Scholar] [CrossRef]
- Cigna, F.; Tapete, D. Satellite InSAR survey of structurally-controlled land subsidence due to groundwater exploitation in the Aguascalientes Valley, Mexico. Remote Sens. Environ. 2021, 254, 112254. [Google Scholar] [CrossRef]
- Farías, C.A.; Lenardón Sánchez, M.; Bonì, R.; Cigna, F. Statistical and Independent Component Analysis of Sentinel-1 InSAR Time Series to Assess Land Subsidence Trends. Remote Sens. 2024, 16, 4066. [Google Scholar] [CrossRef]
- Lenardón Sánchez, M.; Farías, C.A.; Cigna, F. Multi-Decadal Land Subsidence Risk Assessment at Major Italian Cities by Integrating PSInSAR with Urban Vulnerability. Land 2024, 13, 2103. [Google Scholar] [CrossRef]
- Ghorbanzadeh, O.; Shahabi, H.; Crivellari, A.; Homayouni, S.; Blaschke, T.; Ghamisi, P. Landslide detection using deep learning and object-based image analysis. Landslides 2022, 19, 929–939. [Google Scholar] [CrossRef]
- Akosah, S.; Gratchev, I.; Kim, D.H.; Ohn, S.Y. Application of artificial intelligence and remote sensing for landslide detection and prediction: Systematic review. Remote Sens. 2024, 16, 2947. [Google Scholar] [CrossRef]
- Fang, C.; Fan, X.; Wang, X.; Nava, L.; Zhong, H.; Dong, X.; Qi, J.; Catani, F. A globally distributed dataset of coseismic landslide mapping via multi-source high-resolution remote sensing images. Earth Syst. Sci. Data 2024, 16, 4817–4842. [Google Scholar] [CrossRef]
- Chen, J.; Liu, J.; Zeng, X.; Zhou, S.; Sun, G.; Rao, S.; Guo, Y.; Zhu, J. A Cross-Domain Landslide Extraction Method Utilizing Image Masking and Morphological Information Enhancement. Remote Sens. 2025, 17, 1464. [Google Scholar] [CrossRef]
- Lv, J.; Zhang, R.; Wu, R.; Bao, X.; Liu, G. Landslide detection based on pixel-level contrastive learning for semi-supervised semantic segmentation in wide areas. Landslides 2025, 22, 1087–1105. [Google Scholar] [CrossRef]
- Hussain, M.A.; Chen, Z.; Zheng, Y.; Shoaib, M.; Shah, S.U.; Ali, N.; Afzal, Z. Landslide susceptibility mapping using machine learning algorithm validated by persistent scatterer In-SAR technique. Sensors 2022, 22, 3119. [Google Scholar] [CrossRef]
- Schneider, D.J.; Eaton, A.R.V.; Wallace, K.L. Satellite observations of the 2016–2017 eruption of Bogoslof volcano: Aviation and ash fallout hazard implications from a water-rich eruption. Bull. Volcanol. 2020, 82, 29. [Google Scholar] [CrossRef]
- Piontek, D.; Bugliaro, L.; Kar, J.; Schumann, U.; Marenco, F.; Plu, M.; Voigt, C. The new volcanic ash satellite retrieval VACOS using MSG/SEVIRI and artificial neural networks: 2. Validation. Remote Sens. 2021, 13, 3128. [Google Scholar] [CrossRef]
- Ganci, G.; Bilotta, G.; Calvari, S.; Cappello, A.; Del Negro, C.; Herault, A. Volcanic hazard monitoring using multi-source satellite imagery. In Proceedings of the 2021 IEEE International Geoscience and Remote Sensing Symposium IGARSS, Brussels, Belgium, 11–16 July 2021; pp. 1903–1906. [Google Scholar]
- Chen, Y.; Hantson, S.; Andela, N.; Coffield, S.R.; Graff, C.A.; Morton, D.C.; Ott, L.E.; Foufoula-Georgiou, E.; Smyth, P.; Goulden, M.L.; et al. California wildfire spread derived using VIIRS satellite observations and an object-based tracking system. Sci. Data 2022, 9, 249. [Google Scholar] [CrossRef] [PubMed]
- Seydi, S.T.; Akhoondzadeh, M.; Amani, M.; Mahdavi, S. Wildfire damage assessment over Australia using sentinel-2 imagery and MODIS land cover product within the google earth engine cloud platform. Remote Sens. 2021, 13, 220. [Google Scholar] [CrossRef]
- Rostami, A.; Shah-Hosseini, R.; Asgari, S.; Zarei, A.; Aghdami-Nia, M.; Homayouni, S. Active fire detection from landsat-8 imagery using deep multiple kernel learning. Remote Sens. 2022, 14, 992. [Google Scholar] [CrossRef]
- Hu, X.; Ban, Y.; Nascetti, A. Uni-temporal multispectral imagery for burned area mapping with deep learning. Remote Sens. 2021, 13, 1509. [Google Scholar] [CrossRef]
- Ko, B.; Kim, H.H.; Nam, J.Y. Classification of Potential Water Bodies Using Landsat 8 OLI and a Combination of Two Boosted Random Forest Classifiers. Sensors 2015, 15, 13763–13777. [Google Scholar] [CrossRef]
- Acharya, T.D.; Lee, D.H.; Yang, I.; Lee, J.K. Identification of Water Bodies in a Landsat 8 OLI Image Using a J48 Decision Tree. Sensors 2016, 16, 1075. [Google Scholar] [CrossRef]
- Sarp, G.; Ozcelik, M. Water body extraction and change detection using time series: A case study of Lake Burdur, Turkey. J. Taibah Univ. Sci. 2017, 11, 381–391. [Google Scholar] [CrossRef]
- Mishra, K.; Prasad, P.R.C. Automatic Extraction of Water Bodies from Landsat Imagery Using Perceptron Model. J. Comput. Environ. Sci. 2015, 2015, 903465. [Google Scholar] [CrossRef]
- Skakun, S. A Neural Network Approach to Flood Mapping Using Satellite Imagery. Comput. Inform. 2012, 29, 1013–1024. [Google Scholar]
- Nemni, E.; Aylett-Bullock, J.; Belabbes, S.; Bromley, L. Fully Convolutional Neural Network for Rapid Flood Segmentation in Synthetic Aperture Radar Imagery. Remote Sens. 2020, 12, 2532. [Google Scholar] [CrossRef]
- Amitrano, D.; Di Martino, G.; Di Simone, A.; Imperatore, P. Flood detection with SAR: A review of techniques and datasets. Remote Sens. 2024, 16, 656. [Google Scholar] [CrossRef]
- Islam, M.T.; Meng, Q. An exploratory study of Sentinel-1 SAR for rapid urban flood mapping on Google Earth Engine. Int. J. Appl. Earth Obs. Geoinf. 2022, 113, 103002. [Google Scholar]
- Lahsaini, M.; Albano, F.; Albano, R.; Mazzariello, A.; Lacava, T. A synthetic aperture radar-based robust satellite technique (RST) for timely mapping of floods. Remote Sens. 2024, 16, 2193. [Google Scholar] [CrossRef]
- Jamali, A.; Roy, S.K.; Beni, L.H.; Pradhan, B.; Li, J.; Ghamisi, P. Residual wave vision U-Net for flood mapping using dual polarization Sentinel-1 SAR imagery. Int. J. Appl. Earth Obs. Geoinf. 2024, 127, 103662. [Google Scholar] [CrossRef]
- Florentino, A.; Charapaqui, S.; Jara, C.D.L.; Milla, M.A. Implementation of a ground based synthetic aperture radar (GB-SAR) for landslide monitoring: System description and preliminary results. In Proceedings of the 2016 IEEE XXIII International Congress on Electronics, Electrical Engineering and Computing (INTERCON), Piura, Peru, 2–5 August 2016; pp. 1–6. [Google Scholar]
- Aslan, G.; Foumelis, M.; Raucoules, D.; De Michele, M.; Bernardie, S.; Cakir, Z. Landslide mapping and monitoring using persistent scatterer interferometry (PSI) technique in the French Alps. Remote Sens. 2020, 12, 1305. [Google Scholar] [CrossRef]
- Nava, L.; Monserrat, O.; Catani, F. Improving landslide detection on SAR data through deep learning. IEEE Geosci. Remote Sens. Lett. 2021, 19, 1–5. [Google Scholar] [CrossRef]
- Nava, L.; Bhuyan, K.; Meena, S.R.; Monserrat, O.; Catani, F. Rapid mapping of landslides on SAR data by attention U-Net. Remote Sens. 2022, 14, 1449. [Google Scholar] [CrossRef]
- Endo, Y.; Adriano, B.; Mas, E.; Koshimura, S. New insights into multiclass damage classification of tsunami-induced building damage from SAR images. Remote Sens. 2018, 10, 2059. [Google Scholar] [CrossRef]
- Koshimura, S.; Moya, L.; Mas, E.; Bai, Y. Tsunami damage detection with remote sensing: A review. Geosciences 2020, 10, 177. [Google Scholar] [CrossRef]
- Kwak, Y.; Yorozuya, A.; Iwami, Y. Disaster risk reduction using image fusion of optical and SAR data before and after tsunami. In Proceedings of the 2016 IEEE Aerospace Conference, Big Sky, MT, USA, 5–12 March 2016; pp. 1–11. [Google Scholar]
- Shafapourtehrany, M.; Batur, M.; Shabani, F.; Pradhan, B.; Kalantar, B.; Özener, H. A comprehensive review of geospatial technology applications in earthquake preparedness, emergency management, and damage assessment. Remote Sens. 2023, 15, 1939. [Google Scholar] [CrossRef]
- Ross, Z.E.; Idini, B.; Jia, Z.; Stephenson, O.L.; Zhong, M.; Wang, X.; Zhan, Z.; Simons, M.; Fielding, E.J.; Yun, S.H.; et al. Hierarchical interlocked orthogonal faulting in the 2019 Ridgecrest earthquake sequence. Science 2019, 366, 346–351. [Google Scholar] [CrossRef] [PubMed]
- Park, S.E.; Jung, Y.T. Detection of earthquake-induced building damages using polarimetric SAR data. Remote Sens. 2020, 12, 137. [Google Scholar] [CrossRef]
- Ji, Y.; Sumantyo, J.T.S.; Chua, M.Y.; Waqar, M.M. Earthquake/Tsunami Damage Level Mapping of Urban Areas Using Full Polarimetric SAR Data. IEEE J. Sel. Top. Appl. Earth Obs. Remote Sens. 2018, 11, 2296–2309. [Google Scholar] [CrossRef]
- White, L.; Brisco, B.; Dabboor, M.; Schmitt, A.; Pratt, A. A Collection of SAR Methodologies for Monitoring Wetlands. Remote Sens. 2015, 7, 7615–7645. [Google Scholar] [CrossRef]
- Ban, Y.; Zhang, P.; Nascetti, A.; Bevington, A.R.; Wulder, M.A. Near real-time wildfire progression monitoring with Sentinel-1 SAR time series and deep learning. Sci. Rep. 2020, 10, 1322. [Google Scholar] [CrossRef]
- Wang, L.; Xu, X.; Yu, Y.; Yang, R.; Gui, R.; Xu, Z.; Pu, F. SAR-to-Optical Image Translation Using Supervised Cycle-Consistent Adversarial Networks. IEEE Access 2019, 7, 129136–129149. [Google Scholar] [CrossRef]
- Ryu, J.; Oh, Y.; Seo, M. SAR2Earth: A SAR-to-EO Translation Dataset for Remote Sensing Applications. Available online: https://openreview.net/forum?id=JigWdDArjb (accessed on 30 June 2025).
- Seo, M.; Lee, H.; Jeon, Y.; Seo, J. Self-Pair: Synthesizing Changes from Single Source for Object Change Detection in Remote Sensing Imagery. In Proceedings of the IEEE/CVF Winter Conference on Applications of Computer Vision, Waikoloa, HI, USA, 3–7 January 2023; pp. 6374–6383. [Google Scholar]
- Li, Y.; Hu, J.; Jia, Y. Automatic SAR image enhancement based on nonsubsampled contourlet transform and memetic algorithm. Neurocomputing 2014, 134, 70–78. [Google Scholar] [CrossRef]
- Li, Y.; Gong, H.; Feng, D.D.; Zhang, Y. An Adaptive Method of Speckle Reduction and Feature Enhancement for SAR Images Based on Curvelet Transform and Particle Swarm Optimization. IEEE Trans. Geosci. Remote Sens. 2011, 49, 3105–3116. [Google Scholar] [CrossRef]
- Deledalle, C.A.; Denis, L.; Tupin, F.; Reigber, A.; Jäger, M. NL-SAR: A Unified Nonlocal Framework for Resolution-Preserving (Pol)(In)SAR Denoising. IEEE Trans. Geosci. Remote Sens. 2015, 53, 2021–2038. [Google Scholar] [CrossRef]
- Low, S.; Nina, O.; Sappa, A.D.; Blasch, E.; Inkawhich, N. Multi-Modal Aerial View Image Challenge: Translation From Synthetic Aperture Radar to Electro-Optical Domain Results-PBVS 2023. In Proceedings of the IEEE/CVF Conference on Computer Vision and Pattern Recognition, Vancouver, BC, Canada, 17–14 June 2023; pp. 515–523. [Google Scholar]
- Reyes, M.F.; Auer, S.; Merkle, N.; Henry, C.; Schmitt, M. SAR-to-Optical Image Translation Based on Conditional Generative Adversarial Networks - Optimization, Opportunities and Limits. Remote Sens. 2019, 11, 2067. [Google Scholar] [CrossRef]
- Ho, J.; Jain, A.; Abbeel, P. Denoising diffusion probabilistic models. Adv. Neural Inf. Process. Syst. 2020, 33, 6840–6851. [Google Scholar]
- Song, Y.; Sohl-Dickstein, J.; Kingma, D.P.; Kumar, A.; Ermon, S.; Poole, B. Score-Based Generative Modeling through Stochastic Differential Equations. arXiv 2021, arXiv:2011.13456. [Google Scholar]
- Wang, T.C.; Liu, M.Y.; Zhu, J.Y.; Tao, A.; Kautz, J.; Catanzaro, B. High-resolution image synthesis and semantic manipulation with conditional gans. In Proceedings of the IEEE Conference on Computer Vision and Pattern Recognition, Salt Lake City, UT, USA, 18–23 June 2018; pp. 8798–8807. [Google Scholar]
- Perera, M.V.; Nair, N.G.; Bandara, W.G.C.; Patel, V.M. Sar despeckling using a denoising diffusion probabilistic model. IEEE Geosci. Remote Sens. Lett. 2023, 20, 4005305. [Google Scholar] [CrossRef]
- Lee, J.S. Digital image enhancement and noise filtering by use of local statistics. IEEE Trans. Pattern Anal. Mach. Intell. 1980, PAMI-2, 165–168. [Google Scholar] [CrossRef] [PubMed]
- Frost, V.S.; Stiles, J.A.; Shanmugan, K.S.; Holtzman, J.C. A model for radar images and its application to adaptive digital filtering of multiplicative noise. IEEE Trans. Pattern Anal. Mach. Intell. 1982, PAMI-4, 157–166. [Google Scholar] [CrossRef]
- Kuan, D.T.; Sawchuk, A.A.; Strand, T.C.; Chavel, P. Adaptive noise smoothing filter for images with signal-dependent noise. IEEE Trans. Pattern Anal. Mach. Intell. 1985, PAMI-7, 165–177. [Google Scholar] [CrossRef]
- Krull, A.; Buchholz, T.O.; Jug, F. Noise2void-learning denoising from single noisy images. In Proceedings of the IEEE/CVF Conference on Computer Vision and Pattern Recognition, Long Beach, CA, USA, 15–20 June 2019; pp. 2129–2137. [Google Scholar]
- Batson, J.; Royer, L. Noise2self: Blind denoising by self-supervision. In Proceedings of the International Conference on Machine Learning, PMLR, Long Beach, CA, USA, 9–15 June 2019; pp. 524–533. [Google Scholar]
- Zhang, D.; Zhou, F.; Jiang, Y.; Fu, Z. MM-BSN: Self-Supervised Image Denoising for Real-World with Multi-Mask based on Blind-Spot Network. In Proceedings of the IEEE/CVF Conference on Computer Vision and Pattern Recognition, Vancouver, BC, Canada, 17–24 June 2023; pp. 4188–4197. [Google Scholar]
- Esser, P.; Rombach, R.; Ommer, B. Taming transformers for high-resolution image synthesis. In Proceedings of the IEEE/CVF Conference on Computer Vision and Pattern Recognition, Nashville, TN, USA, 20–25 June 2021; pp. 12873–12883. [Google Scholar]
- Lehtinen, J.; Munkberg, J.; Hasselgren, J.; Laine, S.; Karras, T.; Aittala, M.; Aila, T. Noise2Noise: Learning image restoration without clean data. arXiv 2018, arXiv:1803.04189. [Google Scholar]
- Yu, J.; Du, S.; Lu, R.; Li, P.; Xie, G.; Cai, Z.; Lu, K.; Ling, Q.; Wang, C.; Qiu, L.; et al. SAR2EO: A High-resolution Image Translation Framework with Denoising Enhancement. arXiv 2023, arXiv:2304.04760. [Google Scholar]
- Rombach, R.; Blattmann, A.; Lorenz, D.; Esser, P.; Ommer, B. High-resolution image synthesis with latent diffusion models. In Proceedings of the IEEE/CVF Conference on Computer Vision and Pattern Recognition, New Orleans, LA, USA, 18–24 June 2022; pp. 10684–10695. [Google Scholar]
- Mateo-Garcia, G.; Veitch-Michaelis, J.; Smith, L.; Oprea, S.V.; Schumann, G.; Gal, Y.; Baydin, A.G.; Backes, D. Towards global flood mapping onboard low cost satellites with machine learning. Sci. Rep. 2021, 11, 1–12. [Google Scholar] [CrossRef] [PubMed]
- Ronneberger, O.; Fischer, P.; Brox, T. U-net: Convolutional networks for biomedical image segmentation. In Proceedings of the Medical Image Computing and Computer-Assisted Intervention–MICCAI 2015: 18th International Conference, Munich, Germany, 5–9 October 2015; pp. 234–241. [Google Scholar]
Disclaimer/Publisher’s Note: The statements, opinions and data contained in all publications are solely those of the individual author(s) and contributor(s) and not of MDPI and/or the editor(s). MDPI and/or the editor(s) disclaim responsibility for any injury to people or property resulting from any ideas, methods, instructions or products referred to in the content. |
© 2025 by the authors. Licensee MDPI, Basel, Switzerland. This article is an open access article distributed under the terms and conditions of the Creative Commons Attribution (CC BY) license (https://creativecommons.org/licenses/by/4.0/).