Abstract
High-resolution radar observations are essential to improving the numerical predictions of high-impact weather systems with data assimilation techniques. The numerical simulations of the landfall of Typhoon Lekima (2019) are conducted in the framework of the WRF model, investigating the impact of assimilating radar radial velocity observations via the Ensemble Kalman Filter (EnKF) on the typhoon’s analysis and forecast performance. The results demonstrate that the EnKF method significantly improves forecast accuracy for Typhoon Lekima, including track, intensity and the 24 h cumulative precipitation. To be specific, the control experiment significantly underestimated typhoon intensity, while EnKF-based radar radial velocity assimilation markedly improved near-surface winds (>48 m/s) in the typhoon core, refined vortex structure and reduced track forecast errors by 50–60%. Compared with the control and 3DVAR experiments, EnKF assimilation better captured typhoon precipitation patterns, with the highest ETS scores, especially for moderate-to-high precipitation intensities. Moreover, the detailed analysis and diagnostics of Lekima show that the warm core structure is better captured in the assimilation experiment. The typhoon system is also improved, as reflected by enhanced potential temperature and a more robust wind field analysis.
1. Introduction
Typhoons, also known as tropical cyclones, are non-frontal synoptic-scale low-pressure systems that form over the tropical or subtropical ocean and usually have a warm core structure. The South China Sea and the Northwest Pacific Ocean are areas with frequent typhoon activities in the world. Climate projections indicate an increasing trend in both occurrence rates and peak intensity of high-category tropical cyclones under continued global warming scenarios. However, disasters such as fierce wind, heavy precipitation and tidal flood often occur before and after typhoon landfall, which cause severe damage and threats to the affected areas. Therefore, more abundant observation data and more advanced technology are needed to enhance tropical cyclone prediction, so as to reduce the disaster caused by tropical cyclones. Influenced by varying terrains and diverse weather systems, typhoons often undergo significant structural and intensity changes before and after landfall, and their formation and evolution involve highly complex physical processes. Understanding these complex transitional processes remains a significant challenge in typhoon research [1,2,3], which makes our current forecasting ability of tropical cyclones still insufficient.
In recent years, radar data assimilation has made remarkable progress in the field of typhoon analysis and forecast. Advanced radar technology and observation systems are used to obtain radar data with high spatiotemporal resolution, and innovative data assimilation methods such as variational assimilation and the Kalman Filter are combined to better integrate radar observation data (mainly radar reflectivity factor, radial velocity, etc.) into numerical models. Enhanced atmospheric state estimation contributes to improved numerical simulation of typhoon characteristics, leading to more accurate track and intensity forecasts. In addition, the improvement in the numerical model also improves the simulation ability of atmospheric dynamics and physical processes, improves the optimization of model parameter schemes and leads to the improvement in model resolution, so that the model can simulate the complex typhoon structure and evolution process more accurately and provide a more reliable simulation environment for radar data assimilation. Current research limitations highlight the need for additional case validation, particularly to assess radar radial velocity assimilation techniques in extreme typhoon scenarios.
Data assimilation integrates direct and indirect observational data to produce an optimal estimate of atmospheric states at specified times and resolutions. Data assimilation originated from analysis techniques in early meteorology [4], and its basic methods developed in several stages: polynomial difference method, stepwise correction method (SC), optimal interpolation method (OI), variational method (3DVAR and 4DVAR) and Ensemble Kalman Filter (EnKF) method [5,6]. Generally, the static and isotropic background error covariance used in 3DVAR fails to resolve rapidly evolving error structures. In contrast, the EnKF dynamically estimates background error covariance through ensemble forecasts. This approach naturally captures the propagation and growth of uncertainties from initial conditions and model physics, improving the propagation of observational information for highly nonlinear weather forecasting via flow-dependent error representation.
A typhoon occurs on a wide and warm ocean surface, and the characteristics of conventional surface and ocean observation data, such as uneven distribution and low resolution, cannot meet the assimilation needs of typhoon forecasting. The assimilation of conventional and radar satellite observation data is the only way to provide forecast accuracy.
In the study of radar reflectivity assimilation, Shen et al. [7] developed a blending hydrometeor retrieval scheme for assimilating weather radar reflectivity data and evaluated its performance through two convective storm cases in East China, demonstrating improved analysis and short-term forecasts of storm structures and precipitation. Xiao et al. [8] adopted the EnKF assimilation method to directly assimilate the radar reflectivity data in Guangdong, thus effectively increasing the water vapor content entering the typhoon and significantly improving the forecast of the precipitation intensity and influence range of Typhoon Hato. Shen et al. [9] investigated the impact of introducing hydrometeor control variables on radar reflectivity data assimilation in a mesoscale convective system case from 6–8 August 2018. In addition, Lin et al. [10] also carried out an observation system simulation experiment (OSSE) with the same Typhoon Hato case, using the atmosphere–ocean coupled model to conduct model experiments. The results indicate that GNSS-R-derived wind-speed measurements effectively complement radar observations within the typhoon boundary layer, significantly reducing wind-speed analysis errors in lower atmospheric levels. This synergistic approach integrating surface-based radar and spaceborne wind observations demonstrates considerable potential for enhancing typhoon intensity forecasting, offering valuable insights for operational implementation.
In terms of the assimilation of radar radial velocity, Yue et al. [11] assimilated the radial velocity of Taiwan coastal radars based on the aggregated Kalman Filter data assimilation system of the WRF model. The Ensemble Kalman Filter assimilation experiments demonstrated that incorporating radar radial velocity observations significantly enhanced the representation of both the environmental steering flow and the typhoon’s kinematic structure, yielding more accurate vortex positioning and improved mesoscale features. The track and precipitation forecast of Typhoon Morakot were improved. Yin et al. [12] also proved that assimilating radar radial velocity data plays a significant role in enhancing meso–small-scale information; thus, adjusting the initial dynamic field of the model can strengthen the convergence intensity of typhoon cyclones. The research by Feng et al. [13,14] shows that after the cyclic assimilation of radial velocity of EnKF radar, all the errors of prediction are reduced with new super-observation processing. Zhu et al. [15] found that the real warm core structure can be revealed by assimilating the radar radial velocity when the typhoon develops to its strongest. The MG-NLS4DVar method is applied in Zhang et al. [16] to conduct assimilation research, and it was found that in typhoon prediction, the radial velocity data of the single assimilated radar has a much more significant improvement effect on the typhoon than the single assimilated reflectivity data. The assimilation of radar radial velocity data effectively mitigates the overestimation of precipitation evident in the control forecast. Previous research by Shen et al. [17] systematically evaluated two distinct momentum control variable approaches for Typhoon Chanthu forecasting: the streamfunction–velocity potential scheme (DA_ΨX) and the wind component scheme (DA_UV). Their comparative analysis demonstrated superior forecast ability when employing the DA_UV configuration.
In general, the progress of radar data assimilation in typhoon analysis and forecasting in recent years provides strong support for improving forecast accuracy and reducing risk. These advances provide a more reliable scientific basis for reducing the impact of typhoons on human society. Previous studies have examined tropical cyclones in south China, including the investigation of Typhoon Vicente (2012) in Zhu et al. [15] and of Typhoon Mujigae (2015) in Feng et al. [14]. The current study focuses on Typhoon Lekima (2019) in east China and investigates the performance of both 3DVAR and the EnKF, thereby expanding the geographical scope of research. Typhoon Lekima (2019) was selected as the case study in our research because it represents a highly challenging and impactful event for data assimilation and typhoon forecasting. Specifically, Lekima was the most intense tropical cyclone in the 2019 Northwest Pacific season, characterized by an unusually prolonged rapid intensification phase and complex interaction with land and environmental factors [18,19,20].
The primary objectives of this research study are to investigate the impact of assimilating radar radial velocity observations via the Ensemble Kalman Filter (EnKF) on Typhoon Lekima ‘s analysis and forecast performance compared with 3DVAR and control experiments with any data assimilation. As a pioneering effort, this work establishes a framework for optimizing tropical cyclone modeling through improved numerical configurations and advanced data assimilation methodologies for typhoons in east China for both 3DVAR and the EnKF. The numerical simulations are conducted in the framework of the WRF model along with EnKF assimilation technology when assimilating Doppler radar radial velocity data, and they are compared with unassimilated control experiments and three-dimensional variational assimilation experiments; the influence of ENKF-assimilated radar radial velocity data on typhoon forecast is analyzed from the perspectives of typhoon track, intensity and precipitation.
2. Data and Methods
2.1. Data
- (1)
- The ERA5 reanalysis dataset (ECMWF), available from 1950 onwards with a horizontal resolution of 0.25°, serves two primary purposes in this study: diagnosing synoptic-scale circulation evolution during typhoon landfall phases and providing initial and lateral boundary conditions for WRF numerical simulations [21].
- (2)
- Precipitation Data
The China Merged Precipitation Analysis (CMPA) dataset, developed by the National Meteorological Information Center (China Meteorological Administration), was adopted to evaluate model-predicted precipitation across experimental groups. This dataset features hourly temporal resolution and 0.05° × 0.05° spatial resolution and covers the geographical domain of 70–140°E and 0–60°N.
The CMPA integrates hourly precipitation products, including rainfall measurements from automated ground observation stations, CMORPH satellite precipitation products developed by the Climate Prediction Center (CPC) and radar precipitation products based on hourly precipitation data from automated station observations [22]. Through the comprehensive application of these multivariate precipitation data sources, CMPA hourly fusion precipitation products can provide more accurate and comprehensive precipitation information.
- (3)
- Typhoon Data
The China Meteorological Administration (CMA) tropical cyclone data center provides the best track of typhoon dataset (https://tcdata.typhoon.org.cn, accessed on 28 June 2025), which is used to examine the predicted typhoon intensity and track.
- (4)
- Radar Data
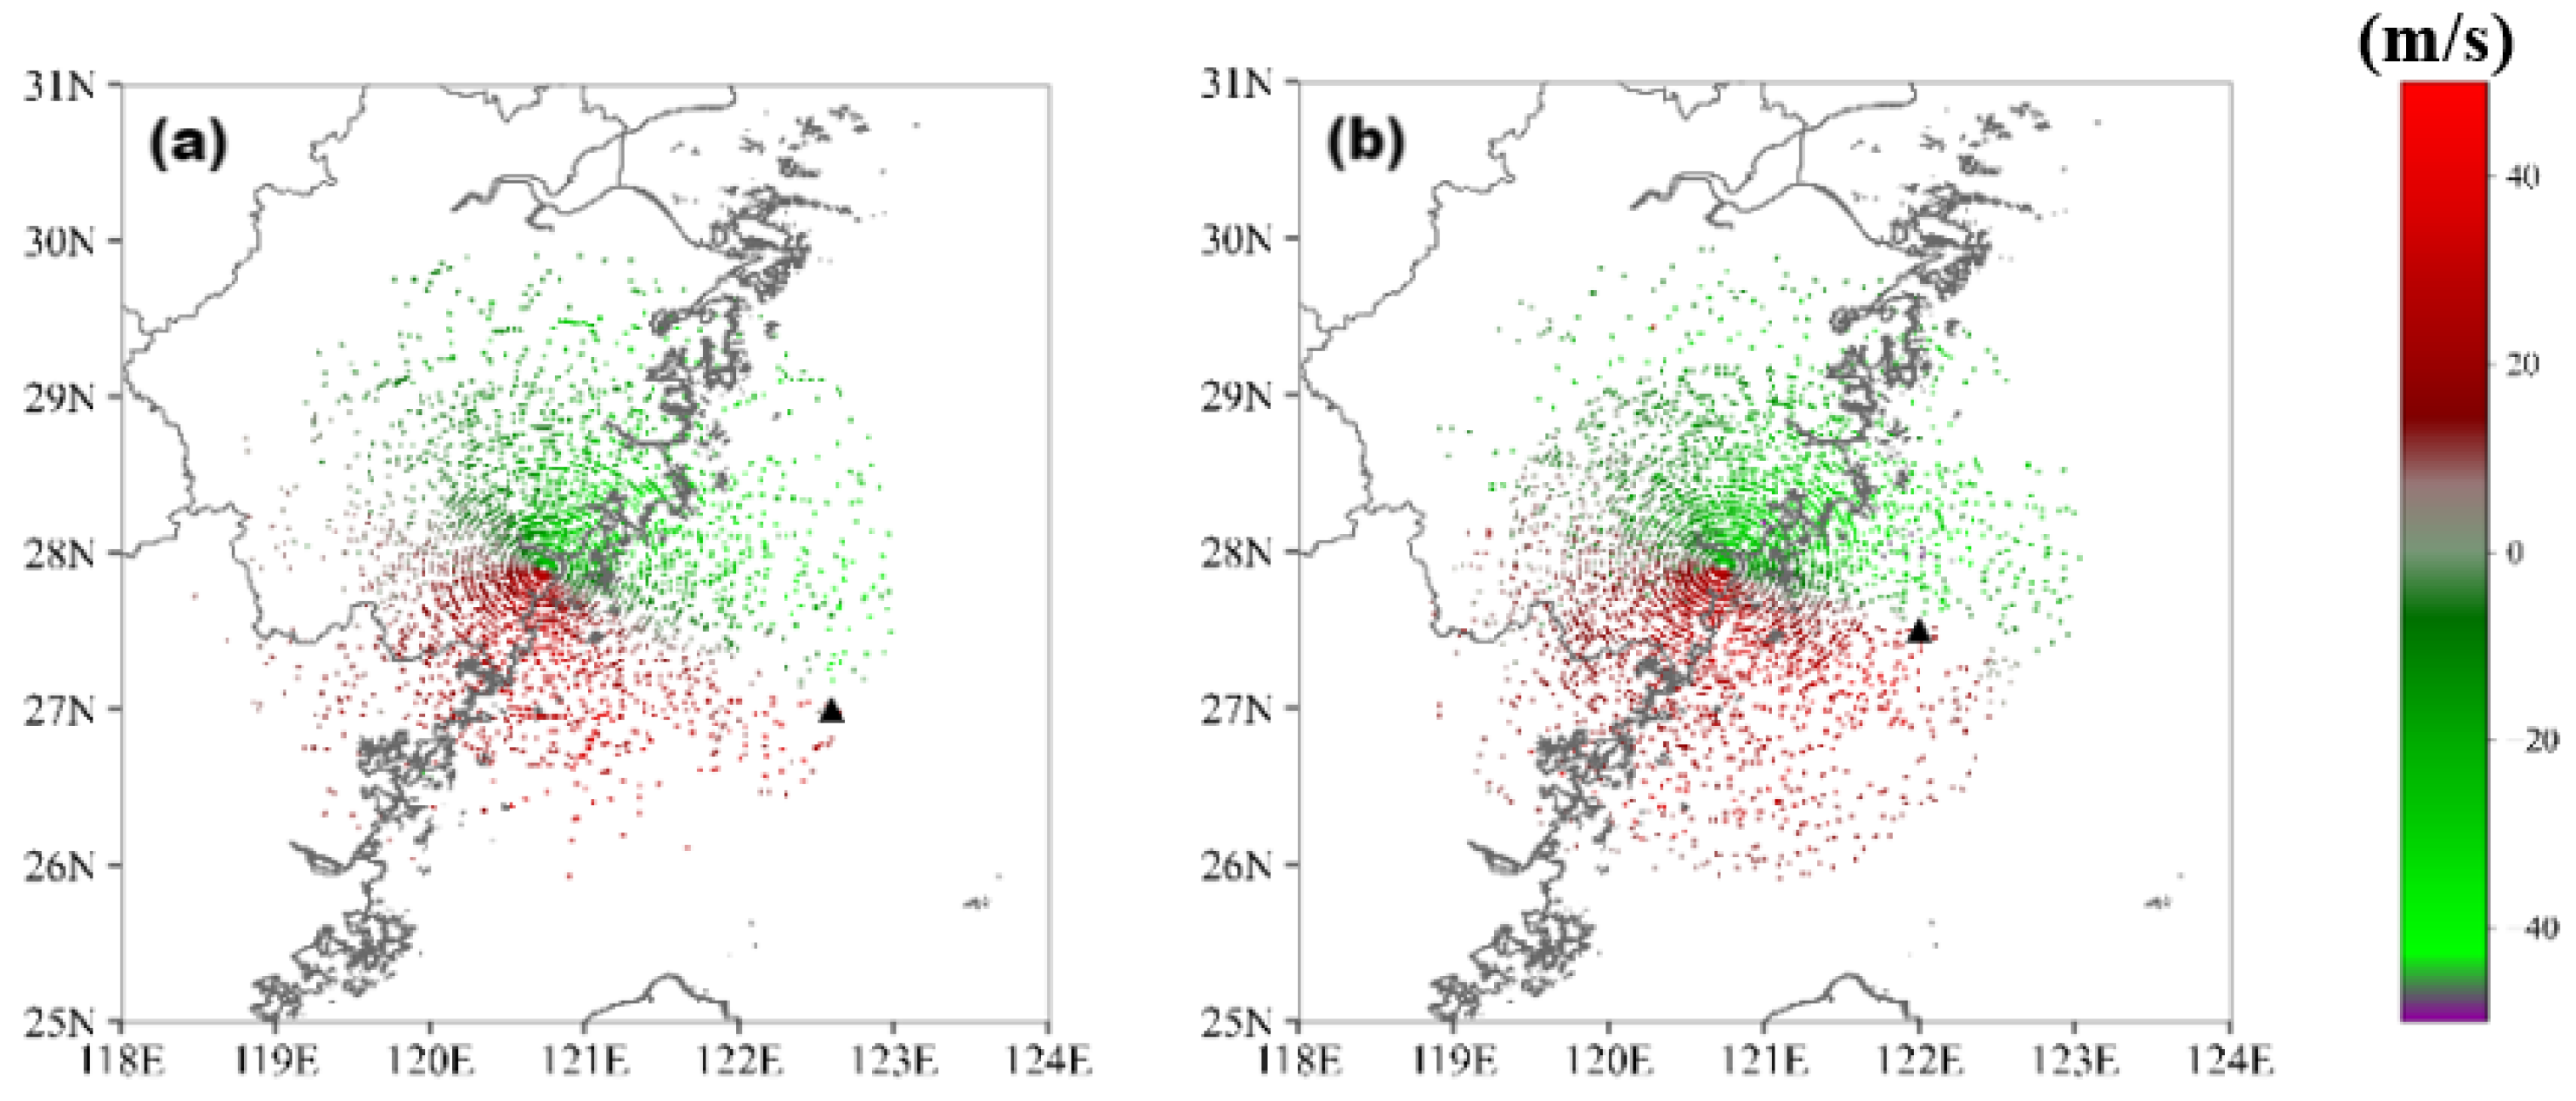
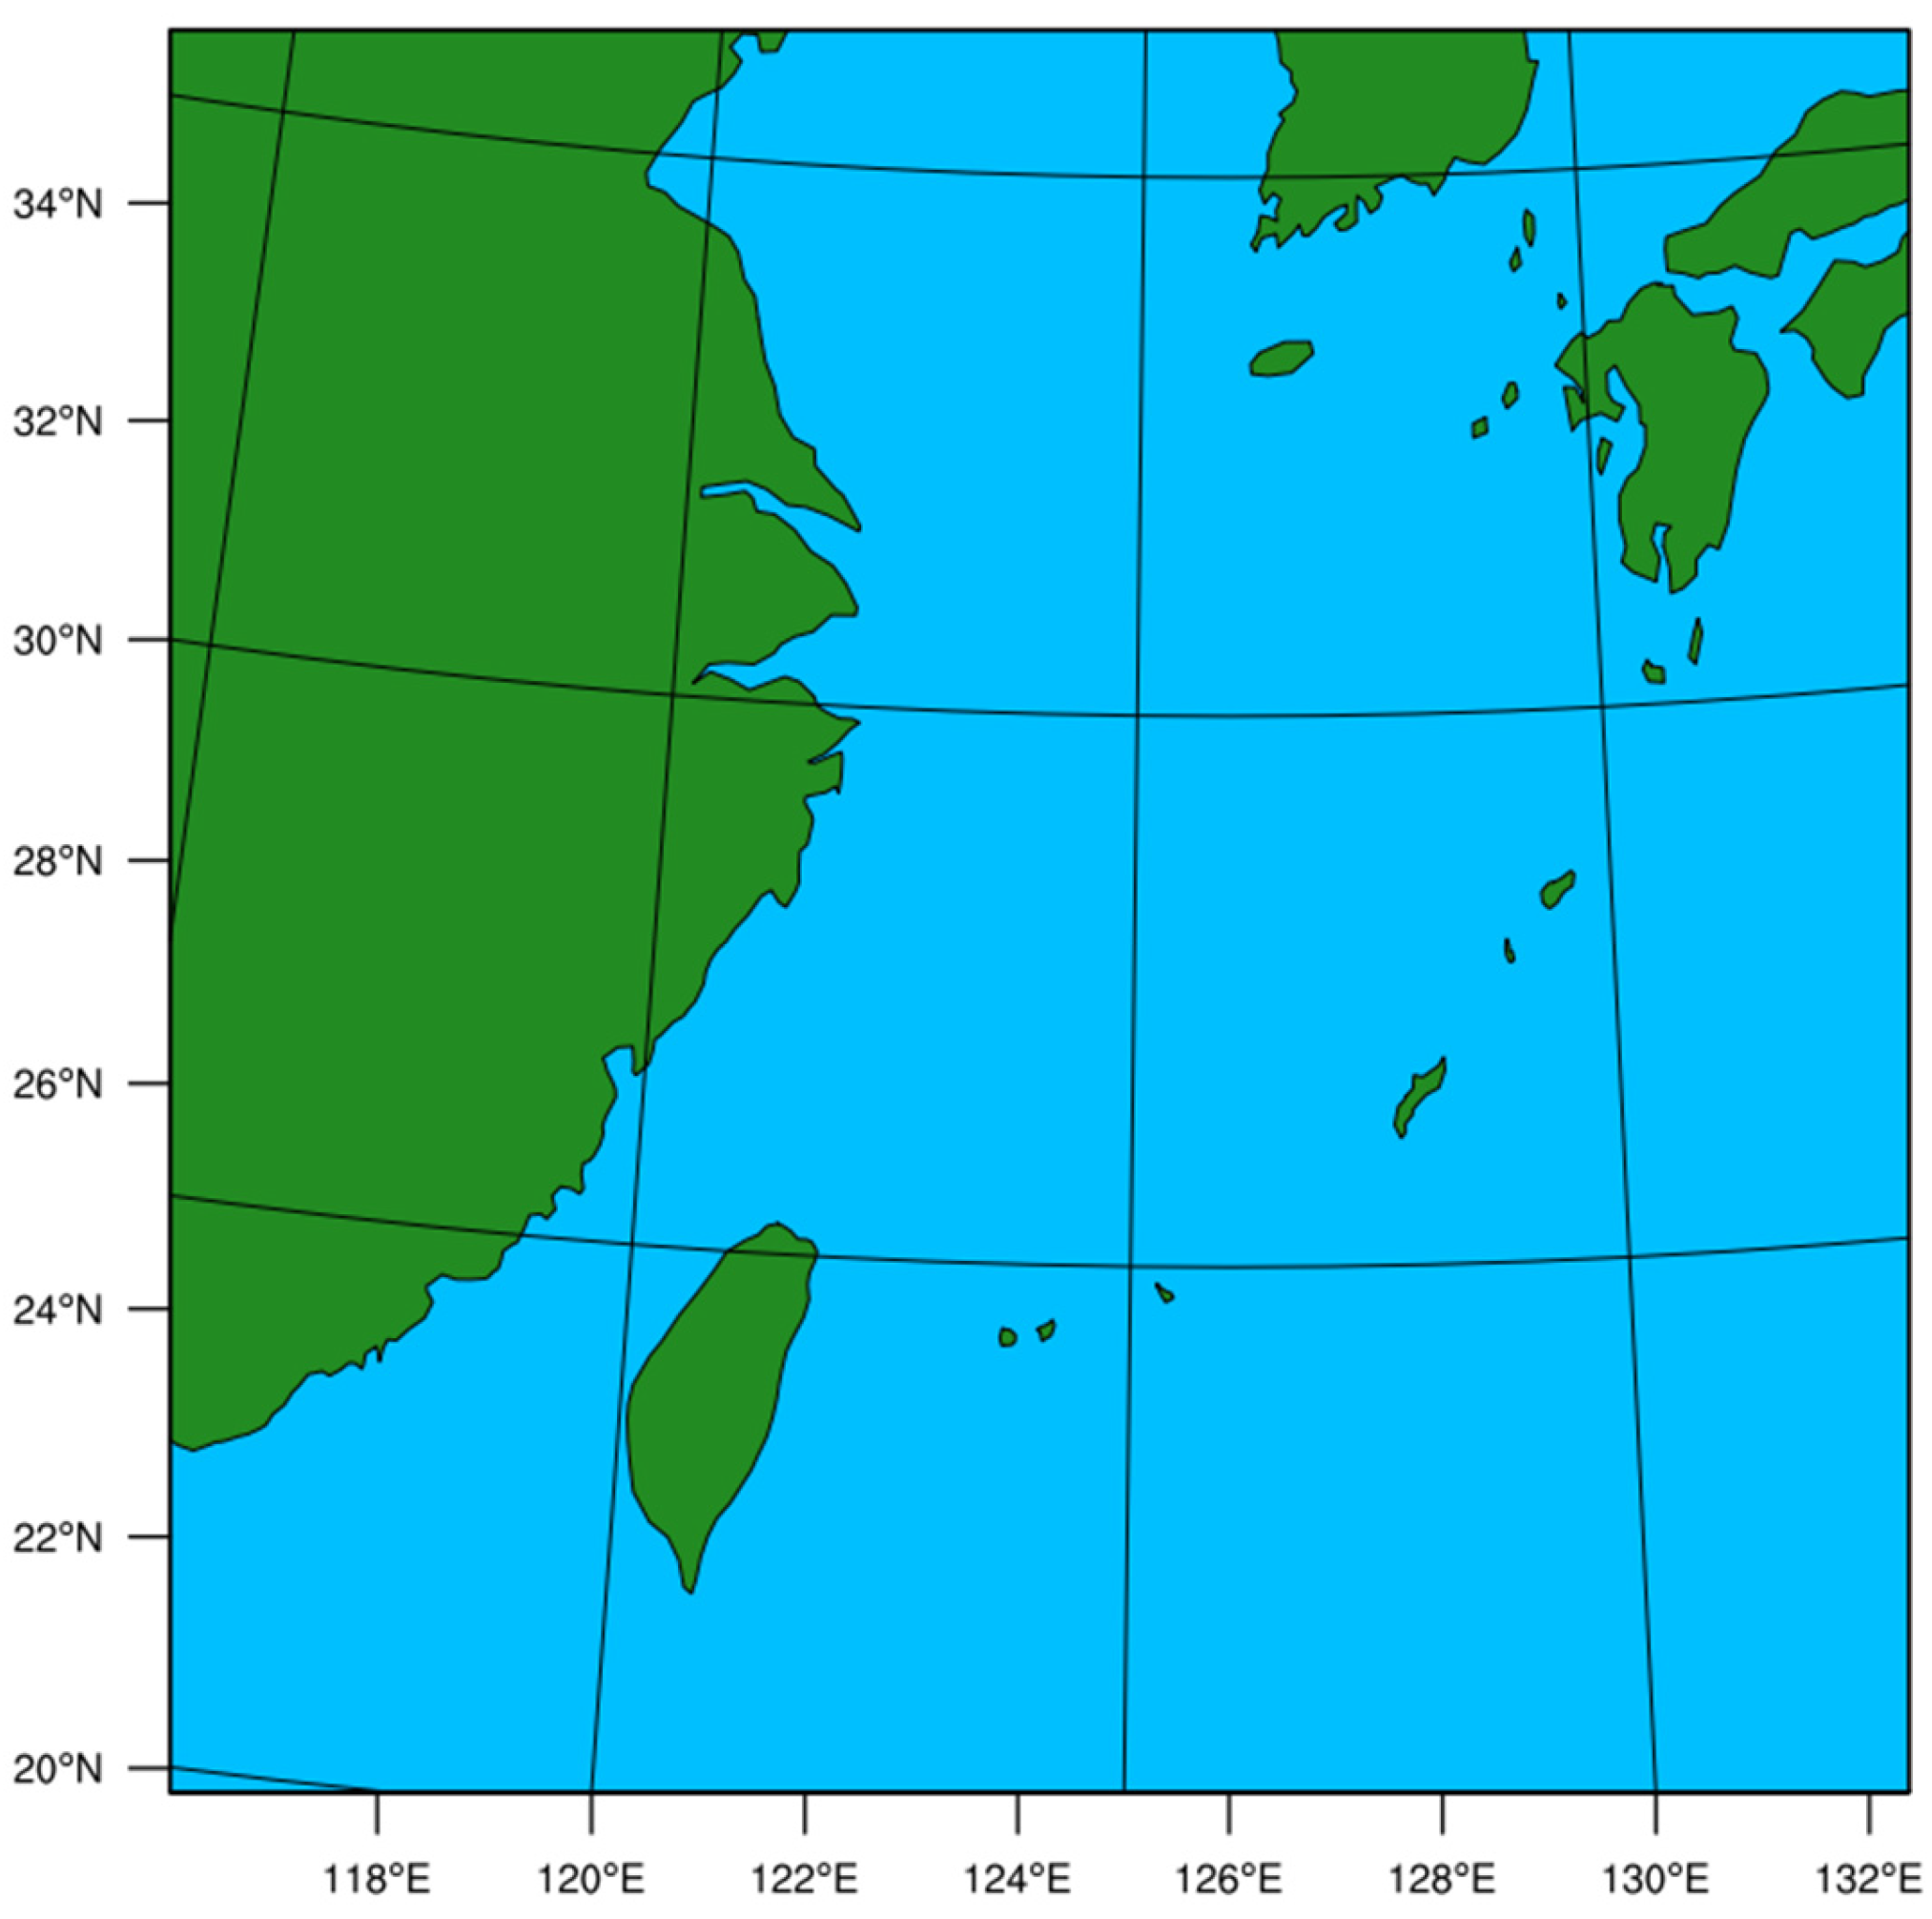
The S-band Doppler radar in Wenzhou (WZRD; 27.9°N, 120.74°E) supplies radial velocity data with nine elevation angles, featuring 250 m spatial resolution and 230 km coverage at six-minute intervals (Figure 1). Due to the high-wind-speed characteristics of the typhoon system and the existence of a maximum unambiguous velocity threshold in Doppler radar detection, velocity aliasing will occur when the radial wind speed exceeds this threshold. Since velocity ambiguity may lead to deviations in numerical results, strict quality control must be implemented before using radar data for assimilation [23].
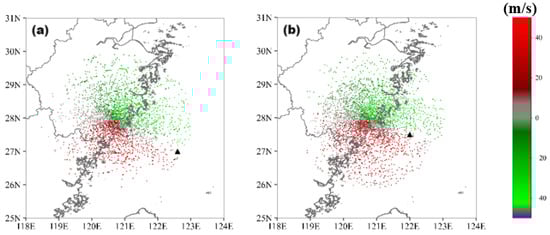
Figure 1.
Observation of radar radial velocity speed in Zhejiang Region (Unit: m/s) at (a) 0600 UTC on 9 August 2019 and (b) 1200 UTC on 9 August 2019.
Several procedures were performed to provide high-quality radar radial velocity data for subsequent assimilation [24,25]. Initially, noise removal was conducted to filter out the interfering signals and non-meteorological features from the raw radar radial velocity observations. Following He et al. [26], observations at radial gate locations that satisfied the conditions of reflectivity of less than 20 dBZ and spectral width greater than 8 m/s were removed. Subsequently, the processed radial velocity observations were dealiased using the region-based unfolding algorithm in the Py-ART v3.1.0 software library developed by the Atmospheric Radiation Measurement Climate Research Facility (ARM) [27]. Finally, super-observations were generated from the dense radial velocity observations to enable secondary quality control and mitigate observation error correlation effects according to Zhang et al. [28]. A 2 m/s observation error was assigned to the processed observations.
2.2. Methodology
Each assimilation method has its advantages and disadvantages, but its core principle can be based on the following formula:
In Formula (1), is the analysis field, is the background field, and and are the observed and real atmospheric states. The difference between different assimilation methods is only the calculation method of the prior weight function W and the running time interval of the equation.
2.2.1. Three-Dimensional Variational Data Assimilation Method
Among them, the three-dimensional variation can boil down to the objective function minimization problem. Firstly, the objective function is derived from the probability density function of the observation field, background field and pattern operator:
In Formula (2), H is the observation operator; and are the atmospheric state variable and the background field, respectively; B, F and O are the error covariance matrix of the background, the observation operator and the observation, respectively; and is the observation value. To make the assimilation effect as good as possible, it is necessary to minimize the objective function, even if its gradient is 0; that is, the objective function gradient , after sorting, becomes
If is satisfied, then
Here, Formula (4) refers to the solution that satisfies the gradient equal to 0 and is also the analysis field after three-dimensional variational assimilation.
2.2.2. Ensemble Kalman Filter Method
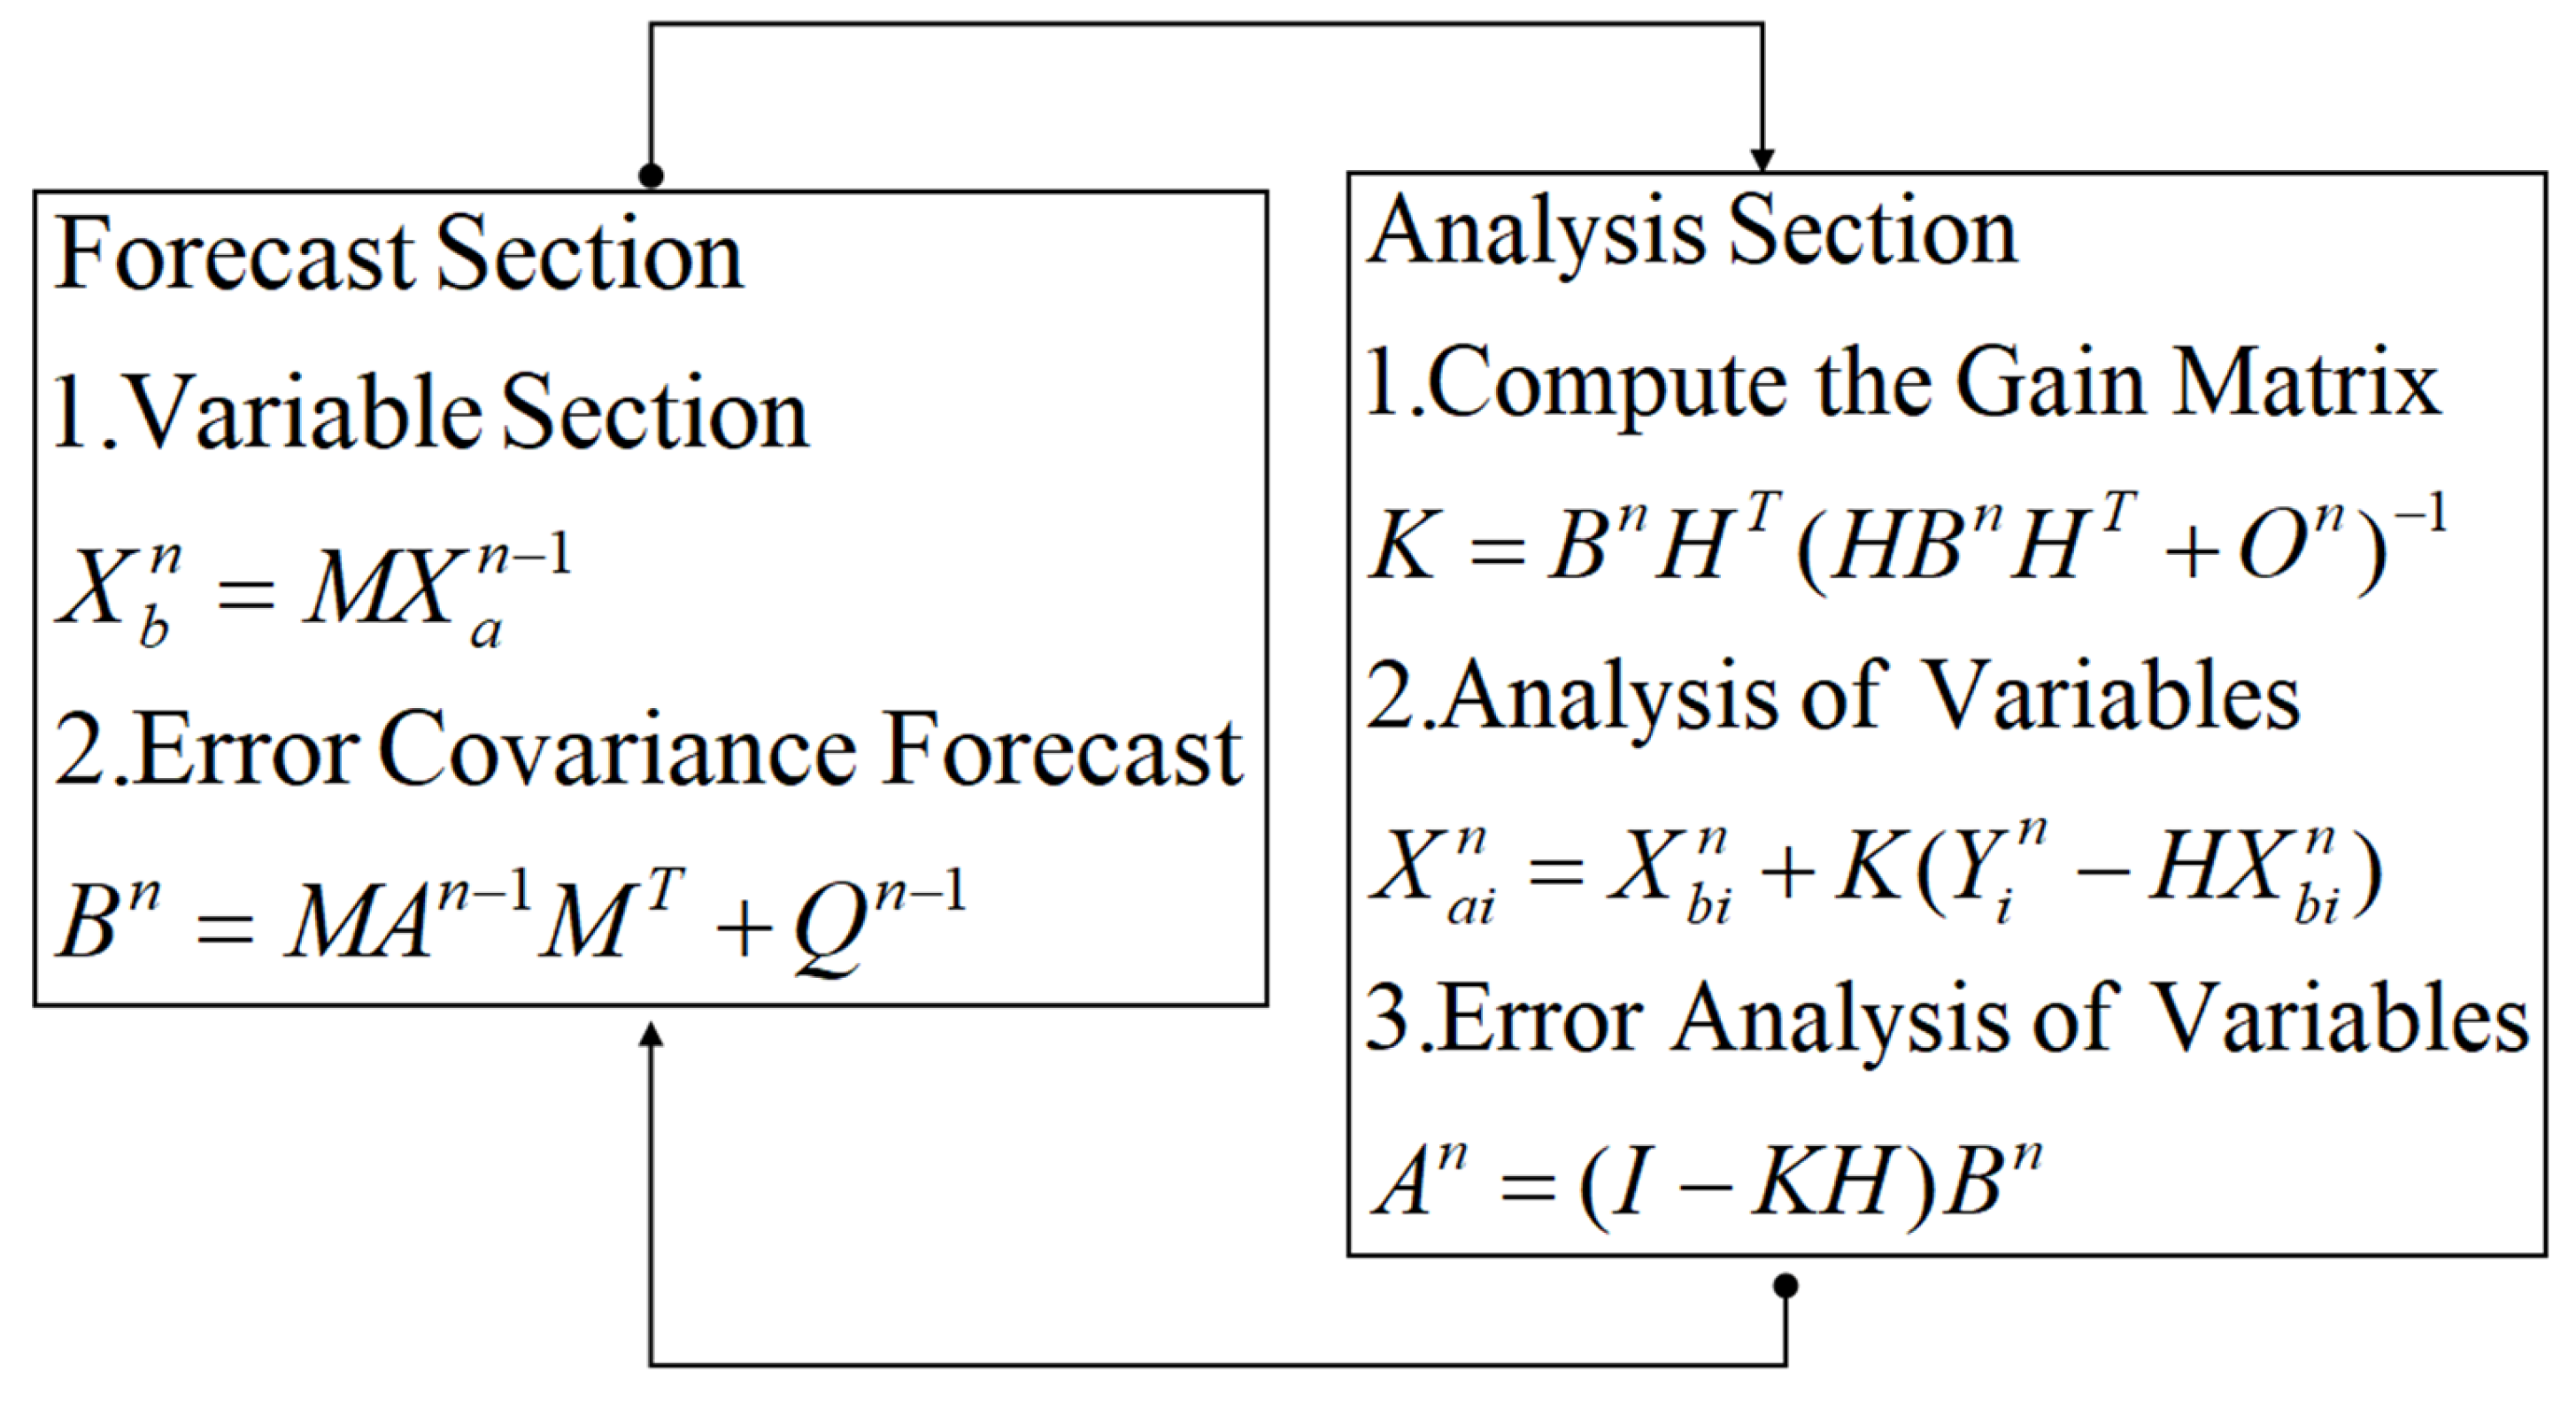
The assimilation method mainly studied in this paper is the Ensemble Kalman Filter method, which is a data assimilation algorithm based on minimum variance estimation. Different from the variational method, the data assimilation process of the Kalman Filter gives the optimal analysis value and analysis error distribution at the current time. The basic operation flow of Kalman Filter assimilation is a cycle: forecast, analysis and re-forecast. The relevant formula and calculation process are shown in Figure 2.
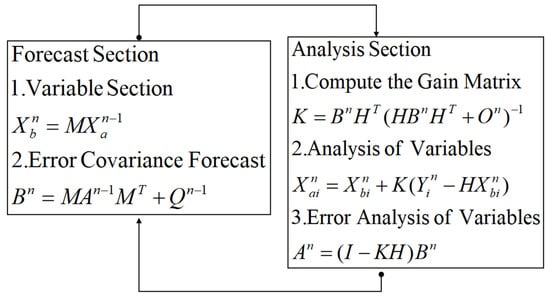
Figure 2.
The computational process of Kalman Filtering.
In the above figure, Y is the observation variable; M is the observation operator and the model prediction operator; A and O are the error covariance matrix of the analysis field and the model, respectively; and the meanings of the other letters are consistent with the previous formulas. In a linear system, we assume that the model error and the observed error are independent of each other and do not affect each other. At the same time, both matrix H and matrix M maintain linear properties.
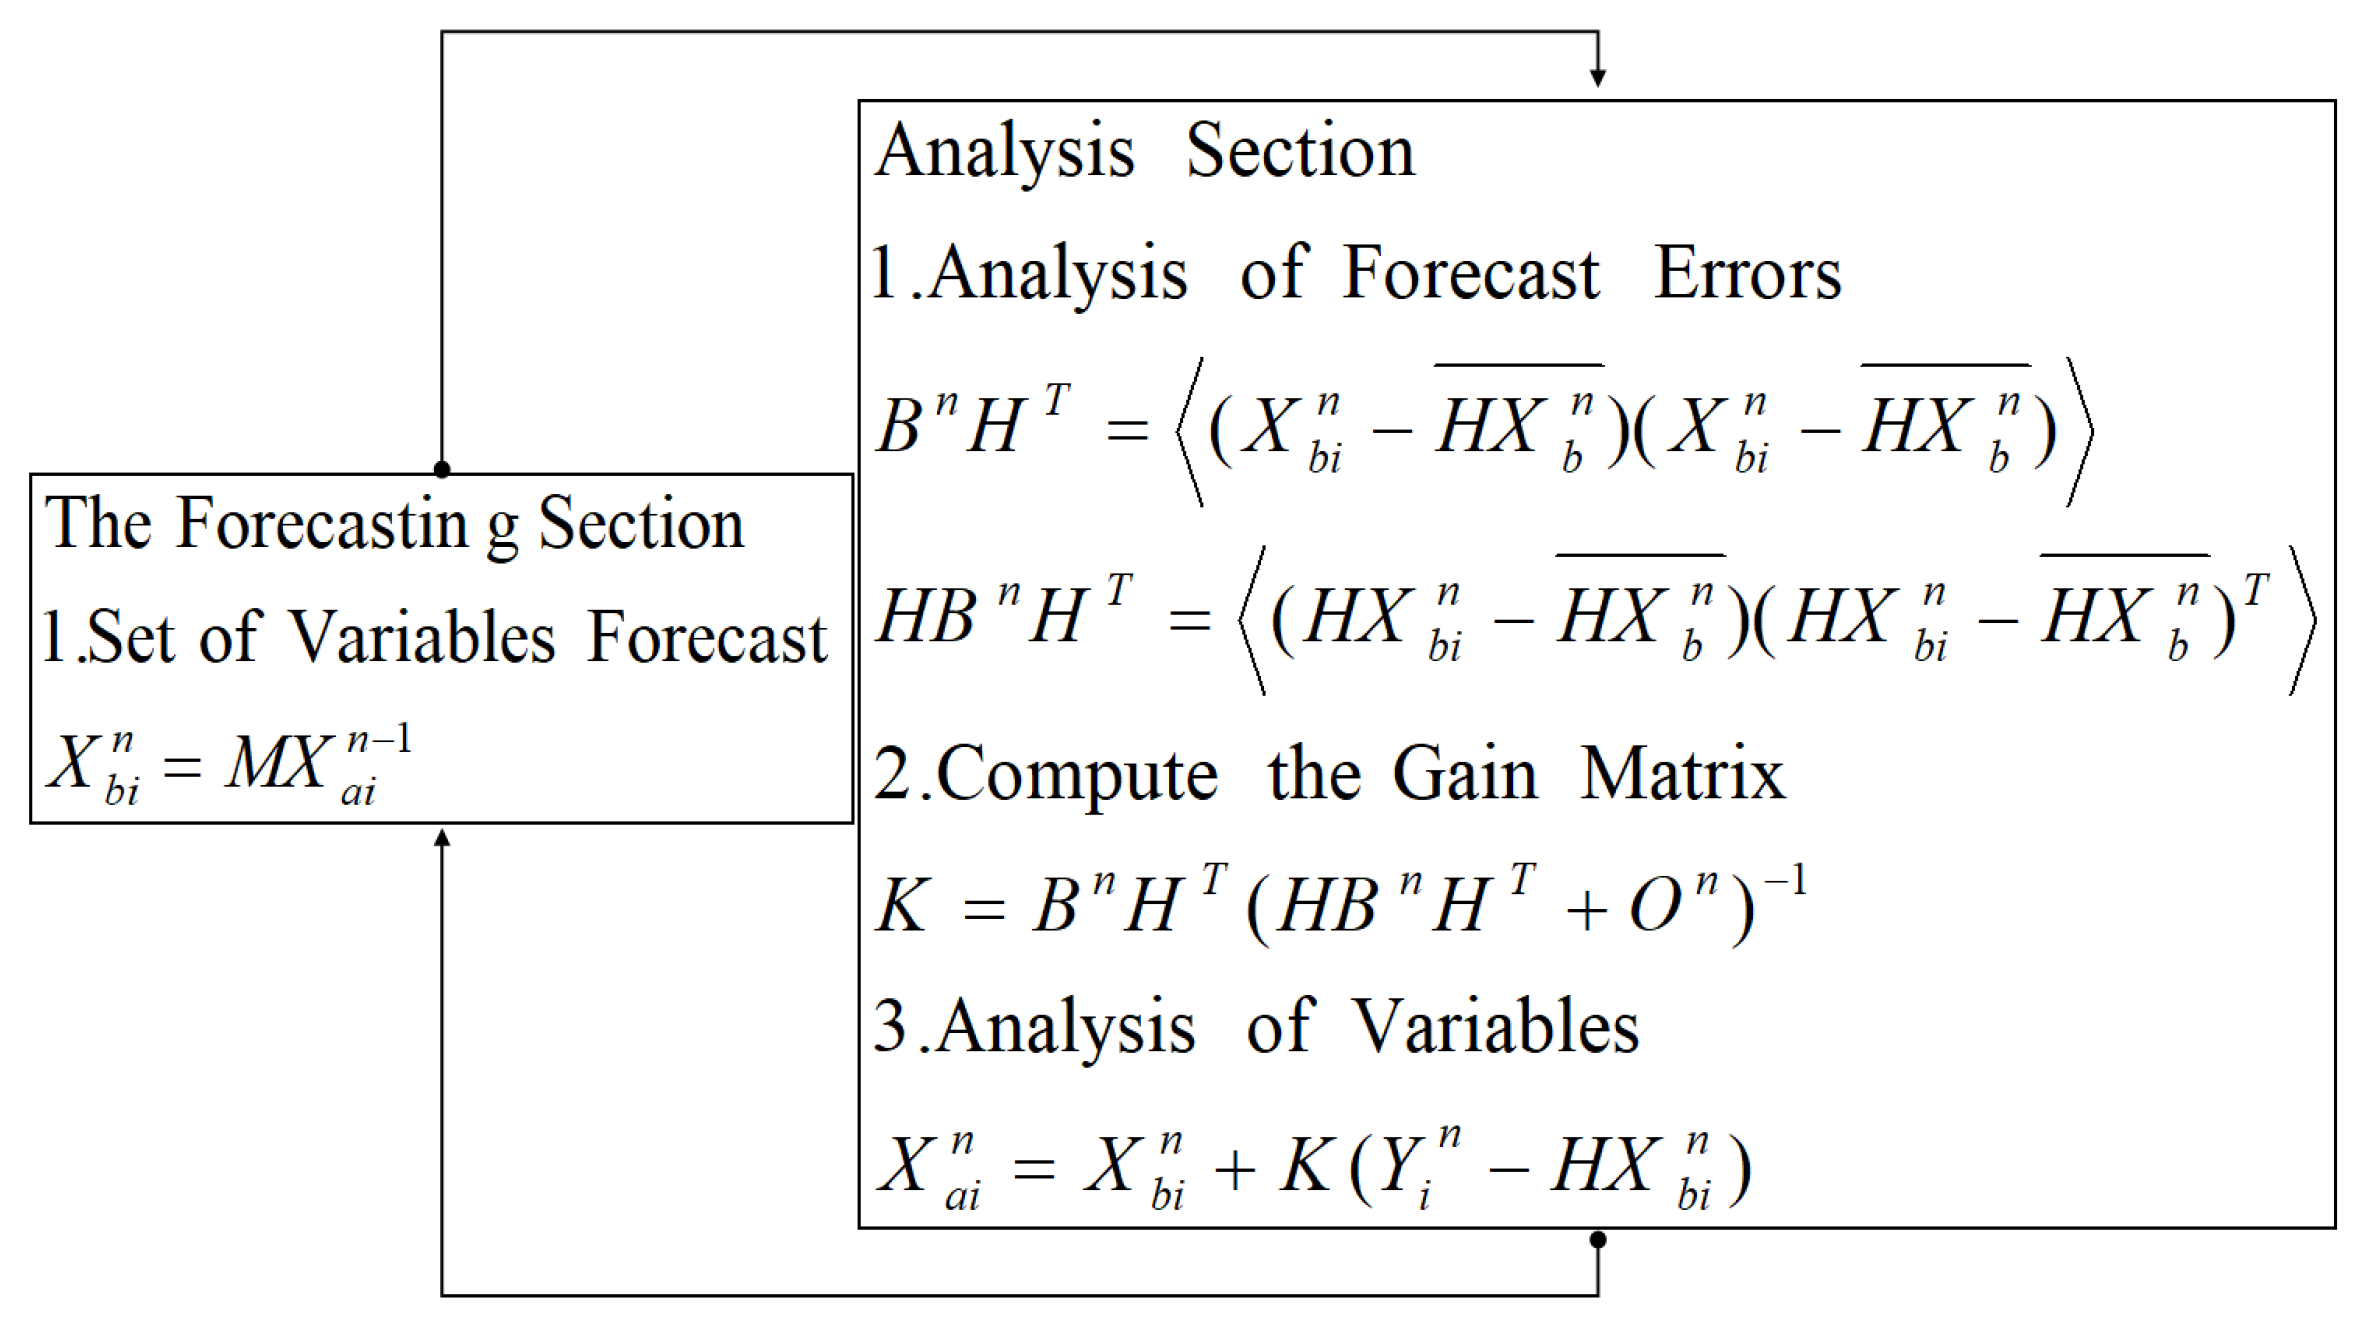
The Kalman Filter is an optimal estimation algorithm developed for linear models, so it cannot be directly used in meteorological numerical models, because the atmospheric model is a highly nonlinear system and the observation operators of many data also have strong nonlinear characteristics. However, with the continuous development and progress of the ensemble prediction concept [29], the Ensemble Kalman Filter (EnKF) method has gradually emerged. The EnKF does not need the tangential linear and adjoint models of observation operators and is suitable for dealing with nonlinear observation operators. The covariance matrix of the EnKF method has the characteristic of “changing with the flow pattern”, which makes the EnKF method effectively adapt to the complex development and evolution process of typhoon systems with strong asymmetry. Therefore, in the field of typhoon forecasting, the EnKF has shown significant advantages and broad application prospects. Some studies have shown that WRF-EnKF radar data assimilation systems can accurately analyze the detailed characteristics of the wind field and the microphysical quantity field of model storms [30]. The calculation process of Ensemble Kalman Filtering is similar to that of Kalman Filtering, but the key difference is that it uses the statistics of the ensemble members to calculate the error covariance. In traditional time-series analysis, statistical quantities may be computed from observations of the same variable at different times. However, the statistics in the Ensemble Kalman Filter do not rely on the temporal dimension, but rather on the “spatial distribution” across different ensemble members at the same time. While ensemble members are reintegrated during each assimilation cycle, the statistics are always calculated based on differences among ensemble members at the current time step, rather than through comparisons of data across different times.
When the set number i (where i = 1, 2, 3, …) is large enough and representative enough, the above approximate expression can be regarded as an equivalent. The relevant formula and calculation process are shown in Figure 3.
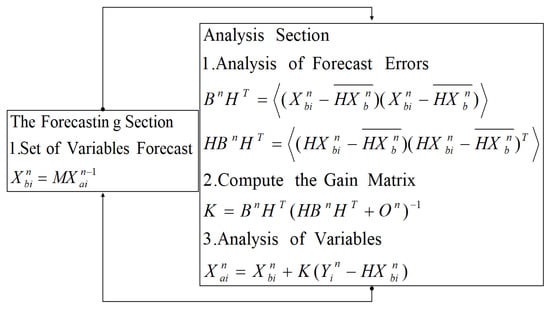
Figure 3.
Computational process of Ensemble Kalman Filtering.
3. Case Introduction and Experimental Description
3.1. Typhoon Lekima Case Introduction
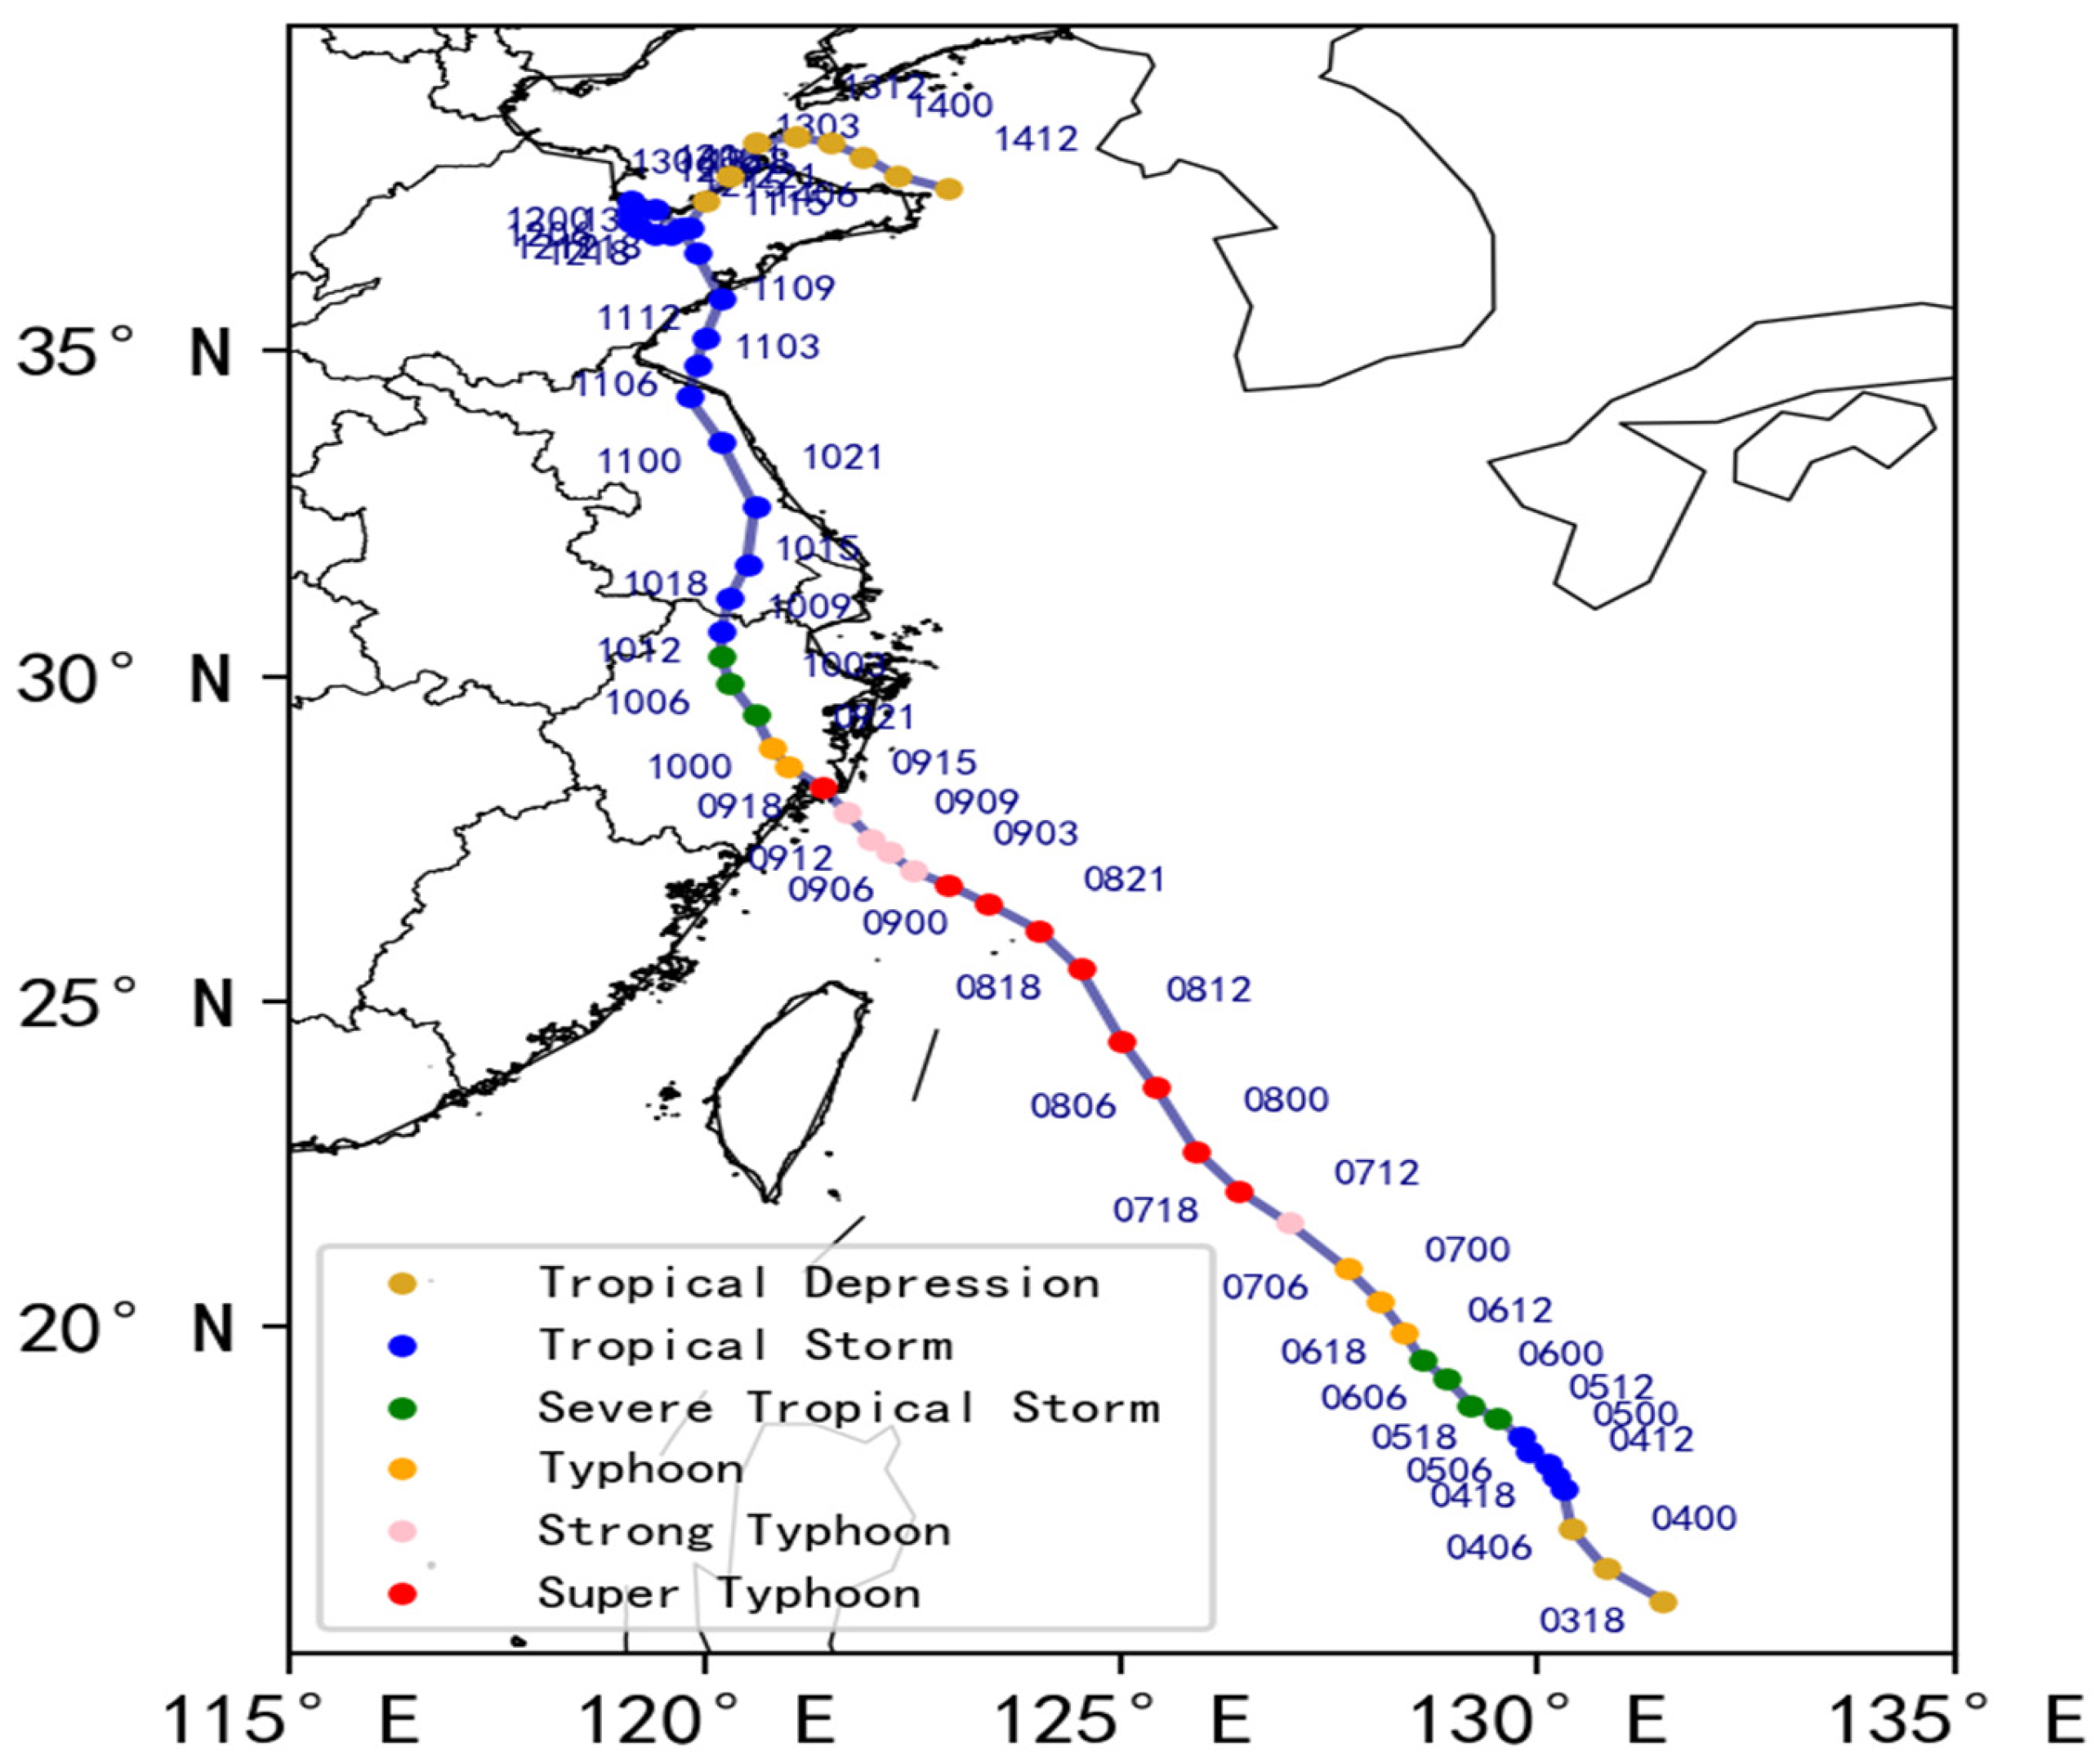
Figure 4 shows the best track of Typhoon Lekima in 2019. The typhoon formed in the Western Pacific Ocean at 0900 UTC on 4 August and successfully landed in the coastal area of Wenling City, Zhejiang Province, at 1745 UTC on 9 August, with the maximum wind force near the center reaching force 16. After that, Lekima continued to push north, passing through Jiangsu and Shandong Provinces. Finally, at 1250 UTC on 11 August, it made landfall again in Qingdao, where its maximum wind force reached 9. With a life cycle of 11 days and a land retention time of 44 h, Typhoon Lekima lasted for a long time, and caused long duration, large cumulative rainfall in east and northeast China, making it the tropical cyclone that caused the most serious economic losses in China in 2019 [31]. This study mainly studies the influence of EnKF direct assimilation radar radial velocity on Lekima analysis and forecast.
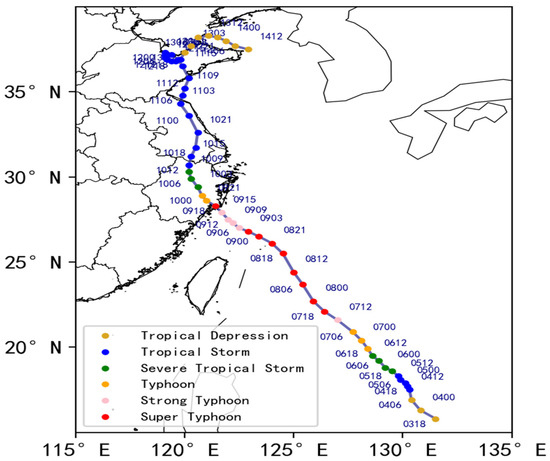
Figure 4.
The observed track of Typhoon Lekima. The time format in the figure is day:hour (UTC). Data shown at 6-hourly intervals between 18:00 UTC on 3 August and 1200UTC on 14 August 2019.
3.2. Large-Scale Synoptic Background
The large-scale circulation situation will change obviously before and after the typhoon landfall, so this paper will use the hourly pressure level reanalysis data of ERA5 to analyze the large-scale circulation situation before and after the typhoon landfall.
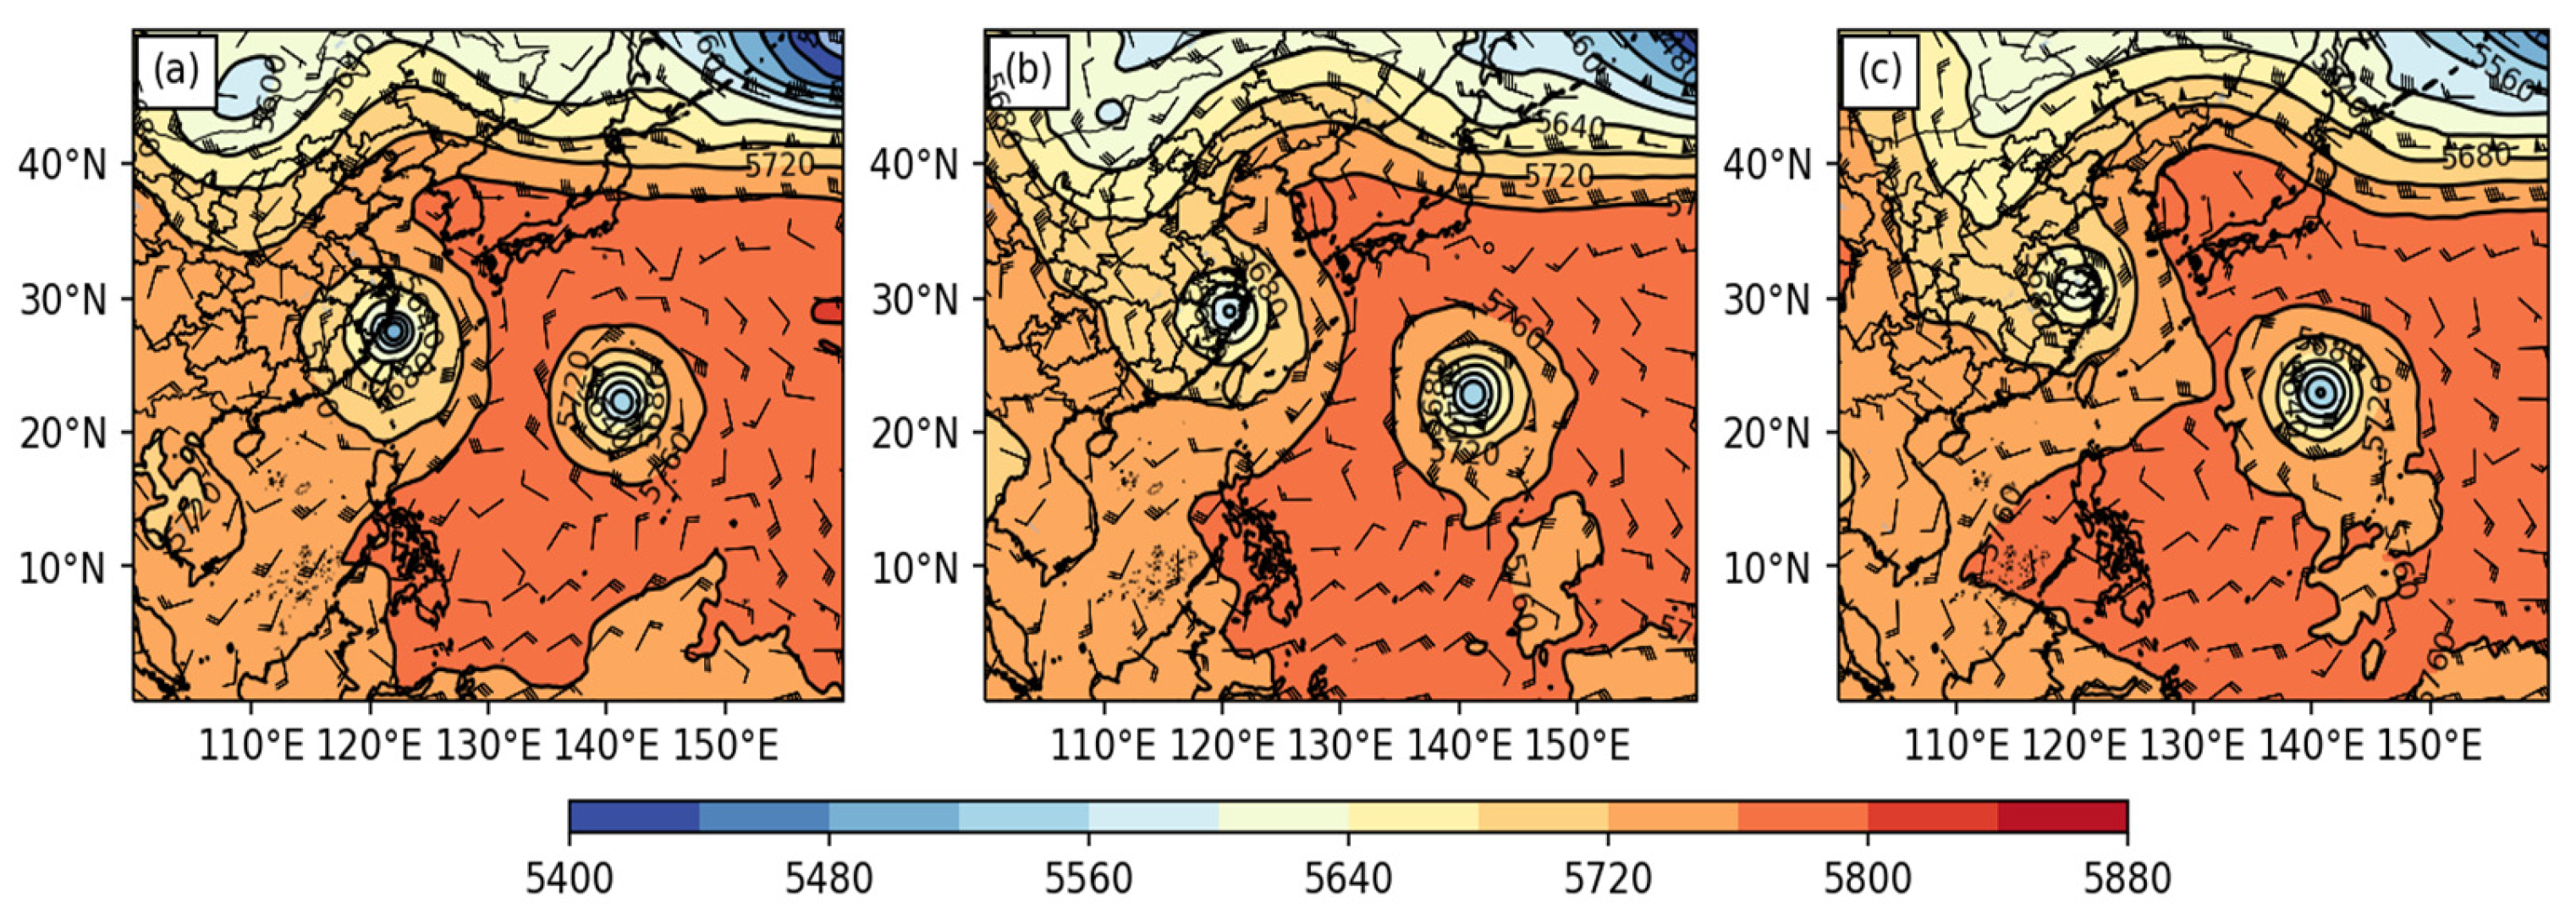
As shown in Figure 5, on the 500 hPa isobaric surface, the circulation pattern in the mid-to-high latitudes is characterized by two troughs and one ridge, which is also one of the main circulation patterns in China. Specifically, the East Asia Major trough is located at the Shan–Jin junction, with a ridge of high pressure extending from the Korean Peninsula to near the northeast region, and a small trough near Japan. At 12:00 on 9 August (Figure 5a), Typhoon Lekima had not yet landed, and the typhoon center was near the coast of Zhejiang and outside the subtropical high (abbreviation: subtropical high, the same below), and the Korean Peninsula was controlled by the subtropical high. It can be seen from the figure that the typhoon moves in the northwest direction, which should be guided by the southeast air flow outside the subtropical high. Between 00:00 (Figure 5b) and 12:00 (Figure 5c) on 10 August, Typhoon Lekima made landfall, and its center gradually moved away from the subtropical high area and entered the trough of low pressure. Because of this, the southeast flow outside the subtropical high has weakened its guiding effect on the typhoon. At this time, the typhoon was mainly guided by the flow in the East Asian trough and moved eastward to the north. In addition, due to the impact of topographic friction and other factors after landfall, the typhoon’s moving speed slowed down, and its intensity also decreased. At 850 hPa, from 1200 UTC on 9 August 2019 to 1200 UTC on 10 August 2019, southwest low-level jets and easterly jets with wind speeds exceeding 12 m/s were observed on the southeastern and northern flanks of Typhoon Lekima [20]. These two jets transported abundant heat and water vapor for the heavy rainfall process, establishing ideal water vapor conditions. Notably, the typhoon was situated within the left-side convergence zone of the southwestern low-level jet stream’s exit region, where lower-tropospheric convergence initiated pronounced vertical ascent, creating favorable dynamic lifting conditions for precipitation development.
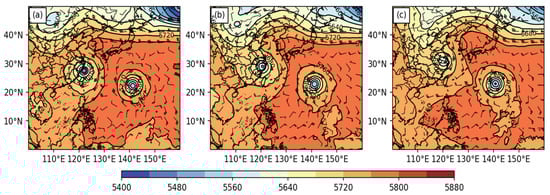
Figure 5.
At 500 hPa, wind (wind barbs, unit: m/s) and geopotential height (shaded and contour, unit: gpm) at (a) 1200 UTC on 9 August, (b) 0000 UTC on 10 August and (c) 1200 UTC on 10 August.
3.3. WRF Model Configurations
This paper is based on WRF-ARW model, version 4.1, to conduct the numerical simulation of tropical cyclone Lekima. The numerical simulations spanned from 0000 UTC on 9 August to 1200 UTC on 10 August 2019. The specific settings of the simulation scheme are as follows:
- (1)
- In terms of the setting of the horizontal region, Lambert map projection was adopted in the simulation. The simulation region is shown in Figure 6. The number of horizontal cells in the region was 601 × 601, the horizontal cell distance was 3 km in both the x- and y-directions, and the longitude and latitude of the center of the model were 127.0°E, 26.0°N.
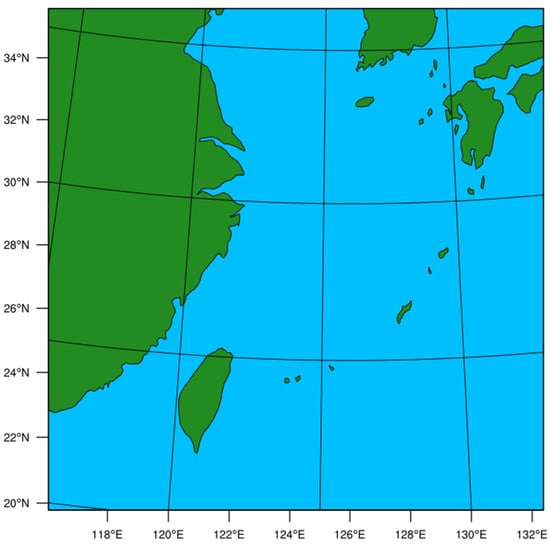 Figure 6. Configuration of the WRF model domain for Typhoon Lekima (August 2019), with a 3 km horizontal resolution.
- (2)
- In terms of vertical stratification, the number of vertical layers was 51.
- (3)
- In terms of the integration time setting, the model integral step was 15 s. The deterministic forecast was initialized at 1200 UTC on 9 August 2019, spanning a 24 h period, with model outputs archived hourly from 1200 UTC on 10 August 2019.
- (4)
- The physical parameterization configurations implemented in this research study are summarized in Table 1.
 Table 1. Physical parameterization schemes.
3.4. Experimental Designs
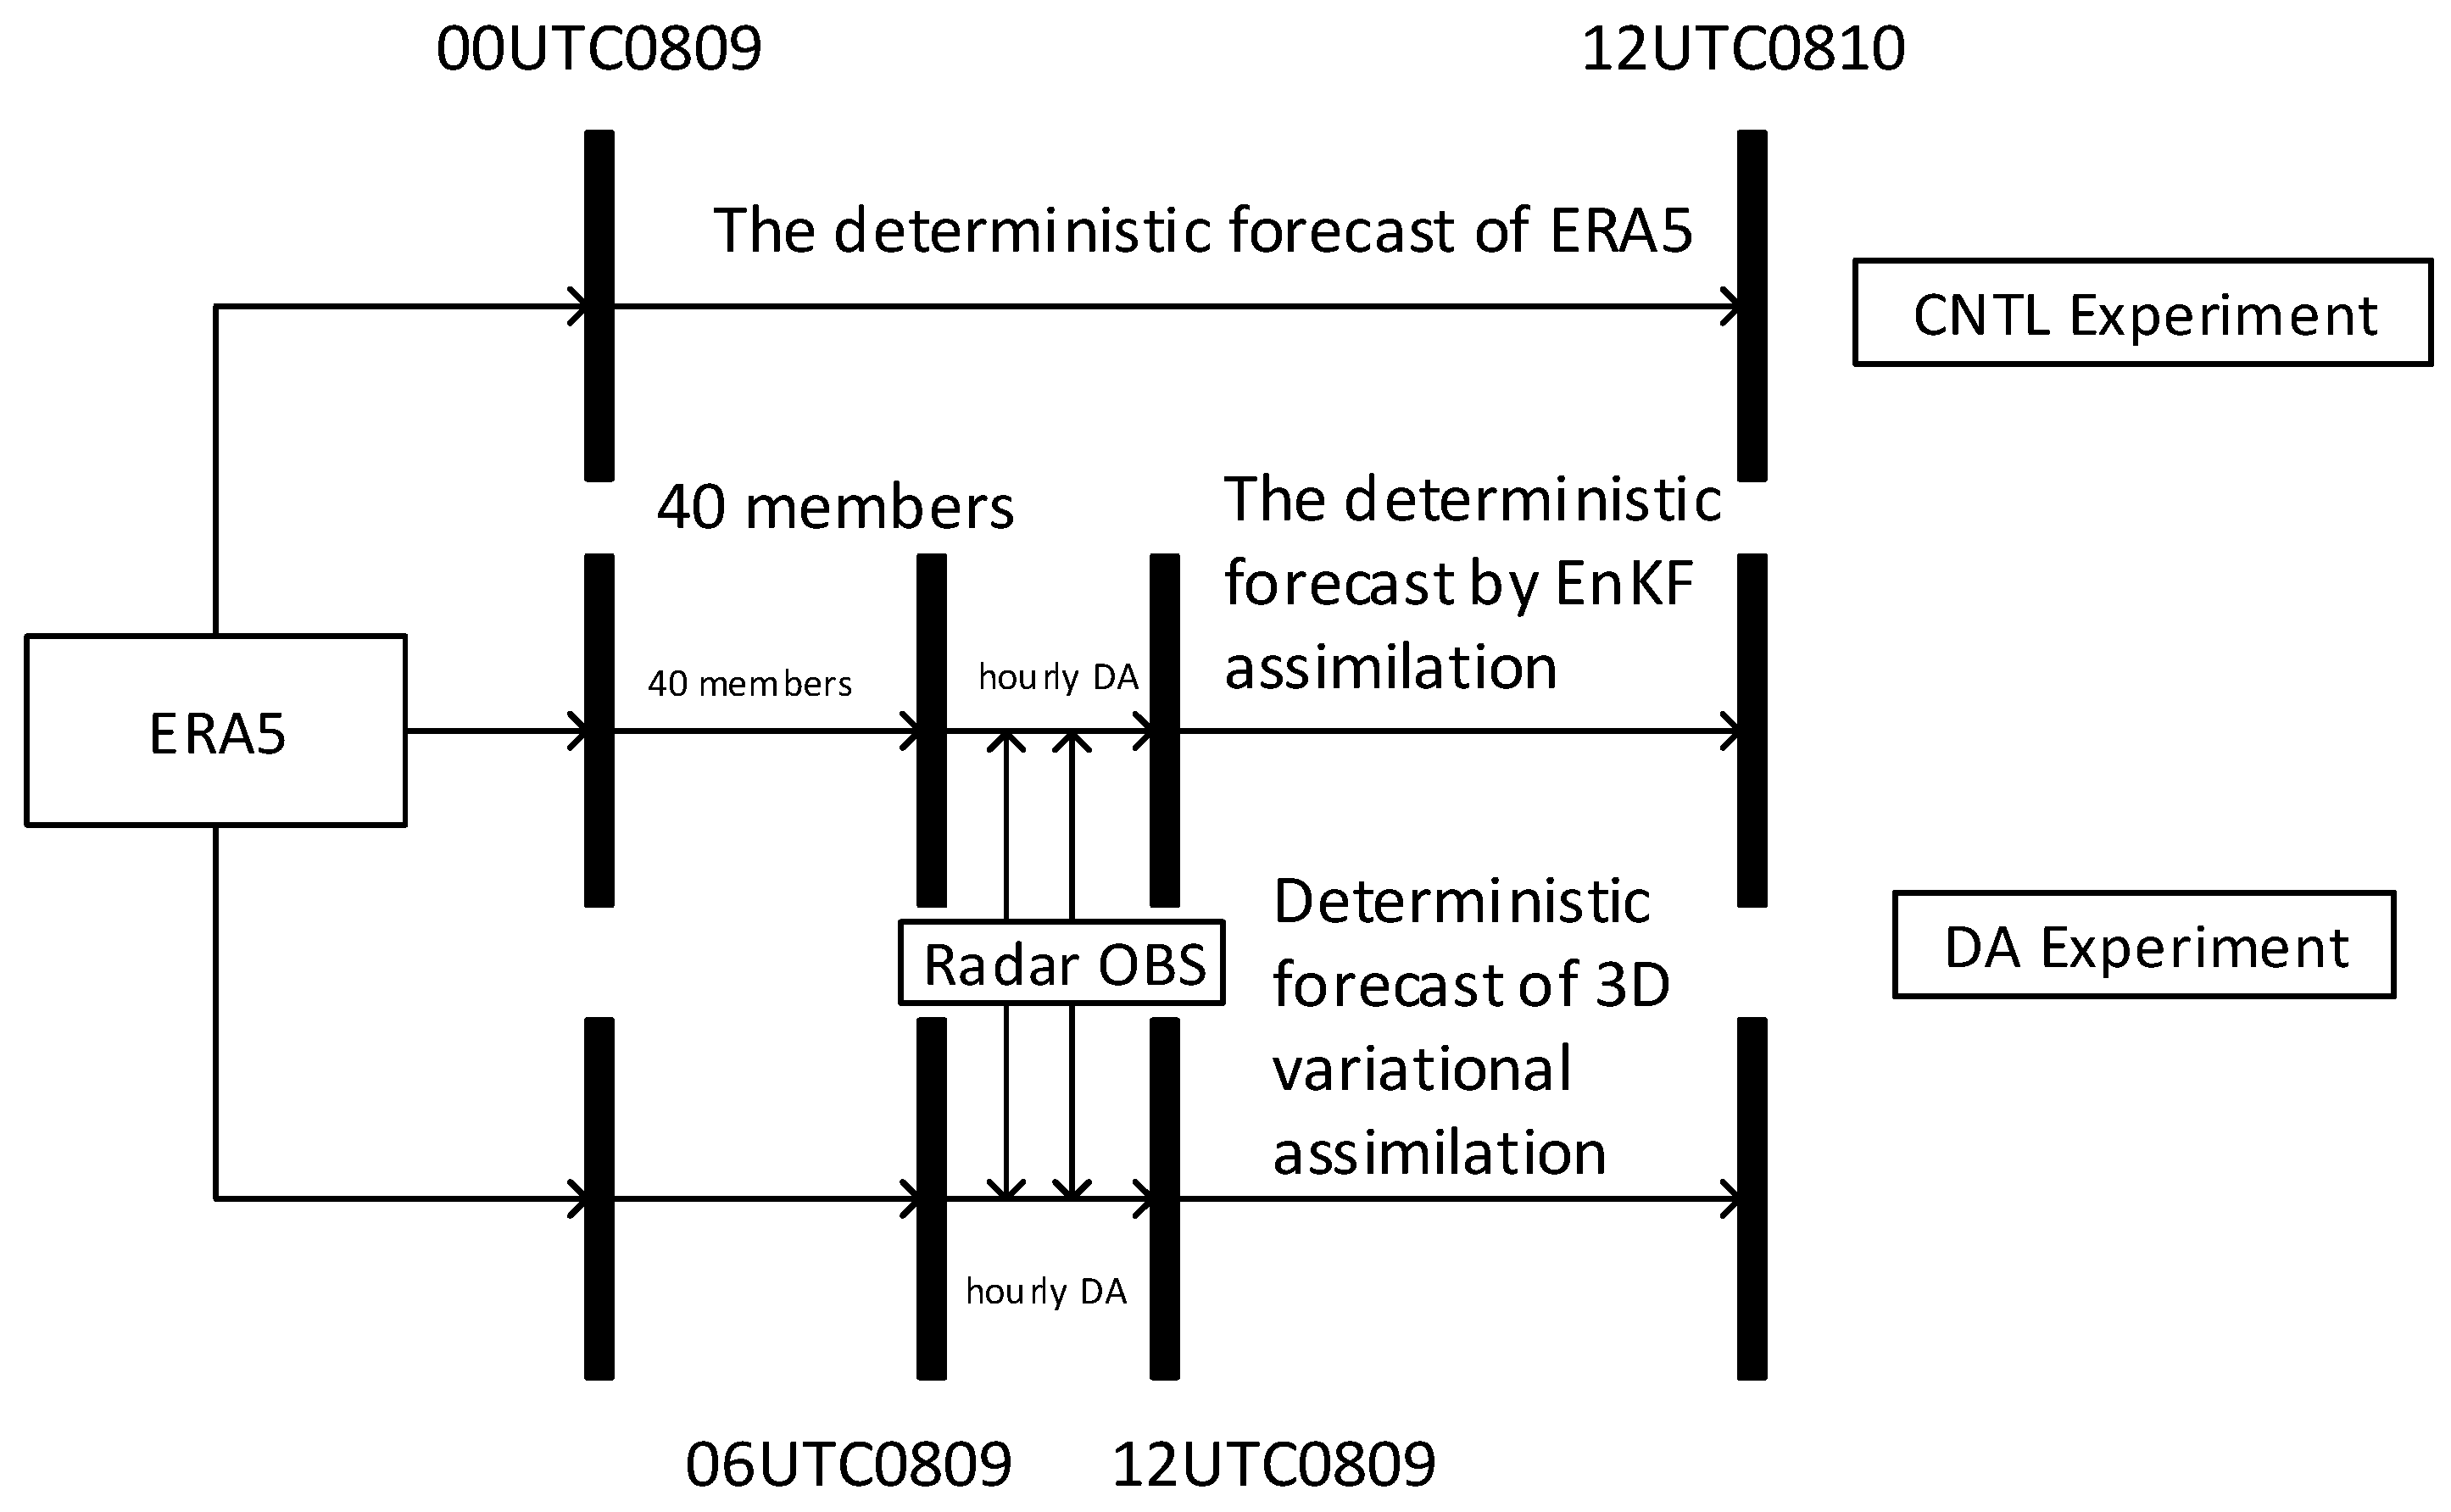
Figure 7 presents a flow chart outlining the three experiments conducted in this study. First, the control experiment (referred to as ‘CNTL’) was performed without data assimilation, with a 36 h forecast initialized from ERA5 data spanning from 0000 UTC on 9 August to 1200 UTC on 10 August. The other two experiments assimilated radar radial velocity data hourly, beginning at 0600 UTC on 9 August after a 6 h spin-up period, followed by a 12 h deterministic forecast after seven assimilation cycles. The 3DVAR assimilation experiment was conducted using the WRFDA system with control variable option 5 (CV5). The static background error covariance was calculated statistically using the National Meteorological Center (NMC) method [32]. For the EnKF assimilation experiment, 40 ensemble members were generated to represent the evolving forecast error covariance. Specifically, WRFDA’s CV option 5 was used to create ensemble members with physically balanced random perturbations by perturbing the control variables. The perturbed variables included horizontal wind components, water vapor mixing ratio, potential temperature, and pressure, with corresponding standard deviations of 2 m/s, 0.6 g/kg, 1 K, and 40 Pa. This perturbation procedure was also applied to the boundary conditions of the ensemble members. Integrating the model for 6 h allowed for the development of flow-dependent background error covariance. During the ensemble assimilation cycles, covariance localization was performed using a Gaussian-like polynomial function [33], with horizontal and vertical localization radii set to 30 km and the full model depth, respectively. Covariance inflation was implemented using the relaxation-to-prior-perturbation method [34], with a relaxation coefficient of 0.8, meaning that the final perturbations consist of 20% analysis perturbation and 80% prior perturbation.

Figure 7.
Flow chart of control experiment and radar data assimilation experiments.
4. Result of Predictions
In the next two sections, the intensity, track, and rainfall prediction of Lekima is first presented, followed by the illustration of the typhoon structure of Lekima. Lastly, detailed analyses and diagnoses of Lekima are shown.
4.1. Intensity and Track
The model’s predictive capability for typhoon trajectory and intensity was evaluated against the CMA best-track data, utilizing critical metrics including geospatial coordinates of the vortex center, minimum sea-level pressure and peak 10 m wind speed. The analysis focused on the 24 h period from 1200 UTC on 9 August to 1200 UTC on 10 August 2019, with temporal sampling at 6 h intervals. Model outputs were temporally aligned with observational data for validation purposes.
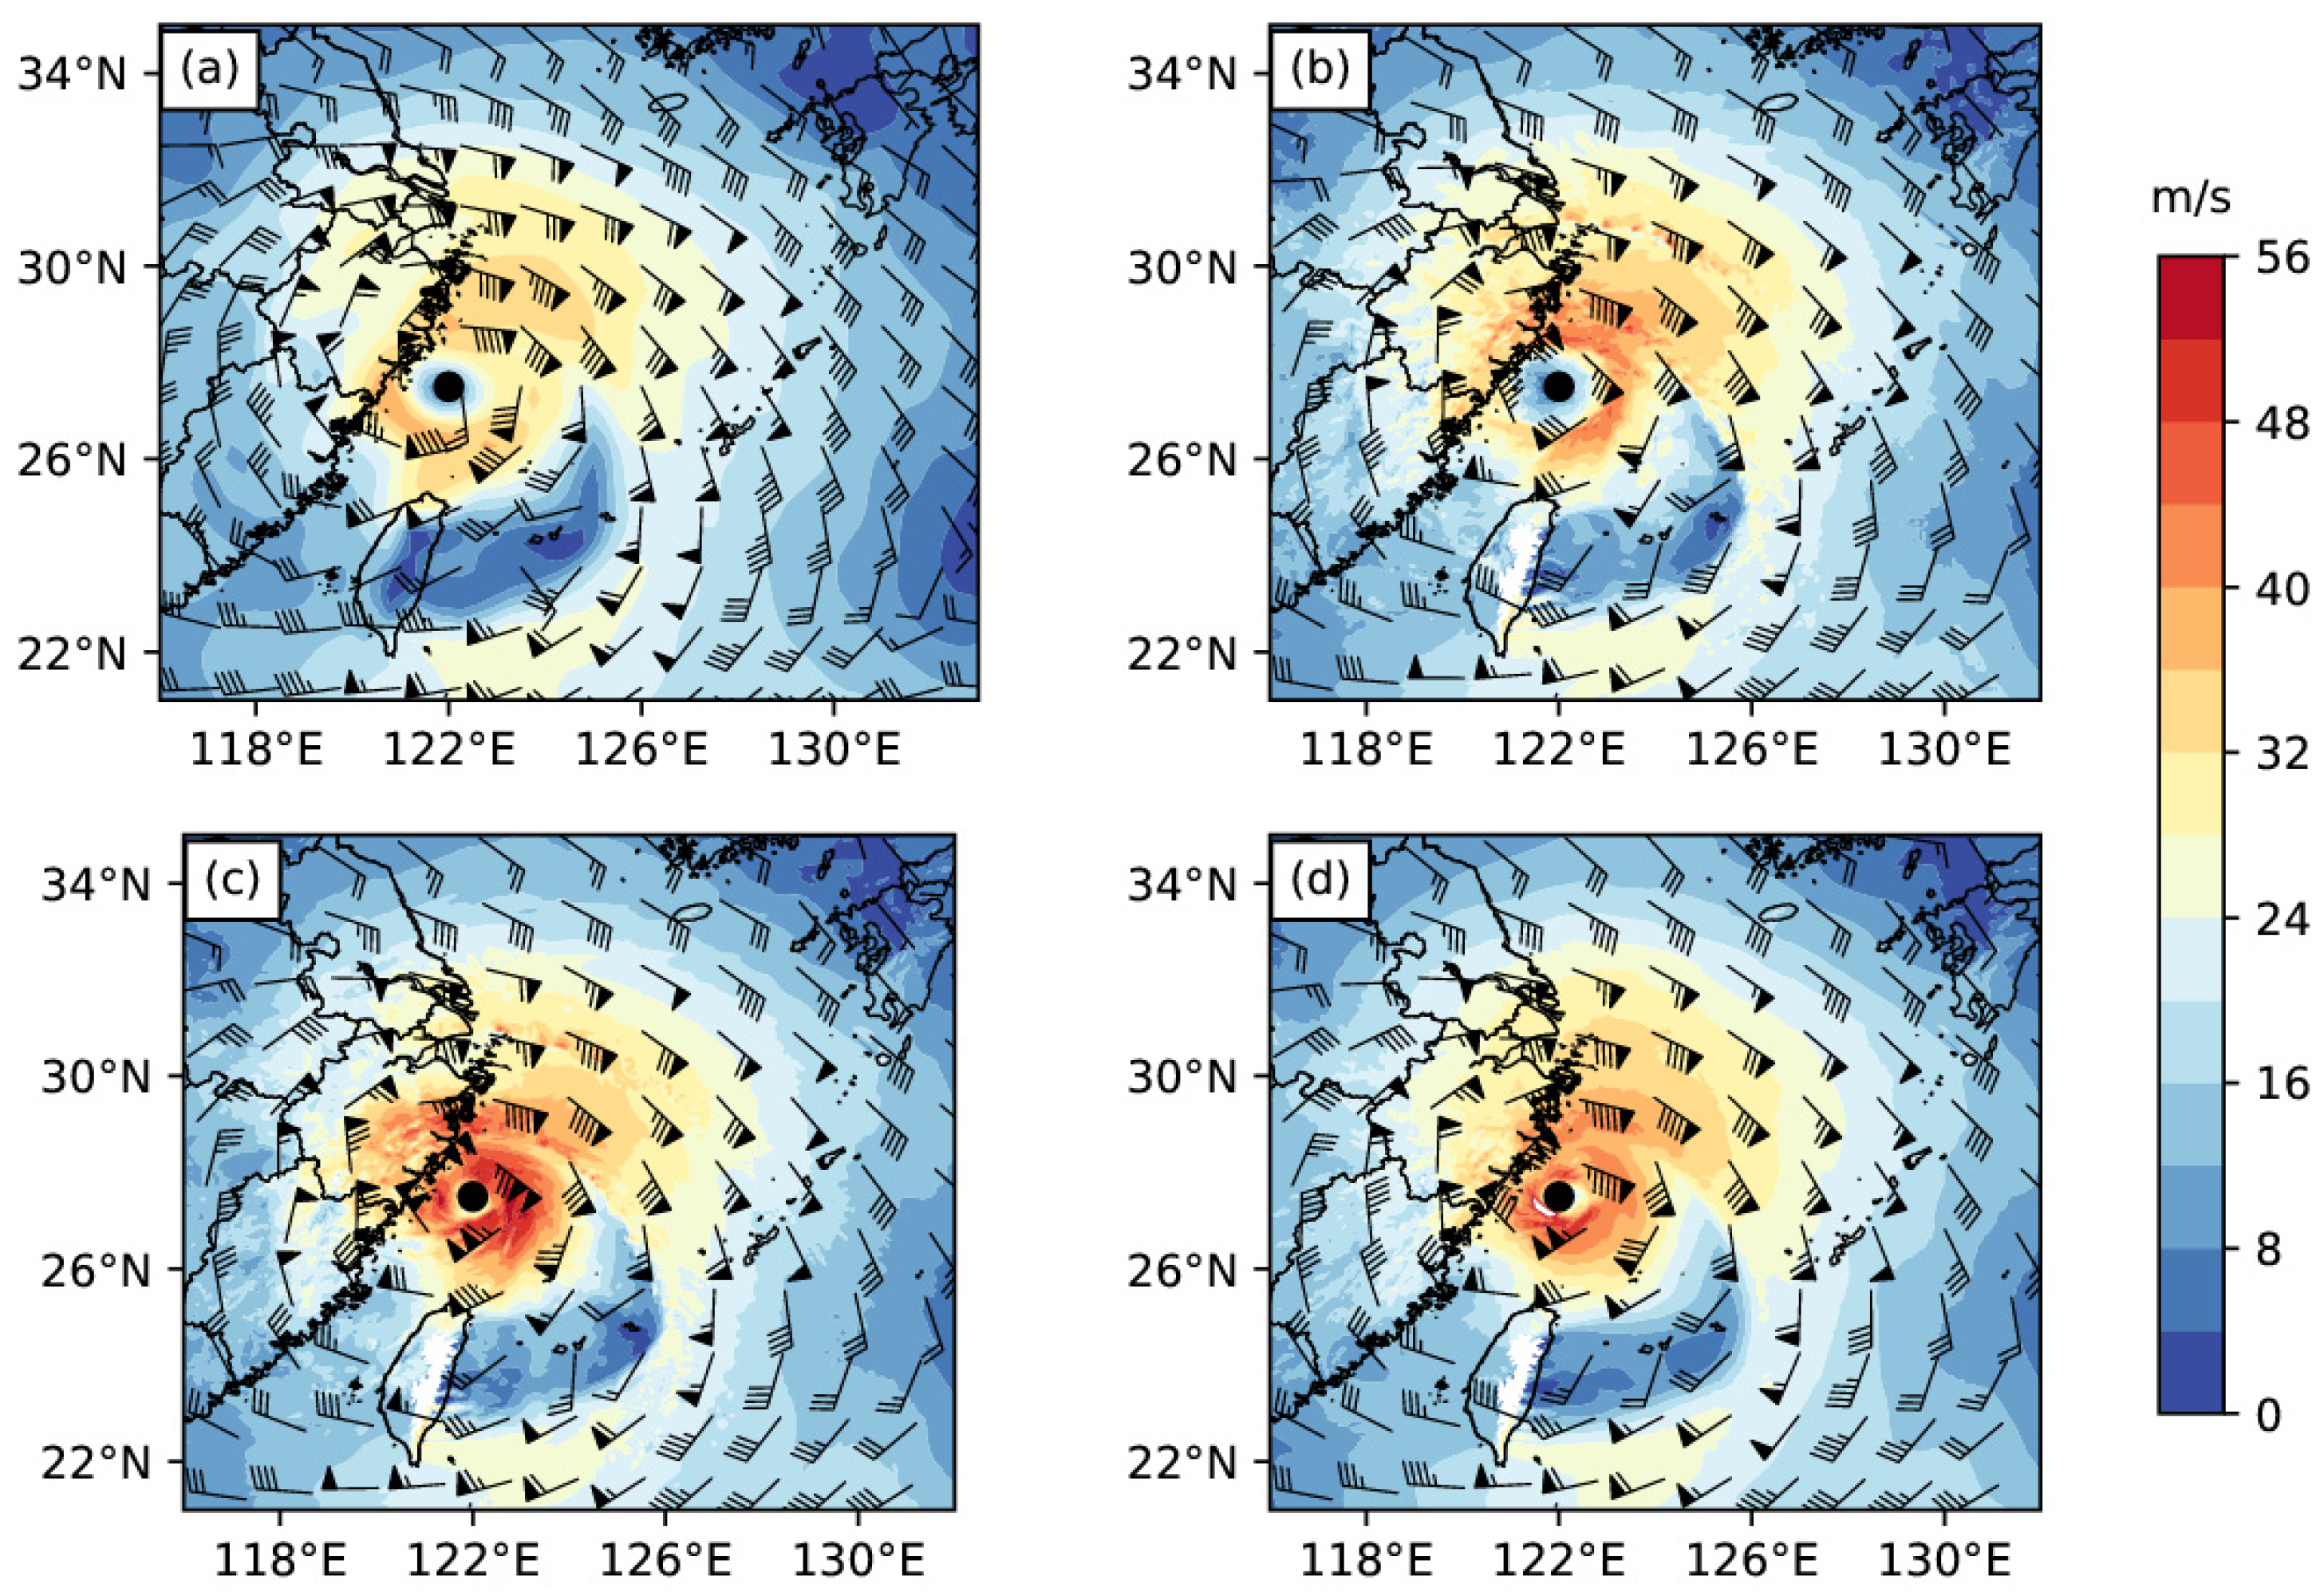
Figure 8 displays the spatial configuration of both sea-level pressure and wind vectors derived from the ERA5 initialization dataset, control test and assimilation test at 12:00 on 9 August 2019, before typhoon landfall. The control simulation results presented in Figure 8b reveal a systematic westward shift in typhoon positioning compared with the initial analysis, while generating 10 m wind-speed maxima of ~28 m/s near the vortex core, which is consistent with the initial field. Compared with the non-assimilated control test, both the 3DVAR (Figure 8c) and EnKF (Figure 8d) assimilation tests positioned the typhoon center in closer agreement with observations, nearly coinciding with the actual location. The simulations simultaneously demonstrated the intensification of 10 m wind maxima within the typhoon’s core region, with peak values exceeding 36 m/s. The corresponding central sea-level pressure was approximately 970 hPa in the control run. Correspondingly, the pressure value obtained by the 3DVAR assimilation test was about 950 hPa, and the result of EnKF assimilation test was about 960 hPa. Generally, it can be seen that at 12:00 on 9 August, compared with the control test, the assimilated sea-level pressure of the two groups was closer to the observation, indicating that after the assimilation of the radar radial velocity, the possible overestimation deviation was effectively corrected, thus making the sea-level pressure more similar to the actual observation.
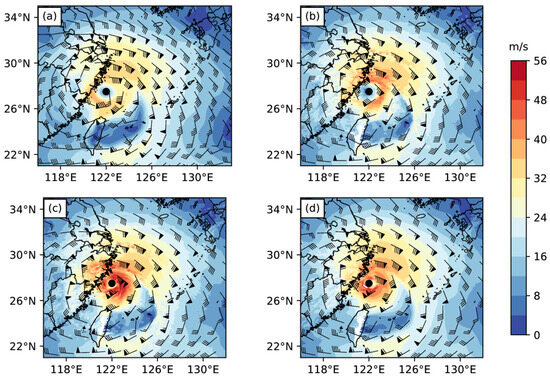
Figure 8.
Configuration of 10 m wind speed (shaded, unit: m/s) and wind (wind barbs, unit: m/s) of Typhoon Lekima at 1200 UTC on 9 August 2019 from (a) ERA5 Initial Field, (b) CNTL, (c) 3DVAR and (d) EnKF assimilation experiments. The measured position of Typhoon Lekima at this moment is indicated by the black dot.
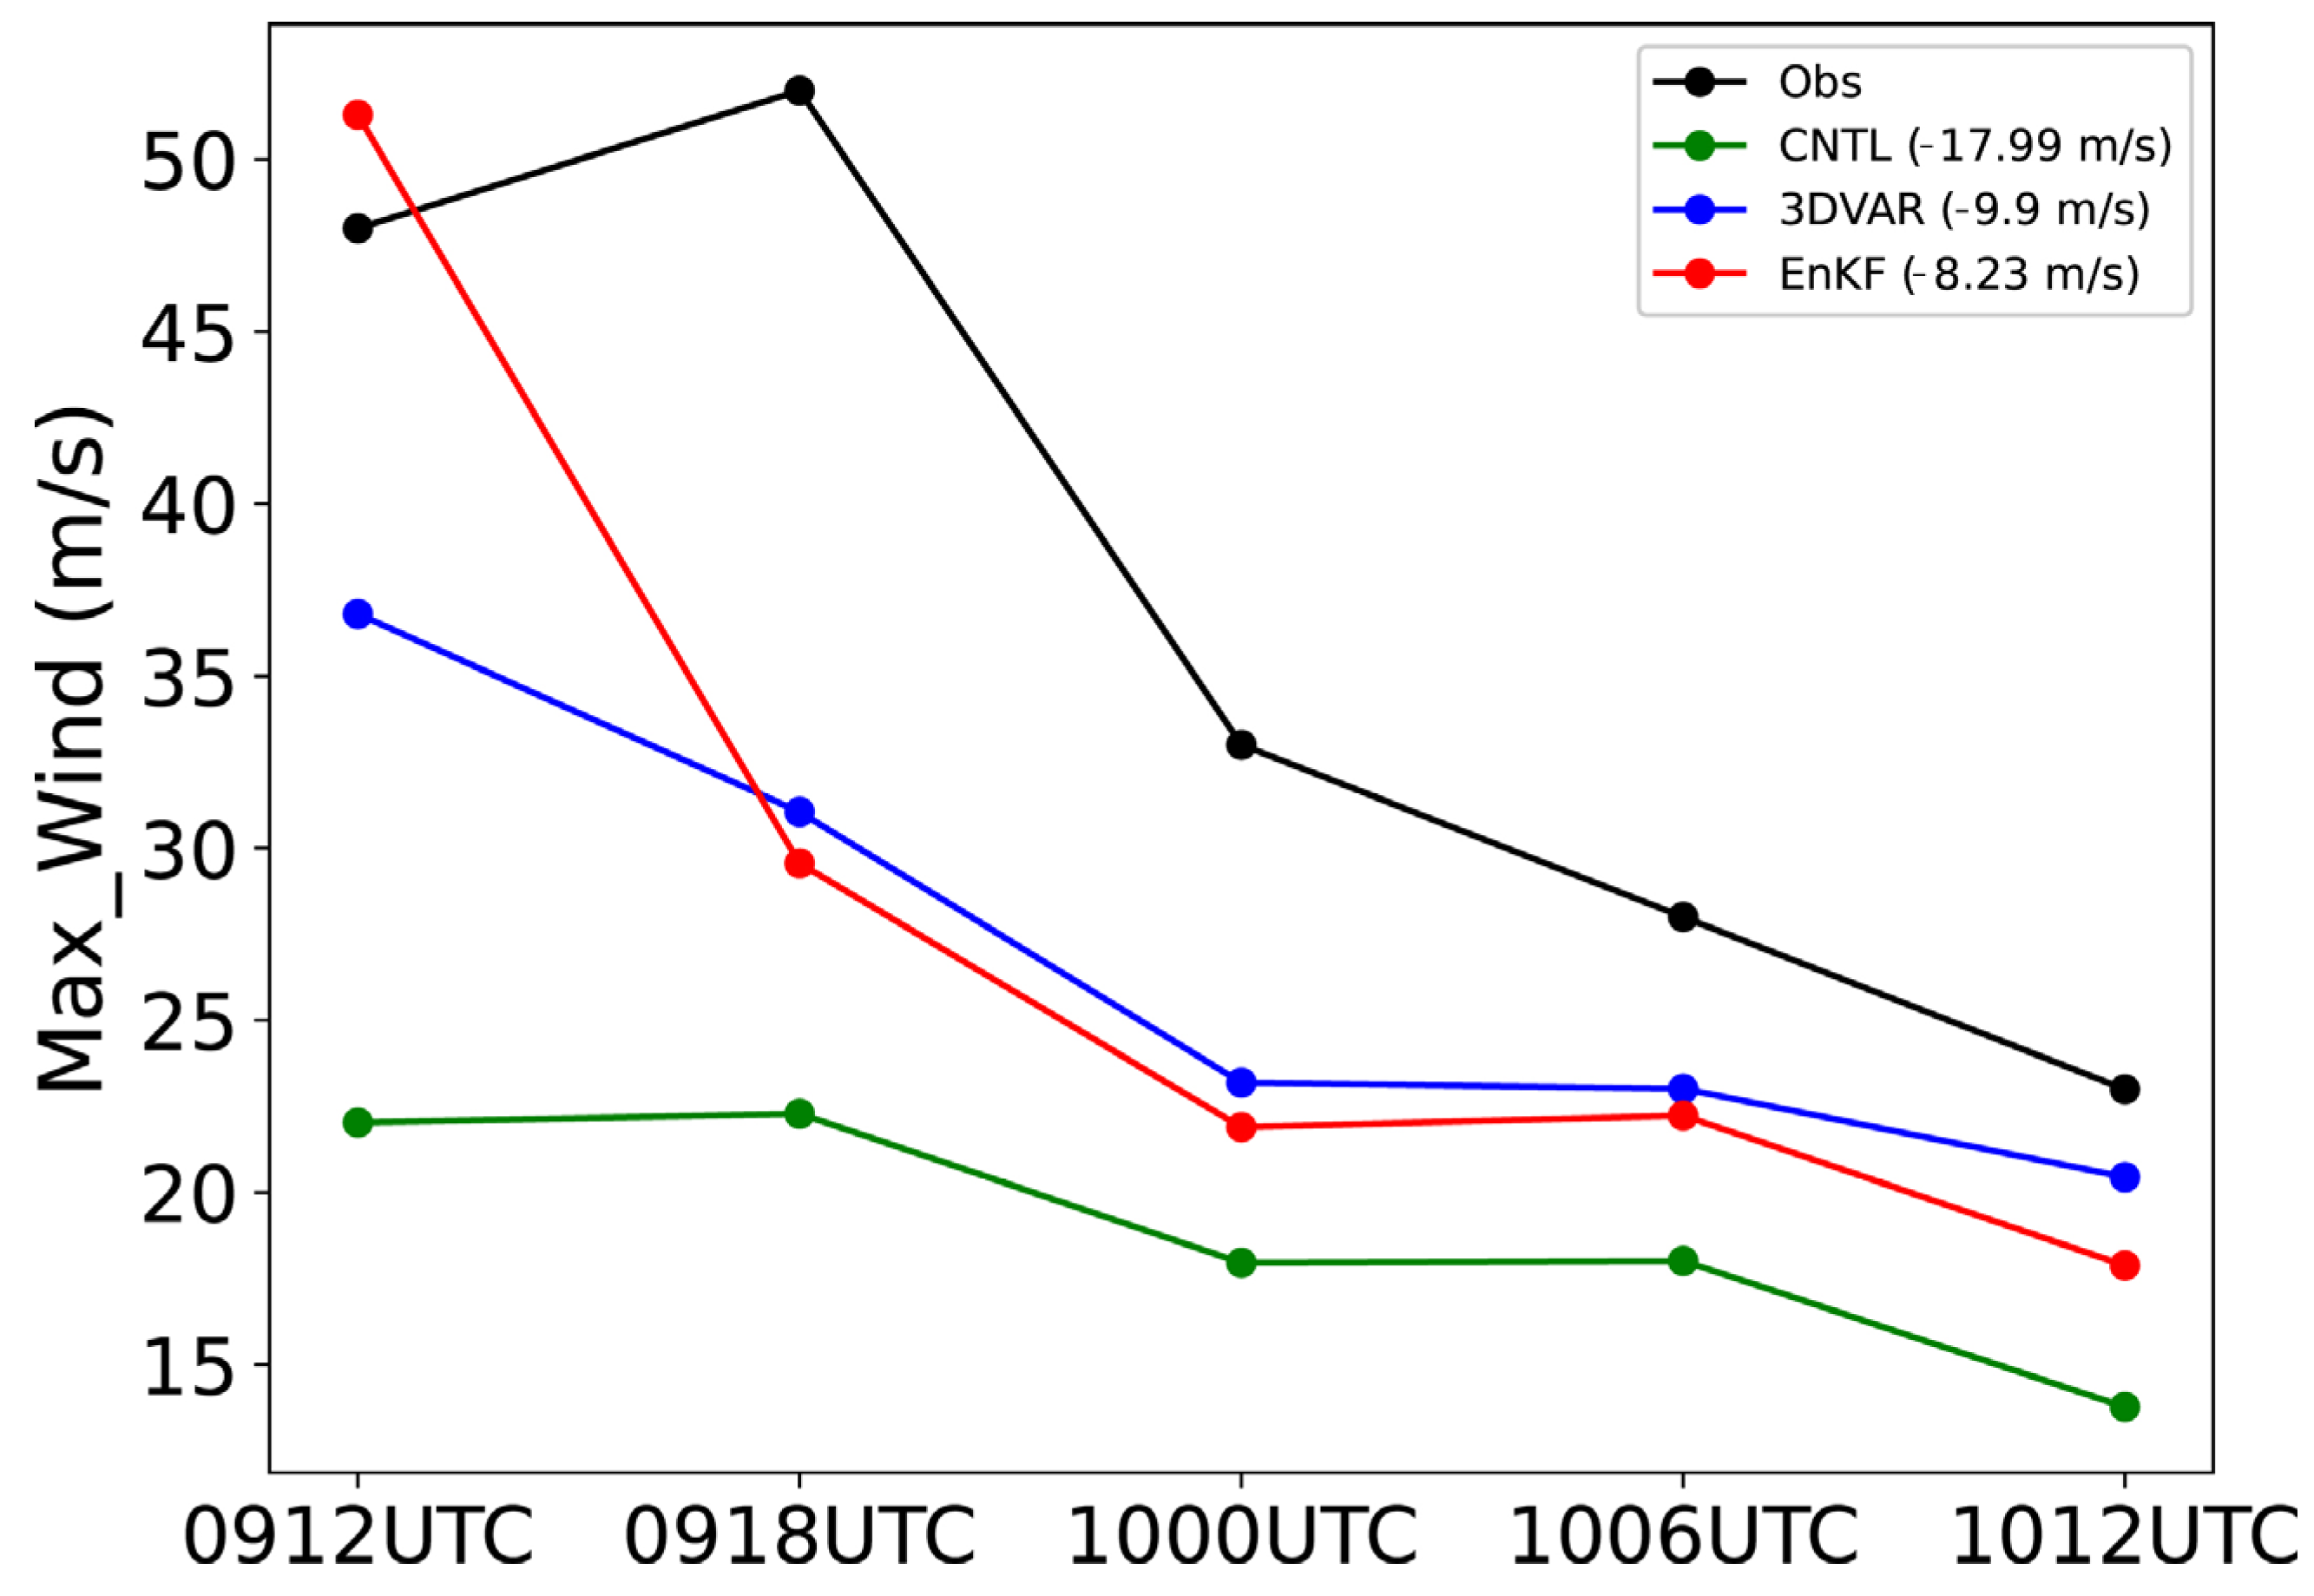
Figure 9 presents a 24 h forecast comparison of 10 m maximum wind speeds for Typhoon Lekima (2019) between model experiments (control and assimilation) and observed measurements from 1200UTC on 9 August to 1200UTC on 10 August 2019. It is found that at 12:00 on 9 August, that is, before the typhoon landed, compared with the control test, the 10 m maximum wind speed of the two groups of tests after radar radial velocity assimilation was closer to the observation, among which the 10 m maximum wind speed predicted by the EnKF assimilation test was very close to the reality. From then to 18:00 on 9 August, the actual maximum wind speed showed an increasing trend, but the maximum wind speed of the control test was basically unchanged, and the wind speed of the two groups of assimilation tests showed a decreasing trend, and the maximum wind speed of the EnKF assimilation test showed a prominent decreasing trend. After 18:00 on 9 August, the variation trend of wind speed in the three groups of tests was generally consistent with the actual observation results. Comparative analysis reveals that both the 3DVAR and EnKF assimilation experiments produce maximum-wind-speed predictions in closer agreement with observational data than the control experiment. Although systematic underestimation persists, the radar radial velocity assimilation demonstrates significant improvement in wind-speed forecasting accuracy relative to the control run.
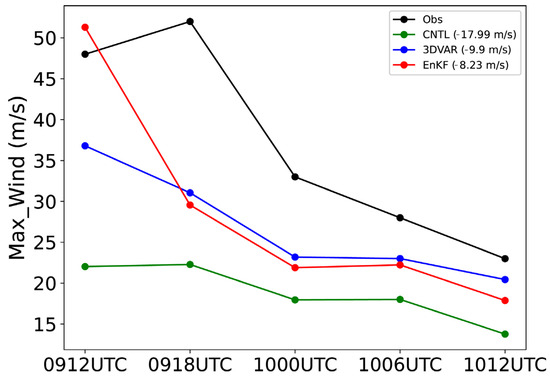
Figure 9.
The 24 h predicted minimum and maximum wind speed along with the observation at the center of the typhoon from 1200 UTC on 9 August 2019 to 1200 UTC on 10 August 2019. The averaged errors for each experiment are shown in the legend.
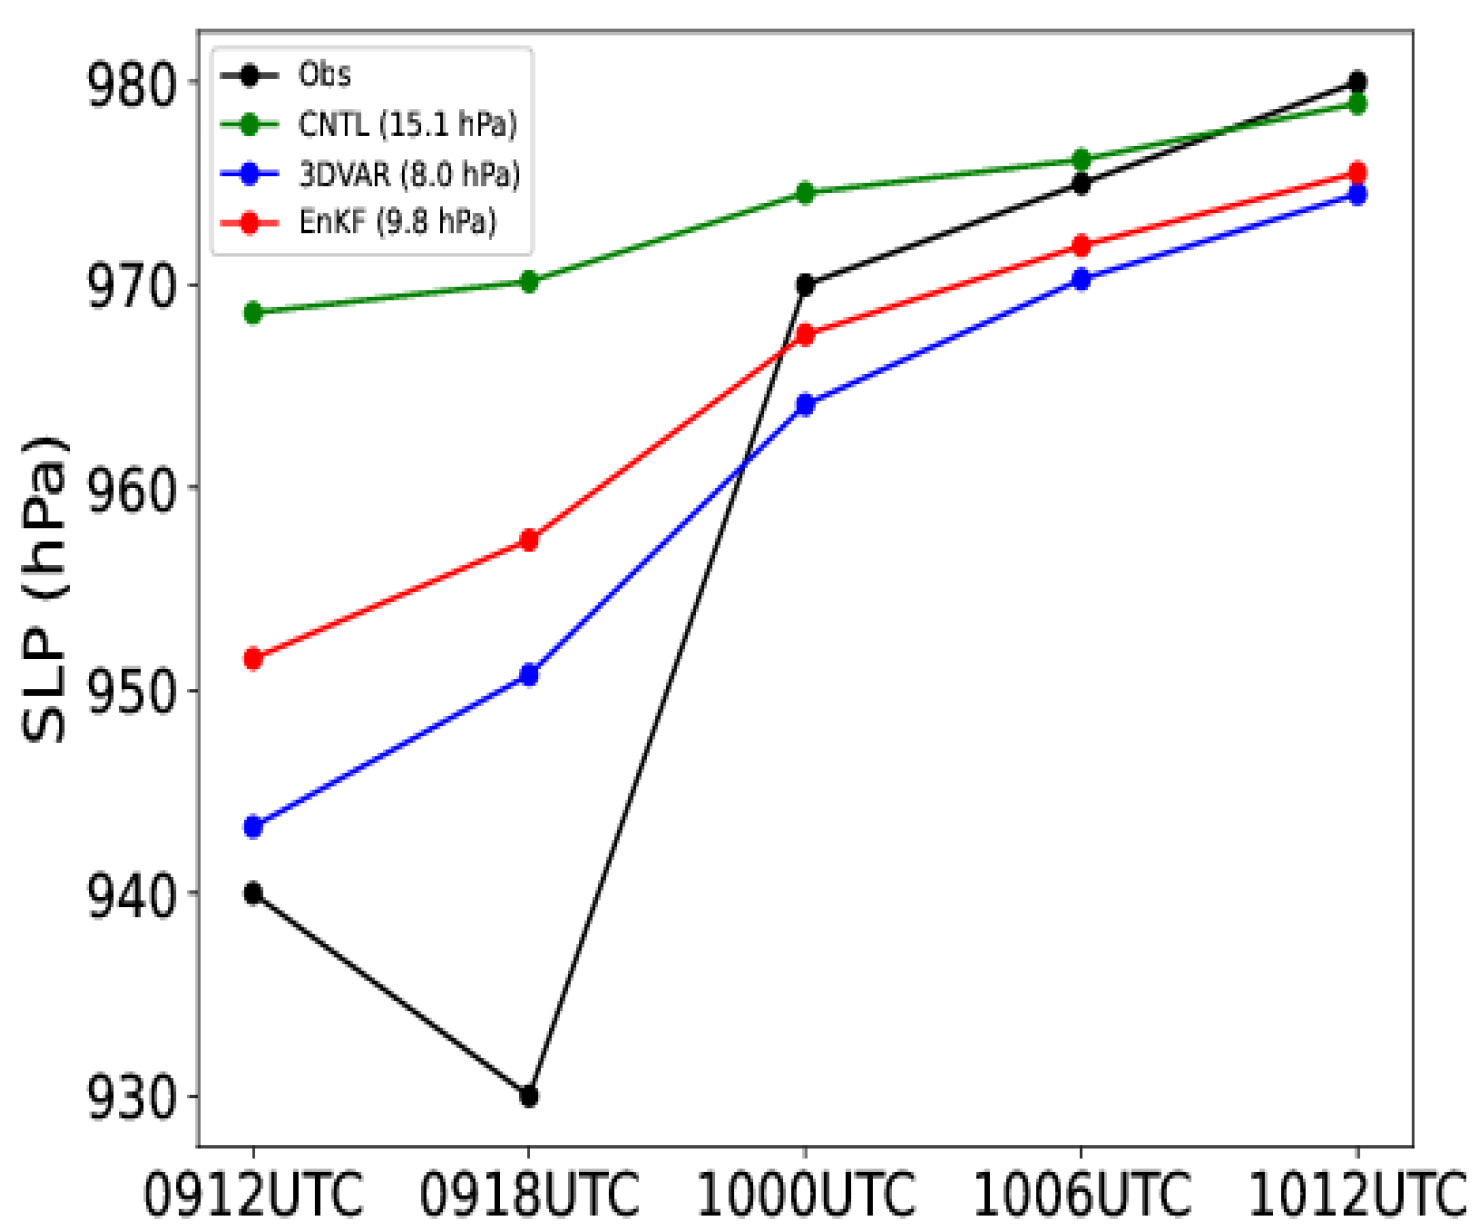
Figure 10 displays the 24 h evolution of minimum sea-level pressure forecasts from 1200 UTC on 9 August to 1200 UTC on 10 August 2019. The initial analysis (1200 UTC on 9 August) reveals that both data assimilation experiments (3DVAR and EnKF) generate sea-level pressure estimates with closer proximity to observations compared with the control run, particularly for the 3DVAR scheme, which shows superior alignment with verification data. Notably, while observed central pressure exhibited a decreasing trend between 1200 UTC on 9 August and 0000 UTC on 10 August, all simulations erroneously produced increasing pressure tendencies during this period. After 18:00 on 9 August, the predicted minimum sea-level pressure after radar radial velocity assimilation showed a trend closer to the actual observed value and closer to the observation than the control test. However, there is still some deviation between the assimilated forecast value and the actual observed value. After 18:00 on 9 August, the pressure change trend of the control test and the assimilation test was basically consistent with the real situation. After 00:00 on 10 August, the sea-level pressure of the three groups of tests was relatively close to the real situation, and the deviation was basically within 10 hPa. In addition, when comparing the effect of different assimilation methods, we found that the prediction effect after EnKF assimilation treatment was slightly improved compared with the 3DVAR assimilation method. In general, after radar radial velocity assimilation, the predicted minimum sea-level pressure showed an obvious increasing trend, which was roughly the same as the evolution trend of the real situation (after 18:00 on 9 August) in the late period, indicating that after assimilation treatment, the model has a more accurate simulation of the gradual weakening of typhoon intensity.
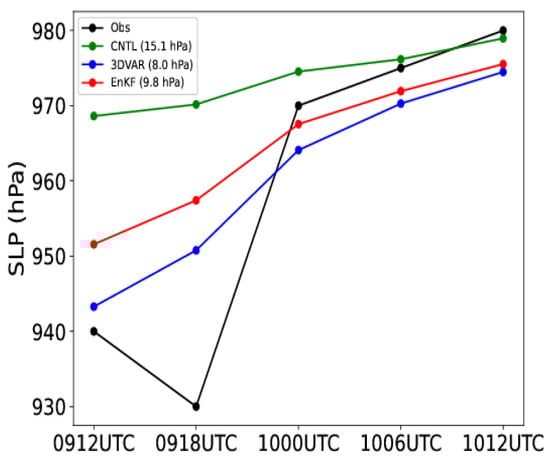
Figure 10.
The 24 h predicted minimum sea-level pressure along with the observation at the center of the typhoon from 1200 UTC on 9 August 2019 to 1200 UTC on 10 August 2019. The averaged errors for each experiment are shown in the legend.
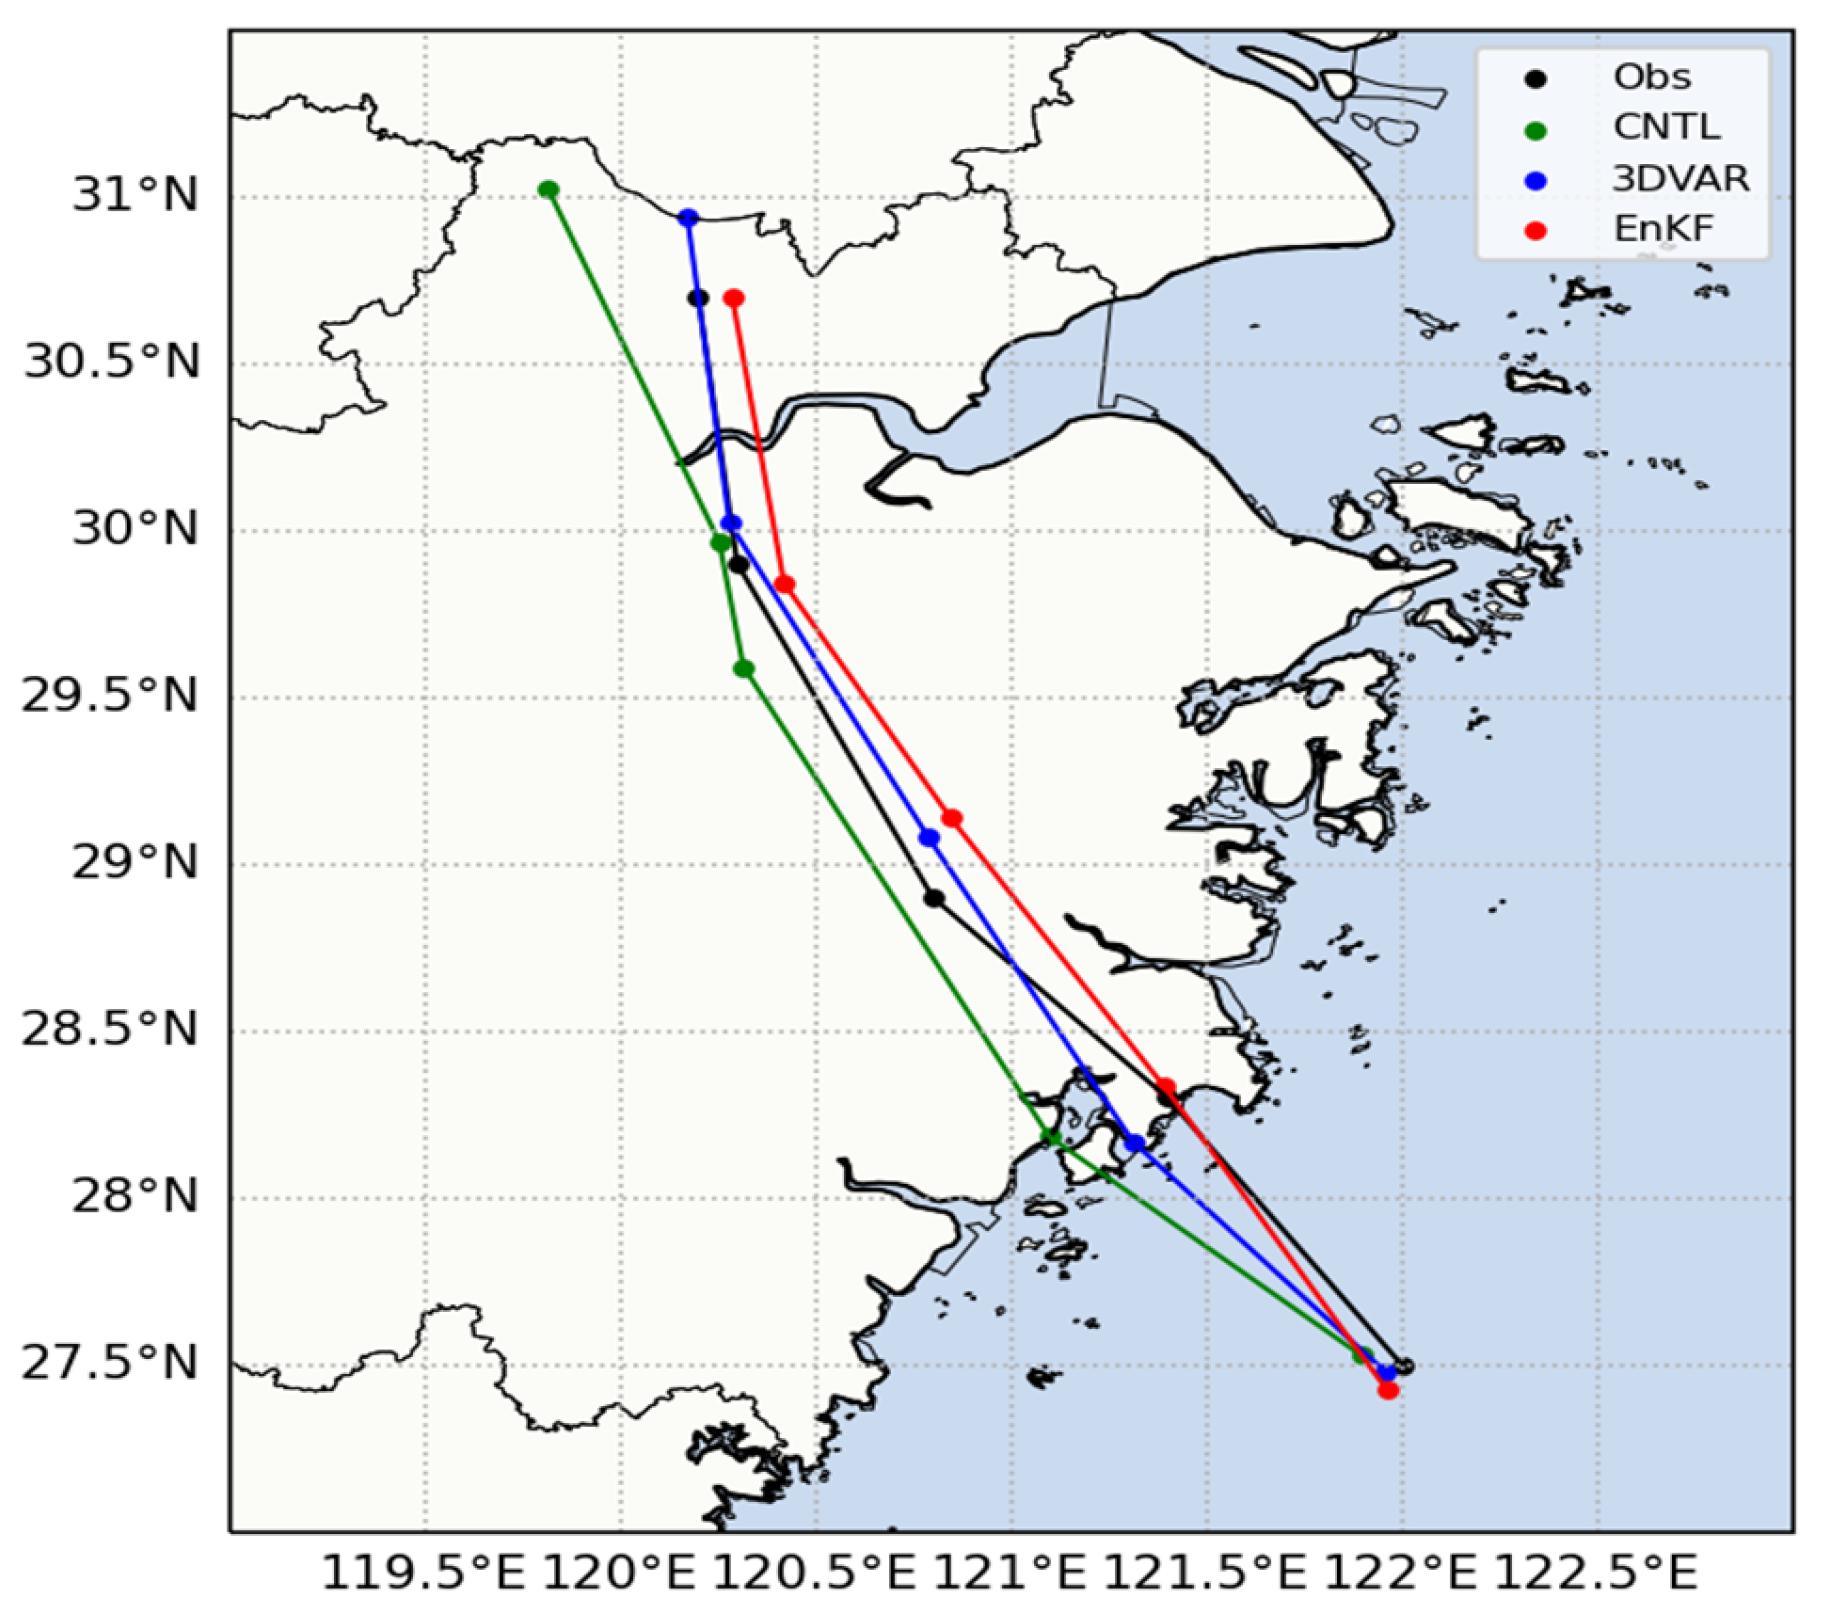
Figure 11 presents the 24 h track forecast of the typhoon, with dots marked every 6 h. Generally, the typhoon track predicted by the three groups of experiments are approximately the same as the best track, all showing a northwest–northward trend. Specifically, the simulated track of the control experiment is westward relative to the best track. Significant track forecast enhancement is achieved through radar radial velocity assimilation relative to the control simulation. Before the typhoon makes landfall, the track simulated by the EnKF assimilation experiment shows a high consistency with the actual situation. However, the simulated track in the 3DVAR experiment yields an obvious westward bias compared with the observation in the first few hours. When the typhoon makes landfall, the landing position simulated by the EnKF assimilation experiment is basically consistent with the actual situation; however, in the 3DVAR assimilation experiment simulation, there is a large difference between the typhoon landing position and the actual situation, and the simulated result is westward and lagging compared with the actual position. After the typhoon makes landfall, the simulation effect of the EnKF assimilation experiment significantly decreases, and the simulated track is eastward, while the track simulated by the 3DVAR assimilation experiment is closer to the actual situation and basically coincides with it in the later stage.
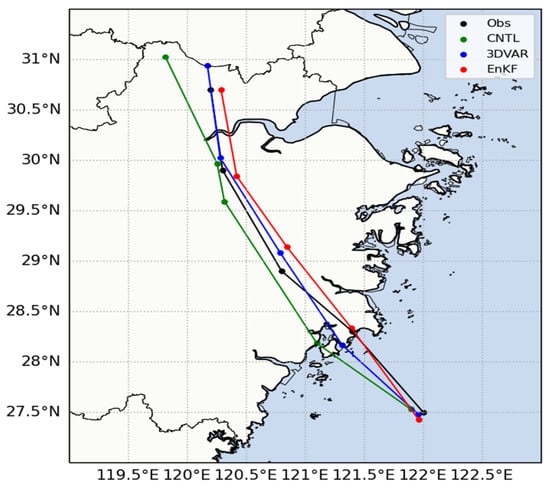
Figure 11.
The 24 h predicted typhoon track along with the observations from 1200 UTC on 9 August 2019 to 1200 UTC on 10 August 2019.
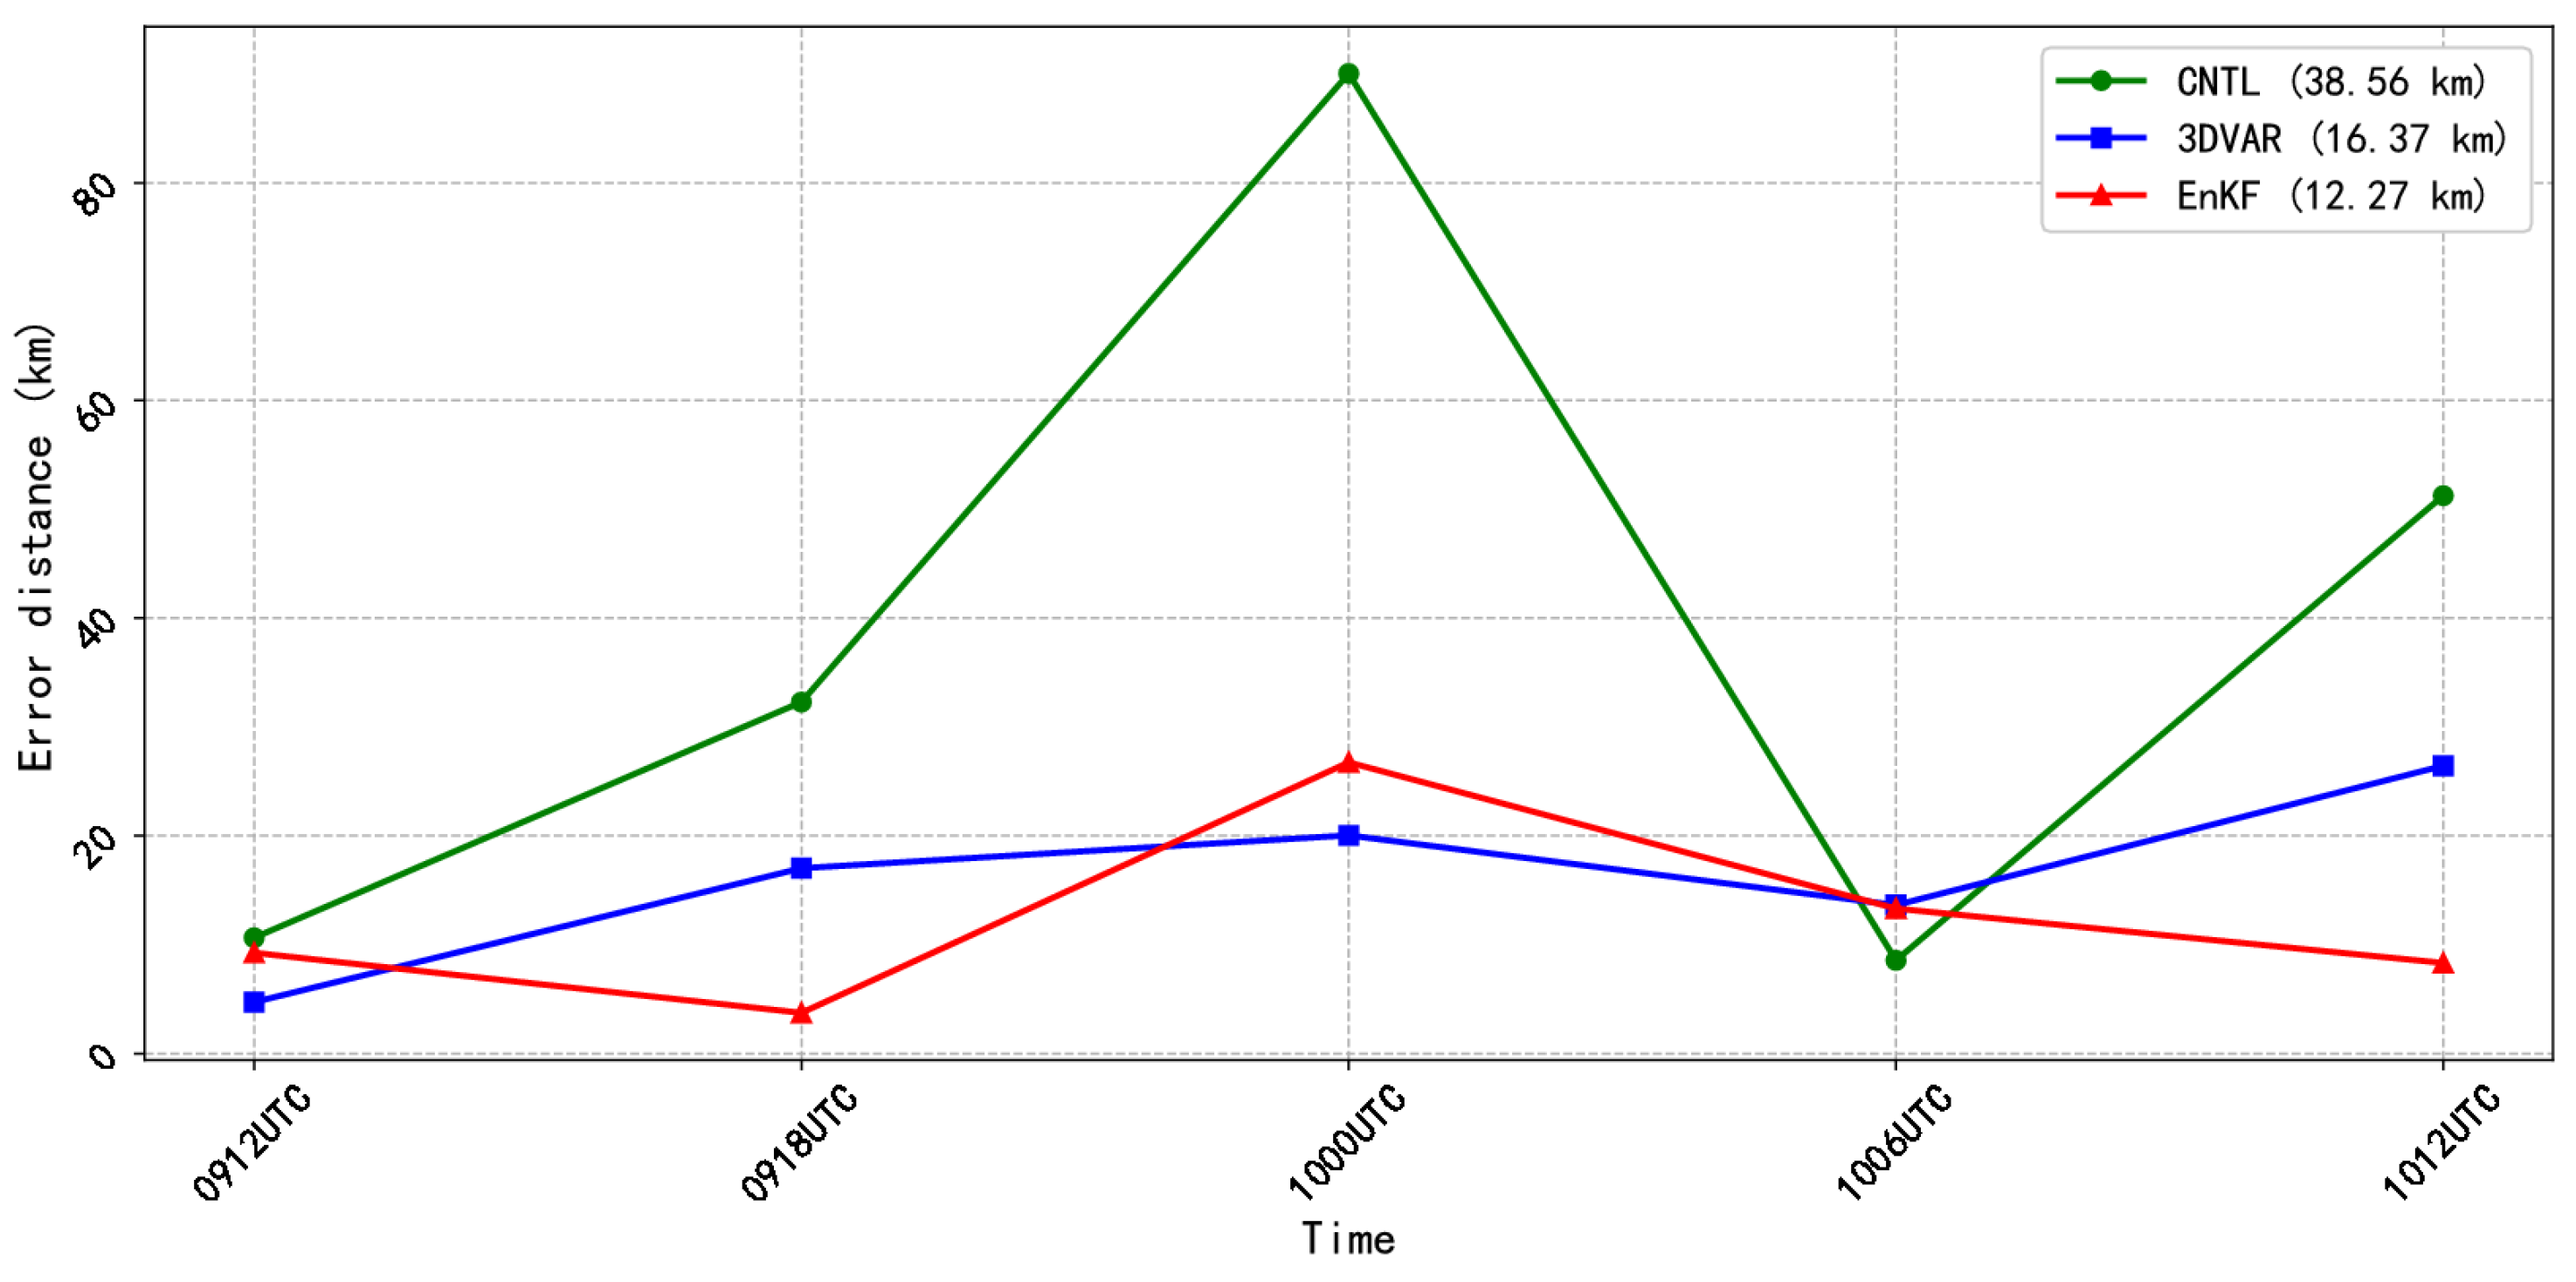
Figure 12 presents the track errors against the best track from the control experiment and the assimilation experiments from 12:00 on 9 August 2019 to 12:00 on 10 August 2019. The results demonstrate that radar radial velocity data assimilation substantially improves typhoon track forecasts relative to the control experiment, as evidenced by the figure. Specifically, before the typhoon made landfall, the simulated track errors of the EnKF assimilation experiment and the 3DVAR assimilation experiment exhibited opposite changing trends, with the former showing a downward trend and the latter an upward trend; after the typhoon made landfall, the changing trends of the two experiments were reversed compared with those before the typhoon made landfall. After 06:00 on 10 August, the simulated track error of the EnKF assimilation experiment presented a downward trend again. Overall, the positions after assimilation were basically consistent with the best track, and the track errors were reduced by 50–60% with the EnKF.
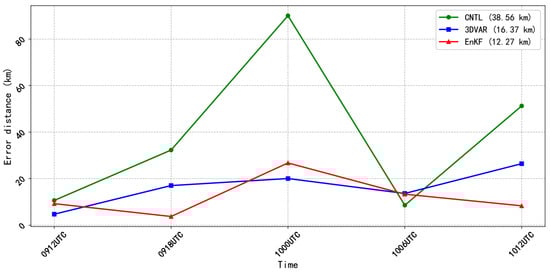
Figure 12.
The 24 h predicted track errors from 1200 UTC on 9 August 2019 to 1200 UTC on 10 August 2019 from different experiments. The averaged errors for each experiment are shown in the legend.
4.2. Typhoon Precipitation
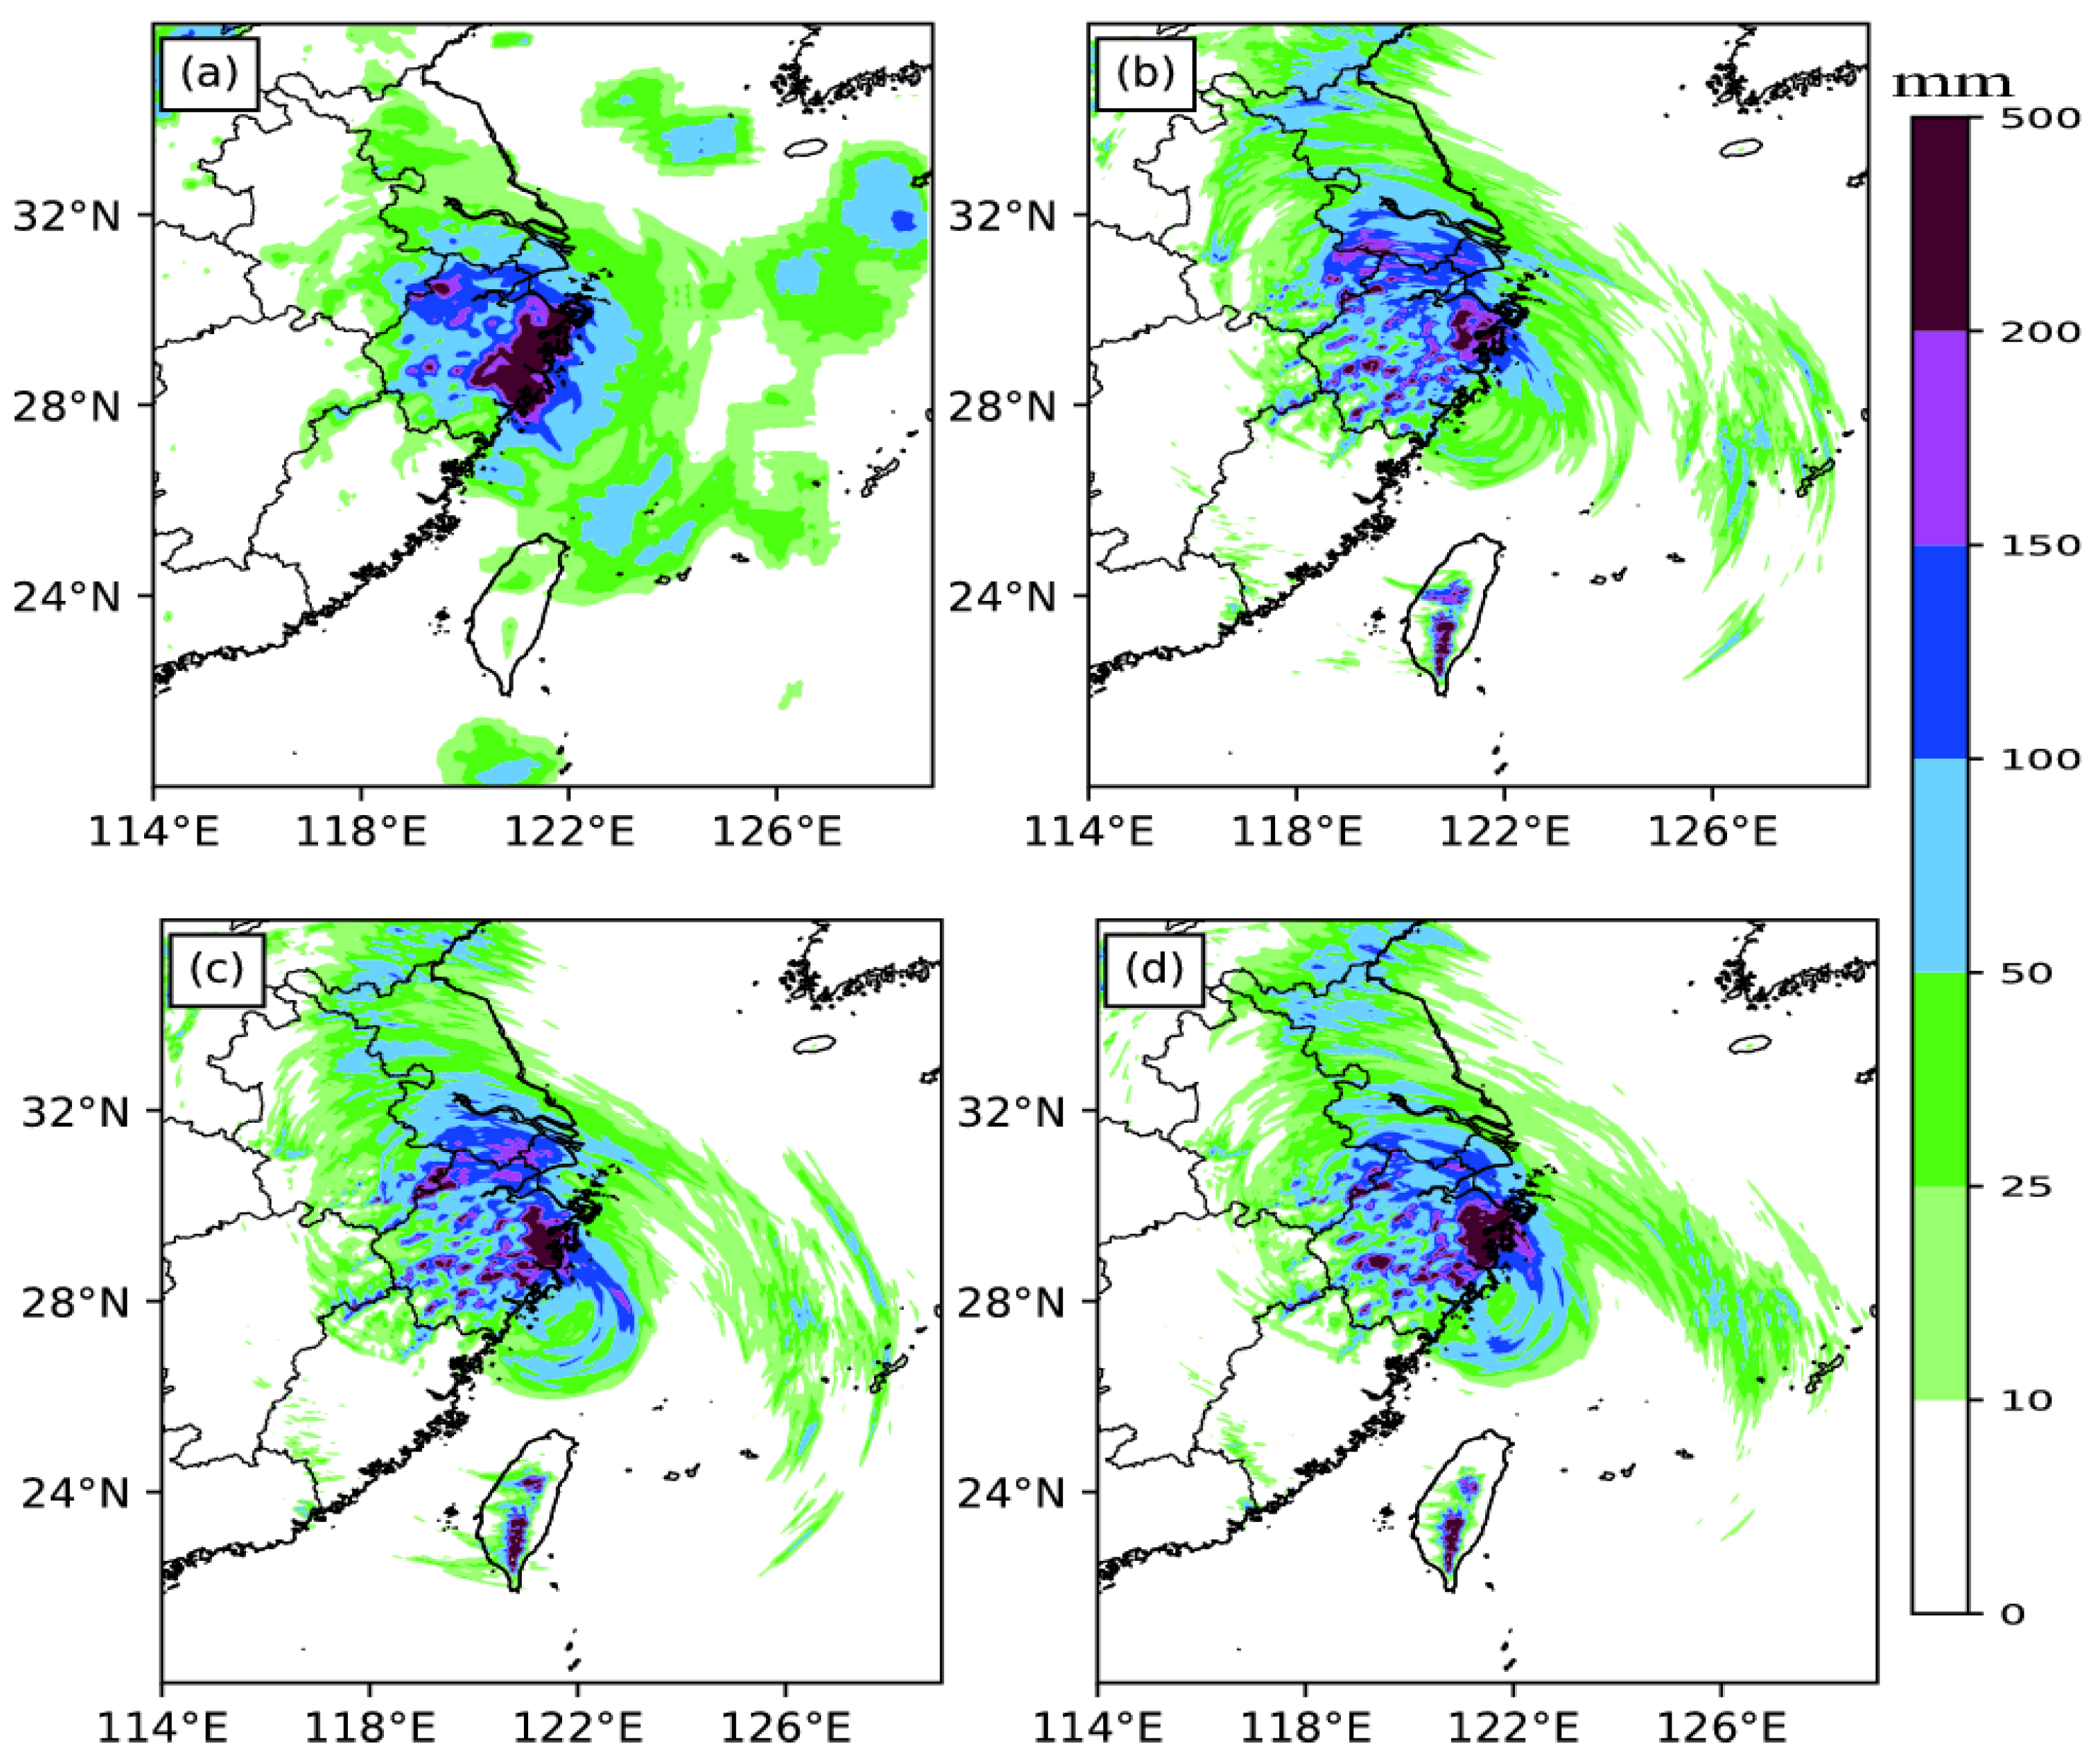
Figure 13 presents a comparison of the 24 h accumulated precipitation results. As can be seen from the observed precipitation in Figure 13a, during this period, the typhoon center was located in the coastal zone of Zhejiang. Precipitation was mainly concentrated in Zhejiang, Shanghai and southern Jiangsu. Most of the coastal areas witnessed precipitation exceeding 200 mm. A comparative analysis reveals that both the control simulation and the 3DVAR assimilation experiment produce slightly overestimated rainfall areas when validated against observational data. Moreover, the distribution of their maximum rainfall belts was more dispersed than the actual situation. Specifically, the precipitation intensity forecasted by the control experiment in the southern coastal area of Zhejiang was lower than the observation. Both the control experiment and the 3DVAR experiment overestimated the precipitation intensity in the junction area of Jiangsu and Zhejiang (near the Shanghai area). The EnKF assimilation experiment had a relatively better overall forecast of the main precipitation of the typhoon. Both the precipitation intensity and location were closer to the observations, and the simulated spiral rainfall band was more complete.
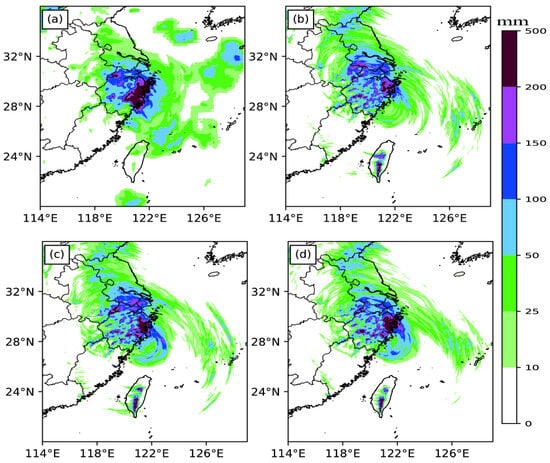
Figure 13.
The 24 h accumulate precipitation (unit: mm) in (a) observation, (b) control experiment, (c) 3DVAR and (d) EnKF experiment from 1200 UTC on 9 August 2019 to 1200 UTC on 10 August 2019.
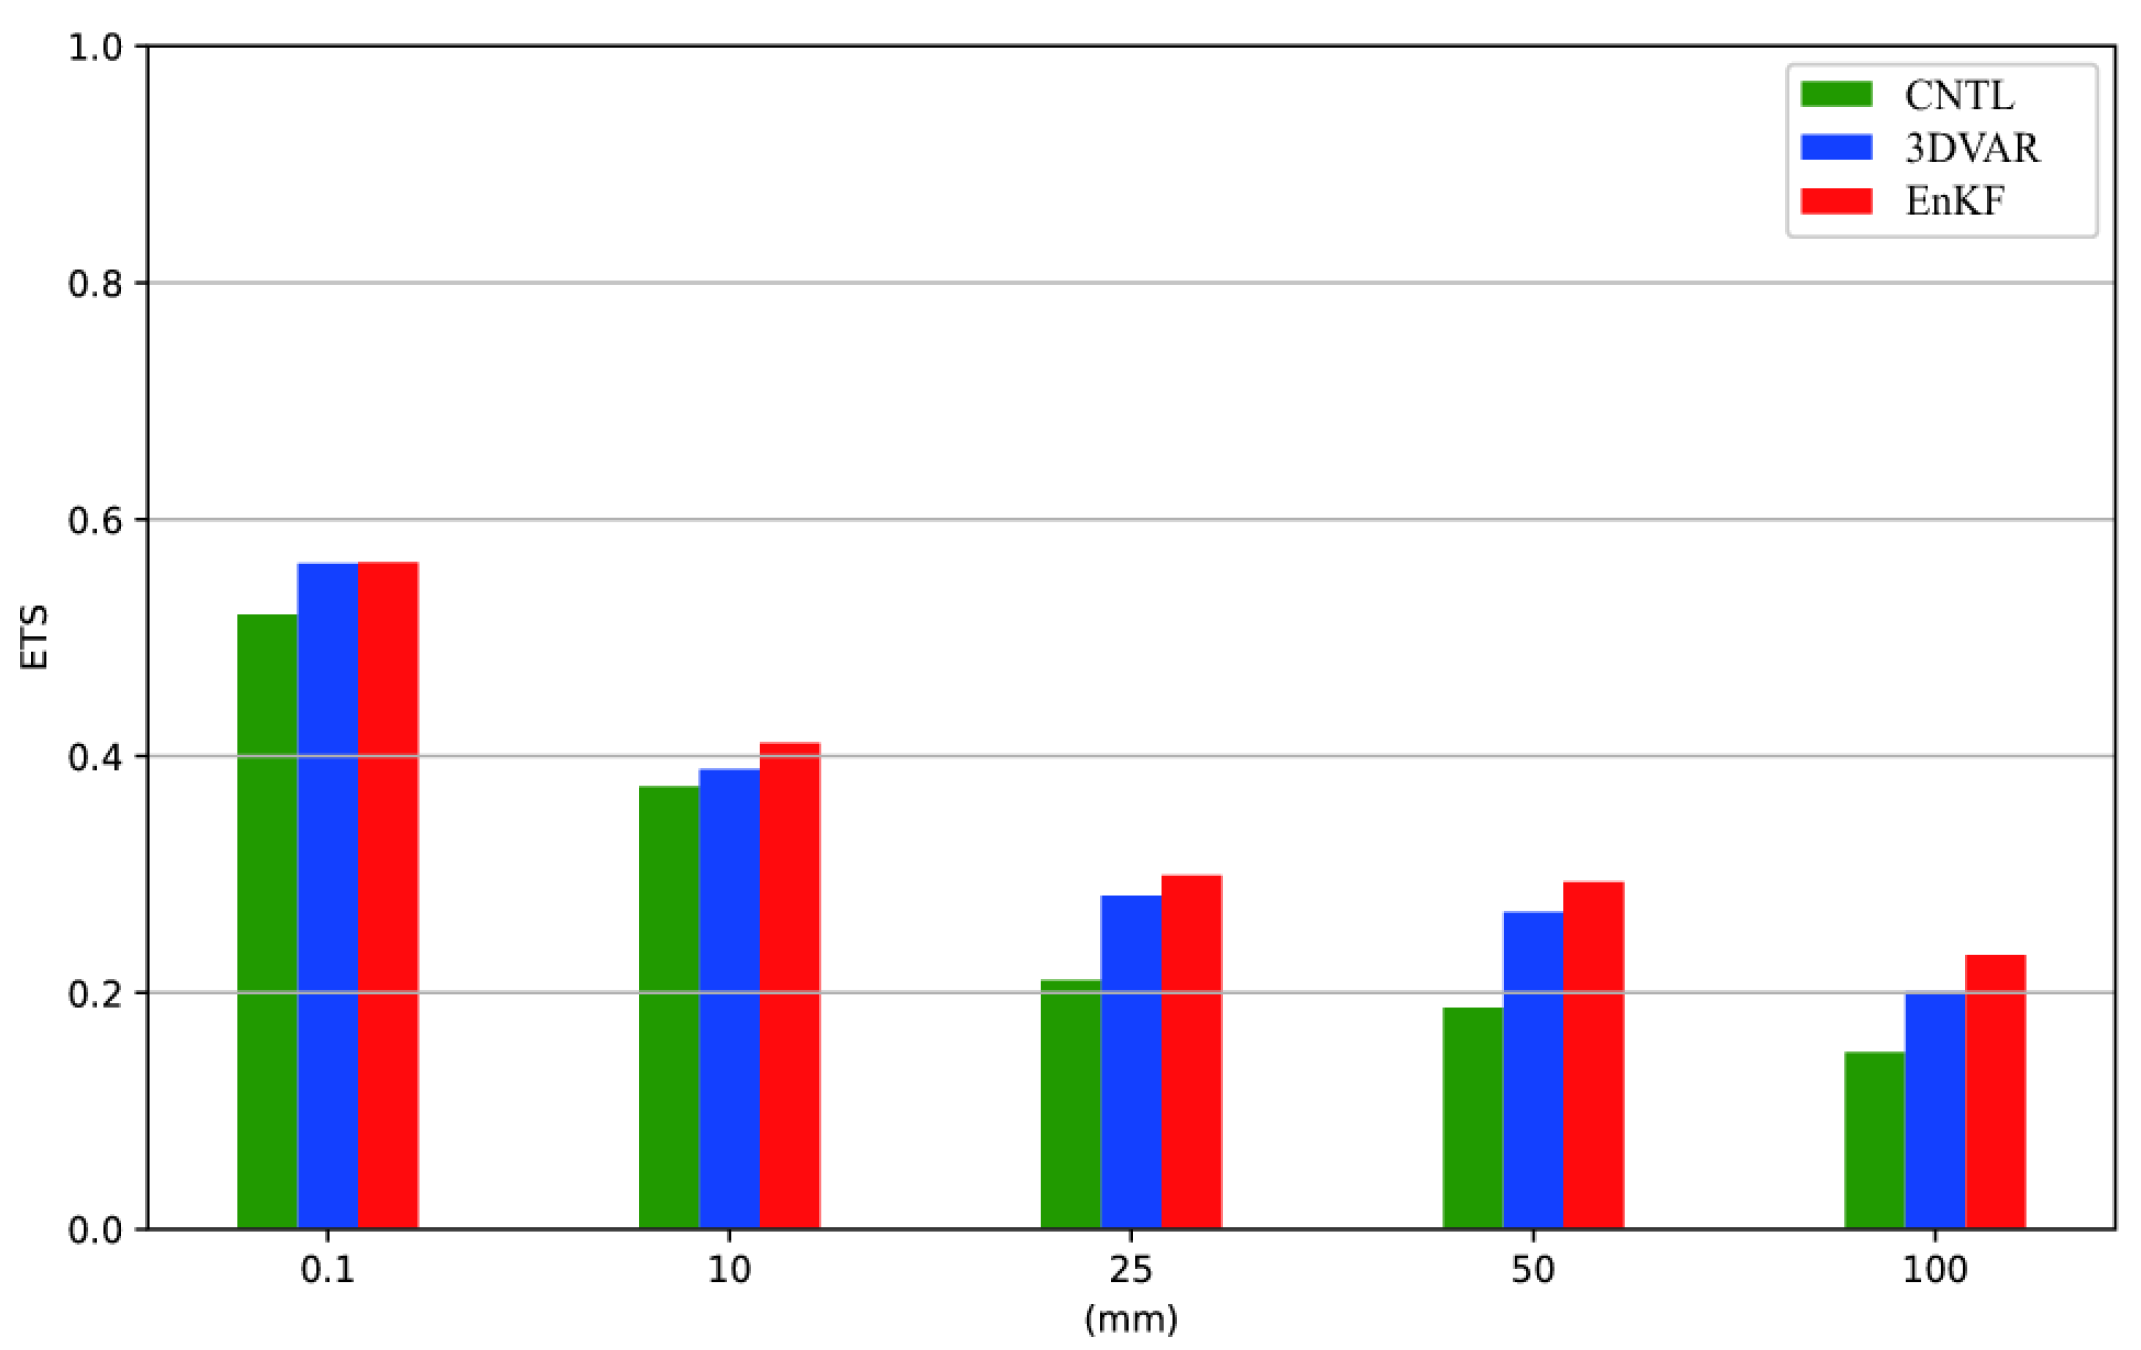
Figure 14 illustrates the ETS scores for all the experiments with different precipitation thresholds. It is found that the CNTL experiment achieves the lowest ETS scores for all the thresholds. Although the EnKF experiment achieves similar scores to 3DVAR, it generally outperforms the 3DVAR experiment, indicating that the EnKF yields the highest scores for most of the thresholds. When the threshold increases to 10 mm, the advantage of the EnKF is most obvious. That is, the impact of the EnKF on predicted precipitation becomes more evident for moderate-to-high precipitation intensities.
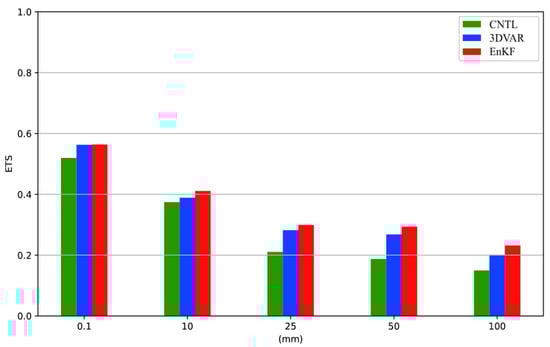
Figure 14.
ETS scores for 24 h accumulated precipitation in CNTL, 3DVAR and EnKF experiments across different thresholds.
4.3. Typhoon Structure
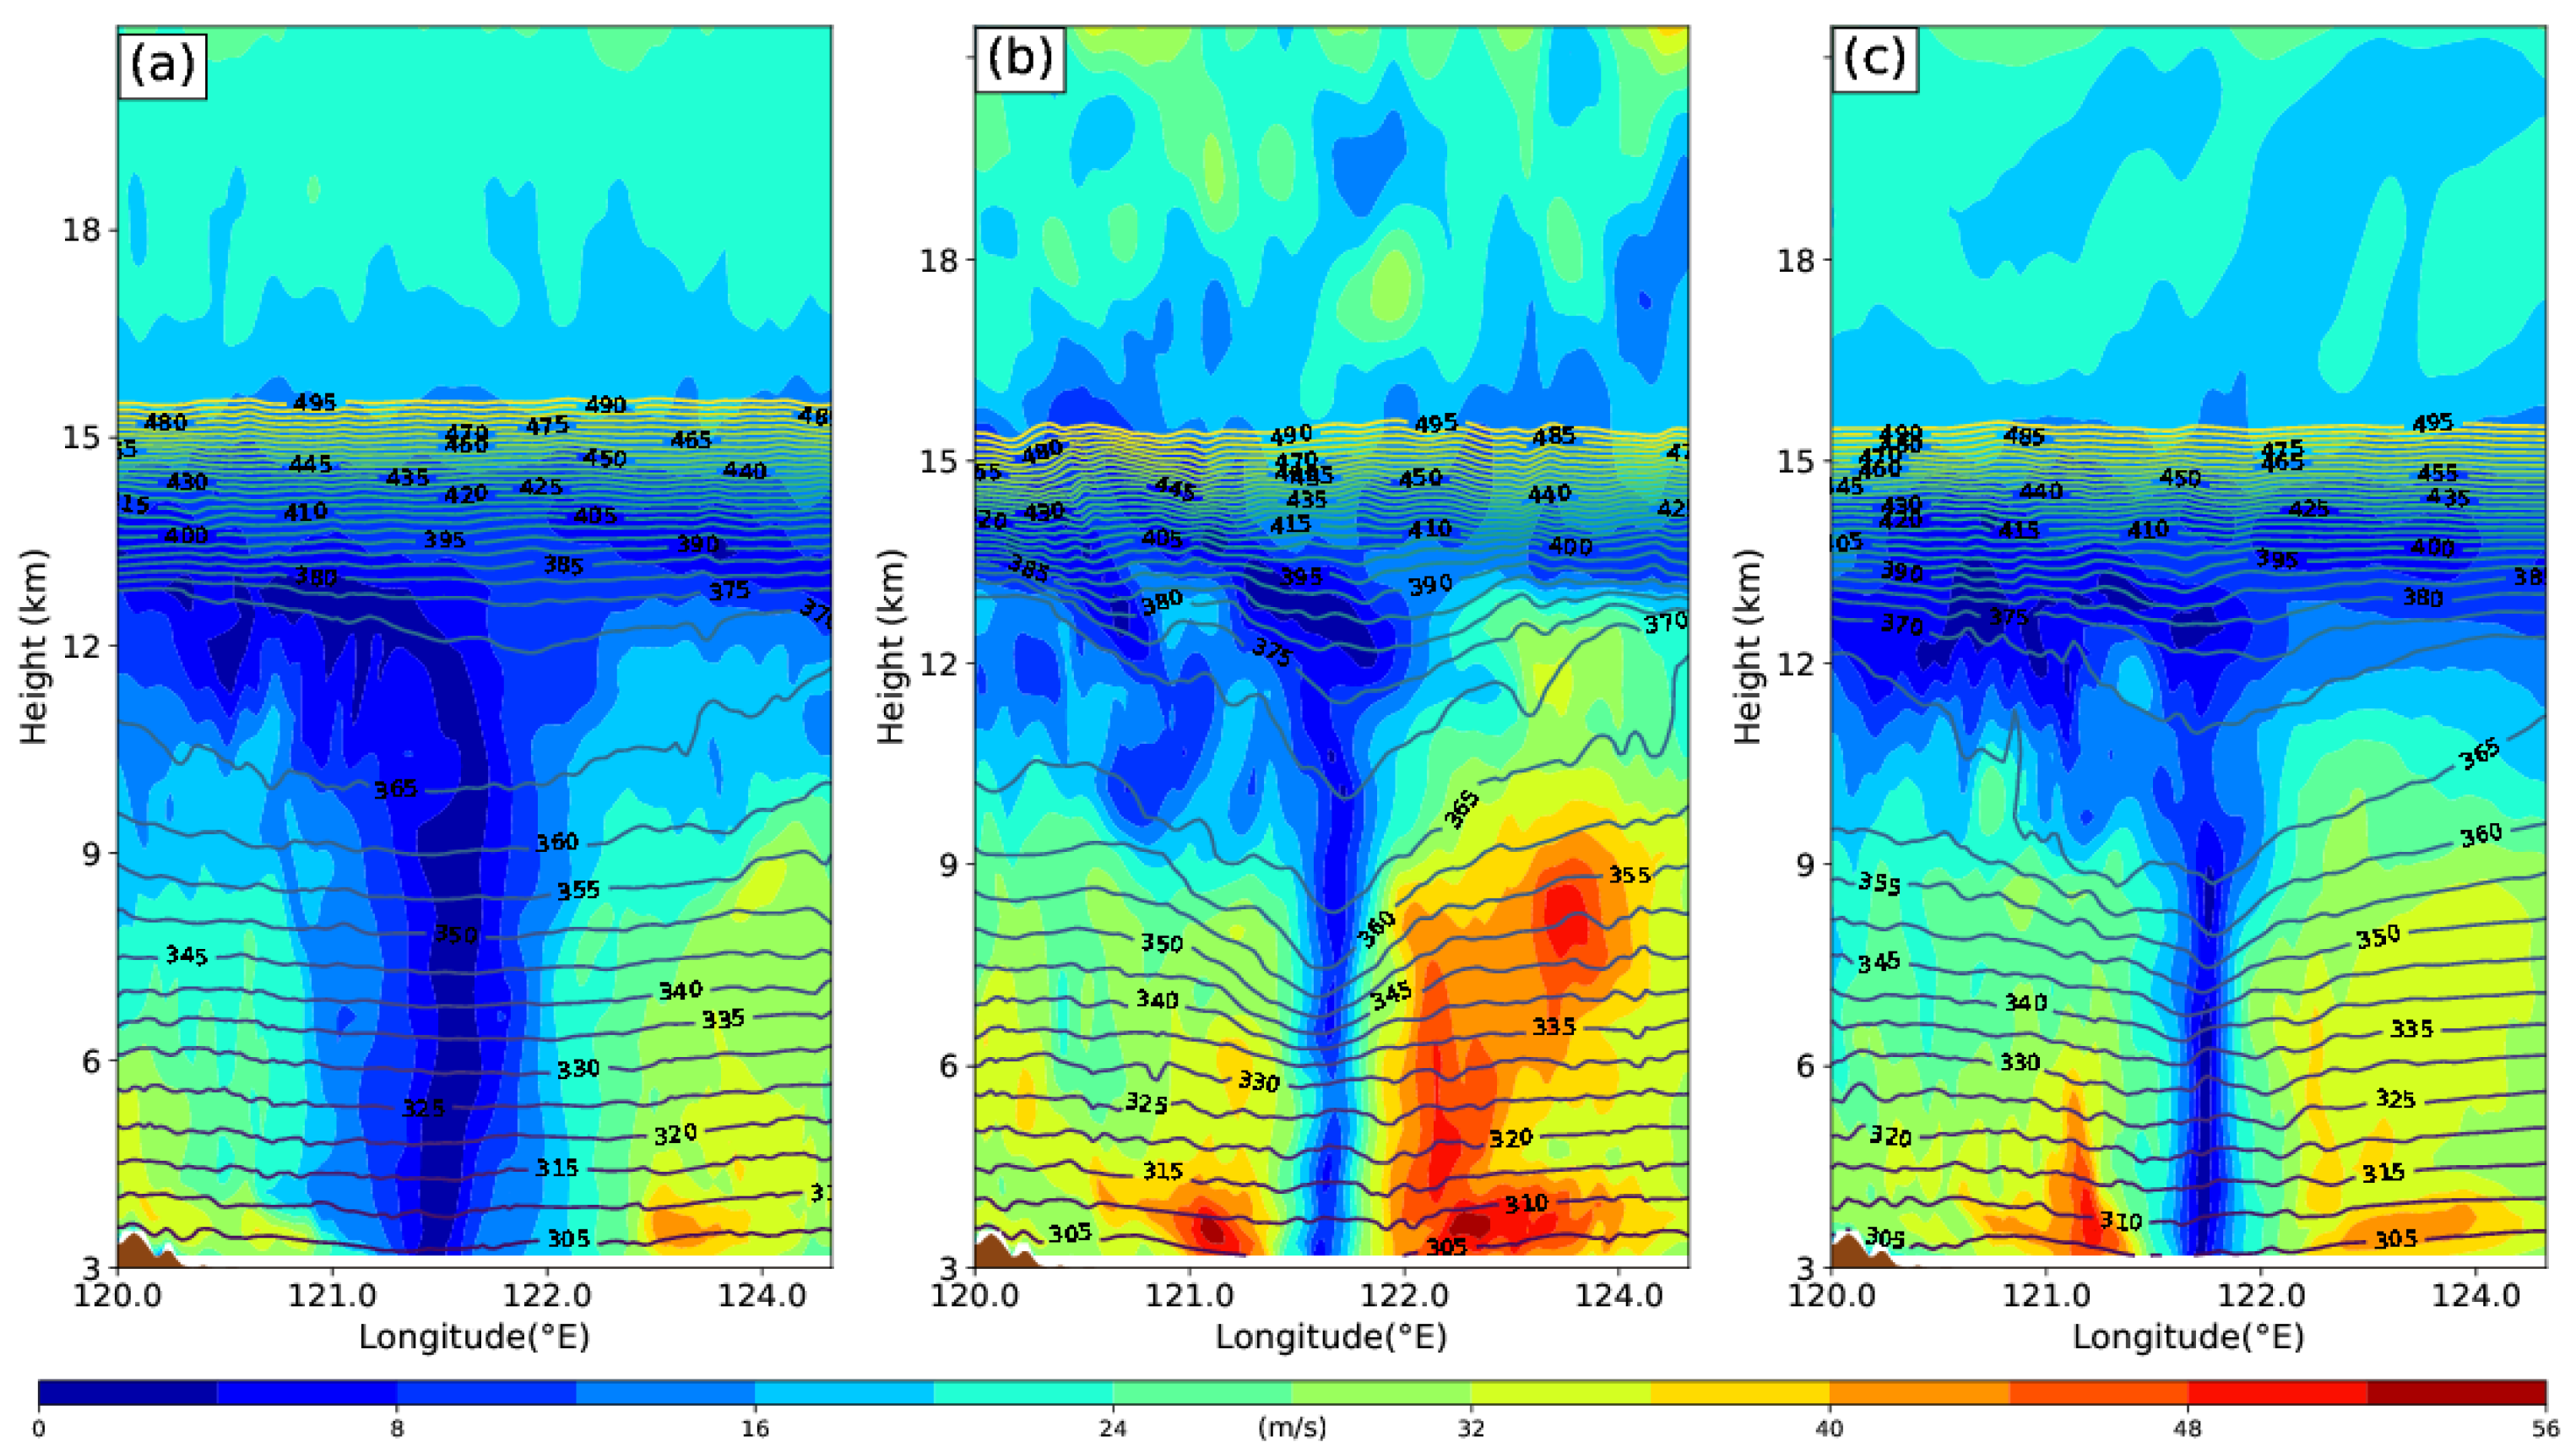
Figure 15 presents a comparison of east–west vertical cross-sectional analyses through the typhoon center at 1200 UTC on 9 August 2019, evaluating structural modifications induced by radar radial velocity data assimilation across three experiments: a control experiment, the 3DVAR assimilation experiment and the EnKF assimilation experiment. These diagrams facilitate more intuitive observation and analysis of the alterations and impacts of assimilating radar data on the typhoon structure. Figure 15a demonstrates smoother isentropic contours in the control experiment, indicative of a less organized eyewall configuration in Typhoon Lekima. The experimental results reveal a pronounced east–west asymmetry in wind-speed distribution, with significantly stronger winds being observed on the eastern flank of the typhoon compared with its western counterpart. The control experiment exhibited weaker maximum wind speeds peaking below 44 m/s, with high-velocity zones being displaced outward from the typhoon’s central vortex. Radar-derived radial velocity assimilation in both the 3DVAR (Figure 15b) and EnKF (Figure 15c) configurations reveals a pronounced downward concave structure, corresponding to enhanced thermal anomaly patterns that characterize the typhoon’s warm core development. The assimilation experiments consistently demonstrate intensification of near-surface winds relative to the control case, with peak wind speeds surpassing 48 m/s in both configurations. In the 3DVAR assimilation experiment, there are strong wind regions on both sides, with the east side being significantly stronger than the west side, exceeding 9 km, while the west side does not exceed 6 km. The EnKF experiment demonstrates a predominant western wind maximum with a vertical extent exceeding 5 km, indicating a more vertically coherent and compact vortex structure. The results can be explained by the fact that the EnKF ensemble-based approach is able to better capture nonlinear processes (e.g., vorticity advection and stretching) and multivariate correlations, which are critical to resolving vertical coherence in vortices.

Figure 15.
The meridional-height profile of potential temperature (contour, unit: K) and horizontal wind speed (shaded, unit: m/s) crossing the center of Typhoon Lekima at 1200 UTC on 9 August 2019 (reference latitude: 27.5°N) from (a) control, (b) 3DVAR and (c) EnKF experiments.
5. Diagnosis of Analyses
5.1. Analysis of Potential Temperature
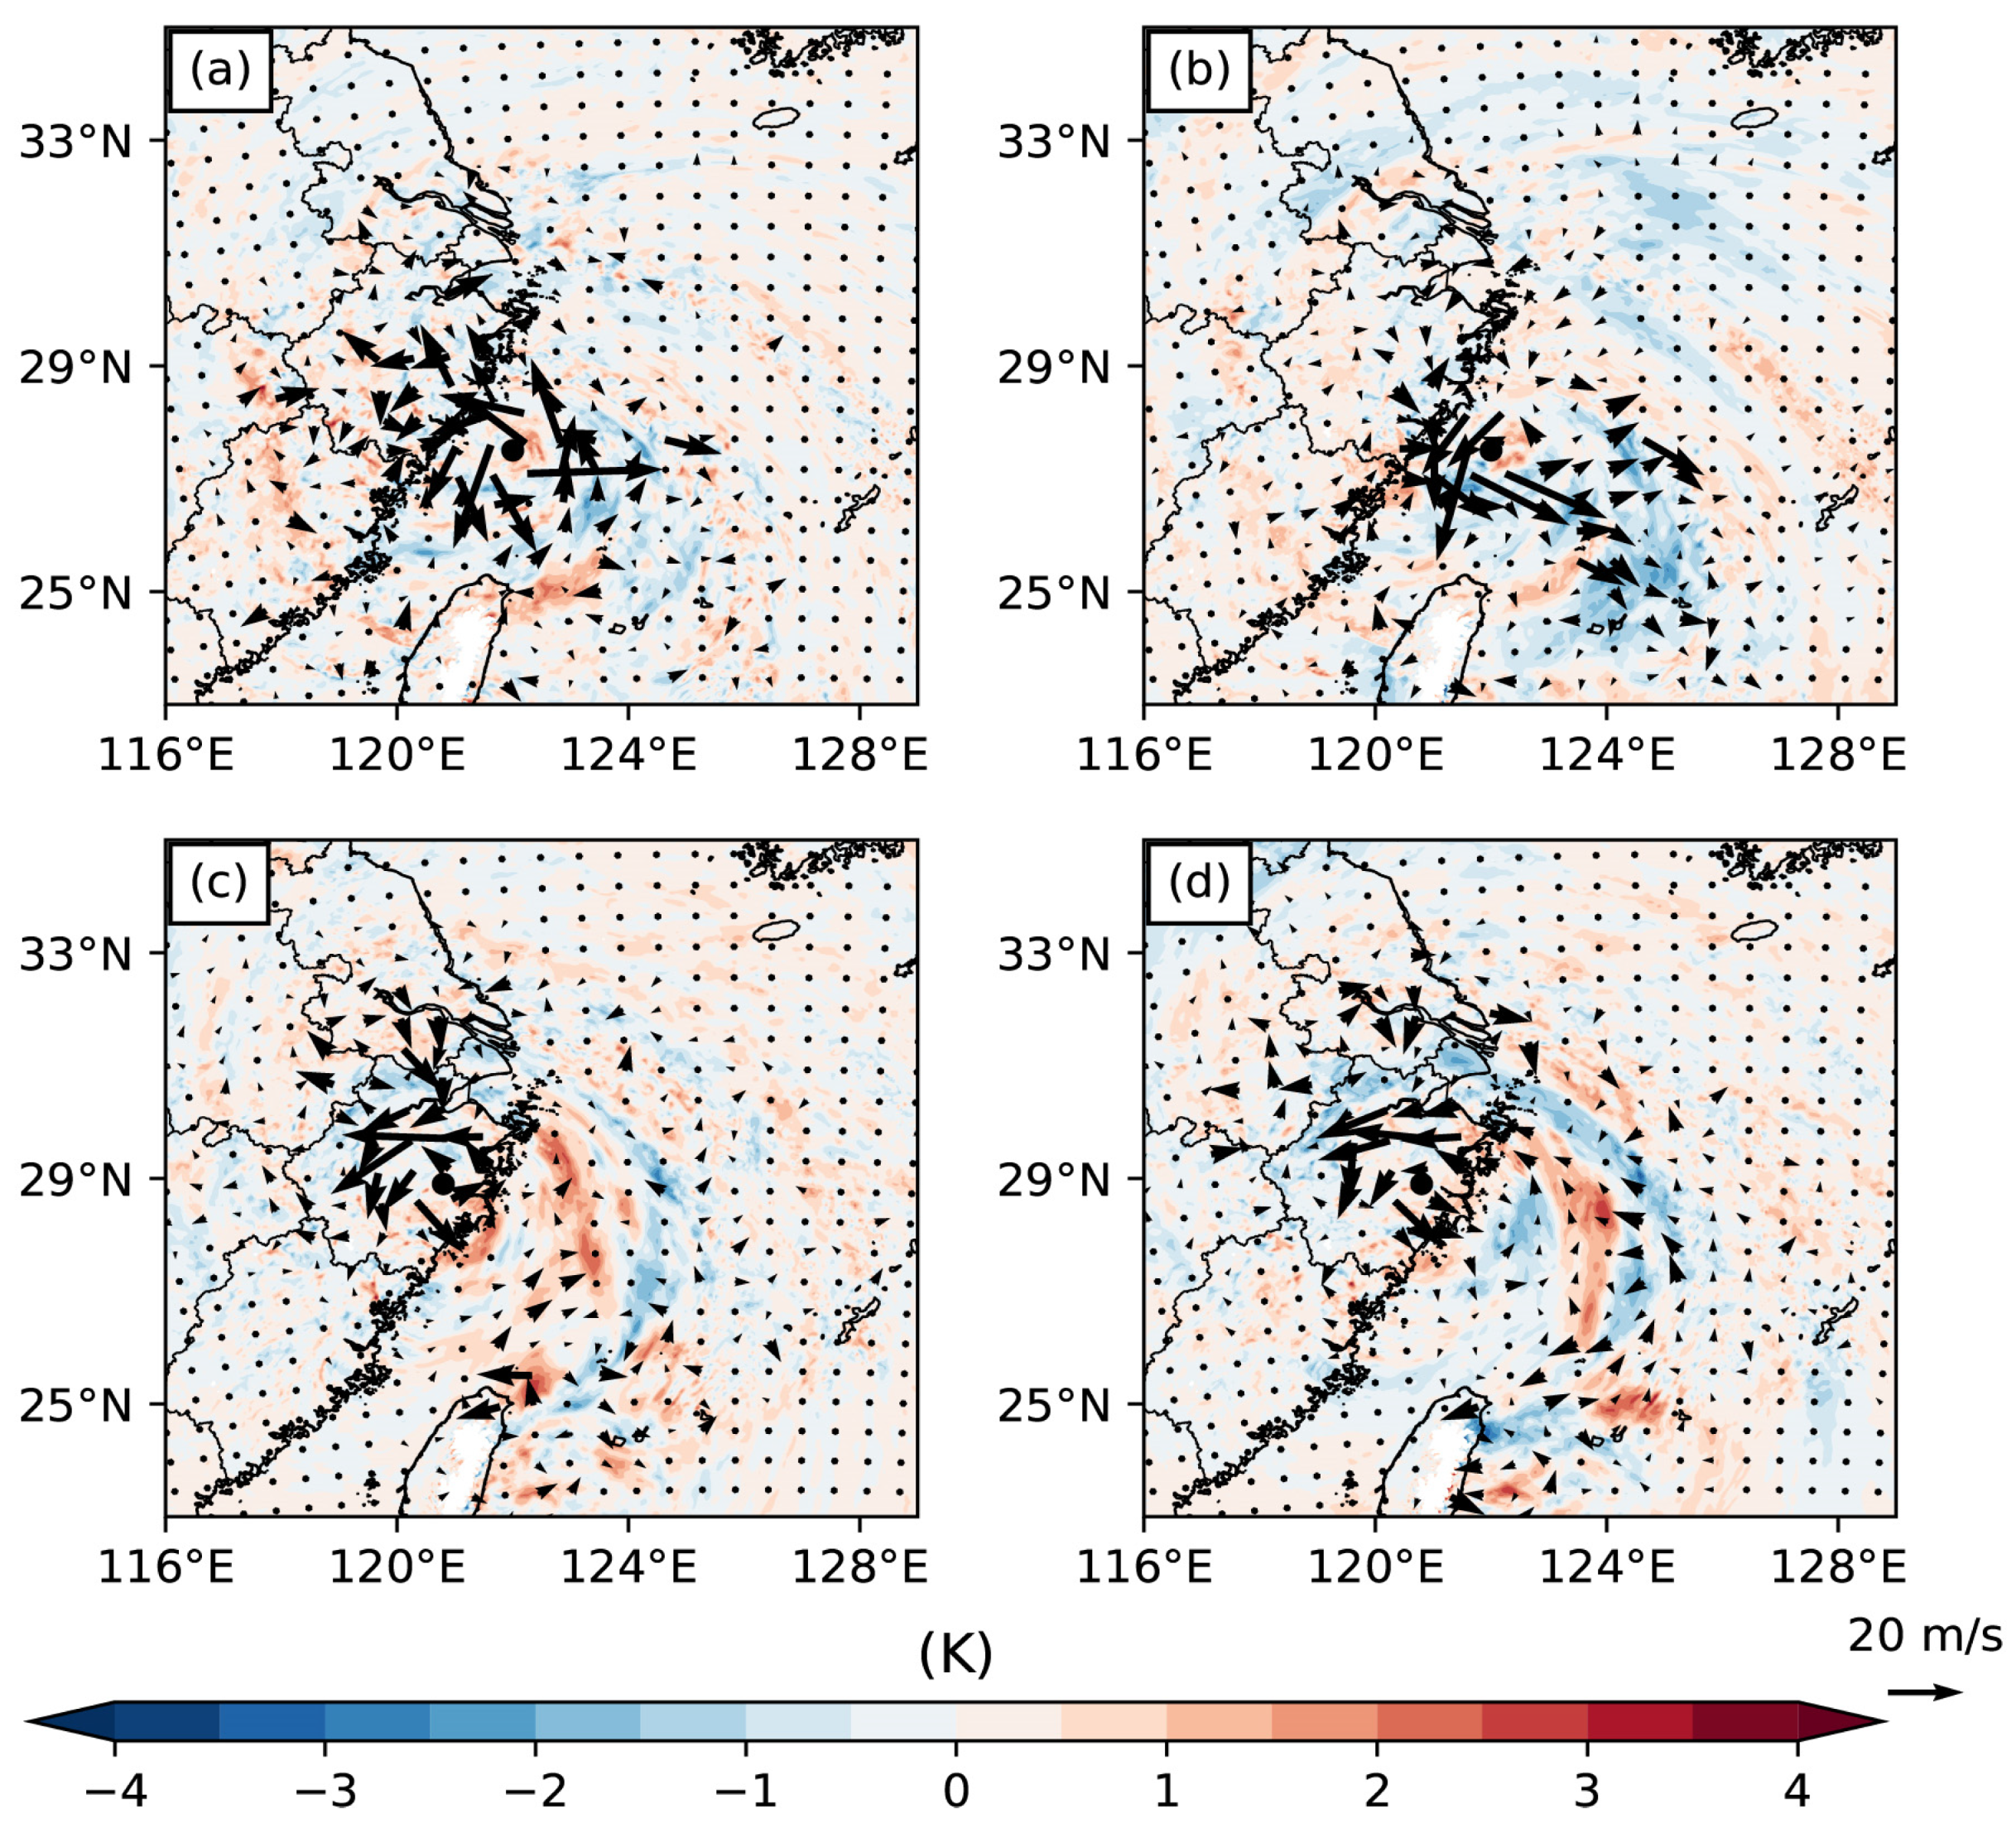
The difference in potential temperature and wind between the control run and both data assimilation experiments (3DVAR and EnKF) are shown in Figure 16 at three analysis times for Typhoon Lekima at 850 hPa. At the initial time (1200 UTC on 9 August), both assimilation experiments show substantially stronger wind differences compared with later times, with the most pronounced enhancements occurring near the typhoon center. These modifications yield a more realistic vortex structure, as evidenced by the cyclonic organization of the wind speed increases, indicating intensification relative to the control simulation. The 3DVAR and EnKF results exhibit similar patterns of improvement, though with some variations in the spatial distribution and magnitude of the changes. Additionally, the intensification of the wind within the typhoon is conducive to the accumulation of energy. It is found that around the center of the typhoon, the difference of geopotential temperature at the typhoon center is positive. This reveals that in the assimilation experiments, the warm core structure of the typhoon is more pronounced, which indirectly demonstrates the effectiveness of the EnKF assimilation system in radial velocity assimilation.
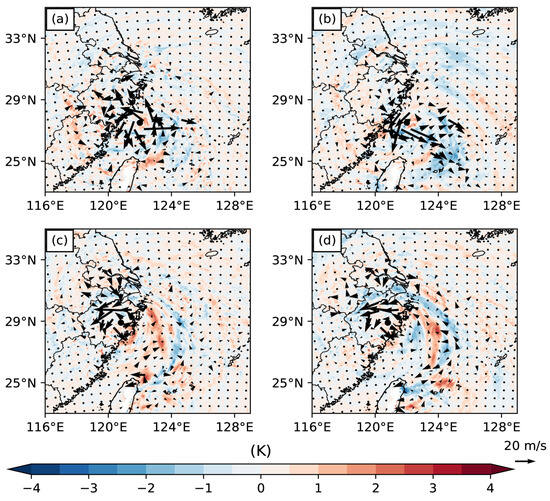
Figure 16.
The difference in potential temperature (shaded, Unit: K) and horizontal wind (wind vector, Unit: m/s) between 3DVAR and CNTL in the left panel and between the EnKF and CNTL in the right panel at 850 hPa at (a,b) 1200 UTC on 9 August, (c,d) 0000 UTC on 10 August and (e,f) 1200 UTC on 10 August. Black dots indicate the observed typhoon location.
5.2. Wind Farm Analysis
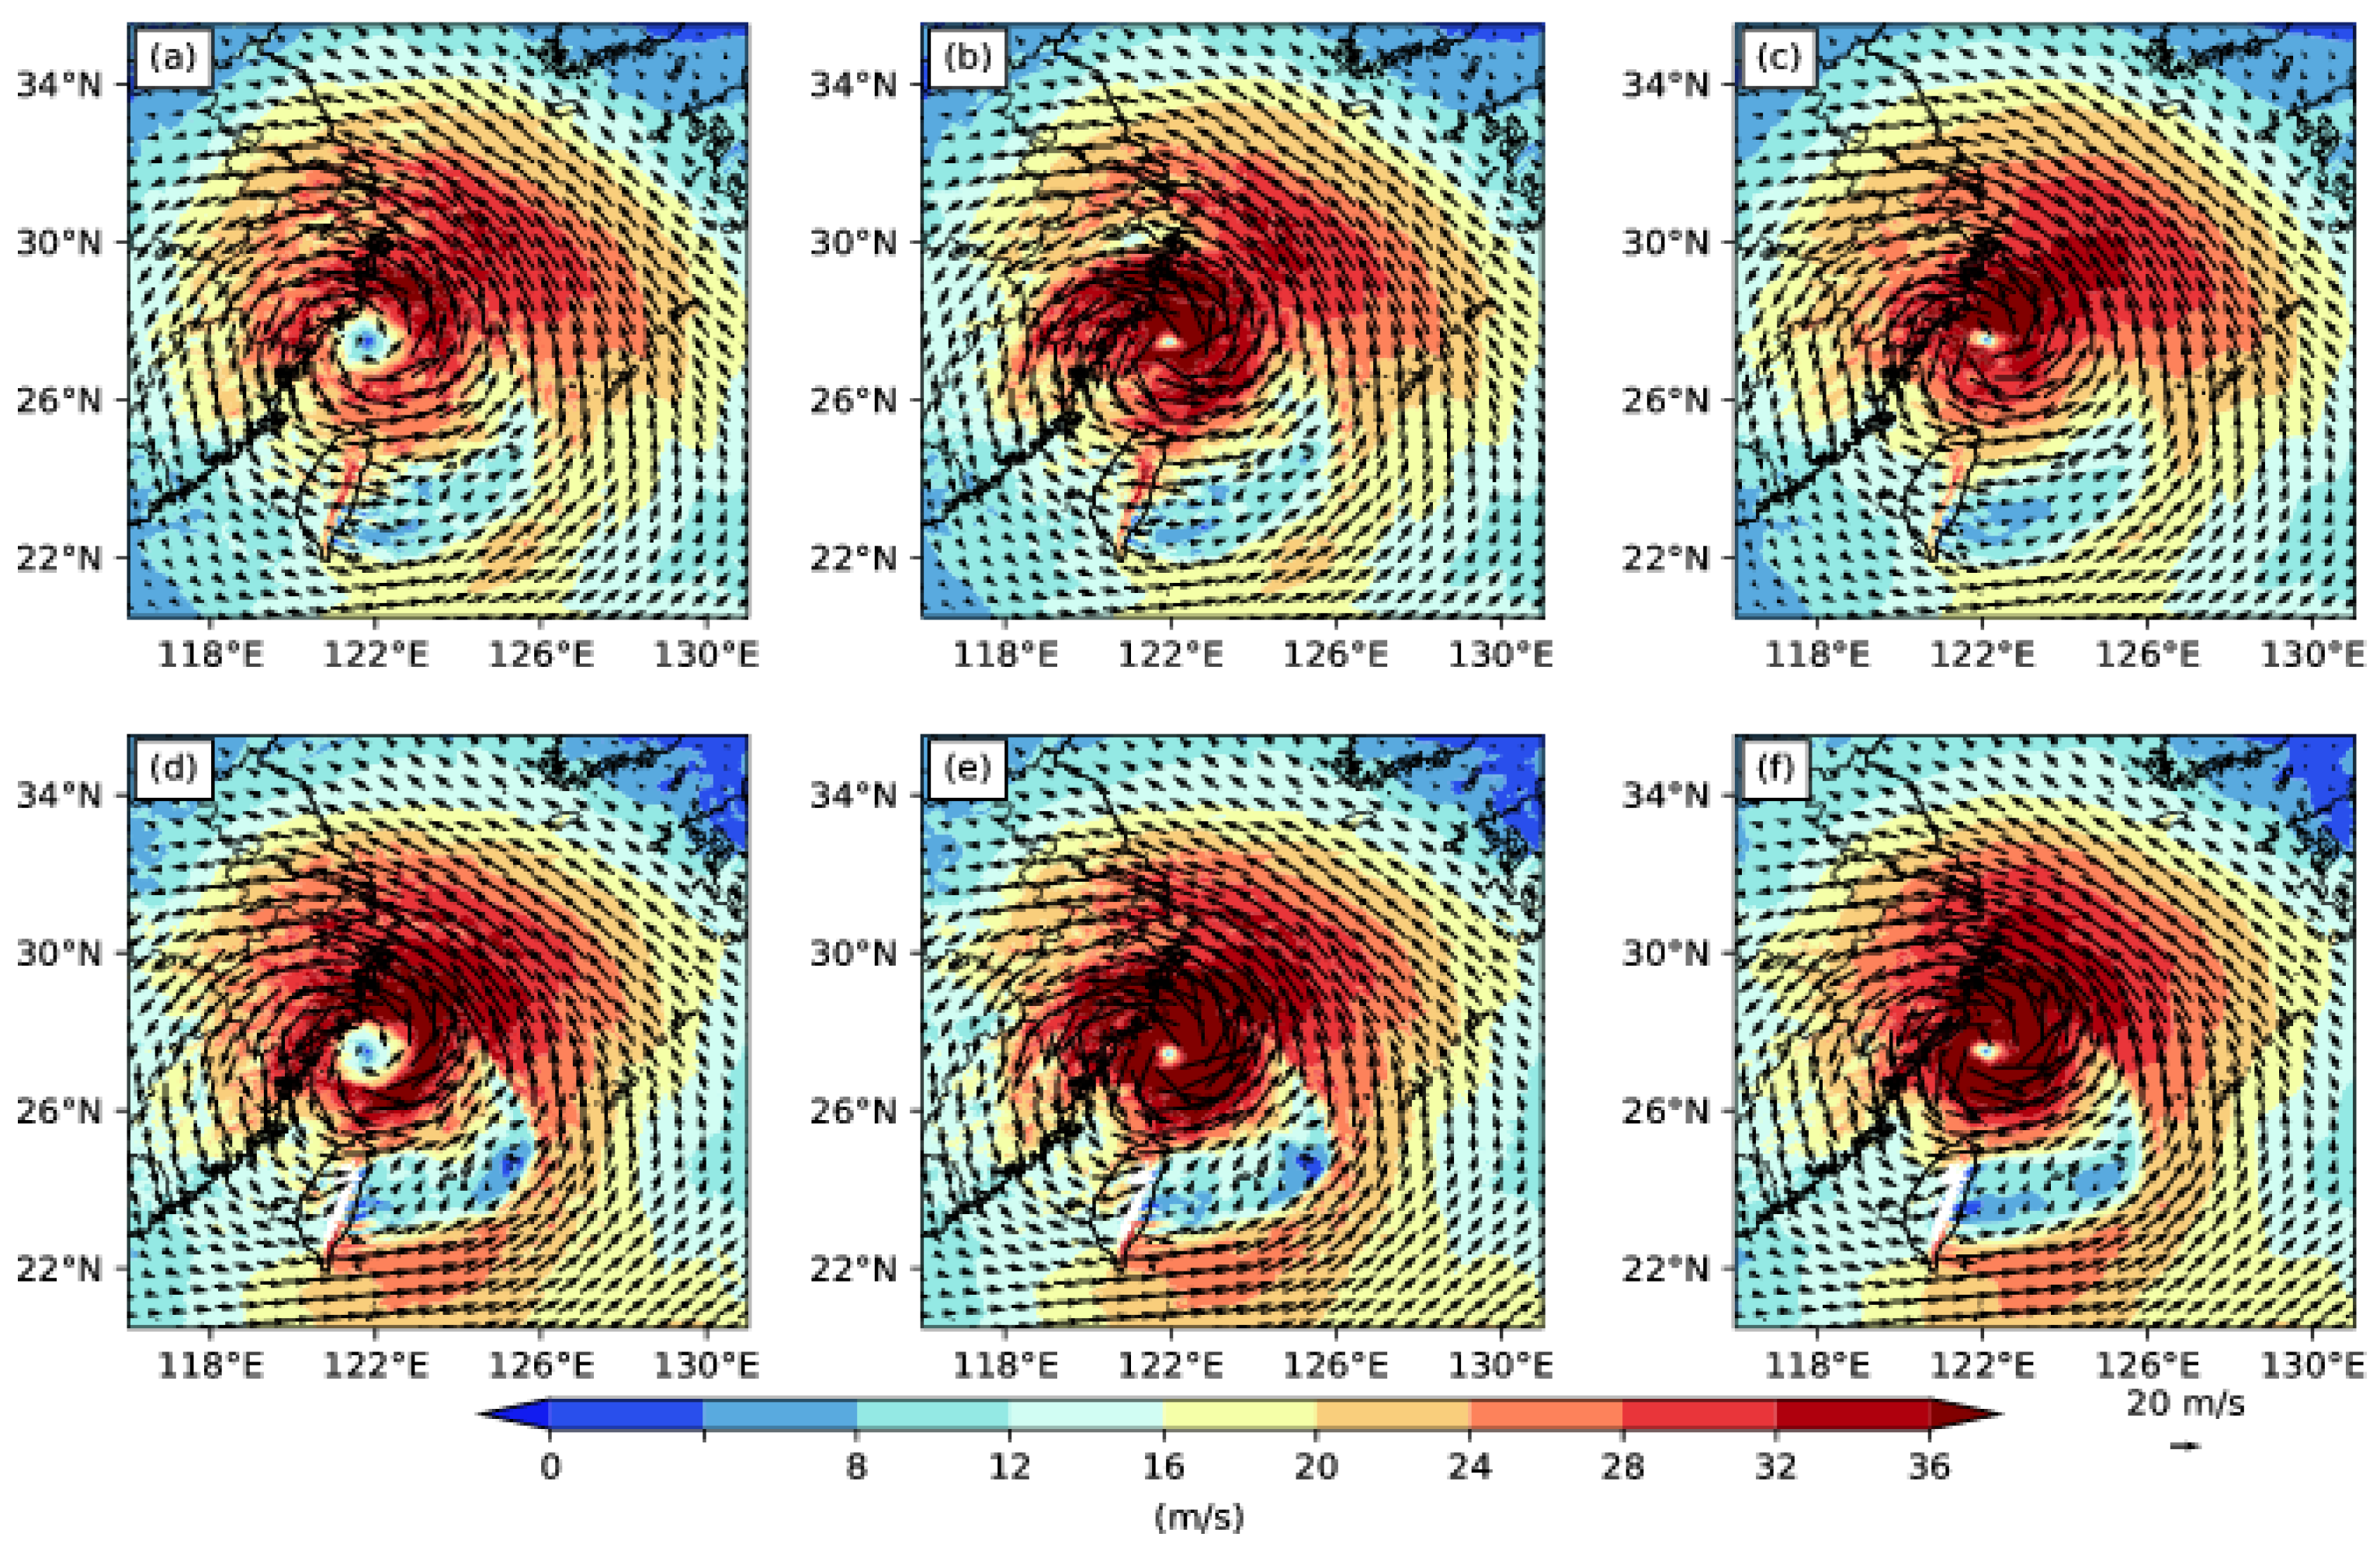
The radial velocity component primarily reflects horizontal wind characteristics. Comparative horizontal wind fields at dual atmospheric levels from the control and assimilation experiments are displayed in Figure 17 (1200 UTC on 9 August 2019). As can be seen from Figure 17a,d, in the control experiment, Typhoon Lekima located near the coast of Zhejiang at the altitudes of 700 hPa and 850 hPa exhibits typical structural characteristics of a cyclonic wind field, and the wind speed at the typhoon center exceeds 24 m/s. Both the 3DVAR (Figure 17b,e) and EnKF (Figure 17c,f) assimilation experiments demonstrate a more compact typhoon vortex structure at both vertical levels compared with the control simulation, accompanied by enhanced wind speeds in the core region.
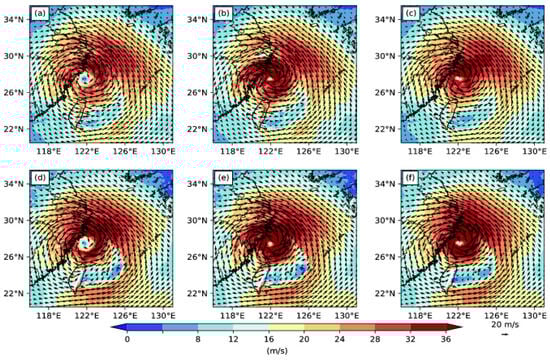
Figure 17.
Horizontal wind speed (arrows, unit: m/s) and wind speed (shaded, unit: m/s) at 700 hPa (top) and 850 hPa (bottom) at 1200 UTC on 9 August 2019 from (a,d) control, (b,e) 3DVAR and (c,f) EnKF assimilation experiments.
Figure 18 presents the differences in wind field analysis at 500 hPa and 850 hPa at 12:00 on 9 August 2019. Quantitative evaluation indicates that incorporating radar-derived radial velocity observations markedly enhances wind field magnitudes within the typhoon’s dynamic convergence sectors at both 700 hPa and 850 hPa layers compared with the non-assimilated control configuration. Additionally, the difference field between the assimilated horizontal wind and the control experiment exhibits a cyclonic structure, further reflecting the enhanced vertical convergence and upward movement resulting from the assimilation of radial velocity data. Radial velocity data assimilation demonstrates marked improvements in resolving mesoscale wind dynamics, with the most pronounced enhancements concentrated within the typhoon’s vortex core region.
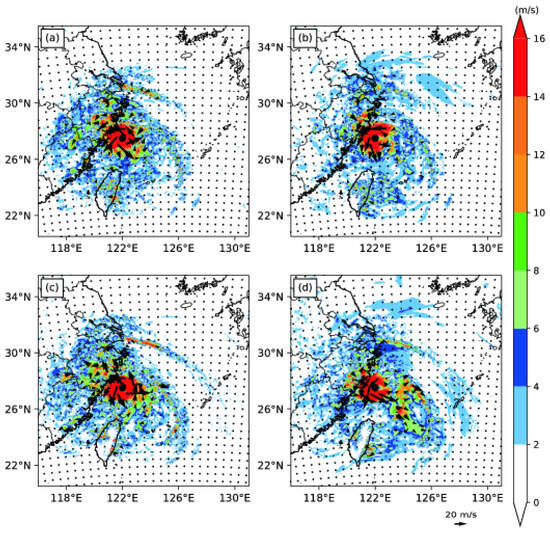
Figure 18.
The analysis difference of wind speed (shaded, unit: m/s) and wind vector (arrows, unit: m/s) at 700 hPa (a,b) and 850 hPa (c,d) at 1200 UTC on 9 August 2019 between the assimilation experiment and the CNTL experiment based on (a,c) the 3DVAR assimilation experiment and (b,d) the EnKF assimilation experiment. Black dots indicate the observed typhoon location.
6. Conclusions and Discussion
The radar radial velocity data assimilation via the Ensemble Kalman Filter methodology with the WRF numerical framework is systematically examined for its capacity to improve mesoscale features in both initializations and subsequent predictions of Typhoon Lekima (2019). To comprehensively assess the assimilation effect, three groups of comparative experiments were designed: the control experiment, the 3DVAR assimilation experiment and the EnKF assimilation experiment. This investigation evaluates the impacts of radar radial velocity assimilation on three critical forecast parameters, track, intensity and precipitation, in Typhoon Lekima (2019). Key quantitative outcomes and operational implications derived from numerical experiments are subsequently revealed:
- (1)
- In the control experiment, the simulated typhoon intensity was significantly weaker compared with the actual conditions. The implementation of EnKF-based radar radial velocity assimilation in numerical experiments demonstrates a significant enhancement in near-surface wind velocities (exceeding 48 m/s) within the typhoon’s core region, accompanied by structural modifications including the vertical extension of maximum wind zones and improved warm core representation. These dynamical refinements collectively contribute to a 50–60% reduction in track forecast errors relative to non-assimilated simulations, substantiating the critical role of mesoscale vortex dynamics in modulating tropical cyclone intensification processes. Notably, before the typhoon made landfall, the forecasted track in the EnKF assimilation experiment was the closest to the actual situation.
- (2)
- The EnKF assimilation experiment demonstrated enhanced predictive capability in capturing the spatiotemporal distribution of typhoon precipitation compared with the control and 3DVAR configurations. This improvement in precipitation pattern representation, particularly regarding the alignment of maximum rainfall axes and cumulative totals with observational datasets, suggests that radial velocity assimilation effectively modulates the dynamic and microphysical processes governing convective organization within tropical cyclones.
- (3)
- The control experiment failed to reproduce the characteristic warm core configuration typically associated with mature tropical cyclones, with maximum wind velocities confined to lower atmospheric levels. Radial velocity data assimilation successfully resolved the thermal anomaly structure while vertically extending regions of peak wind intensity. These enhancements indicate that incorporating Doppler wind observations generates a more vertically coherent vortex with improved dynamic alignment to observed tropical cyclone characteristics.
In addition to radial velocity data, radar observation basic quantities also include radar reflectivity factor and others. The research in this study only uses radar radial wind observations without the assimilation of radar reflectivity in the model. In the next step of research, Doppler radar radial velocity and reflectivity data can be jointly assimilated from multi-radars. In recent years, the integration of Machine Learning (ML) techniques into meteorology has become increasingly prominent. In future work, combining ML with traditional data assimilation methods could further enhance forecasting accuracy and efficiency. For instance, deep learning models such as Graph Neural Networks (GNNs) could be used to analyze the spatiotemporal characteristics of radar echoes and develop observation operator error correction models, addressing the nonlinear mapping biases inherent in traditional Ensemble Kalman Filter (EnKF) approaches for severe convective cloud systems.
Author Contributions
Conceptualization, J.G., J.C. and M.Z.; methodology, J.G. and J.C.; software, X.L. and M.L.; validation, X.L. and M.L.; investigation, J.G. and J.C.; data curation, J.C. and X.L.; writing—original draft preparation, J.G.; writing—review and editing, J.G., X.L. and J.C.; supervision, J.C.; funding acquisition, M.Z. All authors have read and agreed to the published version of the manuscript.
Funding
This research study was funded by National Natural Science Foundation of China grant number 42405162.
Data Availability Statement
The ERA5 data used in this paper were obtained from the European Centre for Medium-Range Weather Forecasts (ECMWF) and are available at https://cds.climate.copernicus.eu/datasets/reanalysis-era5-pressure-levels (accessed on 28 June 2025). The best track of typhoon dataset was obtained from the China Meteorological Administration (CMA) tropical cyclone data center and is available at https://tcdata.typhoon.org.cn (accessed on 28 June 2025). The CMPA and radar data presented in this study are available upon request from the first author; these data are not publicly available due to their containing information that could compromise the privacy of research participants.
Acknowledgments
The authors would like to thank the anonymous reviewers for providing professional and insightful comments about this manuscript.
Conflicts of Interest
The authors declare no conflicts of interest.
References
- Leroux, M.D.; Wood, K.; Elsberry, R.L.; Cayanan, E.O.; Hendricks, E.; Kucas, M.; Otto, P.; Rogers, R.; Sampson, B.; Yu, Z. Recent Advances in Research and Forecasting of Tropical Cyclone Track, Intensity, and Structure at Landfall. Trop. Cyclone Res. Rev. 2018, 7, 85–105. [Google Scholar]
- Liu, M.; Zhang, X.; Zhu, X.-S.; Yu, H. Large-eddy simulation of the rapidly intensifying tropical cyclone Soudelor (2015). Atmos. Res. 2023, 294, 106976. [Google Scholar] [CrossRef]
- Shen, F.; Shu, A.; Liu, Z.; Li, H.; Jiang, L.; Zhang, T.; Xu, D. Assimilating FY-4A AGRI Radiances with a Channel-Sensitive Cloud Detection Scheme for the Analysis and Forecasting of Multiple Typhoons. Adv. Atmos. Sci. 2024, 41, 937–958. [Google Scholar] [CrossRef]
- Tiwari, G.; Kumar, P. Predictive skill comparative assessment of WRF 4DVar and 3DVar data assimilation: An Indian Ocean tropical cyclone case study. Atmos. Res. 2022, 277, 106288. [Google Scholar] [CrossRef]
- Kong, R.; Xue, M.; Liu, C.S. Development of a Hybrid En3DVar Data Assimilation System and Comparisons with 3DVar and EnKF for Radar Data Assimilation with Observing System Simulation Experiments. Mon. Weather. Rev. 2018, 146, 175–198. [Google Scholar] [CrossRef]
- Tong, C.-C.; Jung, Y.; Xue, M.; Liu, C. Direct assimilation of radar data with ensemble Kalman filter and hybrid ensemble-variational method in the National Weather Service operational data assimilation system GSI for the stand-alone regional FV3 model at a convection-allowing resolution. Geophys. Res. Lett. 2020, 47, e2020GL089879. [Google Scholar] [CrossRef]
- Shen, F.; Wan, S.; Li, H.; Luo, J.; He, Z.; Fei, H.; Song, L.; Sun, Q.; Xu, D.; Chen, J. Data assimilation of weather radar reflectivity with a blending hydrometer retrieval scheme for two convective storms in East China. Atmos. Res. 2025, 321, 108110. [Google Scholar] [CrossRef]
- Xiao, H.; Wan, Q.; Liu, X.; Chen, S.; Wang, H.; Zheng, T.; Feng, L.; Xia, F. Impact of Radar Reflectivity Direct Assimilation Using WRF-EnKF System on the Forecast of Typhoon “Tian’e” (1713). Acta Meteorol. Sin. 2019, 35, 433–445. [Google Scholar]
- Shen, F.; Song, L.; He, Z.; Xu, D.; Chen, J.; Huang, L. Impacts of adding hydrometeor control variables on the radar reflectivity data assimilation for the 6–8 August 2018 mesoscale convective system case. Atmos. Res. 2023, 295, 107012. [Google Scholar] [CrossRef]
- Lin, K.; Yang, S.; Chen, S. Improving Analysis and Prediction of Tropical Cyclones by Assimilating Radar and GNSS-R Wind Observations: Ensemble Data Assimilation and Observing System Simulation Experiments Using a Coupled Atmosphere–Ocean Model. Weather Forecast. 2022, 37, 1533–1552. [Google Scholar] [CrossRef]
- Yue, J.; Meng, Z. Impact of assimilating Taiwan’s coastal radar radial velocity on forecasting Typhoon Morakot (2009) in southeastern China using a WRF-based EnKF. Sci. China Earth Sci. 2017, 60, 315–327. [Google Scholar] [CrossRef]
- Yin, J. Application of Radial Velocity Data in GRAPES High-Resolution Numerical Modeling. Master’s Thesis, Nanjing University of Information Science and Technology, Nanjing, China, 2019. [Google Scholar]
- Feng, J.; Duan, Y.; Xu, J.; Zhang, X.; Hu, H. Improvement of Numerical Simulation of Typhoon Rainbow Using Radar Data Assimilation in 2015. Acta Meteorol. Sin. 2017, 28, 399–413. [Google Scholar]
- Feng, J.; Duan, Y.; Wan, Q.L.; Hu, H.; Pu, Z.X. Improved Prediction of Landfalling Tropical Cyclone in China Based on Assimilation of Radar Radial Winds with New Super-Observation Processing. Weather Forecast. 2020, 35, 2523–2539. [Google Scholar] [CrossRef]
- Zhu, L.; Wan, Q.; Shen, X.; Meng, Z. Prediction and predictability of high-impact western Pacific landfalling Tropical Cyclone Vicente (2012) through convection-permitting ensemble assimilation of Doppler radar velocity. Mon. Weather Rev. 2016, 144, 21–43. [Google Scholar] [CrossRef]
- Zhang, L.; Tian, X.; Zhang, H.; Chen, F. Impacts of Multigrid NLS-4DVar-based Doppler Radar Observation Assimilation on Numerical Simulations of Landfalling Typhoon Haikui (2012). Adv. Atmos. Sci. 2020, 37, 873–892. [Google Scholar] [CrossRef]
- Shen, F.; Xu, D.; Min, J. Effect of momentum control variables on assimilating radar observations for the analysis and forecast for Typhoon Chanthu (2010). Atmos. Res. 2019, 230, 104622. [Google Scholar] [CrossRef]
- Shi, D.; Chen, G.; Wang, K.; Bi, X.; Chen, K. Evaluation of two initialization schemes for simulating the rapid intensification of Typhoon Lekima (2019). Adv. Atmos. Sci. 2020, 37, 987–1006. [Google Scholar] [CrossRef]
- Huang, J.; Ma, Z.; Zhao, H.; Fei, J.; Chen, L. Increase in western North Pacific tropical cyclone intensification rates and their northwestward shifts. Atmos. Res. 2024, 301, 107292. [Google Scholar] [CrossRef]
- Chen, J.; Xu, D.; Shu, A.; Song, L. The Impact of Radar Radial Velocity Data Assimilation Using WRF-3DVAR System with Different Background Error Length Scales on the Forecast of Super Typhoon Lekima (2019). Remote Sens. 2023, 15, 2592. [Google Scholar] [CrossRef]
- Hersbach, H.; Bell, B.; Berrisford, P.; Hirahara, S.; Horányi, A.; Muñoz-Sabater, J.; Nicolas, J.; Peubey, C.; Radu, R.; Schepers, D.; et al. The ERA5 global reanalysis. Q. J. R. Meteorol. Soc. 2020, 146, 1999–2049. [Google Scholar] [CrossRef]
- Yuan, Y.; Chen, T.; Ao, T.; Yang, K. Flood Simulation Study of China’s Data-Deficient Mountainous Watersheds Based on CMPA-Hourly. Atmosphere 2023, 14, 1666. [Google Scholar] [CrossRef]
- Zhang, J.; Wang, S. An Automated 2D Multipass Doppler Radar Velocity Dealiasing Scheme. J. Atmos. Oceanic Technol. 2006, 23, 1239–1248. [Google Scholar] [CrossRef]
- Xiao, Q.; Zhang, X.; Davis, C.; Tuttle, J.; Holland, G.; Fitzpatrick, P. Experiments of Hurricane Initialization with Airborne Doppler Radar Data for the Advanced Research Hurricane WRF (AHW) Model. Mon. Weather Rev. 2009, 137, 2758–2777. [Google Scholar] [CrossRef]
- Liu, J.; Pu, Z.; Lee, W.C.; Gao, Z. Influence of Assimilation of NEXRAD-Derived 2D Inner-Core Structure Data from Single Radar on Numerical Simulations of Hurricane Charley (2004) near Its Landfall. Remote Sens. 2024, 16, 1351. [Google Scholar] [CrossRef]
- He, G.; Sun, J.; Ying, Z.; Zhang, L. A radar radial velocity dealiasing algorithm for radar data assimilation and its evaluation with observations from multiple radar networks. Remote Sens. 2019, 11, 2457. [Google Scholar] [CrossRef]
- Helmus, J.J.; Collis, S.M. The Python ARM Radar Toolkit (Py-ART), a Library for Working with Weather Radar Data in the Python Programming Language. J. Open Res. Softw. 2016, 4, e25. [Google Scholar] [CrossRef]
- Zhang, F.; Weng, Y.; Sippel, J.A.; Meng, Z.; Bishop, C.H. Cloud-resolving hurricane initialization and prediction through assimilation of Doppler radar observations with an ensemble Kalman filter. Mon. Weather Rev. 2009, 137, 2105–2125. [Google Scholar] [CrossRef]
- Anderson, J. An Ensemble Adjustment Kalman Filter for Data Assimilation. Mon. Weather Rev. 2001, 129, 2884–2903. [Google Scholar] [CrossRef]
- Zhu, L. Research on Ensemble Kalman Filter Data Assimilation Method. Master’s Thesis, Nanjing University of Information Science and Technology, Nanjing, China, 2007. [Google Scholar]
- Xu, D.; Zhang, X.; Li, H.; Wu, H.; Shen, F.; Shu, A.; Wang, Y.; Zhuang, X. Evaluation of the Simulation of Typhoon Lekima (2019) Based on Different Physical Parameterization Schemes and FY-3D Satellite’s MWHS-2 Data Assimilation. Remote Sens. 2021, 13, 4556. [Google Scholar] [CrossRef]
- Parrish, D.; Derber, J. The National Meteorological Center’s spectral statistical-interpolation analysis system. Mon. Weather Rev. 1992, 120, 1747–1763. [Google Scholar] [CrossRef]
- Gaspari, G.; Cohn, S. Construction of correlation functions in two and three dimensions. Q. J. R. Meteorol. Soc. 1999, 125, 723–733. [Google Scholar] [CrossRef]
- Zhang, F.; Snyder, C.; Sun, J. Impacts of initial estimate and observation availability on convective-scale data assimilation with an ensemble Kalman filter. Mon. Weather Rev. 2004, 132, 1238–1254. [Google Scholar] [CrossRef]

Disclaimer/Publisher’s Note: The statements, opinions and data contained in all publications are solely those of the individual author(s) and contributor(s) and not of MDPI and/or the editor(s). MDPI and/or the editor(s) disclaim responsibility for any injury to people or property resulting from any ideas, methods, instructions or products referred to in the content. |
© 2025 by the authors. Licensee MDPI, Basel, Switzerland. This article is an open access article distributed under the terms and conditions of the Creative Commons Attribution (CC BY) license (https://creativecommons.org/licenses/by/4.0/).