Abstract
Current synthetic aperture radar (SAR) ship datasets exhibit a notable disparity in the distribution of large, medium, and small ship targets. This imbalance makes it difficult for a relatively small number of large and medium-sized ships to be effectively trained, resulting in many false alarms. Therefore, to address the issues of scale diversity, intra-class imbalance in ship data, and the feature conflict problem associated with traditional coupled detection heads, we propose an SAR image multiscale task-decoupled oriented ship target detector based on a size-aware balanced strategy. First, the multiscale target features are extracted using the multikernel heterogeneous perception module (MKHP). Meanwhile, the triple-attention module is introduced to establish the remote channel dependence to alleviate the issue of small target feature annihilation, which can effectively enhance the feature characterization ability of the model. Second, given the differences in the demand for feature information between the detection and classification tasks, a channel attention-based task decoupling dual-head (CAT2D) detector head structure is introduced to address the inherent conflict between classification and localization tasks. Finally, a new size-aware balanced (SAB) loss strategy is proposed to guide the network in focusing on the scarce targets in training to alleviate the intra-class imbalance problem during the training process. The ablation experiments on SSDD+ reflect the contribution of each component, and the results of the comparison experiments on the RSDD-SAR and HRSID datasets show that the proposed method achieves state-of-the-art performance compared to other state-of-the-art detection models. Furthermore, our approach exhibits superior detection coverage for both offshore and inshore scenarios for ship detection tasks.
1. Introduction
Synthetic aperture radar (SAR) is an advanced microwave sensor [1] that is capable of providing all-weather monitoring under various meteorological conditions [2,3]. Its applications in maritime surveillance are extensive, encompassing areas such as maritime traffic management, fisheries monitoring, search and rescue operations, and military reconnaissance. Ship detection is critical in maritime surveillance because ship activities directly affect international trade and maritime security. Following the deployment of numerous high-resolution SAR satellites, obtaining high-quality SAR ship data [4,5,6] has become more convenient, and research focusing on SAR ship detection is increasing [7,8,9,10,11,12,13,14,15,16,17].
In recent decades, numerous conventional SAR ship detection methods have been proposed, covering techniques based on statistical features [18,19], visual saliency [20], and transformations [21]. The constant false alarm rate (CFAR) [18] method has been widely studied as a statistical feature-driven technique, and its performance is significantly affected by the statistical modeling of background clutter. Although some of the improved CFAR techniques can fit the sea surface clutter better and perform well in simple sea conditions, their effectiveness decreases significantly in complex inshore scenarios.
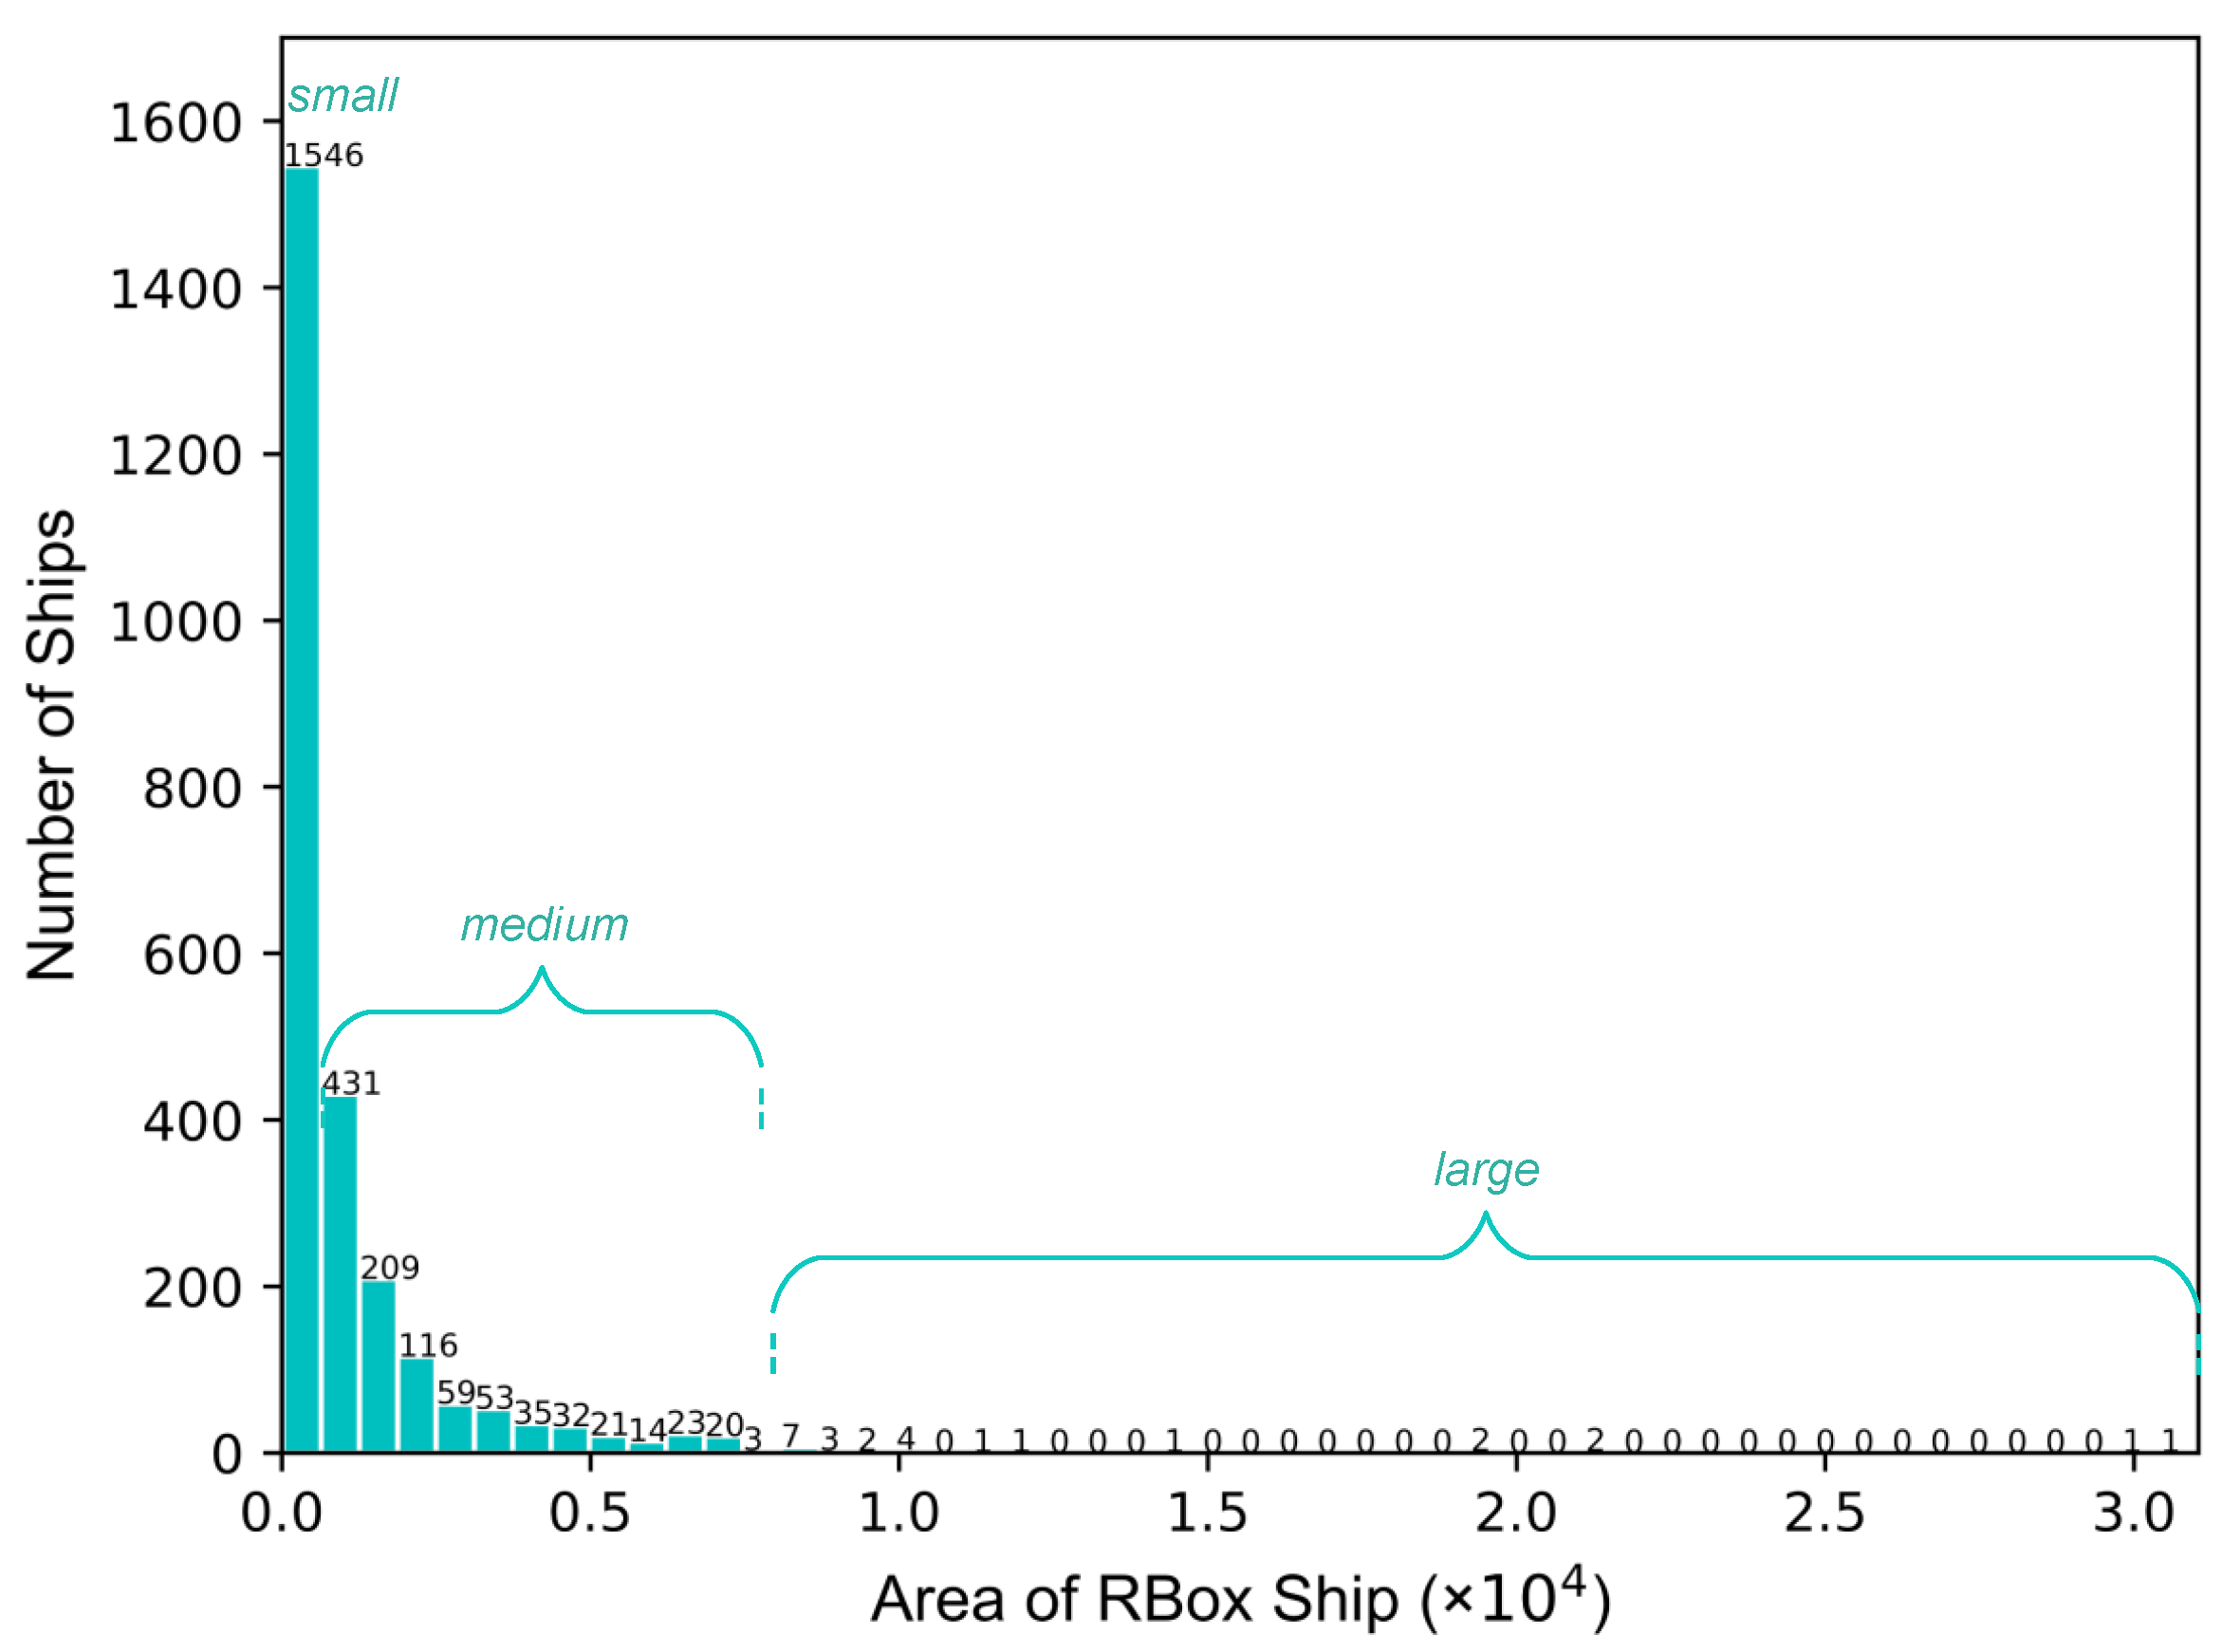
With improvements in computing power, target detection methods based on deep learning have made significant progress, which are mainly classified as one-stage [22,23,24,25] and two-stage [26,27,28] algorithms. In addition to optical images, deep learning methods have also made breakthroughs in SAR target detection. Although the method based on a horizontal bounding box (HBB) [7,8,9,10,11] has achieved some results in SAR ship detection, its performance is limited by the characteristics of ship targets in SAR images with diverse orientations, dense arrangement, and large aspect ratios, which easily lead to classification and regression errors. For this reason, researchers propose an improved algorithm based on an oriented bounding box (OBB) [12,13,14,15,16,17], which introduces angular regression based on HBB to improve the localization accuracy. The target detection method based on an OBB can accurately determine the specific position and direction of ships in SAR images, which provides a clear starting point and search range for SAR ship wake detection [29] and can better promote the development of applications for SAR ships. At present, representative algorithms such as ROI-Transformer [12], Oriented R-CNN [13], ReDet [14], R3Det [15], and Oriented RepPoints [16] have been developed in the field of optical remote sensing and derived numerous SAR ship detection methods, but they still face the following challenges: First, there are significant differences in the size of ship targets in SAR images, with small targets suffering from inadequate feature representation due to convolution and down-sampling, leading to severe missed detections and false alarms for small targets. Second, background noise and multiscale variations in SAR ship images exacerbate the task complexity, and traditional coupled detection heads face performance bottlenecks due to interference between classification and localization tasks. Third, ship target sizes follow an extreme long-tail distribution in Figure 1, with insufficient training focus on large and medium-sized ships, resulting in a large number of missed detections.

Figure 1.
Area distribution of ships in the SSDD+ dataset [4].
To address the above issues, this study proposes an oriented ship target detection network for SAR images based on a size-aware balanced strategy. The primary contributions of this study are outlined as follows:
- 1.
- To address the problem of scale diversity in ship targets of SAR images, a multiscale target feature extraction (MSTFE) backbone that can effectively extract multiscale targets is constructed, which is mainly composed of the multikernel heterogeneous perception (MKHP) module for multiscale target feature extraction, the triple-attention module to alleviate the annihilation of small target features, and the convolutional perceptron module (CPM) that introduces nonlinear transformation, thereby obtaining richer and more detailed feature representations.
- 2.
- Aiming at the defective problem of the traditional coupled detector head, considering that the classification and localization tasks have different sensitive regions in the feature space, a channel attention-based task decoupling dual-head (CAT2D) detector is designed, which utilizes the channel attention to adaptively select the layer features that are most suitable for each task. Subsequently, the selected features are input into the sensitive detector head structure for the output to enhance the robustness of both classification and localization tasks.
- 3.
- Regarding the problem of ship size imbalance, to further strengthen the model’s focus on large and medium-sized targets during the training process, the intra-class imbalance during the training process is regarded as the main obstacle to preventing the detector from achieving the highest accuracy, and a new size-aware balanced (SAB) loss function is proposed to eliminate this obstacle.
- 4.
- We conducted extensive experiments on the publicly available SSDD+ [4], RSDD-SAR [5], and HRSID [6] oriented bounding box datasets. The results of the comparative experiment show that the proposed method outperformed existing oriented detection methods. Compared with the baseline network, on the SSDD+, RSDD-SAR, and HRSID datasets, the mAP improved by 2.1%, 1.4%, and 1.9%, respectively. Ablation studies indicate that the MSTFE backbone and SAB strategy significantly improve ship detection, while the CAT2D effectively mitigates task conflicts.
2. Related Work
2.1. Oriented Bounding Box (OBB) Target Detection
In SAR images, the diverse orientations and dense distribution of ship targets render traditional horizontal bounding boxes (HBBs) insufficient for direction-sensitive characterization, as they include redundant background and limit feature extraction. To address this, researchers have proposed oriented detection methods. For example, RoI Transformer [12] learns region-of-interest (RoI) transformation parameters via spatial alignment supervised by oriented bounding boxes. Oriented R-CNN [13] modifies the region proposal network (RPN) to regress six parameters for direct oriented proposal generation. ReDet [14] leverages rotation-covariant networks for invariant feature extraction, which is combined with rotation-adaptive RoI Align. R3Det [15] employs stepwise regression for coarse-to-fine orientation prediction, complemented by a feature refinement module. G-Rep [30] unifies an oriented bounding box (OBB) and point set modeling via Gaussian distributions. However, the limitation of the above methods lies in their inability to deeply couple SAR scattering physical characteristics with geometric directional representation. Oriented RepPoints [16], on the other hand, utilize an adaptive point learning mechanism to directly capture key points of strong scattering centers from images, explicitly representing direction through point set distributions. This approach avoids the limitations of predefined boxes or distribution assumptions, achieving a breakthrough from parametric regression to physical structure-level representation, thereby enhancing the accuracy of ship target detection in complex scenarios.
2.2. Multiscale Target Detection
SAR ship datasets consist of ships of varying sizes. Current researchers mainly focus on improving detection accuracy for multiscale ship targets by optimizing algorithms through feature fusion and attention mechanisms. For example, Zhou et al. [31] developed a SAR image ship detection method based on multiscale feature extraction and adaptive feature fusion, which improves detection accuracy by combining multiscale features and adaptively fusing these features. Wang et al. [32] developed NAS-YOLOX, combining NAS-FPN with a multiscale attention mechanism to enhance feature extraction. Chen et al. [33] incorporated an SAS-FPN structure and atrous spatial pyramid pooling with shuffle attention for better detection of multiscale targets. Liu et al. [34] created a lightweight network with a bi-directional feature fusion module and convolutional block attention to improve feature extraction in complex backgrounds. Liang et al. [35] introduced MSFA-YOLO, using a fused attention mechanism and dense ASPP structure to enhance feature extraction for ships of various scales. Zhou et al. [36] designed a new attention feature fusion network that aggregates semantic information from features at different levels and suppresses interference from complex backgrounds through an attention mechanism, thereby focusing more on ship targets. However, these methods typically fuse features across scales by simple addition or concatenation, which fails to address the semantic differences between features at different levels, resulting in insufficient coupling of shallow and deep features and making small ships prone to being obscured by background noise. Additionally, the use of a single-attention module often fails to effectively enhance multigranularity features, leading to poor activation for small targets. This paper proposes a multikernel heterogeneous convolutional kernel set to directly extract multiscale target features at the same level, combined with a synergistic architecture of multiple attention mechanisms, enabling better capture of small target features, precise feature enhancement, and improved feature characterization with fewer network parameters.
2.3. Task Decoupling
Traditional target detection methods often combine classification and localization tasks, leading to high model complexity and training difficulties. To address these challenges, researchers have proposed decoupling the detection head, which enhances performance and flexibility by separating classification and localization tasks. Song et al. [37] demonstrated that classification and localization tasks respond to different regions: Classification is sensitive to the most discriminative part of the object, while localization is sensitive to the object’s edges. Based on this, Task-Aware Spatial Disentanglement (TSD) was proposed, which separates the tasks by generating two decoupled proposals. Wu et al. [38] introduced a double-head method with a fully connected head for classification and a convolutional head for bounding box regression, improving model robustness. Zhou et al. [39] proposed an edge semantic decoupling (ESD) structure and a transformer detection layer (TDL) to distinguish ship targets in dense areas. Han et al. [40] introduced a semi-decoupled head with spatial decoupling and redundancy suppression, enhancing detection performance in the Faster R-CNN framework. Song et al. [41] improved detection speed and accuracy with a lightweight rotationally decoupled detector head. However, the above methods only achieve decoupling at the feature level and do not fully consider the sensitivity of the detection head structure to different tasks. Our method combines task decoupling with a dual-head structure, optimizing the decoupling process to better handle classification and localization tasks while improving overall performance by allowing each head to focus more effectively on its specific task.
2.4. Intra-Class Imbalance
The SAR ship datasets suffer from an imbalance in inshore and offshore ship targets, with disparities in small, medium, and large ship quantities. This imbalance leads to inadequate target feature extraction and false alarms due to model bias in inshore ship detection. Reducing false alarms and effectively utilizing SAR ship features are crucial. Zhang et al. [42] used deep convolutional generative adversarial networks (DCGANs) to generate minority class ship samples, alleviating intra-class imbalance by balancing the training data, but generating samples was found to require significant computational costs. Guo et al. [43] proposed the Masked Efficient Adaptive Network (MEA-Net), which balances the target distribution through data augmentation and morphological processing. However, it overlooks target size differences and demands substantial computational resources. Zhan et al. [44] introduced the center focus loss (CEFL) to tackle intra-class imbalance in SAR ship detection by aggregating deep features and applying intra-class center distance constraints. However, this approach lacks sensitivity to ship size. Liu et al. [45] introduced evidence-based learning to correct the intra-class imbalance by utilizing uncertainty labels to improve the detection accuracy, which is effective but increases the complexity of training. However, we directly optimize the target size distribution imbalance by balancing the training contributions of different sized ships to the network during training, thus solving the within-class imbalance problem without increasing the inference cost.
3. Materials and Methods
3.1. Overall Framework
To accurately locate ship targets, our method is based on the Oriented RepPoints [16] framework, a directional unanchored target detection model using a point set representation. It first regresses the point set from the target center and then refines their positions for more precise localization. Unlike traditional angle-based regression, Oriented RepPoints determine target orientation through the point set, avoiding issues of angle prediction inaccuracies.
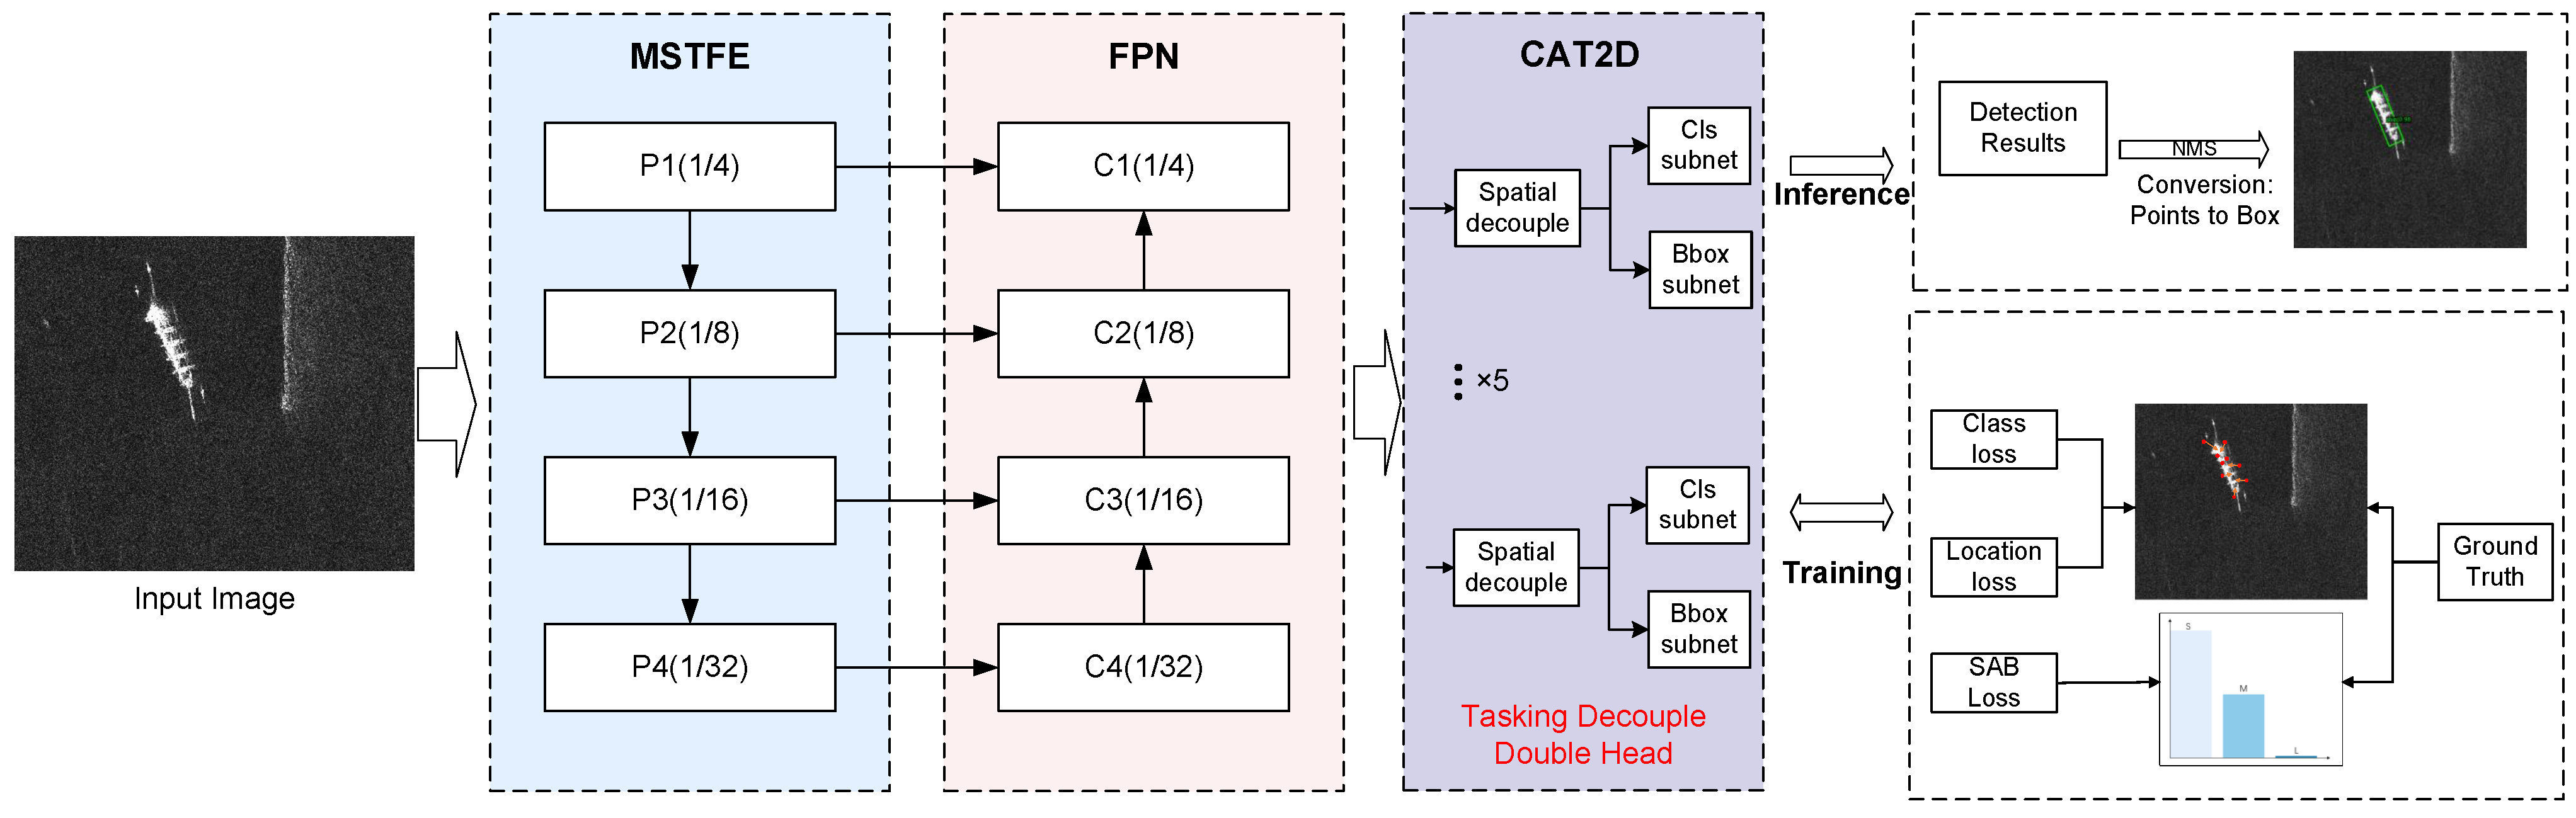
To address the unique properties of SAR ship data, we propose a multiscale task decoupling detector with a size-aware balanced strategy consisting of three components: the MSTFE backbone for multiscale target feature extraction, FPN for feature fusion, and CAT2D for final prediction. The overall framework is illustrated in Figure 2. The image undergoes preprocessing, adjusting size, and normalization; it then enters MSTFE to produce a multiscale feature map. FPN further fuses these features, which are processed by the CAT2D for feature decoupling and then input to the dedicated head for predictions. Additionally, a size-aware balanced loss function is introduced to address the imbalance of ship sizes in SAR datasets, effectively balancing intra-class imbalance without adding computation during inference. Since it only plays a role in the training phase, during the inference phase, the model performs forward propagation calculations and makes predictions based solely on the learned parameters without performing any additional calculations related to the loss function, thus not increasing any inference costs.

Figure 2.
Overall proposed framework.
3.2. Multiscale Target Feature Extraction Backbone
3.2.1. Multiscale Target Feature Extraction Structure
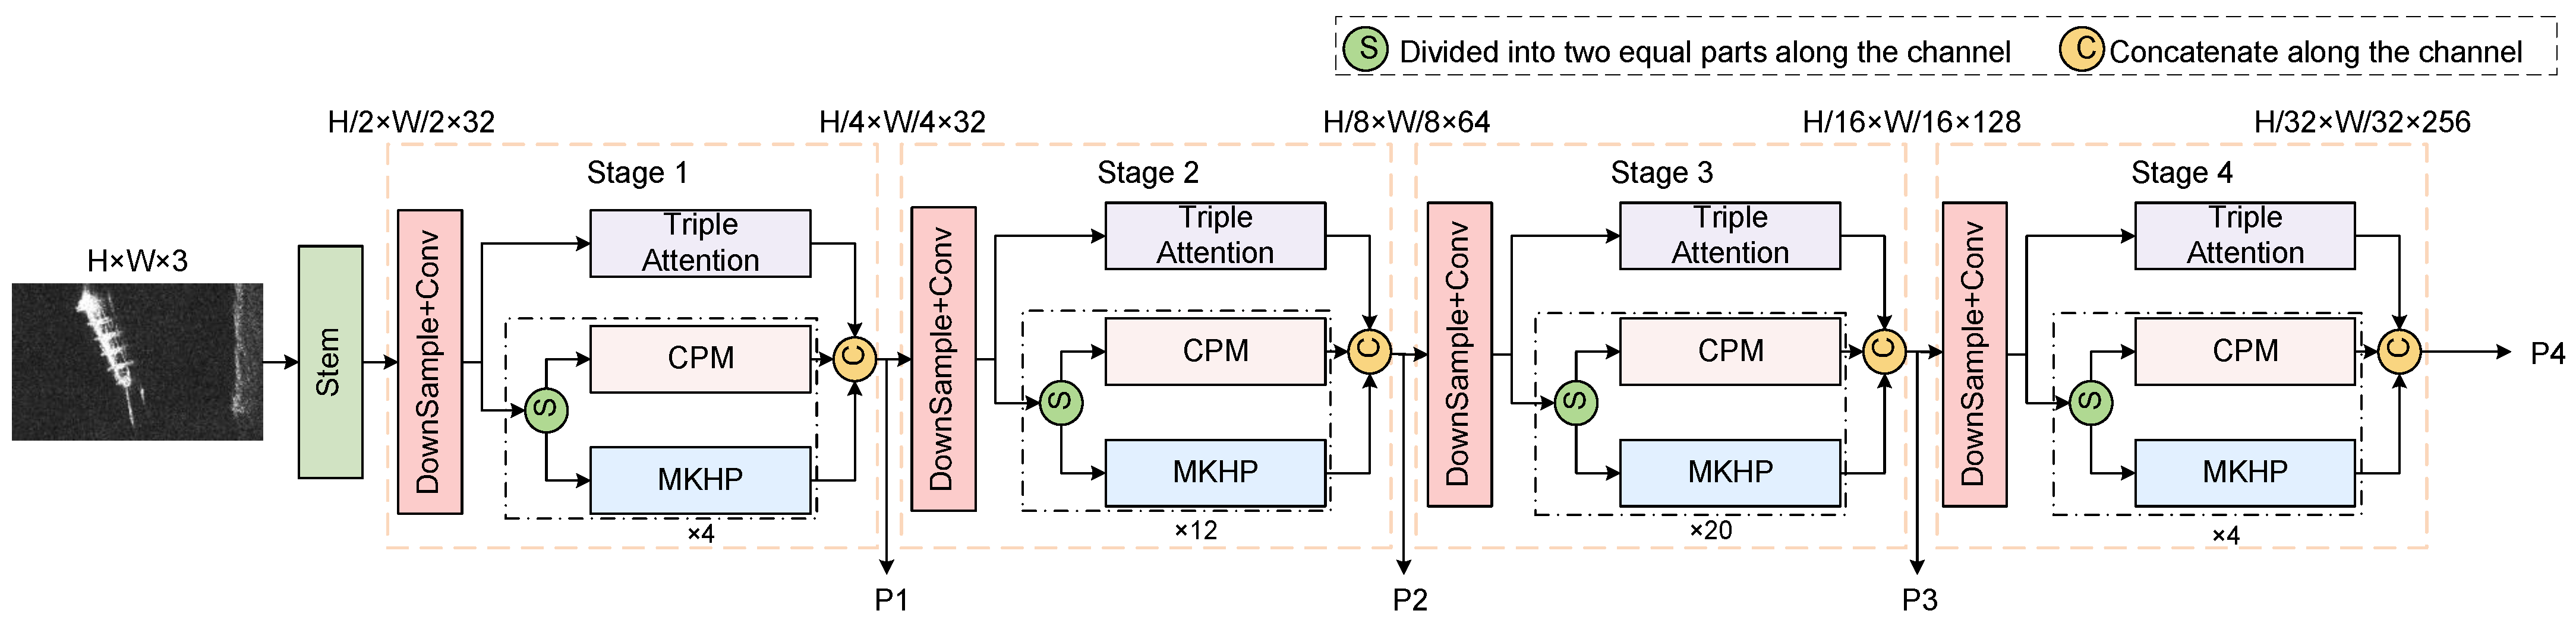
The inception structure is a key component of the GoogLeNet architecture, proposed by Google, to efficiently extract multiscale features [46]. The module captures the rich information in an image by applying multiple convolutional kernels of different sizes and maximum pooling layers in parallel within the same layer. Inspired by the inception module, this study proposes a multiscale target feature extraction (MSTFE) backbone for detecting SAR ship targets that is designed to handle the complexities of SAR images, including shadows, clutter, and variable ship shapes. The MSTFE backbone comprises three modules: a multikernel heterogeneous perception module (MKHP), a triple-attention module, and a convolutional perceptron module (CPM). The framework structure of the backbone is shown in Figure 3. The MKHP module is the core of the MSTFE backbone, which captures features at different scales by using parallel heterogeneous convolutional kernels, allowing the model to focus on both the global structure and local details of ship targets of various sizes. The triple-attention mechanism integrates channel attention, spatial attention, and attention gating to enhance feature representation by emphasizing important information while suppressing irrelevant data. The CPM improves feature representation through nonlinear transformations and processes deeper features, aiding classification and localization tasks. Additionally, the CPM helps the model develop abstract features, boosting its generalization ability in complex environments. With this multiscale, multiattention, and deep-level feature extraction strategy, our method can show superior performance in the detection of SAR ship targets.
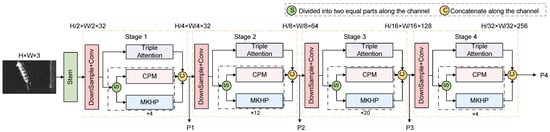
Figure 3.
Structure of the multiscale target feature extraction backbone.
3.2.2. Multikernel Heterogeneous Perception Module
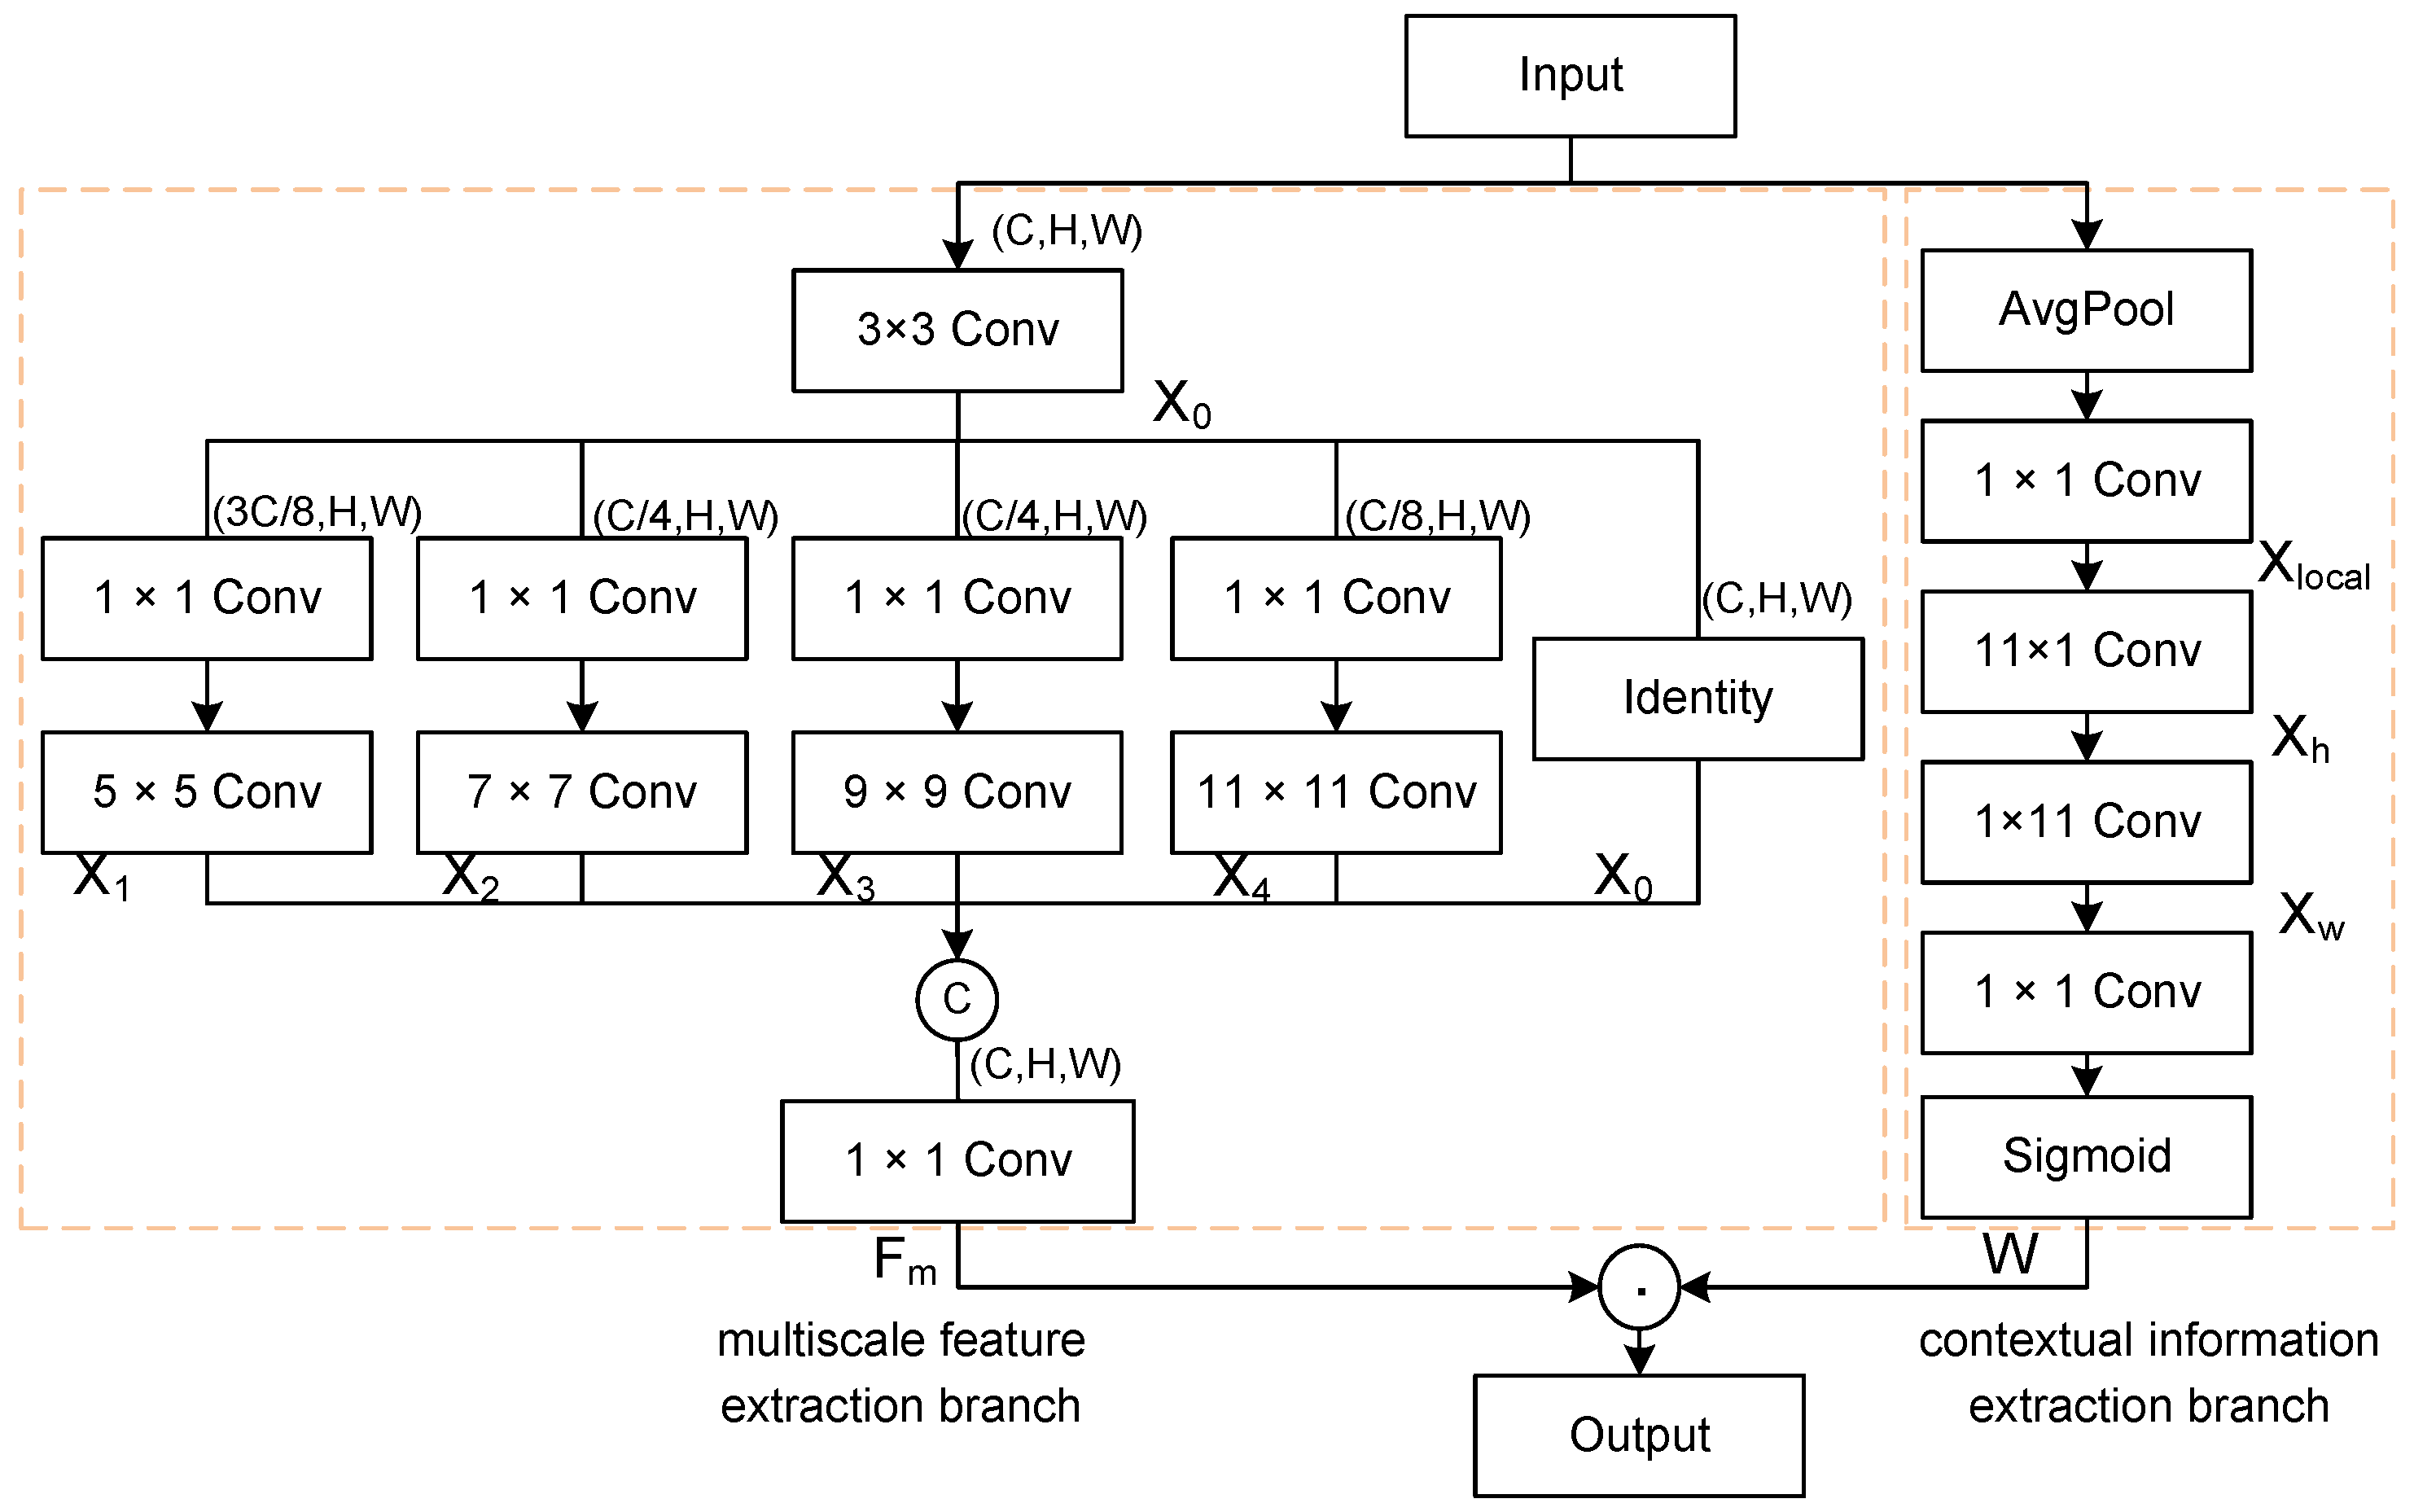
Ship targets in SAR images usually have different sizes and wide size spans, which requires the detection model to capture target features of various sizes. Inspired by [46,47], we propose a multikernel heterogeneous perception module (MKHP) for efficient extraction of features at multiple sizes, as shown in Figure 4. The module consists of two branches: one for multiscale feature extraction and the other for local context information.
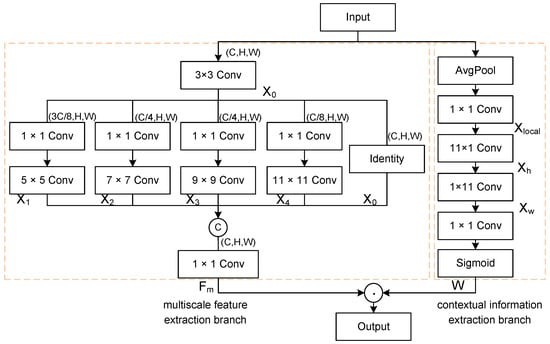
Figure 4.
Structure of the multikernel heterogeneous perception module.
The multiscale feature extraction branch starts with a 3 × 3 convolution to gather local information, followed by a 1 × 1 convolution to reduce channel numbers, thus alleviating computational load. It then performs multiscale target feature extraction using a parallel convolutional layer with kernels of varying sizes. Larger kernels capture the overall contours and features of larger ships, while smaller kernels focus on the fine textures and edges of smaller ships. Finally, local and contextual features are fused via a 1 × 1 convolution after merging along channel dimensions to represent interrelations among channels. The specific calculation process is as follows:
where represents the input features, represents the initial extracted features, represents the different scale features extracted by different convolution kernels, and represents the final fusion of multiscale features.
The contextual information extraction branch first decreases the spatial dimensions of the feature maps and preserves important features through average pooling, which reduces overfitting and enhances the robustness of small positional variations. Next, the local area features are preserved by a 1 × 1 convolution. Subsequently, the dependencies between long-range contextual information and local features are captured by 11 × 1 and 1 × 11 strip convolutions, respectively. Finally, an attention weight is generated via the sigmoid activation function to enhance the output of the multiscale feature extraction branch. The specific process is as follows:
where represents the local region features, represents the horizontal feature information, represents the vertical feature information, and W represents the remote context weight.
3.2.3. Triple-Attention Module
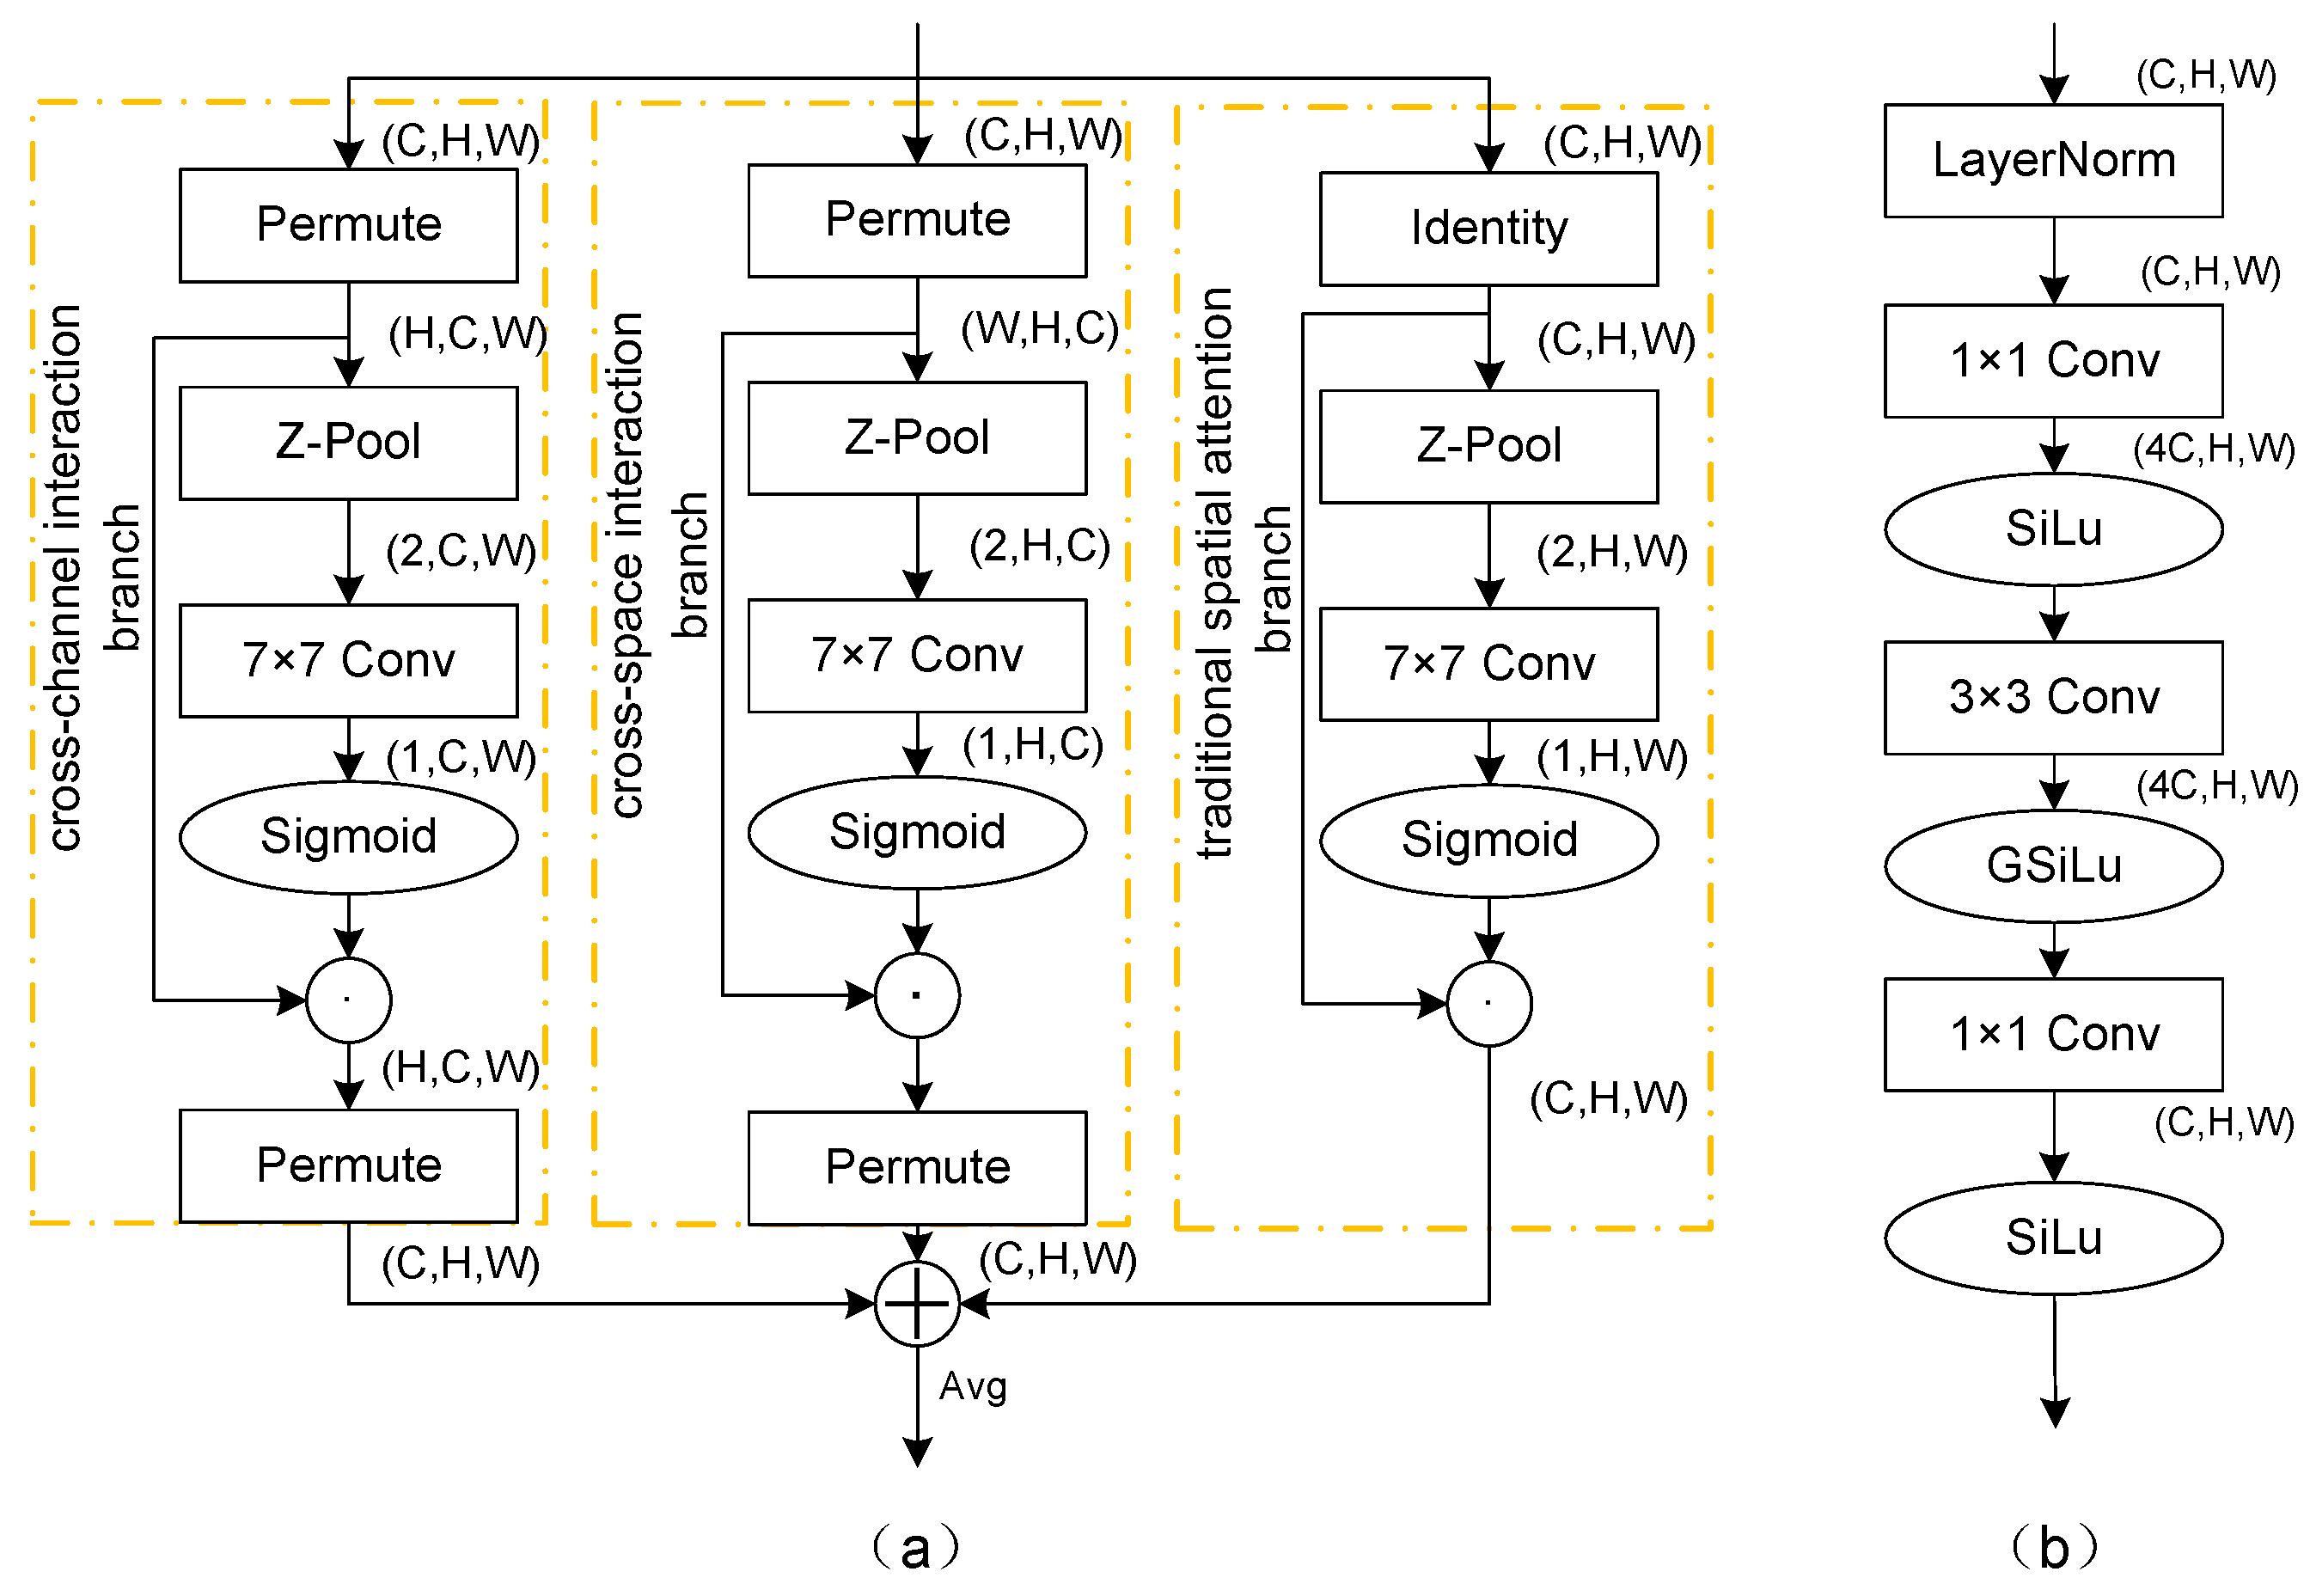
In SAR images, there exists a considerable quantity of small targets, making the effective detection of these small targets especially important. The triple-attention module [48] utilizes a cross-dimensional attention mechanism without involving any dimensionality reduction operations, which allows it to capture the features of small targets better. Small targets may be more prominent in certain channels or spatial regions, and this module improves the model’s capacity to identify these small targets by emphasizing these important regions. Figure 5a illustrates the triple-attention module, which comprises three main branches. First, the cross-channel interaction branch begins with a permutation operation on the input feature map, changing its dimensions from C × H × W to H × C × W. This transformation allows the model to better understand the interactions between channels. Then, a Z-pool operation captures global information, which can be described by Equation (8). Subsequently, convolutional layers are employed, accompanied by a sigmoid activation function, to produce a spatial attention weight map. Finally, the dimensions are permuted to the original format. The cross-space interaction branch follows a similar process as the cross-channel interaction branch but focuses on the interaction between the channel and spatial dimensions. The traditional spatial attention branch uses global average pooling and convolution operations. The objective of this branch is to emphasize the more important spatial regions within the feature map. Ultimately, the outputs of the three branches were summed and averaged to form the ultimate output of the module, allowing the model to simultaneously consider the importance across both the channel and spatial dimensions, thus providing a more thorough comprehensive understanding of the feature map.
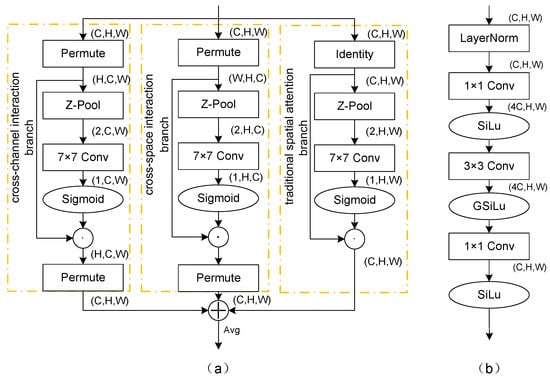
Figure 5.
(a) Triple-attention module. (b) Convolutional perceptron module.
3.2.4. Convolutional Perceptron Module
The distinctive imaging characteristics of SAR images, such as poor readability, low resolution, speckle noise, and geometric distortions, complicate target detection. The convolutional perceptron module (CPM) addresses these challenges by combining multilayer perceptron (MLP) [49] with convolutional layers to introduce stronger nonlinear transformation capability, enhancing the deep learning model’s ability to identify and extract features of ship targets in SAR images.
The specific structure of the CPM is shown in Figure 5b. The process begins with layer normalization to stabilize the training dynamics. A 1 × 1 convolutional layer then increases the number of channels in the input feature map by a factor of fours, enhancing the feature representation capability. The SiLu activation function is then employed to introduce nonlinearity into the model, offering a more flexible feature mapping for the model. Subsequently, a 3 × 3 convolutional layer captures deeper spatial features, whereas the GSiLu activation function further improves the discrimination of the features. Finally, another 1 × 1 convolutional layer is employed to revert the number of channels count back to its initial count, aiming to remove redundant information and refine the feature representation. Another SiLu activation function is applied to enhance the learning capacity of the model for complex features. The entire module efficiently extracts image features while maintaining spatial resolution by precisely controlling the number of channels and introducing effective activation functions. This approach enhances the efficiency of model training and bolsters its capacity for generalization.
3.3. Channel Attention-Based Task Decoupling Dual-Head Detector
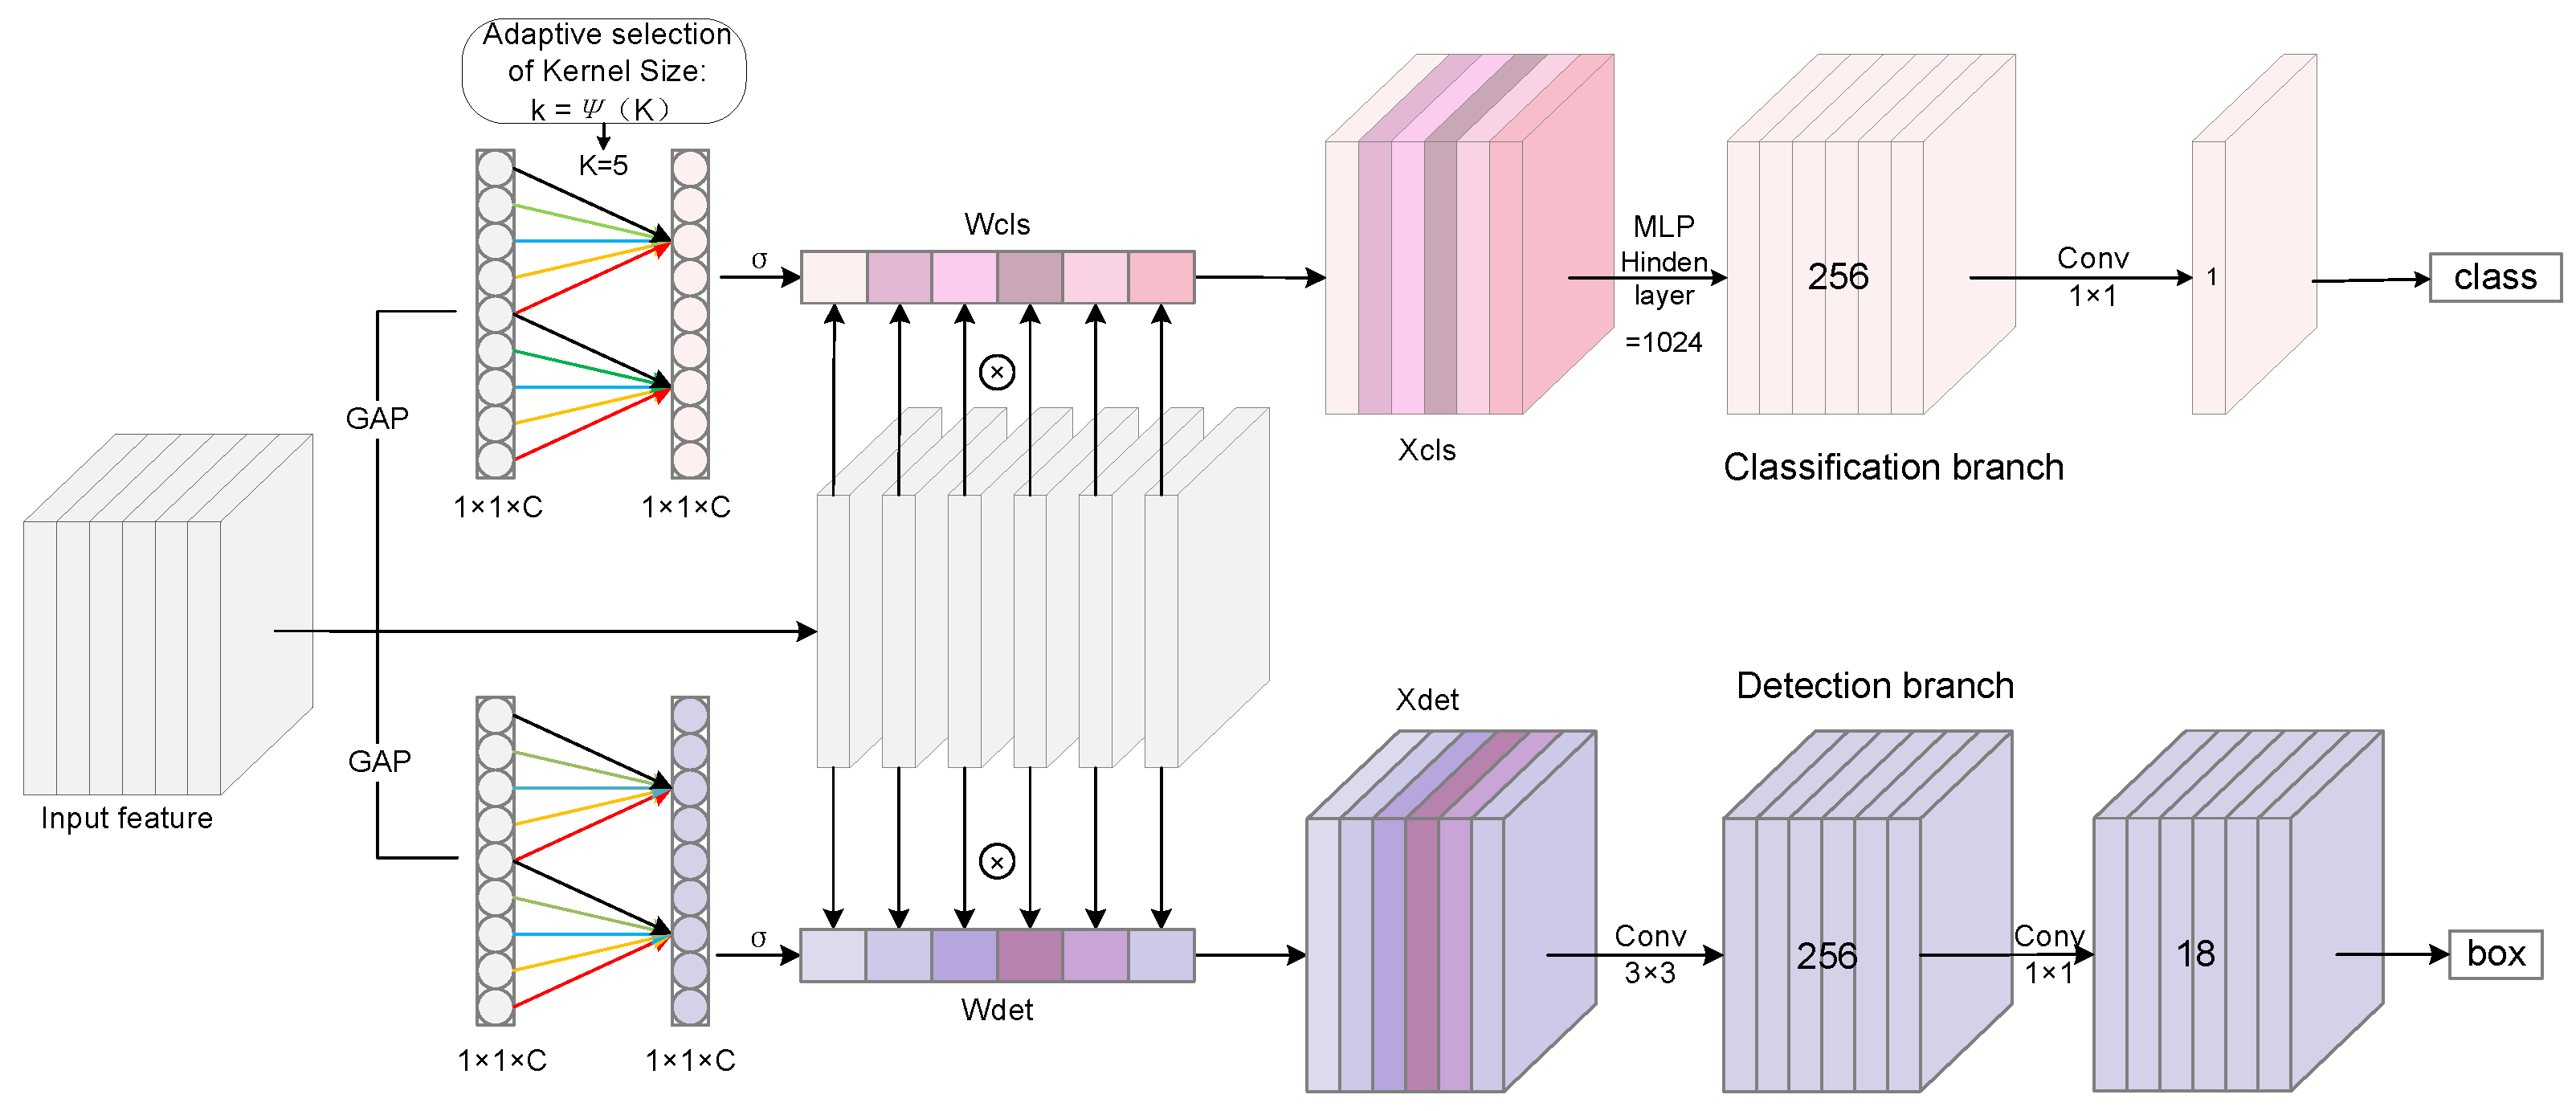
Currently, natural-scene analysis methods often use shared features for both positioning and classification tasks, leading to conflicts due to differing feature requirements, which affect accuracy. Ship regression tasks need edge scattering features for spatial localization, while classification tasks require stable features capturing scattering characteristics [37]. Especially in complex inshore scenarios for ship target detection, terrestrial clutter such as docks, buildings, and other man-made structures interferes with natural terrains such as islands and rocks and dynamic environments such as ocean tides and waves. This leads to strong reflection noise and ship echo signals overlapping in SAR images. Furthermore, targets are densely arranged, have variable courses, and vary greatly in size, which causes optimization conflicts when using shared features. Additionally, different head structures benefit each task: Fully connected structures are better for classification, while convolutional structures excel at positioning [38]. To address the feature conflicts between classification and positioning tasks and to effectively utilize information, we propose a new detection head called channel attention-based task decoupling dual-head (CAT2D) detector, and the structure is shown in Figure 6. The design of CAT2D aims to select task-specific feature information from multilayer features and feed them into their respective adaptive head structures to improve performance in both positioning and classification tasks.

Figure 6.
Structure of the channel attention-based task decoupling dual-head detector.
We first use efficient channel attention (ECA) [50] for feature decoupling, which can achieve efficient feature separation with very low computational cost by avoiding dimensionality reduction operations while preserving the integrity of the channel information through lightweight 1D convolution and local cross-channel interaction mechanisms. Specifically, the method starts by using global average pooling (GAP) to average the feature map across spatial dimensions, obtaining global statistical information for each channel. The kernel size k of the 1D convolution is computed from Equation (14) based on the number of channels of the input features. Using the calculated kernel size k, 1D convolution is performed on the GAP feature map to learn the importance of each channel relative to the others. The original input feature map is multiplied by the attention weights produced via the sigmoid function, resulting in weighted feature maps tailored for specific tasks. The process of feature decoupling can be expressed as follows:
where denotes the fast 1D convolution with kernel k.
The classification branch processed the features through a fully connected perceptron structure with a hidden layer of 1024 units, followed by a 1 × 1 convolution to output the classification result. The detection branch uses a deformable convolution with a kernel size of 3, succeeded by a 1 × 1 convolution to modify the output channel number before generating the detection result. It can be expressed as follows:
where denotes deformable convolution.
The method of decoupling tasks employs a channel attention mechanism to selectively identify features that are particularly important for the detection and classification of ships, subsequently processing these features through structures tailored to specific tasks to improve overall performance. Consequently, this method effectively improves the accuracy of detecting and classifying ships in SAR images.
where denotes the odd number closest to X, and C represents the number of feature channels. In all the experiments presented in this study, we set and b to 2 and 1, respectively.
3.4. Loss Function
Based on the loss function of Oriented Reppoints [16], we introduced a size-aware balanced loss. The comprehensive loss during the training process was defined as follows:
where , , , and represent the object classification loss, initial stage localization loss, fine stage localization loss, and size-aware balanced loss, respectively. and are stage balancing weights, and in all our experiments, we set and .
For the object part of the predicted point set, to mitigate the disparity between positive and negative samples, we introduced Focal Loss, which is defined as
where denotes the predicted class confidence derived from the point set, and represents the ground truth class. refers to the Focal Loss [51]. denotes the total number of point sets. and represent the spatial localization losses for the initial and refinement stages, respectively. For each stage, can be articulated as follows:
where is the localization loss of the transformed oriented bounding boxes, represents the total quantity of positive point set samples, is the position of the GT box, and is the GIoU loss [52] for the oriented polygons. is the spatial constraint loss, which is used to penalize adaptive points outside the bounding box. Here, is the quantity of positive point set samples assigned to each object, is the quantity of points located outside the GT box in each point set, and represents the distance from the sampled point to the geometric center.
However, in SAR ship datasets, there exists a significant imbalance in the quantity of small, medium, and large ships, which leads to the model being overly sensitive to the majority class during training while not paying enough attention to the minority class. As a result, the detection performance for medium and large ships is poor due to intra-class size imbalance. Inspired by Focal Loss [51], this study introduces size-aware balanced (SAB) loss to provide a method for balancing the imbalance in ship scale distribution, mitigating the model training imbalance caused by scale differences. Its pioneering third-order weight allocation strategy based on the physical scale of the ship breaks through the limitations of the traditional loss function to model the target size without difference and alleviates the imbalance problem of model training caused by the scale difference. Specifically, based on the distribution of ship scales, a smaller weight is assigned to the disparity between the ground truth and detection samples for small ships, whereas a larger weight is assigned to the difference for medium and large ships. This allows the model to focus on minority class samples during training, thus alleviating the training imbalance. This method directly optimizes the model performance during training and can be naturally applied to many existing SAR ship detection networks. The detailed description is as follows:
where , , and are the modulation factors for large, medium, and small ship targets, respectively. B is the number of detected ships, G is the number of ground truth samples, and N is the total number of detection targets. According to reports from the SSDD+ and RSDD-SAR public datasets, ships with an area larger than 7500 pixels are considered large targets, ships with an area between 625 and 7500 pixels are medium targets, and ships smaller than 625 pixels are considered small targets. By applying focal modulation, the loss function reduces the influence of small ship samples while enhancing the focus on large and medium-sized ship samples. This significantly enhances the detection performance under the conditions of large-scale differences and data imbalance. In this paper, the large, medium, and small ships all denote the pixel size they occupy in the image.
4. Experiments
4.1. Datasets Description
To validate the effectiveness of the method we proposed, a series of experiments were carried out on the SSDD+ ship datasets [4]. Furthermore, we included the public RSDD-SAR dataset [5] and HRSID dataset [6] to further assess the model’s generalization and robustness through comparative experiments. Table 1 shows the distribution of ships of different sizes in each dataset. Below are the pertinent details concerning the datasets.

Table 1.
Distribution of ship sizes in different datasets.
- 1.
- SSDD+ Dataset: The SSDD+ employs an OBB instead of an HBB, enabling ship target detection along with target orientation estimation. It comprises 1160 SAR images characterized by varying resolutions, polarization modes, and sea surface conditions. The original dataset contains a total of 2587 ship targets in SAR images, averaging about 2.12 targets for each SAR image. Since the initial version of the SSDD dataset suffers from rough annotations and ambiguous labeling, this can seriously affect a fair comparison of the methods. Therefore, the 2021 recorrected dataset was chosen for fairer comparison and effective academic communication in this paper. It was partitioned into a training set comprising 928 images and a test set containing 232 images. To assess the model’s detection performance under various scenarios, the test set was additionally divided into 46 images depicting inshore scenes and 186 images representing offshore scenes.
- 2.
- RSDD-SAR Dataset: The RSDD-SAR is a publicly available dataset that has been developed in recent years to support the research and development of SAR ship orientation detection algorithms. The data come from the GaoFen-3 satellite and the TerraSAR-X satellite. It includes a variety of imaging modes, various polarization modes, and multiresolution slices, with a total of 7000 images and 10,263 instances of the ship. The angles of the ship targets are uniformly distributed from −90° to 90°, accommodating a range of ship orientations. The dataset is partitioned into a training set comprising 5000 images and a test set containing 2000 images. To facilitate a throughout assessment of the performance of the method, the test set was further subdivided into 159 inshore scene images and 1841 offshore scene images.
- 3.
- HRSID Dataset: The HRSID dataset is commonly used for tasks such as ship detection, semantic segmentation, and instance segmentation. It comprises 5604 images and 16,951 ship instances, with 65% used for training and 35% for testing. The image resolution of this dataset ranges from 0.5 m to 3 m. All images have been resized to 800 × 800 pixels. These images were cropped from 99 Sentinel-1 satellite images, 36 TerraSAR-X satellite images, and 1 TanDEM-X satellite images. In the HRSID dataset, inshore scenes account for 18.4%, and offshore scenes account for 81.6%, including SAR images with different resolutions.
4.2. Specific Setup and Evaluation Metrics
All experiments detailed in this paper were performed on a system running Ubuntu 20.04, equipped with an NVIDIA GeForce RTX 4090 GPU. To obtain a fairer comparison, for the SSDD+ and RSDD-SAR datasets, we used the image allocation methods mentioned above in [4] and [5], respectively, for model training and comparison. The input images were uniformly resized to dimensions of 512 × 512 pixels. For the HRSID dataset, we used the image allocation method mentioned in [6] for model training and comparison. The input images were uniformly scaled to a size of 800 × 800 pixels. During the training process, only the RRandomFlip online enhancement strategy was executed. RRandomFlip includes horizontal flipping, vertical flipping, and diagonal flipping. These three enhancement methods can effectively improve the orientation of the data. The optimization algorithm utilized was AdamW, with an initial learning rate of 0.0002, a momentum of 0.9, and a weight decay of 0.005. In the initial stage of training, a learning rate warm-up strategy was adopted, with the warm-up starting learning rate set to one-third of the initial learning rate, and 300 batch iterations were performed. The learning rate schedule adopted linear decay. Considering hardware limitations and model performance, the batch size was set to 8. A total of 200 epochs were iterated.
To assess the performance of various methods, we introduced the following metrics for comparison: Precision (P), Recall (R), and Mean Average Precision (mAP). Recall directly reflects the ability of the model to detect positive samples. Precision reflects the classification ability of the model. High recall and precision alone do not reflect the overall performance of the model, so mAP achieves the ability to comprehensively reflect the model’s performance by combining these two metrics. These metrics are defined as
TP refers to the quantity of true positives, FP signifies the quantity of false positives, and FN represents the quantity of false negatives. The average precision (AP) is calculated as the area under the Precision–Recall (PR) curve, which is shown below:
We used the AP to comprehensively evaluate the model’s performance at various Intersection over Union (IoU) thresholds, with the default threshold set to 0.5. In our detection task, the mean average precision (mAP) is the same as the AP, given that the task pertains to a single object class. Additionally, we computed the mAP for both the inshore and offshore test sets to evaluate the efficacy of our method under diverse conditions.
4.3. Ablation Study
To validate the contribution of each component and the overall efficacy of the proposed method, we conducted a sequence of ablation experiments using the SSDD+ dataset. To ensure a valid comparison, all experiments were performed with consistent settings. The Oriented Reppoints network using Resnet-50 as the backbone was used as the baseline. Except for the first module, which replaced the Resnet-50 backbone with the MSTFE backbone, the remaining modules gradually joined the baseline network for experiments, and the overall experimental results are shown in Table 2. Compared to the baseline, our detection network achieved significant improvement in the evaluation metrics across both inshore and offshore scenarios. Specifically, it improved by 14.1%, 1.9%, and 2.1% with respect to the inshore , offshore , and hybrid scenario , respectively. In addition, we achieved 3.8% and 29.4% improvements in recall and precision, respectively, in the hybrid scenario. These results clearly show that our method can improve the detection coverage and localization accuracy of ship targets in inshore and offshore scenarios, as well as reduce false positives. Next, we analyzed the contribution of each method in detail. Table 2 and Table 3 only present the precision and recall metrics in the hybrid scenario. In addition, the offshore scene usually contains a large number of small ships, and the inshore scene contains a large number of large and medium-sized ships with surrounding land interference, which further reflects the contribution of each component in the detection of ships in different scenes. Table 4, Table 5, Table 6 and Table 7 presents the precision and recall rate indicators of the offshore and inshore scenes.
Table 2.
The contribution of each component to the network.
Table 3.
The impact of different weights on the model.
Table 4.
The impact of MSTFE on the model.
Table 5.
Comparison of different attention mechanisms.
Table 6.
Contribution analysis of components in the MSTFE backbone.
Table 7.
The impact of CAT2D on the model.
The Impact of MSTEF: The proposed MSTFE backbone focuses on mitigating the feature annihilation problem for small objects while extracting multiscale ship object features. In this experiment, we performed the experiment by keeping the rest of the network unchanged and only changing the backbone part in the Oriented Reppoints model. As shown in Table 4, compared to Resnet-50 and Swin-Transform, the MSTFE backbone produced excellent results in both the inshore and offshore scenarios, which indicates that the MSTFE backbone can effectively extract multiscale ship target features. Aiming at the problem of large differences in size change, MSTFE realizes multiscale ship target feature extraction through the MKHP module of parallel multikernel convolution, and it achieved an improvement of 26.7% and 17.4% in the precision of the inshore and offshore scenes compared to the baseline backbone. Aiming at the problem of insufficient feature extraction of tiny ships in offshore scenes, MSTFE introduces a triple-attention module to enhance the key features of tiny targets, which allowed it to finally achieve a precision breakthrough of 17.4% in offshore scenes compared to the baseline backbone. MSTFE not only significantly improves the detection and localization ability of medium and large ship targets in the offshore area, but it also improves the detection ability of small targets in the offshore area. These experimental results all demonstrate the detection capabilities and advantages of our MSTFE backbone in multiscale scenes.
Table 5 demonstrates the advantages of triple attention (TA) over other attention mechanisms in small ships feature extraction. We conducted comparative experiments between triple attention, channel attention (CA), and spatial attention (SA). The results show that, in inshore scenarios, although the precision of TA decreased, its recall and AP for small ships remained comparable to those of channel-only and spatial-only attention. In offshore scenarios, the recall and AP of TA both exceeded those of channel-only and spatial-only attention, indicating that TA performs better in offshore small ship detection. Therefore, although its detection performance in inshore scenarios is slightly insufficient, its detection capability in offshore scenarios meets our requirements.
To further reflect the contribution of each component in the backbone network of MSTFE in the feature extraction process, we also conduct ablation experiments on the three modules of the multikernel heterogeneous perception module (MKHP), triple-attention module (TA), and convolutional perceptron module (CPM). It can be seen from Table 6 that when only the MKHP was used for feature extraction alone, the R, P, and AP metrics in both the inshore and offshore scenarios were significantly improved, with the precision in the inshore and offshore scenarios increased by 28% and 11.4%, respectively, which indicates that the model is more capable of capturing multiscale features. Secondly, the TA module was introduced based on the MKHP, and its recall rate and precision rate in the offshore scene with a large number of small targets was increased by 2.0% and 3.8%, respectively, indicating that it can effectively improve detection coverage and accuracy of small targets. However, due to the influence of its multiple attention, although the effect is significant in the offshore scene, there is a risk of overfitting in the inshore scene. It affects the discrimination ability of the model. Finally, after removing the TA module and introducing the CPM module, compared to the baseline, the inshore AP was greatly improved to 77.7%, and the offshore AP was stable at 90.7%. Meanwhile, the precision results in the inshore and offshore scenarios were improved by 9.1% and 19.0% compared to those without the introduction of CPM, which suggests that the introduction of nonlinear transformations in CPM enhances the model’s discriminative ability, which shows that the introduction of nonlinear transformation in CPM strengthens the discriminant ability of the model. Finally, when the three components were combined, the inshore AP reached 74.1%, and the offshore AP reached 90.0%, indicating that the modules are complementary. This part of the experiment fully verifies the effectiveness of the MSTFE backbone and the role and effectiveness of each component in the feature extraction process.
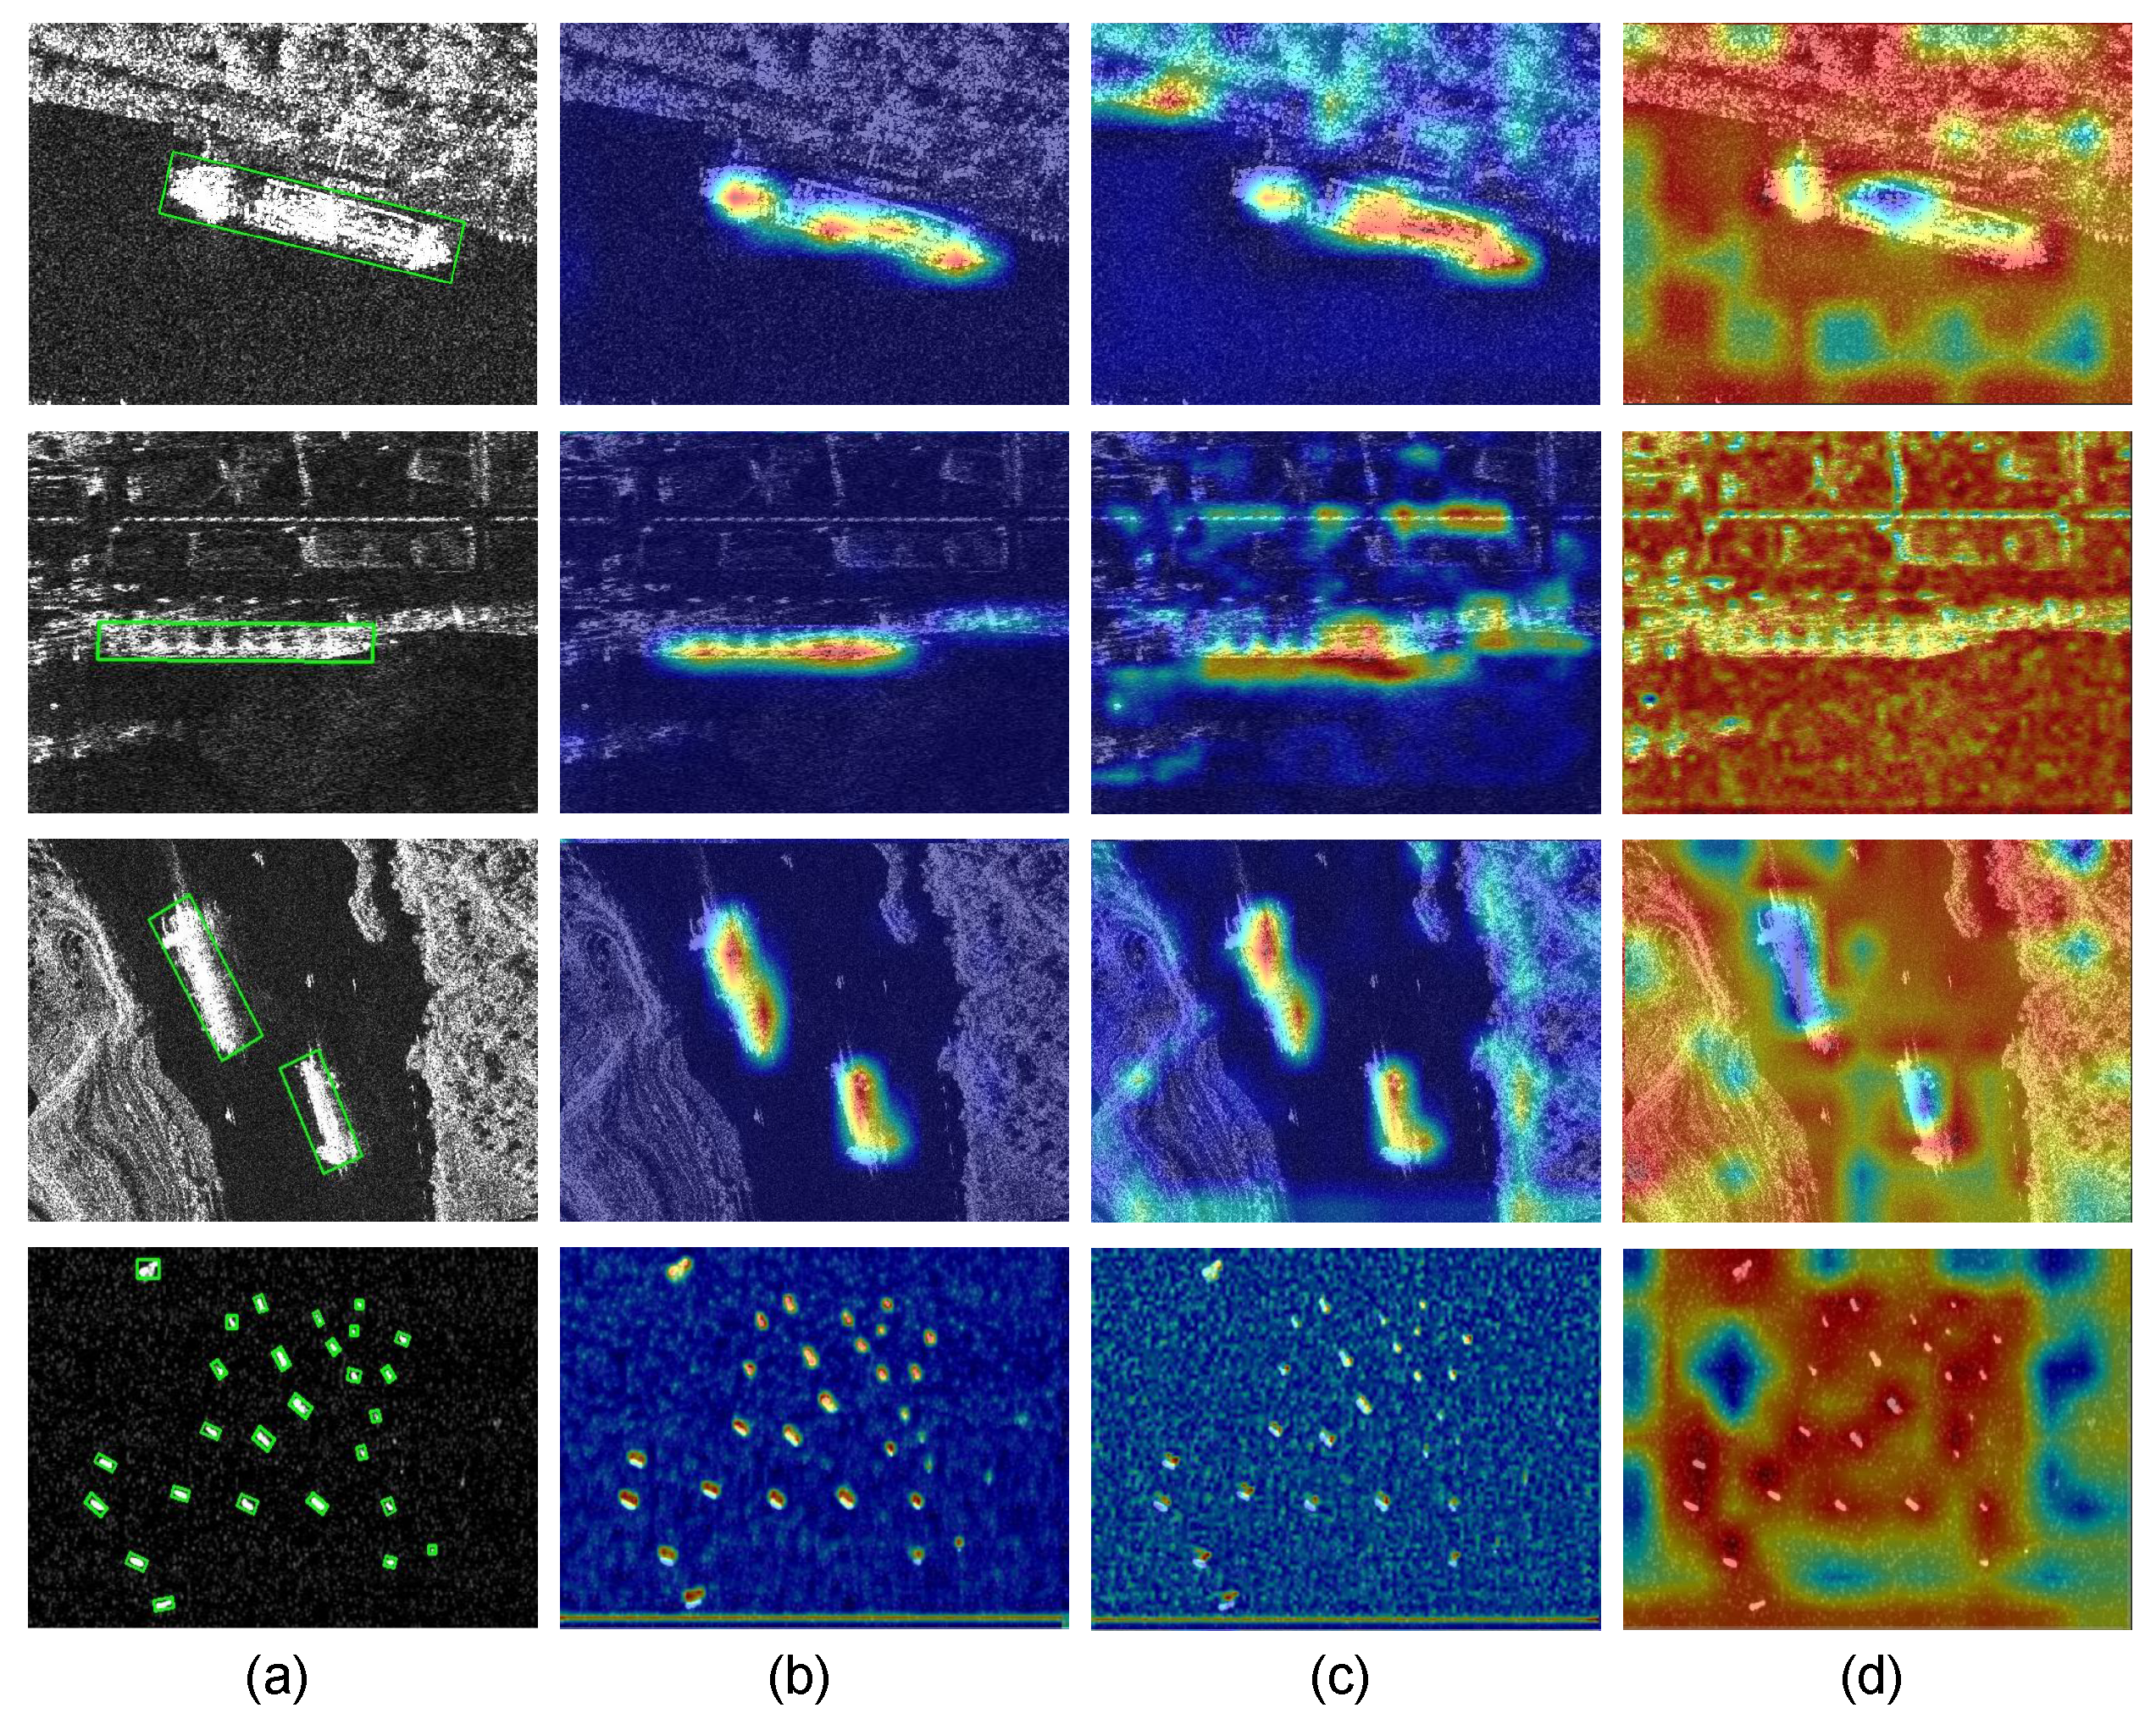
In addition, for a more intuitive comparison, we visualized the features extracted by the backbone network. As shown in Figure 7, compared to the resnet-50 backbone of the baseline network, MSTFE could extract the features of ship targets at different scales more accurately. At the same time, the design could also effectively suppress clutter noise and other interference. Compared to the swin-transform backbone, which is limited to the perception of local details due to its window segmentation and shift mechanism, a large number of unrelated but similar features were also extracted, resulting in a lot of redundancy. Our method uses multiscale, multiattention, and deep multiple architectures to improve the performance of the swin-transform backbone. It can extract features more accurately with less redundancy. The visualized backbone feature extraction results show the accuracy of the features extracted by our method.

Figure 7.
Visualization of the backbone heatmaps, with a gradient from blue to red indicating an increase in model attention. (a) Gound truth. (b) Our method. (c) Resnet-50. (d) Swin-Transformer.
The Impact of CAT2D: CAT2D first realizes the adaptive selection of features for each task by introducing the channel attention mechanism, an innovative design that accurately highlights key features relevant to the task. The filtered features are fed into the respective task-adaptive networks for prediction and output, thus endowing the detection head with an extremely high degree of flexibility, enabling it to efficiently cope with the diverse demands of different tasks and significantly optimize the overall performance. According to the experimental results in Table 7, CAT2D achieved a 31.0% and 17.5% improvement in precision in the inshore and offshore scenarios, respectively, compared to the baseline network. This significant improvement not only highlights the excellent performance of CAT2D in complex backgrounds but also its efficiency in feature selection. Meanwhile, the recall of CAT2D was also improved by 4.9% and 2.0% for the inshore and offshore scenarios, respectively. Furthermore, our method has achieved relatively excellent detection results with only a few enhanced parameters. These results fully demonstrate that CAT2D has significant advantages in feature selection and adaptation between different tasks, which greatly improve the model’s ability to detect ship targets and show its innovation and efficiency in the field of multitask detection.
The Impact of SAB: The size-aware balanced loss focuses on addressing the model-fitting imbalance caused by data imbalance during network training. According to the distribution of ship size in the two public datasets shown in Table 1, we conducted comparative experiments by setting the modulation factors in Equation (20) as , , and . Additionally, to guarantee the effectiveness and stability of the model, the sum of , , and was set to 1. This is shown in Table 3, where , , and are all 0, indicating that no SAB was introduced to the baseline method. The SAB notably improved the recall rate of the model and steadily enhanced the precision and average precision compared to the baseline. The best model accuracy was achieved when = 0.69, = 0.30, and = 0.02. Therefore, selecting appropriate modulation factors , , and are crucial for enhancing the performance of the model in SAR ship detection, particularly when dealing with class imbalance and multiscale targets. These factors increase the weight of large targets in the loss function, permitting the model to concentrate more on these often-overlooked targets, thus optimizing its detection capability. This study is the first to deeply integrate the physical scale prior to loss function design, and through the theory-driven weight allocation mechanism, we not only overcome the size distribution imbalance problem in SAR ship detection but also establish a generalized framework that can be generalized to multiscale target detection. Compared to the method without SAB, the recall and precision were improved by 4.6% and 10.2%, respectively, under the same computational resources, which provides a new paradigm for target detection in data imbalance scenarios.
4.4. Comparison with Other Advanced Methods
To assess the performance of the proposed method more comprehensively, we compared it with other advanced methods based on convolutional neural networks. Nine methods were selected for comparison: Oriented R-CNN [13], RoI Transformer [12], Gliding Vertex [53], ReDet [14], R3Det [15], S2A-Net [54], Rotated Retina [51], Rotated Fcos [55], and Oriented RepPoints [18]. These experiments were conducted on the SSDD+ dataset, covering both the two-stage and one-stage algorithms. We used three evaluation metrics—precision, recall, and average precision—across different inshore and offshore scenarios. The results of the experimental comparison are presented in Table 8.
Table 8.
Performance comparison of different advanced methods on the SSDD+ dataset.
As can be seen from Table 8, the two-stage algorithms (Oriented R-CNN, RoI Transformer, Gliding Vertex, and ReDet) achieved good precision while maintaining recall; however, their drawbacks include high computational costs and numerous parameters, such as Oriented R-CNN, which has 41.35 MB parameters and a computational load of 63.28 GFlops. In contrast, the single-stage algorithms (R3Det, S2A-Net, Rotated Retina, Rotated Fcos, and Oriented RepPoints) have fewer parameters but typically exhibited lower accuracy while maintaining recall. Our method has only 24.36 MB parameters, the fewest among all compared algorithms. Meanwhile, the computational complexity is 45.85 GFlops, which is significantly lower than that of the two-stage algorithms (such as Oriented R-CNN at 63.28 GFlops and RoI-Transformer at 77.15 GFlops) and also lower than some single-stage algorithms (such as R3Det at 82.17 GFlops and S2A-Net at 49.07 GFlops). This indicates that the model has a significant advantage in terms of lightweight design, with lower memory and computational overhead during inference, making it suitable for resource-constrained scenarios. Under the constraint of computational complexity, our method achieved a recall rate of 96.3%, a precision of 85.1%, and an AP50 of 91.3%, significantly outperforming other two-stage and single-stage algorithms in terms of recall rate and average accuracy. For example, compared to the Oriented Reppoints method with a number of similar parameters (36.60 MB parameters and 48.56 GFlops computational load), our method reduces the parameter total by 33.4% and GFlops complexity by 5.6% while improving recall by 3.8% and AP50 by 2.1%, validating the synergistic optimization of computational efficiency and detection performance. Additionally, compared to the baseline method, our method demonstrated improvements in specific scenarios: In inshore scenarios, the recall improved by 9.5%, accuracy by 34.2%, and AP50 by 14.1%; in mixed scenarios, the recall improved by 3.8%, accuracy by 29.4%, and AP50 by 2.1%. The results indicate that this method achieves higher detection coverage and detection accuracy with fewer parameters and reduced computational complexity, significantly enhancing the detection performance of ships in inshore scenarios.
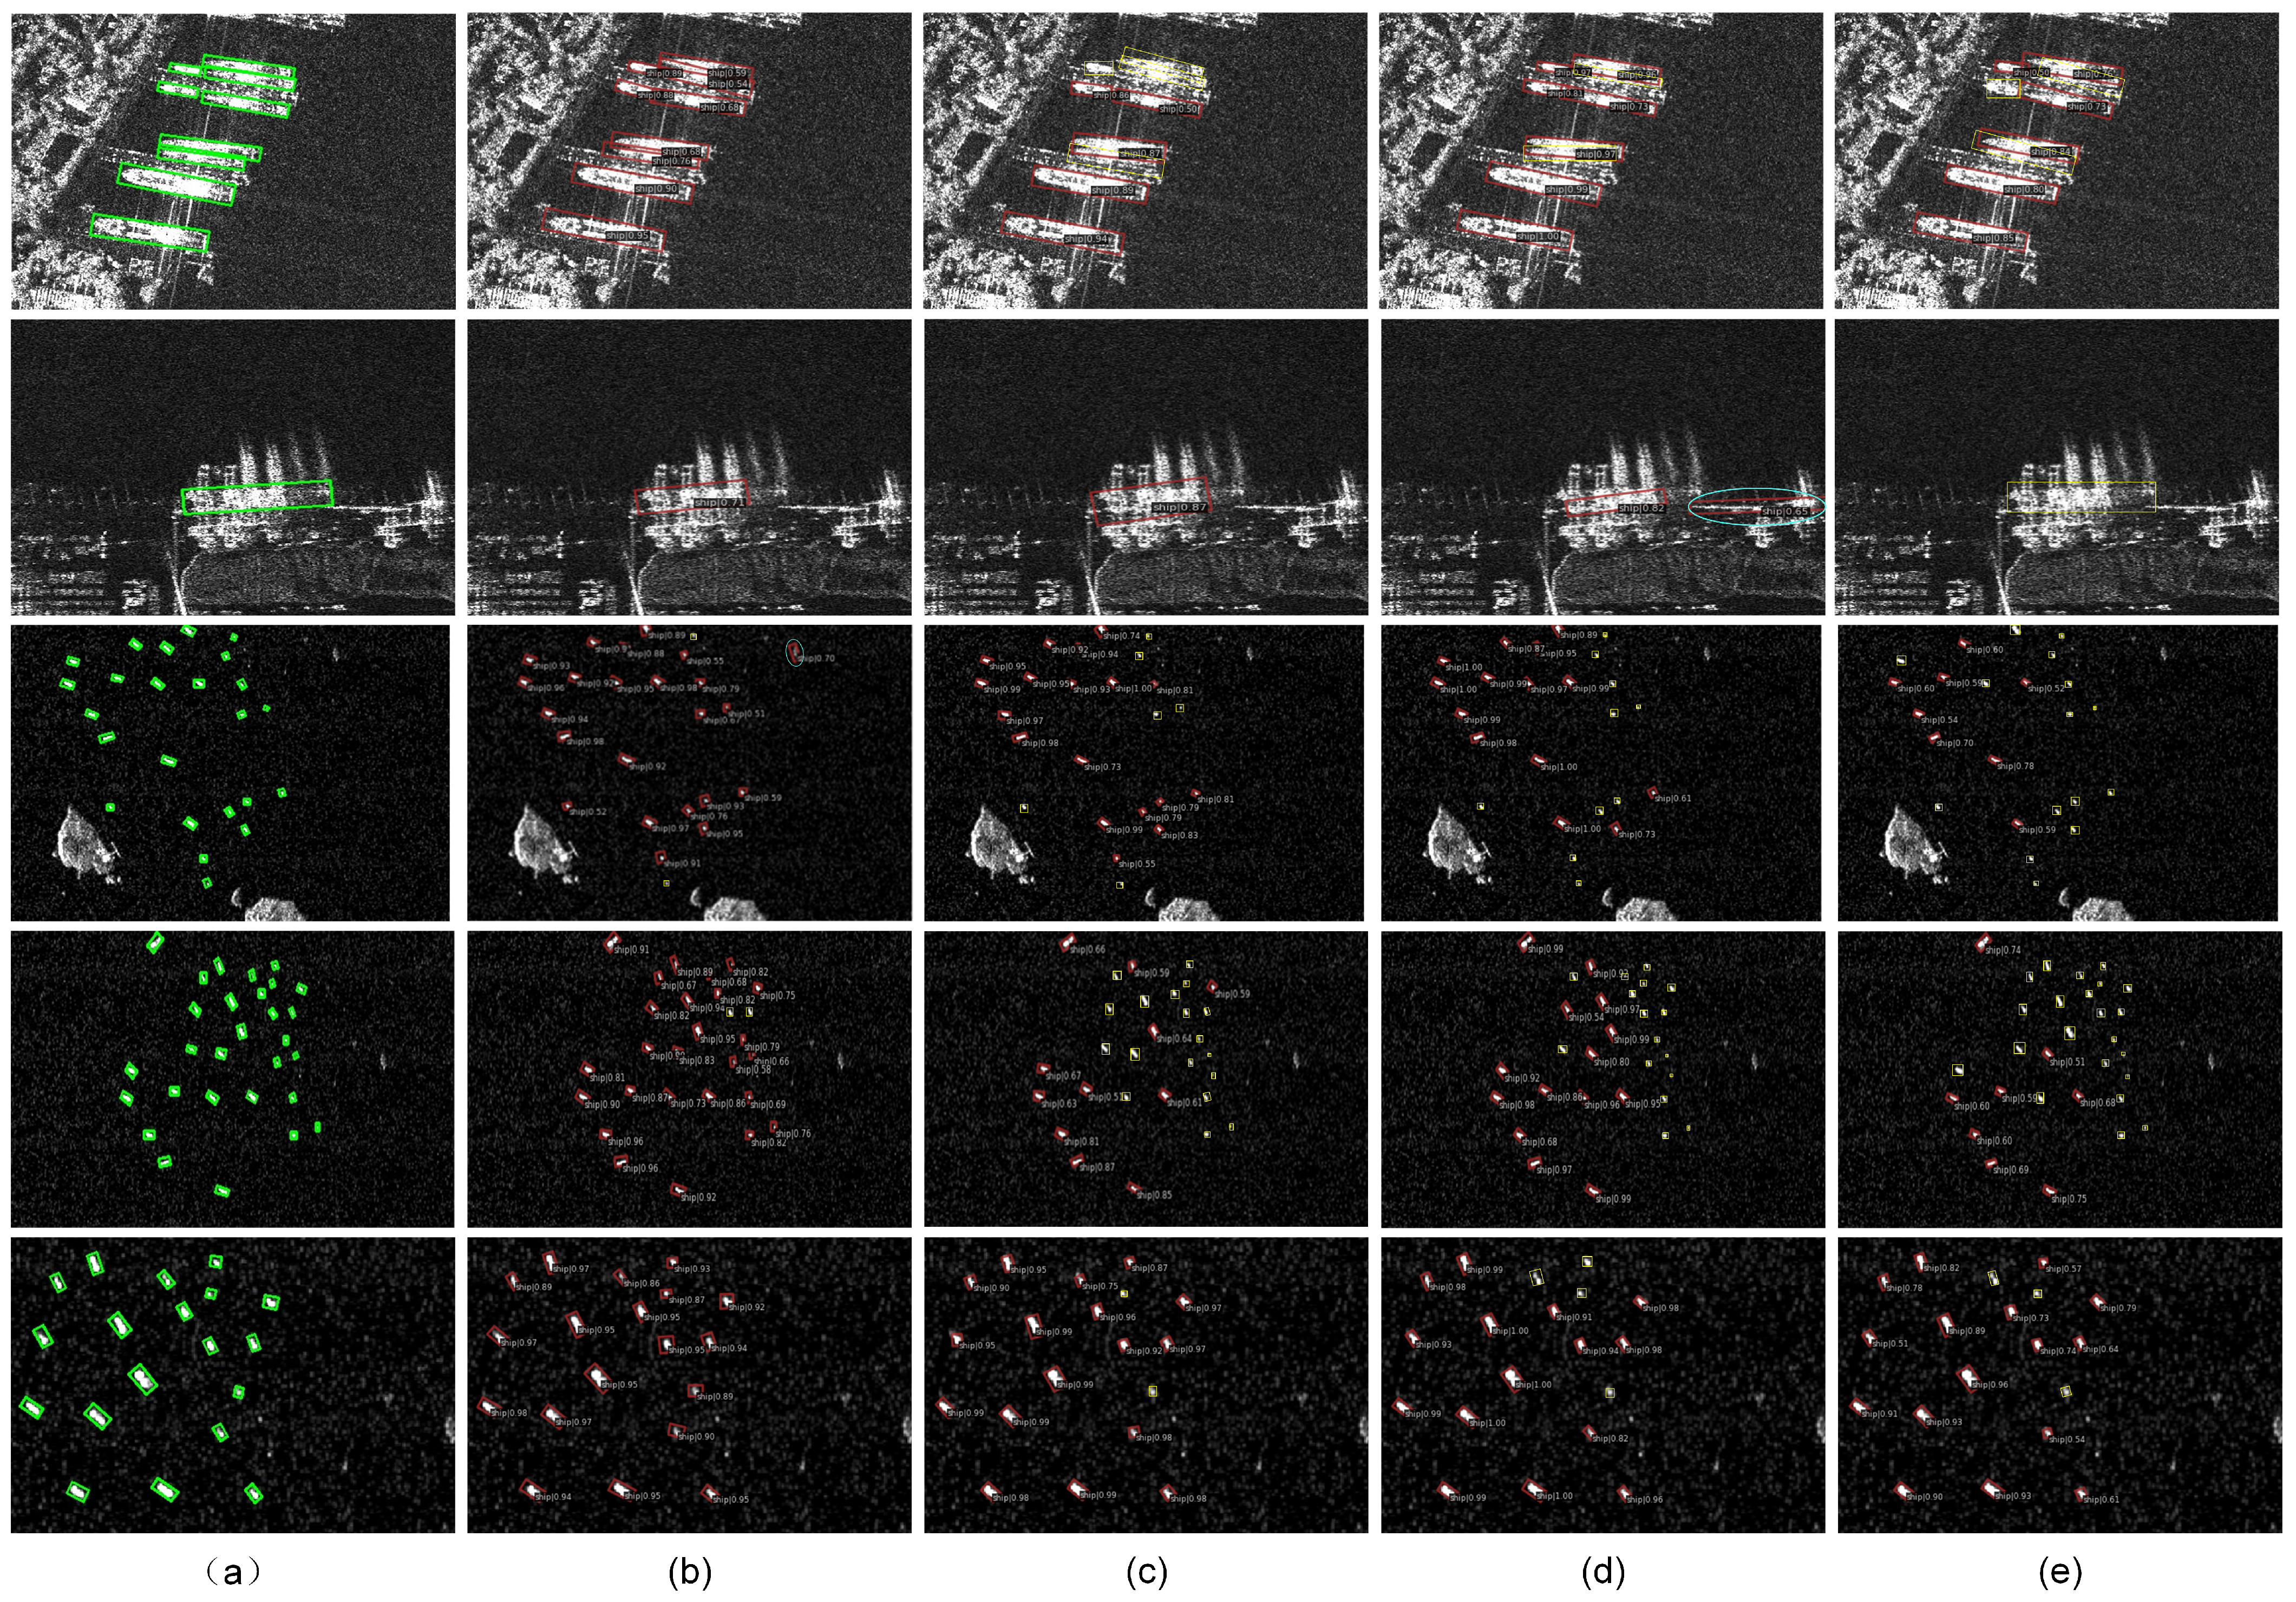
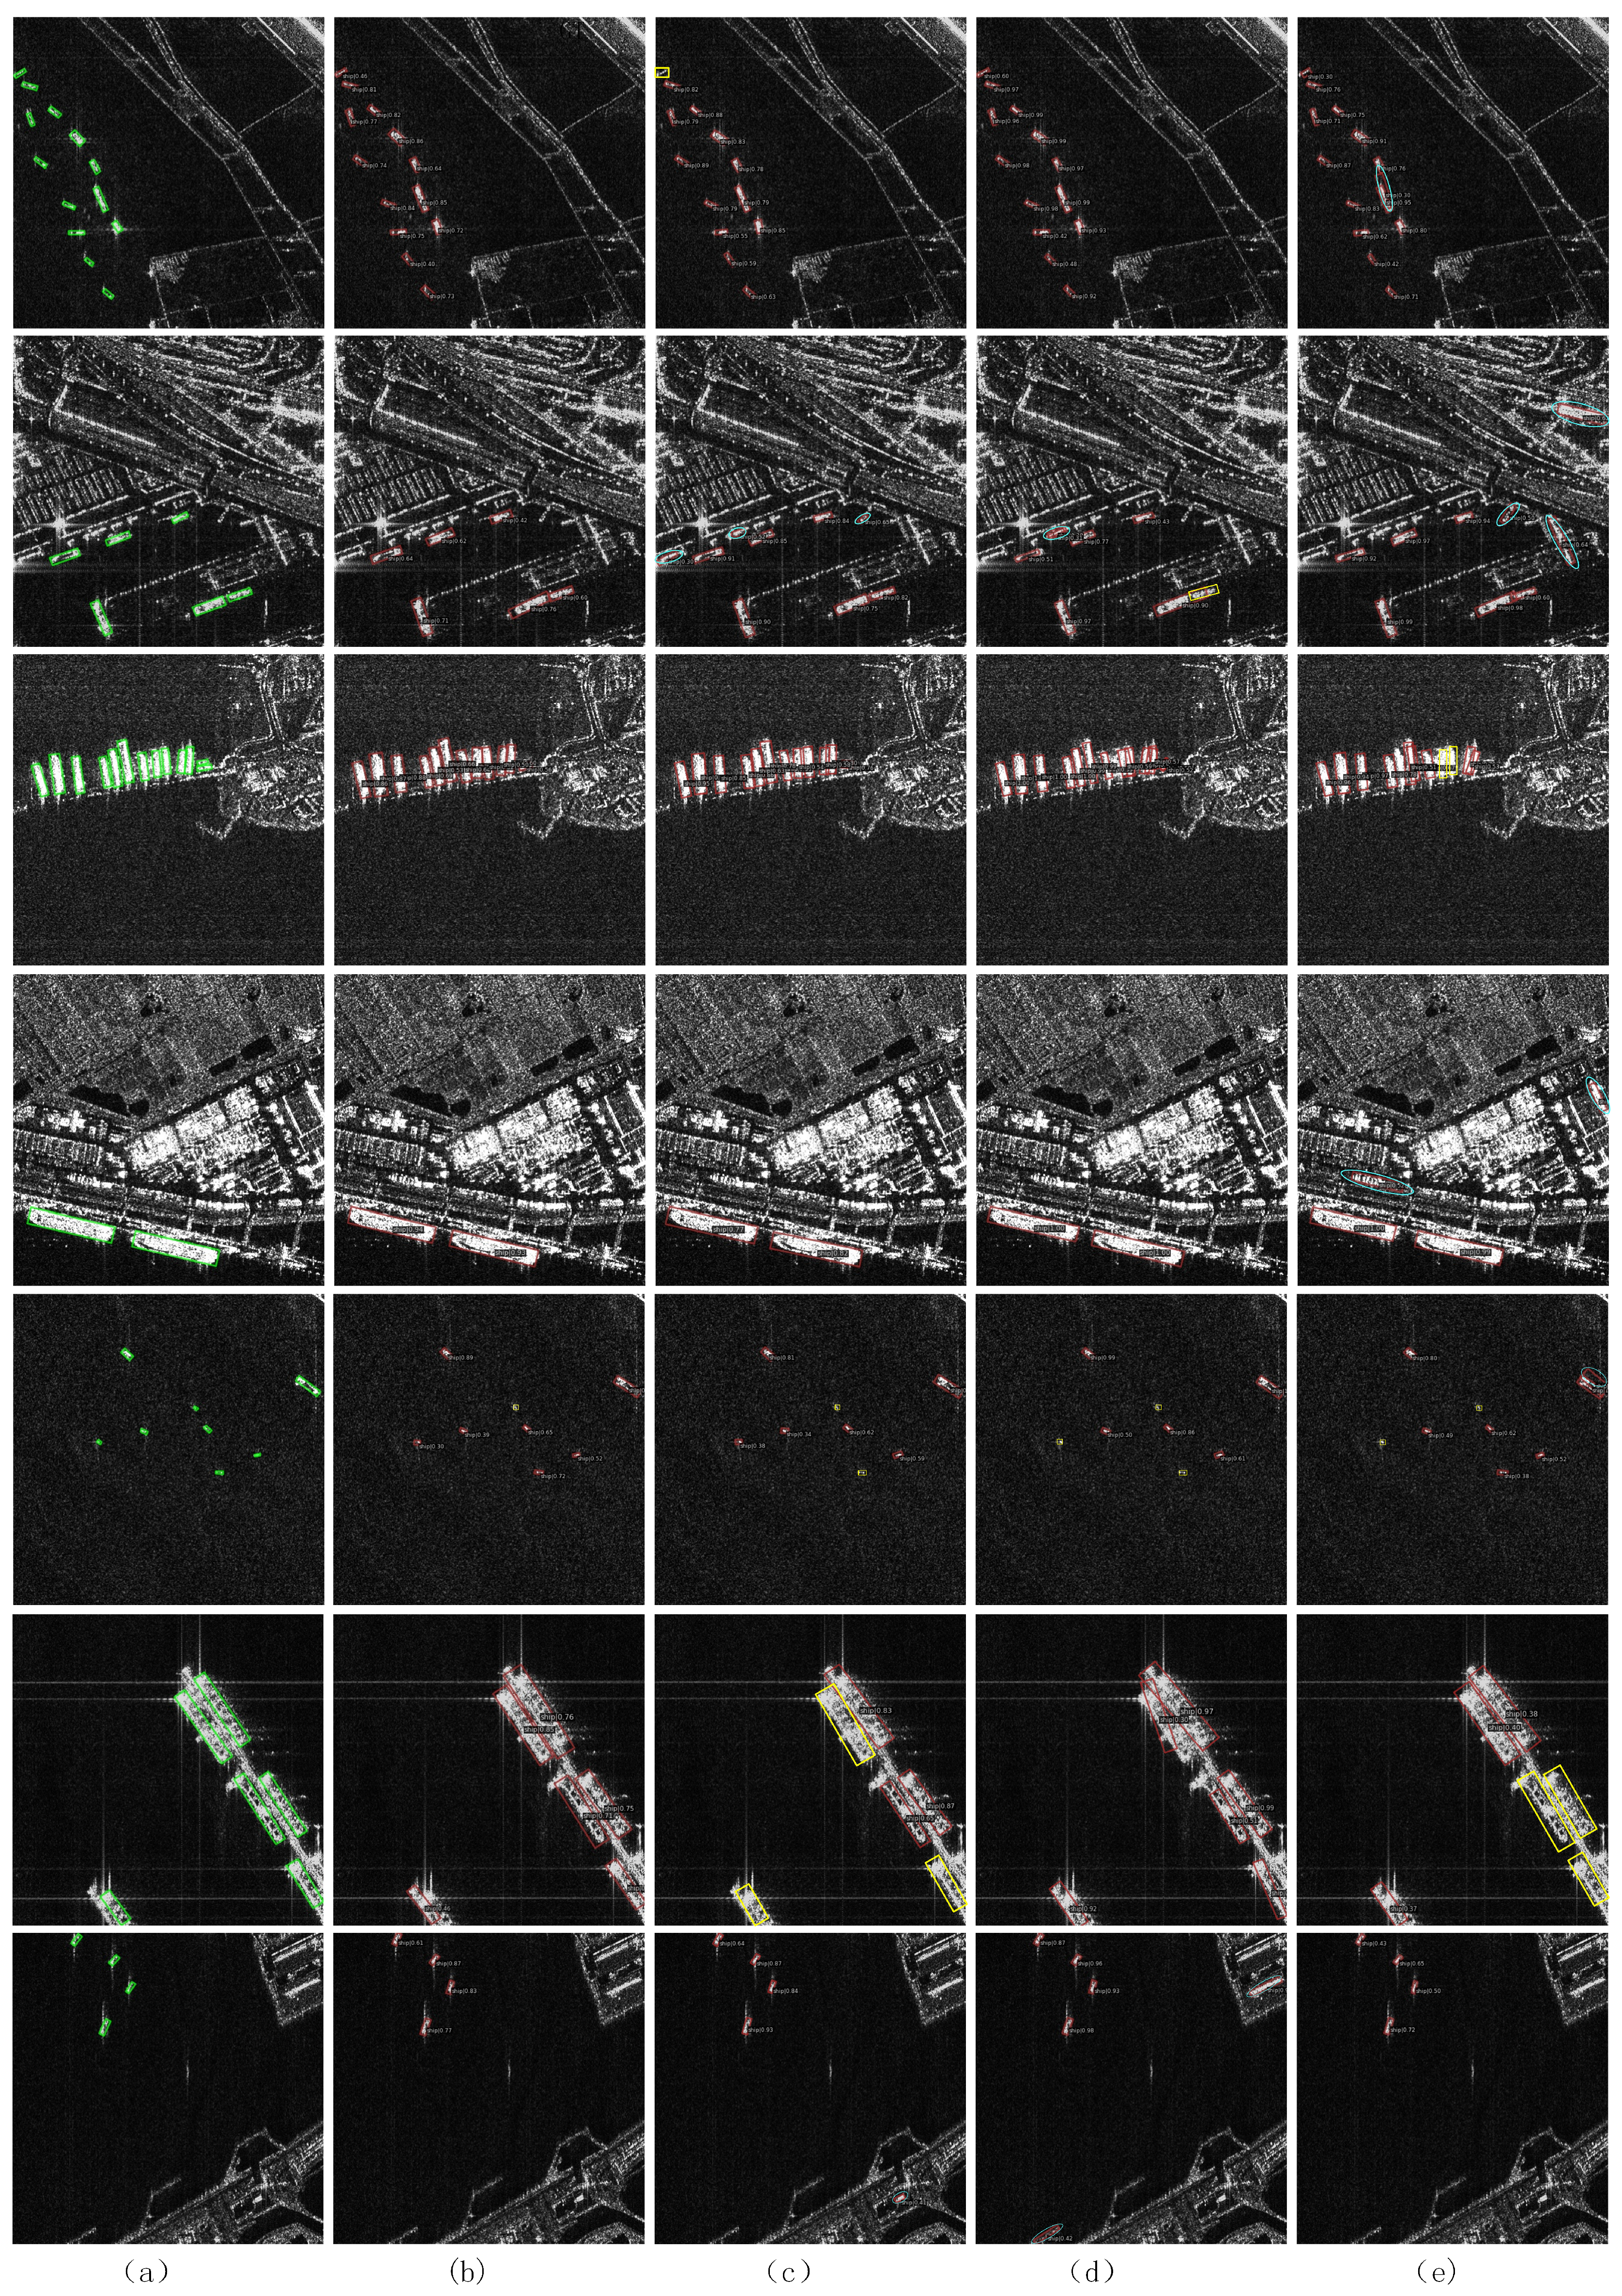
Furthermore, we visualized the detection results of several methods to visually compare the performance of the algorithms. As shown in Figure 8, the selected test images cover various scenarios, including large, medium, and small ship targets; inshore and offshore; and dense and sparse distributions. In the figure, the green boxes represent ground truth detection boxes, red boxes represent detected targets, yellow boxes represent missed detections, and blue boxes represent false positives. The results indicate that the proposed method effectively detects ship targets under various conditions. In the first two rows, which represent complex inshore scenarios and densely distributed scenes, our method demonstrates strong detection performance, whereas other algorithms suffer from significant missed detections. From the third to the fifth rows, it can be noted that for small targets, our method also shows strong detection coverage, whereas other algorithms exhibit severe missed detections. This demonstrates the robustness and effectiveness of our method for detecting ship targets under a wide range of complex conditions. Overall, compared to all other methods, our approach has superior detection capabilities.
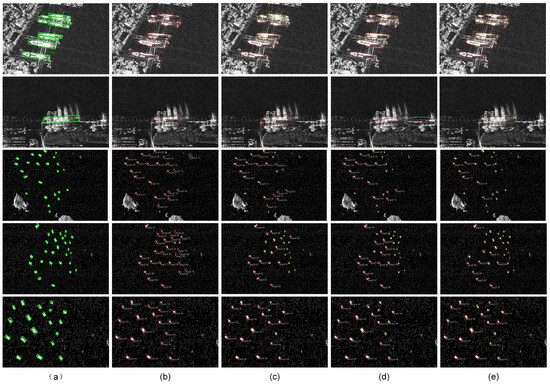
Figure 8.
Detection results of different methods on the SSDD+ dataset. (a) Ground truth. (b) Our method. (c) Oriented Reppoints. (d) Oriented R-CNN. (e) R3Det. Green represents the ground truth boxes, red represents the detected boxes, yellow represents missed detections, and blue represents false positives.
To strengthen the validation of model generalization and robustness, we conducted complementary experiments using the R-SSD SAR dataset and the HRSID dataset, and the results are presented in Table 9 and Table 10. The results in the R-SSD SAR dataset show that our method improved the AP of the inshore, offshore, and hybrid scenarios by 5.2%, respectively, as compared to the baseline method at 0.8% and 1.4%. Compared to the other state-of-the-art methods, our method achieved 93.9% and 81.8% in recall and precision, respectively. The results in the HRSID dataset show that our method improved the AP in inshore, offshore, and mixed scenes by 5.6%, 1.5%, and 1.9%, respectively, compared to the baseline method. Our method improves the precision while maintaining the recall, and it also solves the problem that other methods have poor detection performance in inshore scenes. These experimental results further validate the generalization ability of our method, showing that it can maintain stable performance across different datasets and real-world scenarios.
Table 9.
Performance comparison of different advanced methods on the RSDD-SAR dataset.
Table 10.
Performance comparison of different advanced methods on the HRSID dataset.
Figure 9 presents the detection results obtained from various methods applied to different maritime regions within the R-SSD SAR dataset. The results clearly indicate that our method can effectively detect all types of ships, including those in inshore regions with complex backgrounds and offshore ships with smaller target sizes. With the size-aware balanced loss function, our method trains large and medium-sized ships more effectively than other methods, ensuring their accurate detection while significantly reducing false detection. The findings underscore the reliability and efficacy of our approach in identifying ships within intricate and varied settings, effectively overcoming the challenges posed by ship target imbalance.

Figure 9.
Detection results of different methods on the R-SDD SAR dataset. (a) Ground truth. (b) Our method. (c) Oriented Reppoints. (d) Oriented R-CNN. (e) R3Det. Green represents the ground truth boxes, red represents the detected boxes, yellow represents missed detections, and blue represents false positives.
5. Conclusions
This study proposes a multiscale task-decoupling oriented ship detection network based on a size-aware balanced strategy in SAR images. Building upon Oriented Reppoints, a multiscale target feature extraction backbone network is introduced, which alleviates the problem of disappearing features of small targets while extracting information about ship targets of different sizes through the use of a multikernel heterogeneous perception module and a triple-attention model. Meanwhile, a channel attention-based task decoupling dual-head detector is proposed for the final model prediction output, which decouples the hierarchical features through channel attention and feeds them into each task-applicable detector head structure, thus realizing dual enhancement for localization and classification tasks. Furthermore, to alleviate the severe imbalance in the number of samples for large, medium, and small ships in SAR ship datasets, a size-aware balanced loss function was introduced. This loss function helps the model to focus more on the less-frequent large and medium-sized ship targets during training, effectively solving the problem of model fitting imbalance caused by data imbalance. Extensive experiments on the public SSDD+, R-SDD SAR and HRSID datasets verify the effectiveness and superiority of the proposed method.
Although our method performs well in most scenes and multiscale target detection, it exhibits limitations in detection samples of inshore scenes containing a large amount of background and noise interference. Our future work will explore the complex background and noise interference problem in inshore detection scenes in depth to propose more powerful and comprehensive detectors.
Author Contributions
Conceptualization, S.H. and R.Y.; methodology, R.Y.; software, R.Y.; validation, R.Y. and J.L.; formal analysis, S.H.; investigation, S.H.; resources, Z.Y.; data curation, J.L.; writing—original draft preparation, R.Y.; writing—review and editing, R.Y. and S.H.; visualization, R.Y.; supervision, S.H. and Z.Y.; project administration, S.H.; funding acquisition, Z.Y. All authors have read and agreed to the published version of the manuscript.
Funding
This work was supported by the National Natural Science Foundation of China under Grant 62071481.
Data Availability Statement
The dataset used in this study is available at https://github.com/TianwenZhang0825/Official-SSDD (accessed on 1 September 2024), https://radars.ac.cn/web/data/getData?dataType=SDD-SAR (accessed on 1 September 2024) and https://github.com/chaozhong2010/HRSID (accessed on 3 March 2025).
Conflicts of Interest
The authors declare no conflicts of interest.
References
- Pan, D.; Gao, X.; Dai, W.; Fu, J.; Wang, Z.; Sun, X.; Wu, Y. SRT-Net: Scattering Region Topology Network for Oriented Ship Detection in Large-Scale SAR Images. IEEE Trans. Geosci. Remote Sens. 2024, 62, 5202318. [Google Scholar] [CrossRef]
- Li, H.; An, J.; Jiang, X. Accurate Range Modeling for High-Resolution Spaceborne Synthetic Aperture Radar. Sensors 2024, 24, 3119. [Google Scholar] [CrossRef] [PubMed]
- Zhu, M.; Hu, G.; Zhou, H.; Wang, S. Multiscale Ship Detection Method in SAR Images Based on Information Compensation and Feature Enhancement. IEEE Trans. Geosci. Remote Sens. 2022, 60, 1–13. [Google Scholar] [CrossRef]
- Zhang, T.; Zhang, X.; Li, J.; Xu, X.; Wang, B.; Zhan, X.; Xu, Y.; Ke, X.; Zeng, T.; Su, H.; et al. SAR Ship Detection Dataset (SSDD): Official Release and Comprehensive Data Analysis. Remote Sens. 2021, 13, 3690. [Google Scholar] [CrossRef]
- Xu, C.; Su, H.; Li, J.; Liu, Y.; Yao, L.; Gao, L.; Yan, W.; Wang, T. RSDD-SAR: Rotated Ship Detection Dataset in SAR Images. J. Radars 2022, 11, 581–599. [Google Scholar] [CrossRef]
- Wei, S.; Zeng, X.; Qu, Q.; Wang, M.; Su, H.; Shi, J. HRSID: A High-Resolution SAR Images Dataset for Ship Detection and Instance Segmentation. IEEE Access 2020, 8, 120234–120254. [Google Scholar] [CrossRef]
- Ma, W.; Yang, X.; Zhu, H.; Wang, X.; Yi, X.; Wu, Y.; Hou, B.; Jiao, L. NRENet: Neighborhood Removal-and-Emphasis Network for Ship Detection in SAR Images. Int. J. Appl. Earth Obs. Geoinf. 2024, 131, 103927. [Google Scholar] [CrossRef]
- Zhou, Y.; Wang, S.; Ren, H.; Hu, J.; Zou, L.; Wang, X. Multi-Level Feature-Refinement Anchor-Free Framework with Consistent Label-Assignment Mechanism for Ship Detection in SAR Imagery. Remote Sens. 2024, 16, 975. [Google Scholar] [CrossRef]
- Bai, L.; Yao, C.; Ye, Z.; Xue, D.; Lin, X.; Hui, M. Feature Enhancement Pyramid and Shallow Feature Reconstruction Network for SAR Ship Detection. IEEE J. Sel. Top. Appl. Earth Obs. Remote Sens. 2023, 16, 1042–1056. [Google Scholar] [CrossRef]
- Hu, B.; Miao, H. An Improved Deep Neural Network for Small-Ship Detection in SAR Imagery. IEEE J. Sel. Top. Appl. Earth Obs. Remote Sens. 2024, 17, 2596–2609. [Google Scholar] [CrossRef]
- Wang, S.; Gao, S.; Zhou, L.; Liu, R.; Zhang, H.; Liu, J.; Jia, Y.; Qian, J. YOLO-SD: Small Ship Detection in SAR Images by Multi-Scale Convolution and Feature Transformer Module. Remote Sens. 2022, 14, 5268. [Google Scholar] [CrossRef]
- Ding, J.; Xue, N.; Long, Y.; Xia, G.S.; Lu, Q. Learning RoI Transformer for Oriented Object Detection in Aerial Images. In Proceedings of the 2019 IEEE/CVF Conference on Computer Vision and Pattern Recognition (CVPR), Long Beach, CA, USA, 15–20 June 2019; pp. 2844–2853. [Google Scholar] [CrossRef]
- Xie, X.; Cheng, G.; Wang, J.; Yao, X.; Han, J. Oriented R-CNN for Object Detection. In Proceedings of the 2021 IEEE/CVF International Conference on Computer Vision (ICCV), Montreal, QC, Canada, 10–17 October 2021; pp. 3500–3509. [Google Scholar] [CrossRef]
- Han, J.; Ding, J.; Xue, N.; Xia, G.S. ReDet: A Rotation-equivariant Detector for Aerial Object Detection. In Proceedings of the 2021 IEEE/CVF Conference on Computer Vision and Pattern Recognition (CVPR), Nashville, TN, USA, 20–25 June 2021; pp. 2785–2794. [Google Scholar] [CrossRef]
- Yang, X.; Yan, J.; Feng, Z.; He, T. R3Det: Refined Single-Stage Detector with Feature Refinement for Rotating Object. Proc. AAAI Conf. Artif. Intell. 2021, 35, 3163–3171. [Google Scholar] [CrossRef]
- Li, W.; Chen, Y.; Hu, K.; Zhu, J. Oriented RepPoints for Aerial Object Detection. In Proceedings of the 2022 IEEE/CVF Conference on Computer Vision and Pattern Recognition (CVPR), New Orleans, LA, USA, 18–24 June 2022; pp. 1819–1828. [Google Scholar] [CrossRef]
- Liu, J.; Liu, L.; Xiao, J. Ellipse Polar Encoding for Oriented SAR Ship Detection. IEEE J. Sel. Top. Appl. Earth Obs. Remote Sens. 2024, 17, 3502–3515. [Google Scholar] [CrossRef]
- Goldstein, G.B. False-Alarm Regulation in Log-Normal and Weibull Clutter. IEEE Trans. Aerosp. Electron. Syst. 1973, AES-9, 84–92. [Google Scholar] [CrossRef]
- Xu, C.; Li, Y.; Ji, C.; Huang, Y.; Wang, H.; Xia, Y. An Improved CFAR Algorithm for Target Detection. In Proceedings of the 2017 International Symposium on Intelligent Signal Processing and Communication Systems (ISPACS), Xiamen, China, 6–9 November 2017; pp. 883–888. [Google Scholar] [CrossRef]
- Wang, Z.; Wang, R.; Fu, X.; Xia, K. Unsupervised Ship Detection for Single-Channel SAR Images Based on Multiscale Saliency and Complex Signal Kurtosis. IEEE Geosci. Remote Sens. Lett. 2022, 19, 1–5. [Google Scholar] [CrossRef]
- Tello, M.; Lopez-Martinez, C.; Mallorqui, J. A Novel Algorithm for Ship Detection in SAR Imagery Based on the Wavelet Transform. IEEE Geosci. Remote Sens. Lett. 2005, 2, 201–205. [Google Scholar] [CrossRef]
- Tan, M.; Pang, R.; Le, Q.V. EfficientDet: Scalable and Efficient Object Detection. In Proceedings of the 2020 IEEE/CVF Conference on Computer Vision and Pattern Recognition (CVPR), Seattle, WA, USA, 13–19 June 2020; pp. 10778–10787. [Google Scholar] [CrossRef]
- Li, C.; Li, L.; Jiang, H.; Weng, K.; Geng, Y.; Li, L.; Ke, Z.; Li, Q.; Cheng, M.; Nie, W.; et al. YOLOv6: A Single-Stage Object Detection Framework for Industrial Applications. arXiv 2022, arXiv:2209.02976. [Google Scholar] [CrossRef]
- Redmon, J.; Divvala, S.; Girshick, R.; Farhadi, A. You Only Look Once: Unified, Real-Time Object Detection. In Proceedings of the 2016 IEEE Conference on Computer Vision and Pattern Recognition (CVPR), Las Vegas, NV, USA, 27–30 June 2016; pp. 779–788. [Google Scholar] [CrossRef]
- Varghese, R.; Sambath, M. YOLOv8: A Novel Object Detection Algorithm with Enhanced Performance and Robustness. In Proceedings of the 2024 International Conference on Advances in Data Engineering and Intelligent Computing Systems (ADICS), Chennai, India, 18–19 April 2024; pp. 1–6. [Google Scholar] [CrossRef]
- Ren, S.; He, K.; Girshick, R.; Sun, J. Faster R-CNN: Towards Real-Time Object Detection with Region Proposal Networks. IEEE Trans. Pattern Anal. Mach. Intell. 2017, 39, 1137–1149. [Google Scholar] [CrossRef]
- He, K.; Gkioxari, G.; Dollár, P.; Girshick, R. Mask R-CNN. In Proceedings of the 2017 IEEE International Conference on Computer Vision (ICCV), Venice, Italy, 22–29 October 2017; pp. 2980–2988. [Google Scholar] [CrossRef]
- Cai, Z.; Vasconcelos, N. Cascade R-CNN: Delving Into High Quality Object Detection. In Proceedings of the 2018 IEEE/CVF Conference on Computer Vision and Pattern Recognition, Salt Lake City, UT, USA, 18–23 June 2018; pp. 6154–6162. [Google Scholar] [CrossRef]
- Ding, K.; Yang, J.; Lin, H.; Wang, Z.; Wang, D.; Wang, X.; Ni, K.; Zhou, Q. Towards Real-Time Detection of Ships and Wakes with Lightweight Deep Learning Model in Gaofen-3 SAR Images. Remote Sens. Environ. 2023, 284, 113345. [Google Scholar] [CrossRef]
- Hou, L.; Lu, K.; Yang, X.; Li, Y.; Xue, J. G-Rep: Gaussian Representation for Arbitrary-Oriented Object Detection. Remote Sens. 2023, 15, 757. [Google Scholar] [CrossRef]
- Zhou, K.; Zhang, M.; Wang, H.; Tan, J. Ship Detection in SAR Images Based on Multi-Scale Feature Extraction and Adaptive Feature Fusion. Remote Sens. 2022, 14, 755. [Google Scholar] [CrossRef]
- Wang, H.; Han, D.; Cui, M.; Chen, C. NAS-YOLOX: A SAR Ship Detection Using Neural Architecture Search and Multi-Scale Attention. Connect. Sci. 2023, 35, 1–32. [Google Scholar] [CrossRef]
- Chen, Z.; Liu, C.; Filaretov, V.F.; Yukhimets, D.A. Multi-Scale Ship Detection Algorithm Based on YOLOv7 for Complex Scene SAR Images. Remote Sens. 2023, 15, 2071. [Google Scholar] [CrossRef]
- Liu, H. SAR Image Ship Detection Based on Light-Weight Multi-Scale Feature Enhancement Network. In Proceedings of the 2023 38th Youth Academic Annual Conference of Chinese Association of Automation (YAC), Hefei, China, 27–29 August 2023; pp. 81–86. [Google Scholar] [CrossRef]
- Liangjun, Z.; Feng, N.; Yubin, X.; Gang, L.; Zhongliang, H.; Yuanyang, Z. MSFA-YOLO: A Multi-Scale SAR Ship Detection Algorithm Based on Fused Attention. IEEE Access 2024, 12, 24554–24568. [Google Scholar] [CrossRef]
- Zhou, L.; Wan, Z.; Zhao, S.; Han, H.; Liu, Y. BFEA: A SAR Ship Detection Model Based on Attention Mechanism and Multiscale Feature Fusion. IEEE J. Sel. Top. Appl. Earth Obs. Remote Sens. 2024, 17, 11163–11177. [Google Scholar] [CrossRef]
- Song, G.; Liu, Y.; Wang, X. Revisiting the Sibling Head in Object Detector. In Proceedings of the 2020 IEEE/CVF Conference on Computer Vision and Pattern Recognition (CVPR), Seattle, WA, USA, 13–19 June 2020; pp. 11560–11569. [Google Scholar] [CrossRef]
- Wu, Y.; Chen, Y.; Yuan, L.; Liu, Z.; Wang, L.; Li, H.; Fu, Y. Rethinking Classification and Localization for Object Detection. In Proceedings of the 2020 IEEE/CVF Conference on Computer Vision and Pattern Recognition (CVPR), Seattle, WA, USA, 13–19 June 2020; pp. 10183–10192. [Google Scholar] [CrossRef]
- Zhou, Y.; Zhang, F.; Yin, Q.; Ma, F.; Zhang, F. Inshore Dense Ship Detection in SAR Images Based on Edge Semantic Decoupling and Transformer. IEEE J. Sel. Top. Appl. Earth Obs. Remote Sens. 2023, 16, 4882–4890. [Google Scholar] [CrossRef]
- Han, B.; He, L.; Yu, Y.; Lu, W.; Gao, X. General Deformable RoI Pooling and Semi-Decoupled Head for Object Detection. IEEE Trans. Multimed. 2024, 26, 9410–9422. [Google Scholar] [CrossRef]
- Song, C.; Ding, S.; Chen, Y. Implicit Learning of Rotational Decoupling Detection Heads Applied to Remote Sensing Object Detection. In Proceedings of the 2023 Asia-Pacific Conference on Image Processing, Electronics and Computers (IPEC), Dalian, China, 14–16 April 2023; pp. 52–58. [Google Scholar] [CrossRef]
- Zhang, Y.; Lei, Z.; Yu, H.; Zhuang, L. Imbalanced High-Resolution SAR Ship Recognition Method Based on a Lightweight CNN. IEEE Geosci. Remote Sens. Lett. 2022, 19, 1–5. [Google Scholar] [CrossRef]
- Guo, Y.; Zhou, L. MEA-Net: A Lightweight SAR Ship Detection Model for Imbalanced Datasets. Remote Sens. 2022, 14, 4438. [Google Scholar] [CrossRef]
- Zhan, R.; Cui, Z. Ship Recognition for SAR Scene Images under Imbalance Data. Remote Sens. 2022, 14, 6294. [Google Scholar] [CrossRef]
- Liu, Y.; Yan, G.; Ma, F.; Zhou, Y.; Zhang, F. SAR Ship Detection Based on Explainable Evidence Learning Under Intraclass Imbalance. IEEE Trans. Geosci. Remote Sens. 2024, 62, 1–15. [Google Scholar] [CrossRef]
- Szegedy, C.; Liu, W.; Jia, Y.; Sermanet, P.; Reed, S.; Anguelov, D.; Erhan, D.; Vanhoucke, V.; Rabinovich, A. Going Deeper with Convolutions. In Proceedings of the 2015 IEEE Conference on Computer Vision and Pattern Recognition (CVPR), Boston, MA, USA, 7–12 June 2015; pp. 1–9. [Google Scholar] [CrossRef]
- Cai, X.; Lai, Q.; Wang, Y.; Wang, W.; Sun, Z.; Yao, Y. Poly Kernel Inception Network for Remote Sensing Detection. In Proceedings of the 2024 IEEE/CVF Conference on Computer Vision and Pattern Recognition (CVPR), Seattle, WA, USA, 16–22 June 2024; pp. 27706–27716. [Google Scholar] [CrossRef]
- Misra, D.; Nalamada, T.; Arasanipalai, A.U.; Hou, Q. Rotate to Attend: Convolutional Triplet Attention Module. In Proceedings of the 2021 IEEE Winter Conference on Applications of Computer Vision (WACV), Waikoloa, HI, USA, 3–8 January 2021; pp. 3138–3147. [Google Scholar] [CrossRef]
- Vaswani, A.; Shazeer, N.; Parmar, N.; Uszkoreit, J.; Jones, L.; Gomez, A.N.; Kaiser, Ł.; Polosukhin, I. Attention Is All You Need. In Proceedings of the Advances in Neural Information Processing Systems, Long Beach, CA, USA, 4–9 December 2017; Curran Associates, Inc.: Red Hook, NY, USA, 2017; Volume 30. [Google Scholar]
- Wang, Q.; Wu, B.; Zhu, P.; Li, P.; Zuo, W.; Hu, Q. ECA-Net: Efficient Channel Attention for Deep Convolutional Neural Networks. In Proceedings of the 2020 IEEE/CVF Conference on Computer Vision and Pattern Recognition (CVPR), Seattle, WA, USA, 13–19 June 2020; pp. 11531–11539. [Google Scholar] [CrossRef]
- Lin, T.Y.; Goyal, P.; Girshick, R.; He, K.; Dollar, P. Focal Loss for Dense Object Detection. In Proceedings of the 2017 IEEE International Conference on Computer Vision (ICCV), Venice, Italy, 22–29 October 2017; pp. 2999–3007. [Google Scholar] [CrossRef]
- Rezatofighi, H.; Tsoi, N.; Gwak, J.; Sadeghian, A.; Reid, I.; Savarese, S. Generalized Intersection Over Union: A Metric and a Loss for Bounding Box Regression. In Proceedings of the 2019 IEEE/CVF Conference on Computer Vision and Pattern Recognition (CVPR), Long Beach, CA, USA, 15–20 June 2019; pp. 658–666. [Google Scholar] [CrossRef]
- Xu, Y.; Fu, M.; Wang, Q.; Wang, Y.; Chen, K.; Xia, G.S.; Bai, X. Gliding Vertex on the Horizontal Bounding Box for Multi-Oriented Object Detection. IEEE Trans. Pattern Anal. Mach. Intell. 2021, 43, 1452–1459. [Google Scholar] [CrossRef] [PubMed]
- Han, J.; Ding, J.; Li, J.; Xia, G.S. Align Deep Features for Oriented Object Detection. IEEE Trans. Geosci. Remote Sens. 2022, 60, 5602511. [Google Scholar] [CrossRef]
- Tian, Z.; Shen, C.; Chen, H.; He, T. FCOS: Fully Convolutional One-Stage Object Detection. In Proceedings of the 2019 IEEE/CVF International Conference on Computer Vision (ICCV), Seoul, Republic of Korea, 27 October–2 November 2019; pp. 9626–9635. [Google Scholar] [CrossRef]
Disclaimer/Publisher’s Note: The statements, opinions and data contained in all publications are solely those of the individual author(s) and contributor(s) and not of MDPI and/or the editor(s). MDPI and/or the editor(s) disclaim responsibility for any injury to people or property resulting from any ideas, methods, instructions or products referred to in the content. |
© 2025 by the authors. Licensee MDPI, Basel, Switzerland. This article is an open access article distributed under the terms and conditions of the Creative Commons Attribution (CC BY) license (https://creativecommons.org/licenses/by/4.0/).