Article

Multi-Modal Remote Sensing Image Registration Method Combining Scale-Invariant Feature Transform with Co-Occurrence Filter and Histogram of Oriented Gradients Features

by
Yi Yang
1,*,
Shuo Liu
2,
Haitao Zhang
1,
Dacheng Li
3 and
Ling Ma
4
1
College of Integrated Circuits, Taiyuan University of Technology, Taiyuan 030024, China
2
College of Physics and Optoelectronics, Taiyuan University of Technology, Taiyuan 030024, China
3
College of Geological and Surveying Engineering, Taiyuan University of Technology, Taiyuan 030024, China
4
Department of Bioengineering, University of Texas at Dallas, Richardson, TX 75080, USA
*
Author to whom correspondence should be addressed.
Remote Sens. 2025, 17(13), 2246; https://doi.org/10.3390/rs17132246
Submission received: 15 May 2025 / Revised: 21 June 2025 / Accepted: 27 June 2025 / Published: 30 June 2025

Abstract

Multi-modal remote sensing images often exhibit complex and nonlinear radiation differences which significantly hinder the performance of traditional feature-based image registration methods such as Scale-Invariant Feature Transform (SIFT). In contrast, structural features—such as edges and contours—remain relatively consistent across modalities. To address this challenge, we propose a novel multi-modal image registration method, Cof-SIFT, which integrates a co-occurrence filter with SIFT. By replacing the traditional Gaussian filter with a co-occurrence filter, Cof-SIFT effectively suppresses texture variations while preserving structural information, thereby enhancing robustness to cross-modal differences. To further improve image registration accuracy, we introduce an extended approach, Cof-SIFT_HOG, which extracts Histogram of Oriented Gradients (HOG) features from the image gradient magnitude map of corresponding points and refines their positions based on HOG similarity. This refinement yields more precise alignment between the reference and image to be registered. We evaluated Cof-SIFT and Cof-SIFT_HOG on a diverse set of multi-modal remote sensing image pairs. The experimental results demonstrate that both methods outperform existing approaches, including SIFT, COFSM, SAR-SIFT, PSO-SIFT, and OS-SIFT, in terms of robustness and registration accuracy. Notably, Cof-SIFT_HOG achieves the highest overall performance, confirming the effectiveness of the proposed structural-preserving and corresponding point location refinement strategies in cross-modal registration tasks.

1. Introduction

Remote sensing plays a pivotal role in diverse applications, ranging from change detection [1] and land use analysis [2] to disaster management [3] and climate studies [4]. These applications often require the integration of data captured by different sensors operating in varying modalities, such as optical, synthetic aperture radar (SAR), and infrared imaging [5]. Multi-modal image registration, the process of geometrically aligning images from different modalities, is a critical preprocessing step for achieving such integration [6].
The primary challenge in multi-modal remote sensing image registration lies in the significant differences in the visual properties of the images. For example, optical images capture surface reflectance, SAR images represent backscatter, and infrared images depict thermal emissions. These inherent differences result in poor correlation of pixel intensities, rendering traditional intensity-based registration techniques ineffective. Furthermore, varying resolutions, imaging geometries, and sensor noise exacerbate the difficulty of aligning such images.
In the past few decades, researchers have developed numerous image registration methods for various types of images. These methods can be roughly divided into three categories: area-based methods [7,8], feature-based approaches [9,10,11,12], and deep learning-based techniques [13,14,15,16]. Area-based methods typically select a patch from the image to be registered and then traverse the reference image to find the position with the highest similarity, thereby achieving image registration [8]. These methods can usually achieve high matching accuracy but are computationally expensive and sensitive to image rotation and scaling.
With the development of deep learning, researchers have also attempted to apply it to multi-modal image registration tasks [14,17,18,19,20]. In the initial stage, deep learning is mainly used to extract image features, improve the differences caused by nonlinear changes, and accurately locate the corresponding areas in the reference image [20]. Later, scholars transformed image matching into a classification problem. For any two given image blocks, the network determines whether they correspond. Other scholars have used neural networks to achieve image registration based on similarity and semantic criteria [21]. Recent work has also incorporated attention mechanisms into image registration [22]. However, deep learning methods are data-driven, and thus the burden of labeling remote sensing images poses great challenges. In addition, deep learning requires high computing power, which also limits its application.
Feature-based methods have become a robust alternative for image registration. Among them, Scale-Invariant Feature Transform (SIFT) [23] is particularly effective due to its strong invariance to image rotation and scale variations, making it widely used in applications such as natural image registration and image stitching. However, SIFT’s performance significantly degrades in multi-modal remote sensing image registration, where nonlinear radiometric distortions are commonly present.
Despite the significant nonlinear radiation distortion in multi-modal remote sensing images, their structural features usually remain unchanged. Therefore, this paper proposes a hybrid approach combining SIFT and a co-occurrence filter [24] named Cof-SIFT for multi-modal remote sensing image registration. This method employs co-occurrence filters to smooth image details while preserving structural features. Unlike SIFT, this method uses co-occurrence filters to build an image pyramid, thereby achieving invariance to image scale and rotation. To further improve the accuracy of corresponding points between the reference image and the image to be registered, we propose a method to iteratively adjust the positions of corresponding points based on Histogram of Oriented Gradients (HOG) [25] feature similarity. To evaluate the performance of our proposed methods and other well-known approaches such as SIFT, SAR-SIFT [26], PSO-SIFT [27], OS-SIFT [28], and CoFSM [10], we conducted image matching experiments on multi-modal remote sensing image datasets and generated checkerboard mosaiced images based on the image matching results to more intuitively demonstrate the performance of image registration methods.
The rest of this paper is organized as follows: Section 2 reviews related works in multi-modal remote sensing image registration. Section 3 presents the proposed methodology in detail, including the co-occurrence filter, the Cof-SIFT construction process, and the position refinement strategy of corresponding points based on HOG features. Section 4 reports the experimental results of image matching, accompanied by a comprehensive analysis of the advantages and limitations of the evaluated methods. Section 5 concludes the study and outlines potential directions for future research.

2. Related Works

Image registration is a key prerequisite for remote sensing applications such as change detection, image mosaicking, and image fusion. Numerous deep learning-based remote sensing image matching methods have been proposed in recent years. For example, LoFTR, developed by Sun et al., has demonstrated strong performance in optical image registration [18], but its robustness significantly declines when applied to multi-modal remote sensing image registration. To address modality differences, Zhu et al. designed a two-branch network to extract complementary features and formulated the matching task as a binary classification problem [19]. Quan et al. proposed CNet, a correlation learning network tailored for multi-modal remote sensing image registration [29]; however, it struggles with large geometric distortions and severe noise. Han et al. leveraged deep neural networks (DNNs) to measure the similarity between image patches for matching purposes [21]. Ye et al. introduced AESF, a method combining a multi-branch global attention mechanism with a joint multi-cropping image matching loss, specifically designed for optical and SAR image matching [30]. Zhang et al. proposed a multi-modal image matching method combining a deep convolutional neural network and the transformer attention mechanism [22]. Despite these advances, deep learning methods heavily rely on large volumes of high-quality training data. In practice, the scarcity of annotated datasets and the absence of standardized benchmarks remain major challenges. Moreover, deep learning approaches typically demand substantial computational resources, thus limiting their practicality in real-world applications.
Meanwhile, area-based methods [8,31] usually take a patch from the image to be registered, then traverse the reference image to find the position with the highest similarity to achieve image registration. Correlation coefficient and mutual information (MI) are two commonly adopted similarity metrics. However, the correlation coefficient is not robust to nonlinear radiation distortion, while MI may not obtain the global optimal solution [32]. Ye et al. [8] proposed an area-based method that utilized the phase-consistent (PC) amplitude and orientation to generate orientation-phase consistency histograms (HOPCs) for multi-modal remote sensing image registration. Later, Ye et al. [33] constructed channel features of orientated gradients (CFOGs) by calculating orientated gradients based on the HOG to alleviate the impact of nonlinear intensity distortion. This type of method can usually achieve high matching accuracy, but it is heavily reliant on prior positional information between images and is not robust to geometric distortions, scale change, and image rotation.
In contrast, feature-based methods are widely used because they only operate on features and require less calculation. The proposal of SIFT marked a breakthrough and opened a new era of feature-based image registration techniques. It first constructs a gradient direction histogram by calculating the gradient of pixels in the feature support region to obtain the main direction. Then, the region is rotated to achieve rotation invariance. Subsequently, the feature support region is divided into blocks, and the gradient histogram within the block is calculated to generate a unique feature vector. SIFT exhibits impressive performance in applications such as natural image matching, object detection, and image stitching. Inspired by SIFT, many SIFT variants [26,27,28,34] have been developed by researchers. However, there are significant differences in the imaging sensors and mechanisms of remote sensing images of different modalities, which lead to complex nonlinear radiation differences among images. Although SIFT and its variants achieve favorable results in natural image registration, they cannot handle nonlinear radiation distortion well. To address this limitation, many researchers have improved the SIFT algorithm based on the characteristics of remote sensing images. Dellinger et al. [26] proposed a SIFT-like algorithm named SAR-SIFT for the registration of SAR images. This method demonstrated promising results in image registration of SAR images, but its performance significantly decreased on other remote sensing images such as visible light and infrared images. Ma et al. [27] utilized the Sobel algorithm to modify the gradient definition used in SIFT and developed an enhanced feature matching method for remote sensing image registration, which exhibited good performance in multispectral images. Nevertheless, it was not robust to SAR image and infrared image registration. Xiang et al. [28] proposed a SIFT-like algorithm, namely OS-SIFT, which extracted feature points in Harris scale spaces, for optical-to-SAR image registration. Experimental results showed that the method works better in suburban and rural areas than in urban areas.
In order to mitigate the effects of nonlinear radiation distortion, scholars [8,35,36] exploited the PC algorithm to extract the phase features that are robust to contrast changes and achieved image registration using the local descriptor constructed from phase orientation and magnitude. Fan et al. [37] proposed an effective coarse-to-fine matching method for multi-modal remote sensing based on the phase congruency model. Zhang et al. [13] developed a new multi-modal remote sensing image registration method named Histogram of the Orientation of Weighted Phase (HOWP), which utilized a novel weighted phase orientation model and a regularization-based log-polar to build the feature description vectors. The results show that the HOWP is more robust to nonlinear distortion and contrasting differences, but its performance degrades in the image rotation scenario. Yao et al. [10] utilized co-occurrence filtering to construct the image scale space and generated the image gradient using the low-pass Butterworth filter for multi-modal remote sensing image registration.
In summary, the feature-based methods mentioned above can only alleviate the impact of nonlinear radiation distortion for multi-modal remote sensing image registration in certain scenarios. Therefore, it is necessary to further study and improve the robustness of feature-based methods to deal with nonlinear radiation changes in diverse scenarios and to improve image registration performance.

3. Materials and Methods

The overall workflow of the proposed method is shown in Figure 1.
As illustrated in Figure 1, the proposed Cof_SIFT method consists of the following five steps: (i) construction of an image pyramid using co-occurrence filters; (ii) feature point extraction; (iii) construction of the Cof_SIFT descriptor; (iv) bidirectional feature matching; and (v) outlier rejection using RANSAC. In the Cof_SIFT_HOG, an additional refinement step is introduced, which adjusts the positions of matched points based on Histogram of Oriented Gradients similarity.

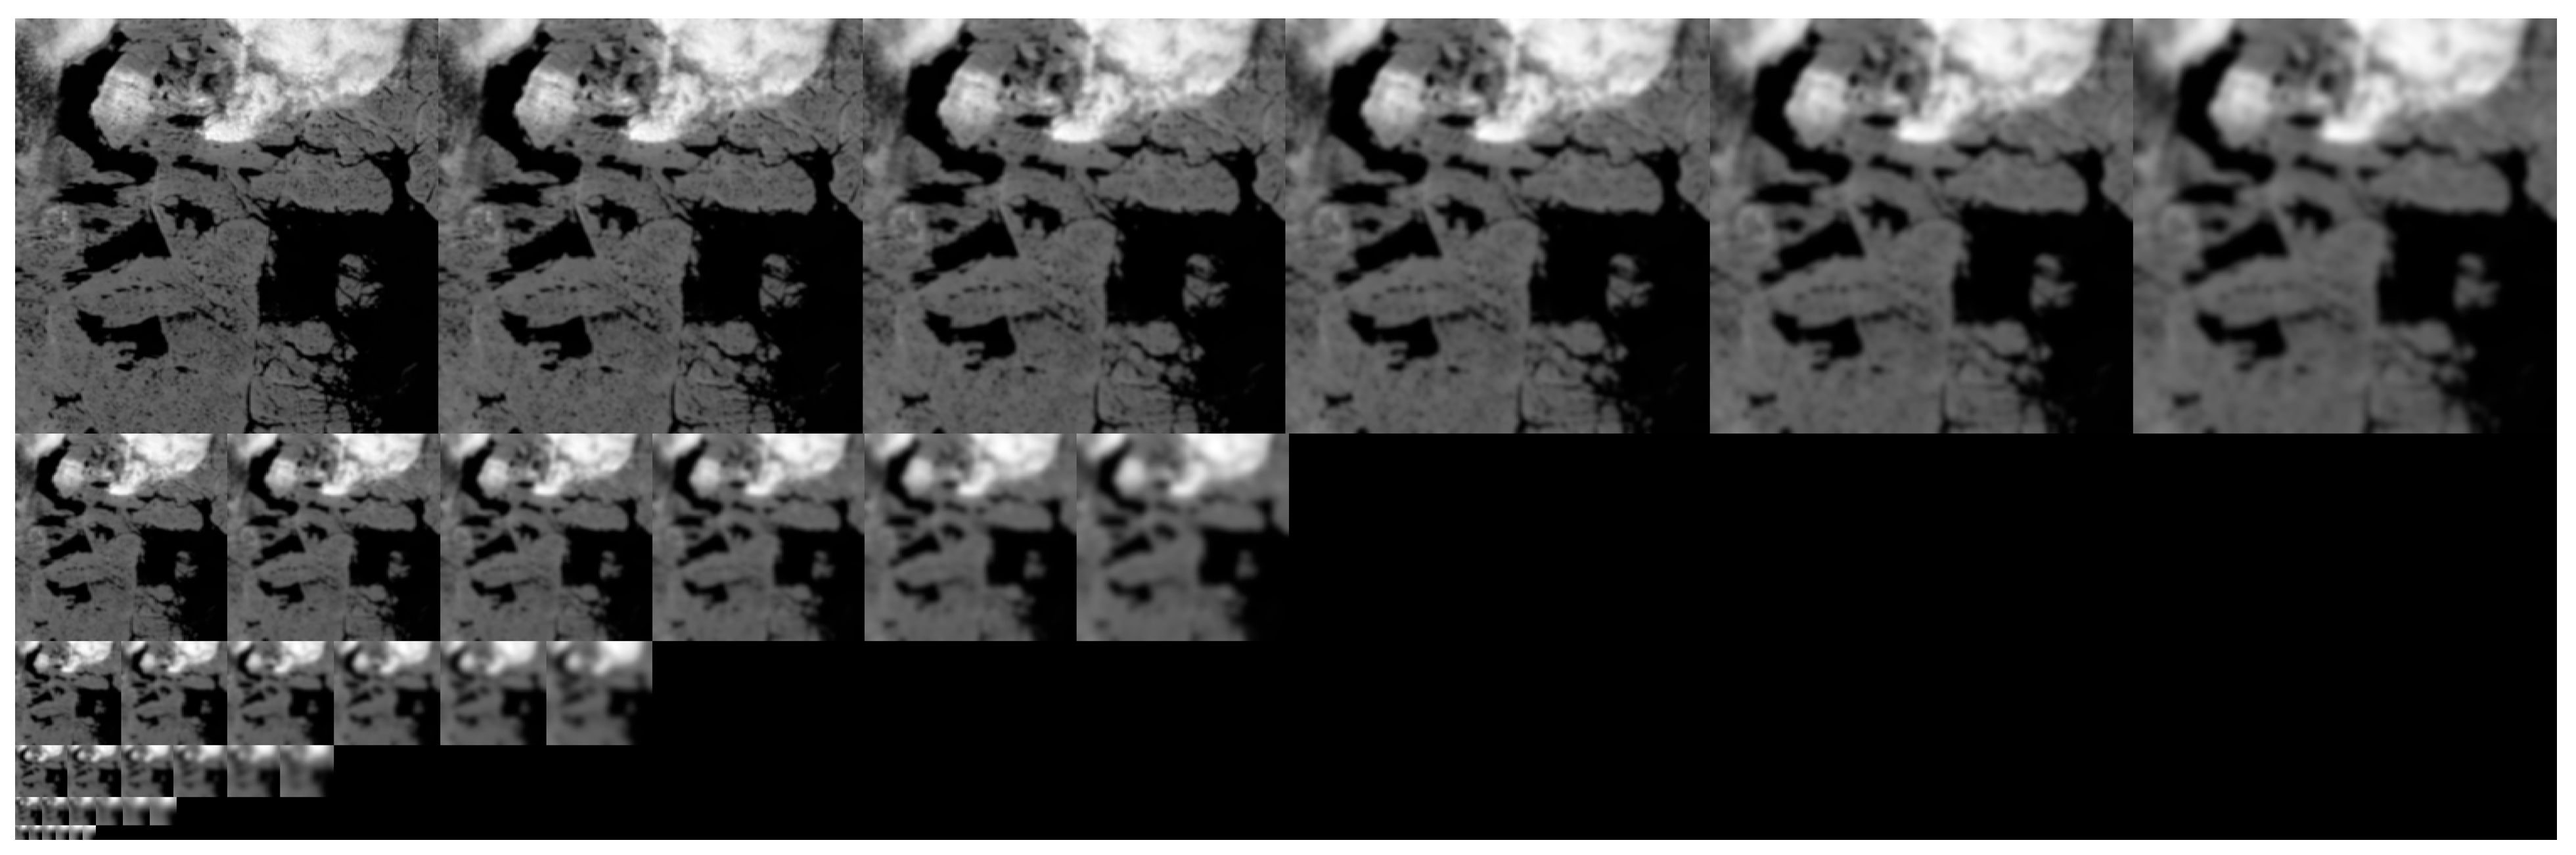
3.1. Image Pyramid Construction Based on the Co-Occurrence Filter

The co-occurrence filter proposed by Jevnisek et al. [24] can effectively preserve image edges while smoothing the image. The textures of multi-modal remote sensing images may differ significantly, but structural features such as image edges typically remain consistent across different modalities. To enhance the robustness of image registration methods to scale variations, Lowe constructed an image pyramid using the Gaussian filter in SIFT. Inspired by it, we used the co-occurrence filter instead of the Gaussian filter to build an image pyramid. Unlike SIFT, however, we do not double the size of the image before pyramid construction.
The definition of the co-occurrence filter can be described by Equation (1):
J p = q N ( p ) G σ s ( p , q ) M ( p , q ) I q q N ( p ) G σ s ( p , q ) M ( p , q )
In Equation (1), p and q are pixel indices; J p and I q denote the output and input of the co-occurrence filter, respectively; G σ s ( p , q ) represents the Gaussian filter; M ( a , b ) is a 256 × 256 matrix and can be calculated from the co-occurrence matrix according to Equation (2).
M ( a , b ) = C ( a , b ) h ( a ) h ( b )
C ( a , b ) = p , q exp ( d ( p , q ) 2 2 σ 2 ) [ I p = a ] [ I q = b ]
h ( a ) = p [ I p = a ]
h ( b ) = q [ I q = b ]
It can be seen from Equations (2)–(5) that M ( a , b ) is based on the co-occurrence matrix C ( a , b ) that counts the co-occurrence of values a and b divided by their frequencies (i.e., the histogram of pixel values), h ( a ) and h ( b ) in the image. In Equation (3); σ is a parameter specified by the user, a and b are integer values ranging from 0 to 255; [.] equals one if the expression inside the brackets is true and zero otherwise.
The co-occurrence filter space of the image is calculated by Equations (1)–(5). To deal with image scale changes, we constructed an image pyramid consisting of o octaves and l layers. Different from the Gaussian image pyramid, we utilized co-occurrence filters instead of Gaussian filters to smooth images in different octaves and layers of the image pyramid. The window size of the co-occurrence filter in different layers is calculated by combining the initial window size of the filter:
C o F _ W n = C o F _ W n 1 + 2 ,   ( n = 1 , 2 l ) C o F _ W 0 = 5
In Equation (6), C o F _ W n denotes the size of the co-occurrence filter used at level n in the image pyramid; l represents the number of the layers in each octave of the image pyramid; C o F _ W 0 represents the initial window size of the co-occurrence filer, which is set to 5 in this paper.
In Equation (3), the parameter σ is determined by the size of the co-occurrence filter in different layers and can be obtained by Equation (7):
σ n 2 = 2 C o F _ W n + 1 ,   ( n = 1 , 2 , . l )
where σ n 2 denotes the parameter used at level n in the image pyramid.
Figure 2 and Figure 3 show the image pyramids constructed using the Gaussian filter and the co-occurrence filter, respectively, illustrating the difference between two filters in this procedure. It can be seen that the co-occurrence filter effectively smooths the image while preserving edge details. In contrast, the Gaussian filter not only smooths the image but also blurs the edges. Therefore, the co-occurrence filter can better meet the needs of multi-modal remote sensing image registration.

3.2. Feature Point Extraction

The feature points in SIFT are detected using the Difference-of-Gaussians (DoG) operator within an image pyramid, which ensures robustness to scale and rotation variations. In this work, we adopt a feature point detection strategy inspired by SIFT, though with certain modifications that differentiate it from the original method. The method mainly includes three steps:
(1)
Scale space extreme detection: In contrast to the original SIFT feature point extraction method, our approach leverages an image pyramid based on co-occurrence filters to produce a series of difference images at various scales. A pixel is designated as a candidate feature point if its value in the difference image represents a local extremum—either a maximum or minimum—relative to its 26 neighbors across the current and adjacent scales in the scale space.
(2)
Feature point localization: We use the detailed model to correct the location of the candidate feature points. Then, candidate feature points are filtered by using the non-maximum suppression algorithm.
(3)
Orientation assignment: To achieve image rotation invariance, each feature point is assigned one or more dominant orientations using the gradient information of the image patch where the key point is located.
After completing the above steps, each feature point contains information such as location, scale, and dominant orientation, achieving invariance to changes in image scale and image rotation.

3.3. Image Gradient

Image gradient orientation and magnitude are crucial for the construction of local descriptors. To improve the robustness of image gradient calculation, we adopted the image gradient calculation method proposed by Ma et al. [27]. First, the image gradient magnitude map is computed using the means of the Sobel filters in the x and y directions. The calculation method is shown in Equation (8).
G M 1 = ( G M , x 1 ) 2 + ( G M , y 1 ) 2
where G M , x 1 and G M , y 1 represent the x and y direction derivatives of the image, respectively.
Then, image derivatives are calculated along the x and y directions on the image magnitude map generated above, and the image orientation and magnitude are obtained according to Equation (9).
G M 2 = ( G M , x 2 ) 2 + ( G M , y 2 ) 2 G O 2 = arctan ( G M , y 2 G M , x 2 )
where G M 2 and G O 2 denote the magnitude and orientation of the final image gradient used for local descriptor construction, respectively.

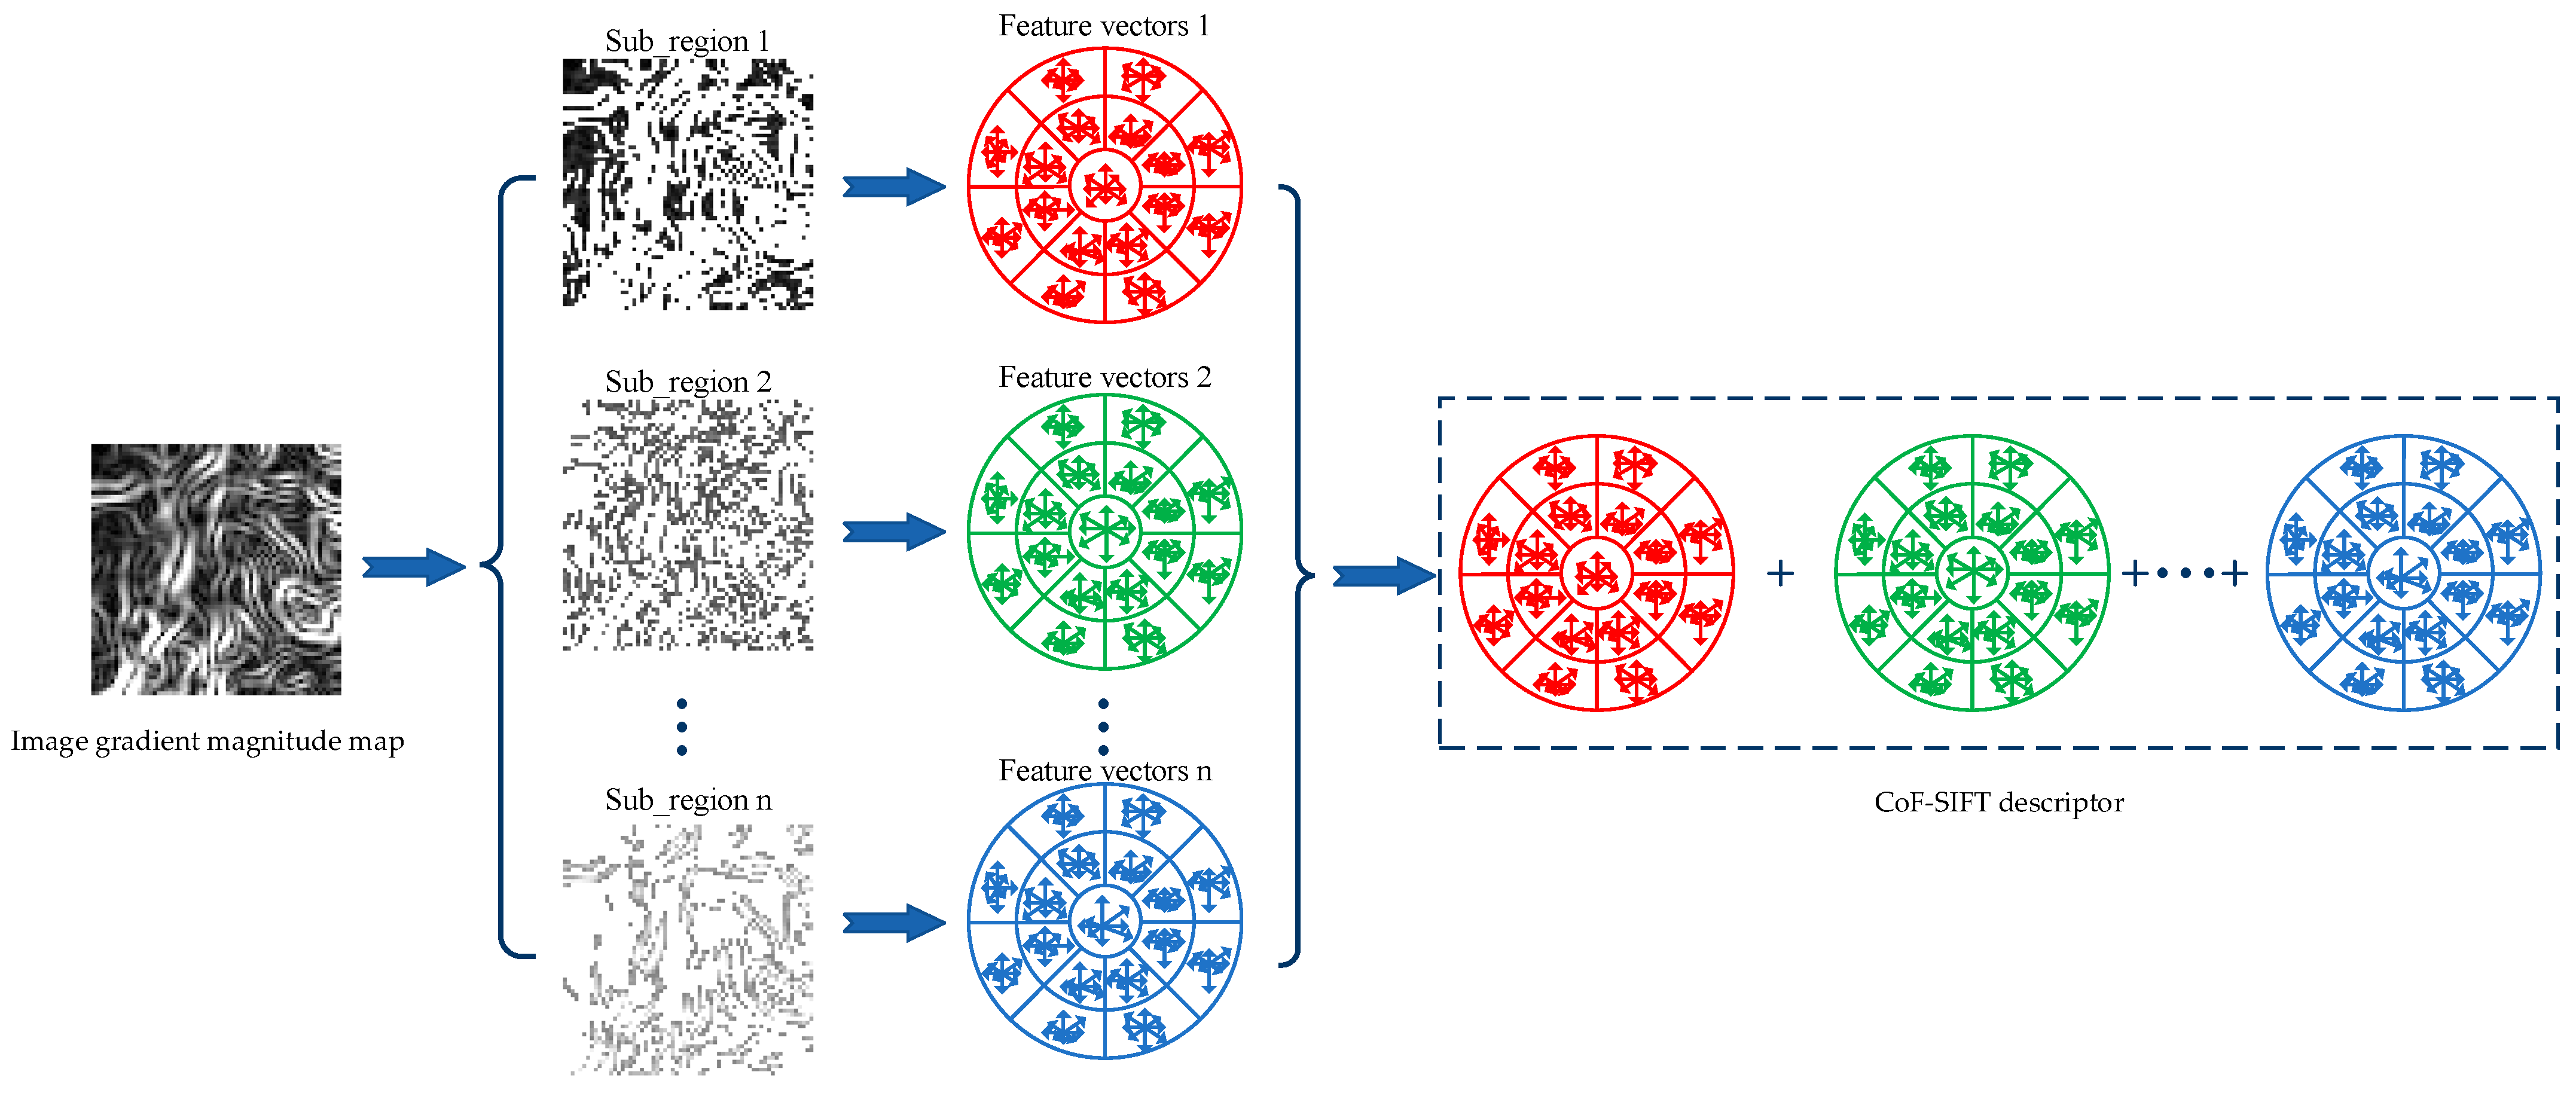
3.4. Image Gradient Magnitude Map Segmentation Based on Magnitude Order

Wang et al. [38] introduced an intensity-based image patch division method to improve the distinctiveness of local descriptors, which has demonstrated effectiveness in natural image matching. However, multi-modal remote sensing images often present complex intensity variations resulting from nonlinear radiation responses. Since structural features such as edges are more resilient to these effects, we instead partition the image gradient magnitude map surrounding each feature point into multiple sub-regions according to magnitude value, thereby enhancing the robustness and discriminative capability of the descriptors. The method of image gradient magnitude map division is described in detail below.
Let us suppose the image gradient magnitude map Ω of one feature point contains n pixels ( x 1 , x 2 , , x n ), and I ( x i ) denotes the magnitude in pixel x . There are mainly two steps to divide the magnitude map into several sub-regions. First, the gradient magnitude of the pixels is sorted in non-descending order, and a set of sorted pixels can be expressed by Equation (10):
O ( Ω ) = { I ( x ^ ) : I ( x ^ 1 ) I ( x ^ 2 ) I ( x ^ n ) , x ^ i Ω , i [ 1 , n ] }
Assuming that the magnitude map is divided into B sub-regions, the B 1 partition threshold set T = { t k : k = 1 , 2 , . , B 1 } can be obtained as Equation (11):
t k = I ( x ^ b k )
where b k = k / B × n , represents the floor function.
Finally, the pixels in the image gradient magnitude map Ω can be mapped onto its corresponding sub-regions according to Equation (12):
η ( x ; T ) = 1 , I ( x ) t 1 k ,   t k - 1 I ( x ) B , I ( x ) > t B 1 t k , k = 2 , 3 , , B 1
As shown in Figure 4, panel (a) illustrates the gradient magnitude map of the support region around one feature point. The gradient magnitudes are sorted in non-descending order and segmented into several sub-regions; panel (b) presents the corresponding segmentation result. To balance the performance and dimension of the local feature descriptor, the number of sub-regions is empirically set to two in this paper.

3.5. Local Feature Descriptor Construction

To further enhance the distinctiveness and robustness of local descriptors in multi-modal remote sensing image registration, the proposed method constructs a Cof-SIFT descriptor by integrating local gradient information within a log-polar coordinate system. As illustrated in Figure 5, the gradient magnitude map of one feature point neighborhood is first partitioned into multiple sub-regions based on gradient magnitude. For each sub-region, local feature vectors are computed by quantizing gradient orientations within the log-polar domain, following the scheme employed in the Gradient Location–Orientation Histogram (GLOH). These sub-region feature vectors are then concatenated to form the final Cof-SIFT descriptor, which encapsulates both local structural information and spatial distribution, thereby improving the discriminative capability under nonlinear radiation conditions. In this work, the gradient orientations are quantized into 12 bins, while the spatial domain is divided into 10 location bins, and the dimension of the feature vector is 136.

3.6. Matching Strategy

3.6.1. Bidirectional Image Matching

In traditional feature-based image matching methods, the corresponding point for each feature point in the reference image is typically determined by selecting the feature point with the smallest Euclidean distance in the image to be registered. However, the reverse is not necessarily true—not all feature points in the image to be registered are guaranteed to have a corresponding point in the reference image, leading to potential asymmetry in the matching process.
To mitigate the aforementioned asymmetry problem in feature matching, a bidirectional matching strategy is employed. Specifically, for each feature point in the reference image, the corresponding point in the image to be registered is first identified based on the minimum Euclidean distance in the feature space. The same procedure is then applied in the reverse direction, identifying the closest match in the reference image for each feature point in the image to be registered. The two sets of matching points are subsequently combined to form a unified candidate correspondence set. To enhance robustness and eliminate outliers, the final matching set is refined using the Random Sample Consensus (RANSAC) algorithm.

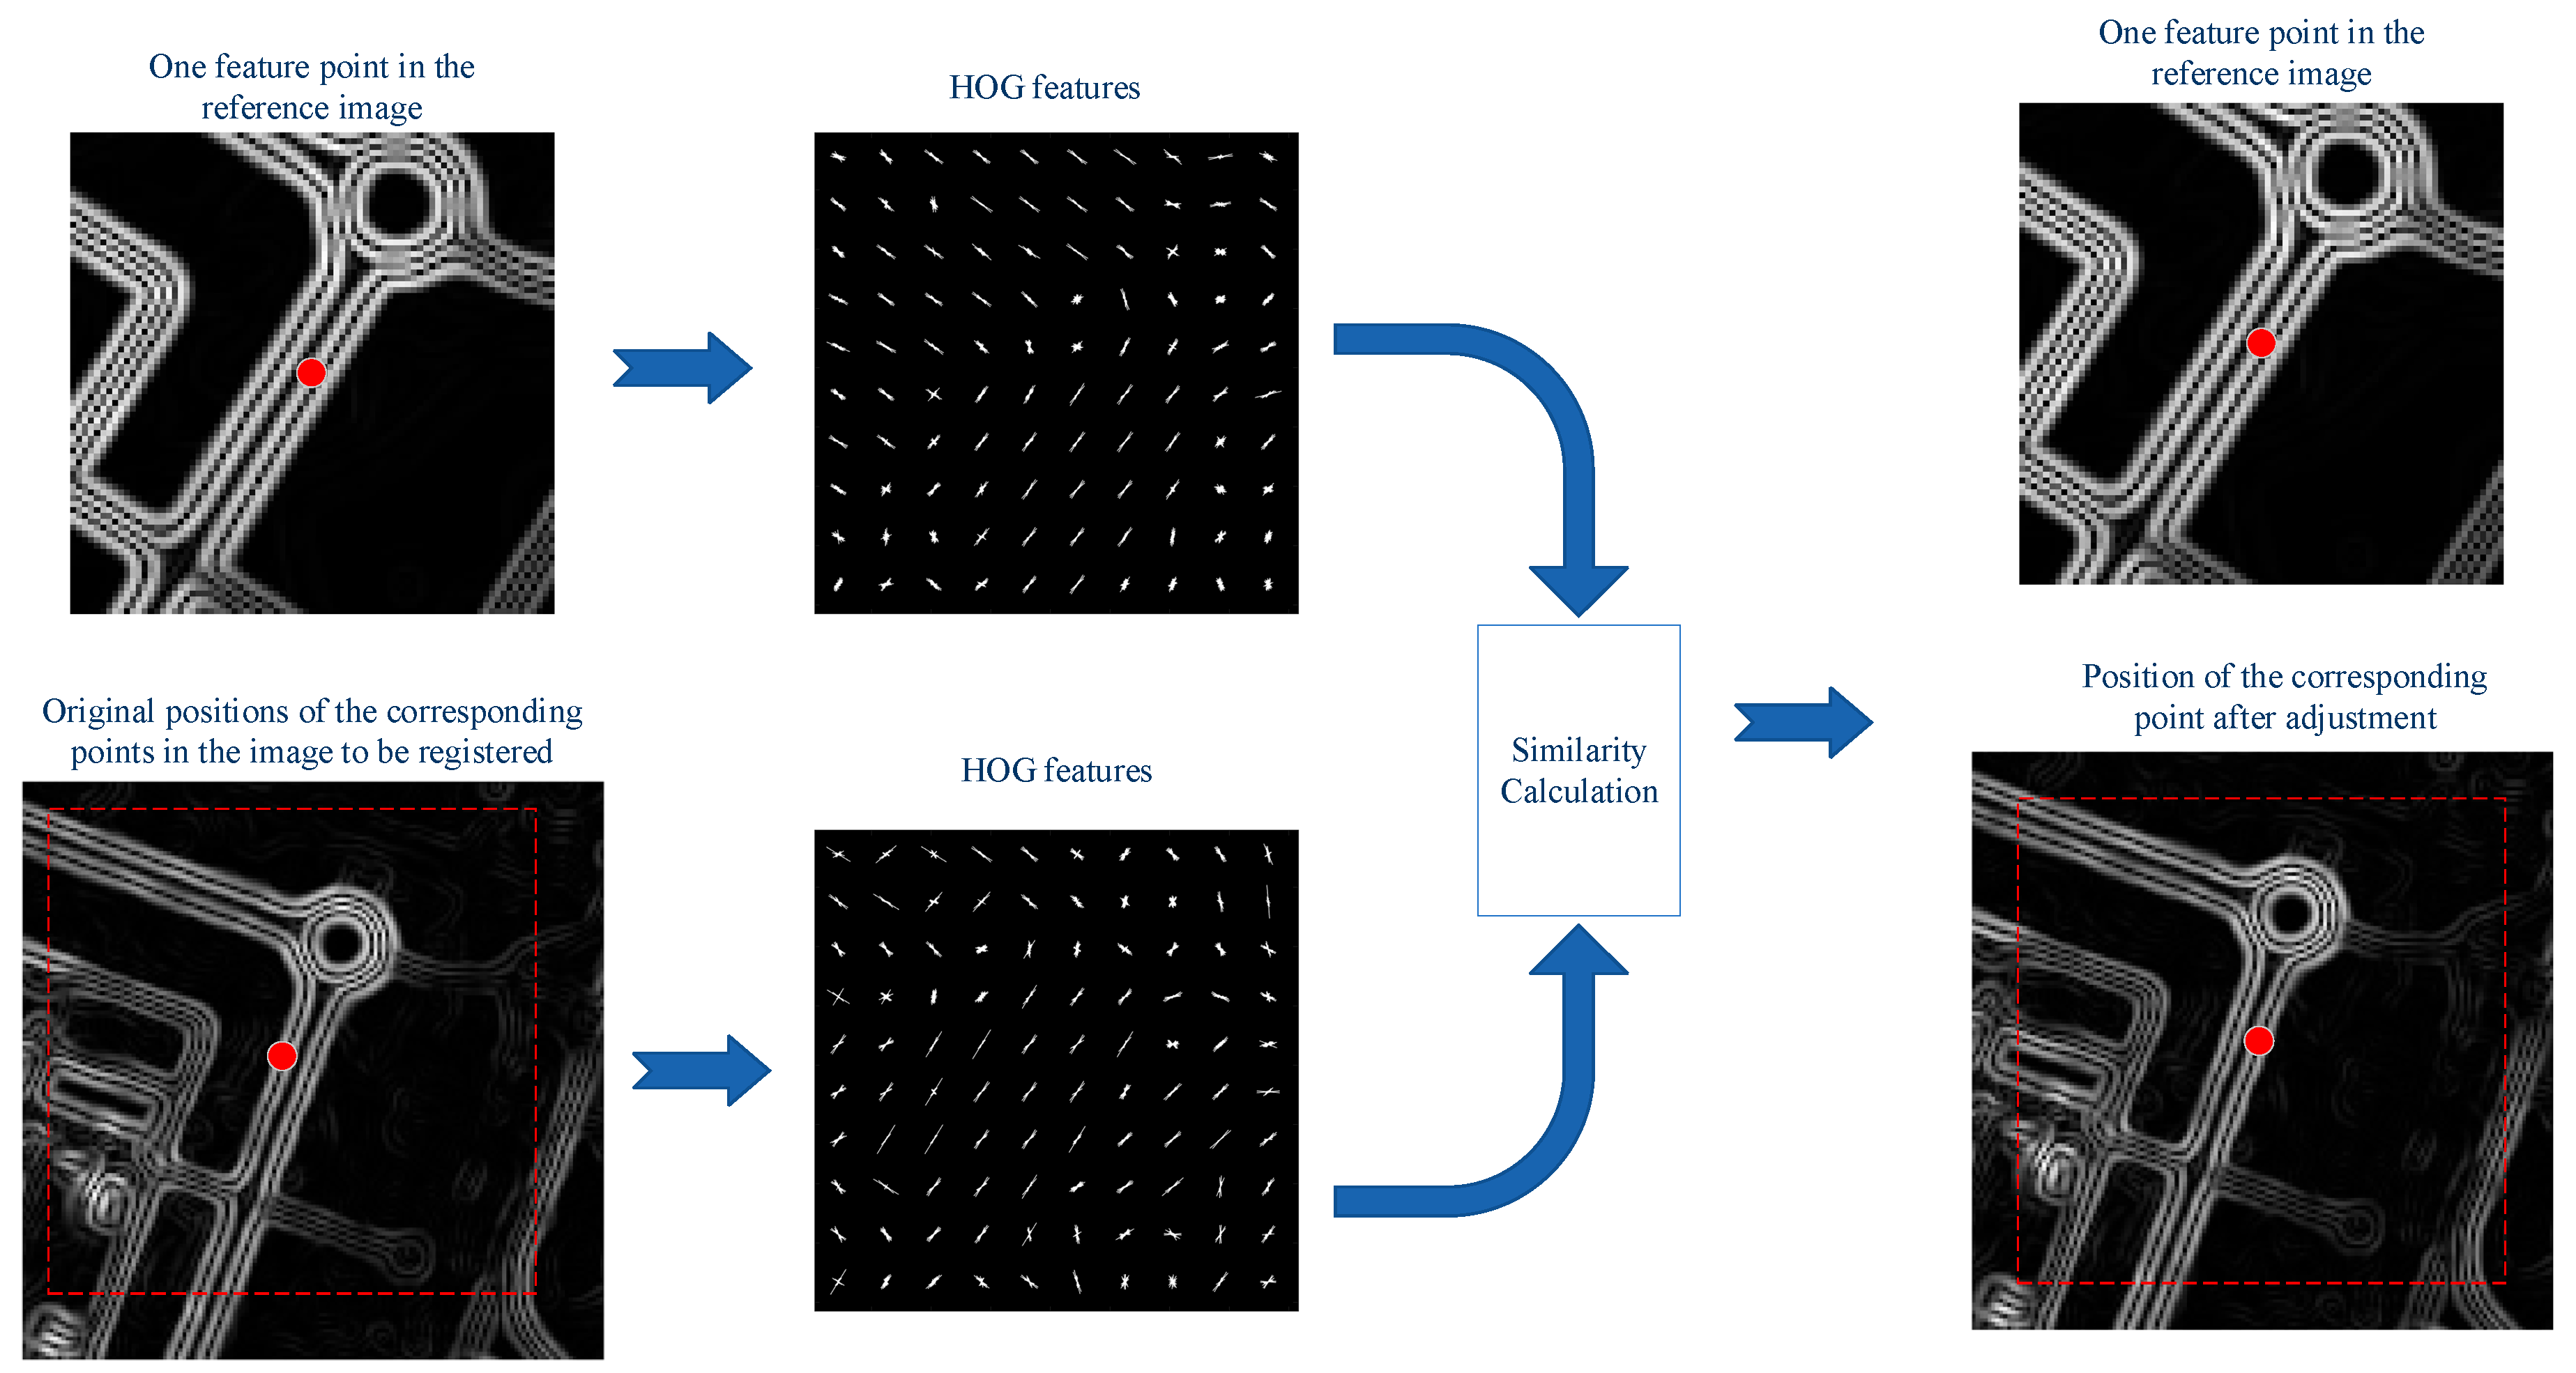
3.6.2. Corresponding Point Location Adjustment Using the Similarity of HOG Features

Image matching based on Euclidean distance cannot guarantee the position accuracy of corresponding points, which will affect the correctness of image transformation matrix calculation and further affect the accuracy of image registration.
To address this issue, after image registration using Cof_SIFT, we define a local search window, which centers on the initial position of the corresponding feature point, and is 15 pixels larger than on the original feature support region. Within this window, HOG features are extracted from the gradient magnitude map of the image. The location yielding the highest HOG similarity is identified, and the coordinates of the corresponding feature point are subsequently updated to this refined position, thereby improving localization accuracy.
The similarity between HOG features of corresponding points is evaluated using the Pearson correlation coefficient. It is important to note that the HOG features are extracted not from the original images, but from their respective gradient magnitude maps to enhance robustness to intensity variations. The Pearson correlation coefficient is defined in Equation (13):
ρ ( A , B ) = 1 N 1 i = 1 N ( A i μ A σ A ) ( B i μ B σ B )
where two variables A and B contain N scalar observations; μ A and σ A are the mean and standard deviation of the variable A; μ B and σ B are the mean and standard deviation of the variable B. In this paper, A and B represent HOG features.
The position adjustment process of corresponding points is shown in Figure 6, given a pair of initially matched points—one in the reference image and the other in the image to be registered. HOG features are extracted from their respective image gradient magnitude maps. A search window is defined around the initially matched point in the image to be registered, and the HOG feature similarity (measured using the Pearson correlation coefficient) is computed between the reference point and each candidate point within the window. The position with the highest similarity score is selected as the updated corresponding point. This process significantly enhances the accuracy of feature point localization, thereby improving the robustness of subsequent transformation estimation.

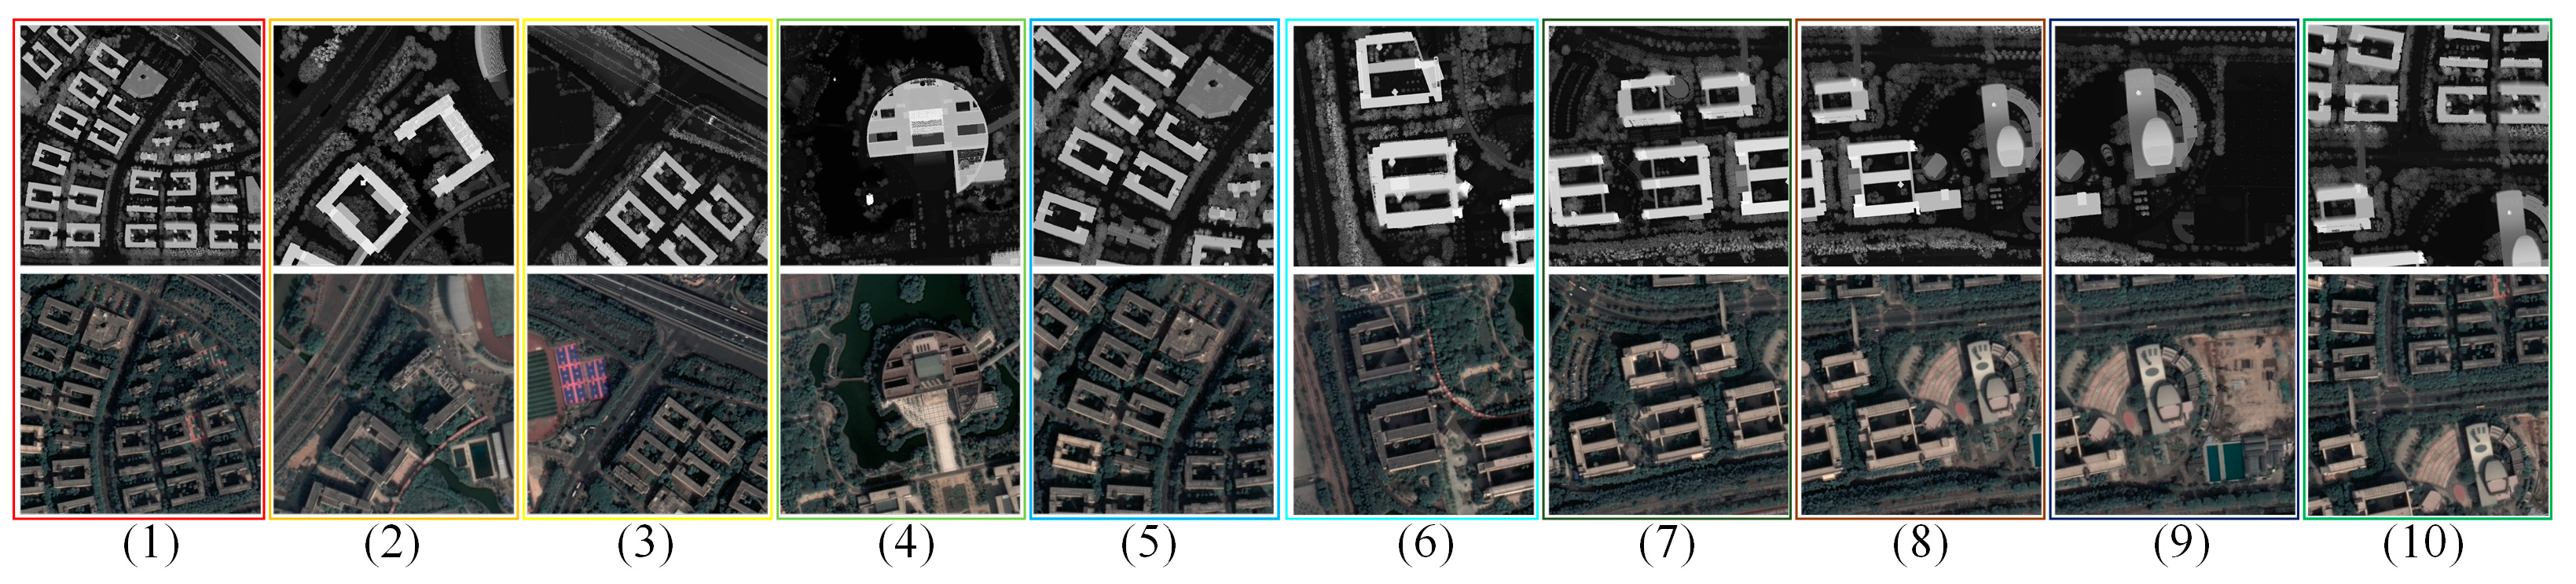
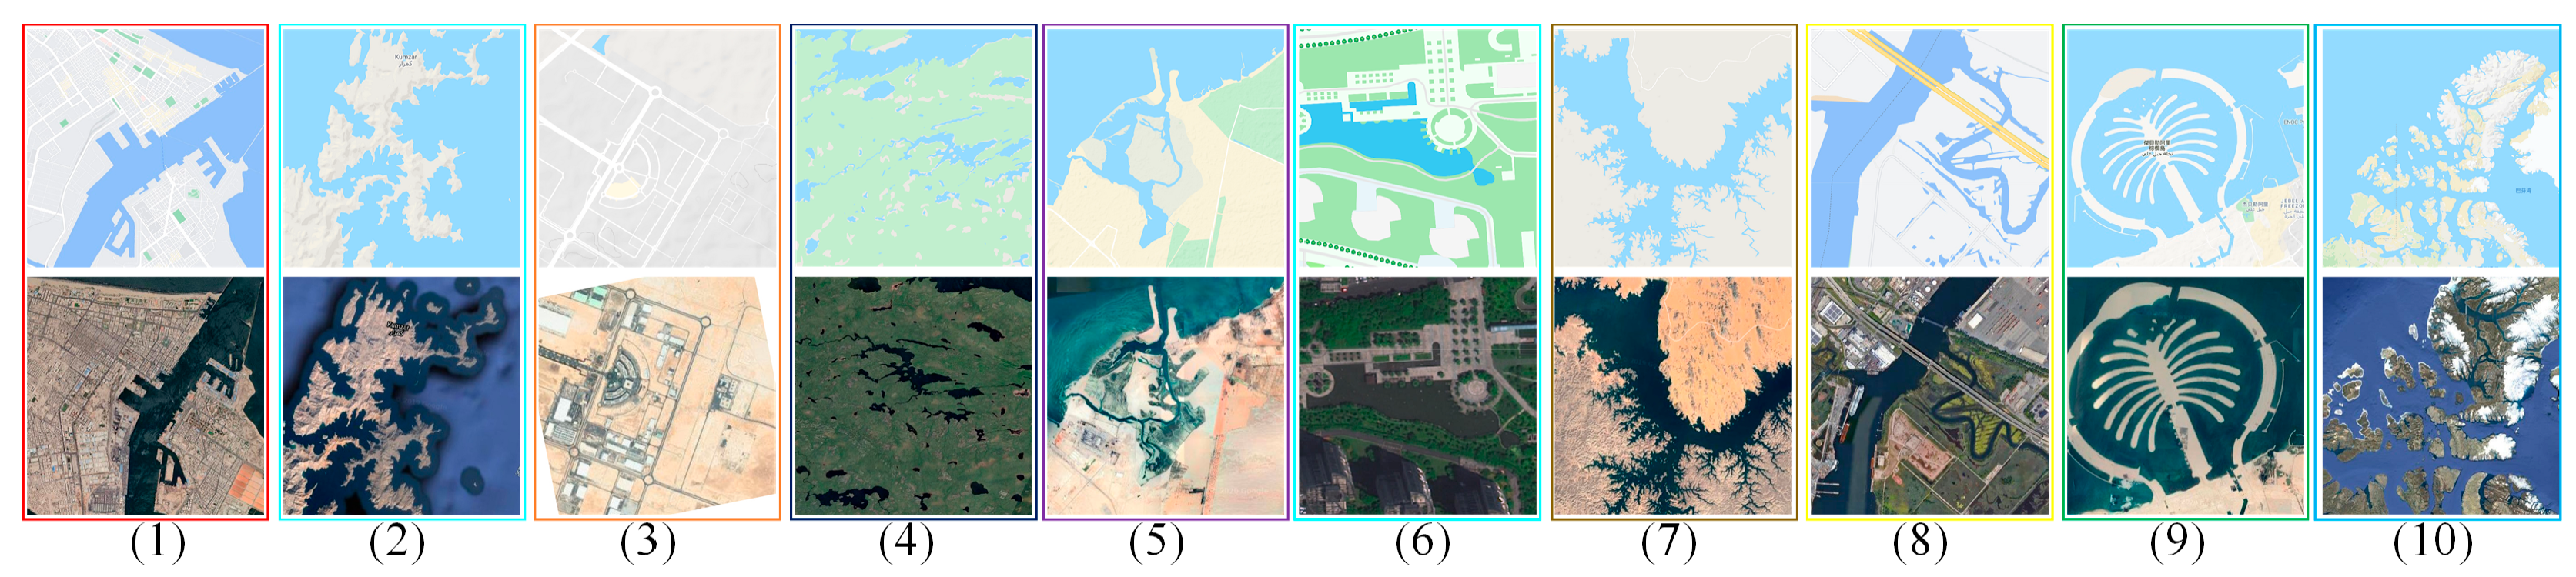
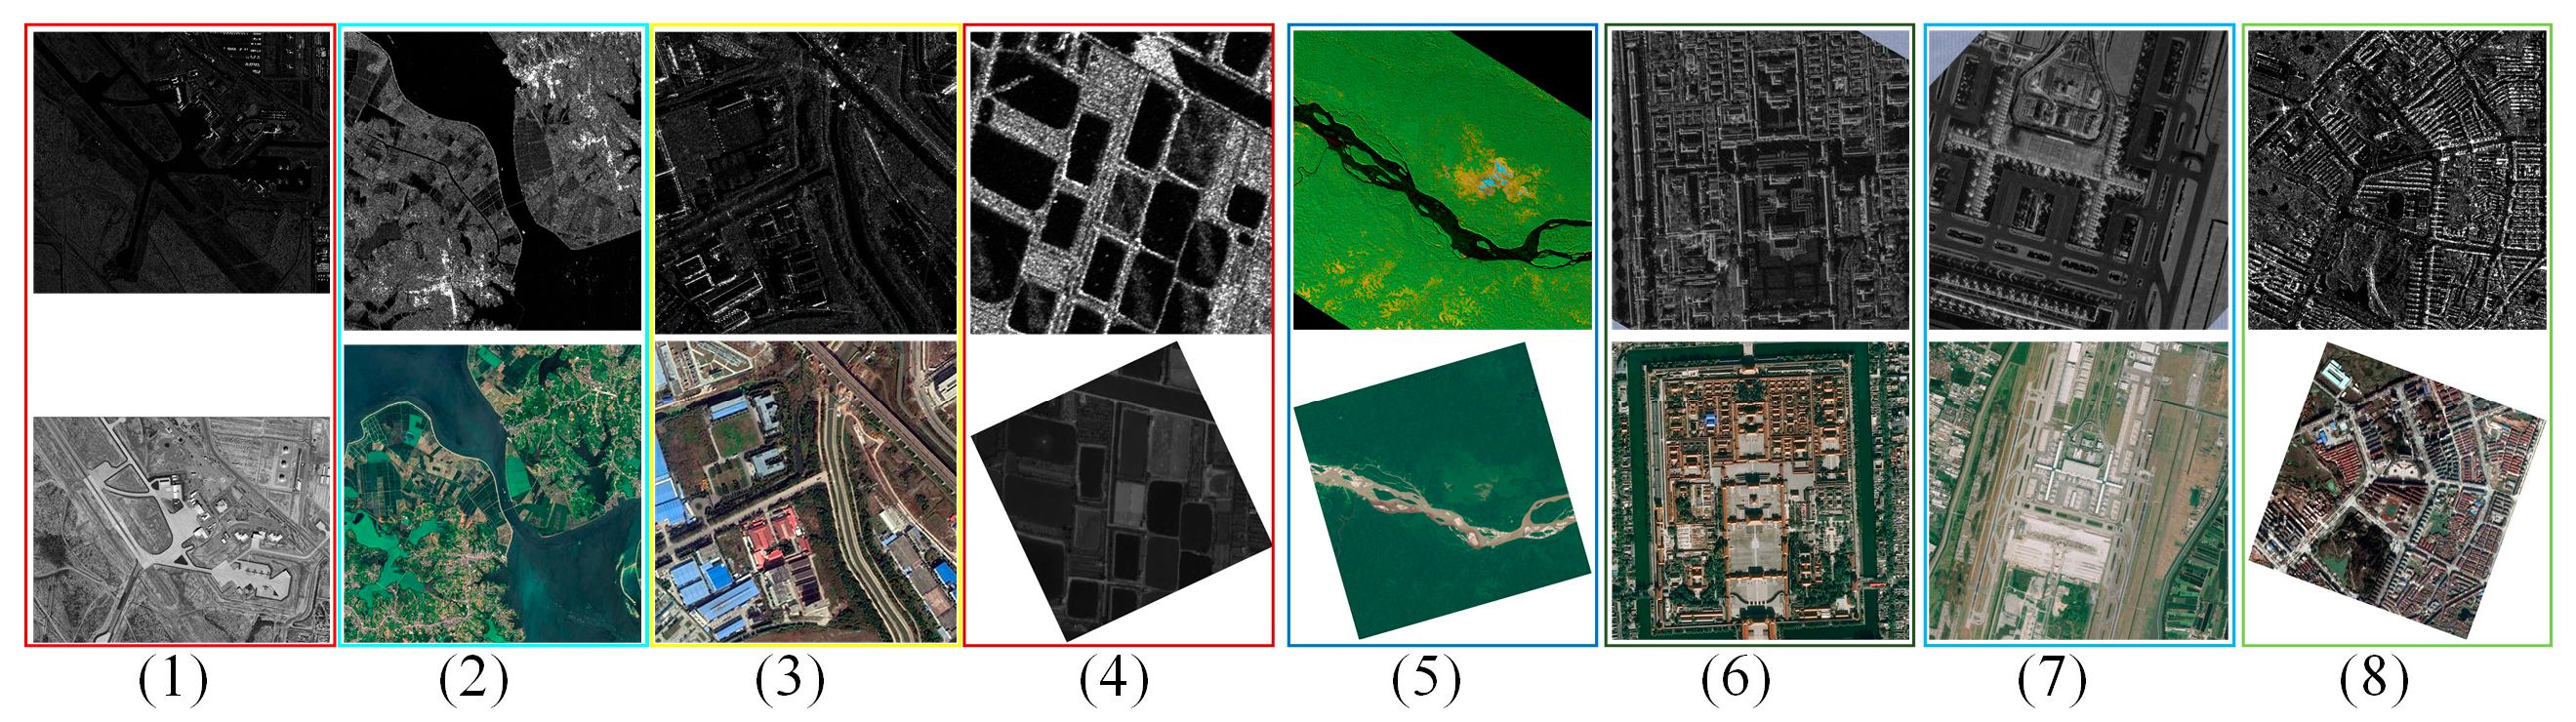
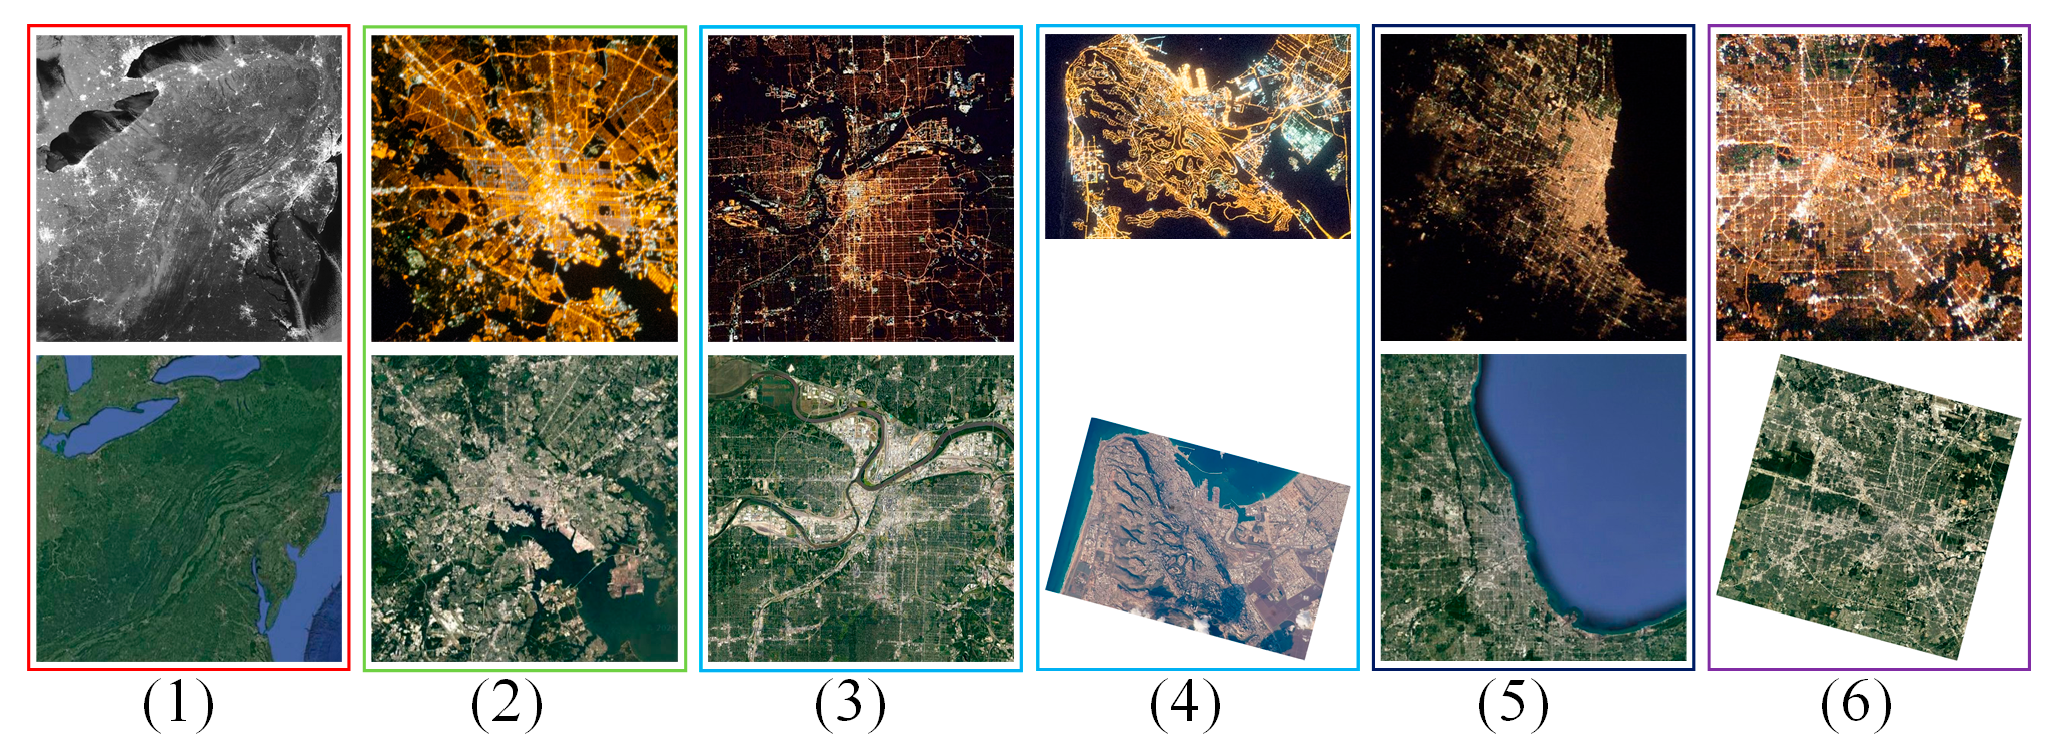
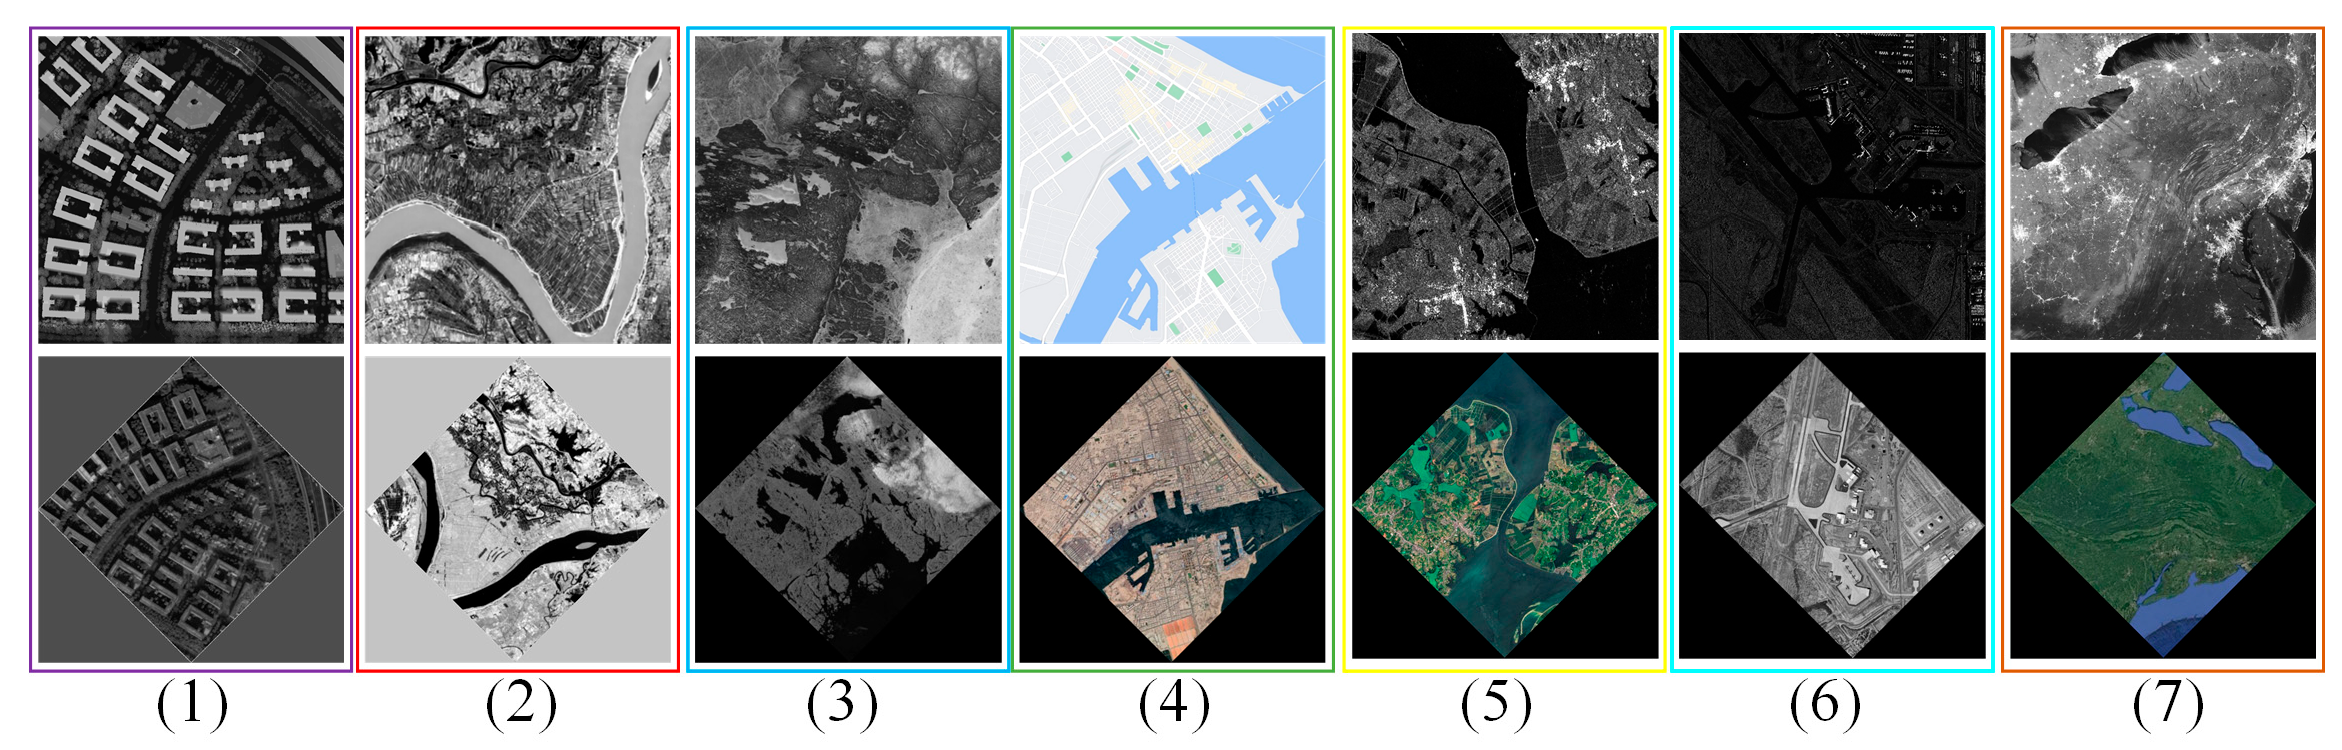
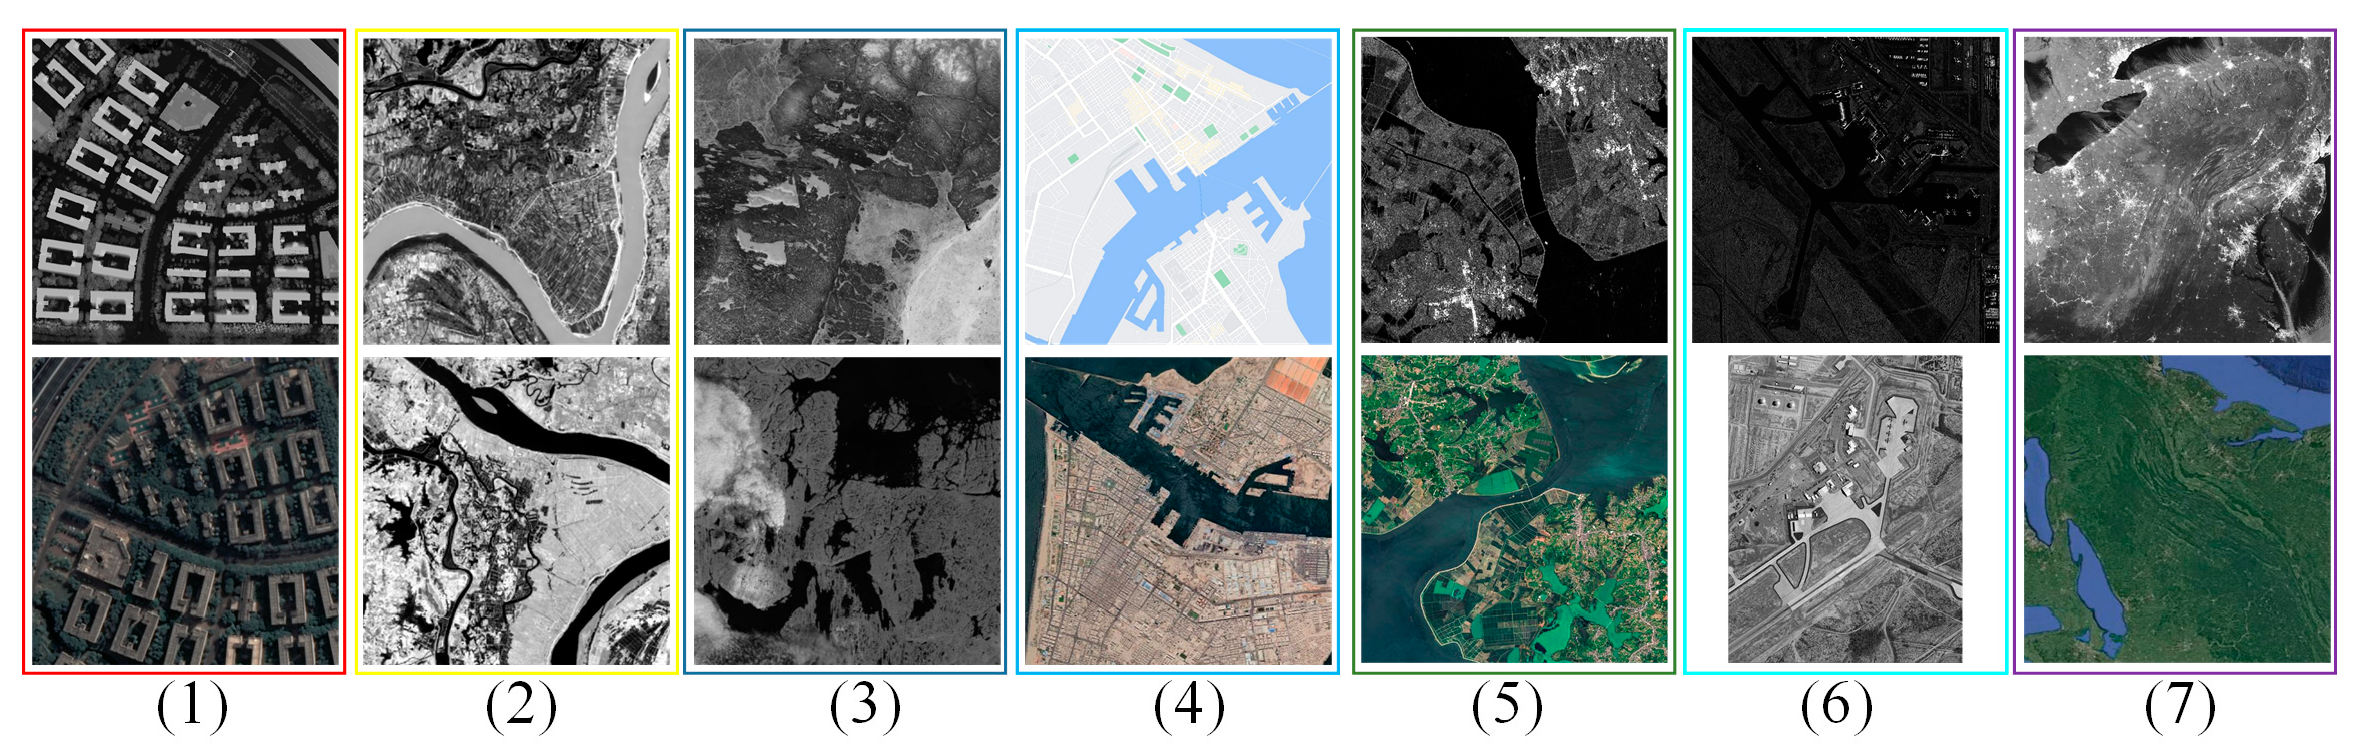
3.7. Multi-Modal Remote Sensing Datasets

To comprehensively evaluate the performance of the proposed method in comparison with several widely used approaches, we conducted image registration experiments on a multi-modal remote sensing dataset. As illustrated in Figure 7, the dataset comprises 58 image pairs encompassing diverse modality combinations, including depth–optical set, infrared–optical set, map–optical set, SAR–optical set, night–day set, and image rotation scenarios (45° and 90°). The dataset is sourced from Zhang et al. [12] and is summarized as follows:
  • Depth images were derived from airborne LiDAR data;
  • Infrared images were collected from airborne infrared sensors and the Landsat TM-5 satellite;
  • Map images were obtained from Google Maps;
  • SAR images were acquired from the GaoFen-3 (GF-3) satellite;
  • Night–day images originated from National Aeronautics and Space Administration (NASA)’s Suomi National Polar-orbiting Partnership (Suomi-NPP) satellite and National Oceanic and Atmospheric Administration (NOAA) satellites.
This diverse dataset provides a rigorous testbed for evaluating registration performance under challenging cross-modality and geometric transformation conditions. Each image pair ranges in size from 381 to 750 pixels and exhibits complex variations, including contrast changes, nonlinear radiation differences, and geometric distortions such as rotation, scale change, and displacement.
Overall, this dataset presents significant challenges for multi-modal image registration, providing a comprehensive testbed for evaluating both accuracy and robustness under diverse and complex conditions.

4. Results and Discussion

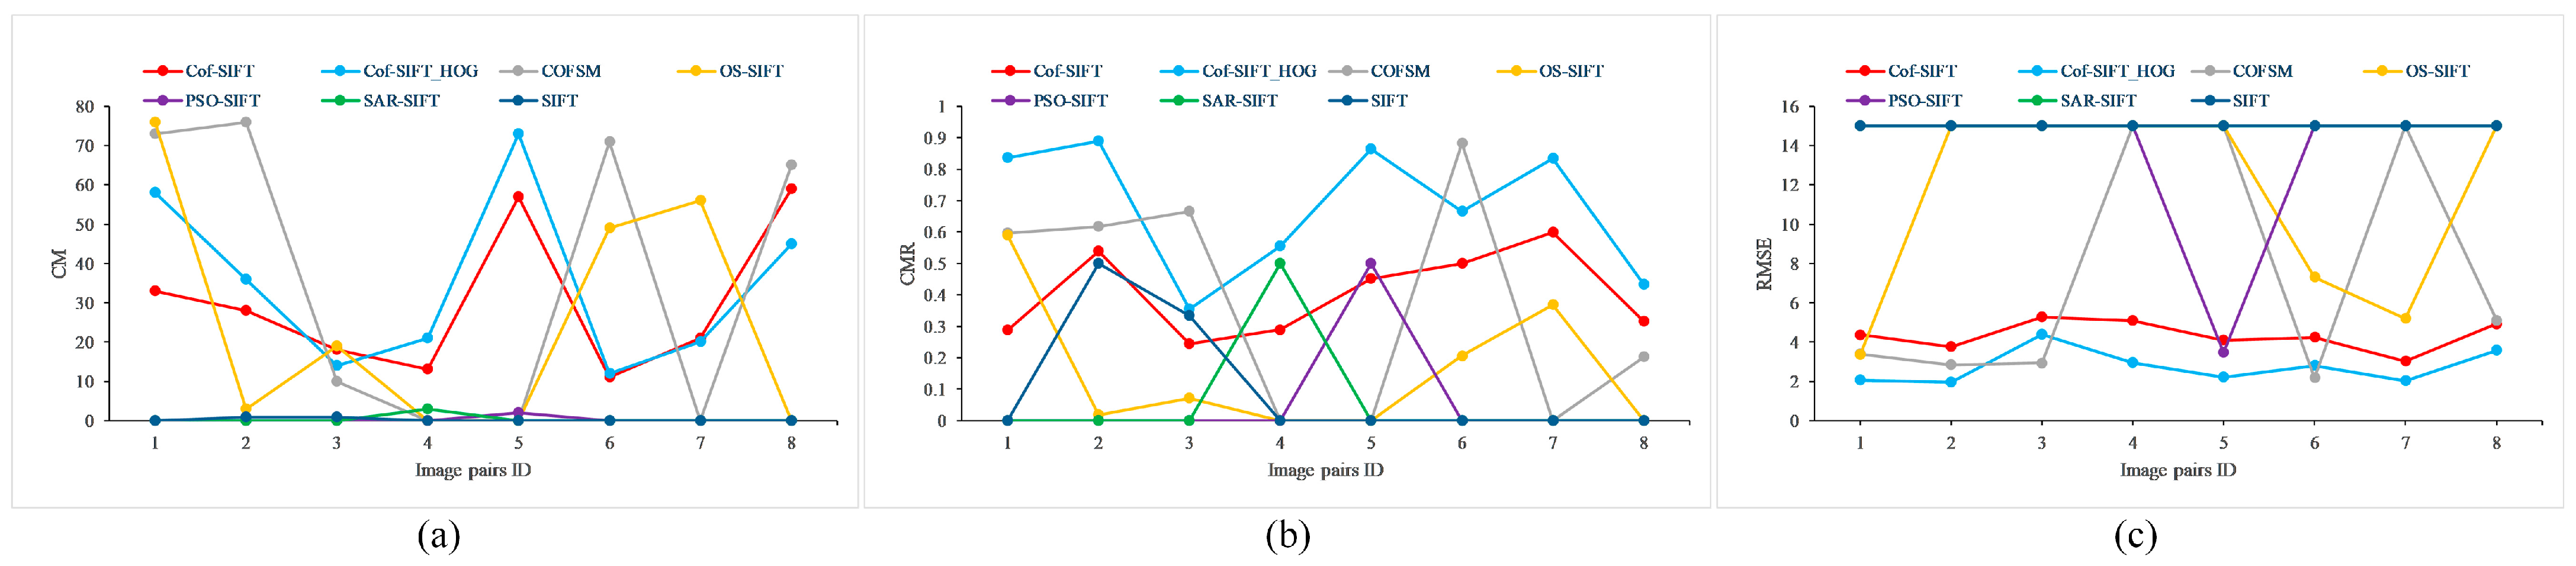
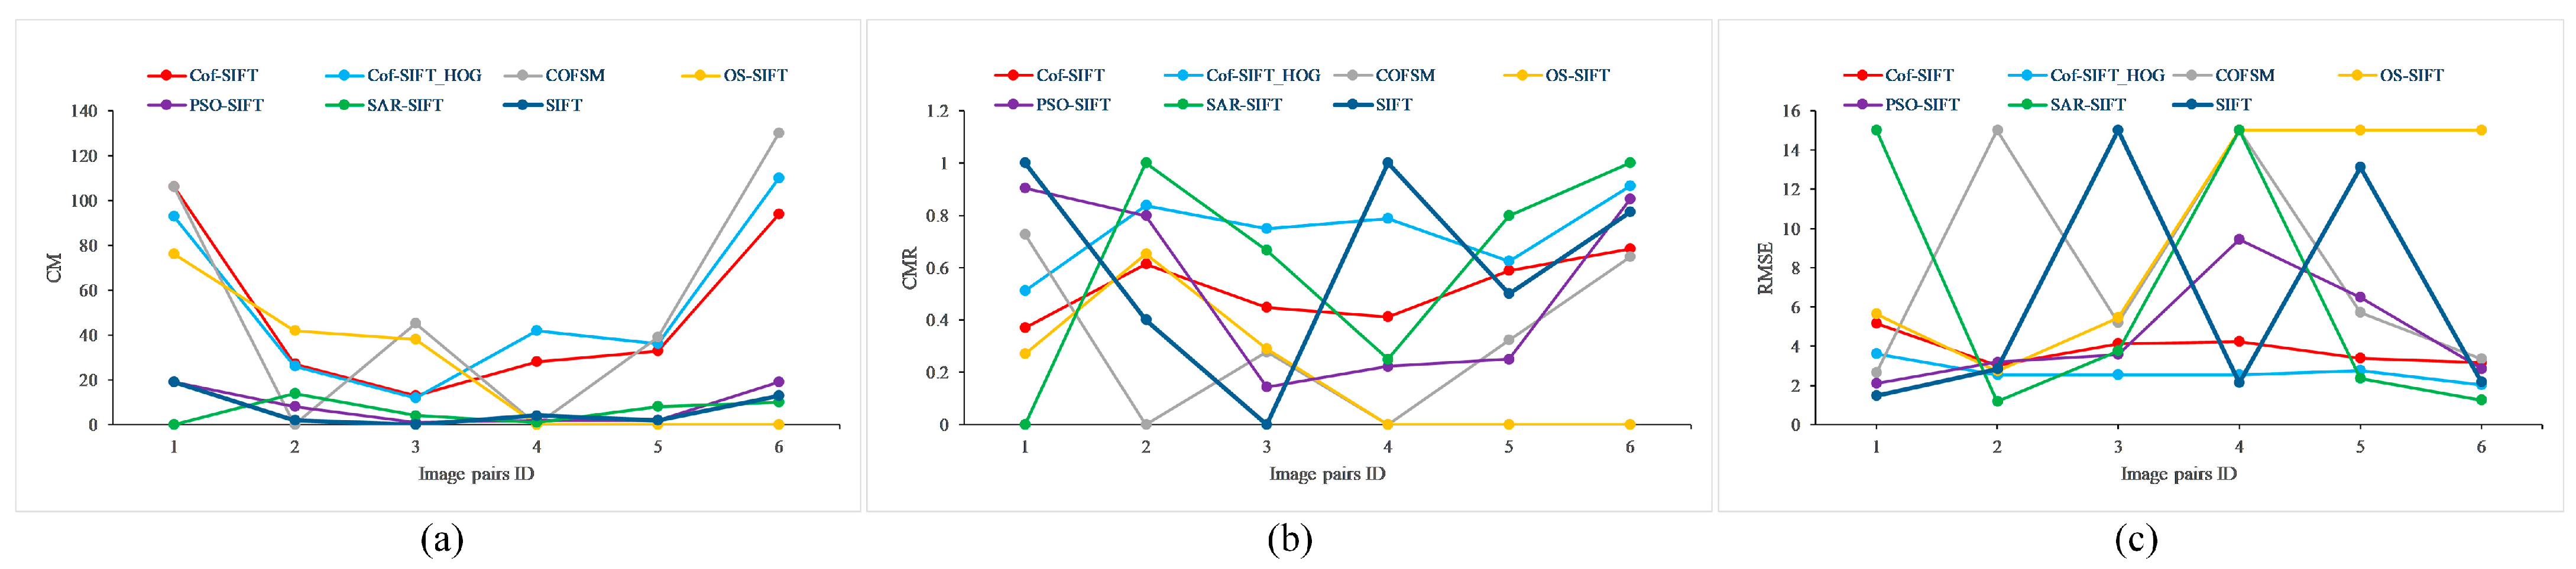
4.1. Evaluation Criterion

Root Mean Square Error (RMSE), Correct Match Rate (CMR), and Success Rate (SR) were adopted as the evaluation metrics in this paper. Specifically, the CMR and the RMSE evaluate the accuracy of the matching results. The ground-truth points for the RMSE calculation were manually annotated on the images to ensure reliability. Before calculating the CMR and the SR, the matching results were screened using RANSAC to filter out outliers.
The RMSE is defined in Equation (14):
R M S E = 1 N i = 1 N ( x i x ^ i ) 2 + i = 1 N ( y i y ^ i ) 2
where N denotes the number of ground-truth points; ( x i , y i ) represents the coordinates of the i-th ground-truth point; ( x ^ i , y ^ i ) is the coordinate converted by the transformation matrix calculated based on the image matching results. Notably, for each image pair, ground-truth correspondences were manually annotated and carefully verified.
The CMR (Correct Match Rate) is defined as the ratio of the number of correct matching points to the total number of matching points, as in Equation (15):
C M R = N c N M
where N c denotes the number of correctly matched points (NCMs) in the image matching results; N m indicates the total number of image matching results. In this paper, a match is considered correct if the Euclidean distance between the matched feature points and the ground-truth points is less than 3.
The SR represents the ratio of successful image matches achieved by the image matching method in the datasets. It is calculated based on the following criteria for a successful match: (1) the NCM should be sufficient to solve the geometric transformation model and contain at least one redundant observation, and (2) the CMR should exceed 20% [39]. The SR can be calculated according to Equations (16) and (17):
I ( p i ) = 1 ,   N C M ( p i ) N min   &   C M R 0.2 0 ,   e l s e
S R = i I ( p i ) M
In Equation (16), I ( p i ) denotes a logic value. If image matching is successful, the value is 1; otherwise, it is 0. N min is set to 4, which represents the minimum number of correct matching points for calculating the affine transformation model; M denotes the total number of image pairs used in the experiments.

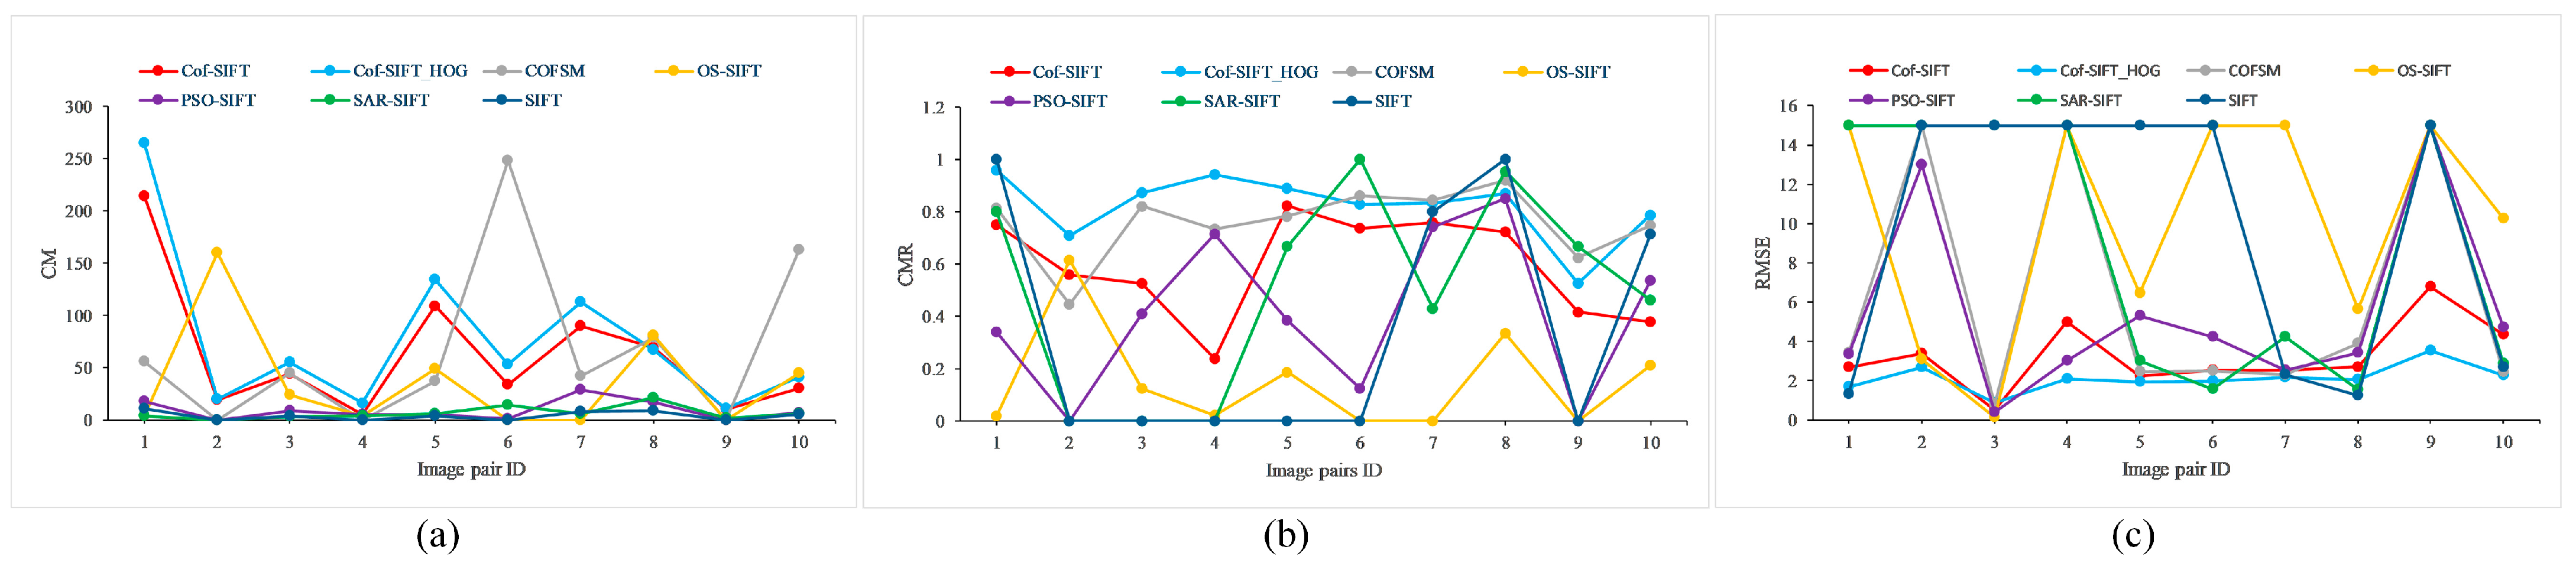
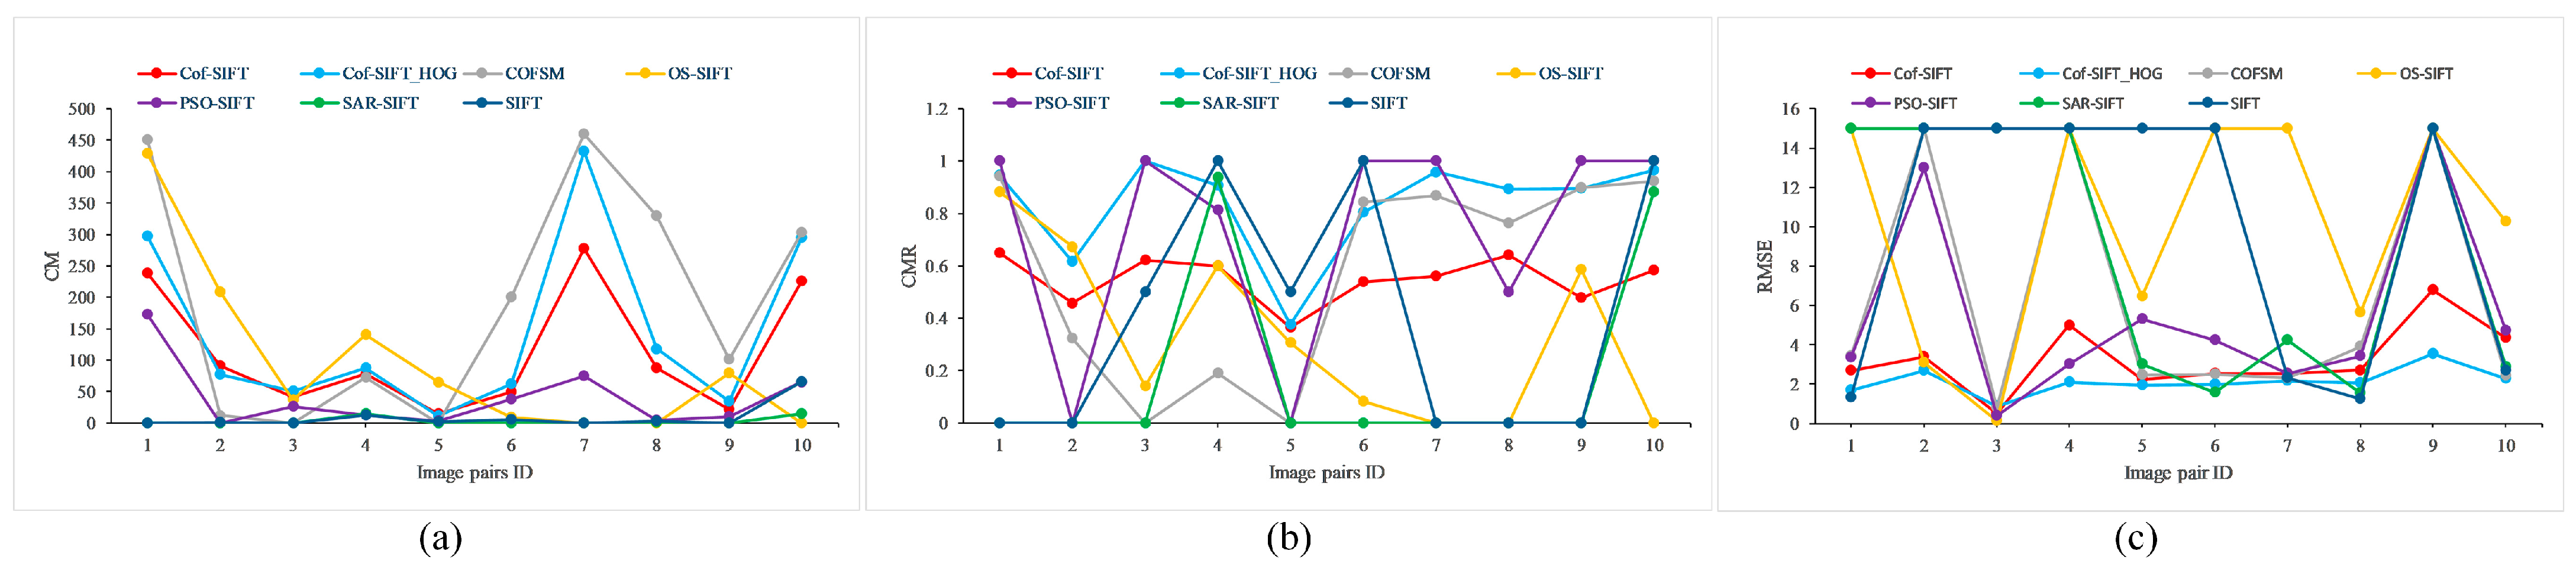
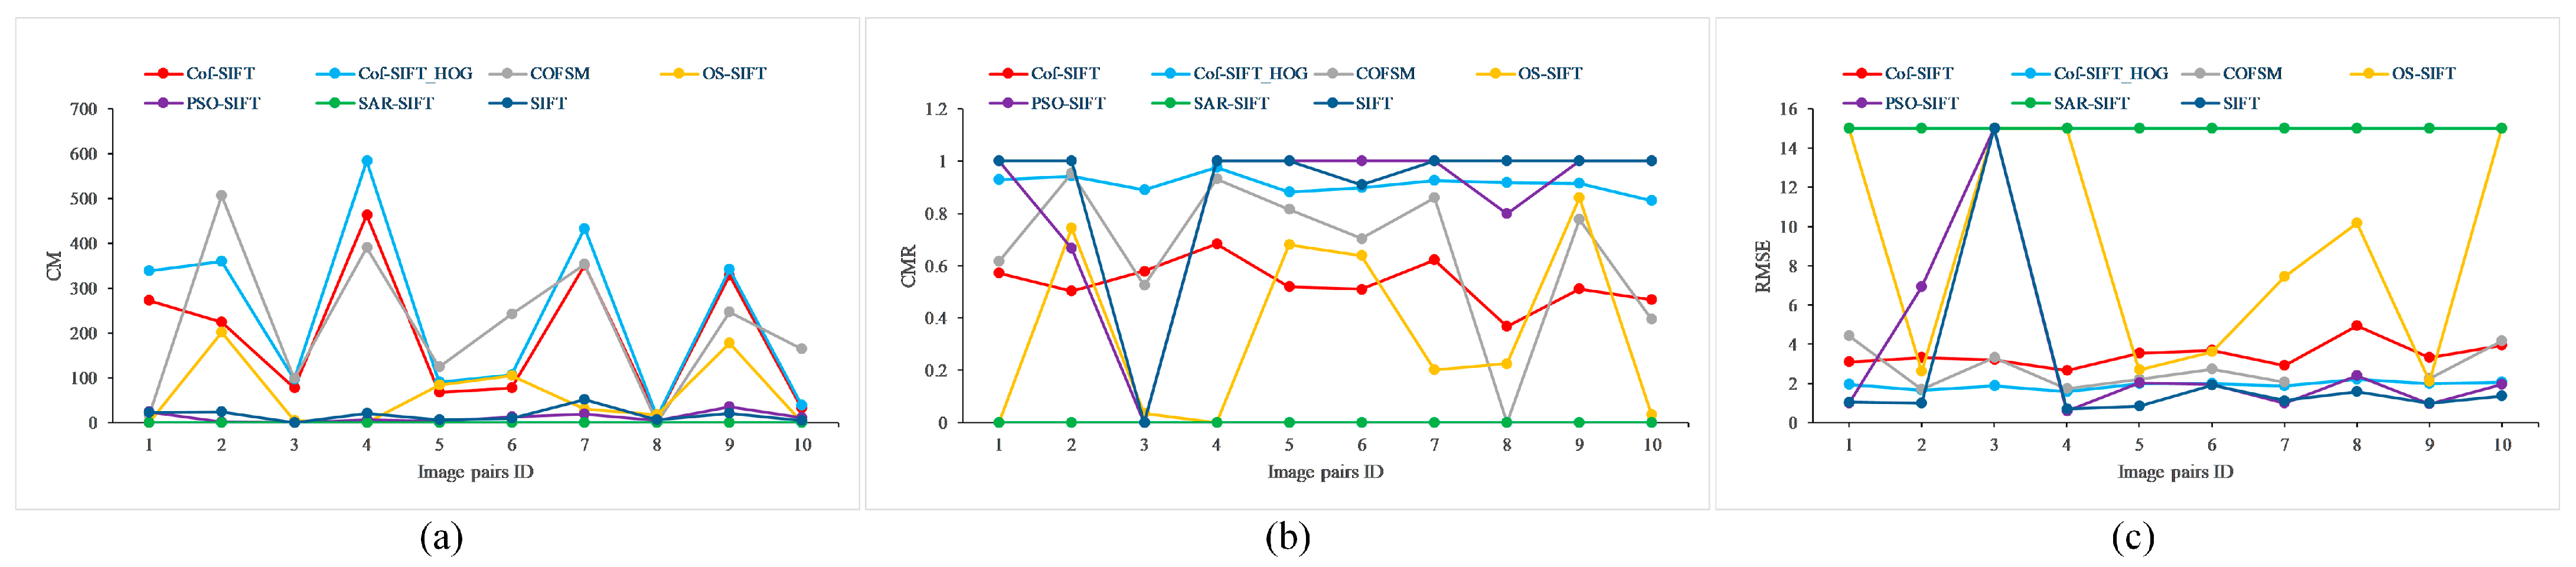
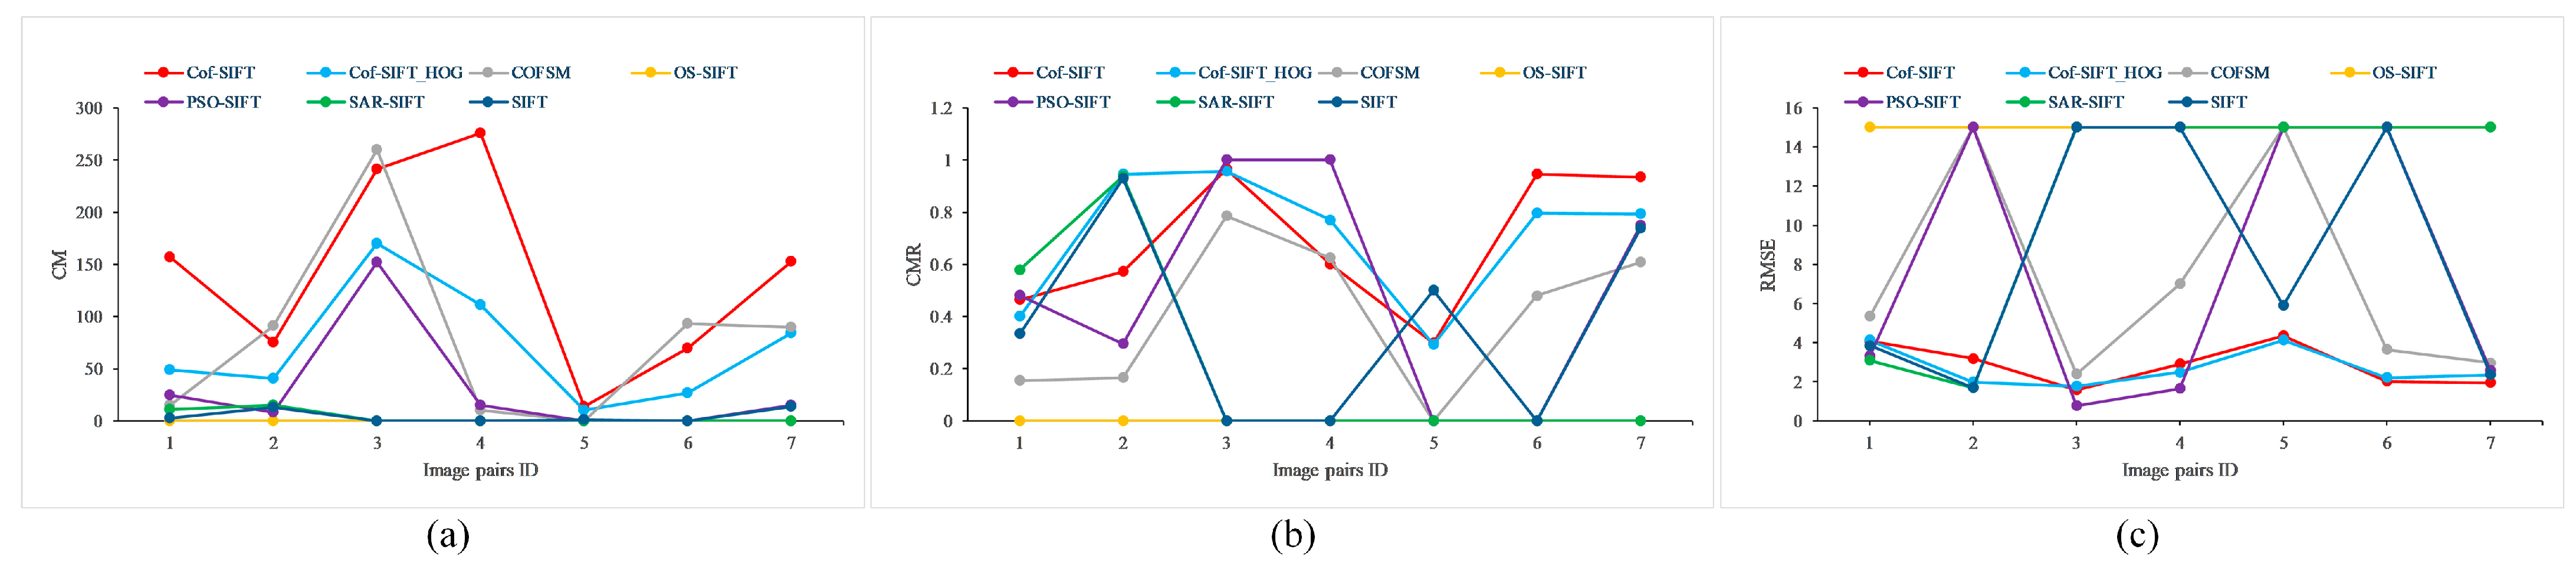
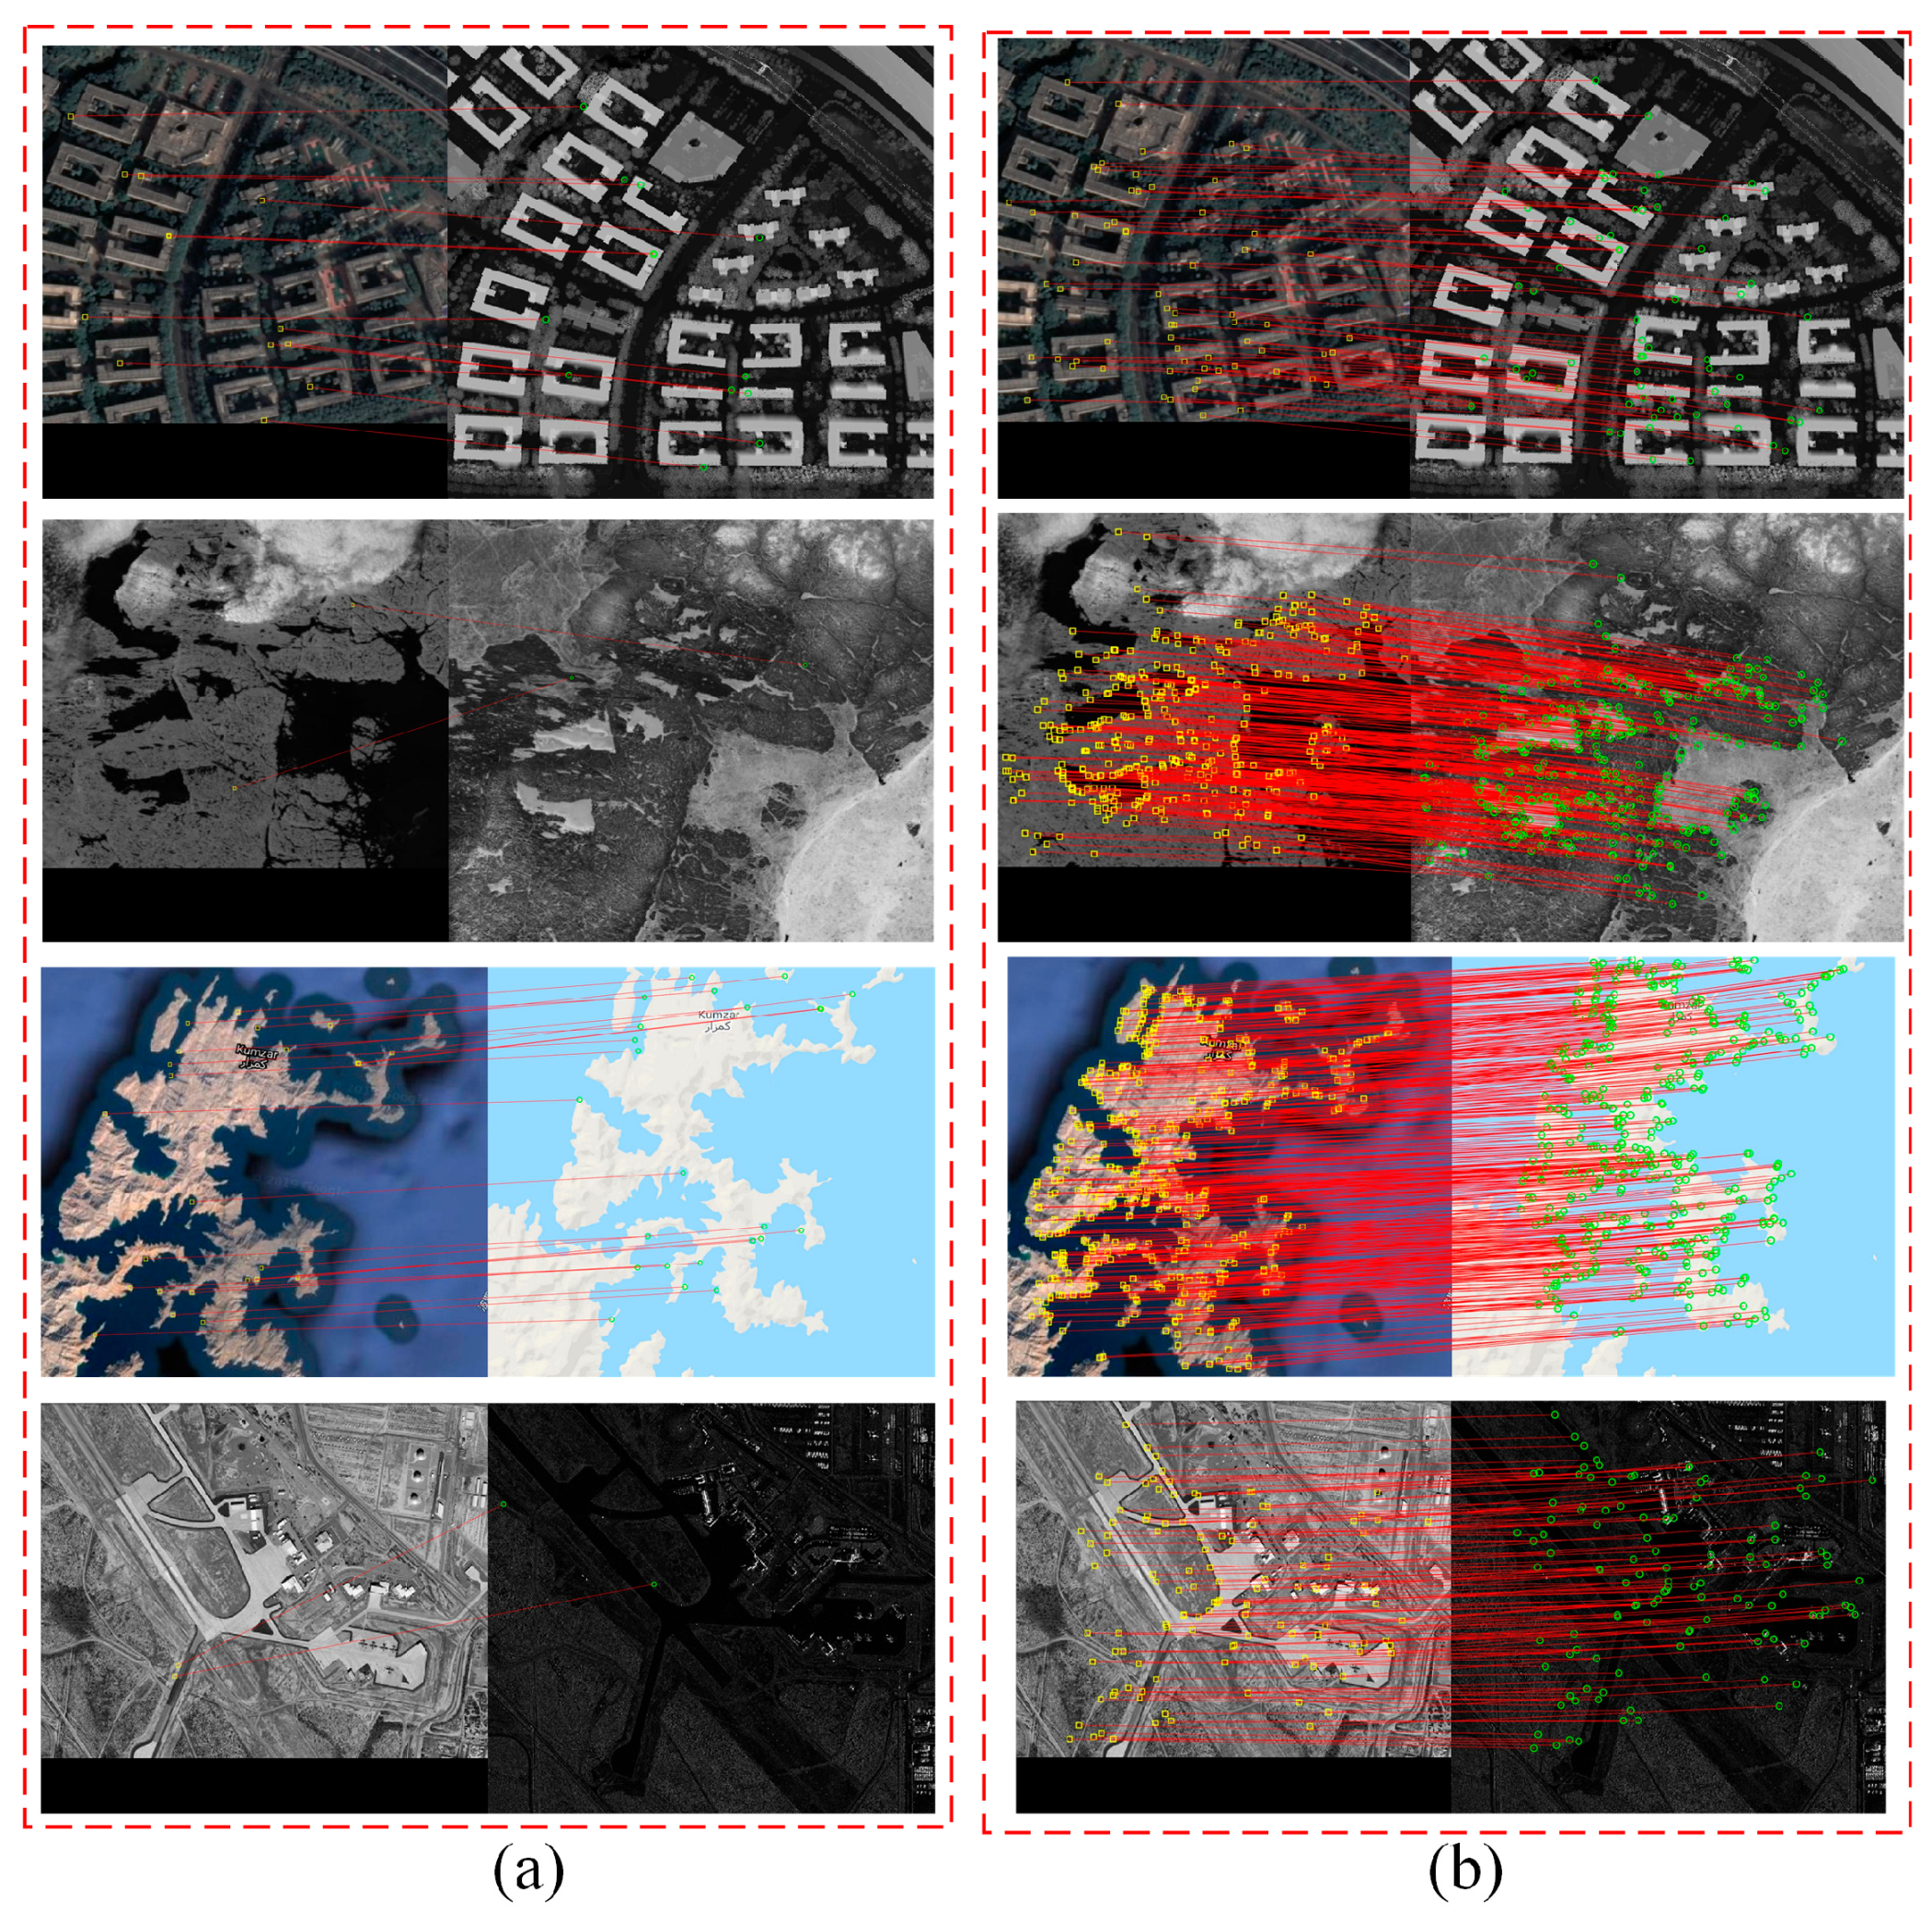
4.2. Image Matching Results on Multi-Modal Image Datasets

To evaluate the performance and robustness of our proposed methods Cof-SIFT and Cof-SIFT_HOG, as well as SIFT and SIFT variants OS-SIFT, SAR-SIFT, PSO-SIFT, and COFSM, we conducted image matching experiments on multi-modal image datasets. The depth–optical dataset shown in Figure 8 contains 10 image pairs covering urban areas with tall buildings. The displacement of these buildings leads to prominent local geometric distortions. Furthermore, the LiDAR intensity images suffer from considerable noise, making feature matching more challenging. Each pair also exhibits slight differences in rotation and scale, adding further complexity to the registration task. An image matching experiment was conducted on this dataset, and the detailed experimental results are shown in Figure 9. Figure 9 presents the quantitative evaluation results of various feature-based matching methods on depth–optical image pairs from the multi-modal remote sensing dataset. The horizontal axis of Figure 9 denotes the index of image pairs, while the vertical axis indicates the values of different evaluation metrics, including CM, CMR, and RMSE. The compared methods include the proposed Cof-SIFT and Cof-SIFT_HOG, as well as benchmark SIFT-based algorithms: SIFT, OS-SIFT, SAR-SIFT, PSO-SIFT, and COFSM. The evaluation was conducted in terms of three key metrics, namely the CM, CMR, and RMSE of the estimated affine transformation.
Figure 9a depicts the number of correct matching points across ten image pairs. It is evident that the proposed Cof-SIFT_HOG achieves the highest number of CMs on almost all image pairs and outperforms all baseline methods overall. Cof-SIFT also demonstrates strong performance, second only to Cof-SIFT_HOG. Among the comparative methods, COFSM performs well with image pairs 6 and 10, while the traditional SIFT, PSO-SIFT, and SAR-SIFT yield relatively lower matching accuracy across most image pairs.
Figure 9b illustrates the CMR, which reflects the proportion of correctly matched points that conform to the underlying geometric transformation. Cof-SIFT_HOG achieves the highest CMR with the majority of image pairs, highlighting its robustness and precision. Although COFSM shows competitive CMR values in some instances, its performance significantly drops with image pairs 2, 4, and 9. Cof-SIFT maintains a stable performance across all test cases, further validating its reliability.
Figure 9c presents the RMSE of the affine transformation, which quantifies the geometric alignment accuracy. To enhance visualization clarity, RMSE values are capped at 15. The results show that Cof-SIFT_HOG obtains the lowest RMSE in most cases, followed by Cof-SIFT. COFSM suffers from a dramatic increase in RMSE for image pairs with low CMR and CM, notably in pairs 2, 4, and 9. In short, the proposed Cof-SIFT and Cof-SIFT_HOG show better performance than other evaluated methods, followed by COFSM, while SIFT and other methods are not very robust to this image matching scenario.
As illustrated in the visible light–infrared set (Figure 10), the fifth image pair features a building and involves both scale and rotation variations. The other image pairs primarily depict natural outdoor scenes, including rivers and mountains, which often lack strong geometric structures. Combined with the presence of scale and rotational transformations, these factors make the registration task particularly challenging for conventional matching algorithms. The image matching results on the infrared–optical set are shown in Figure 11, using the same axis conventions as in Figure 9.
As illustrated in Figure 11a, COFSM achieves the highest number of CMs with image pairs 1, 6, 7, and 8. However, the proposed methods Cof-SIFT and Cof-SIFT_HOG outperform COFSM with image pairs 2, 3, and 4. OS-SIFT also performs competitively, particularly with image pairs 1, 2, 4, 5, and 9. SIFT and SAR-SIFT exhibit the lowest CMs in almost all image pairs.
In Figure 11b, Cof-SIFT_HOG achieves the highest CMR with almost all image pairs. COFSM demonstrates high CMR values with image pairs 1, 6, 7, 8, 9, and 10, while OS-SIFT also shows relatively strong performance with image pairs 1, 2, 4, 5, and 9. PSO-SIFT maintains competitive CMR values in most cases, with the exception of image pairs 2 and 5, where it exhibits performance degradation. SIFT only obtains better CMR values with image pairs 3, 4, 5, 6, and 10. SAR-SIFT still achieves the worst CMR value.
Figure 11c shows that our Cof-SIFT and Cof-SIFT_HOG methods generally show better performance (lower RMSE) than other evaluated methods across most image pairs. Notably, while COFSM achieves a similar CM to Cof-SIFT and Cof-SIFT_HOG with image pair 4 (as seen in Figure 11a), its low CMR (below 0.2, as shown in Figure 11b) results in a high RMSE of 14.5 (Figure 11c). COFSM’s RMSE performance is comparable to that of Cof-SIFT with image pairs 6 to 10. In addition, although SIFT achieves the highest correct match rate (CMR) with image pairs 4 and 6, its number of correct matches (CMs) is the lowest for these pairs, which consequently results in a substantially higher RMSE, demonstrating that SIFT is not suitable for infrared–optical image matching.
As shown in Figure 12, the map–optical set contains 10 image pairs. Among them, the first, third, sixth, and eighth pairs correspond to urban areas with rich structural features, while the remaining pairs depict regions with weaker structural characteristics, such as islands, coastlines, and rivers. Moreover, the intensity details between the visible light images and the map data differ significantly. The texture information in the maps is considerably sparser than that in the optical images, and the maps also include labeled text. These factors make it highly challenging to detect accurate correspondences between the two modalities. Figure 13 presents the image matching results in the map–optical set, using the same axis conventions as in Figure 9.
As depicted in Figure 13a, the proposed Cof-SIFT, Cof-SIFT_HOG, and COFSM methods achieve similarly high numbers of CMs, indicating strong performance in feature correspondence. In contrast, SAR-SIFT, PSO-SIFT, and SIFT show similar CMs but overall weaker results, with OS-SIFT’s CMs slightly outperforming them, representing the lowest performing group among the evaluated methods.
In terms of the CMR, as shown in Figure 13b, SIFT achieves the highest values across most image pairs, except for image pairs 3 and 6. In these cases, the proposed Cof-SIFT_HOG method surpasses SIFT, and it maintains a comparable CMR to SIFT with the remaining image pairs, demonstrating its stability and reliability. COFSM achieves a relatively high CMR overall, but experiences notable degradation with image pairs 3, 8, and 10. The proposed Cof-SIFT method consistently outperforms OS-SIFT and SAR-SIFT across the tested image pairs, further validating its robustness in multi-modal scenarios.
Figure 13c illustrates the RMSE results. SIFT achieves the lowest RMSE values for most image pairs except for pair 3, where Cof-SIFT_HOG obtains the best performance. The RMSE of Cof-SIFT_HOG closely matches that of SIFT in other cases as well. While COFSM also exhibits competitive RMSE performance, its failure to establish correct matches with image pair 8 results in a performance gap. Cof-SIFT maintains a relatively stable RMSE across all pairs, though its accuracy is slightly inferior to that of Cof-SIFT_HOG. The above comparison indicates that SAR-SIFT and OS-SIFT perform poorly on map–optical image pairs, whereas the other methods demonstrate better adaptability to map–optical scenes, exhibiting superior performance and robustness.
The SAR–optical dataset is illustrated in Figure 14. The fifth image pair depicts a field scene with weak structural features, whereas the remaining image pairs cover scenes rich in structural information, such as buildings and urban areas. However, these image pairs exhibit complex geometric transformations and significant contrast differences. For instance, the first image pair shows a substantial contrast difference between the two modalities. The fourth and eighth pairs are affected not only by large contrast variations but also by rotation and scaling transformations. The sixth and seventh image pairs exhibit noticeable scaling transformations. Additionally, the presence of strong speckle noise in SAR images further increases the difficulty of accurate image matching. These factors collectively make the visible light–SAR dataset one of the most challenging scenarios for multi-modal image registration. Image matching results for the SAR–optical image pairs are illustrated in Figure 15, using the same axis conventions as in Figure 9.
As shown in Figure 15a, all evaluated methods exhibit considerable fluctuations in the CM metric across different image pairs. Among them, SIFT, PSO-SIFT, and SAR-SIFT consistently yield the lowest CM values, indicating poor robustness in this challenging multi-modal context. COFSM achieves the highest CM value with image pairs 2, 6, and 8. In contrast, the proposed Cof-SIFT and Cof-SIFT_HOG consistently demonstrate superior performance across all image pairs, with particularly strong results observed for image pair 5.
The CMR results in Figure 15b further validate the stability of the proposed methods. Both Cof-SIFT and Cof-SIFT_HOG maintain stable CMR values across all image pairs. Although COFSM achieves relatively good CMR values in some cases, it fails completely with image pairs 4, 5, and 7, resulting in a CMR of zero for these pairs. For the remaining image pairs, COFSM still outperforms SIFT, OS-SIFT, PSO-SIFT, and SAR-SIFT. It is worth noting that while SAR-SIFT was originally designed for SAR-to-SAR registration, its performance degrades significantly when applied to SAR–optical image pairs, highlighting its limited generalizability.
As depicted in Figure 15c, the proposed Cof-SIFT and Cof-SIFT_HOG achieve the lowest RMSE across most image pairs, indicating high geometric accuracy in the registration results. In contrast, SIFT exhibits the highest RMSE values throughout, reflecting its unsuitability for SAR–optical image registration. COFSM performs competitively in terms of RMSE for image pairs 1, 2, 3, 6, and 8, but its failure with other pairs limits its overall effectiveness. From the above description, it can be seen that Cof-SIFT and Cof-SIFT_HOG show better performance and robustness than other methods in the SAR–optical image matching scenario, which also proves the effectiveness of the method proposed in this paper.
The night–day set (Figure 16) comprises six image pairs. The first and fifth pairs depict natural outdoor scenes such as seashores, which contain weak structural features. The remaining pairs primarily cover urban areas and regions with high nighttime illumination, offering comparatively richer structural information. However, the structural representations in day and night conditions are not entirely consistent. For example, in daytime images, roads are clearly visible, while in nighttime images, only the illumination from streetlights along the roads may be captured. Such modality-specific representations complicate the extraction of common features and increase the difficulty of establishing reliable correspondences across image pairs. The image matching results for the night–day image pairs are presented in Figure 17, using the same axis conventions as in Figure 9.
As illustrated in Figure 17a, traditional methods such as SIFT, SAR-SIFT, and PSO-SIFT consistently yield low CM values, indicating limited effectiveness under significant illumination variations. COFSM fails to achieve successful matching with image pairs 2 and 4, while OS-SIFT is unable to complete matching with image pairs 4, 5, and 6. In contrast, the proposed Cof-SIFT and Cof-SIFT_HOG methods successfully perform image matching across all pairs, demonstrating robustness and reliability in night-day scenarios.
The CMR results shown in Figure 17b further highlight the advantage of the proposed methods. Both Cof-SIFT and Cof-SIFT_HOG outperform all baseline methods across most image pairs. Notably, SAR-SIFT, despite yielding low CM values for image pairs 2, 5, and 6, achieves the highest CMR in those image pairs. However, COFSM exhibits substantial fluctuation in the CMR, and overall performs worse than the proposed methods.
As shown in Figure 17c, the proposed Cof-SIFT and Cof-SIFT_HOG continue to achieve the lowest RMSE across most image pairs, indicating higher geometric registration accuracy. PSO-SIFT ranks closely behind, yet still falls short of the consistency and accuracy demonstrated by Cof-SIFT and Cof-SIFT_HOG. Other methods, including SAR-SIFT, COFSM, SIFT, and OS-SIFT, yield higher RMSE values, reflecting reduced registration precision under night–day modality discrepancies.
To assess the robustness of the proposed approach under rotational transformations, we conducted image matching experiments on image pairs subjected to 45-degree and 90-degree rotations. The image rotation datasets are illustrated in Figure 18 and Figure 19, each comprising seven multi-modal image pairs. The first, fourth, and sixth pairs contain prominent structural features, while the remaining pairs depict natural scenes with relatively weak structural information. In each image pair, one of the images is artificially rotated by either 45° or 90°, introducing additional challenges for rotation-invariant image matching. These datasets are designed to evaluate the robustness of matching algorithms under significant rotational transformations across different modalities. Figure 20 and Figure 21 show the image matching results for the image pairs rotated 45 degrees and 90 degrees, respectively, using the same axis conventions as in Figure 9.
As illustrated in Figure 20a, COFSM achieves the highest number of CMs with image pairs 3, 5, and 7, but exhibits the lowest CMR values with image pairs 4 and 6, indicating inconsistency in its performance. Cof-SIFT records the highest CM value with image pairs 1 and 4, and demonstrates comparable performance to COFSM with image pairs 3 and 7. Cof-SIFT_HOG closely follows Cof-SIFT in CM values across all pairs. In contrast, traditional methods such as SIFT, SAR-SIFT, and OS-SIFT fail to deliver satisfactory CMR in all evaluated pairs.
As shown in Figure 20b, the CMR values for all methods exhibit noticeable fluctuations across image pairs, reflecting the challenges posed by rotational changes. Nevertheless, Cof-SIFT and Cof-SIFT_HOG consistently outperform the baseline methods in terms of the CMR, with COFSM ranking closely behind.
The RMSE results in Figure 20c further validate the effectiveness of the proposed methods. Both Cof-SIFT and Cof-SIFT_HOG achieve the lowest RMSE in nearly all image pairs, highlighting their superior geometric accuracy and robustness under rotational transformations.
Figure 21 presents the image matching results for image pairs subjected to 90-degree rotation. As observed in the figure, the proposed Cof-SIFT and Cof-SIFT_HOG methods consistently outperform all other evaluated approaches across most image pairs in terms of the CM, CMR, and RMSE. Although the performance of COFSM is inferior to that of Cof-SIFT and Cof-SIFT_HOG, it still surpasses traditional methods such as SIFT, OS-SIFT, SAR-SIFT, and PSO-SIFT, confirming its relative effectiveness. These results highlight the robustness and rotation invariance of the proposed method under image rotation changes.
Table 1 presents the average values of four key evaluation metrics: SR, average number of CM, average CMR, and average RMSE. Based on the comprehensive image matching experiments described earlier, it is evident that Cof-SIFT, Cof-SIFT_HOG, and COFSM consistently outperform the other evaluated methods in terms of both performance and robustness. Accordingly, Table 1 focuses on a comparative analysis of these three methods to highlight their relative strengths.
As shown in the table, the proposed Cof-SIFT and Cof-SIFT_HOG methods successfully complete image matching across all image pairs, achieving a 100% SR. COFSM ranks second with an SR of 72%. Regarding the average number of correct matches (CMs), Cof-SIFT_HOG and COFSM attain comparably high values, reflecting strong feature matching capabilities.
In terms of the average CMR, Cof-SIFT_HOG achieves the highest performance, followed by COFSM, while Cof-SIFT ranks third with a CMR of 55%. With respect to RMSE, Cof-SIFT_HOG again exhibits the best performance, yielding the lowest average error. COFSM follows closely, whereas Cof-SIFT has the highest RMSE among the three. It is worth noting that Cof-SIFT_HOG improves the average RMSE from 3.54 (achieved by Cof-SIFT) to 2.37 through refined localization of corresponding points.
In summary, on the multi-modal dataset, Cof-SIFT-HOG shows better overall performance and robustness than the other methods (including Cof-SIFT, SIFT, OS-SIFT, SAR-SIFT, PSO-SIFT, and COFSM), among which Cof-SIFT ranks second. Note that Cof-SIFT-HOG outperforms Cof-SIFT, mainly due to its improvement in corresponding point positioning based on HOG feature similarity.

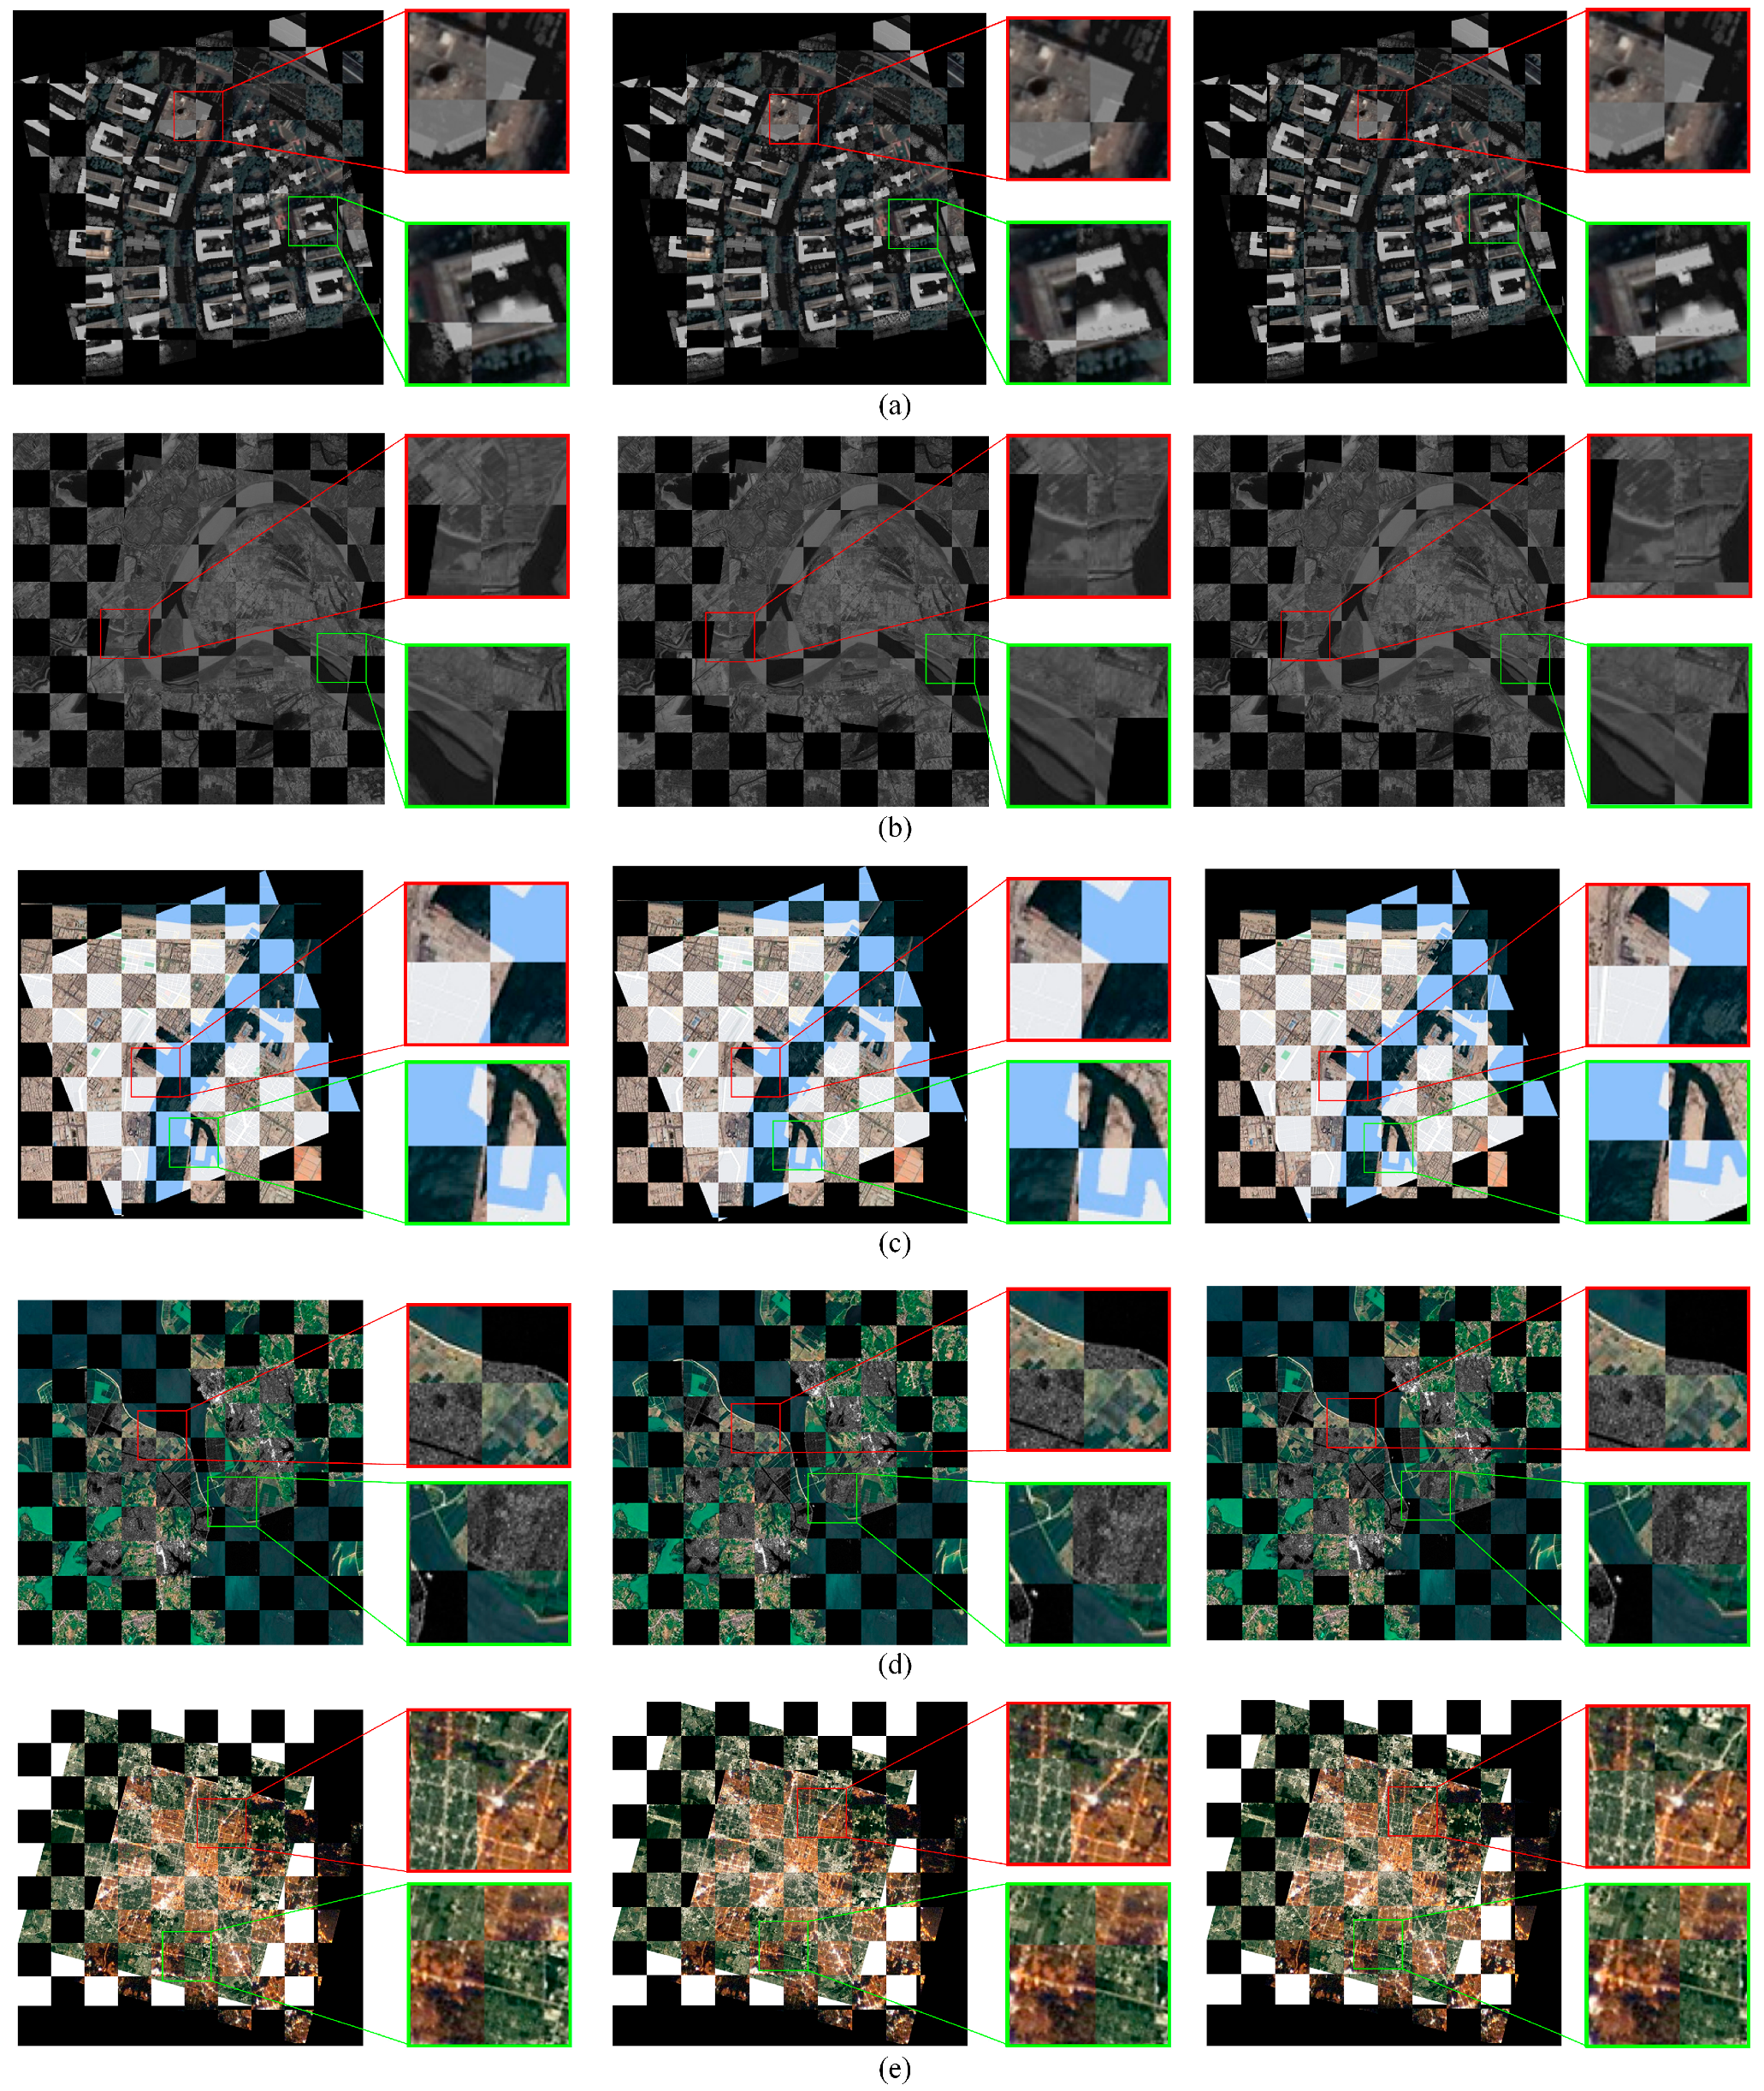
4.3. Checkerboard Mosaiced Images on Partial Multi-Modal Image Pairs

To further validate the effectiveness of the proposed methods, we applied Cof-SIFT, Cof-SIFT_HOG, and COFSM to generate checkerboard mosaics. Due to space limitations, partial mosaicking results are presented in Figure 22 and Figure 23. In both figures, the left, middle, and right columns correspond to the results produced by Cof-SIFT, Cof-SIFT_HOG, and COFSM, respectively.
Figure 23 shows the alignment results of the same image pair after rotating at different angles. As shown in Figure 23a, COFSM shows more serious misalignment than Cof-SIFT, while Cof-SIFT_HOG continues to maintain excellent alignment quality. Specifically, the RMSE of COFSM reaches 7.0, while the RMSE of Cof-SIFT_HOG is only 2.4. In the case of 90-degree rotation shown in Figure 23b, Cof-SIFT and Cof-SIFT_HOG achieve comparable alignment results, and both are significantly better than COFSM. It is worth noting that although the RMSE of COFSM (1.2) is relatively small compared to Cof-SIFT (3.1) and Cof-SIFT_HOG (2.0) in this case, its actual registration quality is poor, mainly because its number of correct matches is extremely low (CM = 17), while Cof-SIFT and Cof-SIFT_HOG achieve 225 and 262 correct matches, respectively.
Overall, the results demonstrate that Cof-SIFT_HOG substantially enhances alignment accuracy compared to Cof-SIFT, while COFSM generally performs similarly to or worse than Cof-SIFT. These findings further confirm that the HOG-based location refinement strategy employed in Cof-SIFT_HOG significantly improves registration precision, particularly under challenging conditions involving large rotations and complex modality differences.

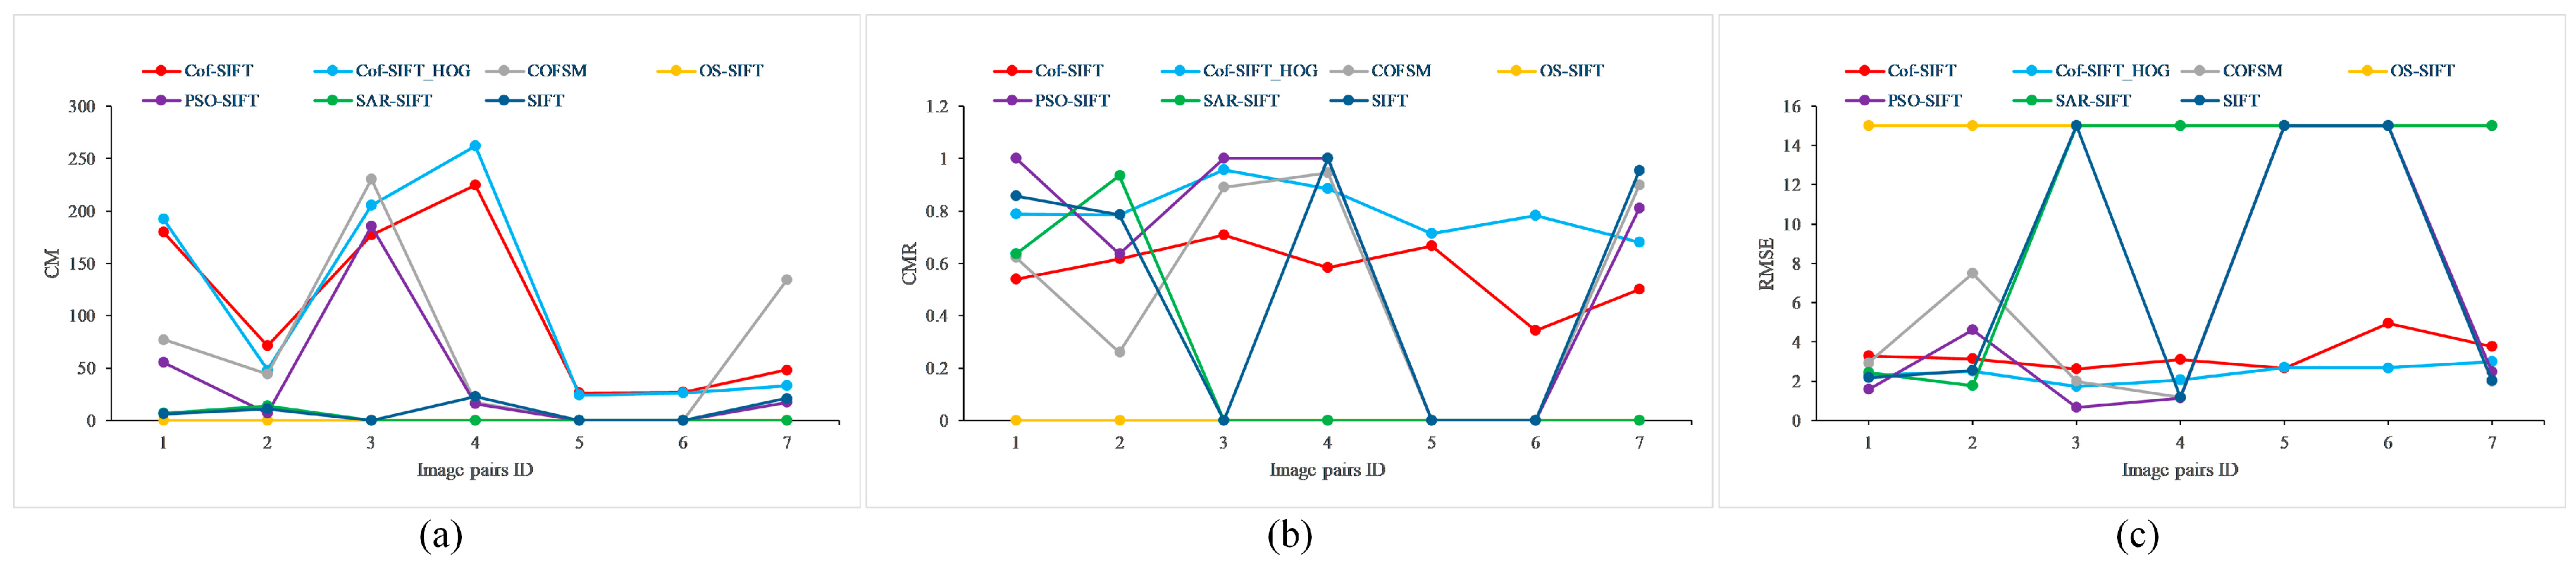
4.4. Evaluation of Image Pairs with Skew Transformations

To evaluate the robustness of the proposed method under geometric distortions, we conducted image matching experiments on skew-transformed image pairs. Specifically, one image in each pair was artificially tilted to simulate geometric deformation.
As illustrated in Figure 24a–c, the three image pairs include optical–infrared, map–optical, and SAR–optical combinations, with one image in each pair subjected to a skew transformation. Figure 24d–f present the corresponding checkerboard mosaic results: the left columns are generated using the Cof_SIFT algorithm, while the right columns are obtained using the Cof_SIFT_HOG method. Visual results show that the proposed methods exhibit good robustness to geometric distortions and achieve outstanding alignment performance in all test cases.

4.5. Evaluation of Effect of Co-Occurrence Filter and HOG on Matching Performance

To further assess the impact of co-occurrence filters and HOG features on image registration, we conducted multi-modal image matching experiments using both SIFT and Cof_SIFT. The primary distinction between the two lies in the construction of the scale space: Cof_SIFT replaces the Gaussian filter used in SIFT with the co-occurrence filter. Due to space limitations, only a subset of the experimental results is presented in Figure 25.
As shown in Figure 25, Cof_SIFT consistently produces significantly more correct correspondences than SIFT across all tested image pairs. Notably, in the second and fourth rows, SIFT identifies only two correspondences, both of which are incorrect. Statistical analysis reveals that SIFT achieves an SR of just 43% across all image pairs, whereas Cof_SIFT achieves 100%. These results demonstrate that the scale space constructed using co-occurrence filters provides superior performance and robustness compared to the traditional Gaussian-based approach.
To assess the refinement capability of HOG features, we further applied a HOG-based adjustment strategy to the matched points. As shown in Figure 26, the mosaic image generated by SIFT (Figure 26a) exhibits noticeable misalignment. After HOG refinement (Figure 26b), the alignment improves for structurally rich images but remains insufficient for texture-similar pairs. In contrast, Figure 26c shows the results of Cof_SIFT, which achieves better alignment accuracy in all cases.
In summary, Cof_SIFT, which incorporates a co-occurrence filter, outperforms the traditional SIFT with the Gaussian filter and demonstrates strong matching performance on the test dataset. This provides a solid foundation for subsequent refinement of matched point positions. While HOG features can enhance the localization accuracy of matched points, Cof_SIFT_HOG achieves better performance compared to the combination of SIFT and HOG. These results highlight the advantage of co-occurrence filtering and confirm the effectiveness of the proposed methods in multi-modal image registration tasks.

5. Conclusions

In this paper, we proposed two robust multi-modal remote sensing image registration methods—Cof-SIFT and Cof-SIFT_HOG—to address the challenges posed by nonlinear radiation differences across imaging modalities. The proposed Cof-SIFT method substitutes the traditional Gaussian filter in SIFT with a co-occurrence filter, which effectively suppresses modality-specific texture variations while preserving structural features such as edges and contours. Building upon this, Cof-SIFT_HOG further refines the positions of matched feature points by leveraging HOG similarity, thereby enhancing registration accuracy.
Extensive experiments were conducted on various multi-modal image pairs, including optical–SAR, optical–map, night–day, and rotated image scenarios. The results demonstrate that both proposed methods outperform other evaluated approaches such as SIFT, COFSM, SAR-SIFT, PSO-SIFT, and OS-SIFT in terms of robustness and accuracy across almost all image pairs. Among them, Cof-SIFT_HOG achieves the highest performance across nearly all test scenarios.
In addition, checkerboard mosaicking visualizations further confirm the superior alignment accuracy of Cof-SIFT_HOG compared to Cof-SIFT and COFSM. These results collectively validate the effectiveness and robustness of our proposed methods for multi-modal remote sensing image registration.
With the continuous development of small-sample deep learning technology, future work will be devoted to further studying how to reduce the impact of modal differences and extract robust structural features. Specifically, we will study the use of structural feature information of remote sensing images of different modalities as the input of deep learning models, on the basis of which we also plan to build a small-sample deep learning framework to reduce the demand for annotated samples and further improve the accuracy and efficiency of multi-modal remote sensing image registration.

Author Contributions

Conceptualization, Y.Y.; methodology, Y.Y. and S.L.; software, Y.Y.; validation, S.L. and H.Z.; formal analysis, Y.Y.; investigation, S.L.; resources, D.L.; data curation, S.L.; writing—original draft preparation, S.L.; writing—review and editing, H.Z. and L.M.; visualization, Y.Y. and L.M.; supervision, Y.Y.; project administration, Y.Y.; funding acquisition, Y.Y. All authors have read and agreed to the published version of the manuscript.

Funding

This work was supported in part by the National Natural Science Foundation of China (Grant Number: 62175177).

Data Availability Statement

Due to the confidentiality of the project, the datasets used in this article cannot be shared. If necessary, please contact the corresponding author for relevant data and authorization.

Acknowledgments

We thank others for any contributions, whether it be direct technical help or indirect assistance.

Conflicts of Interest

The authors declare no conflicts of interest.

Abbreviations

The following abbreviations are used in this manuscript:
SARSynthetic Aperture Radar
SIFTScale-Invariant Feature Transform
MIMutual Information
HOPCHistogram of Orientated Phase Congruency
CFOGChannel Features of Orientated Gradients
DoGDifference-of-Gaussians
GLOHGradient Location and Orientation Histogram
RANSACRandom Sample Consensus
SRSuccess Rate
CMRCorrect Match Ratio
RMSERoot Mean Square Error
PCPhase-Consistent
NCMNumber of Correct Matches
HOGHistogram of Oriented Gradients
HOWPHistogram of the Orientation of Weighted Phase
NOAANational Oceanic and Atmospheric Administration
Suomi-NPPSuomi National Polar-orbiting Partnership
CMCorrect Match
NASANational Aeronautics and Space Administration
GF-3GaoFen-3

References

  1. Bruzzone, L.; Bovolo, F. A Novel Framework for the Design of Change-Detection Systems for Very-High-Resolution Remote Sensing Images. Proc. IEEE 2013, 101, 609–630. [Google Scholar] [CrossRef]
  2. Tuia, D.; Marcos, D.; Camps-Valls, G. Multi-Temporal and Multi-Source Remote Sensing Image Classification by Nonlinear Relative Normalization. ISPRS J. Photogramm. Remote Sens. 2016, 120, 1–12. [Google Scholar] [CrossRef]
  3. Brunner, D.; Lemoine, G.; Bruzzone, L. Earthquake Damage Assessment of Buildings Using VHR Optical and SAR Imagery. IEEE Trans. Geosci. Remote Sens. 2010, 48, 2403–2420. [Google Scholar] [CrossRef]
  4. Yang, J.; Gong, P.; Fu, R.; Zhang, M.; Chen, J.; Liang, S.; Xu, B.; Shi, J.; Dickinson, R. The Role of Satellite Remote Sensing in Climate Change Studies. Nat. Clim. Change 2013, 3, 875–883. [Google Scholar] [CrossRef]
  5. Feng, R.; Shen, H.; Bai, J.; Li, X. Advances and Opportunities in Remote Sensing Image Geometric Registration: A Systematic Review of State-of-the-Art Approaches and Future Research Directions. IEEE Geosci. Remote Sens. Mag. 2021, 9, 120–142. [Google Scholar] [CrossRef]
  6. Zhu, B.; Ye, Y. Multimodal Remote Sensing Image Registration: A Survey. J. Image Graph. 2024, 29, 2137–2161. [Google Scholar] [CrossRef]
  7. Viola, P.; Wells, W.M. Alignment by Maximization of Mutual Information. J. Image Graph. 1997, 24, 137–154. [Google Scholar] [CrossRef]
  8. Ye, Y.; Shen, L. Hopc: A Novel Similarity Metric Based on Geometric Structural Properties for Multi-Modal Remote Sensing Image Matching. ISPRS Ann. Photogramm. Remote Sens. Spat. Inf. Sci. 2016, III-1, 9–16. [Google Scholar] [CrossRef]
  9. Li, J.; Hu, Q.; Ai, M. RIFT: Multi-Modal Image Matching Based on Radiation-Variation Insensitive Feature Transform. IEEE Trans. Image Process. 2020, 29, 3296–3310. [Google Scholar] [CrossRef]
  10. Yao, Y.; Zhang, Y.; Wan, Y.; Liu, X.; Yan, X.; Li, J. Multi-Modal Remote Sensing Image Matching Considering Co-Occurrence Filter. IEEE Trans. Image Process. 2022, 31, 2584–2597. [Google Scholar] [CrossRef]
  11. Zhuang, J.; Chen, W.; Huang, X.; Yan, Y. Band Selection Algorithm Based on Multi-Feature and Affinity Propagation Clustering. Remote Sens. 2025, 17, 193. [Google Scholar] [CrossRef]
  12. Wan, G.; Ye, Z.; Xu, Y.; Huang, R.; Zhou, Y.; Xie, H.; Tong, X. Multimodal Remote Sensing Image Matching Based on Weighted Structure Saliency Feature. IEEE Trans. Geosci. Remote Sens. 2024, 62, 4700816. [Google Scholar] [CrossRef]
  13. Zhang, Y.; Yao, Y.; Wan, Y.; Liu, W.; Yang, W.; Zheng, Z.; Xiao, R. Histogram of the Orientation of the Weighted Phase Descriptor for Multi-Modal Remote Sensing Image Matching. ISPRS J. Photogramm. Remote Sens. 2023, 196, 1–15. [Google Scholar] [CrossRef]
  14. Zampieri, A.; Charpiat, G.; Girard, N.; Tarabalka, Y. Multimodal Image Alignment Through a Multiscale Chain of Neural Networks with Application to Remote Sensing. In Proceedings of the European Conference on Computer Vision, Munich, Germany, 8–14 September 2018; Springer International Publishing: Cham, Switzerland, 2018; Volume 11220, pp. 679–696. [Google Scholar]
  15. Yang, Z.; Dan, T.; Yang, Y. Multi-Temporal Remote Sensing Image Registration Using Deep Convolutional Features. IEEE Access 2018, 6, 38544–38555. [Google Scholar] [CrossRef]
  16. Zhuang, J.; Zheng, Y.; Guo, B.; Yan, Y. Globally Deformable Information Selection Transformer for Underwater Image Enhancement. IEEE Trans. Circuits Syst. Video Technol. 2024, 35, 19–32. [Google Scholar] [CrossRef]
  17. Baruch, E.B.; Keller, Y. Joint Detection and Matching of Feature Points in Multimodal Images. IEEE Trans. Pattern Anal. Mach. Intell. 2022, 44, 6585–6593. [Google Scholar] [CrossRef]
  18. Sun, J.; Shen, Z.; Wang, Y.; Bao, H.; Zhou, X. LoFTR: Detector-Free Local Feature Matching with Transformers. In Proceedings of the IEEE Conference on Computer Vision and Pattern Recognition, Nashville, TN, USA, 20–25 June 2021; Volume 4, pp. 8918–8927. [Google Scholar]
  19. Zhu, R.; Yu, D.; Ji, S.; Lu, M. Matching RGB and Infrared Remote Sensing Images with Densely-Connected Convolutional Neural Networks. Remote Sens. 2019, 11, 2836. [Google Scholar] [CrossRef]
  20. Li, L.; Han, L.; Ye, Y.; Xiang, Y.; Zhang, T. Deep Learning in Remote Sensing Image Matching: A Survey. ISPRS J. Photogramm. Remote Sens. 2025, 225, 88–112. [Google Scholar] [CrossRef]
  21. Han, S.; Liu, X.; Dong, J.; Liu, H. Remote Sensing Multimodal Image Matching Based on Structure Feature and Learnable Matching Network. Appl. Sci. 2023, 13, 7701. [Google Scholar] [CrossRef]
  22. Zhang, Y.; Lan, C.; Zhang, H.; Ma, G.; Li, H. Multimodal Remote Sensing Image Matching via Learning Features and Attention Mechanism. IEEE Trans. Geosci. Remote Sens. 2024, 62, 5603620. [Google Scholar] [CrossRef]
  23. Lowe, D.G. Distinctive Image Features from Scale-Invariant Keypoints. Int. J. Comput. Vis. 2004, 60, 91–110. [Google Scholar] [CrossRef]
  24. Jevnisek, R.J.; Avidan, S. Co-Occurrence Filter. In Proceedings of the IEEE Conference on Computer Vision and Pattern Recognition, Honolulu, HI, USA, 21–26 July 2017; pp. 3184–3192. [Google Scholar]
  25. Dalal, N.; Triggs, W. Histograms of Oriented Gradients for Human Detection. In Proceedings of the IEEE Conference on Computer Vision and Pattern Recognition, San Diego, CA, USA, 20–25 June 2005; Volume 1, pp. 886–893. [Google Scholar]
  26. Dellinger, F.; Delon, J.; Gousseau, Y.; Michel, J.; Tupin, F. SAR-SIFT: A SIFT-like Algorithm for SAR Images. IEEE Trans. Geosci. Remote Sens. 2015, 53, 453–466. [Google Scholar] [CrossRef]
  27. Ma, W.; Wen, Z.; Wu, Y.; Jiao, L.; Gong, M.; Zheng, Y.; Liu, L. Remote Sensing Image Registration with Modified Sift and Enhanced Feature Matching. IEEE Geosci. Remote Sens. Lett. 2017, 14, 3–7. [Google Scholar] [CrossRef]
  28. Xiang, Y.; Wang, F.; You, H. OS-SIFT: A Robust SIFT-Like Algorithm for High-Resolution Optical-to-SAR Image Registration in Suburban Areas. IEEE Trans. Geosci. Remote Sens. 2018, 56, 3078–3090. [Google Scholar] [CrossRef]
  29. Quan, D.; Wang, S.; Gu, Y.; Lei, R.; Yang, B.; Wei, S.; Hou, B.; Jiao, L. Deep Feature Correlation Learning for Multi-Modal Remote Sensing Image Registration. IEEE Trans. Geosci. Remote Sens. 2022, 60, 4708216. [Google Scholar] [CrossRef]
  30. Ye, Y.; Yang, C.; Gong, G.; Yang, P.; Quan, D.; Li, J. Robust Optical and SAR Image Matching Using Attention-Enhanced Structural Features. IEEE Trans. Geosci. Remote Sens. 2024, 62, 5610212. [Google Scholar] [CrossRef]
  31. Hou, Z.; Liu, Y.; Zhang, L. POS-GIFT: A Geometric and Intensity-Invariant Feature Transformation for Multimodal Images. Inf. Fusion 2024, 102, 102027. [Google Scholar] [CrossRef]
  32. Chen, H.M.; Arora, M.K.; Varshney, P.K. Mutual Information-Based Image Registration for Remote Sensing Data. Int. J. Remote Sens. 2003, 24, 3701–3706. [Google Scholar] [CrossRef]
  33. Ye, Y.; Bruzzone, L.; Shan, J.; Bovolo, F.; Zhu, Q. Fast and Robust Matching System for Multimodal Remote Sensing Image Registration. IEEE Trans. Geosci. Remote Sens. 2019, 57, 9059–9070. [Google Scholar] [CrossRef]
  34. Mikolajczyk, K.; Schmid, C. A Performance Evaluation of Local Descriptors. IEEE Trans. Pattern Anal. Mach. Intell. 2005, 27, 1615–1630. [Google Scholar] [CrossRef]
  35. Ye, Y.; Shan, J.; Hao, S.; Bruzzone, L.; Qin, Y. A Local Phase Based Invariant Feature for Remote Sensing Image Matching. ISPRS J. Photogramm. Remote Sens. 2018, 142, 205–221. [Google Scholar] [CrossRef]
  36. Liu, X.; Ai, Y.; Tian, B.; Cao, D. Robust and Fast Registration of Infrared and Visible Images for Electro-Optical Pod. IEEE Trans. Ind. Electron. 2019, 66, 1335–1344. [Google Scholar] [CrossRef]
  37. Fan, Z.; Liu, Y.; Liu, Y.; Zhang, L.; Zhang, J.; Sun, Y.; Ai, H. 3MRS: An Effective Coarse-to-Fine Matching Method for Multimodal Remote Sensing Imagery. Remote Sens. 2022, 14, 478. [Google Scholar] [CrossRef]
  38. Wang, Z.; Fan, B.; Wang, G.; Wu, F. Exploring Local and Overall Ordinal Information for Robust Feature Description. IEEE Trans. Pattern Anal. Mach. Intell. 2016, 38, 2198–2211. [Google Scholar] [CrossRef]
  39. Li, J.; Hu, Q.; Ai, M.; Wang, S. A Geometric Estimation Technique Based on Adaptive M-Estimators: Algorithm and Applications. IEEE J. Sel. Top. Appl. Earth Obs. Remote Sens. 2021, 14, 5613–5626. [Google Scholar] [CrossRef]
Figure 1. The flowchart of the proposed method.
Remotesensing 17 02246 g001
Figure 2. An image pyramid constructed using the Gaussian filter. As the sigma value increases progressively across each level (σ = 1.23, 1.55, 1.95, 2.45, and 3.09), the images become increasingly blurred, with fine details gradually smoothed out.
Remotesensing 17 02246 g002
Figure 3. An image pyramid generated using the co-occurrence filter. The window size of the filter increases at each level (window sizes = 5, 7, 9, 11, 13, and 15), leading to progressive blurring of image details. However, edge structures are better preserved compared to the Gaussian pyramid.
Remotesensing 17 02246 g003
Figure 4. A gradient magnitude map of a feature point support region and its segmentation result based on the gradient magnitude order. (a) A gradient magnitude map of the support region around one feature point. (b) The segmentation result of the gradient magnitude map, divided into three sub-regions represented in red, green, and blue.
Remotesensing 17 02246 g004
Figure 5. Construction of the Cof-SIFT descriptor. The image gradient magnitude map is divided into multiple sub-regions based on gradient magnitude. For each sub-region, a local feature vector is constructed using log-polar quantization of gradient orientations. The final descriptor is obtained by concatenating the feature vectors of all sub-regions, enhancing robustness to nonlinear intensity variations and spatial transformations.
Remotesensing 17 02246 g005
Figure 6. Corresponding point position refinement based on HOG feature similarity. For each initial corresponding point (shown as red dots), HOG features are extracted from the gradient magnitude maps of the reference image (top) and the image to be registered (bottom). A local search is performed around the initial point in the image to be registered, and similarity is evaluated using the Pearson correlation coefficient. The location with the highest similarity is selected as the refined correspondence point, enhancing registration precision.
Remotesensing 17 02246 g006
Figure 7. Part of the image from the dataset: (a) depth–optical; (b) infrared–optical; (c) map–optical; (d) SAR–optical; (e) night–day; (f) image rotation with 45 degrees; (g) image rotation with 90 degrees.
Remotesensing 17 02246 g007
Figure 8. Image pairs of the depth–optical set. (1)–(10) correspond to the respective image pair numbers.
Remotesensing 17 02246 g008
Figure 9. Image matching results on the depth–optical set, including (a) CM, (b) CMR, and (c) RMSE.
Remotesensing 17 02246 g009
Figure 10. Image pairs of the infrared–optical set. (1)–(10) correspond to the respective image pair numbers.
Remotesensing 17 02246 g010
Figure 11. Image matching results on the infrared–optical set, including (a) CM, (b) CMR, and (c) RMSE.
Remotesensing 17 02246 g011
Figure 12. Image pairs of the map–optical set. (1)–(10) correspond to the respective image pair numbers.
Remotesensing 17 02246 g012
Figure 13. Image matching results on the map–optical set, including (a) CM, (b) CMR, and (c) RMSE.
Remotesensing 17 02246 g013
Figure 14. Image pairs of the SAR-optical set. (1)–(8) correspond to the respective image pair numbers.
Remotesensing 17 02246 g014
Figure 15. Image matching results on the SAR–optical set, including (a) CM, (b) CMR, and (c) RMSE.
Remotesensing 17 02246 g015
Figure 16. Image pairs of the night–day set. (1)–(6) correspond to the respective image pair numbers.
Remotesensing 17 02246 g016
Figure 17. Image matching results on the night–day set, including (a) CM, (b) CMR, and (c) RMSE.
Remotesensing 17 02246 g017
Figure 18. Image pairs of the image rotation (45 degrees) set. (1)–(7) correspond to the respective image pair numbers.
Remotesensing 17 02246 g018
Figure 19. Image pairs of the image rotation (90 degrees) set. (1)–(7) correspond to the respective image pair numbers.
Remotesensing 17 02246 g019
Figure 20. Image matching results on the image rotation changes (45 degrees), including (a) CM, (b) CMR, and (c) RMSE.
Remotesensing 17 02246 g020
Figure 21. Image matching results on the image rotation changes (90 degrees), including (a) CM, (b) CMR, and (c) RMSE.
Remotesensing 17 02246 g021
Figure 22. Representative checkerboard mosaic results produced by the proposed Cof-SIFT, Cof-SIFT_HOG, and COFSM. From left to right: Cof-SIFT, Cof-SIFT_HOG, and COFSM. The image pairs correspond to different modality combinations: (a) depth–optical, (b) infrared–optical, (c) map–optical, (d) SAR–optical, and (e) night–day. The red and green boxes highlight close-up regions within the mosaic images for detailed comparison.
Remotesensing 17 02246 g022
Figure 23. Representative checkerboard mosaic results for rotated image pairs using the proposed Cof-SIFT, Cof-SIFT_HOG, and COFSM. From left to right: Cof-SIFT, Cof-SIFT_HOG, and COFSM. (a) Image pair with 45° rotation. (b) Image pair with 90° rotation. The red and green boxes highlight close-up regions within the mosaic images for detailed comparison.
Remotesensing 17 02246 g023
Figure 24. Image pairs with skew transformations and their corresponding mosaic results. (ac) The skewed image pairs used for testing. (df) The checkerboard mosaic results obtained using Cof_SIFT (left) and Cof_SIFT_HOG (right), respectively.
Remotesensing 17 02246 g024
Figure 25. Image matching on four multi-modal image pairs using SIFT and Cof_SIFT. (a) Image matching using SIFT; (b) image matching using Cof_SIFT.
Remotesensing 17 02246 g025
Figure 26. Checkerboard mosaic results generated by different methods. (a) Results from SIFT; (b) results from SIFT with HOG refinement; (c) results from Cof_SIFT_HOG. The red and green boxes highlight close-up regions within the mosaic images for detailed comparison.
Remotesensing 17 02246 g026
Table 1. The results of the evaluated methods for the four evaluation indicators.
Cof-SIFTCof-SIFT_HOGCOFSM
SR100%100%72%
CM100109110
CMR55%79%67%
RMSE3.542.373.23
Disclaimer/Publisher’s Note: The statements, opinions and data contained in all publications are solely those of the individual author(s) and contributor(s) and not of MDPI and/or the editor(s). MDPI and/or the editor(s) disclaim responsibility for any injury to people or property resulting from any ideas, methods, instructions or products referred to in the content.

