Article

Contrasting Impacts of Urbanization and Cropland Irrigation on Observed Surface Air Temperature in Northern China

by
Xiaoyu Xu
1,*,
Shiguang Miao
2,3,
Yizhou Zhang
2,3 and
Jingjing Dou
2,3
1
College of General Aviation and Flight, Nanjing University of Aeronautics and Astronautics, Changzhou 213300, China
2
Institute of Urban Meteorology, China Meteorological Administration, Beijing 100089, China
3
Key Laboratory of Urban Meteorology, China Meteorological Administration, Beijing 100089, China
*
Author to whom correspondence should be addressed.
Remote Sens. 2025, 17(13), 2256; https://doi.org/10.3390/rs17132256
Submission received: 19 May 2025 / Revised: 26 June 2025 / Accepted: 27 June 2025 / Published: 30 June 2025

Abstract

Urbanization and cropland irrigation modify land surface water and energy budgets in different ways; however, few observational studies have explicitly quantified their contrasts. Using high-resolution observations from over 2000 surface weather stations and urban and irrigation fraction data, this study investigated the individual and combined effects of urbanization and cropland irrigation on surface air temperature over the Beijing–Tianjin–Hebei (BTH) region in China, where highly urbanized areas and heavily irrigated croplands exist together. The results indicate that (1) the daytime irrigation cooling (with surface air temperature decreasing by ~0.1–0.5 °C at irrigated stations) was non-negligible in late autumn, early winter, and later spring months, when winter wheat irrigation mainly occurred over the BTH region, while a slight warming was observed at many irrigated stations during the nighttime. By contrast, urban warming was most pronounced in the nighttime, especially in winter, and the daytime warming at urban sites was much weaker and comparable to the magnitude of cooling induced by concurrent irrigation for winter wheat. (2) Collectively, the vast stretches of irrigated croplands helped mitigate urban warming, and their combined effect on the daytime surface air temperature over the whole region resulted in a slight cooling of ~0.2 °C in some of the winter wheat-growing months. (3) The contrasting temperature changes due to urbanization and irrigation were spatially variable. Beijing was predominantly characterized by urban warming, while Shijiazhuang, with extensive irrigation, exhibited irrigation cooling (or slight warming) during the daytime (or nighttime) in most of the winter wheat-growing months, which could be a possible contributor to the daytime cooling (or stronger nighttime warming) at urban sites. This work highlights the temperature contrasts between urban areas and surrounding irrigated croplands, as well as the potential role of extensive irrigation in mitigating (or enhancing) daytime (or nighttime) urban warming.

1. Introduction

Anthropogenic land-use and land-cover changes have dramatically altered the surface of the planet, and by 2000, almost 39% of Earth’s total ice-free land had been transformed into agricultural land and settlements [1,2]. With the increased demand for residential space and food security due to the global population growth, urbanization and irrigation, two of the major land-use changes caused by human activities, have expanded rapidly in the past several decades [3,4], and the expansion is projected to continue throughout this century [5,6]. These large-scale land-use changes can substantially modify the surface water and energy balance and influence local and regional weather and climate [2,7,8,9,10,11,12,13,14,15,16,17,18,19,20,21,22,23,24,25].
Extensive studies have individually documented the climatic effects of urbanization [9,10,11,12,13,14] and irrigation [15,16,17,18,19,20,21,22,23,24,25]. The replacement of natural landscapes by built-up structures (i.e., urbanization) reduces evaporative cooling and increases heat storage in urban areas [7,8,10], where more than half of the world’s population resides [26]. This can result in the formation of the urban heat island (UHI), a well-documented phenomenon that indicates routinely warmer city centers than their surrounding non-urban areas [7,8,9,14]. The intensity of the UHI (UHII), traditionally quantified as the urban–rural difference in near-surface air temperature [8], is highly variable over time and space, and on average, urban air temperatures may be 1–3 °C warmer than surrounding rural areas [11]. In contrast, irrigation applied to ~20% of global croplands [27] tends to cool and moisten the air over irrigated lands by repartitioning net radiation into surface sensible and latent heat fluxes [15,17,20,23,24]. The magnitude of irrigation-induced cooling in certain regions may be comparable to or even exceed the influence of other climate forcings [15,16]. In addition to the contrasting effects on surface conditions, both urbanization and irrigation may modulate local or regional circulation and precipitation patterns [8,12,13,21]. For example, owing to reduced land–sea thermal contrasts, extensive irrigation over the Indian peninsula delayed the South Asian summer monsoon onset and weakened the monsoon flow [28,29,30].
Some recent studies have compared the response of surface conditions to urbanization and agricultural development [31,32,33]; however, irrigated croplands were not distinguished from rainfed ones. According to long-term temperature trends in the latter half of the 20th century in the United States, Kalnay and Cai (2003) [31] suggested that the surface warming due to land-use changes such as urbanization and agriculture was at least twice as high as the estimates based on urbanization alone. Han et al. (2019) [32] also employed the observed surface air temperature trends to estimate the combined impacts of urbanization and agriculture over mainland China. Using satellite land surface temperature (LST) data instead, Zhou et al. (2016) [33] showed that the urban and cropland uses in eastern China collectively had insignificant influences on daytime LST and cooled nighttime LST by −0.6 °C with large seasonal variations. More recently, some modeling studies have focused on the contrasting roles of urbanization and irrigation in simulations of surface air temperature, humidity, and regional precipitation [34,35].
However, currently, few observational studies have quantified the contrasts in surface air temperature between urbanization and irrigation as well as their combined impact. One example is the study by Shi et al. (2014) [36], where long-term observations from 95 meteorological stations were used to compute decadal trends of temperature extremes in relation to urbanization and cropland irrigation over the North China Plain. However, the distribution of weather stations in their study was relatively sparse, with only 23 sites located in the BTH region, which comprises two metropolises (i.e., Beijing and Tianjin) and a major agricultural province with intensive irrigation (i.e., Hebei). Additionally, the thermal contrasts between urban areas and irrigated croplands were expected to be spatially variable depending on the levels of urbanization and irrigation [32,36], which may affect local circulation patterns associated with the UHI and require further investigation. Therefore, this study employed hourly measurements from more than 2000 automatic weather stations in the BTH region, where highly urbanized cities and heavily irrigated croplands coexist. The main objectives of this work were: (1) to observationally characterize the individual and combined effects of urbanization and irrigation on surface air temperature for the whole region, and (2) to determine the differences in temperature contrasts induced by urbanization and irrigation between two representative cities (i.e., Beijing and Shijiazhuang, with the former highly urbanized and the latter surrounded by extensive irrigation). Beijing and Shijiazhuang were selected here due to the remarkable differences in the levels of built-up and irrigation fractions between them, which have a great influence on the urbanization- and irrigation-induced temperature changes [8,14,15,18,19] as well as their contrasts [32,36]. According to the 3 km gridded land-use/land-cover map (see Figure 1b below), ~26% (or ~15%) of all grids in Beijing were categorized as urban (or irrigated cropland), while for Shijiazhuang, the percentages were ~14% and ~62% for urban and irrigated cropland, respectively.
The remainder of this paper is organized as follows: Section 2 presents the study area and data sets employed, and the methodology for site categorization and the linear regression model used to minimize the influence of geographic locations on surface air temperature is also documented. Section 3.1 shows the individual and combined effects of urbanization and cropland irrigation on surface air temperature over the study area, and Section 3.2 further investigates the differences in temperature contrasts between Beijing (more urbanized) and Shijiazhuang (more heavily irrigated). Finally, some implications and uncertainties are discussed in Section 4, and conclusions are summarized in Section 5.

2. Materials and Methods
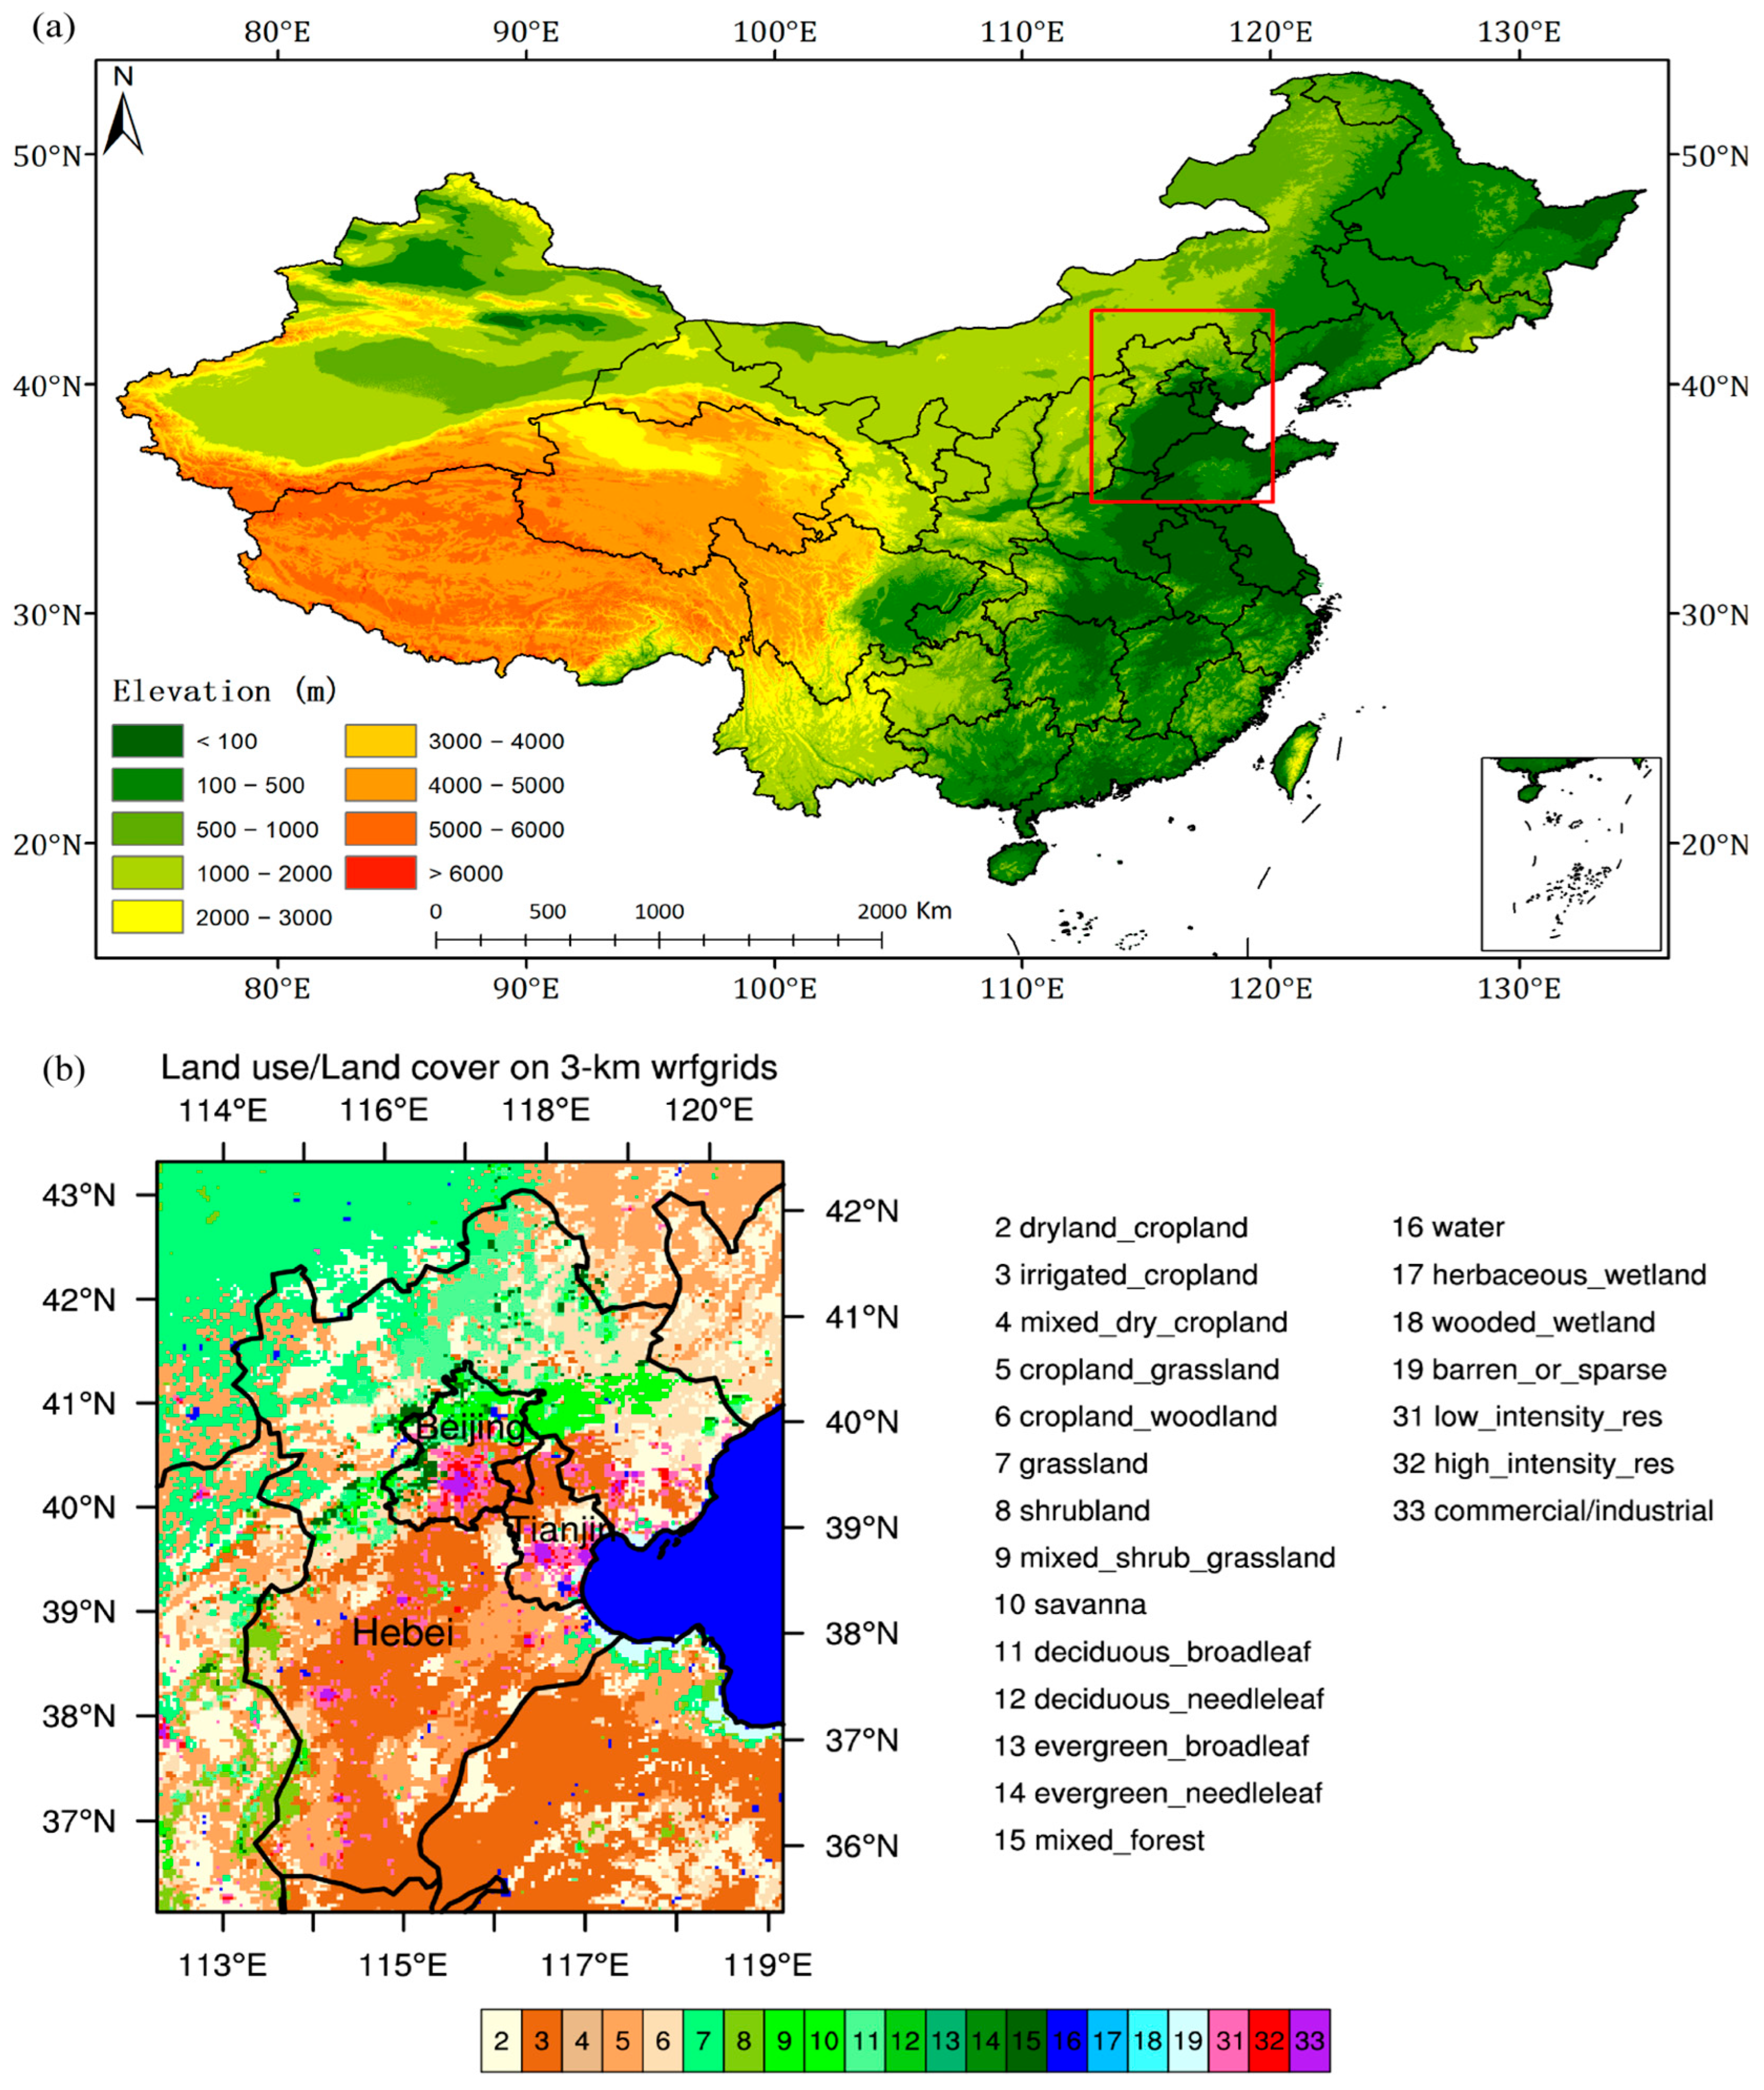
2.1. Study Area

The BTH region is in the northern part of the North China Plain (see the red rectangle in Figure 1a), which is one of the primary grain-producing areas in the country and is known as the “breadbasket of China” [37,38,39]. About 51%–60% of the nation’s wheat and 31–33% of its maize are produced on the Plain [37]. The main production system here is double cropping of winter wheat (from early October to the following June) and summer maize (from June to late September) [36]. The Plain is characterized by a warm-temperate climate with precipitation mainly concentrated in the maize-growing season, and large amounts of irrigation water are required to maintain high crop yields, especially during the winter wheat-growing periods. Consequently, the North China Plain is one of the most intensively irrigated regions in the world [40]. The irrigation fraction in Figure 2a shows that the percentage of irrigated cropland in the southeastern part of Hebei Province is generally over 60%. Additionally, the BTH region is densely populated and highly urbanized (Figure 1b and Figure 2b), with approximately 110 million people (accounting for ~8% of the total population in China). The combination of large irrigated cropland and urban areas makes the study area an ideal domain to investigate the individual and combined effects of urbanization and agricultural irrigation on surface air temperature.

2.2. Data

Hourly surface 2 m air temperature and precipitation data from October 2012 to May 2017 were obtained from more than 2000 meteorological stations in the BTH region, and extreme temperature values were removed following the method of Dou et al. (2015) [13]. To eliminate the influence of local weather systems, those stations with daily precipitation higher than 1 mm (called precipitation stations herein) were not considered. For a given category of stations, we also removed precipitation days if more than 60% of the stations were precipitation stations.
For site categorization, the 3 km gridded land-use/land-cover map and the urban fraction map (Figure 1b and Figure 2b) were generated using the 250 m Moderate-Resolution Imaging Spectrometer (MODIS) remote sensing data set on 24 June 2009, which was also employed in the modeling study of urbanization impact on surface weather [41]. The global map of irrigated fractional area around 2005 with a resolution of 5′ × 5′ was interpolated to the 3 km grid-spacing domain (see Figure 2a), and the quality of this irrigation data set was marked as “good” in China [40]. Comparison with records of 24 agrometeorological stations in Hebei Province [36] showed that this irrigation data set is generally reliable for the North China Plain.
Figure 2. The 3 km gridded (a) fractional area of irrigated lands (unit: %), and (b) urban fraction (unit: %) in the study area, and (c) the locations of urban (58 stations indicated by red circles), irrigated cropland (197 stations indicated by blue triangles), and reference (114 stations indicated by white stars) stations in the BTH region. The red rectangle indicates the location of Shijiazhuang (37.5°N~38.5°N, 114°E~115°E) considered in Section 3.2.
Remotesensing 17 02256 g002

2.3. Methodology

2.3.1. Site Categorization

Instead of the long-term temperature trends utilized in Shi et al. (2014) [36], the thermal effects of urbanization and cropland irrigation in this study were quantified as the surface air temperature differences between urban (or irrigated cropland) stations and reference ones. In this case, the warming or cooling due to urbanization or irrigation largely depends on the classification of urban or irrigation versus reference stations [8,32,33,36,42]. Here, we employed the land-use/land-cover data combined with urban and irrigation fractions to identify urban, irrigated cropland, and reference stations, and this method has been widely used in many studies to isolate the urban or agriculture/irrigation effects on local climate [15,22,32,33,36]. For example, Bonfils and Lobell [15] computed temperature differences between intensively irrigated lands (with irrigated fraction higher than 50%) and reference areas (with irrigated fraction lower than 10%) to estimate the effects of the rapid expansion of irrigated areas in the 20th century. These irrigation fraction thresholds were also used by Chen and Jeong [22] and Shi et al. [36] to detect the irrigation impact over the North China Plain. To estimate the urbanization-induced effect, Shi et al. [36] used urban fraction to determine urban regions (with built-up fraction higher than 70%) and reference ones (with built-up fraction lower than 30%). Note that two groups of reference regions could differ in Shi et al. [36], where different thresholds were utilized to identify reference stations for irrigation and urban areas, respectively. To ensure the comparability between the irrigation- and urbanization-induced changes, this study combined irrigation and urban fraction thresholds when identifying urban, irrigation, and reference stations, and a similar method was also used by Han et al. [32]. The MODIS-based land-use/land-cover map (Figure 1b) was simultaneously employed to improve the accuracy of site categories.
To highlight the effects of agricultural irrigation and urbanization, only those heavily irrigated (with irrigation fraction over 70%) cropland and highly urbanized (with built-up fraction over 70%) stations were analyzed in this study, and the site categories were determined as follows. In addition to the high-level fractional area of irrigation, the closest grid cells to heavily irrigated cropland stations were classified as irrigated cropland (i.e., category 3 in Figure 1b) and the urban fraction was not higher than 10%. Similarly, for urban stations, the closest grid cells were classified as residential or commercial (i.e., category 31–33 in Figure 1b), and the irrigation fraction was not higher than 10%. For reference stations, neither irrigation nor urban fraction was larger than 10%, and the closest grid cells were classified as non-irrigated cropland or grassland (i.e., categories 2 and 4–7 in Figure 1b). Note that stations with elevations higher than 200 m were not included to avoid bias from comparing stations in low-lying irrigated or urban areas to higher elevations [15,17,31]. Figure 2c shows the locations of heavily irrigated cropland (197 sites, over 90% of which were in Hebei Province), highly urbanized (58 sites, nearly 80% of which lay in Beijing and Tianjin), and reference (114 sites) stations.

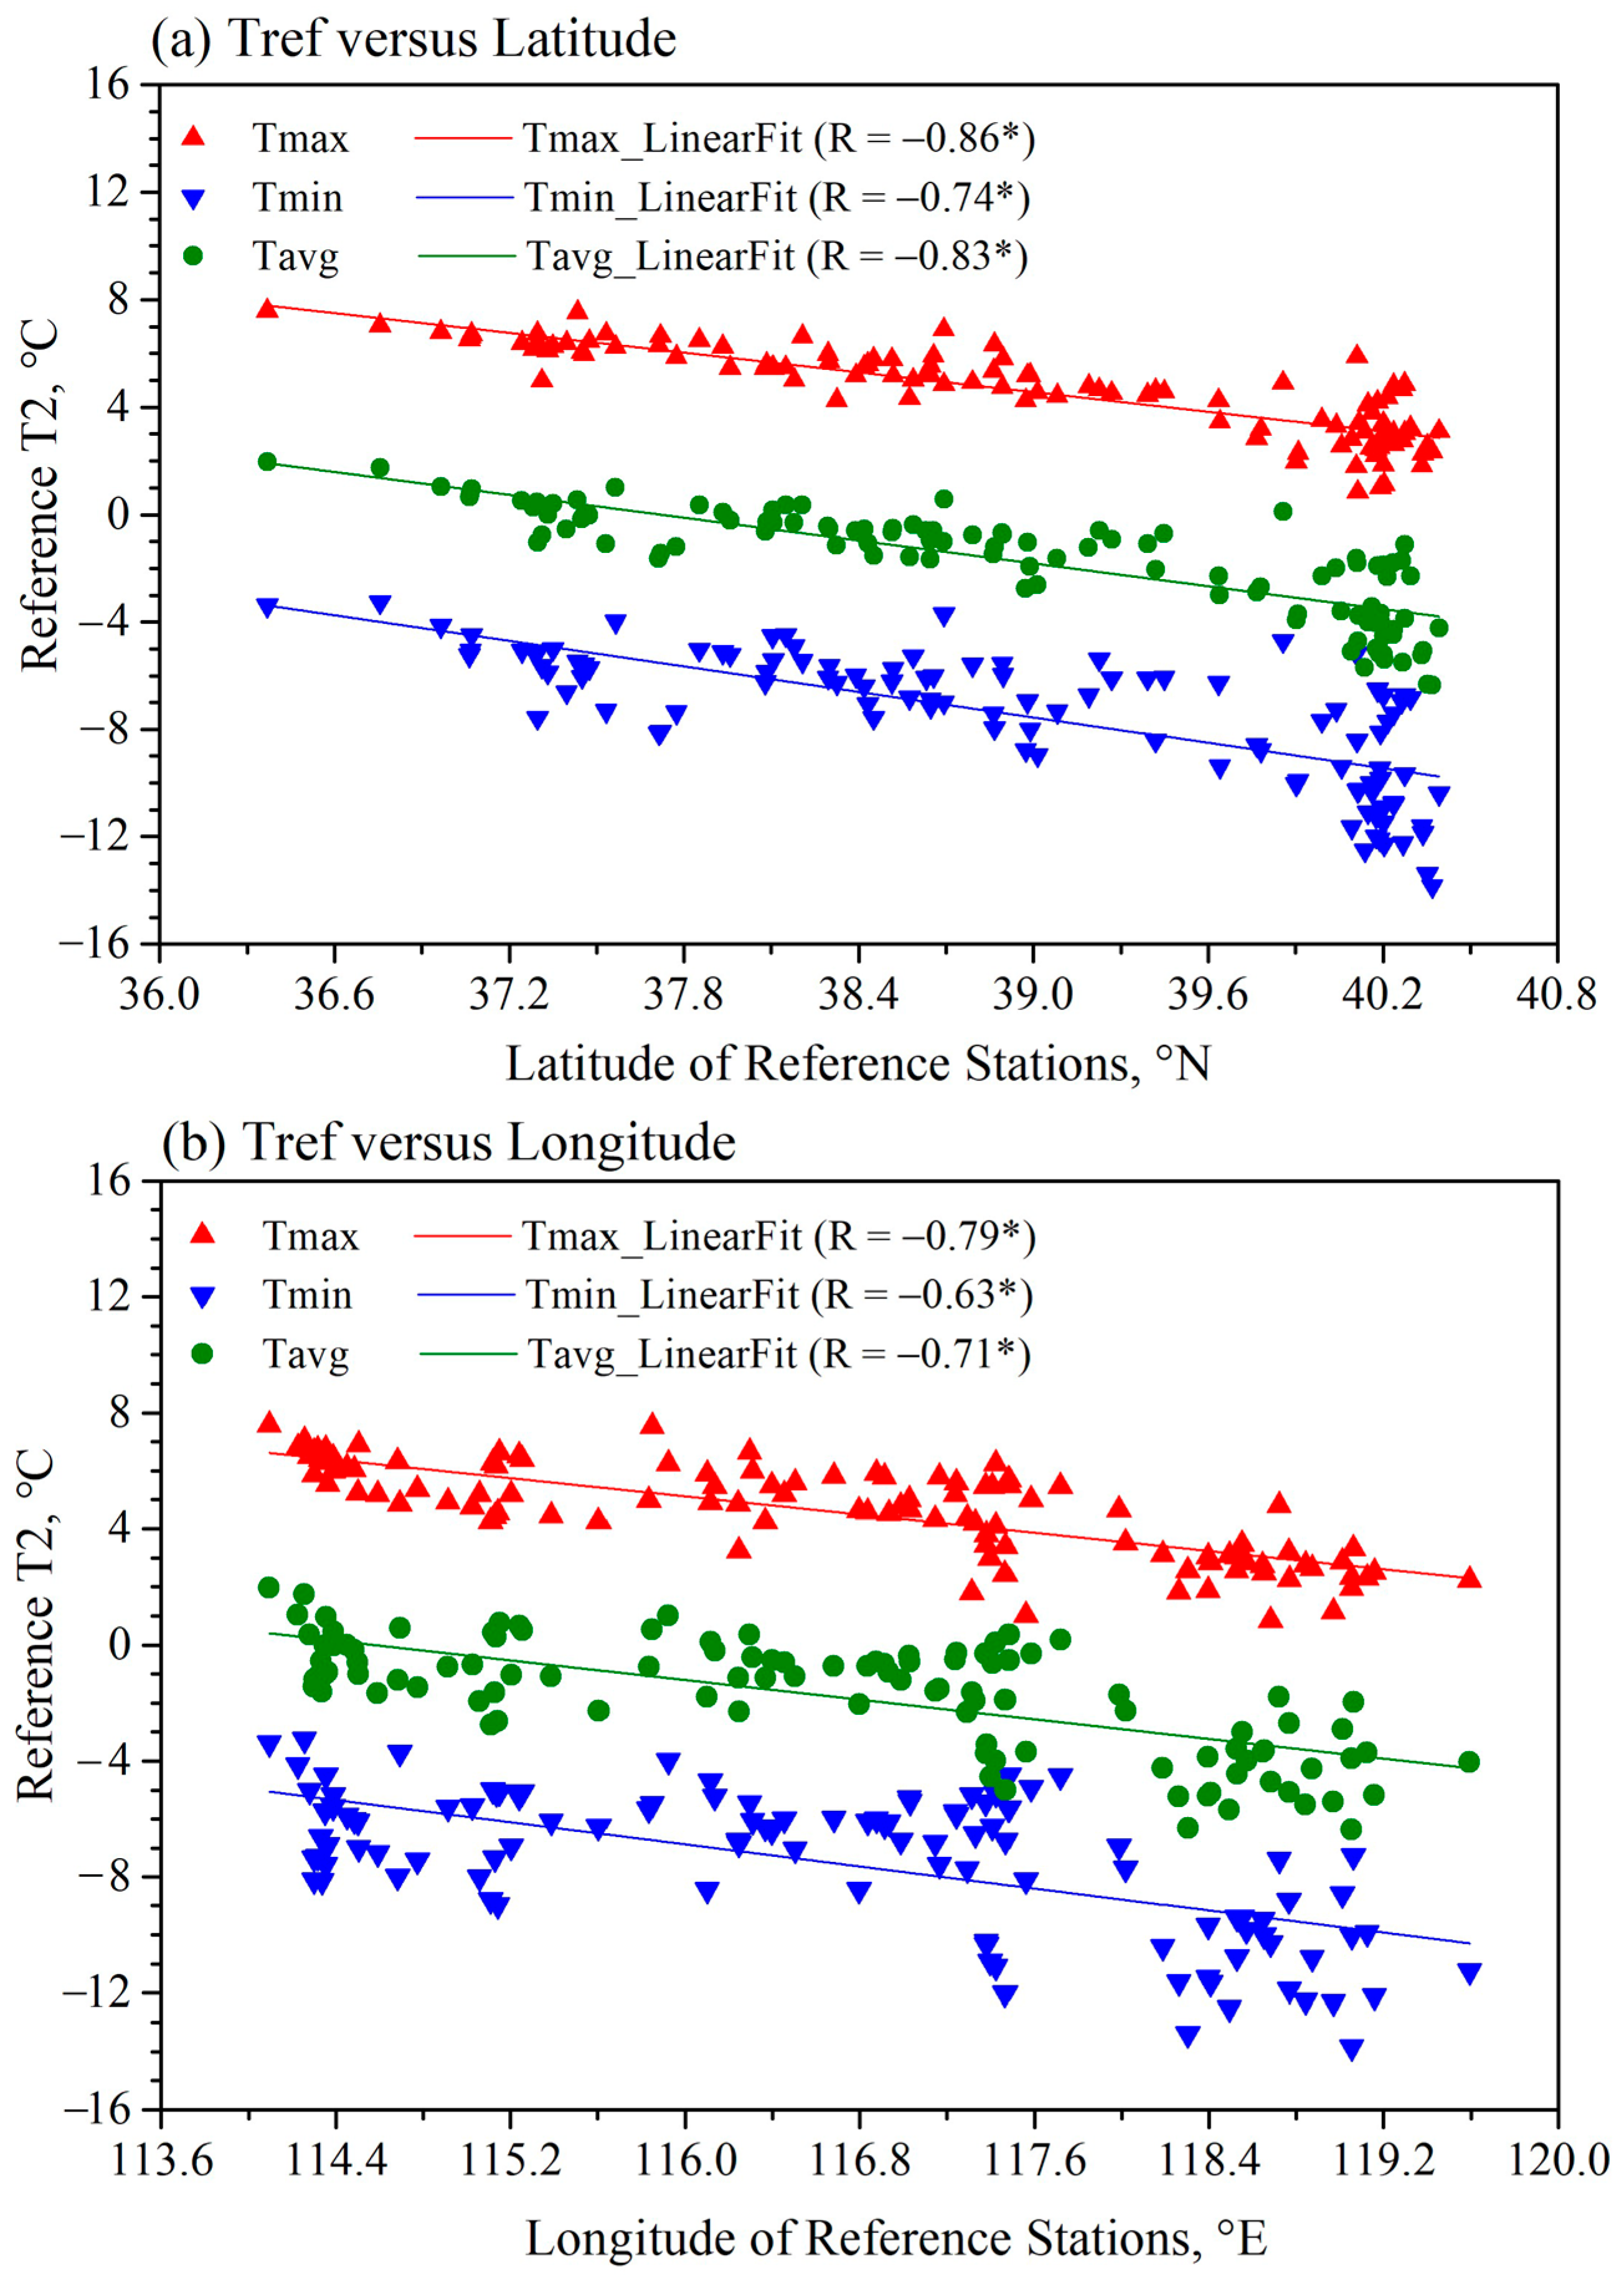
2.3.2. Estimation of Reference Temperatures

Besides local precipitation and elevation considered above, surface air temperature changes can also result from geographical locations, which is non-negligible here due to the large latitude and longitude spans among stations (Figure 2c). In January 2014, for instance, reference air temperature significantly decreased with latitude and longitude, with latitudinal and longitudinal differences of up to ~4–8 °C (Figure 3). To minimize the influence of geographic locations, the reference air temperature was estimated as a function of longitude and latitude (see Equation (1) below) using the multiple linear regression method in Zhou et al. (2016) [33]. Using monthly mean values of daily maximum (Tmax), minimum (Tmin), and average (Tavg) surface air temperature for reference stations, we performed this regression model every month to obtain the corresponding parameters, i.e., T0, a, and b in Equation (1). A new reference air temperature (i.e., T R E F in Equation (2) below) was then re-calculated with these parameters, and the thermal anomaly (i.e., T U R B   o r   I R R in Equation (3) below) was finally estimated by subtracting the new reference air temperature from observations for each urban/irrigated station.
T R E F x , y = T 0 + a · x + b · y
T U R B   o r   I R R ( x , y ) = T U R B   o r   I R R ( x , y ) T R E F ( x , y )
where x (or x′) and y (or y′) represent the longitude and latitude of reference stations (or urban/irrigated stations). T R E F (or T R E F ) is the observed (or re-calculated) reference air temperature. T0 is a constant, and the coefficients a and b describe the spatial gradient of reference air temperature. T U R B   o r   I R R and T U R B   o r   I R R indicate the observed surface air temperature and the thermal anomaly for urban/irrigated stations.
The coefficients of correlation between observed and fitted reference air temperatures were mostly significant at the 99.9% confidence level, except for April and May 2016, when observation data for Hebei and Tianjin were missing. To further evaluate the validity of the regression model used, seasonal average surface air temperature changes relative to fitted and unfitted reference values were compared in Figure 4. Compared with the unfitted reference air temperature, which was estimated as an average of all reference stations in the BTH region, the urban warming was underestimated by ~0.5 °C or more (Figure 4a). On a seasonal basis, the peak of urban warming in winter was better captured by employing the fitted reference air temperature. For irrigated cropland stations, most of which were located in the southern part of the study area, neglecting the geographic influence could generate an underestimated reference air temperature, consequently causing a warming effect of irrigation relative to reference sites (see curves with star symbols in Figure 4b).

3. Results

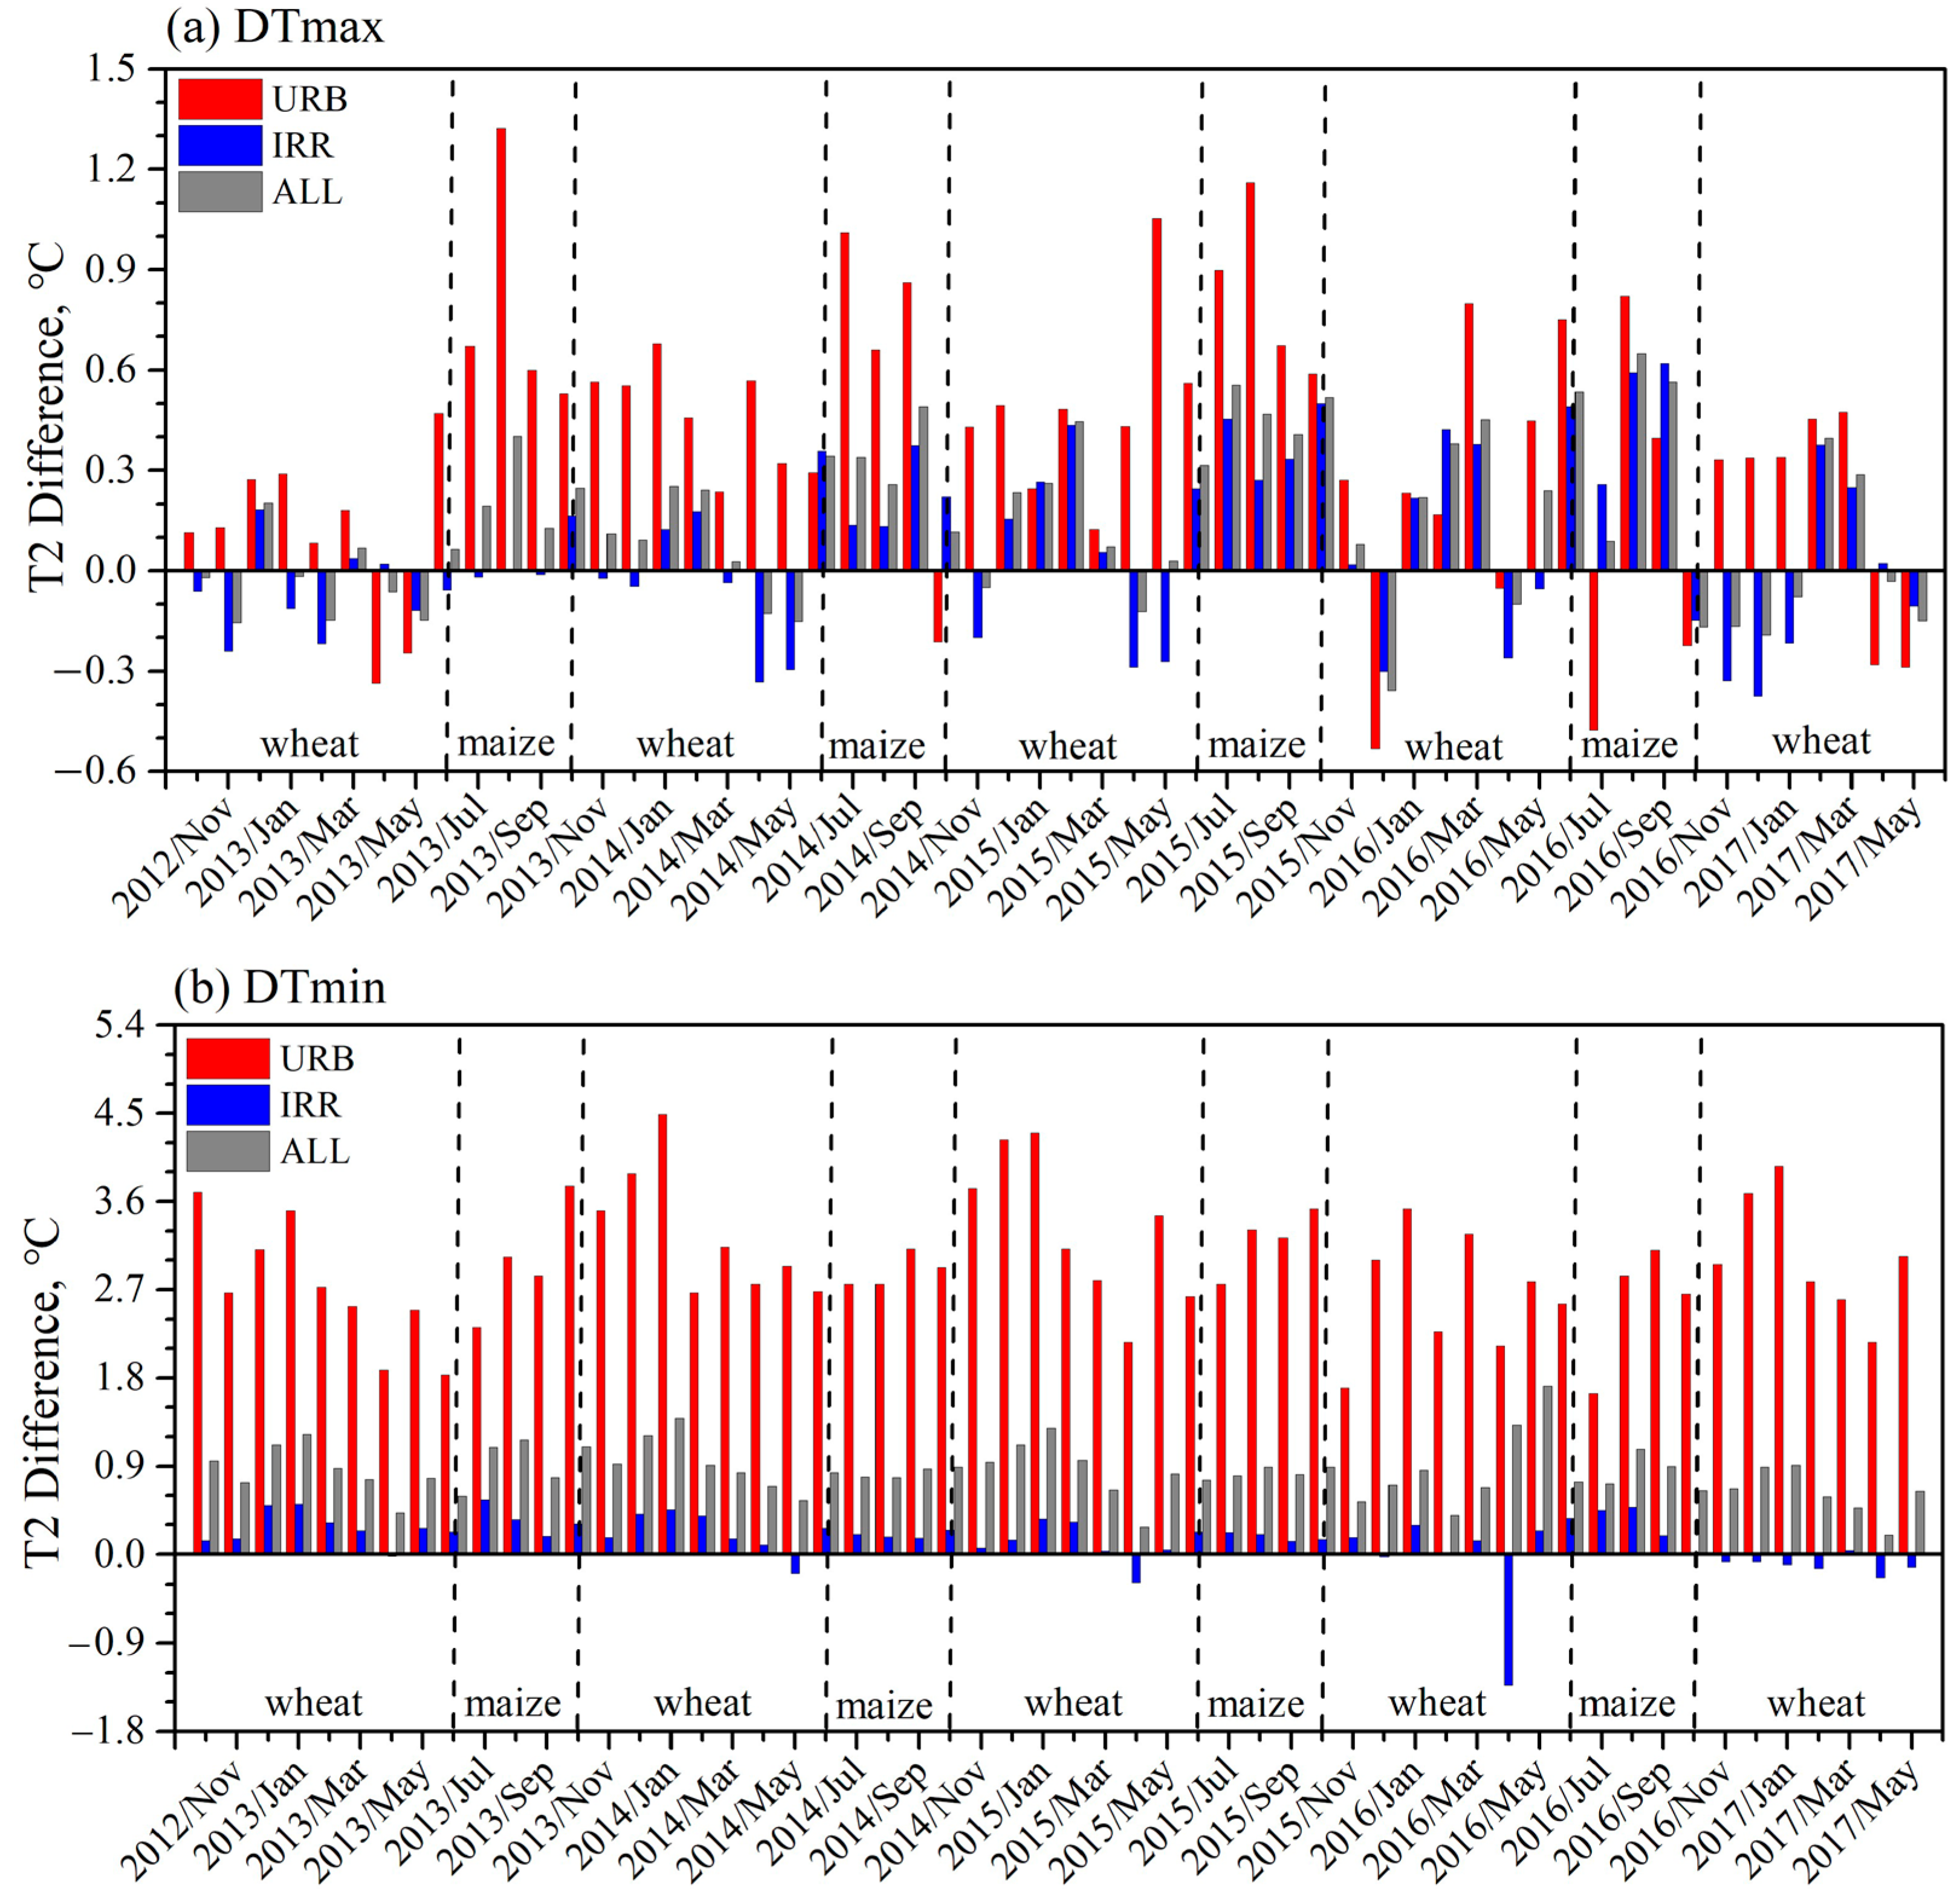
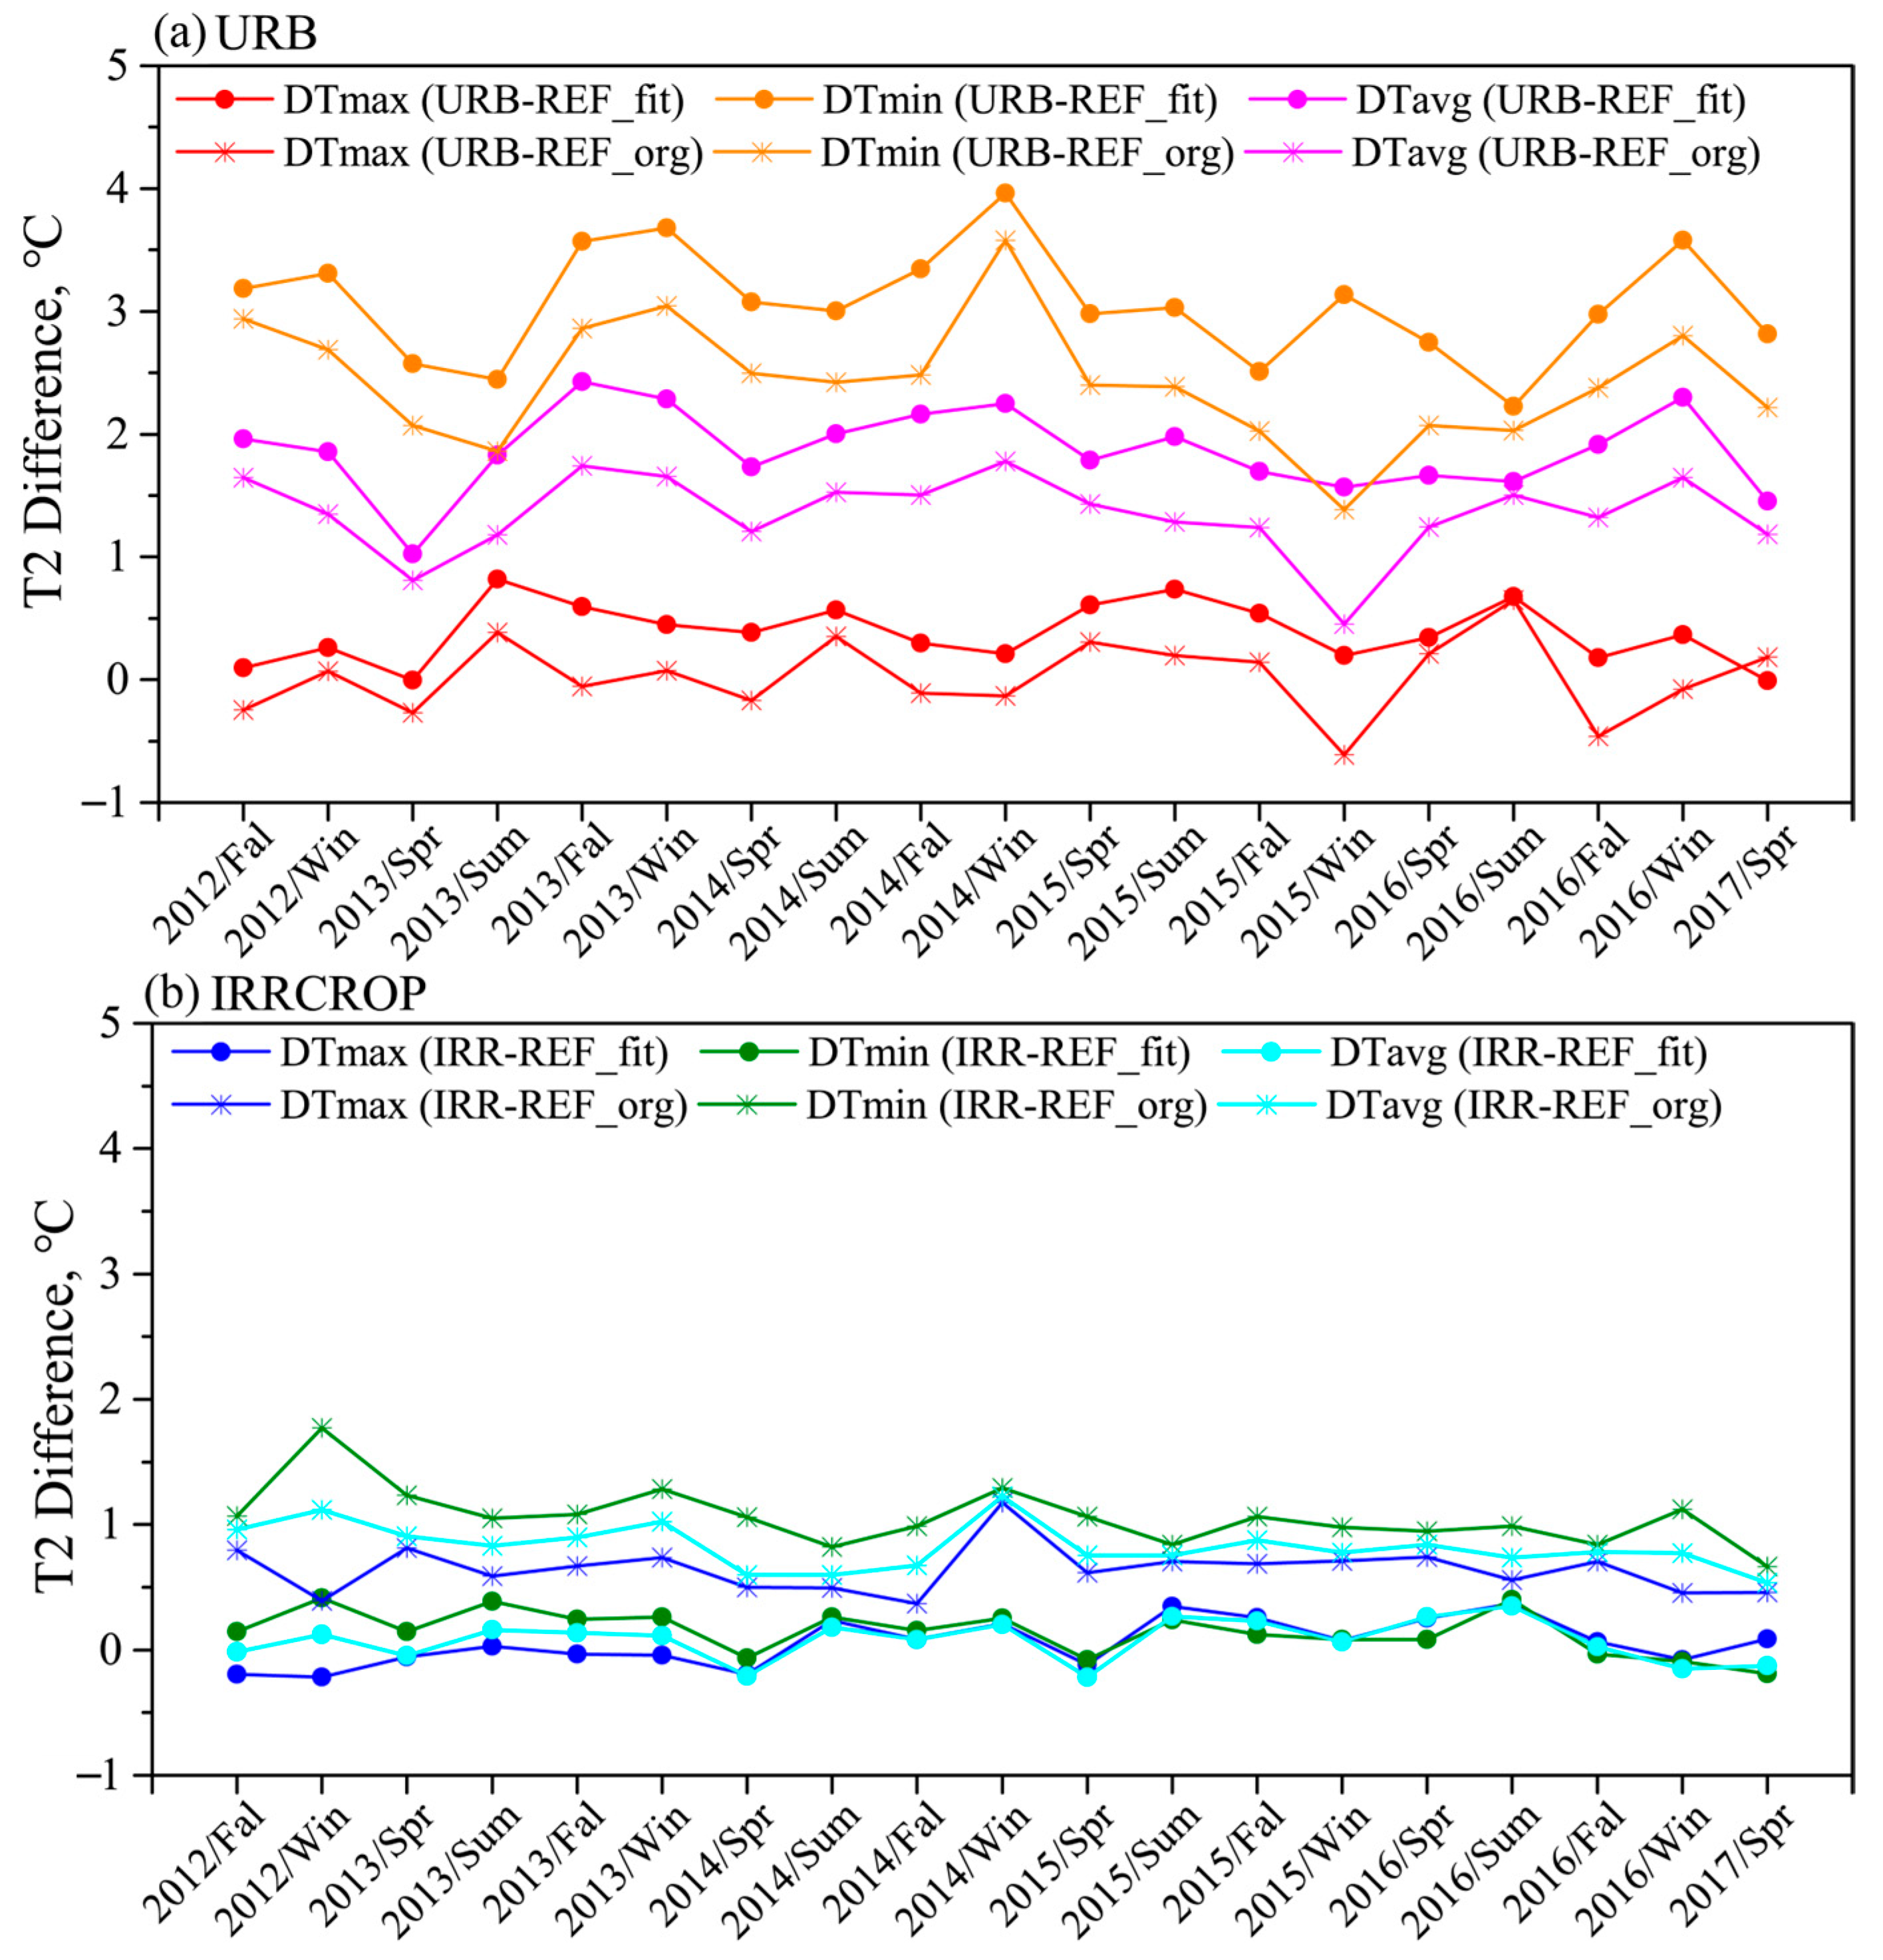
3.1. Temperature Effects over the Whole BTH Region

This section first presents the individual impacts of urbanization and irrigation on surface air temperature over the whole BTH region (Figure 5 and Table 1). The results indicate that urban warming was most pronounced during the nighttime (i.e., Tmin in this study) throughout the year, while irrigation cooling was concentrated in the daytime (i.e., Tmax in this study) during the main wheat-growing season (from November to the following May; see Figure 5 and Table 1). On average, surface 2 m air temperature for urban stations was ~1.5–3.0 °C (or ~0.5–2.0 °C) warmer than the fitted reference values in autumn and winter (or in spring and summer). The strongest warming due to urbanization occurred during the nocturnal hours in winter; for instance, the median nighttime UHII in January 2014 was up to ~4.5 °C (Figure 5b and Table 1).
For irrigated cropland stations, cooler surface air temperatures compared to reference stations mainly occurred during the winter wheat-growing season rather than during the maize-growing season, which could be partly explained by the fact that over 70% of irrigation water is applied to wheat fields in the North China Plain [37]. More specifically, the cooling due to winter wheat irrigation was relatively stronger (with a magnitude of ~0.2–0.3 °C or higher) in late autumn, early winter, and late spring months (Figure 5 and Table 1), which roughly corresponded to the timing of two important irrigation applications for the development of winter wheat (i.e., overwintering water and first spring water [38]). For most of the winter wheat-growing months except for 2016–2017, a slight warming was more prevalent at irrigated stations in the nighttime than during the daytime (Table 1), and this partly agrees with Shi et al. (2014) [36], which suggested a warming effect of irrigation on the average daily minimum temperature of the coldest days. However, during the maize-growing season, the cooling of irrigation almost disappeared, and irrigated stations tended to be even slightly warmer than reference stations (Figure 5d), which might be due to much less irrigation applied to maize fields than to winter wheat fields [37].
Additionally, the temperature decreases caused by winter wheat irrigation were mostly less than 0.5 °C (Figure 5 and Table 1), which is much smaller than the nighttime warming of ~1.5–4.5 °C for urban sites. This is possibly because irrigation implementation only occurred when required, and the memory of irrigation-induced temperature changes was limited [23]. Nevertheless, the magnitude of cooling due to irrigation for winter wheat in this study was comparable to Chen et al. (2018) [23], which indicated that irrigation decreased the summer-average surface air temperature by ~0.2–0.9 °C for maize (or ~0–0.3 °C for soybean).
Furthermore, we estimated the combined temperature effect of urbanization and irrigation over the whole BTH region, which was represented by the average of surface air temperature differences for all the urban and irrigated stations over the study area (as shown by the gray columns in Figure 6). The results indicate that the vast stretches of irrigated croplands helped mitigate the warming due to urbanization, especially during the daytime in the wheat-growing season (Figure 6a). This was when the most significant cooling occurred due to large amounts of irrigation water applied to wheat fields [37], while the intensity of urban warming was much weaker than that during the nighttime. In some months (e.g., November 2016, April–May 2014, etc.), the overall daytime surface air temperature trend for the whole region was slightly cooler than the reference (Figure 6a). Note that urban stations sometimes showed cooler temperatures than reference stations during the day (referred to as the urban cool island or UCI), which has also been observed in other cities [43,44]. This UCI phenomenon, combined with the temperature drops induced by irrigation, could further enhance the cooling across the whole region (Figure 6a). The significant nighttime warming due to urbanization (with a magnitude of ~1.5–4.5 °C) was also partly offset by the extensive irrigated croplands, which showed much weaker warming of less than 0.5 °C (Figure 6b).

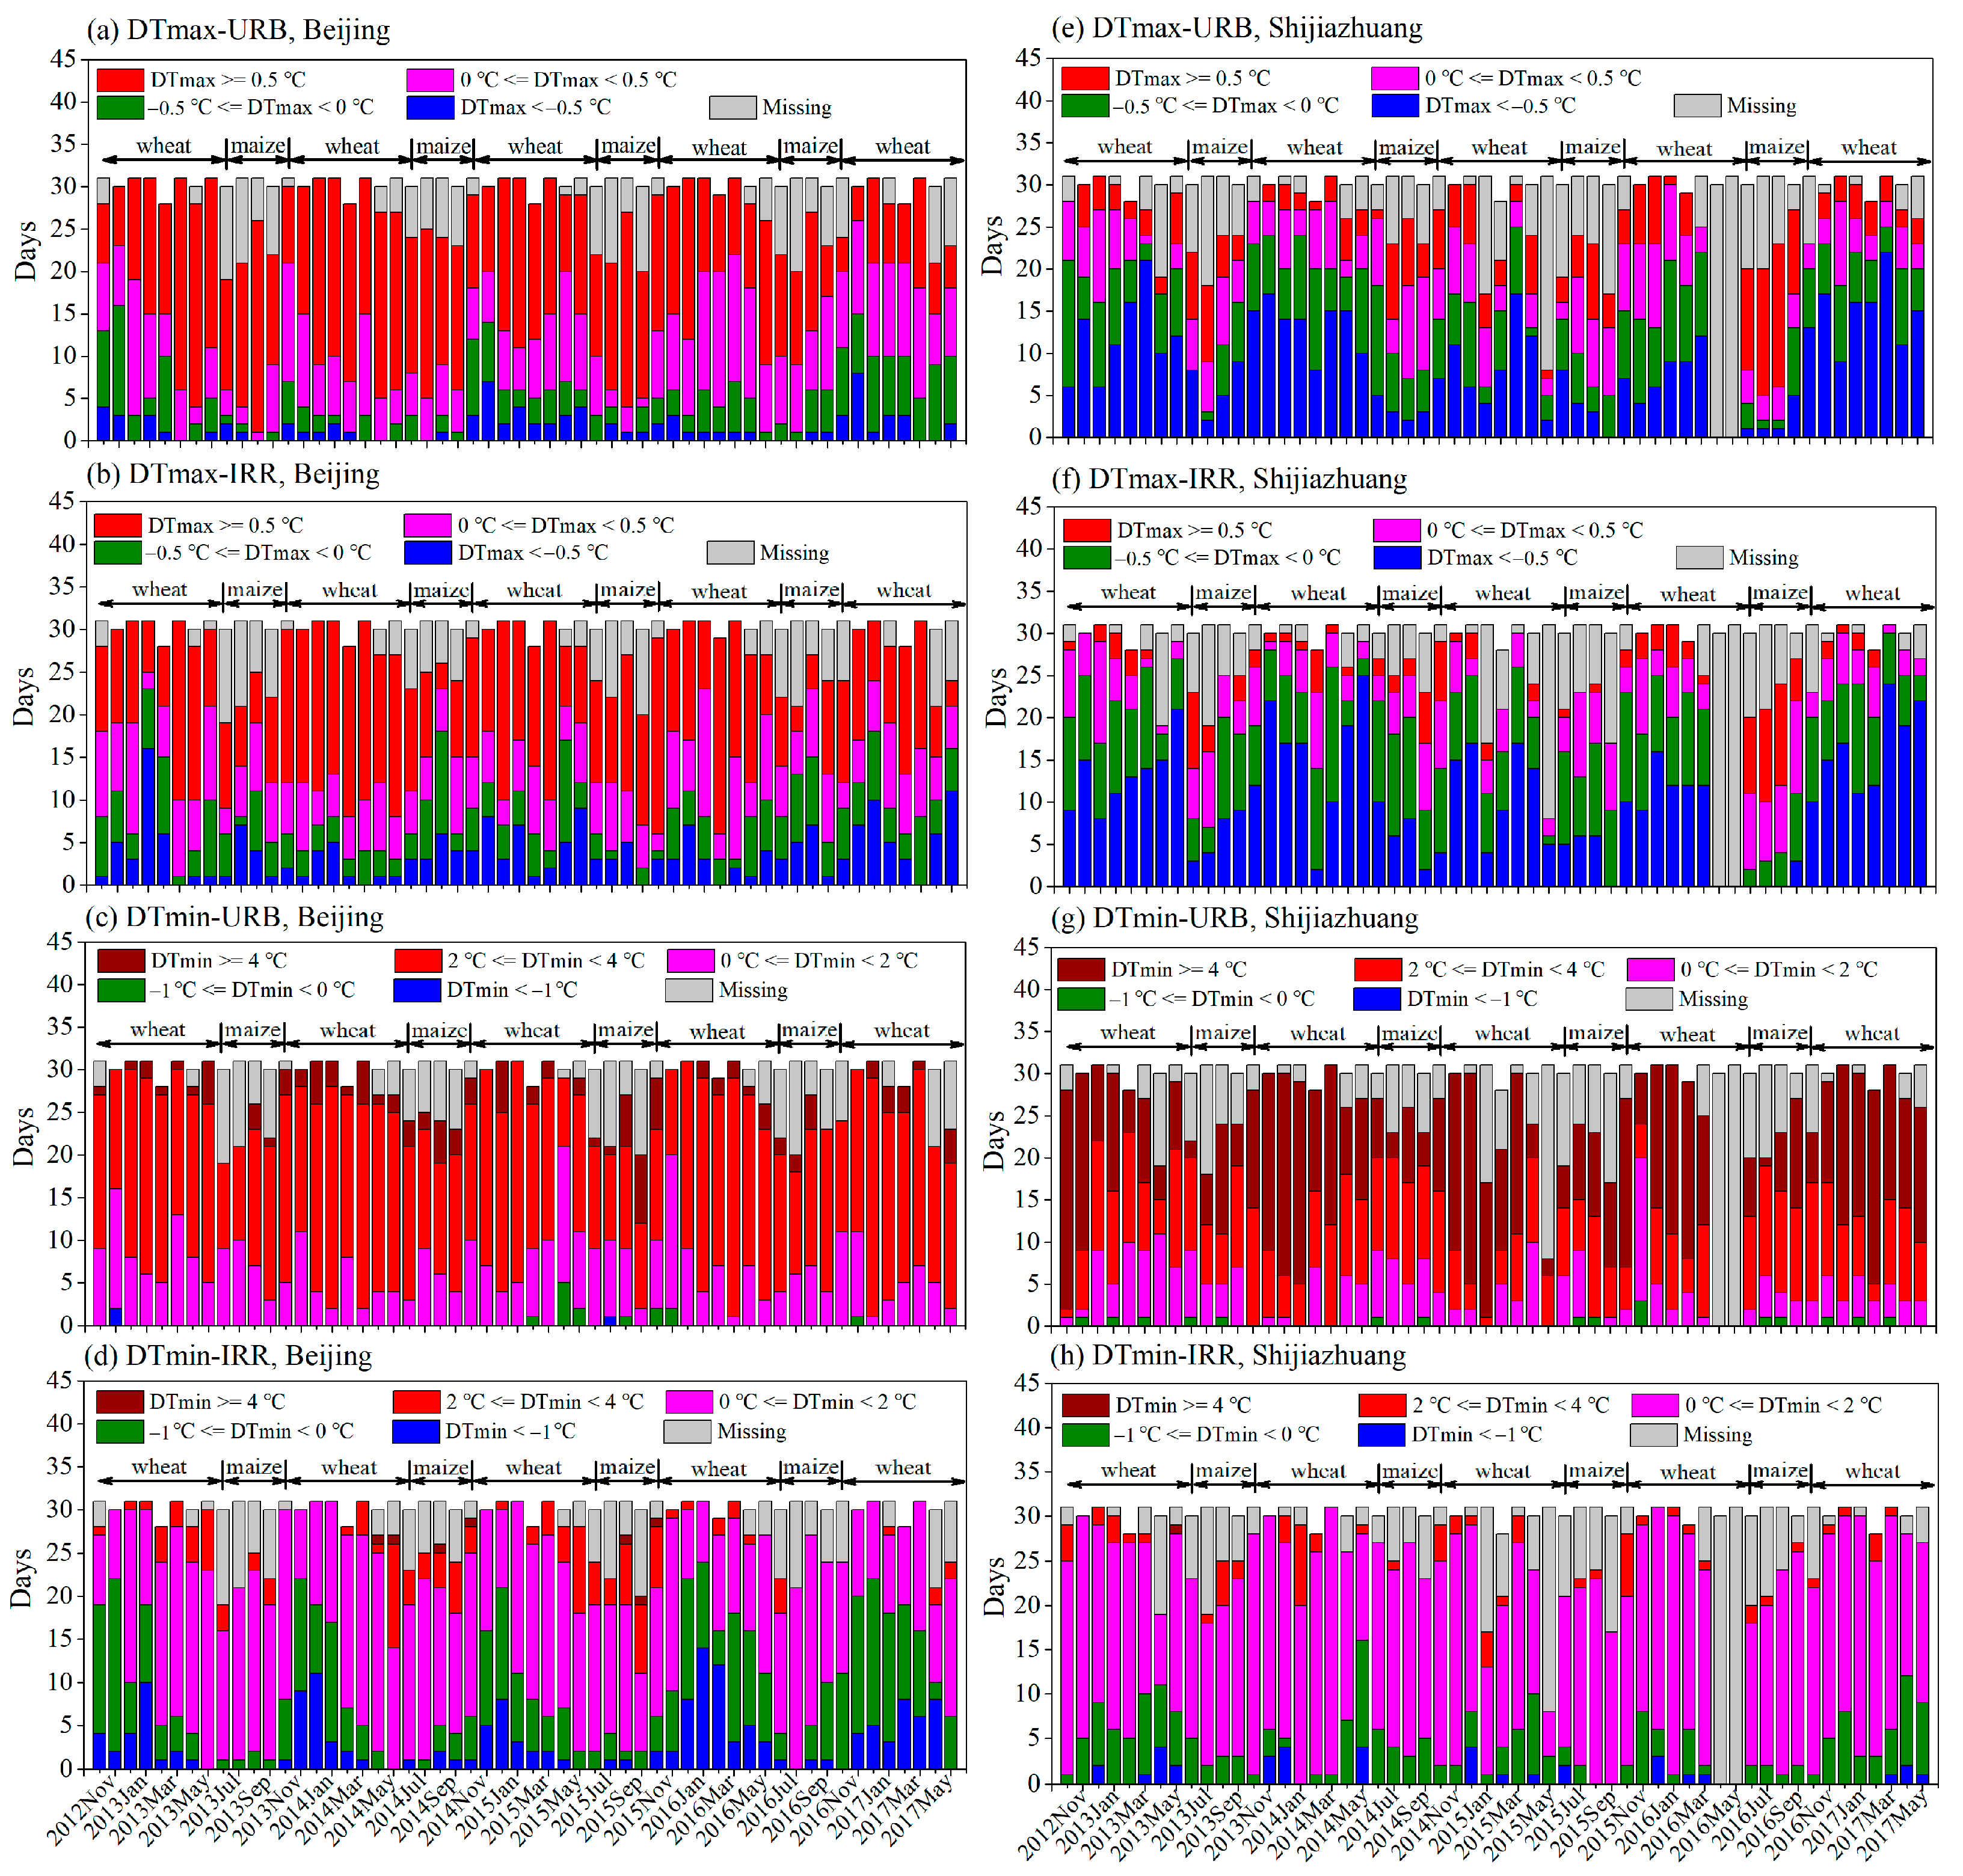
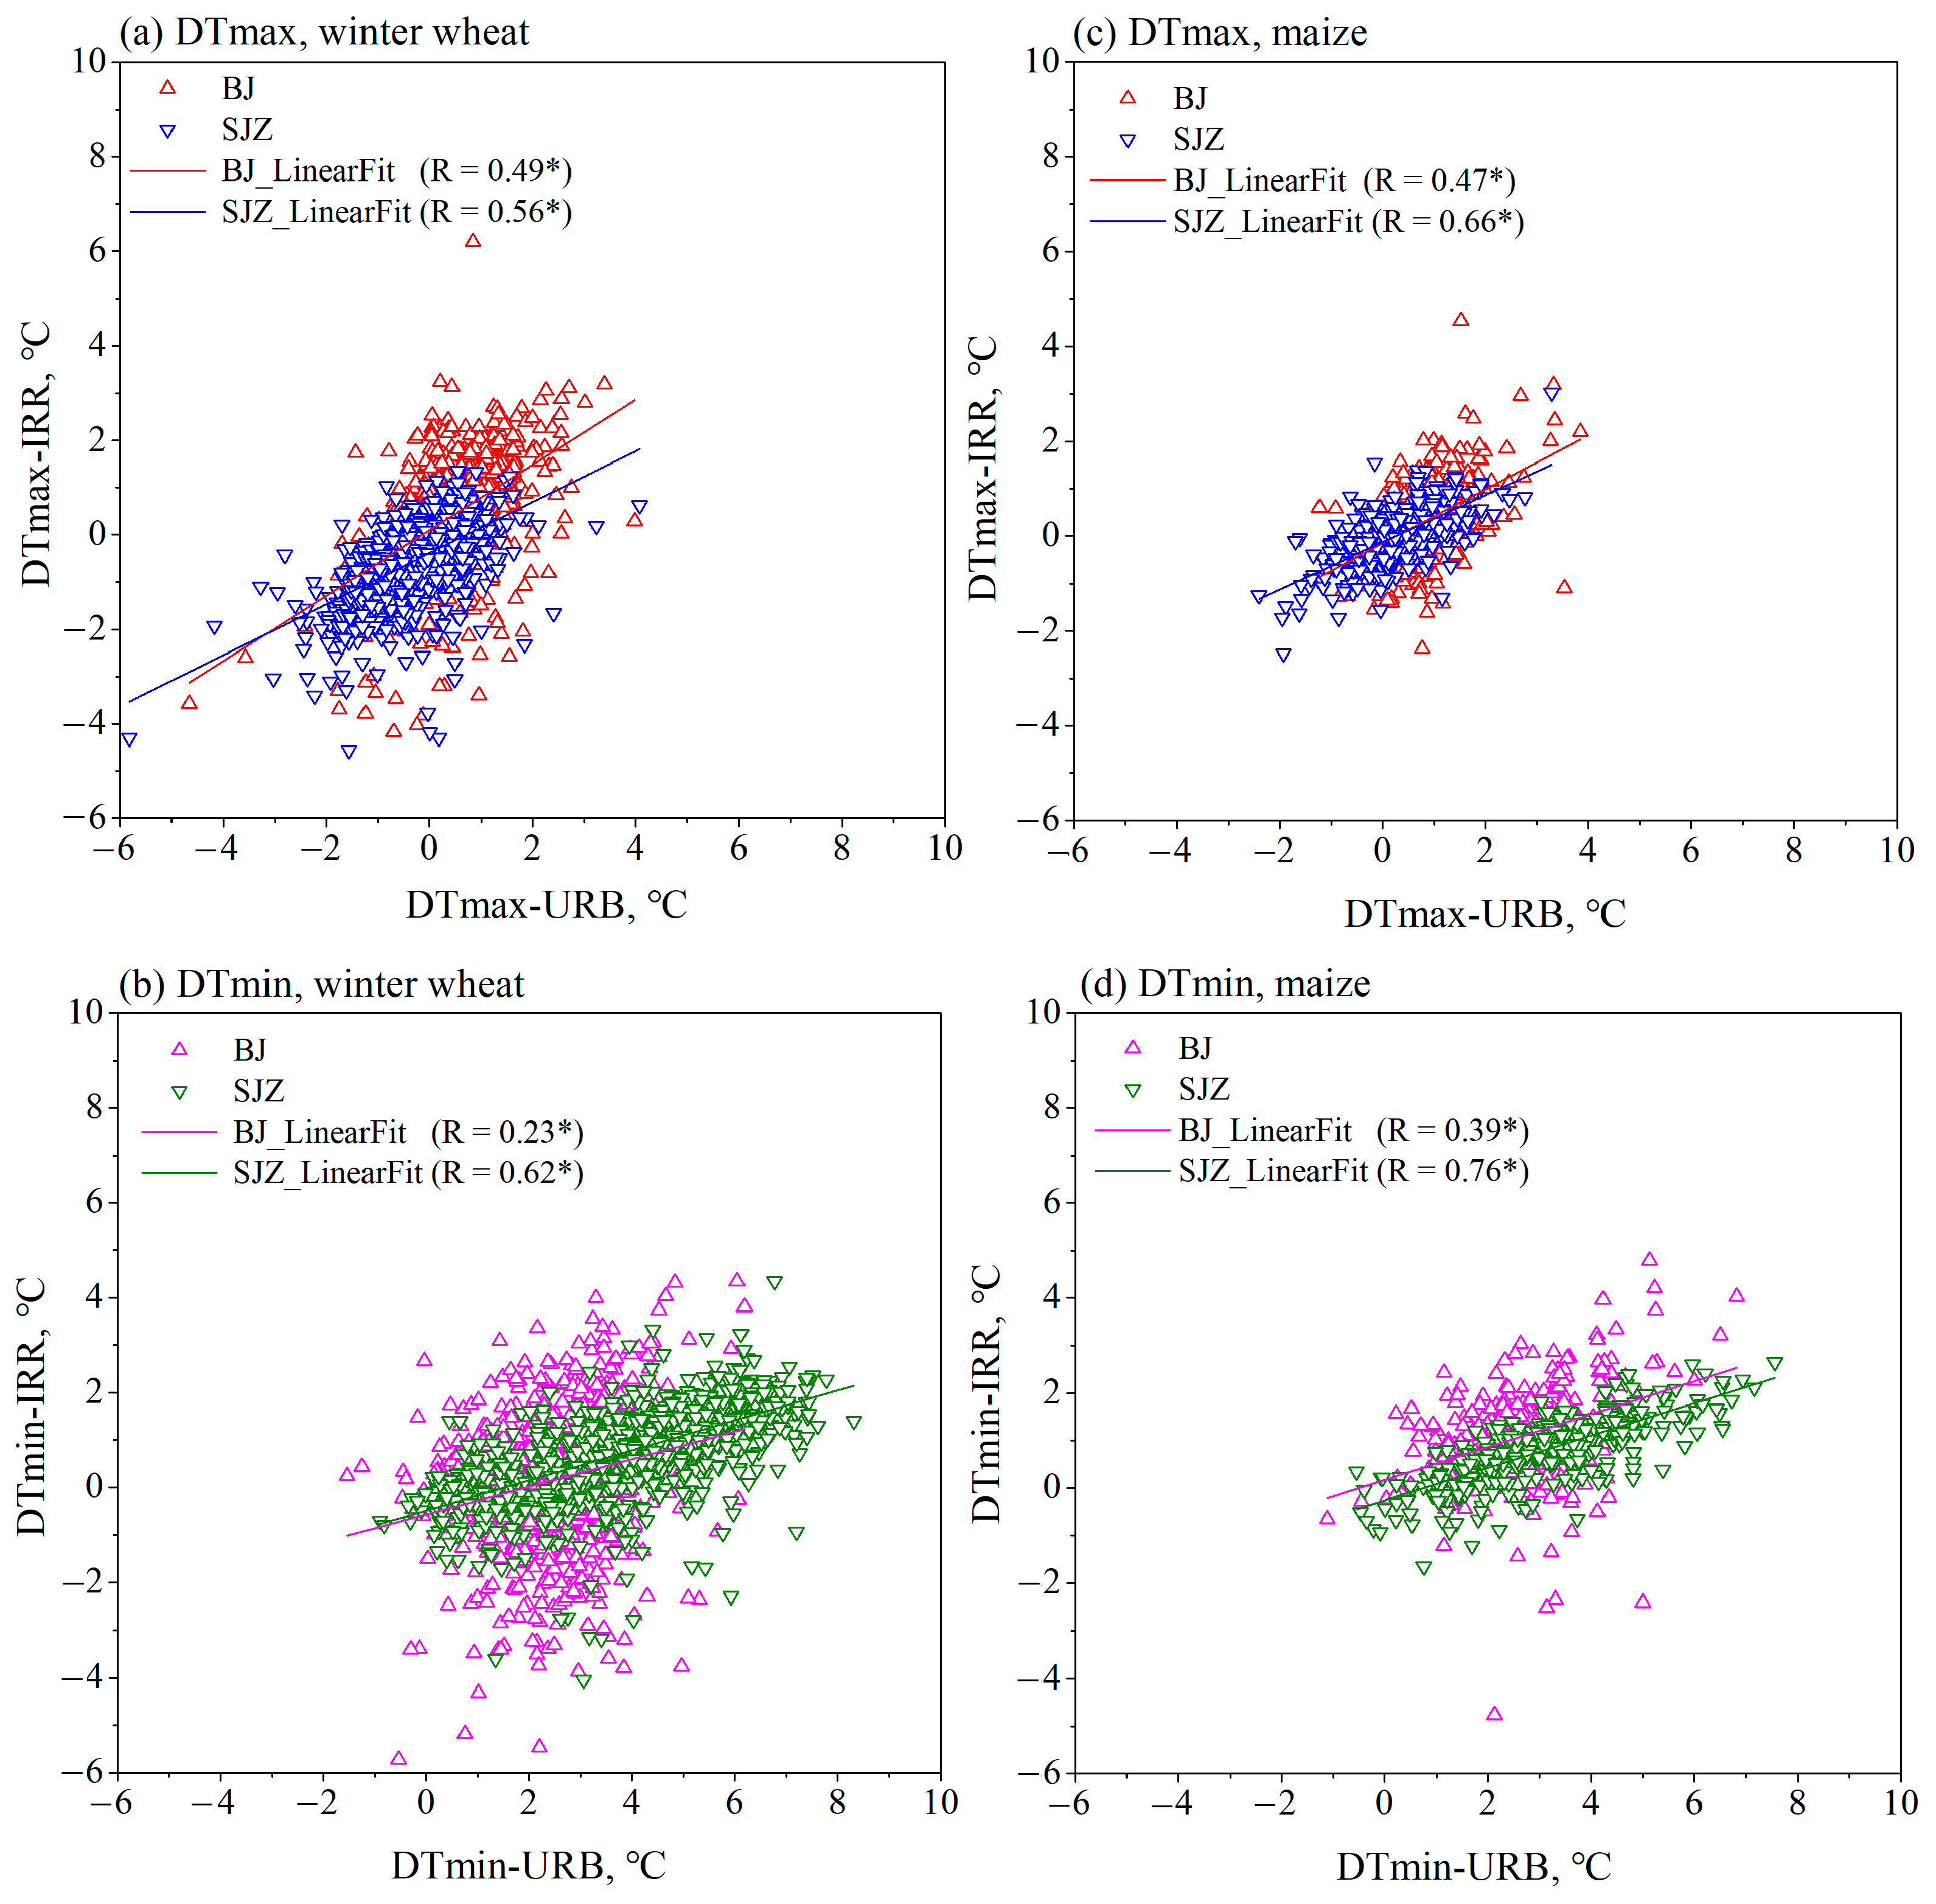
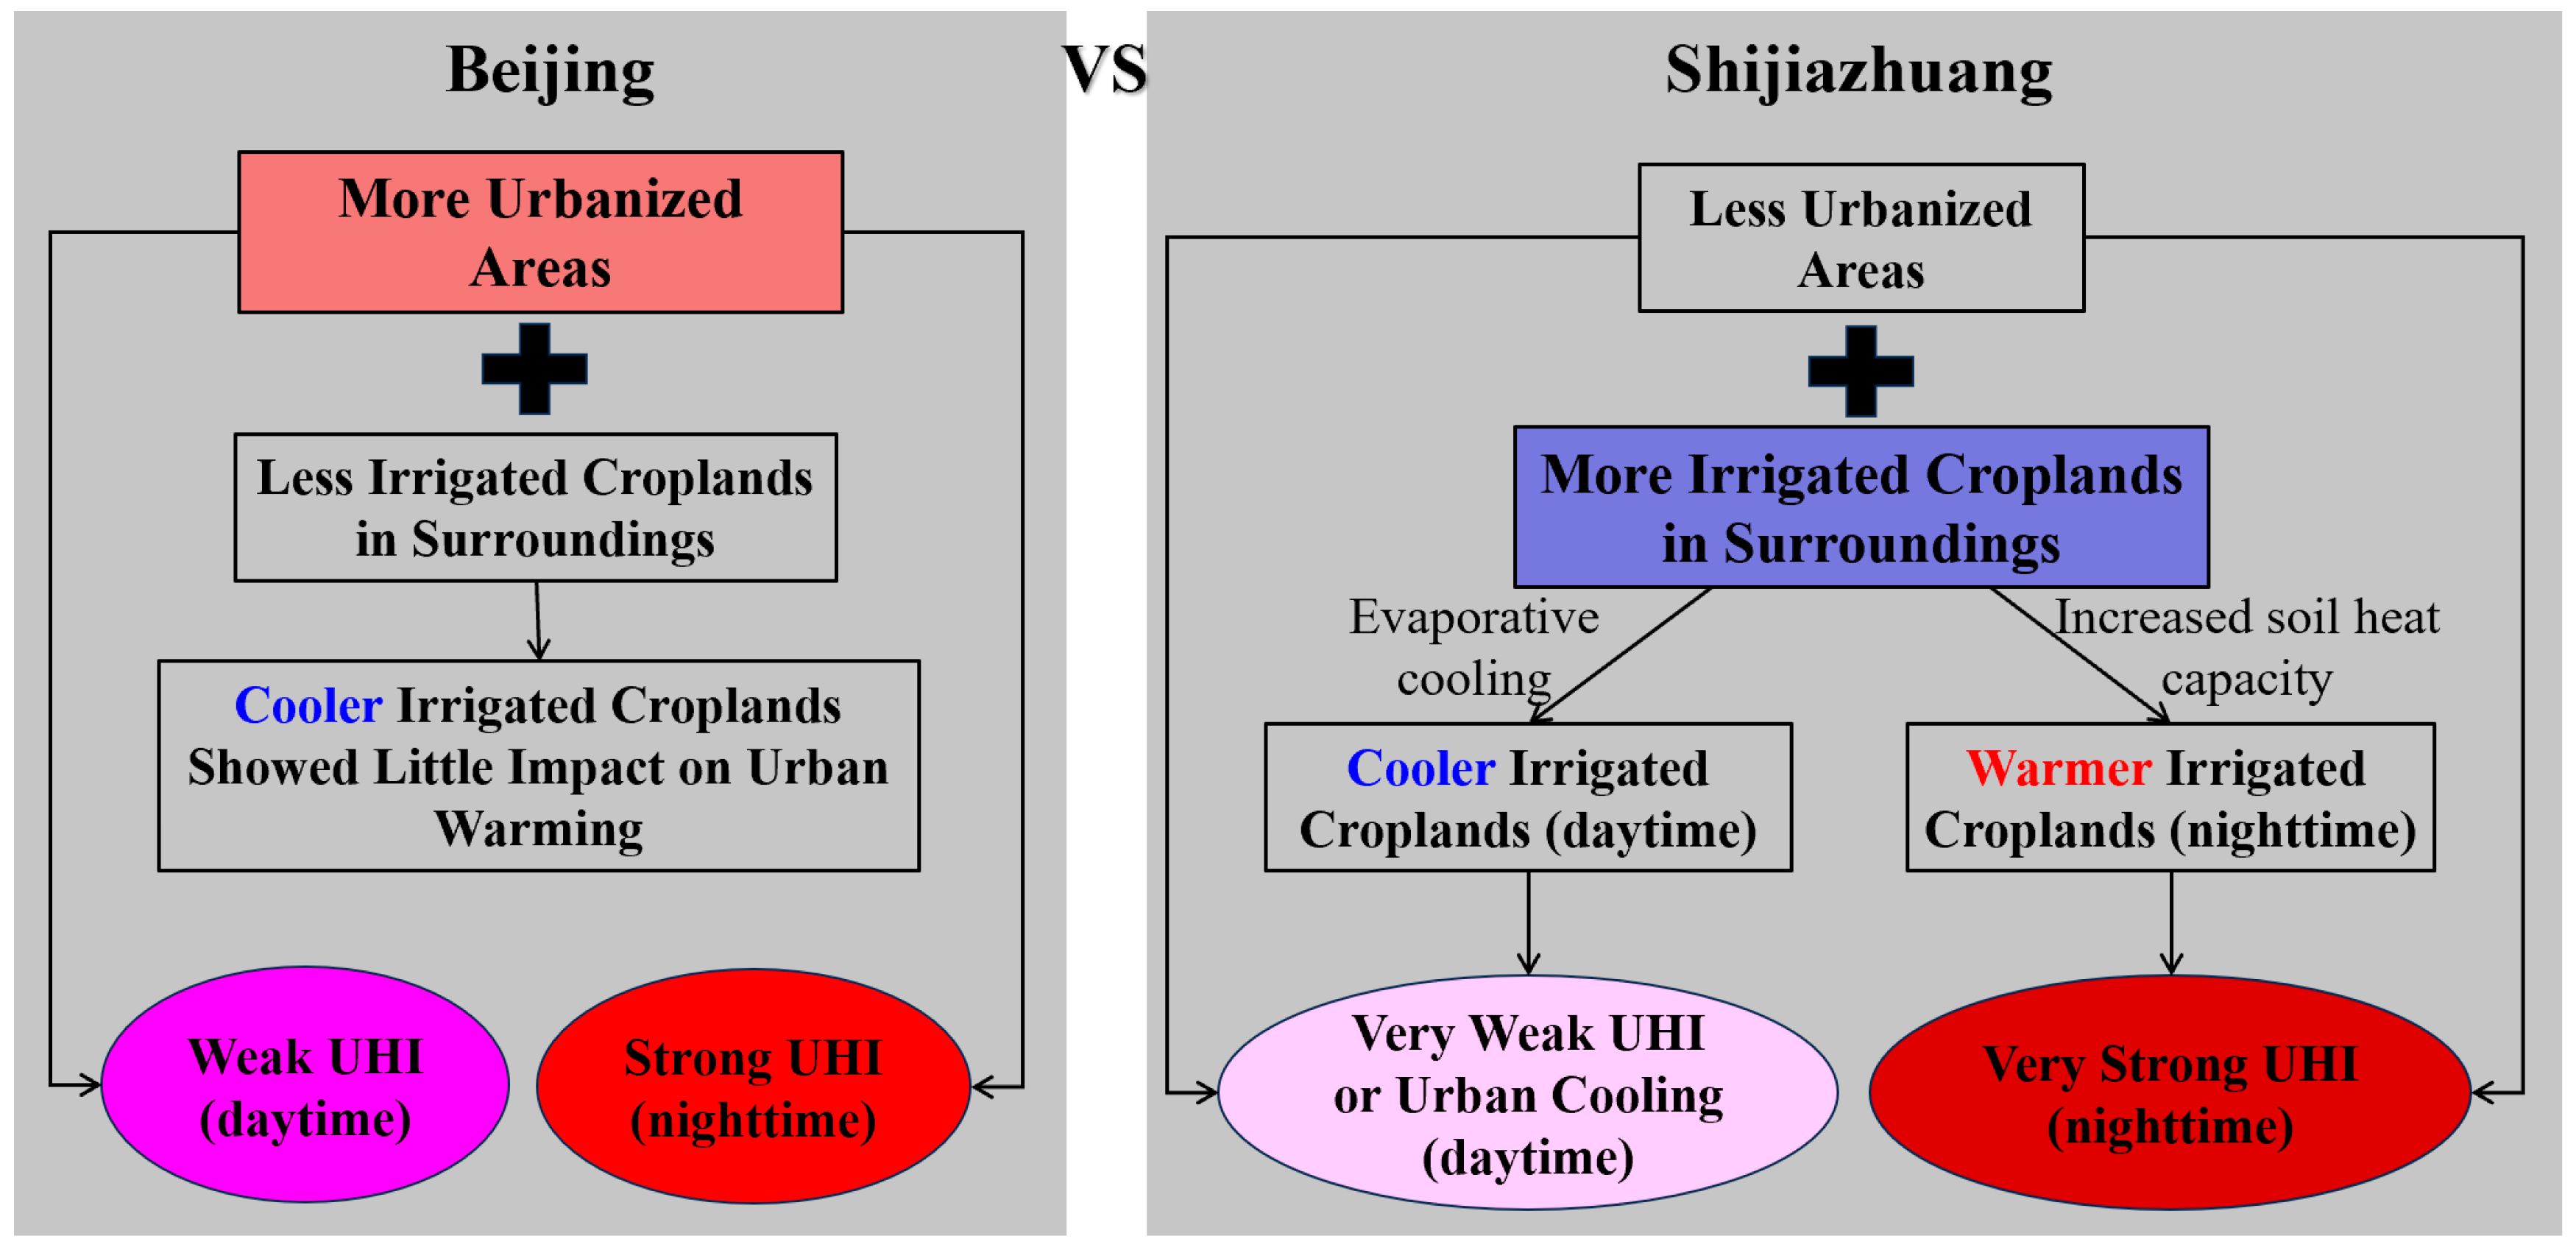
3.2. Differences in Temperature Effects Between Beijing and Shijiazhuang

The degree of urbanization and irrigation implementation (Figure 2) varies spatially, which could cause different surface air temperature contrasts. In this section, using Beijing and Shijiazhuang (the capital of Hebei province, which is less urbanized and more heavily irrigated than Beijing; see Figure 2a,b and the subregion indicated by the red rectangle in Figure 2c) as examples, we further compared the temperature effects of urbanization and cropland irrigation over the two subregions. The influence of geographic location was ignored, and the reference surface air temperature was estimated as the average of all reference stations within each subregion.
The monthly number of days with cooler or warmer urban/irrigated cropland stations compared to reference stations was counted for the two subregions (Figure 7). For Beijing, which is more urbanized (Figure 2b), urban stations were predominantly warmer than reference ones despite a few days with slightly cooler daytime surface air temperatures (Figure 7a), and nighttime urban warming was stronger, especially in winter months (Figure 7c). Despite the much smaller extent of irrigation compared to Shijiazhuang (Figure 2a,c), the cooling effect of irrigation in Beijing could not be neglected during the nighttime in some of the winter wheat-growing months, with ~20 days when irrigated cropland stations were cooler than reference stations (Figure 7b,d). For Shijiazhuang, which is more heavily irrigated (Figure 2a), the most significant urban warming also occurred during the nighttime in winter months, and the warming was even stronger than in the more urbanized Beijing (Figure 7c,g). Interestingly, instead of urban warming, the daytime surface air temperatures at urban stations in Shijiazhuang were cooler than reference stations for over 15 days in most of the winter wheat-growing months (see Figure 7e). Simultaneously, the daytime cooling at irrigated cropland stations was also prominent in Shijiazhuang for these months (Figure 7f), and it was stronger and longer-lasting than the irrigation cooling in Beijing (Figure 7d) due to more extensive irrigation in Shijiazhuang. Note that irrigated cropland stations in Shijiazhuang tended to be generally warmer than reference stations during the nighttime (Figure 7h), which could be attributed to a larger heat capacity of soil increased by irrigation water [22,31,45]. This nighttime warming at irrigated cropland stations in Shijiazhuang is consistent with Chen and Jeong [22] and Shi et al. (2014) [36].
Figure 6. Time series of monthly average surface air temperature difference (unit: °C) relative to the fitted reference values for the indices of (a) Tmax and (b) Tmin. The red, blue, and gray columns represent the temperature differences averaged for urban stations, irrigated cropland stations, and all of them, respectively. Note that observation data for Hebei and Tianjin in April and May 2016 were missing.
Remotesensing 17 02256 g006
Compared with Beijing, the unexpected daytime urban cooling and stronger nighttime urban warming in Shijiazhuang could be associated with the greater impact of surrounding cropland irrigation. The linear regression analysis showed a significant positive correlation between surface air temperature changes at urban and irrigated cropland stations, and the larger correlation coefficients in Shijiazhuang indicate that urban warming/cooling in Shijiazhuang could be more significantly affected by extensive irrigation in surrounding croplands than in Beijing, especially during the nighttime (Figure 8). For instance, the daytime and nighttime correlation coefficients for the winter wheat-growing season in Shijiazhuang were 0.56 and 0.62, respectively, with the latter being about triple that for Beijing.

4. Discussion

4.1. Temporal and Spatial Variations of Thermal Contrasts and Possible Implications

Our results demonstrate the thermal contrasts between built-up and irrigated lands over the BTH region, which generally agree with the contrasting temperature changes individually reported by previous studies on urban [7,8,9,11,13,14] or irrigation [15,17,22,23] impacts. In the case of prevailing urban warming throughout the year, the thermal contrasts were most pronounced during the daytime in late autumn, early winter, and late spring months when irrigation for winter wheat mainly occurred [37,38] and evaporative cooling was non-negligible. The magnitude of irrigation cooling here was comparable to that for maize/soybean fields in the Great Plains [23]. At nighttime, many irrigated cropland stations became slightly warmer than reference stations, which agrees with the nighttime warming of irrigation over the North China Plain reported by Chen and Jeong [22] and Shi et al. (2014) [36]. This could be due to an increased soil heat capacity from irrigation water [22,31,45], which helped store more energy in the daytime in the wet soil. The increased atmospheric water vapor due to irrigation could also enhance the local greenhouse effect and increase nighttime temperatures [46]. Collectively, the vast stretches of irrigated croplands helped mitigate daytime urban warming, and the overall cooling trend they induced for the whole BTH region was in agreement with limited studies on the combined effects of urbanization and irrigation [34,36].
Additionally, the contrasting temperature changes due to urbanization and cropland irrigation were also spatially variable. The more urbanized Beijing was predominantly characterized by urban warming, whereas Shijiazhuang, which is less urbanized and more heavily irrigated, experienced stronger and longer-lasting irrigation-induced cooling during the daytime in most of the winter wheat-growing months. The nighttime warming due to irrigation was also significant in Shijiazhuang. Interestingly, urban stations in Shijiazhuang tended to be notably cooler than reference stations during the daytime, while the nighttime warming intensity was even stronger than in Beijing. This could be due to a greater impact of surrounding cropland irrigation on urban warming in Shijiazhuang, as indicated by the larger correlation coefficients between surface air temperature changes at urban and irrigated stations (Figure 8). The contrasting daytime and nighttime temperature changes during the winter wheat-growing months are summarized for the two subregions in Figure 9, and the results highlight the potential role of cropland irrigation in urban warming/cooling for cities surrounded by extensive irrigated croplands, such as Shijiazhuang.

4.2. Uncertainties and Future Work

Uncertainties remain in this work. For instance, due to limited data, changes in urbanized and irrigated fractional areas were not considered when conducting site categorization. The effects of irrigation and its memory largely depend on irrigation water amounts and application timing [23,24], and the lack of detailed irrigation data limited our understanding of the occurrence of irrigation cooling as well as its magnitude in different growing seasons for different subregions. Additionally, only Beijing and Shijiazhuang were selected here for investigating the spatial variation of thermal contrasts induced by urbanization and irrigation, and future analyses should be extended to more regions, such as the Yangtze River Delta, where highly urbanized areas are also surrounded by heavily irrigated croplands [33]. This study serves as a first step toward a better understanding of the impacts of urbanization and irrigation on local and regional circulation and precipitation patterns. More importantly, future efforts should be directed toward investigating the roles of the temperature contrasts between built-up and irrigated lands in local and regional circulation patterns across different growing seasons.

5. Conclusions

Urbanization and cropland irrigation modify land surface water and energy budgets in different ways [8,10,11,12,15,17,20,23]. However, few observational studies have explicitly quantified the contrasts in surface air temperature between them, which could modulate local and regional circulation and precipitation patterns [34,35]. Thus, an observation-focused study is imperative. Using high-resolution observations from over 2000 surface weather stations as well as urban and irrigation fraction data, we investigated the individual and combined effects of urbanization and irrigation on surface air temperature over the BTH region in China, where highly urbanized areas and heavily irrigated croplands coexist.
Results indicate that irrigation generally produced a cooling of ~0.1–0.5 °C at irrigated cropland stations during the daytime in late autumn, early winter, and late spring months, when irrigation for winter wheat mainly occurred [37,38]. For urban stations, warming was most significant at nighttime throughout the year, especially in winter months, while weaker daytime warming at urban sites was comparable in magnitude to the cooling induced by concurrent irrigation for winter wheat. Collectively, the vast stretches of irrigated croplands helped mitigate the warming due to urbanization, especially in the daytime during the winter wheat-growing season. In some winter wheat-growing months, their combined effect on the daytime surface air temperature for the whole region resulted in a slight cooling of ~0.2 °C (relative to reference stations). The contrasting changes in surface air temperature due to urbanization and irrigation also exhibited spatial variation. Beijing was predominantly characterized by urban warming, while Shijiazhuang, with extensive irrigation, exhibited prominent irrigation cooling (or slight warming) during the daytime (or nighttime) in most of the winter wheat-growing months, which could be a possible contributor to the daytime cooling (or stronger nighttime warming) at urban sites. This work highlights the temperature contrasts between urban areas and surrounding irrigated croplands, as well as the potential role of extensive irrigation in mitigating (or enhancing) daytime (or nighttime) urban warming.

Author Contributions

Conceptualization, X.X.; methodology, X.X. and S.M.; data curation, X.X., S.M., Y.Z. and J.D.; writing—original draft preparation, X.X.; writing—review and editing, X.X., S.M., Y.Z. and J.D.; visualization, X.X. All authors have read and agreed to the published version of the manuscript.

Funding

This research was funded by the National Natural Science Foundation of China (Grant No. 42105170), the Jiangsu Province Association for Science and Technology Youth Talent Support Program (No. JSTJ-2023-072), and supporting funds for talent at Nanjing University of Aeronautics and Astronautics.

Data Availability Statement

The data presented in this study are available from the corresponding author upon reasonable request. The data are not publicly available due to the fact that we need to conduct more research based on these data.

Conflicts of Interest

The authors declare no conflicts of interest.

References

  1. Snyder, M.A.; Kueppers, L.M.; Sloan, L.C.; Cayan, D.; Jin, J.; Kanamaru, H.; Kanamitsu, M.; Miller, N.L.; Tyree, M.; Du, H.; et al. Regional Climate Effects of Irrigation and Urbanization in the Western United States: A Model Intercomparison. California Energy Commission, PIER Energy-Related Environmental Research, CEC-500-2006-031. 2006. Available online: https://escholarship.org/uc/item/3979q78z (accessed on 26 June 2025).
  2. Ellis, E.C.; Goldewijk, K.K.; Siebert, S.; Lightman, D.; Ramankutty, N. Anthropogenic transformation of the biomes, 1700 to 2000. Global Ecol. Biogeogr. 2010, 19, 589–606. [Google Scholar] [CrossRef]
  3. Siebert, S.; Kummu, M.; Porkka, M.; Döll, P.; Ramankutty, N.; Scanlon, B.R. A global data set of the extent of irrigated land from 1900 to 2005. Hydrol. Earth Syst. Sci. 2015, 19, 1521–1545. [Google Scholar] [CrossRef]
  4. Liu, X.; Huang, Y.; Xu, X.; Li, X.; Li, X.; Ciais, P.; Lin, P.; Gong, K.; Ziegler, A.D.; Chen, A.; et al. High-spatiotemporal-resolution mapping of global urban change from 1985 to 2015. Nat. Sustain. 2020, 3, 564–570. [Google Scholar] [CrossRef]
  5. Gao, J.; O’Neill, B.C. Mapping global urban land for the 21st century with data-driven simulations and Shared Socioeconomic Pathways. Nat. Commun. 2020, 11, 2302. [Google Scholar] [CrossRef] [PubMed]
  6. Puy, A.; Lo Piano, S.; Saltelli, A. Current models underestimate future irrigated areas. Geophys. Res. Lett. 2020, 47, e2020GL087360. [Google Scholar] [CrossRef]
  7. Arnfield, A.J. Two decades of urban climate research: A review of turbulence, exchanges of energy and water, and the urban heat island. Int. J. Climatol. 2003, 23, 1–26. [Google Scholar] [CrossRef]
  8. Qian, Y.; Chakraborty, T.C.; Li, J.; Li, D.; He, C.; Sarangi, C.; Chen, F.; Yang, X.; Leung, L.R. Urbanization Impact on Regional Climate and Extreme Weather: Current Understanding, Uncertainties, and Future Research Directions. Adv. Atmos. Sci. 2022, 39, 819–860. [Google Scholar] [CrossRef]
  9. Oke, T.R. The energetic basis of the urban heat island. Quart. J. Roy. Meteor. Soc. 1982, 108, 1–24. [Google Scholar] [CrossRef]
  10. Kusaka, H.; Kimura, F. Thermal effects of urban canyon structure on the nocturnal heat island: Numerical experiment using a mesoscale model coupled with an urban canopy model. J. Appl. Meteor. 2004, 43, 1899–1910. [Google Scholar] [CrossRef]
  11. Grimmond, S. Urbanization and global environmental change: Local effects of urban warming. Geogr. J. 2007, 173, 83–88. [Google Scholar] [CrossRef]
  12. Miao, S.; Chen, F.; Li, Q.; Fan, S. Impacts of urban processes and urbanization on summer precipitation: A case study of heavy rainfall in Beijing on 1 August 2006. J. Appl. Meteor. Climatol. 2011, 50, 806–825. [Google Scholar] [CrossRef]
  13. Dou, J.; Wang, Y.; Bornstein, R.D.; Miao, S. Observed Spatial Characteristics of Beijing Urban Climate Impacts on Summer Thunderstorms. J. Appl. Meteor. Climatol. 2015, 54, 94–105. [Google Scholar] [CrossRef]
  14. Santamouris, M. Analyzing the heat island magnitude and characteristics in one hundred Asian and Australian cities and regions. Sci. Total Environ. 2015, 512–513, 582–598. [Google Scholar] [CrossRef] [PubMed]
  15. Bonfils, C.; Lobell, D. Empirical evidence for a recent slowdown in irrigation-induced cooling. Proc. Natl. Acad. Sci. USA 2007, 104, 13582–13587. [Google Scholar] [CrossRef]
  16. Kueppers, L.M.; Snyder, M.A.; Sloan, L.C. Irrigation cooling effect: Regional climate forcing by land use change. Geophys. Res. Lett. 2007, 34, L03703. [Google Scholar] [CrossRef]
  17. Lobell, D.B.; Bonfils, C. The Effect of Irrigation on Regional Temperatures: A Spatial and Temporal Analysis of Trends in California, 1934–2002. J. Clim. 2008, 21, 2063–2071. [Google Scholar] [CrossRef]
  18. Sacks, W.J.; Cook, B.I.; Buenning, N.; Levis, S.; Helkowski, J.H. Effects of global irrigation on the near-surface climate. Clim. Dynam. 2009, 33, 159–175. [Google Scholar] [CrossRef]
  19. Puma, M.J.; Cook, B.I. Effects of irrigation on global climate during the 20th century. J. Geophys. Res. Atmos. 2010, 115, 1–15. [Google Scholar] [CrossRef]
  20. Leng, G.; Huang, M.; Tang, Q.; Sacks, W.J.; Lei, H.; Leung, L.R. Modeling the effects of irrigation on land surface fluxes and states over the conterminous United States: Sensitivity to input data and model parameters. J. Geophys. Res. Atmos. 2013, 118, 9789–9803. [Google Scholar] [CrossRef]
  21. Pei, L.; Moore, N.; Zhong, S.; Kendall, A.D.; Gao, Z.; Hyndman, D.W. Effects of irrigation on summer precipitation over the United States. J. Clim. 2016, 29, 3541–3558. [Google Scholar] [CrossRef]
  22. Chen, X.; Jeong, S. Irrigation enhances local warming with greater nocturnal warming effects than daytime cooling effects. Environ. Res. Lett. 2018, 13, 24005. [Google Scholar] [CrossRef]
  23. Chen, F.; Xu, X.; Barlage, M.; Rasmussen, R.; Shen, S.; Miao, S.; Zhou, G. Memory of irrigation effects on hydroclimate and its modeling challenge. Environ. Res. Lett. 2018, 13, 64009. [Google Scholar] [CrossRef]
  24. Xu, X.; Chen, F.; Barlage, M.; Gochis, D.; Miao, S.; Shen, S. Lessons learned from modeling irrigation from field to regional scales. J. Adv. Model. Earth Syst. 2019, 11, 2428–2448. [Google Scholar] [CrossRef]
  25. Hou, M.; Zhao, L.; Lin, A. Irrigation Cooling Effect on Local Temperatures in the North China Plain Based on an Improved Detection Method. Remote Sens. 2023, 15, 4571. [Google Scholar] [CrossRef]
  26. United Nations, Department of Economic and Social Affairs, Population Division. World Urbanization Prospects: The 2018 Revision (ST/ESA/SER.A/420); United Nations: New York, NY, USA, 2019; Available online: https://population.un.org/wup/assets/WUP2018-Report.pdf (accessed on 26 June 2025).
  27. Siebert, S.; Döll, P. Quantifying blue and green water uses and virtual water contents in global crop production as well as potential production losses without irrigation. J. Hydrol. 2010, 384, 198–217. [Google Scholar] [CrossRef]
  28. Douglas, E.M.; Beltrán-Przekurat, A.; Niyogi, D.; Pielke, R.A.; Vörösmarty, C.J. The impact of agricultural intensification and irrigation on land–atmosphere interactions and Indian monsoon precipitation—A mesoscale modeling perspective. Global Planet. Change 2009, 67, 117–128. [Google Scholar] [CrossRef]
  29. Guimberteau, M.; Laval, K.; Perrier, A.; Polcher, J. Global effect of irrigation and its impact on the onset of the Indian summer monsoon. Clim. Dynam. 2012, 39, 1329–1348. [Google Scholar] [CrossRef]
  30. Shukla, S.P.; Puma, M.J.; Cook, B.I. The response of the South Asian Summer Monsoon circulation to intensified irrigation in global climate model simulations. Clim. Dynam. 2014, 42, 21–36. [Google Scholar] [CrossRef]
  31. Kalnay, E.; Cai, M. Impact of urbanization and land-use change on climate. Nature 2003, 423, 528–531. [Google Scholar] [CrossRef]
  32. Han, S.; Tang, Q.; Xu, D.; Yang, Z. Impacts of urbanization and agricultural development on observed changes in surface air temperature over mainland China from 1961 to 2006. Theor. Appl. Climatol. 2019, 135, 1595–1607. [Google Scholar] [CrossRef]
  33. Zhou, D.; Li, D.; Sun, G.; Zhang, L.; Liu, Y.; Hao, L. Contrasting effects of urbanization and agriculture on surface temperature in eastern China. J. Geophys. Res. Atmos. 2016, 121, 9597–9606. [Google Scholar] [CrossRef]
  34. Cui, F.; Hamdi, R.; He, H.; Yuan, X.; Yang, T.; Tang, H.; Wang, B.; Zhang, Q.; Termonia, P.; Maeyer, P.D. Interplay between urbanization and irrigation on summer climate in the Huang-Huai-Hai plain, China. J. Geophys. Res. Atmos. 2022, 127, e2021JD036053. [Google Scholar] [CrossRef]
  35. Li, J.; Qian, Y.; Leung, L.R.; Feng, Z.; Sarangi, C.; Liu, Y.; Yang, Z. Impacts of large-scale urbanization and irrigation on summer precipitation in the Mid-Atlantic region of the United States. Geophys. Res. Lett. 2022, 49, e2022GL097845. [Google Scholar] [CrossRef]
  36. Shi, W.; Tao, F.; Liu, J. Regional temperature change over the Huang-Huai-Hai Plain of China: The roles of irrigation versus urbanization. Int. J. Climatol. 2014, 34, 1181–1195. [Google Scholar] [CrossRef]
  37. Iqbal, M.A.; Shen, Y.J.; Stricevic, R.; Pei, H.; Sun, H.; Amiri, E.; Penas, A.; del Rio, S. Evaluation of the FAO AquaCrop model for winter wheat on the North China Plain under deficit irrigation from field experiment to regional yield simulation. Agr. Water Manag. 2014, 135, 61–72. [Google Scholar] [CrossRef]
  38. Liu, T.; Zhou, G.; Tan, K.; Zhou, L. Review on research of irrigation regime and its environmental effect in winter wheat field of North China Plain. Acta Ecol. Sin. 2016, 36, 5979–5986, (In Chinese with English Abstract). [Google Scholar]
  39. Zhang, Y.; Long, H.; Ma, L.; Ge, D.; Tu, S.; Qu, Y. Farmland function evolution in the Huang-Huai-Hai Plain: Processes, patterns and mechanisms. J. Geogr. Sci. 2018, 28, 759–777. [Google Scholar] [CrossRef]
  40. Siebert, S.; Verena, H.; Karen, F.; Jacob, B. Update of the Digital Global Map of Irrigation Areas to Version 5; Rheinische Frie-Drich-Wilhelms-Universität: Bonn, Germany; Food and Agriculture Organization of the United Na-tions: Rome, Italy, 2013; Volume 10, pp. 2660–6728. [Google Scholar]
  41. Xu, X.; Chen, F.; Shen, S.; Miao, S.; Barlage, M.; Guo, W.; Mahalov, A. Using WRF-Urban to assess summertime air conditioning electric loads and their impacts on urban weather in Beijing. J. Geophys. Res. Atmos. 2018, 123, 2475–2490. [Google Scholar] [CrossRef]
  42. Lowry, W.P. Empirical estimation of urban effects on climate: A problem analysis. J. Appl. Meteorol. 1977, 16, 129–135. [Google Scholar] [CrossRef]
  43. Shigeta, Y.; Ohashi, Y.; Tsukamoto, O. Urban Cool Island in daytime-analysis by using thermal image and air temperature measurements. In Proceedings of the Seventh International Conference on Urban Climate, Yokohama, Japan, 29 June 2009. [Google Scholar]
  44. Yang, X.; Li, Y.; Luo, Z.; Chan, P.W. The urban cool island phenomenon in a high-rise high-density city and its mechanisms. Int. J. Climatol. 2016, 37, 890–904. [Google Scholar] [CrossRef]
  45. Mohsin, T.; Gough, W.A. Characterization and estimation of urban heat island at Toronto: Impact of the choice of rural sites. Theor. Appl. Climatol. 2012, 108, 105–117. [Google Scholar] [CrossRef]
  46. Li, H.; Lo, M.-H.; Ryu, D.; Peel, M.; Zhang, Y. Possible increase of air temperature by irrigation. Geophys. Res. Lett. 2022, 49, e2022GL100427. [Google Scholar] [CrossRef]
Figure 1. (a) The location of the study area in China, and (b) the 3 km gridded land-use/land-cover map over the BTH region.
Remotesensing 17 02256 g001
Figure 3. Scatter plots of monthly average surface air temperature against (a) latitude and (b) longitude for reference stations in January 2014. The correlation coefficients between reference air temperature and latitude or longitude are shown in brackets, with star symbols indicating that the coefficients of correlation were statistically significant at the 99.9% confidence level.
Remotesensing 17 02256 g003
Figure 4. Seasonal average surface air temperature differences between (a) urban, (b) irrigated cropland, and reference stations; unit: °C. Here, curves with circle symbols indicate the reference air temperature estimated by the regression model, while curves with star symbols represent the original values with geographic influence not considered.
Remotesensing 17 02256 g004
Figure 5. Boxplots of monthly average surface air temperature difference (unit: °C) for irrigated cropland (indicated by boxes with cold colors) or urban (indicated by boxes with warm colors) relative to the fitted reference values in (a) autumn (September–November), (b) winter (December–February), (c) spring (March–May), and (d) summer (June–August). Note that blue (or red), dark green (or orange), and sky blue (or pink) boxes represent indices of Tmax, Tmin, and Tavg, respectively, for irrigated cropland (or urban) sites. The minimum, maximum, 25th percentile, 75th percentile, and median values of the irrigated cropland or urban stations are shown in these boxes.
Remotesensing 17 02256 g005
Figure 7. Monthly number of days for different ranges of surface air temperature changes relative to the reference for (a,c,e,g) urban and (b,d,f,h) irrigated cropland stations in Beijing (left panels) and Shijiazhuang (right panels). Warm- and cold-colored bars represent surface air temperature differences greater than or less than 0 °C, and gray bars represent missing data.
Remotesensing 17 02256 g007
Figure 8. Scatter plots of daily maximum (top panels) and minimum (bottom panels) surface air temperature changes for urban stations against irrigated cropland stations during the growing season of (a,b) winter wheat (from October to the following May) and (c,d) maize (from June to September). The correlation coefficients for Beijing (BJ) and Shijiazhuang (SJZ) are indicated, and star symbols indicate that the correlation coefficients were statistically significant at the 99.9% confidence level.
Remotesensing 17 02256 g008
Figure 9. A schematic diagram of the contrasting temperature changes (relative to the reference) for day and night in the winter wheat-growing season in Beijing and Shijiazhuang.
Remotesensing 17 02256 g009
Table 1. The median surface air temperature changes for urban/irrigation sites relative to the fitted reference values during the growing season of winter wheat; unit: °C.
OctNovDecJanFebMarAprMayJun
URB2012/2013dTmax0.070.100.290.360.110.25−0.13−0.220.61
dTmin4.173.103.333.803.032.731.972.702.03
2013/2014dTmax0.650.510.490.560.400.130.740.240.30
dTmin3.793.754.274.722.873.312.713.132.73
2014/2015dTmax−0.160.360.470.000.160.110.661.210.44
dTmin3.003.804.454.523.302.832.063.692.86
2015/2016dTmax0.610.210.210.260.171.15−0.100.341.27
dTmin3.601.743.133.592.383.031.902.522.46
2016/2017dTmax−0.330.380.380.240.460.50−0.36−0.15/
dTmin2.633.033.884.332.652.712.463.54/
AVGdTmax0.170.310.370.280.260.430.160.280.66
dTmin3.443.083.814.192.852.922.223.122.52
IRR2012/2013dTmax−0.04−0.34−0.04−0.27−0.38−0.060.09−0.100.17
dTmin0.140.150.400.510.250.230.050.230.23
2013/2014dTmax0.08−0.19−0.26−0.100.24−0.03−0.45−0.210.33
dTmin0.250.160.160.320.300.06−0.07−0.250.29
2014/2015dTmax0.14−0.330.140.120.300.19−0.25−0.270.26
dTmin0.240.020.080.370.310.02−0.320.040.24
2015/2016dTmax0.52−0.21−0.330.190.350.35−0.14 1−0.17 10.54
dTmin0.190.09−0.080.370.030.11−1.38 10.10 10.31
2016/2017dTmax−0.11−0.33−0.58−0.160.260.220.01−0.12/
dTmin−0.06−0.10−0.170.04−0.14−0.08−0.25−0.26/
AVGdTmax0.12−0.28−0.21−0.040.150.13−0.15−0.180.33
dTmin0.150.060.080.320.150.07−0.15−0.060.27
1 Note, observation data for Hebei and Tianjin in April and May 2016 were missing, and they were not included in the calculation of average temperature changes for the whole study period. The numbers in red and blue indicate warmer and cooler temperatures, respectively, than the fitted reference values, and AVG indicates the mean values over the study period.
Disclaimer/Publisher’s Note: The statements, opinions and data contained in all publications are solely those of the individual author(s) and contributor(s) and not of MDPI and/or the editor(s). MDPI and/or the editor(s) disclaim responsibility for any injury to people or property resulting from any ideas, methods, instructions or products referred to in the content.

