
Remote Sensing Image-Based Building Change Detection: A Case Study of the Qinling Mountains in China

 and
and
Abstract
1. Introduction
- (1)
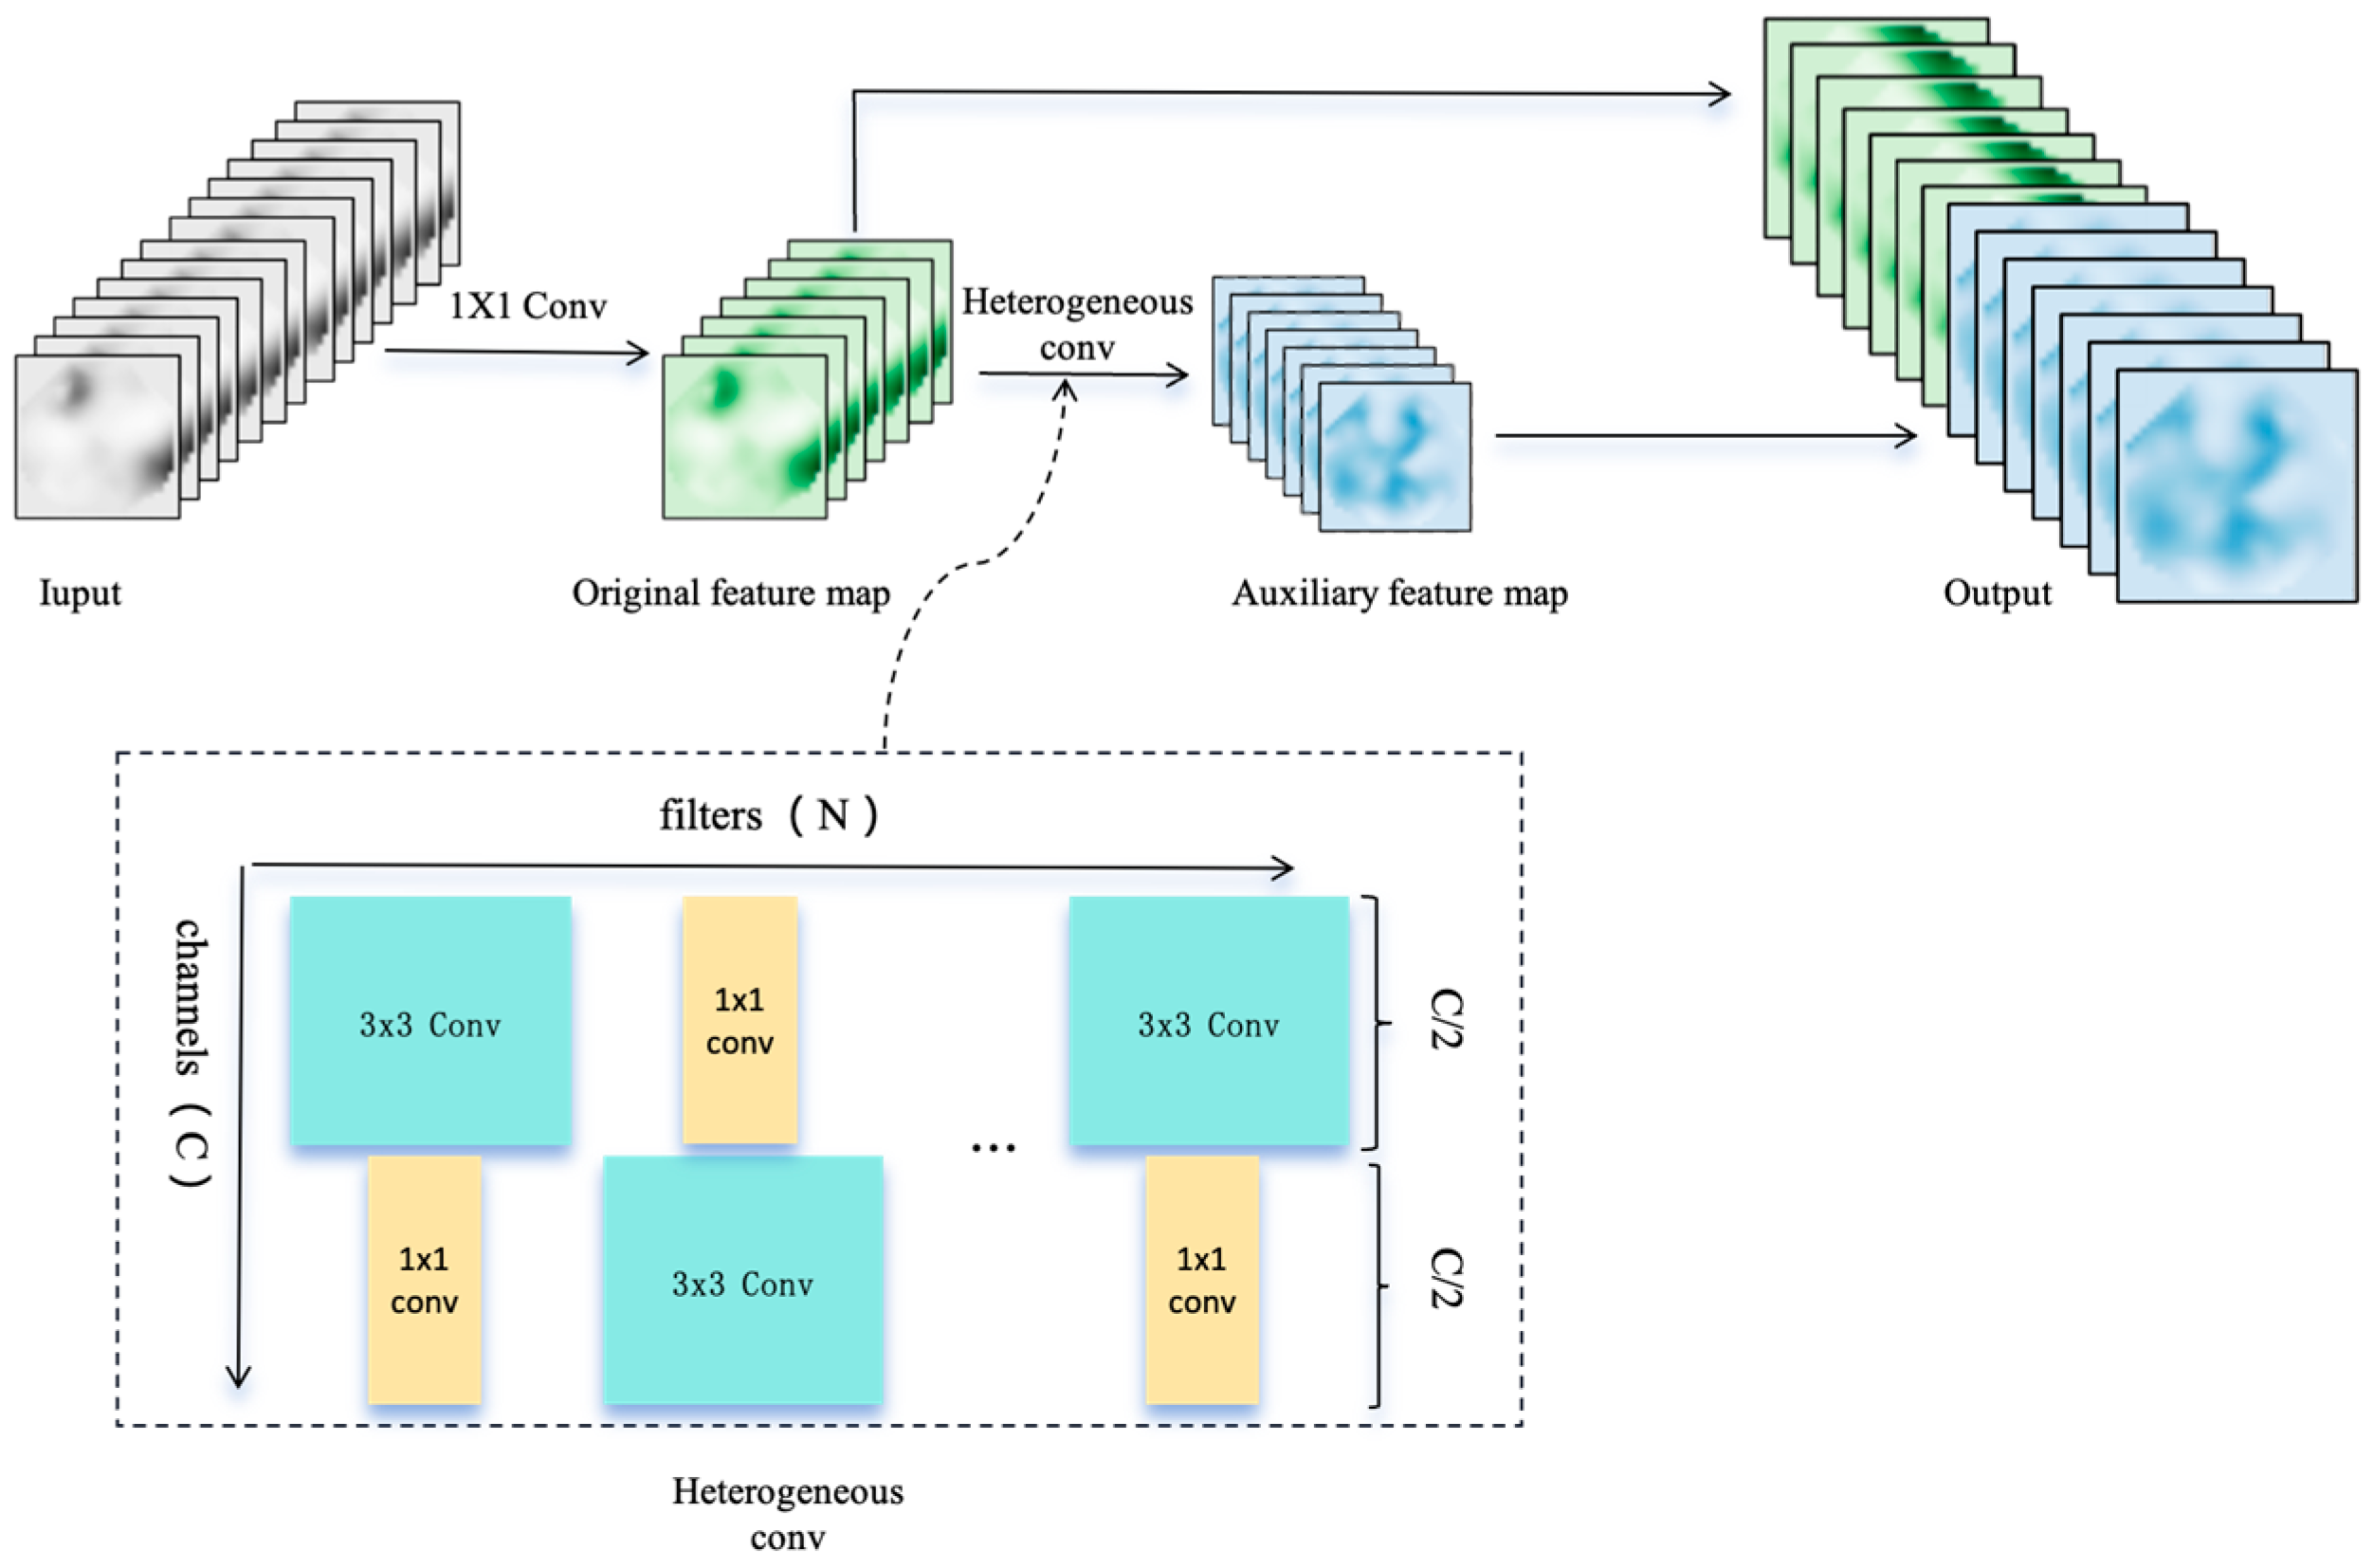
- A Cross-Scale Heterogeneous Convolution (CSHConv) module is introduced to precisely capture key change information across multiple scales.
- (2)
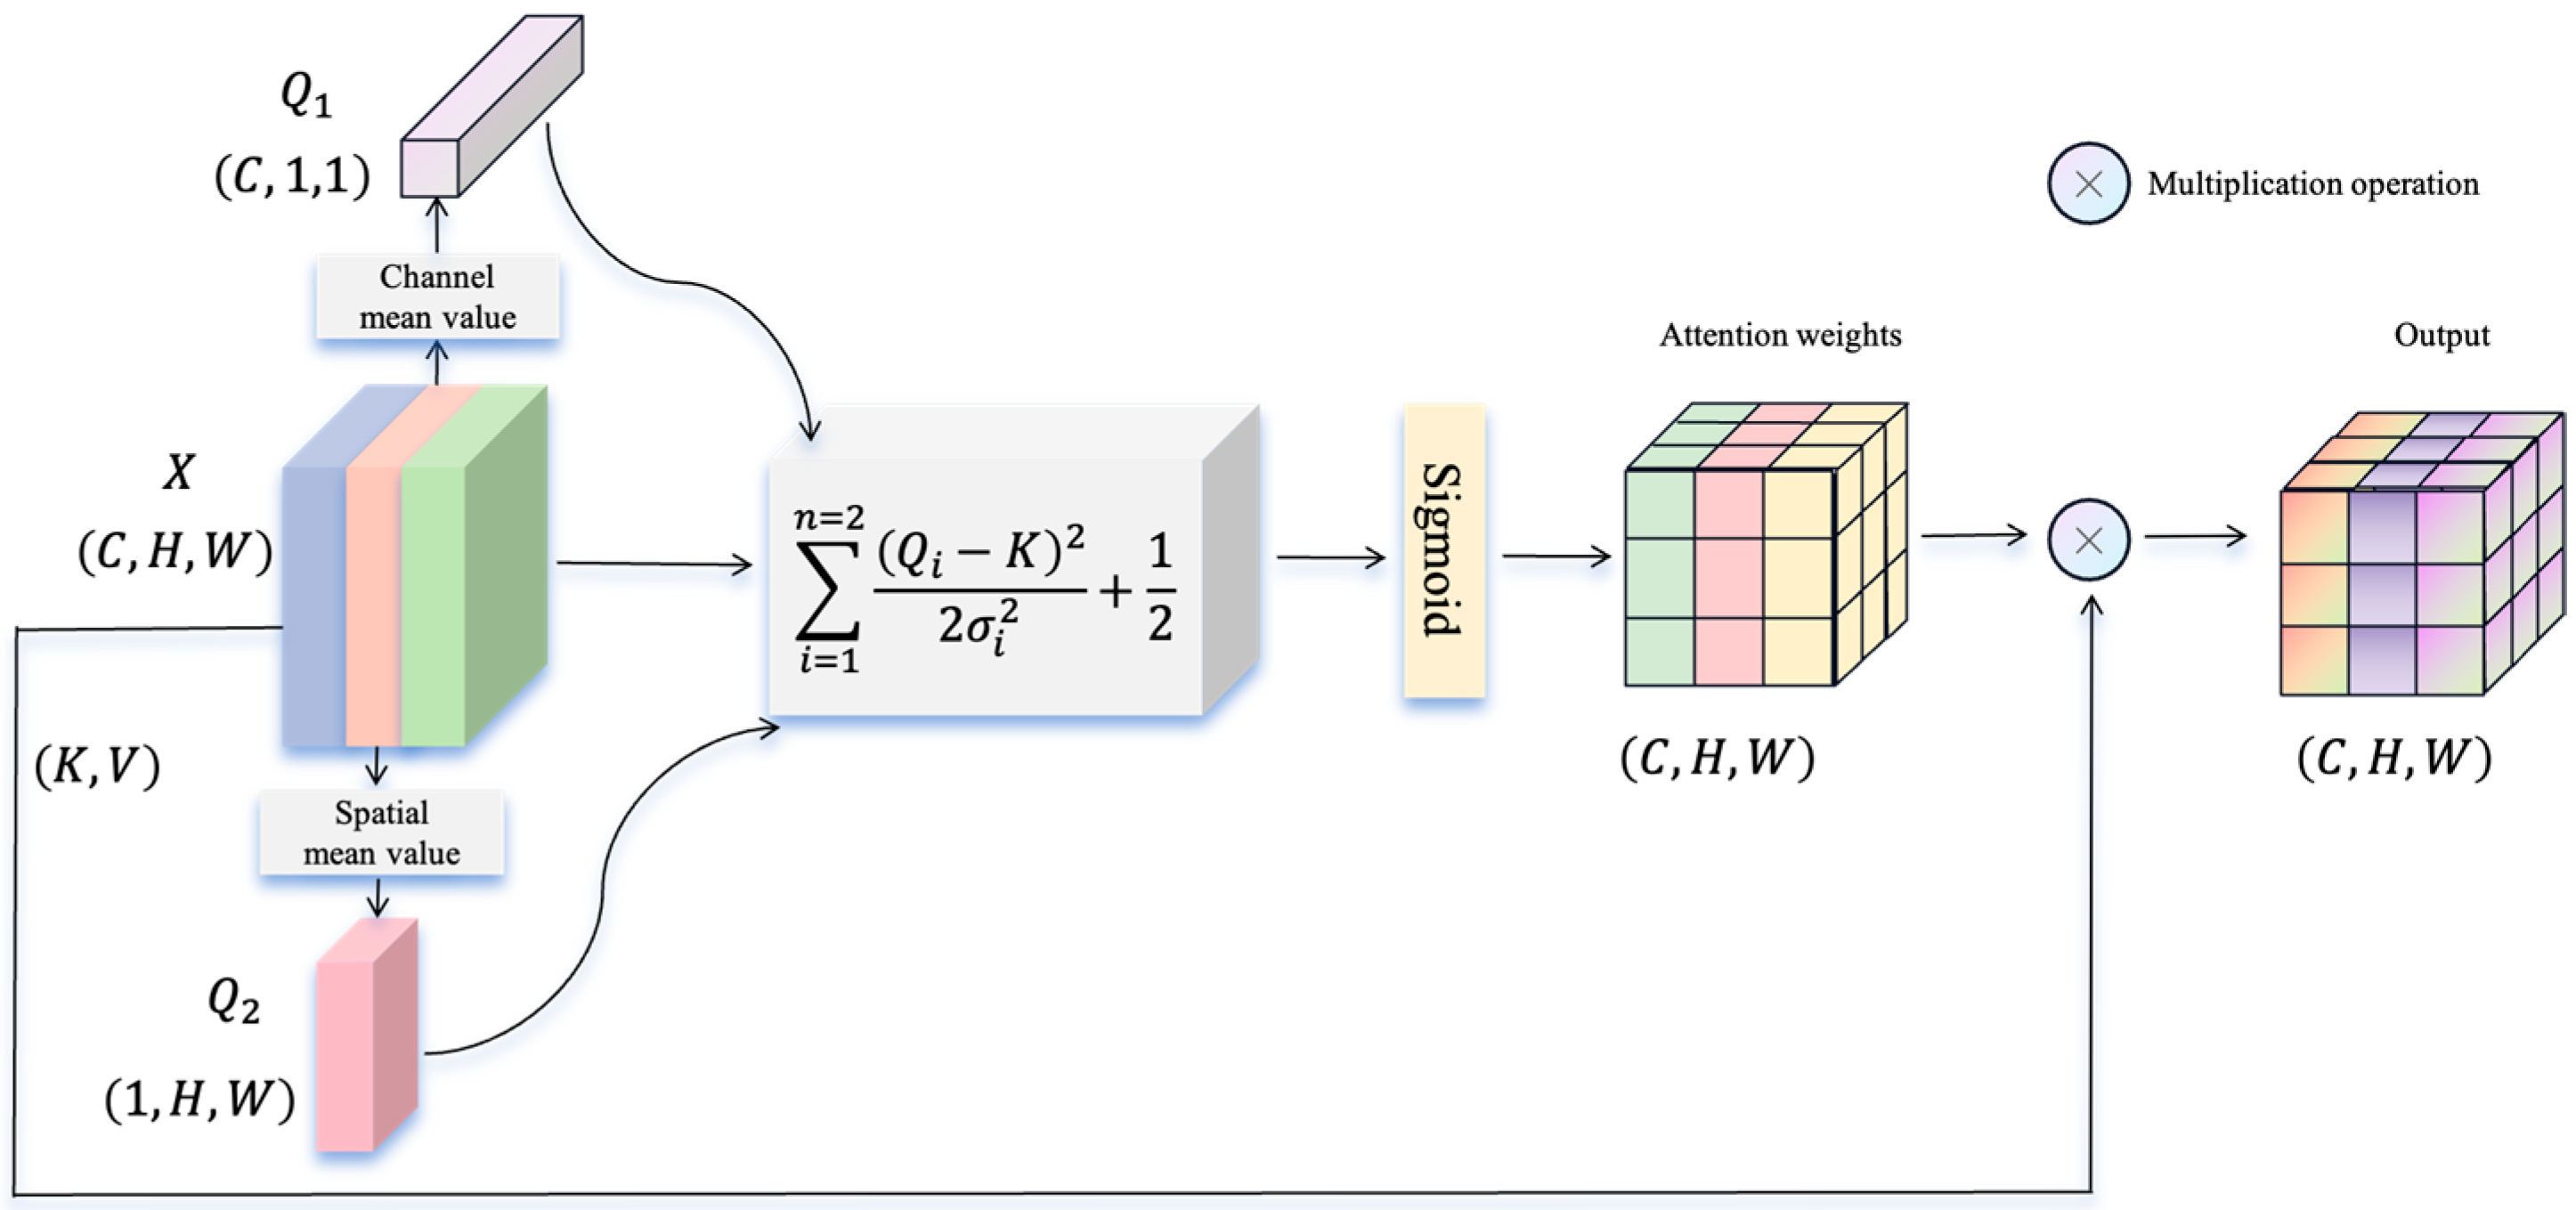
- A Spatio-Spectral Information Aggregation (SSIF) module is designed to comprehensively model the complex spatial–spectral relationships between land cover features.
- (3)
- An extensive experimental study is conducted in the real-world Qinling region, resulting in a new change detection dataset, consisting of 12,724 pairs of images captured by the Gaofen-1 satellite. This dataset covers diverse landscapes, including mountains, forests, rural areas, and nature reserves, providing a valuable resource for future research.
2. Dataset
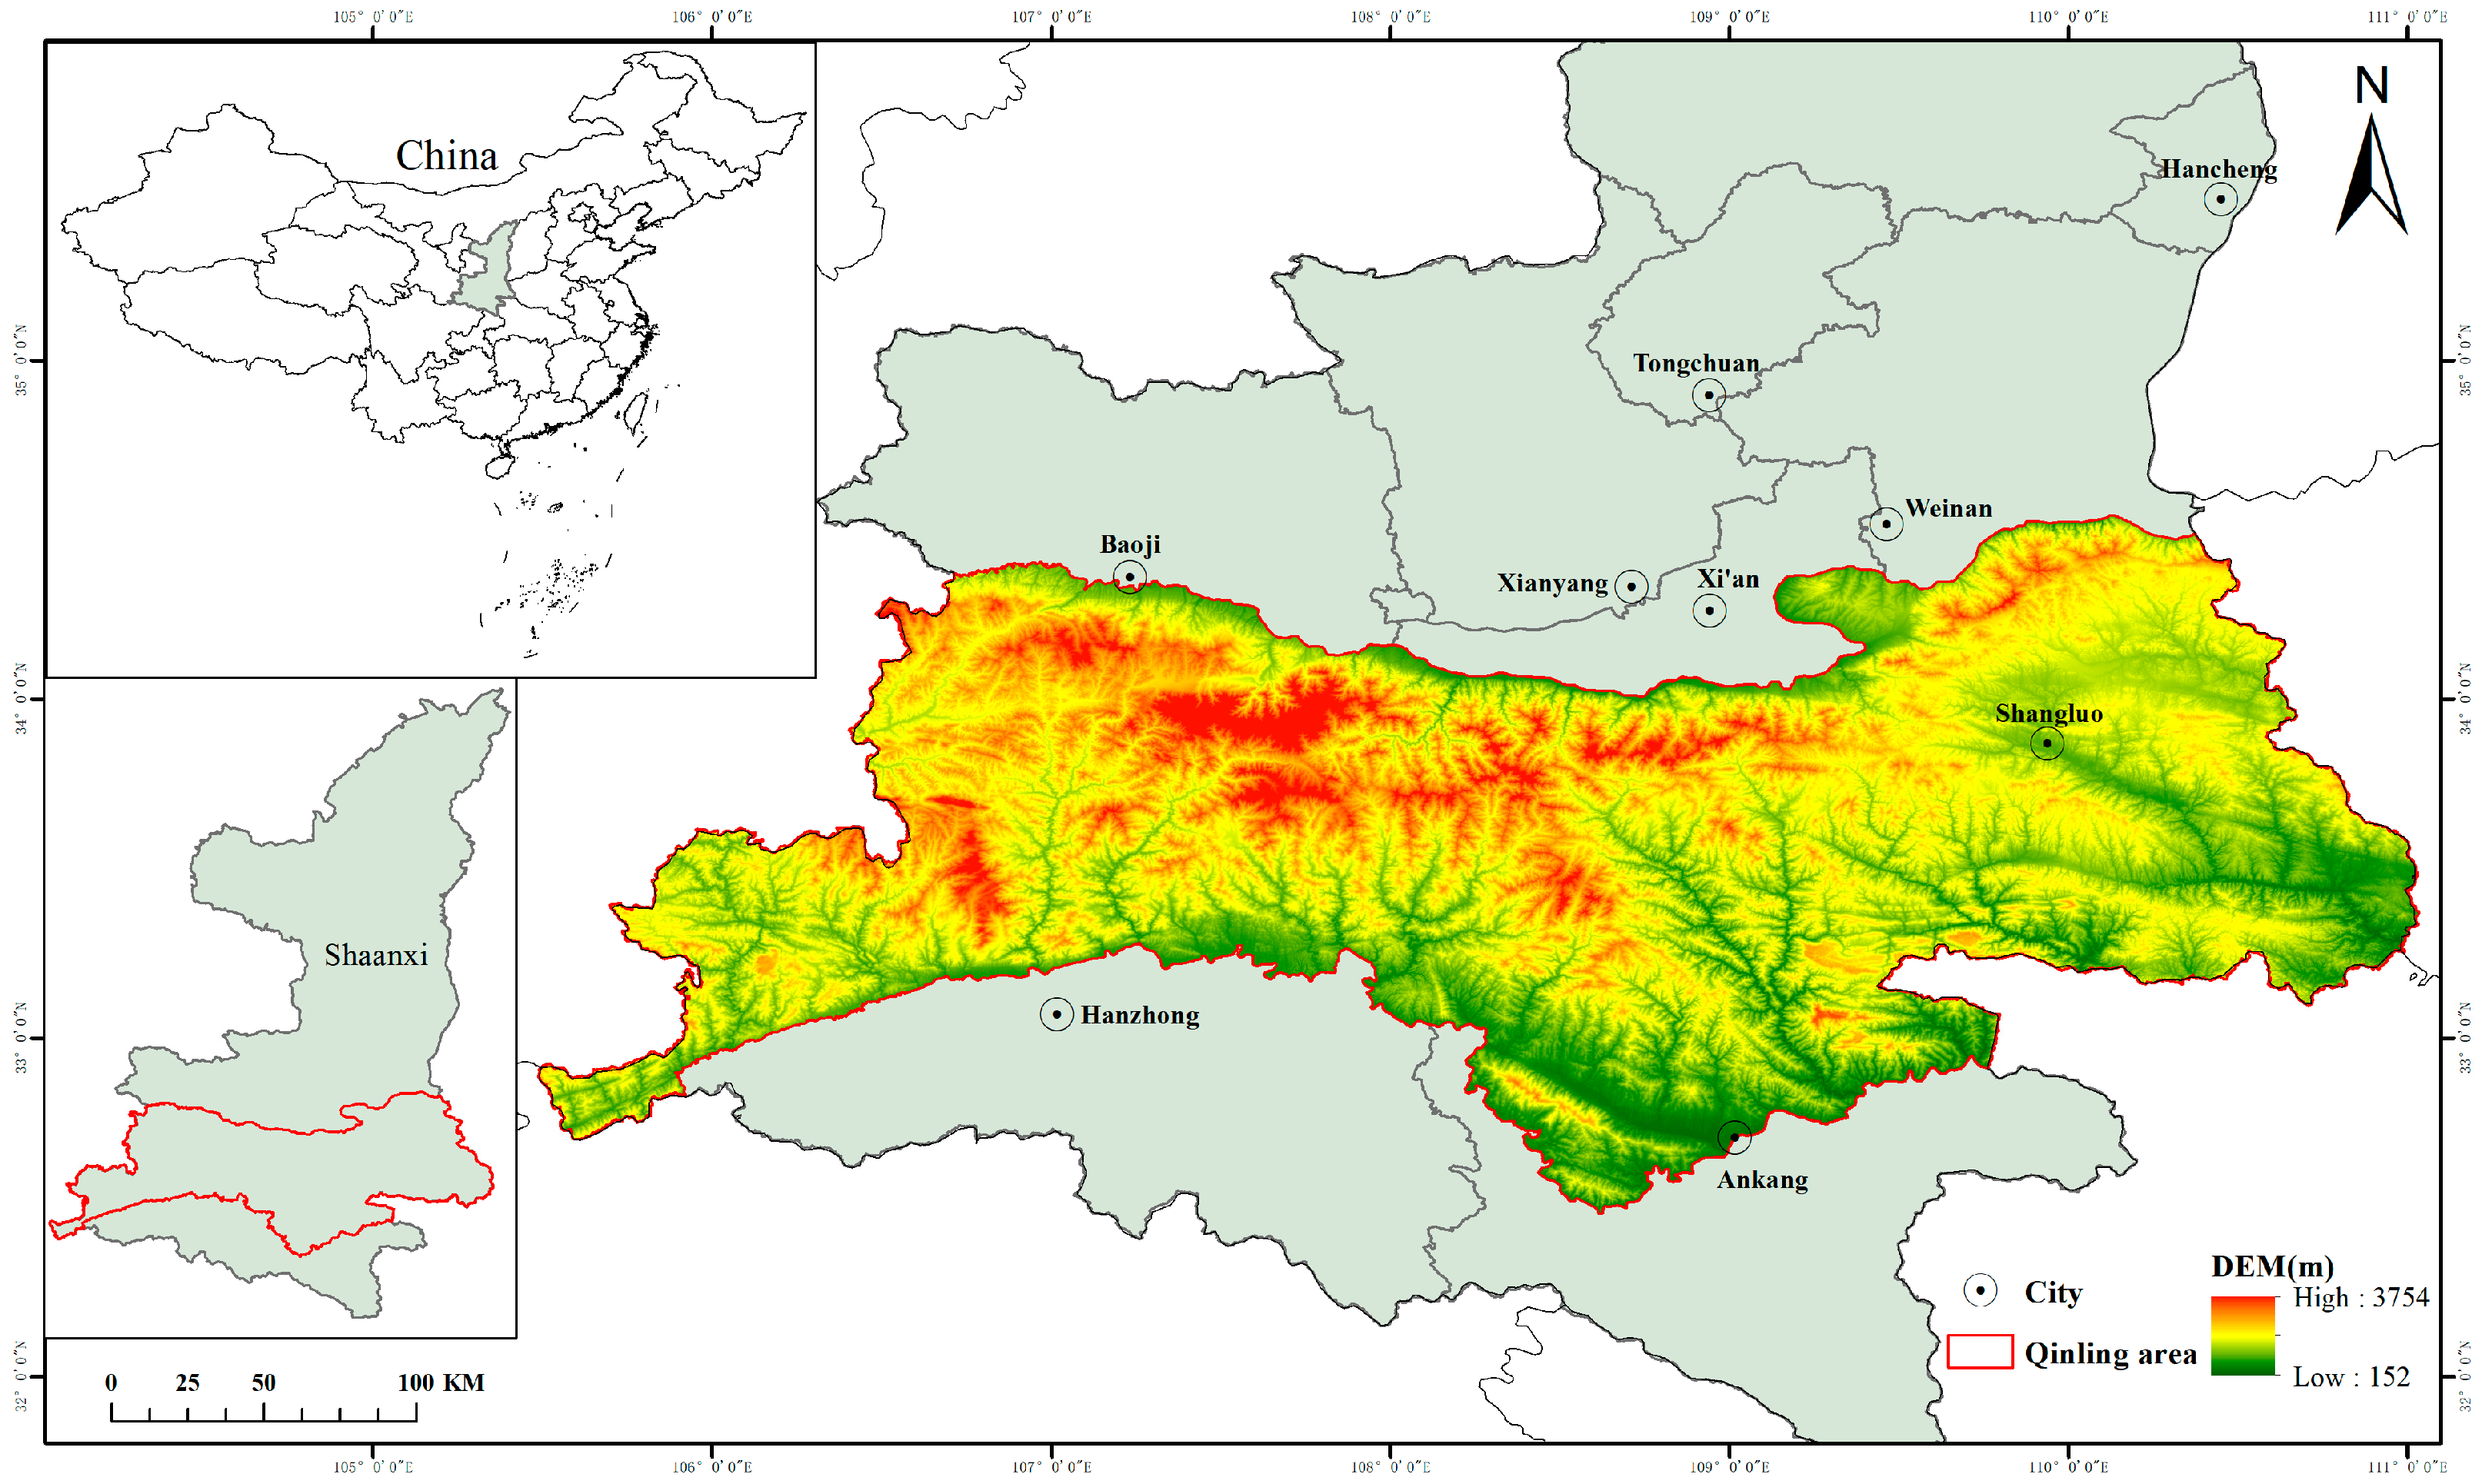
2.1. Study Regions
2.2. Data Annotation and Preprocessing
2.3. Dataset Analysis
- (1)
- Extensive Geographic Coverage: The QL-CD dataset encompasses 12,724 image pairs collected over a vast 58,000 km2 area. Compared to existing datasets, QL-CD covers a significantly larger geographic region, making it one of the most comprehensive datasets in this domain. Specifically, the dataset represents a ground area of over 3300 km2, with change regions covering approximately 367 km2. Each image pair captures rich land cover variations, posing a more challenging benchmark for evaluating model performance in detecting change regions. This extensive coverage enhances the dataset’s utility for performing real-world change detection tasks across diverse environments.
- (2)
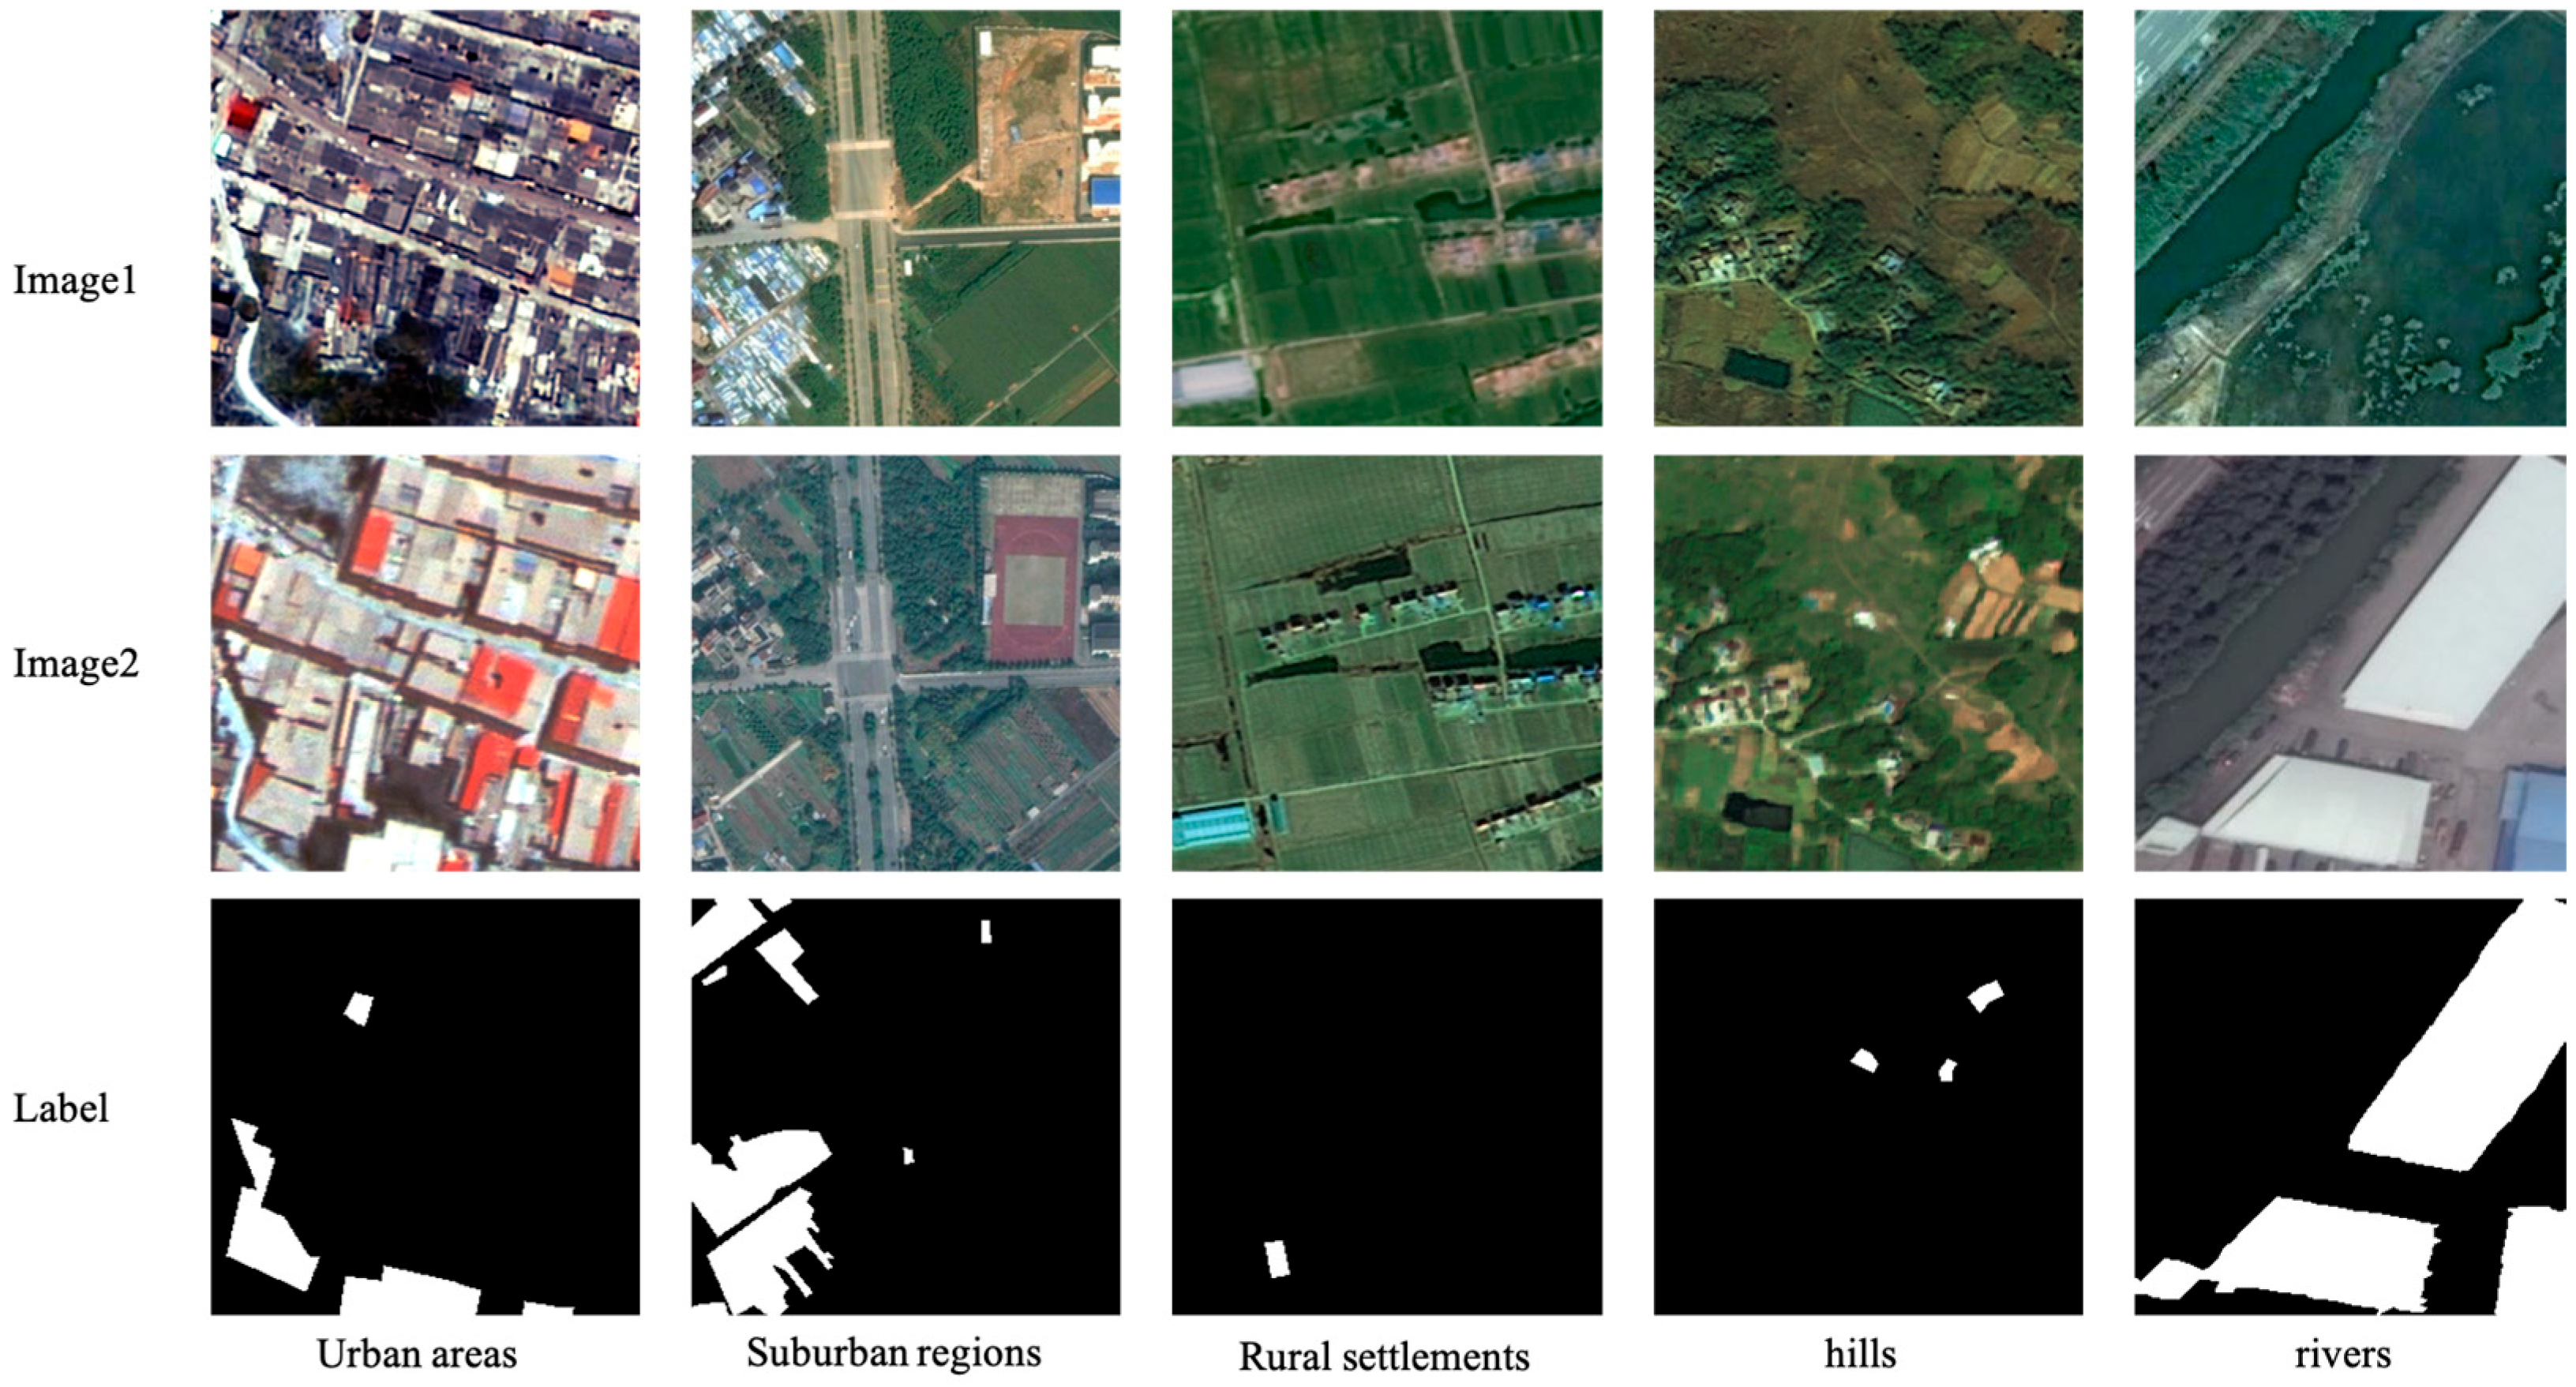
- Diverse Scene Coverage: As shown in Figure 2, the QL-CD dataset includes rich scene types, such as urban regions, suburban regions, rural settlements, hills, and rivers. This scene diversity poses a greater challenge for change detection algorithms, as it requires strong adaptability to model variations in complex environments. Additionally, it can be expected to help enhance the generalization capability of models trained on this dataset. This is because compared to existing datasets like LEVIR-CD and CDD, QL-CD not only provides a more comprehensive diversity of scenes but also serves as a multi-layered data resource for in-depth research and analysis. Such an extended scene coverage ensures that models developed using QL-CD are adaptable to more real-world scenarios.
- (3)
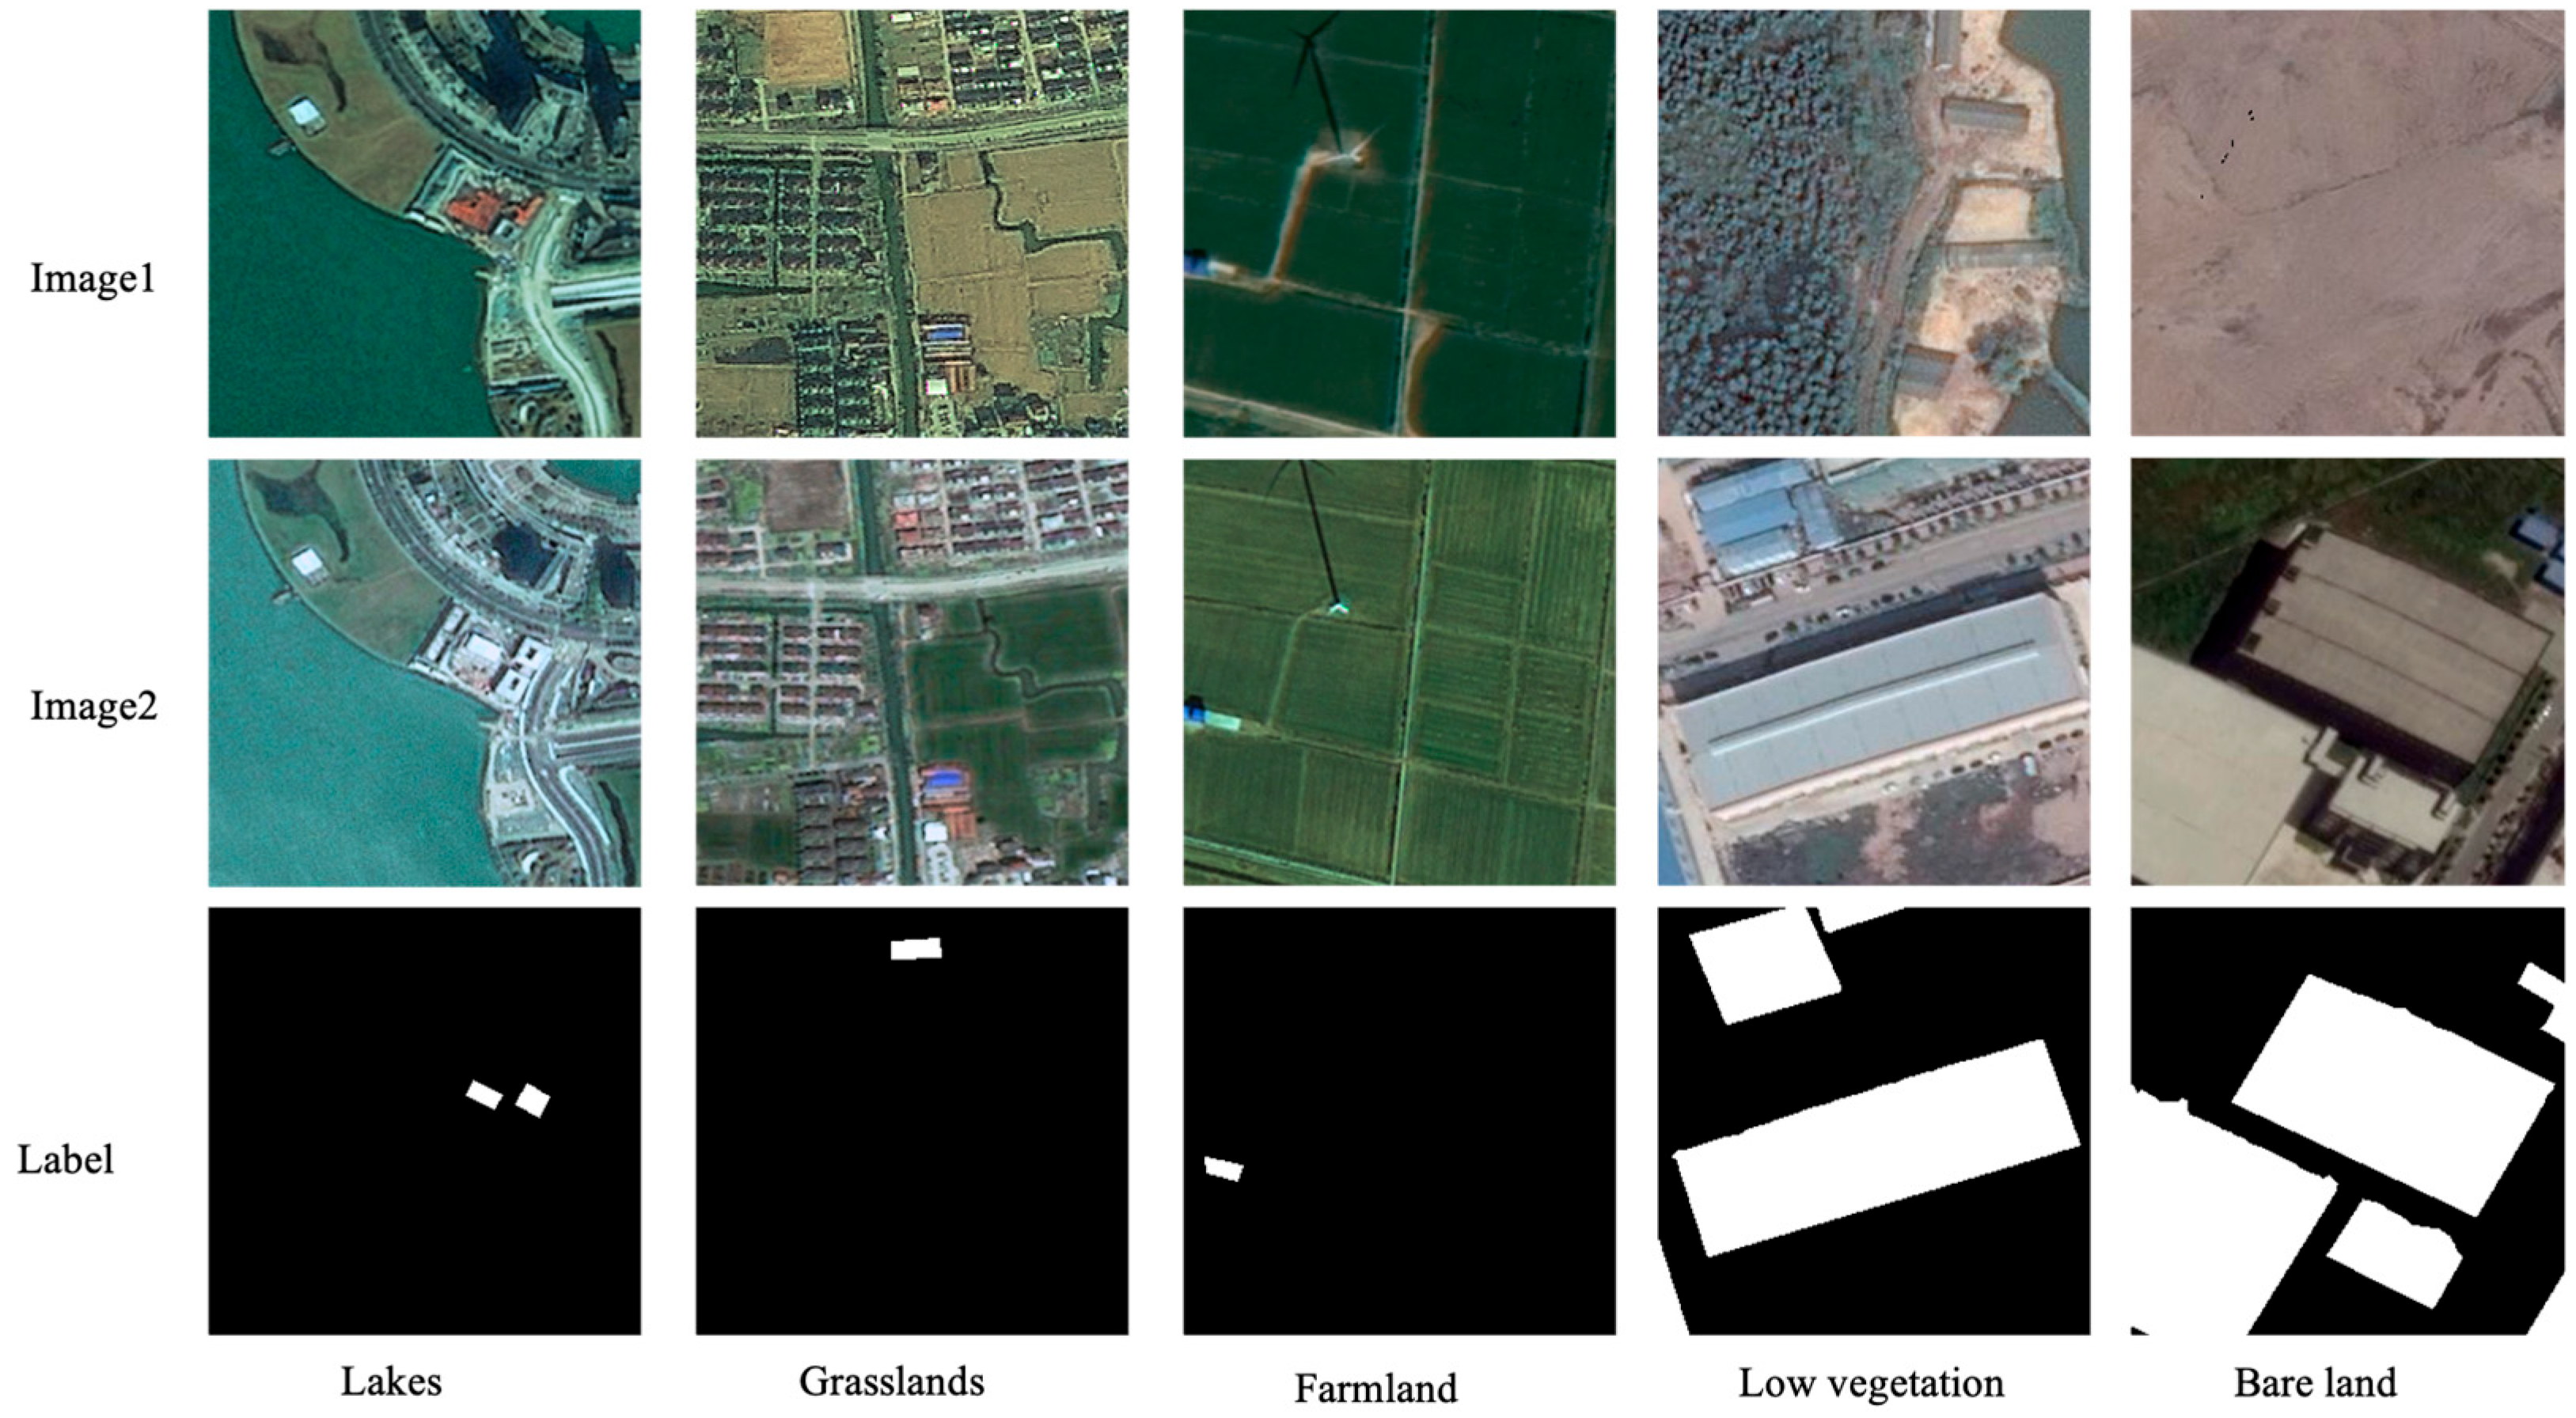
- High Background Complexity: Most existing change detection datasets primarily focus on specific urban areas, where buildings are typically present against simplistic backgrounds such as streets and roads. In contrast, the QL-CD dataset not only retains these urban elements but also significantly expands the variety of background types, including lakes, grasslands, farmland, low vegetation, and bare land. This diverse background complexity, as illustrated in Figure 3, introduces additional challenges for change detection algorithms, requiring them to distinguish between building-related changes and natural environmental variations. The inclusion of such varied backgrounds enhances the dataset’s practical value, making it a more realistic and robust benchmark for real-world applications.
- (4)
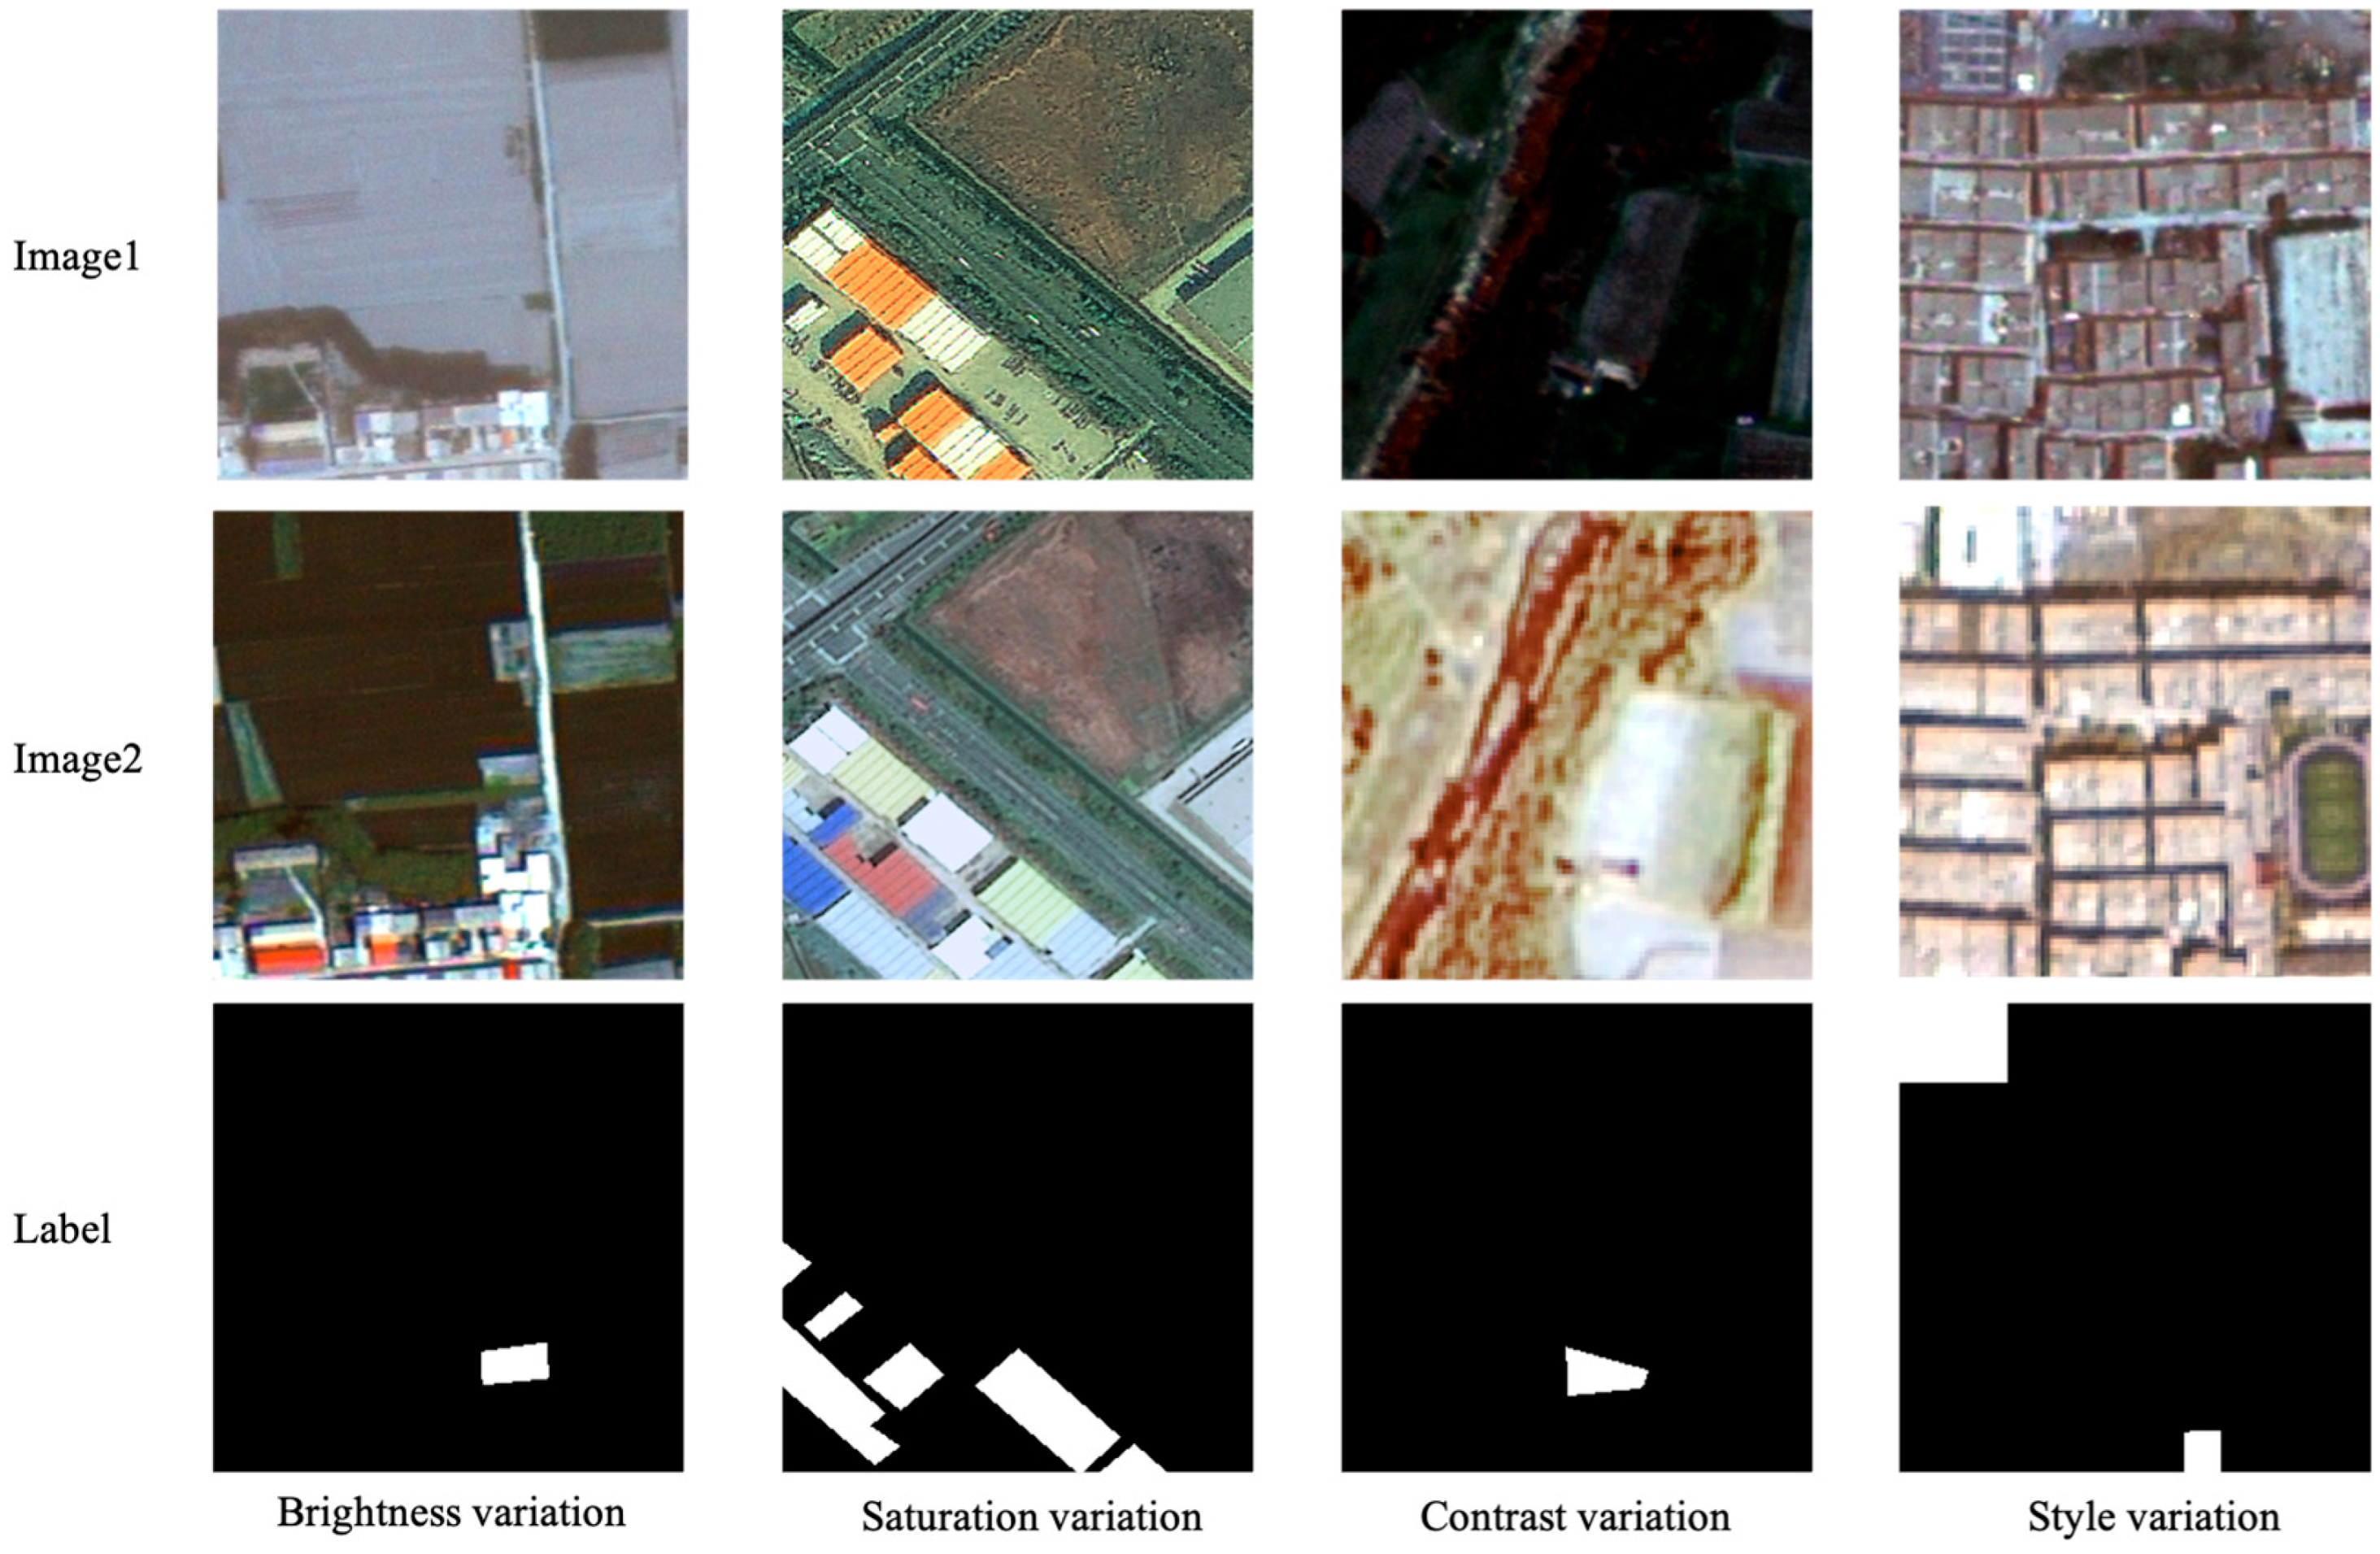
- Illumination Heterogeneity: As shown in Figure 4, the QL-CD dataset exhibits significant illumination heterogeneity, with noticeable variations in brightness, saturation, contrast, and overall image style between the two temporal images. Unlike conventional datasets captured under uniform lighting conditions, QL-CD introduces a greater degree of illumination variability, making it more representative of real-world remote sensing scenarios. This heterogeneity enables models to better capture dynamic surface changes, including seasonal transitions, meteorological variations, and natural events that impact land cover. Additionally, illumination-induced pseudo-changes present an extra challenge for algorithms, requiring them to distinguish actual building changes from lighting variations. As a result, models trained on QL-CD can be expected to achieve greater robustness with improved generalization.
3. Methodology
- Cross-Scale Heterogeneous Convolution (CSHConv) module
- Spatio-Spectral Information Fusion (SSIF) module
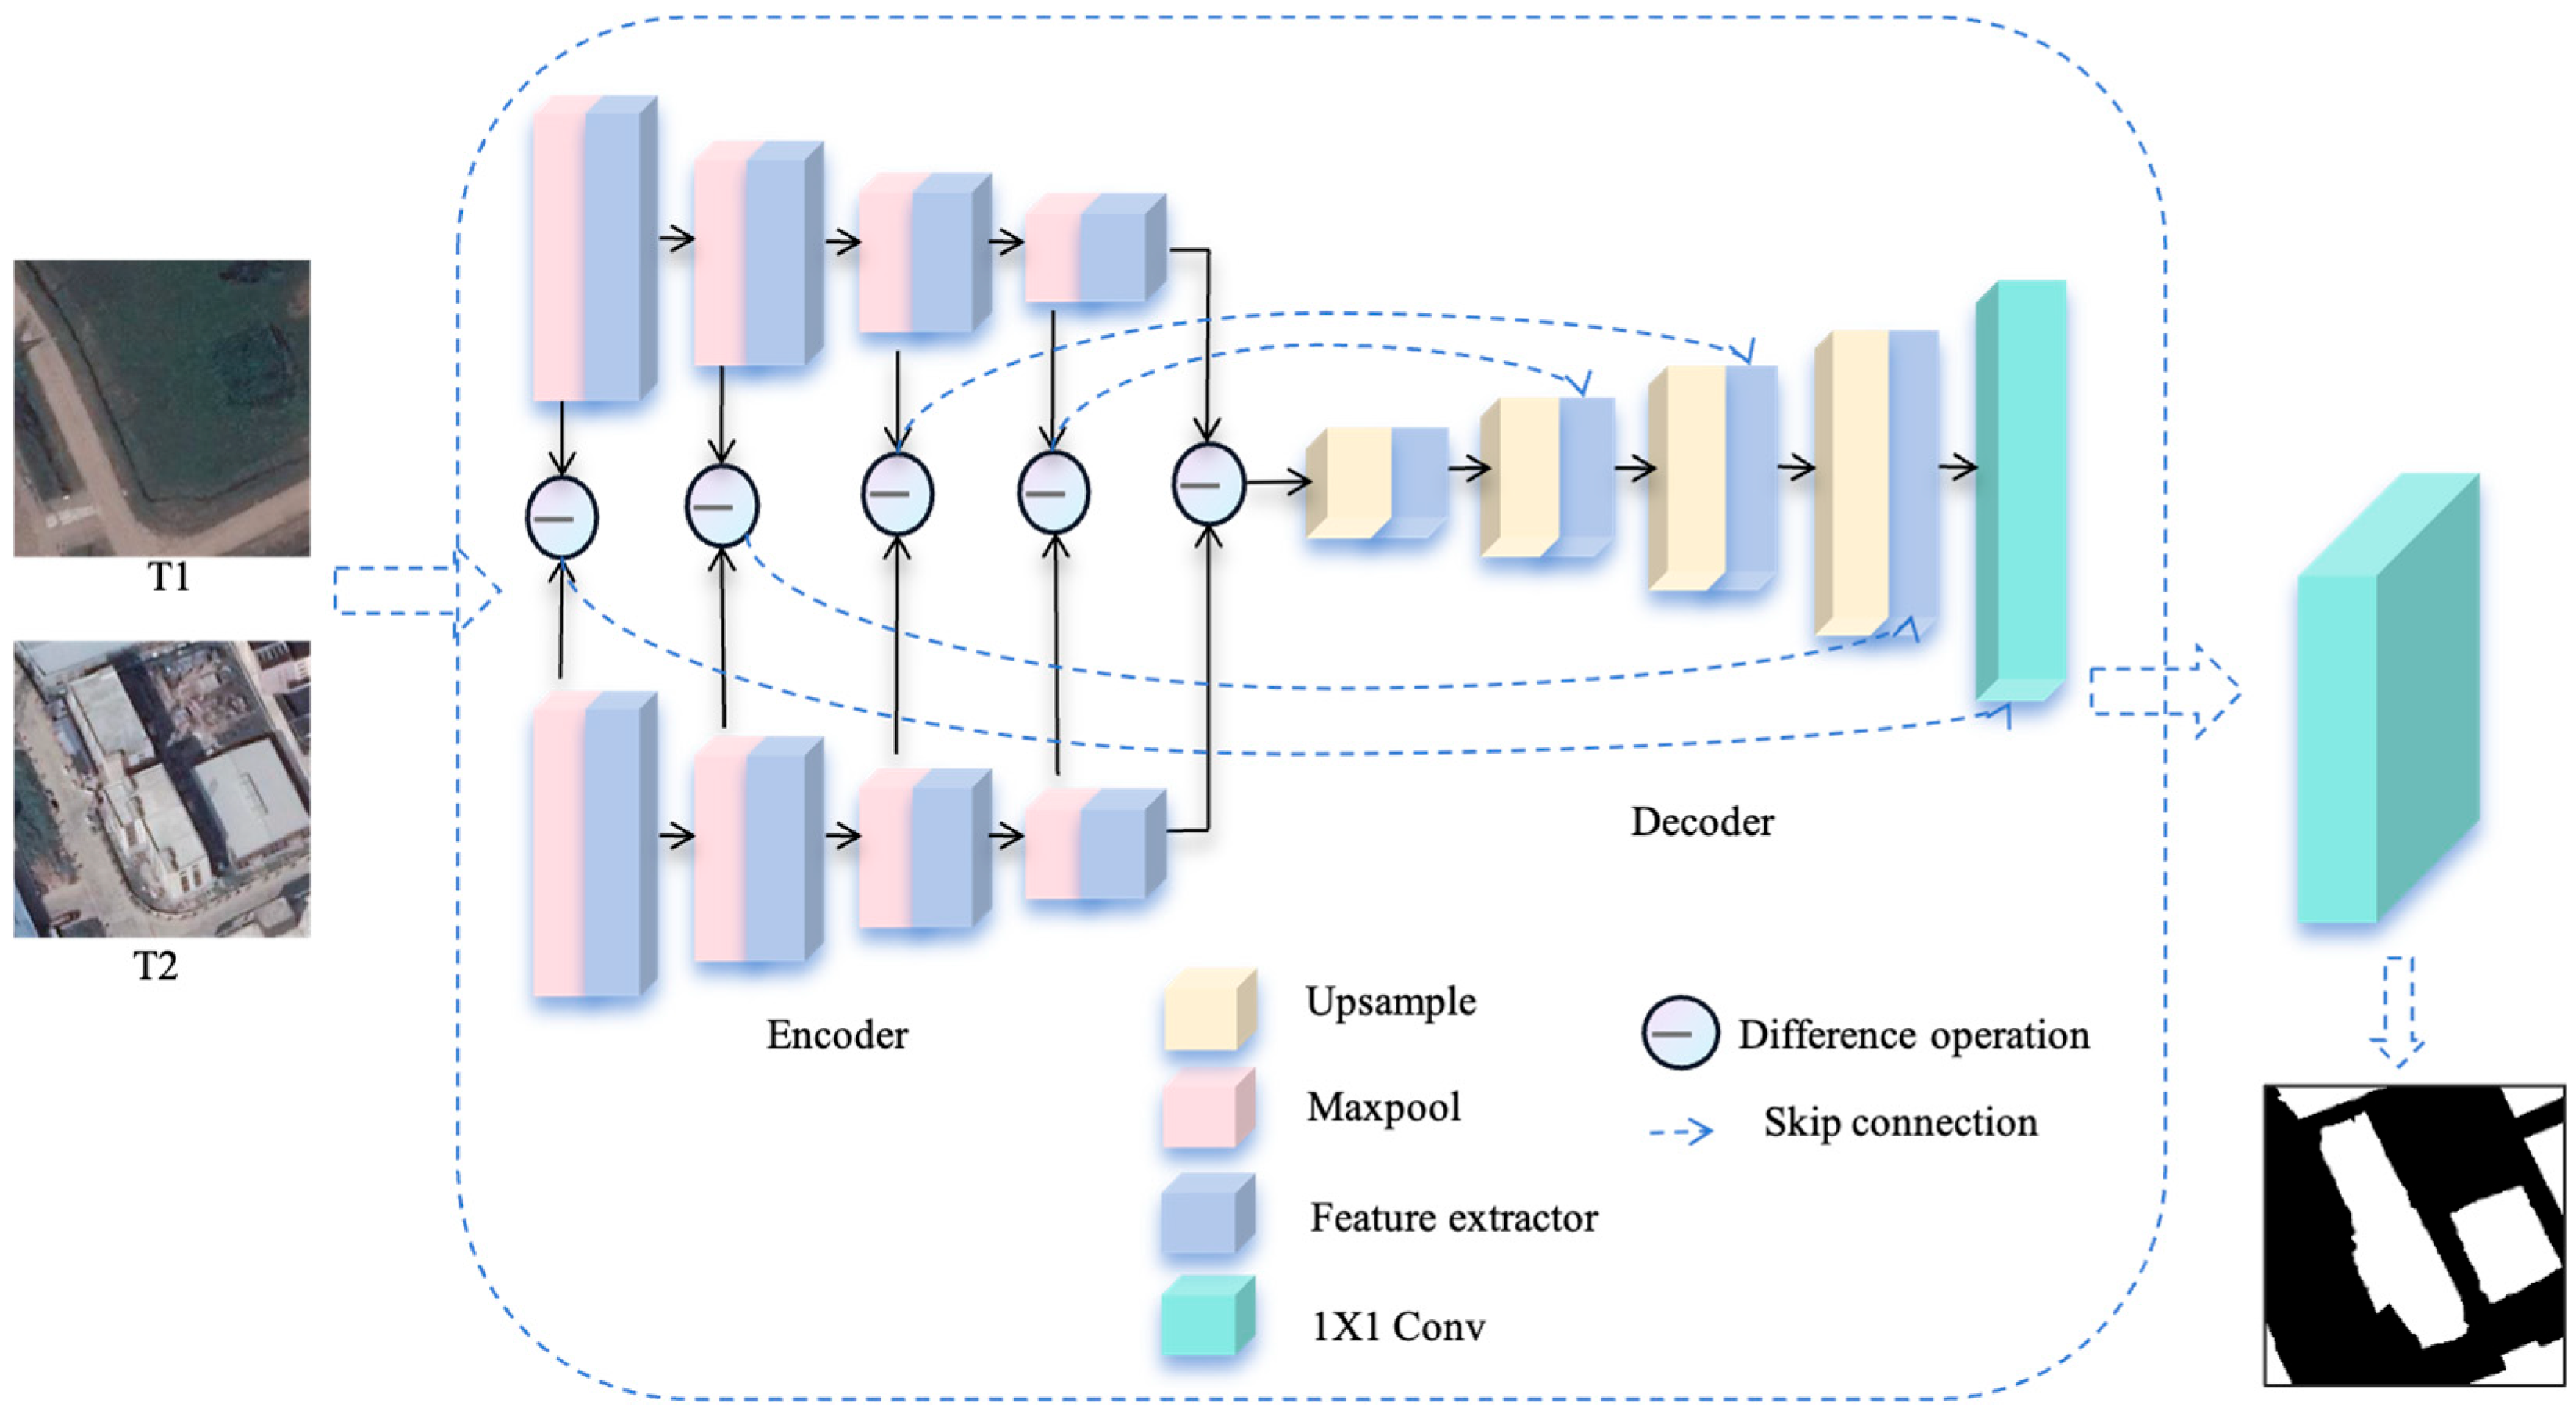
3.1. Overview
3.2. Cross-Scale Heterogeneous Convolution Module
3.3. Spatial and Spectral Information Fusion Module
3.4. Loss Function of SSA-Net
4. Experimental Studies
4.1. Implementation Setup
4.2. Evaluation Metrics
4.3. Methods Compared
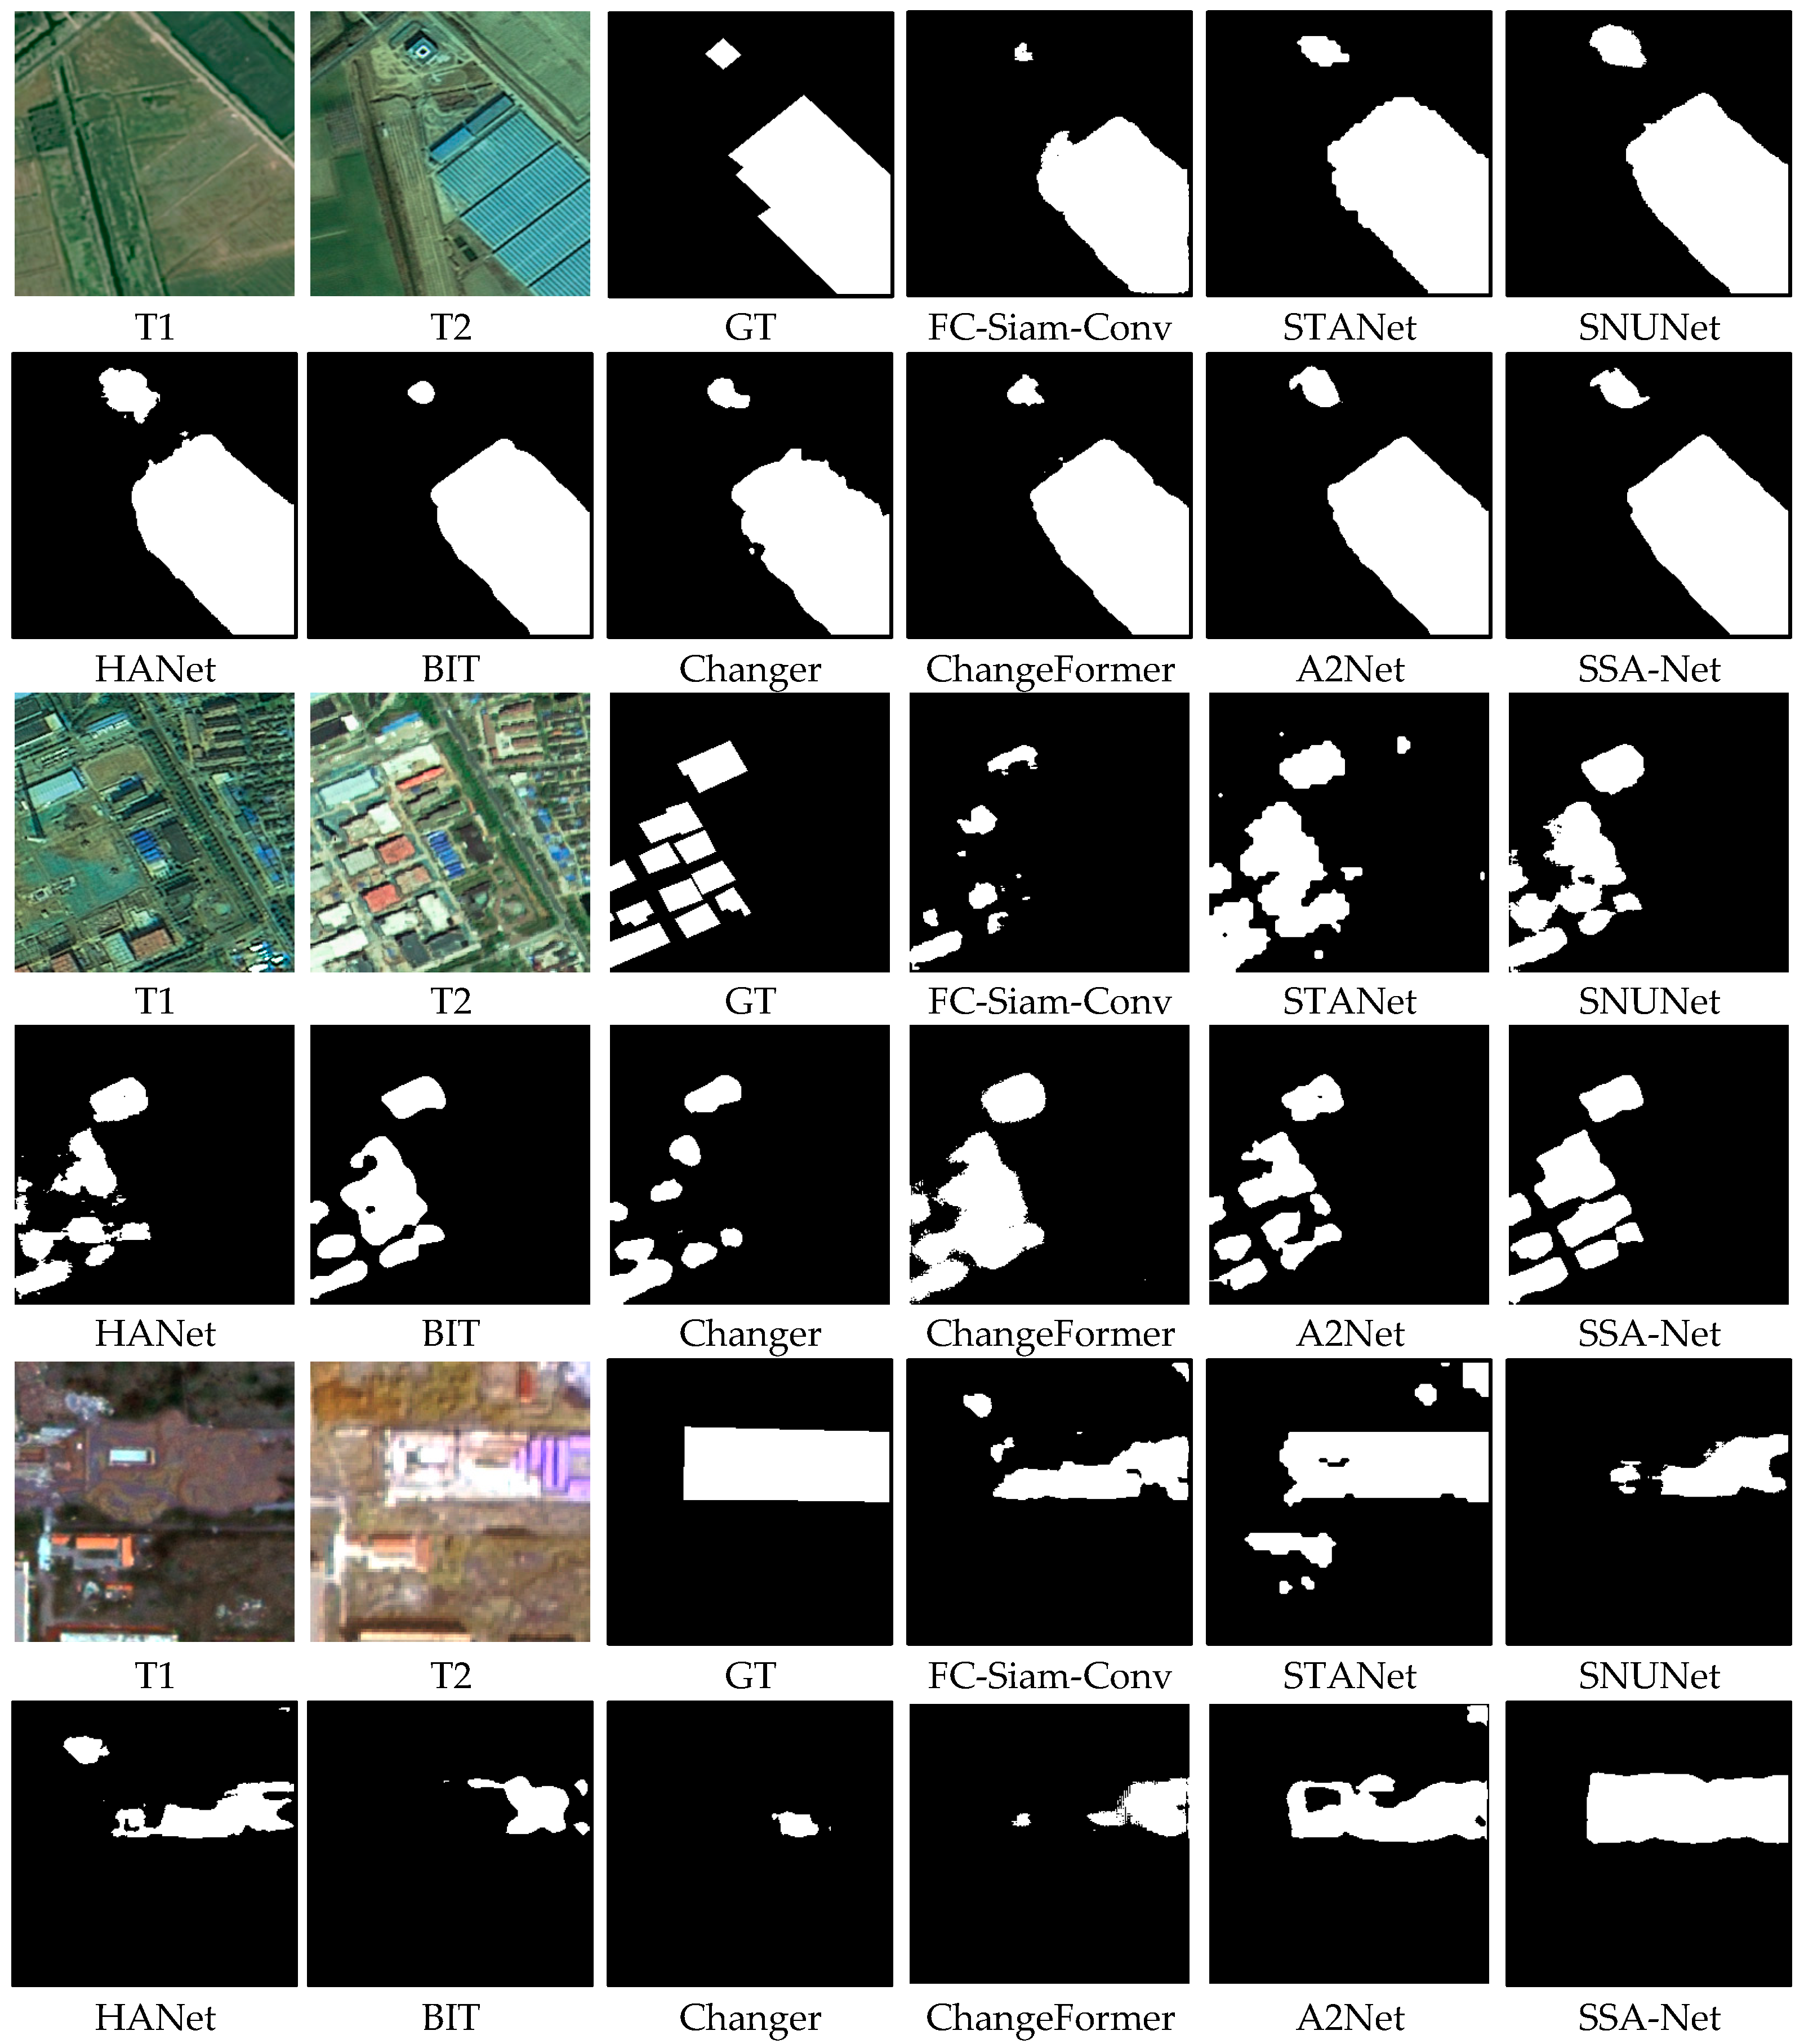
4.4. Experimental Results on QL-CD
4.5. Ablation Investigation
5. Discussion
6. Conclusions
Author Contributions
Funding
Data Availability Statement
Conflicts of Interest
References
- Shafique, A.; Cao, G.; Khan, Z.; Asad, M.; Aslam, M. Deep Learning-Based Change Detection in Remote Sensing Images: A Review. Remote Sens. 2022, 14, 871. [Google Scholar] [CrossRef]
- Bouziani, M.; Goïta, K.; He, D.-C. Automatic change detection of buildings in urban environment from very high spatial resolution images using existing geodatabase and prior knowledge. ISPRS J. Photogramm. Remote Sens. 2010, 65, 143–153. [Google Scholar] [CrossRef]
- Huang, X.; Han, X.; Ma, S.; Lin, T.; Gong, J. Monitoring ecosystem service change in the City of Shenzhen by the use of high-resolution remotely sensed imagery and deep learning. Land Degrad. Dev. 2019, 30, 1490–1501. [Google Scholar] [CrossRef]
- Wang, J.; Yang, D.; Detto, M.; Nelson, B.W.; Chen, M.; Guan, K.; Wu, S.; Yan, Z.; Wu, J. Multi-scale integration of satellite remote sensing improves characterization of dry-season green-up in an Amazon tropical evergreen forest. Remote Sens. Environ. 2020, 246, 111865. [Google Scholar] [CrossRef]
- Zheng, Z.; Zhong, Y.; Wang, J.; Ma, A.; Zhang, L. Building damage assessment for rapid disaster response with a deep object-based semantic change detection framework: From natural disasters to man-made disasters. Remote Sens. Environ. 2021, 265, 112636. [Google Scholar] [CrossRef]
- Lv, Z.; Zhong, P.; Wang, W.; You, Z.; Falco, N. Multi-scale attention network guided with change gradient image for land cover change detection using remote sensing images. IEEE Geosci. Remote Sens. Lett. 2023, 20, 2501805. [Google Scholar]
- Turner, H. A comparison of some methods of slope measurement from large-scale air photos. Photogrammetria 1977, 32, 209–237. [Google Scholar] [CrossRef]
- Ludeke, A.K.; Maggio, R.C.; Reid, L.M. An analysis of anthropogenic deforestation using logistic regression and GIS. J. Environ. Manag. 1990, 31, 247–259. [Google Scholar] [CrossRef]
- Chen, J.; Gong, P.; He, C.; Pu, R.; Shi, P. Land-use/land-cover change detection using improved change-vector analysis. Photogramm. Eng. Remote Sens. 2003, 69, 369–379. [Google Scholar] [CrossRef]
- Bayarjargal, Y.; Karnieli, A.; Bayasgalan, M.; Khudulmur, S.; Gandush, C.; Tucker, C. A comparative study of NOAA–AVHRR derived drought indices using change vector analysis. Remote Sens. Environ. 2006, 105, 9–22. [Google Scholar] [CrossRef]
- Deng, J.; Wang, K.; Deng, Y.; Qi, G. PCA-based land-use change detection and analysis using multitemporal and multisensor satellite data. Int. J. Remote Sens. 2008, 29, 4823–4838. [Google Scholar] [CrossRef]
- Kasetkasem, T.; Varshney, P.K. An image change detection algorithm based on Markov random field models. IEEE Trans. Geosci. Remote Sens. 2002, 40, 1815–1823. [Google Scholar] [CrossRef]
- Benedek, C.; Szirányi, T. Change detection in optical aerial images by a multilayer conditional mixed Markov model. IEEE Trans. Geosci. Remote Sens. 2009, 47, 3416–3430. [Google Scholar] [CrossRef]
- Bruzzone, L.; Prieto, D.F. An MRF approach to unsupervised change detection. In Proceedings of the 1999 International Conference on Image Processing (Cat. 99CH36348), Kobe, Japan, 24–28 October 1999; pp. 143–147. [Google Scholar]
- Li, Y.; Zhang, H.; Xue, X.; Jiang, Y.; Shen, Q. Deep learning for remote sensing image classification: A survey. Wiley Interdiscip. Rev. Data Min. Knowl. Discov. 2018, 8, e1264. [Google Scholar] [CrossRef]
- Li, Y.; Zhang, H.; Shen, Q. Spectral–spatial classification of hyperspectral imagery with 3D convolutional neural network. Remote Sens. 2017, 9, 67. [Google Scholar] [CrossRef]
- Long, J.; Shelhamer, E.; Darrell, T. Fully convolutional networks for semantic segmentation. In Proceedings of the IEEE Conference on Computer Vision and Pattern Recognition, Boston, MA, USA, 7–12 June 2015; pp. 3431–3440. [Google Scholar]
- Ren, S.; He, K.; Girshick, R.; Sun, J. Faster R-CNN: Towards real-time object detection with region proposal networks. IEEE Trans. Pattern Anal. Mach. Intell. 2016, 39, 1137–1149. [Google Scholar] [CrossRef]
- Hou, X.; Bai, Y.; Xie, Y.; Zhang, Y.; Fu, L.; Li, Y.; Shang, C.; Shen, Q. Self-supervised multimodal change detection based on difference contrast learning for remote sensing imagery. Pattern Recognit. 2025, 159, 111148. [Google Scholar] [CrossRef]
- Hou, X.; Bai, Y.; Li, Y.; Shang, C.; Shen, Q. High-resolution triplet network with dynamic multiscale feature for change detection on satellite images. ISPRS J. Photogramm. Remote Sens. 2021, 177, 103–115. [Google Scholar] [CrossRef]
- Daudt, R.C.; Le Saux, B.; Boulch, A. Fully convolutional siamese networks for change detection. In Proceedings of the 2018 25th IEEE international conference on image processing (ICIP), Athens, Greece, 7–10 October 2018; pp. 4063–4067. [Google Scholar]
- Peng, D.; Zhang, Y.; Guan, H. End-to-end change detection for high resolution satellite images using improved UNet++. Remote Sens. 2019, 11, 1382. [Google Scholar] [CrossRef]
- Zhou, Z.; Rahman Siddiquee, M.M.; Tajbakhsh, N.; Liang, J. Unet++: A nested u-net architecture for medical image segmentation. In Proceedings of the Deep Learning in Medical Image Analysis and Multimodal Learning for Clinical Decision Support: 4th International Workshop, DLMIA 2018, and 8th International Workshop, ML-CDS 2018, Held in Conjunction with MICCAI 2018, Granada, Spain, 20 September 2018; pp. 3–11. [Google Scholar]
- Chen, H.; Shi, Z. A spatial-temporal attention-based method and a new dataset for remote sensing image change detection. Remote Sens. 2020, 12, 1662. [Google Scholar] [CrossRef]
- Liu, Y.; Pang, C.; Zhan, Z.; Zhang, X.; Yang, X. Building change detection for remote sensing images using a dual-task constrained deep siamese convolutional network model. IEEE Geosci. Remote Sens. Lett. 2020, 18, 811–815. [Google Scholar] [CrossRef]
- Li, K.; Li, Z.; Fang, S. Siamese NestedUNet networks for change detection of high resolution satellite image. In Proceedings of the 2020 1st International Conference on Control, Robotics and Intelligent System, Xiamen, China, 27–29 October 2020; pp. 42–48. [Google Scholar]
- Jiang, H.; Hu, X.; Li, K.; Zhang, J.; Gong, J.; Zhang, M. PGA-SiamNet: Pyramid feature-based attention-guided Siamese network for remote sensing orthoimagery building change detection. Remote Sens. 2020, 12, 484. [Google Scholar] [CrossRef]
- Vaswani, A.; Shazeer, N.; Parmar, N.; Uszkoreit, J.; Jones, L.; Gomez, A.N.; Kaiser, Ł.; Polosukhin, I. Attention is all you need. Adv. Neural Inf. Process. Syst. 2017, 6000–6010. [Google Scholar]
- Guo, M.-H.; Xu, T.-X.; Liu, J.-J.; Liu, Z.-N.; Jiang, P.-T.; Mu, T.-J.; Zhang, S.-H.; Martin, R.R.; Cheng, M.-M.; Hu, S.-M. Attention mechanisms in computer vision: A survey. Comput. Vis. Media 2022, 8, 331–368. [Google Scholar] [CrossRef]
- Zhang, C.; Yue, P.; Tapete, D.; Jiang, L.; Shangguan, B.; Huang, L.; Liu, G. A deeply supervised image fusion network for change detection in high resolution bi-temporal remote sensing images. ISPRS J. Photogramm. Remote Sens. 2020, 166, 183–200. [Google Scholar] [CrossRef]
- Wang, H.; Fan, Y.; Wang, Z.; Jiao, L.; Schiele, B. Parameter-free spatial attention network for person re-identification. arXiv 2018, arXiv:1811.12150. [Google Scholar]
- Hu, J.; Shen, L.; Sun, G. Squeeze-and-excitation networks. In Proceedings of the IEEE Conference on Computer Vision and Pattern Recognition, Salt Lake City, UT, USA, 18–23 June 2018; pp. 7132–7141. [Google Scholar]
- Song, K.; Jiang, J. AGCDetNet: An attention-guided network for building change detection in high-resolution remote sensing images. IEEE J. Sel. Top. Appl. Earth Obs. Remote Sens. 2021, 14, 4816–4831. [Google Scholar] [CrossRef]
- Chen, J.; Yuan, Z.; Peng, J.; Chen, L.; Huang, H.; Zhu, J.; Liu, Y.; Li, H. DASNet: Dual attentive fully convolutional Siamese networks for change detection in high-resolution satellite images. IEEE J. Sel. Top. Appl. Earth Obs. Remote Sens. 2020, 14, 1194–1206. [Google Scholar] [CrossRef]
- Fang, S.; Li, K.; Shao, J.; Li, Z. SNUNet-CD: A densely connected Siamese network for change detection of VHR images. IEEE Geosci. Remote Sens. Lett. 2021, 19, 8007805. [Google Scholar] [CrossRef]
- Shi, Q.; Liu, M.; Li, S.; Liu, X.; Wang, F.; Zhang, L. A deeply supervised attention metric-based network and an open aerial image dataset for remote sensing change detection. IEEE Trans. Geosci. Remote Sens. 2021, 60, 5604816. [Google Scholar] [CrossRef]
- Woo, S.; Park, J.; Lee, J.-Y.; Kweon, I.S. Cbam: Convolutional block attention module. In Proceedings of the European Conference on Computer Vision (ECCV), Munich, Germany, 8–14 September 2018; pp. 3–19. [Google Scholar]
- Wang, D.; Chen, X.; Jiang, M.; Du, S.; Xu, B.; Wang, J. ADS-Net: An Attention-Based deeply supervised network for remote sensing image change detection. Int. J. Appl. Earth Obs. Geoinf. 2021, 101, 102348. [Google Scholar]
- Zheng, H.; Gong, M.; Liu, T.; Jiang, F.; Zhan, T.; Lu, D.; Zhang, M. HFA-Net: High frequency attention siamese network for building change detection in VHR remote sensing images. Pattern Recognit. 2022, 129, 108717. [Google Scholar] [CrossRef]
- Ren, W.; Wang, Z.; Xia, M.; Lin, H. MFINet: Multi-scale feature interaction network for change detection of high-resolution remote sensing images. Remote Sens. 2024, 16, 1269. [Google Scholar] [CrossRef]
- Yu, X.; Fan, J.; Zhang, P.; Han, L.; Zhang, D.; Sun, G. Multi-scale convolutional neural network for remote sensing image change detection. In Proceedings of the Geoinformatics in Sustainable Ecosystem and Society: 7th International Conference, GSES 2019, and First International Conference, GeoAI 2019, Guangzhou, China, 21–25 November 2019; pp. 234–242. [Google Scholar]
- Yu, X.; Fan, J.; Chen, J.; Zhang, P.; Zhou, Y.; Han, L. NestNet: A multiscale convolutional neural network for remote sensing image change detection. Int. J. Remote Sens. 2021, 42, 4898–4921. [Google Scholar] [CrossRef]
- Ren, H.; Xia, M.; Weng, L.; Hu, K.; Lin, H. Dual attention-guided multiscale feature aggregation network for remote sensing image change detection. IEEE J. Sel. Top. Appl. Earth Obs. Remote Sens. 2024, 17, 4899–4916. [Google Scholar] [CrossRef]
- Yin, H.; Weng, L.; Li, Y.; Xia, M.; Hu, K.; Lin, H.; Qian, M. Attention-guided siamese networks for change detection in high resolution remote sensing images. Int. J. Appl. Earth Obs. Geoinf. 2023, 117, 103206. [Google Scholar] [CrossRef]
- Ding, Q.; Shao, Z.; Huang, X.; Altan, O. DSA-Net: A novel deeply supervised attention-guided network for building change detection in high-resolution remote sensing images. Int. J. Appl. Earth Obs. Geoinf. 2021, 105, 102591. [Google Scholar] [CrossRef]
- Ji, S.; Wei, S.; Lu, M. Fully convolutional networks for multisource building extraction from an open aerial and satellite imagery data set. IEEE Trans. Geosci. Remote Sens. 2018, 57, 574–586. [Google Scholar] [CrossRef]
- Shen, L.; Lu, Y.; Chen, H.; Wei, H.; Xie, D.; Yue, J.; Chen, R.; Lv, S.; Jiang, B. S2Looking: A Satellite Side-Looking Dataset for Building Change Detection. Remote Sens. 2021, 13, 5094. [Google Scholar] [CrossRef]
- Lebedev, M.; Vizilter, Y.V.; Vygolov, O.; Knyaz, V.A.; Rubis, A.Y. Change detection in remote sensing images using conditional adversarial networks. Int. Arch. Photogramm. Remote Sens. Spat. Inf. Sci. 2018, 42, 565–571. [Google Scholar] [CrossRef]
- Lei, T.; Geng, X.; Ning, H.; Lv, Z.; Gong, M.; Jin, Y.; Nandi, A.K. Ultralightweight Spatial–Spectral Feature Cooperation Network for Change Detection in Remote Sensing Images. IEEE Trans. Geosci. Remote Sens. 2023, 61, 4402114. [Google Scholar] [CrossRef]
- Demir, S.; Toktamiş, Ö. On the adaptive Nadaraya-Watson kernel regression estimators. Hacet. J. Math. Stat. 2010, 39, 429–437. [Google Scholar]
- Hofmann, T.; Schölkopf, B.; Smola, A.J. Kernel methods in machine learning. Ann. Statist. 2008, 36, 1171–1220. [Google Scholar] [CrossRef]
- Li, Z.; Tang, C.; Liu, X.; Zhang, W.; Dou, J.; Wang, L.; Zomaya, A.Y. Lightweight remote sensing change detection with progressive feature aggregation and supervised attention. IEEE Trans. Geosci. Remote Sens. 2023, 61, 5602812. [Google Scholar] [CrossRef]
- Ruby, U.; Yendapalli, V. Binary cross entropy with deep learning technique for image classification. Int. J. Adv. Trends Comput. Sci. Eng. 2020, 9. [Google Scholar] [CrossRef]
- Milletari, F.; Navab, N.; Ahmadi, S.-A. V-Net: Fully convolutional neural networks for volumetric medical image segmentation. In Proceedings of the 2016 Fourth International Conference on 3D Vision (3DV), Stanford, CA, USA, 25–28 October 2016; pp. 565–571. [Google Scholar]
- Han, C.; Wu, C.; Guo, H.; Hu, M.; Chen, H. HANet: A hierarchical attention network for change detection with bitemporal very-high-resolution remote sensing images. IEEE J. Sel. Top. Appl. Earth Obs. Remote Sens. 2023, 16, 3867–3878. [Google Scholar] [CrossRef]
- Chen, H.; Qi, Z.; Shi, Z. Remote sensing image change detection with transformers. IEEE Trans. Geosci. Remote Sens. 2021, 60, 5900318. [Google Scholar] [CrossRef]
- Fang, S.; Li, K.; Li, Z. Changer: Feature interaction is what you need for change detection. IEEE Trans. Geosci. Remote Sens. 2023, 61, 5610111. [Google Scholar] [CrossRef]
- Bandara, W.G.C.; Patel, V.M. A transformer-based siamese network for change detection. In Proceedings of the IGARSS 2022—2022 IEEE International Geoscience and Remote Sensing Symposium, Kuala Lumpur, Malaysia, 17–22 July 2022; pp. 207–210. [Google Scholar]


| Prediction\Ground Truth | Positive | Negative |
|---|---|---|
| Positive | TP | FP |
| Negative | FN | TN |
| Method | Precision (%) | Recall (%) | F1 (%) | IoU (%) | Kappa (%) |
|---|---|---|---|---|---|
| FC-EF | 47.64 | 46.36 | 46.99 | 30.71 | 40.99 |
| FC-Siam-Conc | 68.43 | 37.03 | 48.06 | 31.63 | 44.00 |
| FC-Siam-Diff | 82.49 | 26.08 | 39.63 | 24.72 | 36.49 |
| STANet | 65.14 | 76.97 | 70.56 | 54.51 | 66.86 |
| STANet_BAM | 75.58 | 85.21 | 79.22 | 68.28 | 77.67 |
| STANet_PAM | 79.25 | 84.34 | 81.50 | 71.20 | 79.54 |
| SNUNet | 87.23 | 74.64 | 79.27 | 69.04 | 78.39 |
| HANet | 77.09 | 55.06 | 64.23 | 47.31 | 60.88 |
| A2Net | 88.96 | 72.81 | 80.08 | 66.78 | 78.04 |
| BIT | 70.93 | 69.25 | 70.04 | 59.23 | 66.69 |
| Changer | 71.92 | 70.35 | 71.09 | 60.22 | 67.85 |
| ChangeFormer | 79.39 | 69.21 | 72.86 | 62.34 | 71.19 |
| SSA-Net | 88.70 | 80.04 | 84.15 | 72.64 | 82.43 |
| Methods | Precision (%) | Recall (%) | F1 (%) | IoU (%) | Kappa (%) |
|---|---|---|---|---|---|
| Backbone | 86.11 | 75.32 | 80.35 | 70.62 | 78.26 |
| Backbone + CSHConv | 86.93 | 76.07 | 81.13 | 71.50 | 79.13 |
| Backbone + SSIF | 83.85 | 79.14 | 81.14 | 68.87 | 79.36 |
| SSA-Net | 88.70 | 80.04 | 84.15 | 72.64 | 82.43 |
| Method | Params (M) | Flops (G) | Times (S) |
|---|---|---|---|
| FC-EF | 1.93 | 4.55 | 60 |
| FC-Siam-Conc | 1.75 | 3.99 | 57 |
| FC-Siam-Diff | 1.29 | 2.92 | 52 |
| STANet | 12.28 | 25.69 | 165 |
| STANet_BAM | 16.93 | 14.4 | 154 |
| STANet_PAM | 16.93 | 6.58 | 159 |
| SNUNet | 28.34 | 97.87 | 191 |
| HANet | 3.03 | 14.07 | 102 |
| A2Net | 3.78 | 6.02 | 120 |
| BIT | 3.55 | 10.6 | 244 |
| Changer | 11.39 | 11.89 | 184 |
| ChangeFormer | 20.75 | 11.35 | 80 |
| SSA-Net | 3.54 | 6.65 | 84 |
Disclaimer/Publisher’s Note: The statements, opinions and data contained in all publications are solely those of the individual author(s) and contributor(s) and not of MDPI and/or the editor(s). MDPI and/or the editor(s) disclaim responsibility for any injury to people or property resulting from any ideas, methods, instructions or products referred to in the content. |
© 2025 by the authors. Licensee MDPI, Basel, Switzerland. This article is an open access article distributed under the terms and conditions of the Creative Commons Attribution (CC BY) license (https://creativecommons.org/licenses/by/4.0/).
Share and Cite
Fu, L.; Zhang, Y.; Zhao, K.; Zhang, L.; Li, Y.; Shang, C.; Shen, Q. Remote Sensing Image-Based Building Change Detection: A Case Study of the Qinling Mountains in China. Remote Sens. 2025, 17, 2249. https://doi.org/10.3390/rs17132249
Fu L, Zhang Y, Zhao K, Zhang L, Li Y, Shang C, Shen Q. Remote Sensing Image-Based Building Change Detection: A Case Study of the Qinling Mountains in China. Remote Sensing. 2025; 17(13):2249. https://doi.org/10.3390/rs17132249
Chicago/Turabian StyleFu, Lei, Yunfeng Zhang, Keyun Zhao, Lulu Zhang, Ying Li, Changjing Shang, and Qiang Shen. 2025. "Remote Sensing Image-Based Building Change Detection: A Case Study of the Qinling Mountains in China" Remote Sensing 17, no. 13: 2249. https://doi.org/10.3390/rs17132249
APA StyleFu, L., Zhang, Y., Zhao, K., Zhang, L., Li, Y., Shang, C., & Shen, Q. (2025). Remote Sensing Image-Based Building Change Detection: A Case Study of the Qinling Mountains in China. Remote Sensing, 17(13), 2249. https://doi.org/10.3390/rs17132249