Abstract
Extreme climate events are becoming more intense, and how coastal mangroves respond to the alternating intense cyclones and severe droughts is less understood, which challenges the sustainability of the ecosystem services they provide to coastal communities. To address this, we analyzed spatiotemporal dynamics of coastal mangroves in a Caribbean island in response to major hurricanes in 2017, which followed a severe multi-year drought in 2014–2015, using multiple indices derived from multispectral optical images. We further explored the roles of hurricane forces, local hydro-geomorphic environment, and rainfall dynamics in the damage and the following recovery. In addition to the hurricane forces, such as gusty wind and rainfall, the local hydro-geomorphic environment largely determines the spatial variations of damage. Lower-lying, flatter, and wetter mangrove areas sustained more damage, possibly due to prolonged inundation susceptibility and tall canopy configurations. Recovery is mainly limited by the severity of damage. However, sufficient rainfall gradually becomes important to facilitate the recovery. While the pre-hurricane severe drought (2014–2015) largely degraded the mangroves at dry sites, the drought after the hurricanes exacerbated the hurricane damage and retarded the recovery. We also found that the spectral distance and the mangrove vegetation index revealed slower and more spatiotemporally heterogenous mangrove recovery than indices of greenness, implying they are better measures for monitoring mangroves’ response to disturbance. Six years after the disturbance, the greenness of mangroves near the hurricane landfall reached 84% of the pre-hurricane values. However, the mangrove vegetation index showed that healthy mangrove coverage was only 10%, in comparison to 76% before the disturbance. The sluggish recovery at this site with the severest damage may be associated with the loss of pre-established seedlings and the difficulty to have new ones established, thus human efforts are in need to restore the system.
1. Introduction
Extreme climate events are becoming more intense as the globe becomes warmer [1], exerting stronger impacts on the structures, functions, and services of terrestrial ecosystems [2,3]. Among them, coastal wetlands are especially vulnerable to severe droughts [4,5,6] as well as intense tropical cyclones [7,8,9], and are thus facing great uncertainties in providing sustainable functions and services for C sequestration, biodiversity, water filtration, and coastal protection [3,10,11].
Intense tropical cyclones greatly impact the coastal wetlands through wind damage, storm surges, prolonged flooding, and sediment deposits which alter geomorphology and hydrology [12,13]. Globally, tropical cyclones account for 45% of reported disturbance to mangroves [5]. Coastal mangroves have lower diversity and simpler structure than upland vegetation. Compared to upland forests, mangroves, which inhabit saline and anaerobic environments, typically exhibit less resistance to cyclone disturbance [14,15]. Particularly, tall mangrove forests are especially vulnerable to cyclone-induced canopy damage [16]. Based on field observations, the loss of mangrove basal areas in the East Caribbean was found to exhibit a sigmoid relationship with maximum sustainable wind speed. This relationship suggests a wind speed threshold (maximum slope) of 130 km h−1 for high-profile stands and 180 km h−1 for low-profile stands [9]. In addition to immediate wind damage, storm surges, heavy rainfall, and prolonged inundation might further smother mangrove roots, prohibit the respiration of aerial roots, and thus lead to delayed mortality [17,18,19]. For example, basin mangroves suffer more than riverine or island mangroves, probably due to the long-lasting water in the depressions and the subsequent suffocation [13].
The recovery of mangroves after the disturbance of tropical cyclones is not only determined by the severity of damage, but it is also species-specific and dependent on hydro-geomorphology [8,16]. For example, large-size red mangroves (e.g., Rhizophora mangle) are slow in recovery because they are generally unable to resprout or coppice, thus they rely on other strategies such as advance regeneration [20]. The compound flooding from storm heavy rainfall, tides, and surges creates a severe and widespread inundation risk for the coast when combined with rising sea level. As a result, the alteration in hydrology or geomorphology, such as blocked tidal connection or impoundment, might deteriorate the local environment and retard the mangrove recovery from the disturbance of tropical cyclones [15].
Severe droughts also degrade the coastal wetlands and can result in extensive mangrove mortality [4,5,21]. Although mangroves are halophytes, hypersaline stress can greatly limit their primary production and degrade the ecosystem [22]. The high temperatures and increased evapotranspiration commonly associated with droughts, when combined with a limited freshwater supply, often worsen the moisture stress and elevate the salinity in soils and pore water [4]. The consequent hydraulic failure might lead to massive mangrove diebacks [23]. Moreover, the recruitment of mangroves or mangrove associates might also be hindered due to the vulnerability of seedlings and saplings to the stresses [6].
Intensive tropical cyclones and severe droughts are both related to the El Niño Southern Oscillation (ENSO) events, and extreme El Niño and La Niña are becoming more frequent [24,25]. Further, compared to a single-year event, multi-year ENSO events become more frequent [26]. While El Niño tends to suppress the intense storms in the North Atlantic, La Niña often has the opposite effect. The warm periods during ENSO events allow energy accumulation in the ocean–atmosphere system, which may give rise to the major storms during the successive La Niña events. For example, in the tropical island of Puerto Rico in the Caribbean, the severe drought in 2014–2015 is associated with the strong El Niño event of 2014–2016, with the peak Multivariate ENSO Index Version 2 (MEI.v2) greater than 2.0 (https://psl.noaa.gov/enso/mei/, accessed on 1 May 2025). The severe drought was followed by two major hurricanes in September 2017 during the La Niña in 2016–2018 [27]. After that, a weak El Niño in 2018–2020 is associated with a moderate dry condition. How the coastal wetlands respond to and recover from the disturbances in the context of more and more frequent alternating droughts and storms is less understood.
Multispectral optical images are widely used to assess the vegetation responses to major disturbances, particularly greenness dynamics estimated using the normalized difference vegetation index (NDVI) or enhanced vegetation index (EVI) are used to monitor the damage and recovery [28,29]. For example, the mangroves in Hong Kong were assessed with NDVI and a rapid recovery was found after a super-typhoon in 2018. However, the subsequent analyses of changes in canopy structure with airborne LiDAR images still showed significant differences between the ‘recovered’ mangroves and their pre-storm status [30]. Therefore, remote sensing information in addition to the greenness should be explored and leveraged to differentiate the heterogeneous response of mangroves to disturbances and recovery, and to help understand the underlying mechanisms.
This study aimed at the following questions: how the alternating droughts and hurricanes impact coastal mangroves and what are the potential drivers or mechanisms for the differentiated responses and recovery from major hurricanes? We hypothesized that droughts might deteriorate the hurricane damage and retard the subsequent recovery of coastal mangroves, and that multiple indices derived from remote sensing images will complement the greenness index to monitor the damage and the recovery of coastal mangroves in response to alternating droughts and storms. To answer the questions and test the hypotheses, we used multiple indices based on multispectral images, including spectral distance, greenness, and the mangrove vegetation index, to quantify the impact and recovery. Furthermore, we applied spatial error models to explore the potential drivers that differentiated the impact and recovery. Informed suggestions are discussed accordingly.
2. Methods
2.1. Study Areas
Tropical islands in the mid-Atlantic Ocean are prone to the disturbance of hurricanes, which often originate from the western coast of Africa [31]. In the Caribbean, the island of Puerto Rico at the eastern tip of the Great Antilles encountered over 30 hurricanes that passed over or close by since 1900 [32]. Hurricane Irma, category 5, passed by on 6 September, and Hurricane Maria, high-end category 4, made landfall on the island on 20 September 2017, which devastated the coastal mangroves [33]. Aside from the major hurricanes, the island experienced extreme droughts in 2014–2015 which caused mangrove mortality, especially those along the southern coast [34].
The total distribution of estuarine forest, scrub/shrub wetlands, including mangroves and associates, was estimated to occupy approximately 10,000 ha in wet and dry regions along the coast [6,35]. Basin and riverine mangroves are mostly found in the north and the east, while fringe and over-wash mangroves are mostly in the south and the southwest. The largest mangrove forest, the Piñones State Forest near San Juan airport, occupies 1660 ha in the northeast (PIN in Figure 1). The annual rainfall there is as high as 1800 mm, and the canopy height can be more than 20 m with a tree density of more than 2000 per ha [36]. Annual average rainfall at Piñones after the hurricanes in 2018–2023 was only 5% lower than the normal rainfall. However, in the southwest, the dry orographic rain shadow of the central mountains leads to less than 1000 mm annual rainfall, and the mangrove trees in La Parguera (PAG in Figure 1) are lower than 10 m with a tree density of 1600 per ha [33]. Additionally, the rainfall after the hurricanes was almost 30% lower than the normal rainfall.
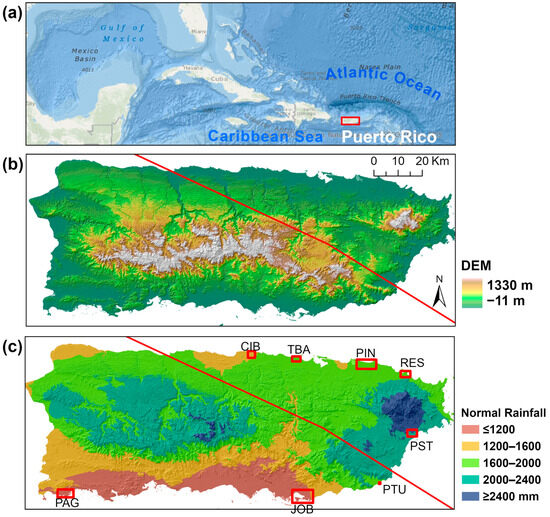
Figure 1.
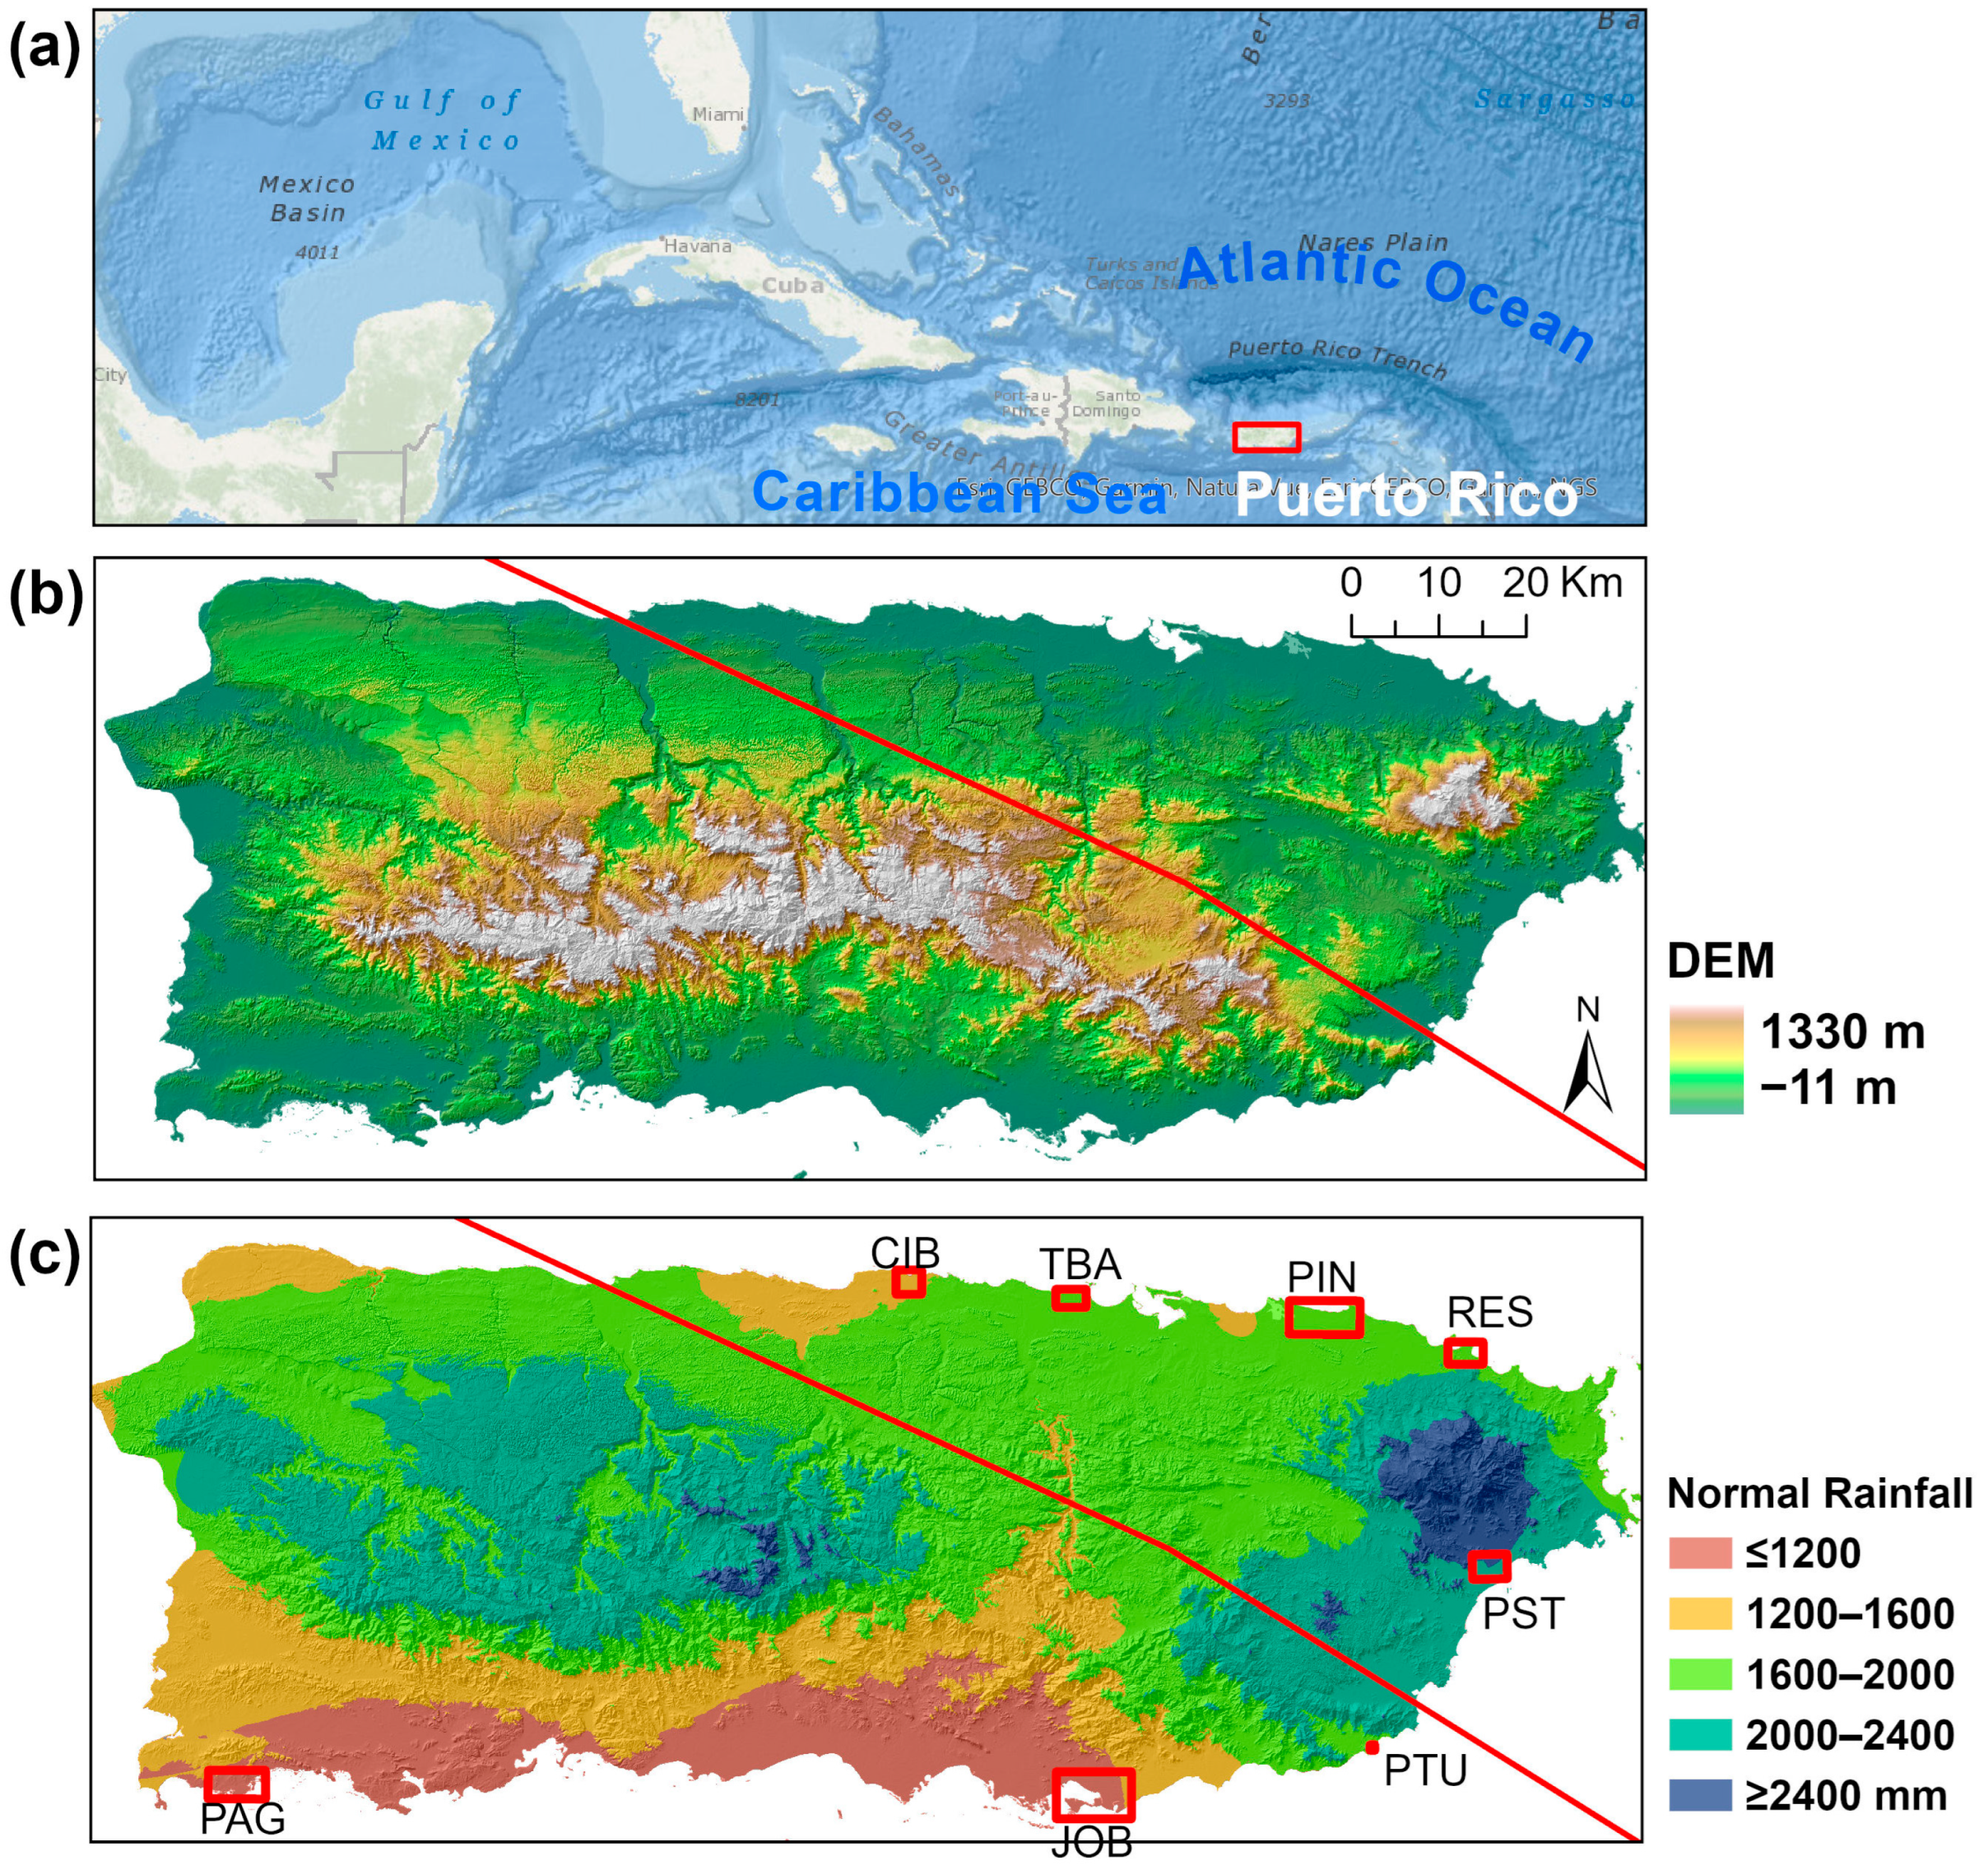
(a) Location of Puerto Rico between the Atlantic Ocean and the Caribbean Sea; (b) elevation profile of Puerto Rico; and (c) normal rainfall in Puerto Rico. The eight mangrove sites are denoted using the red boxes in (c). The site of PTU is quite small, thus appearing as a point on the map. The red line is the path of Hurricane Maria, which traversed the island from the southeast near PTU to the northwest. PAG–La Parguera, JOB–Jobos Bay, PTU–Punta Tuna, PST–Punta Santiago, RES–Rio Espírito Santo, PIN–Piñones, TBA–Toa Baja, and CIB–Cibuco.
2.2. Datasets Preparation
We chose Sentinel-2 optical images from 2016 to 2023 to explore the damage and the recovery of the coastal mangroves in Puerto Rico after the hurricane disturbance in 2017. The satellites of Sentinel-2 were launched on 23 June 2015 (Sentinel-2A) and 7 March 2017 (Sentinel-2B), respectively, and together they provide multispectral images with a revisit time of 5 days. Recently Sentinel-2C was launched on 5 September 2024, which will later replace the Sentinel-2A. The spatial resolutions for the 13 bands are 10, 20, and 60 m, ranging from the visible and near-infrared to the shortwave infrared bands in the spectrum (https://www.esa.int/Applications/Observing_the_Earth/Copernicus/Sentinel-2, accessed on 1 May 2025). We used the Level-2A Surface Reflectance (SR) product of the Harmonized Sentinel-2 MultiSpectral Instrument (MSI), archived at the Google Earth Engine [37]. This dataset fixed the scenes with a value shift after 25 January 2022.
In the humid tropics, clouds and cloud shadows are one of the major concerns for the applications of multispectral optical images to monitor land changes [38]. To address the challenge, we did the following two steps: First, we applied the Cloud Score+ [39] to mask out the areas with high cloud/shadow probability. The Cloud Score+ is an algorithm of quality assessment (QA) on optical satellite imagery. The QA band of ‘cs’, from the dataset of Cloud Score+ S2_HARMONIZED at Google Earth Engine, scores the usability of the Sentinel-2 MSI Level-2A images regarding surface visibility. For each individual pixel, the ‘cs’ value ranges from 0 to 1, with 1 indicating ‘clear’ observations. A threshold of 0.5–0.65 was suggested and we chose a threshold of 0.65 for the masking. Then, we made a median composite by calculating a median across the image collection taken in a specific time range as described below.
To assess the damage and recovery of the coastal mangroves, we selected four time periods to represent the mangrove status: before (September 2016–December 2016), a short time after (20 September 2017–31 December 2017), 1 year after (September 2018–December 2018), and 6 years after (September 2023–December 2023) the hurricanes, which were denoted as PRE, STORM, 1-YEAR, and 6-YEAR, respectively. We chose a range of ~4 months for each period to ensure enough images/pixels left for analysis after removing clouds/shadows.
We extracted the coastal mangrove distributions from the NOAA Coastal Change Analysis Program (C-CAP) [35] according to the land cover types of the Estuarine Forest Wetland and Estuarine Scrub/Shrub Wetland. We further resampled the mangrove distribution from the original 2 m resolution to 10 m to match the resolution of the Sentinel-2 images. Specifically, we explored the mangrove recovery of large patches in Cibuco, Toa Baja, Piñones State Forest, Rio Espírito Santo, Punta Santiago Humacao Natural Reserve, Punta Tuna Wetlands Natural Reserve, East of Jobos Bay (within Aguirre State Forest), and La Parguera (Table 1). These eight sites represent the large mangrove patches along the coast, covering the various mangrove types from the wet north and east regions to the dry south and southwest regions (Figure 1c). Among the mangroves’ sites, Punta Tuna (PTU) is the closest to the landfall of Hurricane Maria, and thus experienced the strongest Hurricane direct impact; La Parguera (PAG) is the furthest to the Hurricane Maria’ path and is located at the left side of the hurricane, and so it encountered the smallest direct hit.

Table 1.
Eight mangrove sites along the coast of Puerto Rico.
2.3. Image and Statistical Analyses
2.3.1. Spectral Distance, Enhanced Vegetation Index, and Mangrove Vegetation Index to Quantify the Hurricane Impact and Recovery
We quantified the change and recovery of mangroves with spectral distance involving all bands, among which the shortwave infrared bands are sensitive to moisture content and are especially important for wetland detection [40,41]. Using the period before the storm (PRE) as a reference, we assessed the change in the coastal mangroves from PRE to STORM period, 1-YEAR-after, and 6-YEAR-after, respectively [42]. The spectral distance was computed both as Euclidean distance and as spectral angle mapper. Smaller values in the spectral distance indicate more similarity to the reference spectrum (PRE). We think these spectral distances are better for analyzing the hurricane impact and the recovery of mangroves than enhanced and normalized difference vegetation indices, particularly due to the incorporation of all bands from visible to shortwave infrared.
Another measurement is the mangrove vegetation index (MVI), which is defined as the ratio of the difference between near infrared and green bands over the difference between shortwave infrared and green bands [41]. Therefore, the MVI includes both the greenness and moisture components, and the latter is especially important for wetlands. The MVI was originally used to map healthy mangroves which were identified with MVI as having ≥ a threshold of 4.5. A lower threshold of 3.5 was also suggested for small mangroves in dry areas. For comparison purpose, we also computed the NDVI and EVI. The image and statistical analyses were conducted at Google Earth Engine and ArcGIS Pro version 3.2 (ESRI, Redlands, CA, USA) platforms.
2.3.2. Potential Drivers to the Impact on and the Recovery of Coastal Mangroves
Since Maria made a landfall as a high-end category 4 hurricane and traversed the island from the southeast to the northwest, while Irma just passed by the island without making landfall, the impacts of Maria dominated [14]. To explore the drivers of the hurricane impact on and the following recovery of the mangroves, we analyzed the external drivers from the major hurricane, which included the distance to the path of Hurricane Maria and the interpolated storm rainfall and gusty wind [14], as well as the geomorphological variables, such as elevation and slope. Normal rainfall was also included to signify the spatial variation of average climate condition. The rainfall in 2018 and that during 2018–2023 were used to explore their impacts on the recovery. Rainfall data in 2018–2023 were extracted from the dataset of Climate Hazards Center InfraRed Precipitation with Station data (CHIRPS), archived at Google Earth Engine [43], whereas the normal rainfall was interpolated from the records of the meteorological stations downloaded from the NOAA climate data center.
We applied spatial error models to analyze the dependence of spectral distance from PRE to STORM period, 1-YEAR-after, and 6-YEAR-after, respectively, on the abovementioned drivers. The spatial error model explicitly considers the spatial autocorrelation of errors of a linear regression model by incorporating a spatial error matrix on the neighborhood structure (Equation (1)).
where y denotes the dependent variable, x denotes the independent variables, β denotes the coefficient matrix to be estimated, and u denotes the spatial error matrix. W denotes the weight matrix determined by the neighborhood structure. λ is the spatial autocorrelation coefficient. ε is the normal independent and identically distributed residual. The spatial neighborhood weight was calculated based on four nearest neighbors. We randomly sampled around 1000 pixels for each spatial regression. For each regression, we iteratively selected the explanatory variables by achieving the minimum Akaike information criterion (AIC), a widely accepted index that balances model complexity and likelihood of the model. Specifically, we first fit a full model with all the explanatory variables, then we iteratively eliminated the variable if the variable was not significant and dropping the variable could lead to the biggest decrease in AIC. The R package of ‘spatialreg’ in R version 4.3 was used for the spatial regression [44,45].
3. Results
3.1. Mangroves Recovery with the Spectral Distance from Pre-Storm Status
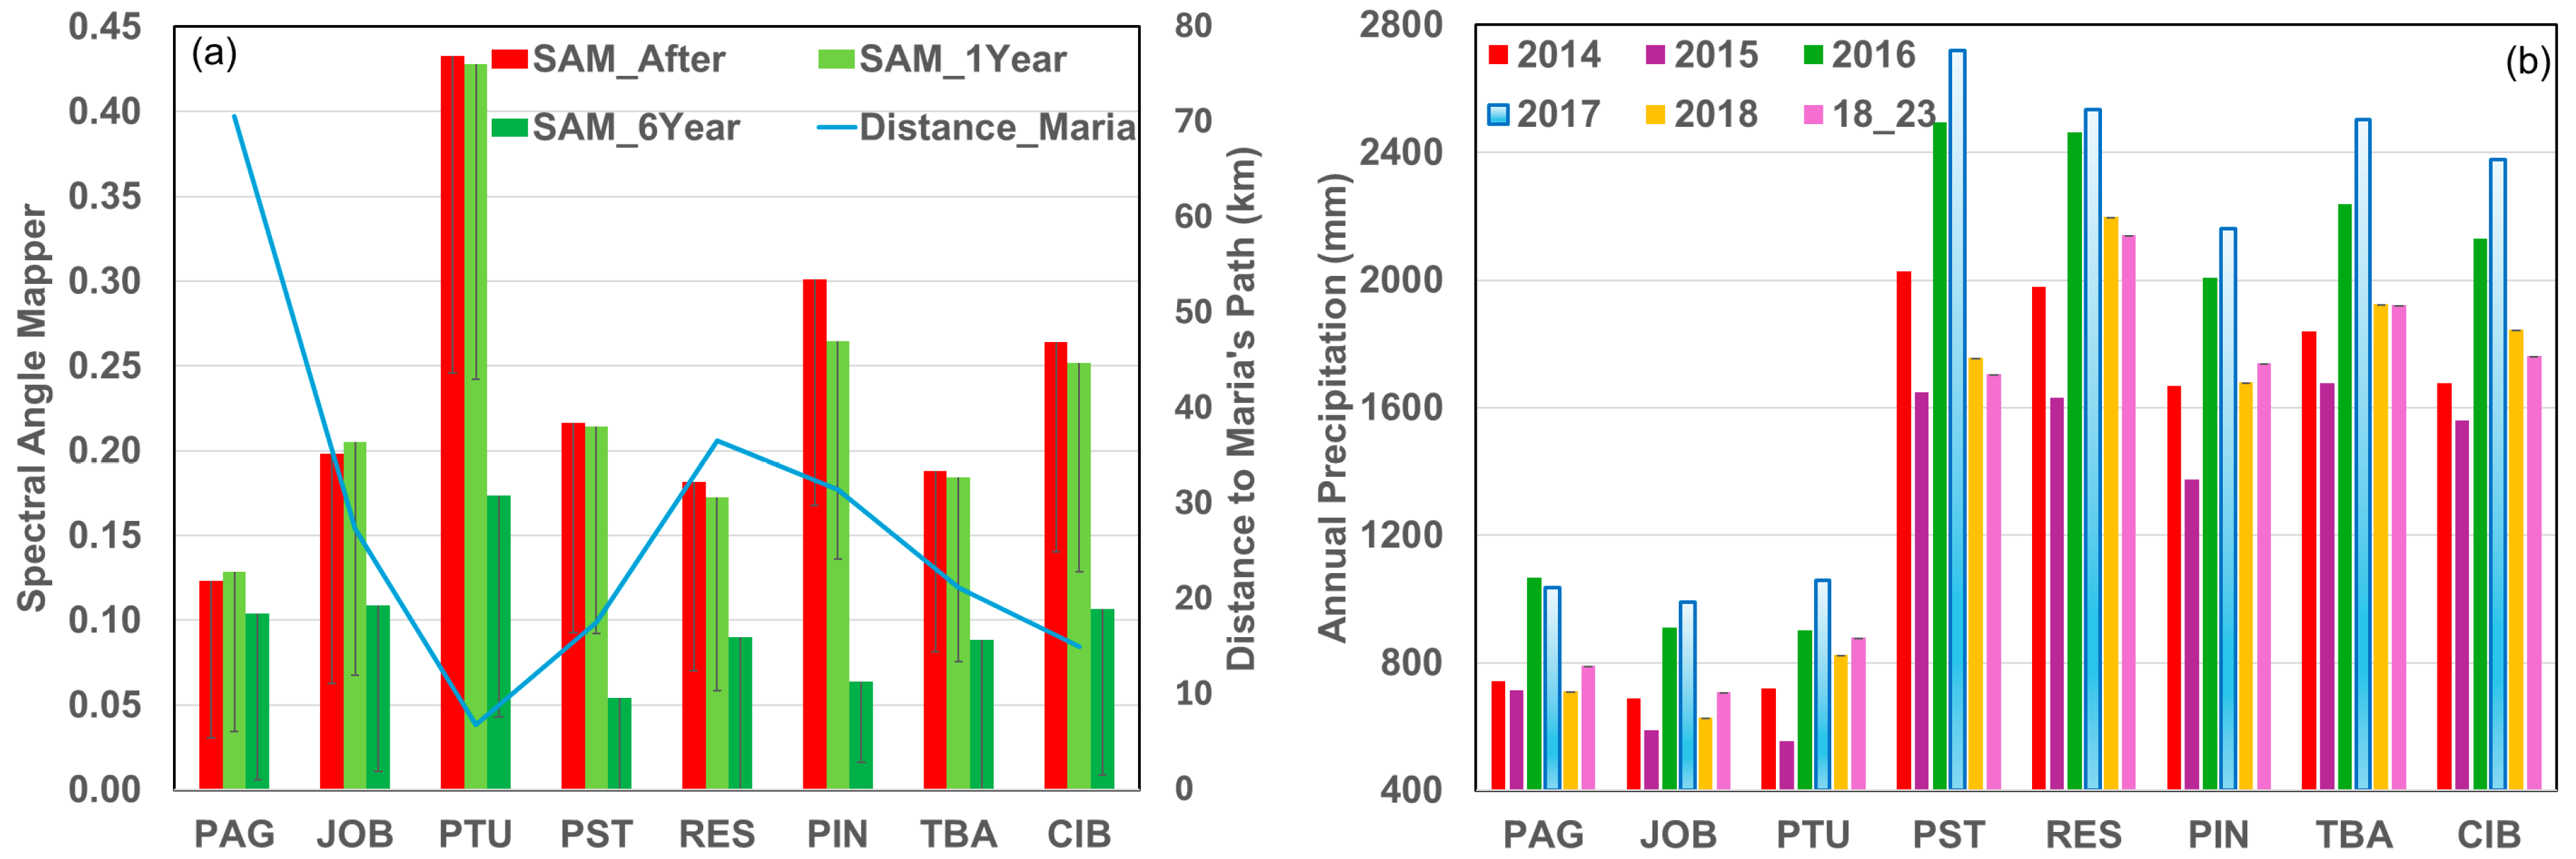
After the storm hit, we found great spectral distances in coastal mangroves with respect to the pre-storm stage. The spectral distance in general decreased with the distance to the path of Hurricane Maria (Figure 2a). The spectral angle mapper (SAM) has a mean and one standard deviation as 0.21 ± 0.14 and reached the highest of 0.43 ± 0.19 for the mangroves at Punta Tuna (PTU), which has the closest distance to the place of Maria’s landfall (Figure 2a). It has the lowest of 0.12 ± 0.09 at the State Forest of Boquerón, located west of La Parguera in the southwest (PAG), where it is the furthest from the hurricane path and located at the lower left side of the path.
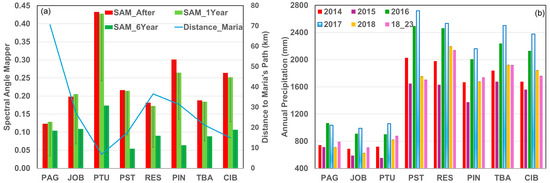
Figure 2.
(a) The mean spectral angle mapper after the hurricanes (SAM_After), 1 year (SAM_1Year) and 6 years (SAM_6Year) after the hurricanes at the mangrove sites with respect to pre-storm status. The gray line in each bar is one-side standard deviation. Distance_Maria, distance to the Maria’s path in km. (b) Annual precipitation for the years of 2014–2018, and mean annual precipitation in 2018–2023 (labelled as 18_23).
One year later, the spectral distance changed little, with a SAM mean ± STD of 0.21 ± 0.13 (Table 2). Most of the sites showed less than 5% in the changes, except the mangroves at the Piñones forest (PIN), where the SAM changed from 0.30 after the hurricanes to 0.26 1 year after (12% reduction). The two sites, PAG and JOB, in the southwest and south dry region, even showed an increase of 4%.
Table 2.
Spectral distance in Euclidean distance and spectral angle mapper (mean ± STD) after the hurricanes, 1 year after, and 6 years after from the pre-hurricane status.
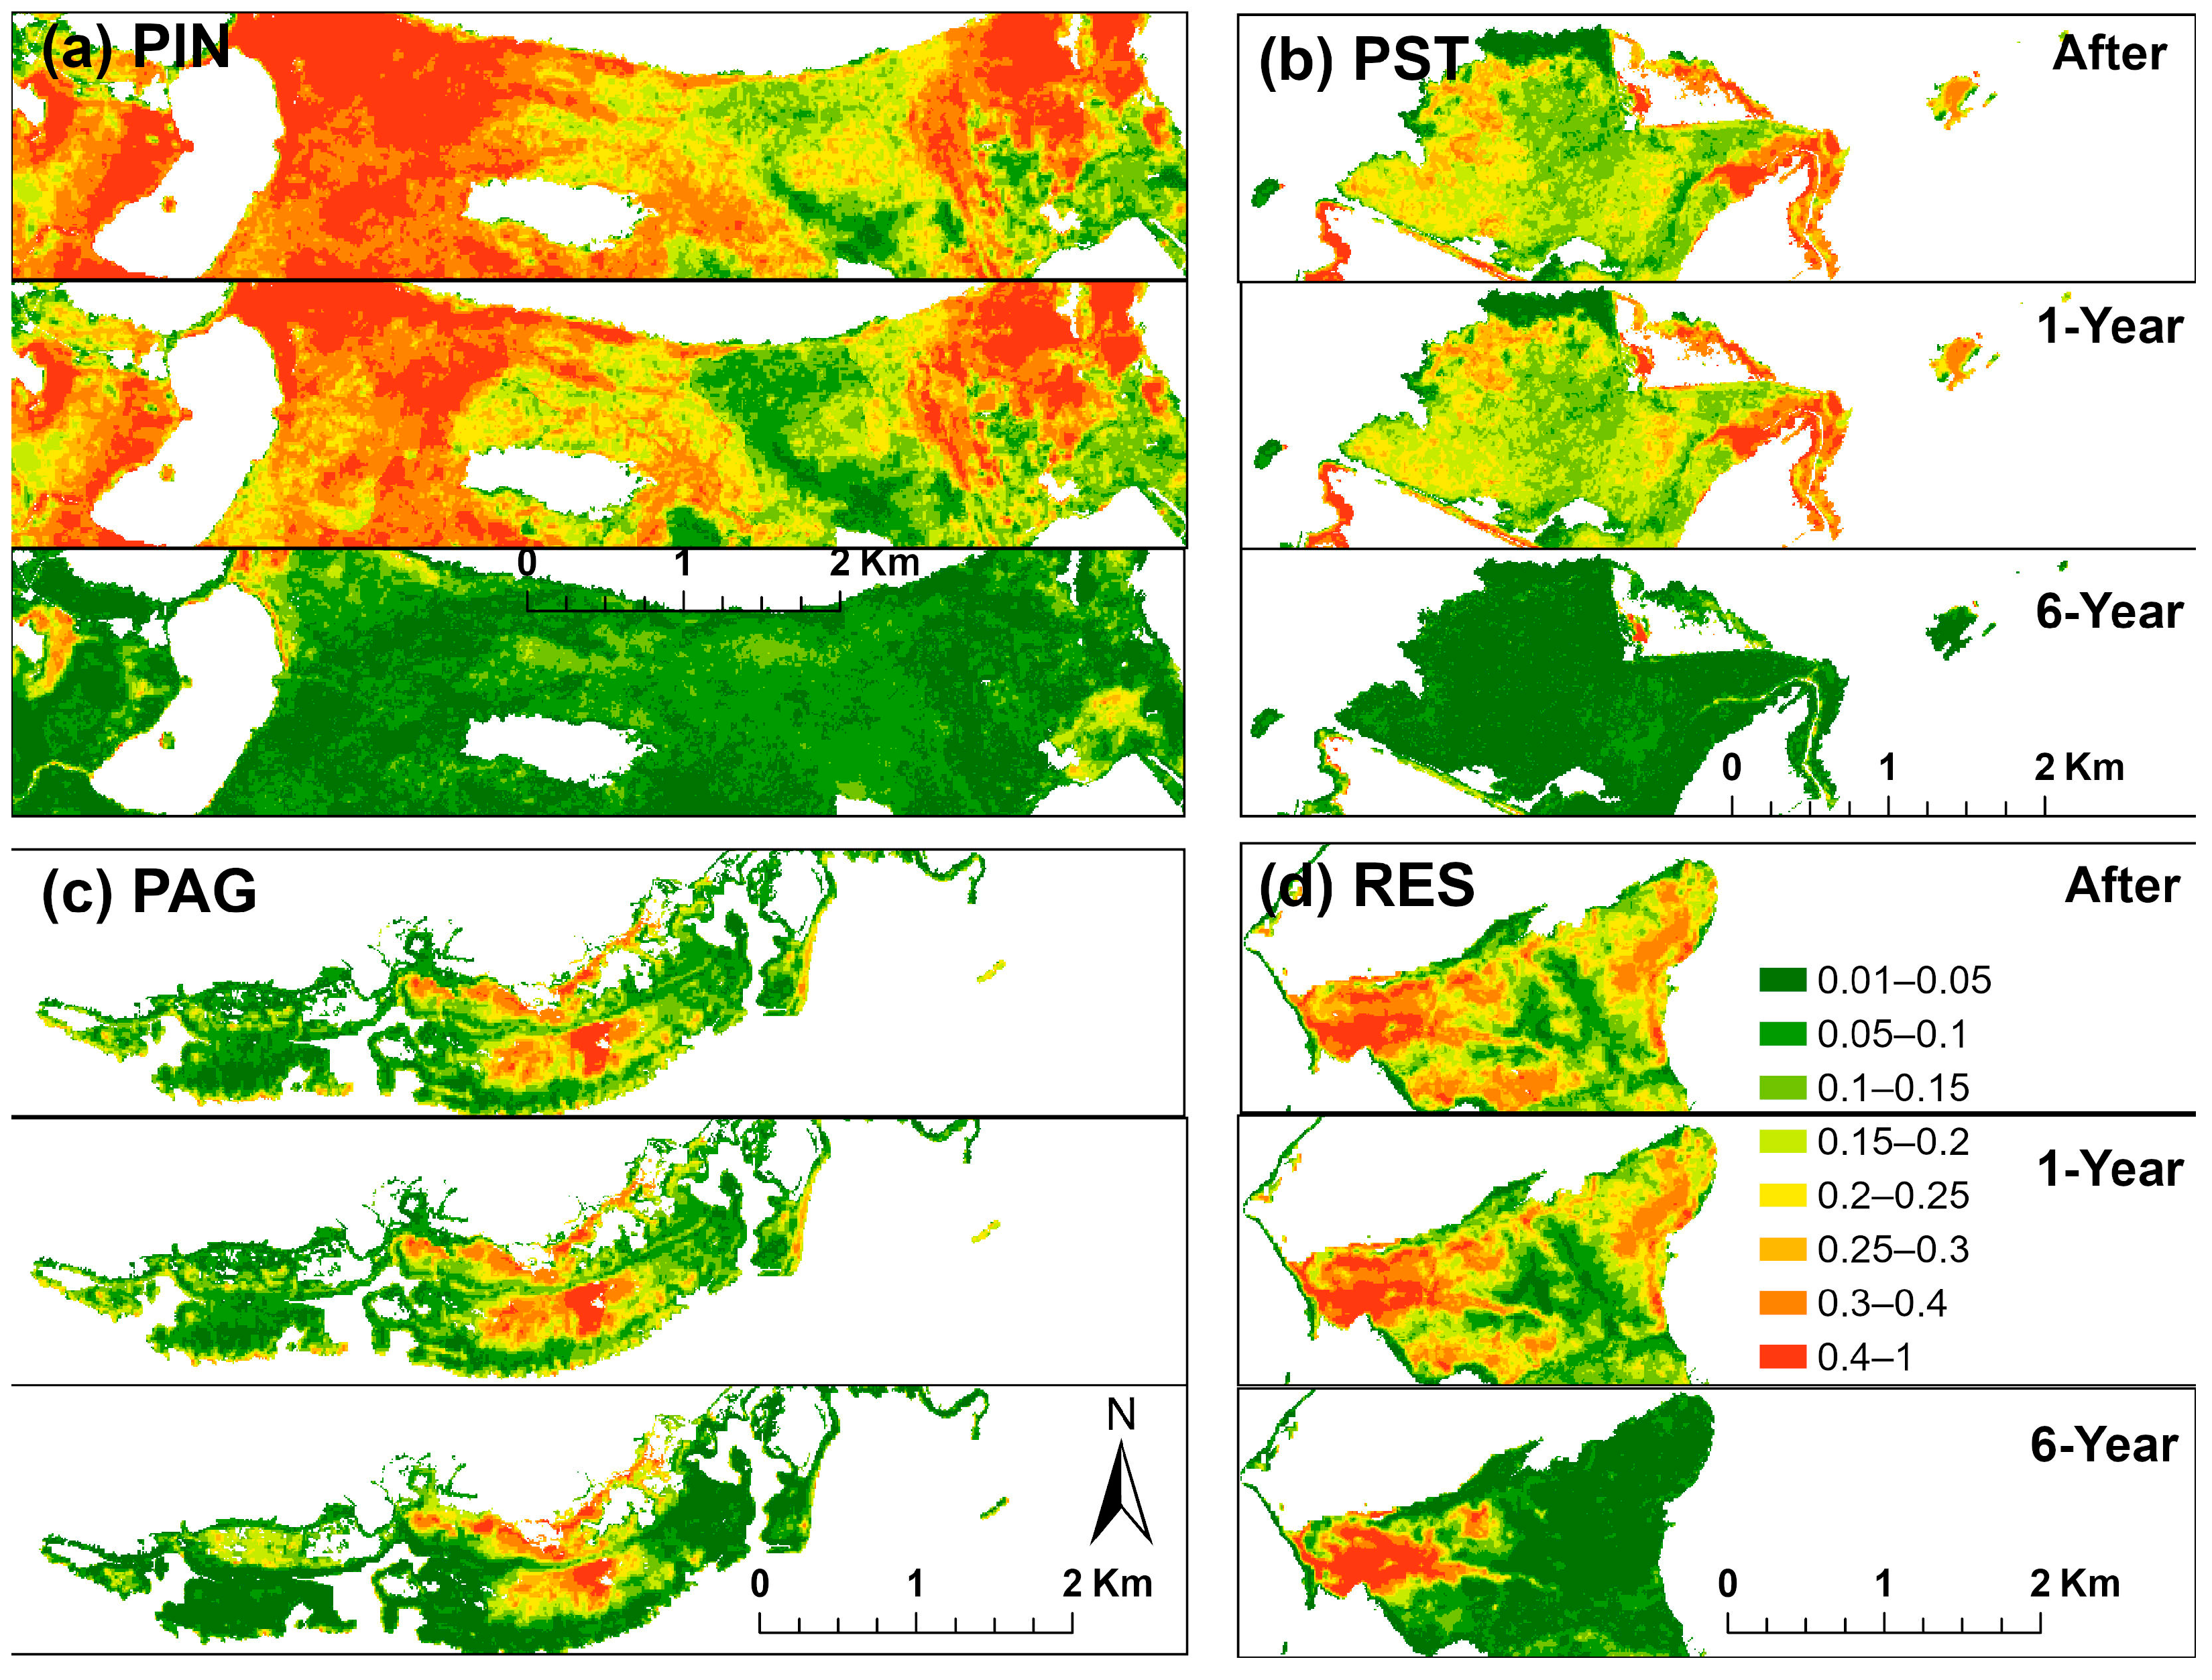
However, the recovery in 6 years is quite spatially heterogeneous both across and within the sites (Figure 3). After six years, the mean SAM across all sites decreased by 57%, reaching 0.09 ± 0.09 compared to 0.21 ± 0.14 after the hurricanes (Table 2). The mangroves at Piñones (PIN) and Punta Santiago (PST) showed the largest decreases of 79% and 75% to 0.06 and 0.05, respectively, implying the fast recovery. Although the mangroves at Punta Tuna (PTU) showed a 60% decrease in SAM, the remaining mean value of 0.17 is still relatively high, featuring slower recovery. The other five sites had a mean SAM of around 0.1. The visual inspection of the high-resolution images shows patches of mangrove mortality within these sites (e.g., Figure A1). The mangroves at the State Forest of Boquerón (PAG) exhibited the lowest reduction of 16% in SAM with the mean value changing from 0.12 to 0.13 in one year (further damage) to 0.10 in six years (Figure 3c).
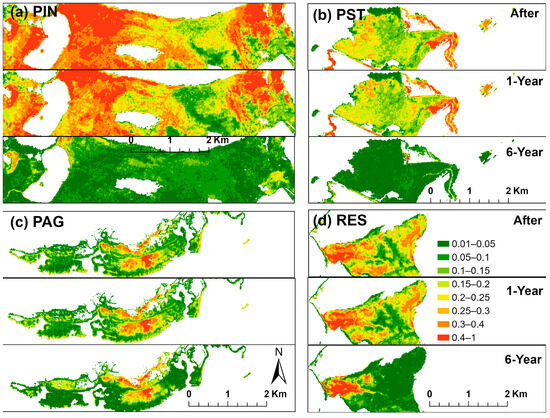
Figure 3.
Spectral angle mapper after the hurricanes (After), 1 year, and 6 years after with respect to pre-storm status at the mangrove sites of (a) PIN–Piñones, (b) PST–Punta Santiago, (c) PAG–La Parguera, and (d) RES–Rio Espírito Santo.
Similarly, the mean Euclidean spectral distance cross-site is 0.15 ± 0.087 immediately after the hurricanes, and Punta Tuna (PTU) had the greatest mean of 0.28 ± 0.11. The second highest impact was found at Punta Santiago near Humacao (PST) with the value of 0.20 ± 0.08, and this site is only 18 km away from the path of Maria. The Euclidean spectral distance after the hurricanes is much lower at La Parguera (PAG) with a mean of only 0.1 ± 0.066. The recovery in terms of the Euclidean spectral distance showed a similar pattern as that in SAM, i.e., the mangroves at Piñones (PIN) and Punta Santiago (PST) showed the largest recovery, and those at Punta Tuna (PTU) recovered slowly (Table 2).
3.2. Potential Drivers of Mangrove Damage and Recovery
The regression of the spectrum distance after the hurricanes with respect to pre-storm status (SAMSTORM and DistanceSTORM for SAM and Euclidean distance, respectively) of hurricane forces and local environment (Equations (2) and (3)) showed that hurricane damage decreased with elevation and slope, but increased with the storm rainfall, gust windspeed, and the normal rainfall. The spatial variation in storm damage is thus mostly determined by topography, e.g., elevation and slope, so that mangroves in lower and flatter areas encountered more damage. Additionally, mangroves in wetter regions or those experiencing stronger hurricane forces such as heavier storm rainfall or stronger winds encountered more damage (Equations (2) and (3)).
where DEM and Slope are elevation and slope, respectively; RainNORM, RainSTORM, and GustSTORM are normal rainfall, hurricane rainfall, and hurricane gusty winds, respectively. All variables were standardized so that the coefficient thus indicates the relative importance of the corresponding variable. The spatial autocorrelation coefficient, λ, is 0.64 and 0.57 for Equation (2) and Equation (3), respectively. All the p-values for the coefficients are < 0.05.
The period of the last quarter of 2017 and the year of 2018 was dry, and the drought was especially severe in the southwest and the south. The sites at La Parguera (PAG) and Jobos Bay (JOB) received only 710 mm and 629 mm of rainfall in 2018, respectively. The rainfall status in the 6 years after the hurricanes is still not abundant, but it is better than the year 2018 for these two sites, with 791 mm for PAG and 707 mm for JOB.
The recovery in one year was predominantly determined by the severity of damage by the storms (SAMSTORM or DistanceSTORM), and to a much lesser degree by the rainfall in the year after the storms, e.g., better recovery in areas with more rainfall in 2018, Rain2018 (Equations (4) and (5)). The recovery in 6 years was still dependent on the storm damage, but the coefficients decreased from greater than 0.9 for 1 year (Equations (4) and (5)) to less than 0.4 (Equations (6) and (7)). Rainfall during the recovery period, Rain2018–2023, and normal rainfall, RainNORM, played a key role in the recovery so that better recovery of mangroves appeared in wetter areas (Equations (6) and (7)).
where SAM1YEAR and Distance1YEAR are SAM and Euclidean distance 1 year after the hurricanes, respectively; SAM6YEAR and Distance6YEAR are SAM and Euclidean distance 6 years after the hurricanes, respectively. Rain2018–2023 is mean annual rainfall during 2018–2023, and Rain2018–2023/norm is the ratio of Rain2018–2023 to the normal rainfall RainNORM. λ is 0.59 and 0.58 for Equation (4) and Equation (5), respectively, and λ is 0.57 and 0.52 for Equation (6) and Equation (7), respectively. All the p-values for the coefficients are <0.05.
3.3. Response of Mangrove Greenness and Mangrove Vegetation Index
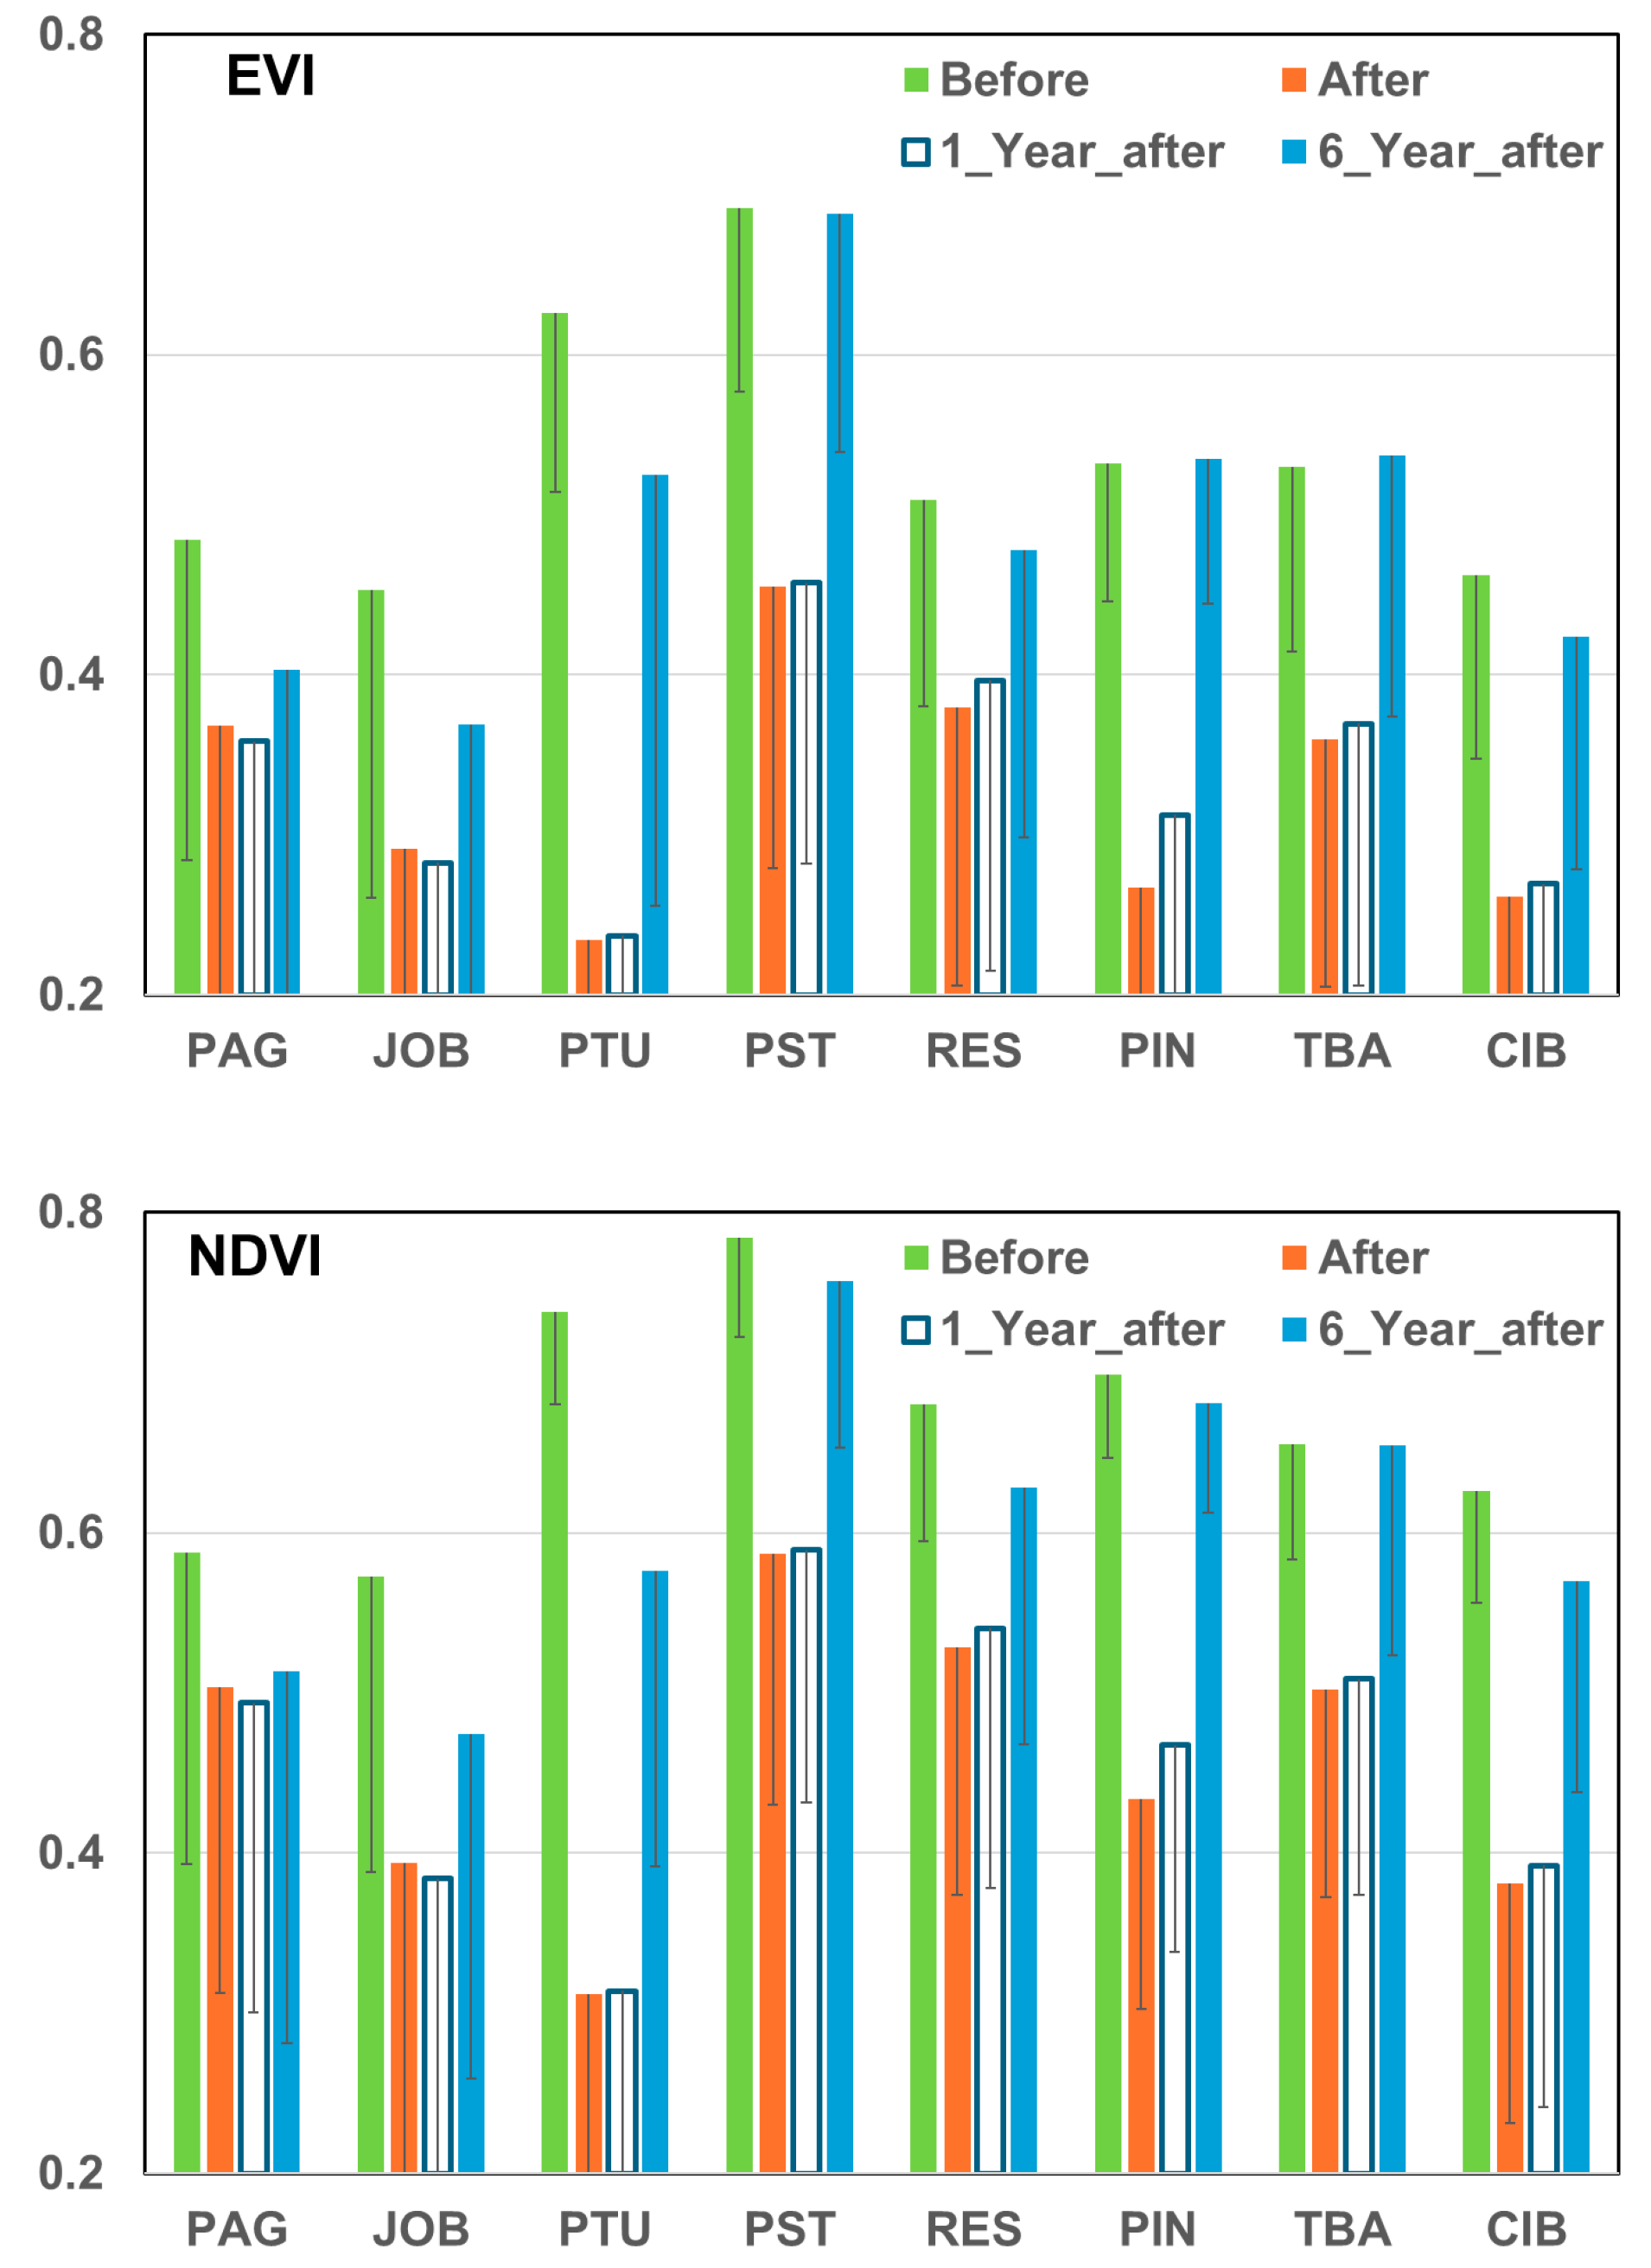
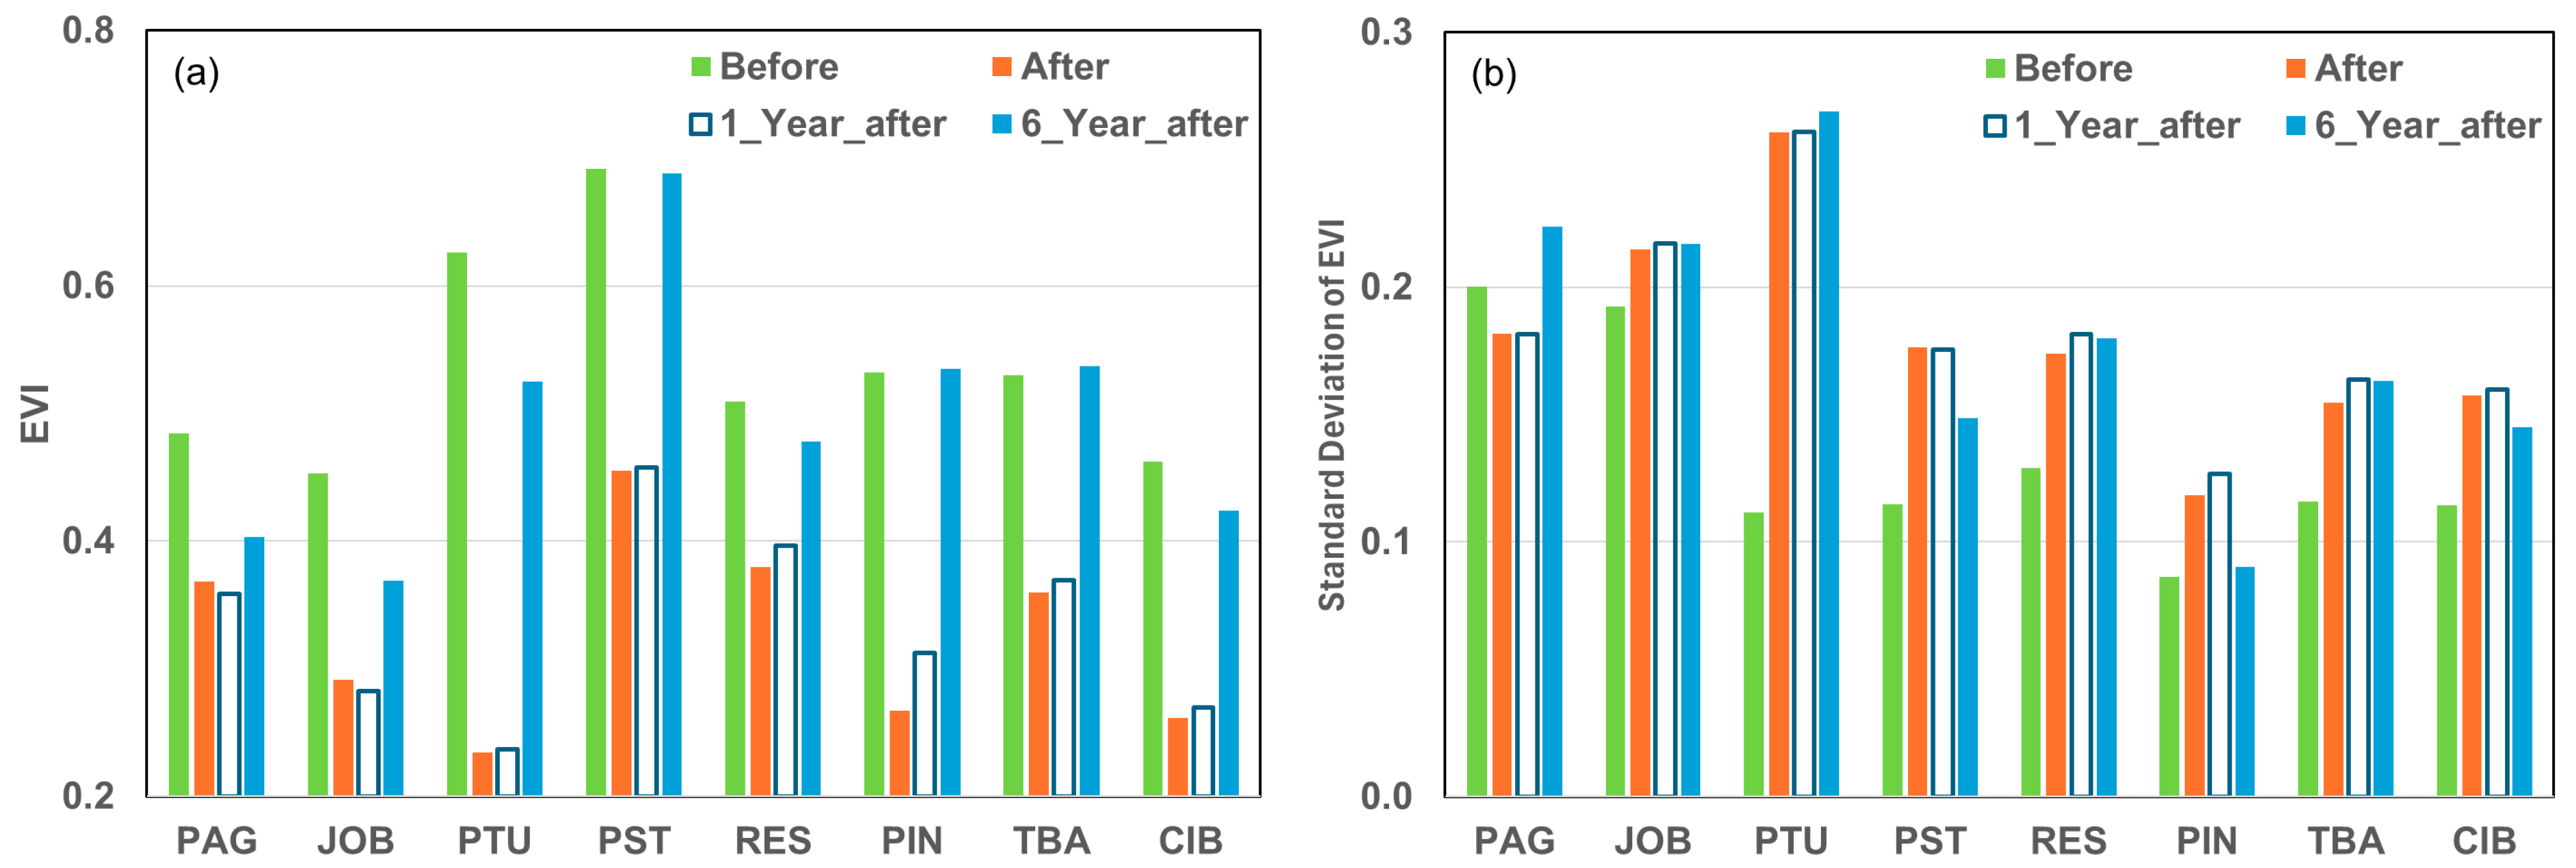
Both EVI and NDVI showed a dynamic greenness pattern spatiotemporally (Figure A2), thus we only analyzed the EVI dynamics in the following: Mangroves at the sites of Punta Santiago (PST) and Punta Tuna (PTU) at the east and the southeast had the highest EVI before the hurricanes, with the mean ± STD of 0.69 ± 0.11 and 0.63 ± 0.11, respectively (Figure 4a). Although the two dry sites at southwest and south (PAG and JOB) had low EVI (<0.5) before the hurricanes, the EVI pattern showed the largest spatial heterogeneity, with standard deviations around 0.2 compared to the others around 0.1 (Figure 4b). Hurricane Maria reduced greenness greatly for all sites and the impact reached the strongest at Punta Tuna (PTU) with a 63% reduction, leaving only a mean ± STD of 0.23 ± 0.26 for the site (Figure 4a). Mangroves at Piñones (PIN) experienced a 50% EVI cutoff. All sites except La Parguera (PAG) had increased spatial heterogeneity in EVI after the hurricanes (Figure 4b). Specifically, the spatial heterogeneity in EVI reached the highest with the standard deviation of 0.26 at Punta Tuna (PTU), more than double of that before the hurricanes (0.11). Mangroves at La Parguera (PAG) showed a decreased spatial heterogeneity instead (Figure 4b).

Figure 4.
(a) EVI and (b) standard deviation of EVI before, after, 1 year after, and 6 years after the hurricanes at the eight mangrove sites.
The two dry sites (PAG and JOB) encountered a severe drought in 2018 (Figure 2b) and the EVI in 2018 was even lower than those after the hurricanes (Figure 4a). The mangroves of the other sites had increased greenness in 2018, and the increase at Piñones (PIN) was especially strong, from 50% of the pre-hurricane EVI after the hurricanes to 59% in one year (Figure 4a). The spatial heterogeneity in greenness 1 year after stayed the same or showed a slight increase compared to that after the hurricanes (Figure 4b). After 6 years, all sites showed increased greenness and the greenness at sites of PST, PIN, and TBA fully returned to that before the hurricanes (Figure 4a). The two dry sites and Punta Tuna (PTU) had the slowest recovery in greenness and the EVI after 6 years is 81–84% of that before the disturbance (Figure 4a). However, only at PIN, the spatial heterogeneity of greenness (in terms of standard deviation of EVI) returned to that before the disturbance (Figure 4b). All other sites still showed increased spatial heterogeneity after 6 years, especially at PTU (0.27 of EVI standard deviation compared to 0.11 before the hurricanes). Figure 5 shows the spatially differentiated recovery in greenness of the mangroves at three representative sites: PAG with slow recovery, RES with spatially heterogenous partial recovery, and PST with almost full recovery in greenness.
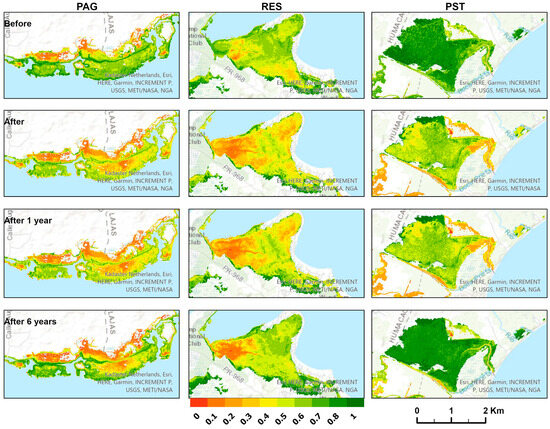
Figure 5.
EVI pattern at the sites of La Parguera (PAG), Rio Espírito Santo (RES), and Punta Santiago (PST) before, after, 1 year after, and 6 years after the hurricanes. PAG with slow recovery, RES with spatially heterogenous partial recovery, and PST with almost full recovery in greenness.
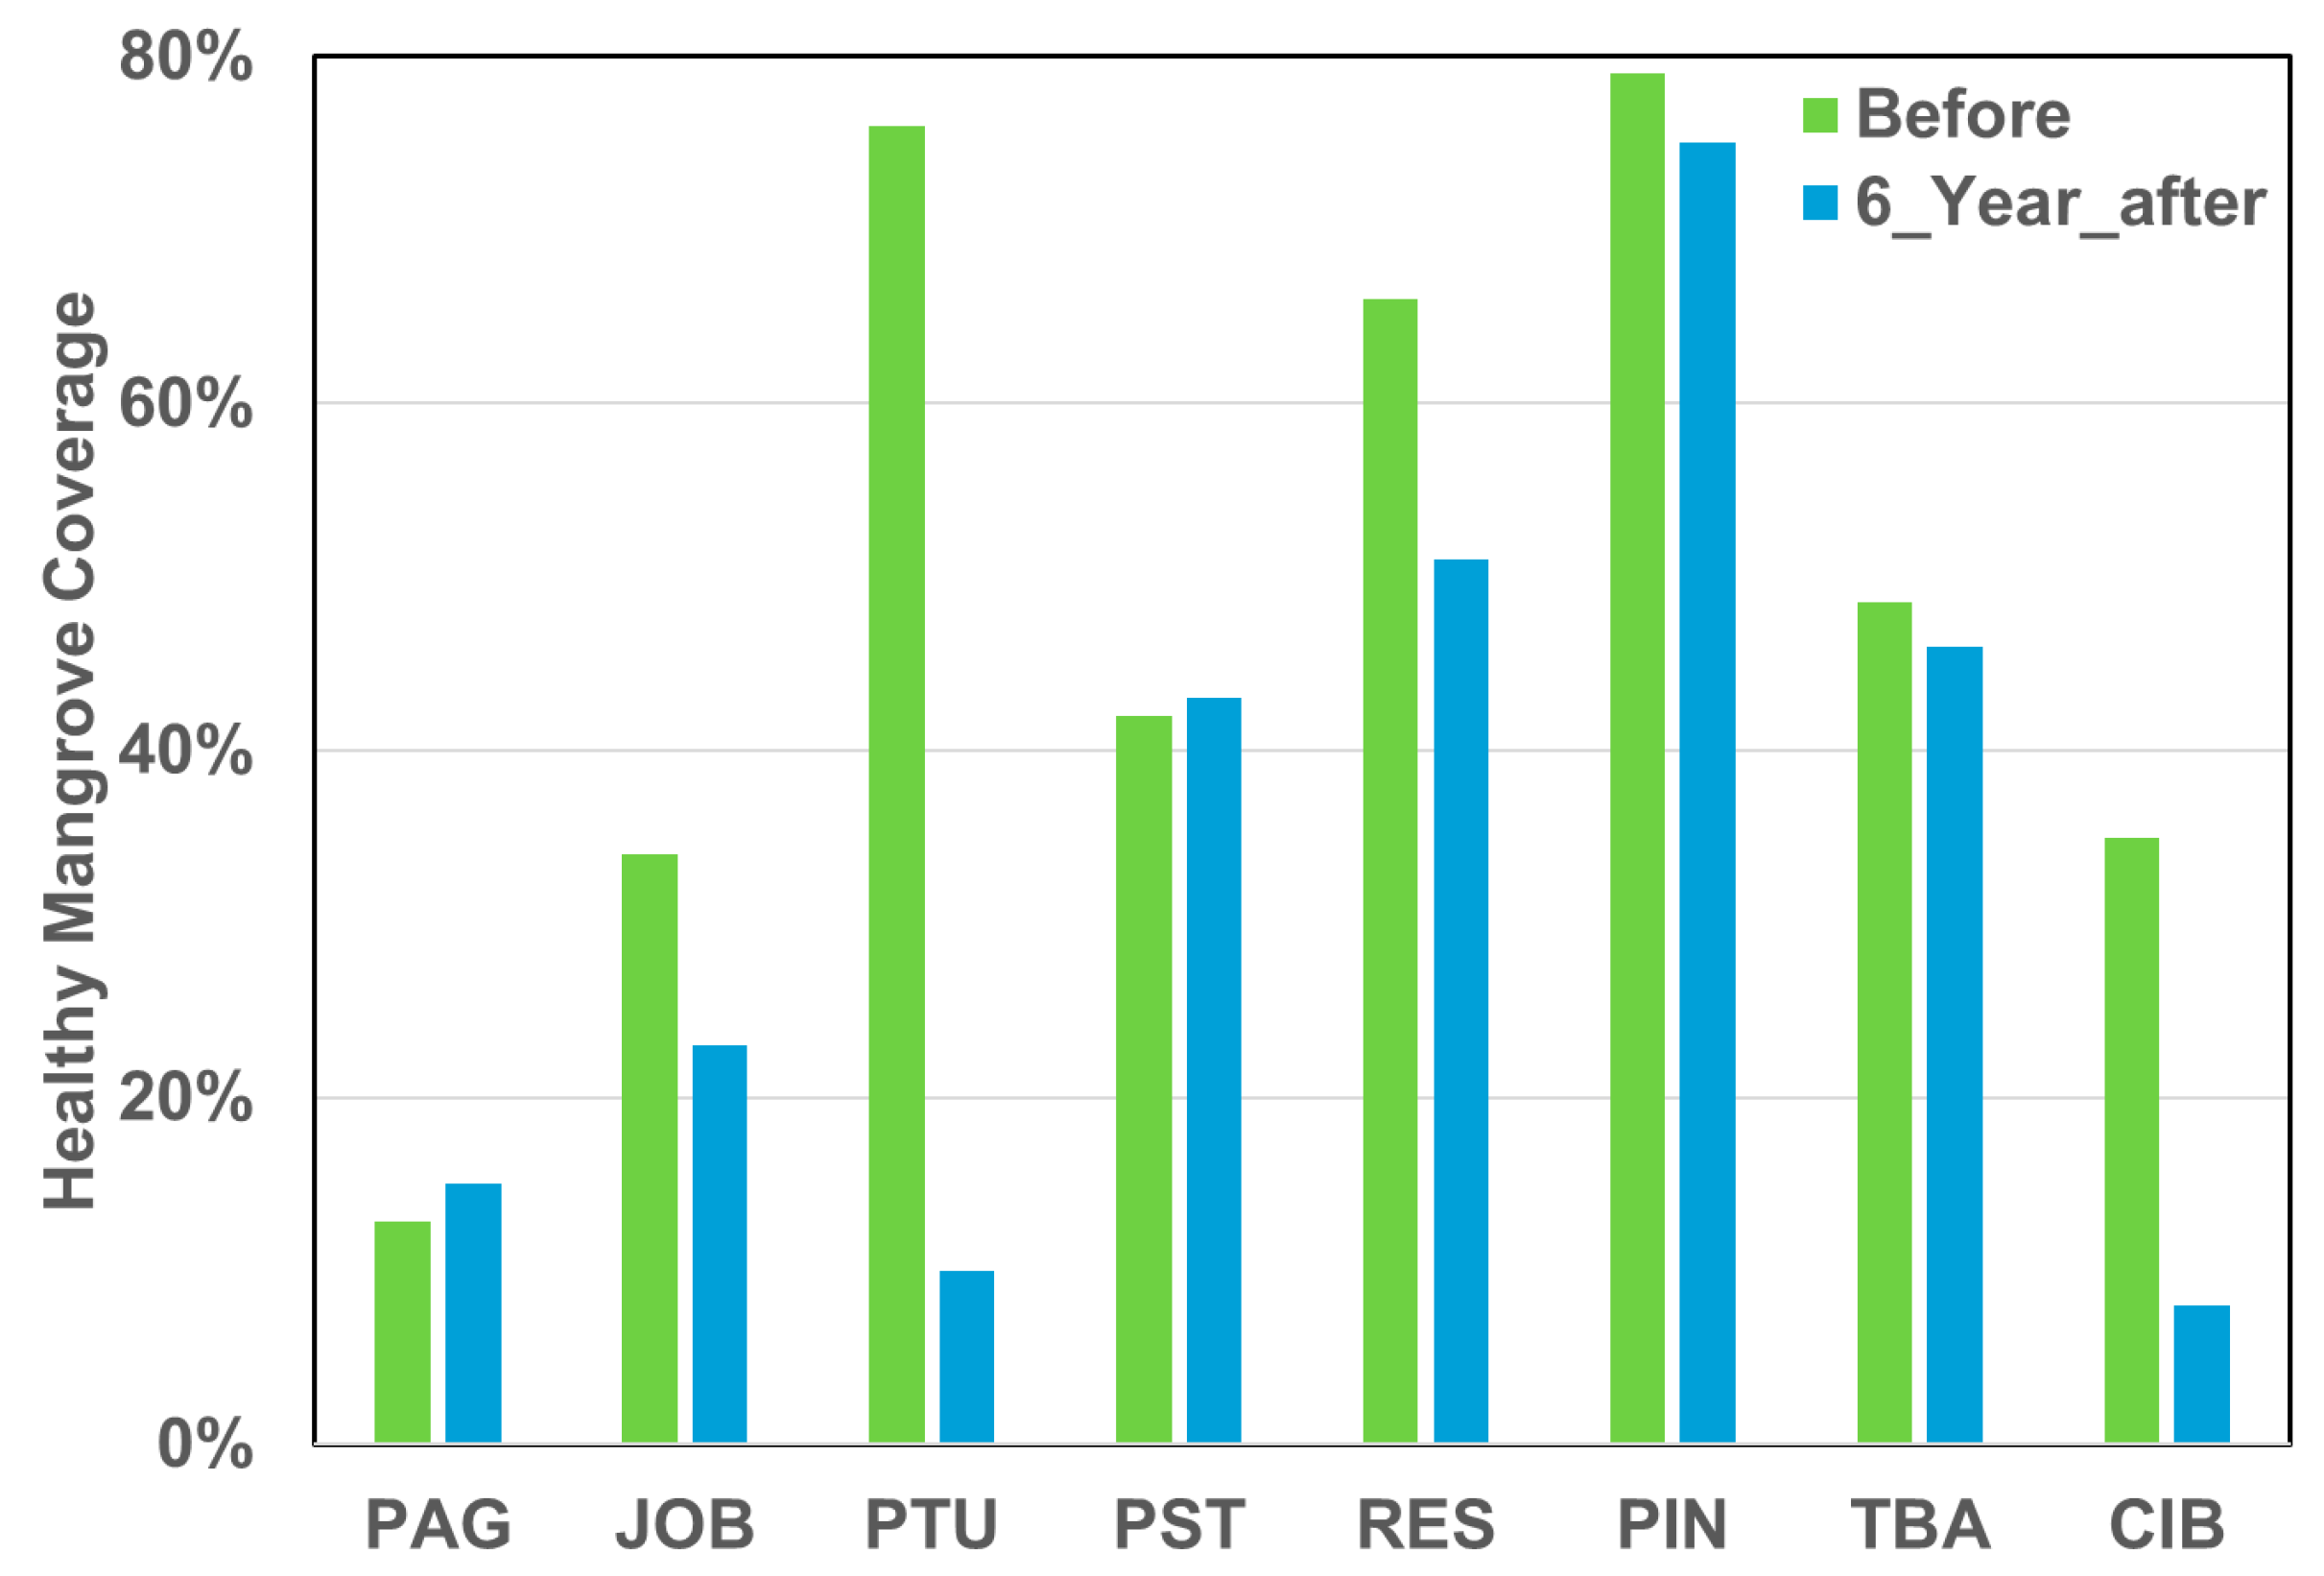
We also compared the mangrove vegetation index before the hurricanes and 6 years after the hurricanes (Figure 6). Before the hurricanes, Piñones (PIN) and Punta Tuna (PTU) had 79% and 77% of healthy mangroves with the MVI ≥ 4.5, respectively [41], and the proportions are the highest among the sites. However, 6 years after the hurricanes, the healthy mangroves covered 75% of the area at Piñones (PIN), but only 10% at Punta Tuna (PTU). This result thus implies a major difference to the pre-hurricane healthy mangrove coverage at Punta Tuna (PTU in Figure 7). Coverage of healthy mangroves at Punta Santiago (PST) and Toa Baja (TBA) recovered 6 years after the hurricanes, while the recovery of healthy mangroves at Cibuco (CIB) and Rio Espírito Santo (RES) is patchy, with mangrove mortality happening in the lowest part of Canal Las Pozas at CIB (lower middle) and along the lowest part of Canal Rodriguez at RES (left middle) (CIB and RES in Figure 7). At the dry site of La Parguera (PAG), the proportion of mangroves with MVI ≥ 4.5 increased.

Figure 6.
Percent of areas with mangrove vegetation index (MVI) ≥ 4.5 at the eight mangrove sites before the hurricanes and 6 years after the hurricanes.
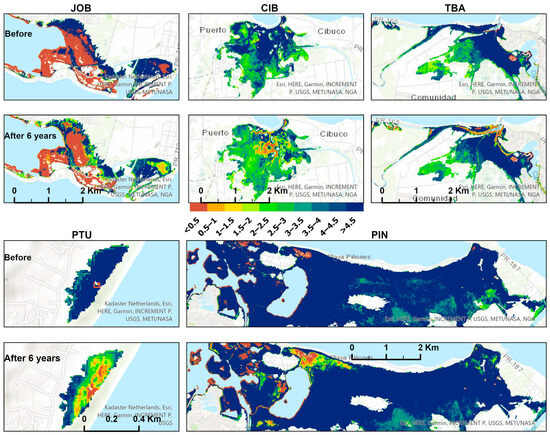

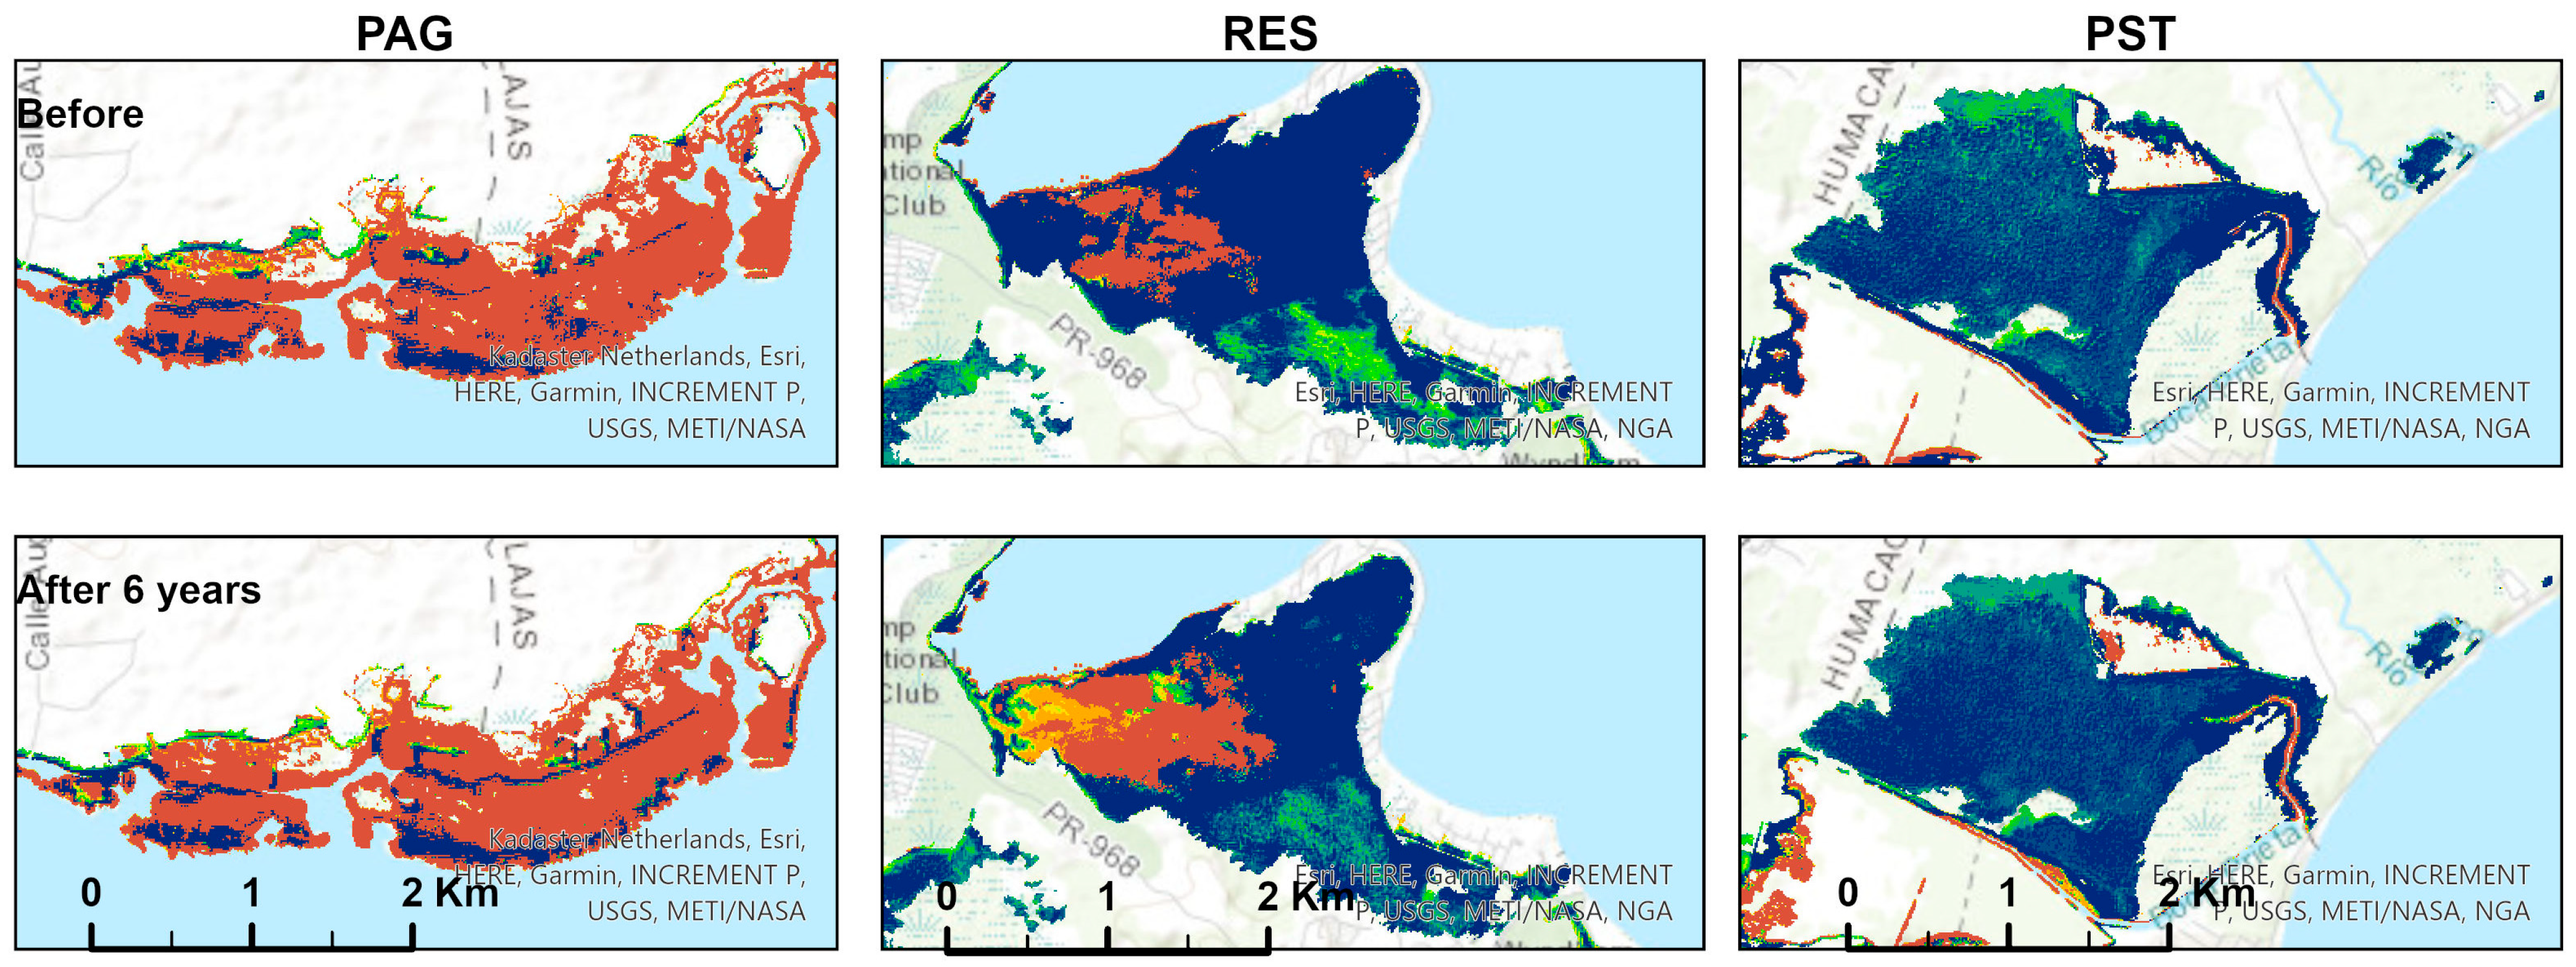
Figure 7.
Mangrove vegetation index (MVI) before the hurricanes and 6 years after at the eight mangrove sites. The scale for PTU is different from others.
4. Discussion
Topography, e.g., elevation and slope, plays the most important role in determining the hurricane damage to mangroves for this case study, followed by the hurricane forces and normal rainfall, as indicated by the larger coefficients before the variables of topography in the Equations (2) and (3). Although hurricane wind is a major concern in terms of damaging the forest canopies [9], geomorphology determines the depth and length of the period of inundation, which also greatly challenges the survival of coastal mangroves. Hurricane Maria traversed the island with a sustaining windspeed of 249 km h−1 at landfall. According to existing studies on hurricane disturbance in East Caribbean mangroves, the relationship between the damage and the wind speed follows a sigmoidal curve, and a maximum slope at 130 km h−1 for a high canopy and 180 km h−1 for a low canopy was suggested [9]. The windspeed of Hurricane Maria well exceeded these thresholds; therefore, geomorphology becomes the most determined driver to explain the spatial variations of the damage in this study.
The negative coefficients before the elevation and the slope in the Equations (2) and (3) indicated that mangroves at lower, flatter areas experienced more damage. This aligns with the existing findings from the LiDAR studies. For that, canopy height reduction by the hurricanes, detected from LiDAR images, revealed that lower-lying mangroves had more canopy height reduction [33,36]. In addition to the immediate hurricane wind damage [9], torrential rainfall and storm surges would lead to extended flooding at lowlands, as revealed from the SAR images taken after the disturbance [46,47], and the lengthy, deep floodings were associated with the delayed mangrove mortality in the literature. Therefore, topographic depressions are susceptible to a high chance of extended flooding for mangroves after major hurricanes. Although the aerial roots of mangroves can help take in oxygen, prolonged inundation may immerse the pneumatophores to prohibit root respiration and may suffocate mangroves [17,48,49].
The spatial regressions on mangrove damage (Equations (2) and (3)) also indicated that mangroves growing in wet regions, i.e., high in normal rainfall, experienced more damage than those in dry regions. This is probably because mangroves in wet regions usually grow much higher than those in dry regions, and are thus more susceptible to wind and rain damage. The airborne LiDAR flown over several mangrove transects in Puerto Rico in the spring of 2017 revealed a canopy height of 12.6 ± 4.4 m (mean ± STD) at Piñones with about 1800 mm of annual rainfall, in comparison to the height of 6.2 ± 1.8 m at La Parguera with less than 1000 mm of annual rainfall [33,36]. Additionally, the analysis of changes in canopy height derived from the LiDAR images found that higher canopies experienced more height reduction by the hurricane [33,36], so mangroves in wet regions with a high canopy could suffer more damage by hurricanes than those in dry regions with a low canopy.
Drought retarded the recovery of the mangroves. Although mangroves’ recovery is mostly determined by the severity of hurricane damage (Equations (4)–(7)) [16], sites with sufficient rainfall, such as Piñones (PIN), experienced fast recovery. On the other hand, the mangroves at La Parguera (PAG) and Jobos Bay (JOB) showed continued degradation in 2018 due to the drought of the year (Figure 2a).
The dry sites in the south and southwest are more impacted by the alternating droughts and hurricanes. Hurricanes often follow severe droughts, which greatly affects the forest structures and functions [50]. The severe drought in 2014–2015 already led to significant mangrove degradation and mortality in the south/southwest. In 2016, in the area of Cabo Rojo, southwest of Puerto Rico, 43% of the 16 ha mangroves died, which is significant compared to the all-living status in 1998 [51]. After the hurricane disturbance in 2017, the drought in 2018 exacerbated the mangrove degradation at the dry sites of PAG and JOB (Table 2) while the other wetter sites started to recover. The recovery at dry sites is the slowest and still showed degradation after 6 years (Figure 4a and Figure 5).
The damage and recovery patterns are highly spatial-heterogeneous for mangroves (Figure 4 and Figure 5). Most sites showed increased heterogeneity in EVI after the hurricanes, and that at Punta Tuna (PTU) even doubled compared to the value before hurricanes from 0.11 to 0.26. However, mangroves at La Parguera (PAG) showed decreased heterogeneity partly due to the continued degradation during the previous drought damage (2014–2015) and the hurricanes in 2017 and the degradation in 2018 because of the post-hurricane drought (Figure 2b, Figure 4b and Figure 5). During the gradual recovery in 6 years, most sites except Punta Tuna (PTU) and La Parguera (PAG) showed decreased heterogeneity. The mangroves at PTU had an increased standard deviation of EVI to 0.27 in 6 years, implying increased spatial heterogeneity during recovery. The site of La Parguera (PAG) also showed an increased standard deviation of EVI, from 0.2 (pre-hurricane) down to 0.18 (after and 1 year after) and up to 0.22 (6 years after).
Ground observations at Punta Tuna (PTU) showed that since Hurricane Maria made landfall close by, the damage was the most severe, with most mangroves dead and seeds and seedlings washed away. Unlike other sites, mangroves’ recovery is very limited and needs human aid for restoration. The increased greenness reflected in EVI came mostly from vegetation other than mangroves, such as Annona glabra [52]. The ground observation aligned well with the result of the mangrove vegetation index so that there were only 10% healthy mangroves (MVI ≥ 4.5) 6 years after the hurricanes, compared to 76% before the hurricanes. The lack of recovery at sites with severe damage was also reported in the literature. In St. John, U.S. Virgin Islands, limited mangrove regeneration was reported 28 months after the major hurricanes, and the potential lack of a propagule source was proposed as one of the limiting factors due to the severe damage [7]. In Lesser Antilles, some red mangroves had not recovered 10 years after a hurricane, and the hypothesis was the loss of pre-established seedlings and the difficulty for new propagules to be grown due to the local environment [22].
The patchy mortality along the canals and the rivers appeared at some sites (Figure 5 and Figure 7), such as Canal Rodriguez near Rio Espírito Santo (RES) and Canal Las Pozas at Cibuco (CIB) (Figure A1), which contributed to the high spatial heterogeneity pattern in recovery. The mangroves in these local lowlands were dead and did not show significant regrowth recently (Figure A1), possibly due to the prolonged inundation there as revealed by the SAR images [47]. Delayed mortality of mangroves was also reported in Florida, USA and Northwest Australia [17,19]. Smothering by storm surge deposits on mangrove roots was attributed to the delayed mortality of mangroves at the landfall sites in southwest Florida after Hurricane Irma in 2017 [17].
The analysis with the spectral distance, other than solely with greenness such as EVI, showed better discrimination among the spatially heterogeneous damage and recovery. EVI is limited by using the information from only three bands and it ranges from 0.37 to 0.69 across the sites 6 years after the hurricanes, whereas the spectral distance used information of all-bands and it revealed greater variation in recovery across the sites than EVI, e.g., ranging from 0.05 to 0.17 in SAM. While greenness recovered rapidly, the spectral distance showed more differentiated recovery patterns and helped in exploring the underlying mechanisms and drivers that led to the heterogeneous impact and recovery. For example, EVI at both Toa Baja (TBA) and Piñones (PIN) fully recovered in 6 years, however, spectral distance revealed a differentiated degree in recovery between these two sites. EVI at TBA reached the mean of 0.54 in 6 years compared to 0.53 before the hurricanes and 0.36 after the hurricanes, whereas SAM still showed large differences to pre-hurricane status with the value of 0.09 6 years after compared to 0.19 after the hurricanes, only reduced by 53%. However, SAM at PIN showed a 79% reduction to 0.06, which is closer to pre-hurricane status. Therefore, the spectral distance is a better measurement for recovery heterogeneity than greenness only.
The mangrove vegetation index significantly improved the discrimination of healthy mangroves from other vegetation, which contributes further understanding of mangrove recovery. Specifically for Punta Tuna (PTU), although the mean EVI in 6 years reached 84% of that before the hurricanes, only 10% of healthy mangroves, based on the MVI [41], came back in 6 years, compared to 76% before the hurricanes, indicating a sluggish recovery in mangroves.
The findings in this study are still limited by using the optical images only. Canopy structure, especially canopy height, an important indicator of forests recovery, could be detected by multiple LiDAR campaigns. Moreover, since inundation plays a more important role than other factors in delayed mangrove mortality, incorporation of SAR images, especially L-band SAR, will help derive spatiotemporal patterns in inundation. Further multi-source studies involving multi-temporal optical, SAR, LiDAR, and ground surveys will provide a more comprehensive understanding of coastal mangrove response to changes in climate variability, such as alternating severe droughts and major storms.
5. Conclusions
How coastal wetlands respond to the alternating extreme climate events is of great concern in regard to the sustainability of providing important ecosystem services to the coastal communities. By incorporating multiple indices of spectral distance, greenness, and mangrove vegetation index derived from the optical images and applying spatial error models, we improved the understanding of the underlying mechanism of coastal mangroves in response to alternating severe droughts and major storms. We classified the eight mangrove sites in the analyses into three categories in terms of the recovery trends and mechanisms.
- (1)
- Rainfall during recovery played a significant role. Sufficient rainfall facilitates recovery. Sites with a large amount of rainfall, such as Piñones (PIN) and Punta Santiago (PST), had substantial recovery in 6 years. On the other hand, scarce rainfall or drought, such as the cases of La Parguera (PAG) and Jobos Bay (JOB), retards the recovery. Hurricanes aggravated the mangrove degradation at dry sites with the pre-hurricane droughts, and the drought after the hurricanes further exacerbated it and the recovery process was largely retarded.
- (2)
- Topography and associated hydrology partly determine the chances of recovery. Topographic depressions along the lowest canals/rivers are susceptible to extended flooding which might suffocate mangrove roots and attribute to the delayed mortality at Rio Espírito Santo (RES), Cibuco (CIB), or Toa Baja (TOA).
- (3)
- The severity of damage is the primary factor to limit recovery. When the damage is too severe, such as that at Punta Tuna (PTU) next to the hurricane landfall, the recovery is sluggish, potentially due to the loss of pre-established seedlings/saplings and the unfavorable environment for new propagules establishment. Efforts such as reconnecting tidal hydrology are needed for the mangrove system restoration [15].
This study benefits from applying multiple indices other than greenness only to the monitoring of mangroves. Further studies are in need to involve optical, LiDAR, and SAR images for changes in mangrove forest structure and the roles of hydrology in mangrove dynamics.
Author Contributions
Conceptualization, M.Y. and Q.G.; methodology, M.Y.; formal analysis, M.Y. and Q.G.; writing—original draft preparation, M.Y.; writing—review and editing, M.Y. and Q.G. All authors have read and agreed to the published version of the manuscript.
Funding
This research was funded by the NOAA Puerto Rico Sea Grant NA18OAR4170089.
Data Availability Statement
The datasets used are publicly available at the NOAA data portal https://coast.noaa.gov/dataviewer/#/ accessed on 1 May 2025 and at the USGS data portal https://apps.nationalmap.gov/viewer/ accessed on 1 May 2025. Satellite Images are publicly available at Google Earth Engine.
Conflicts of Interest
The authors declare no conflict of interest.
Appendix A
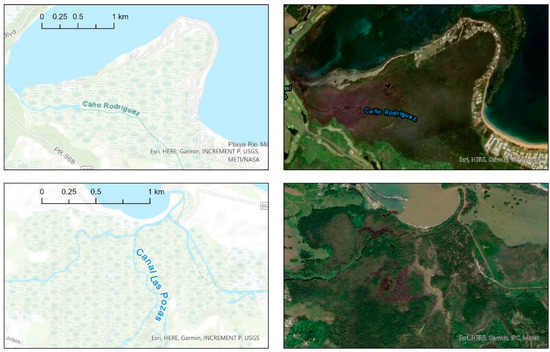
Figure A1.
High-resolution images at Rio Espírito Santo (RES, 16 May 2023, top panel) and Cibuco (CIB, 15 January 2019, bottom panel).
Figure A1.
High-resolution images at Rio Espírito Santo (RES, 16 May 2023, top panel) and Cibuco (CIB, 15 January 2019, bottom panel).
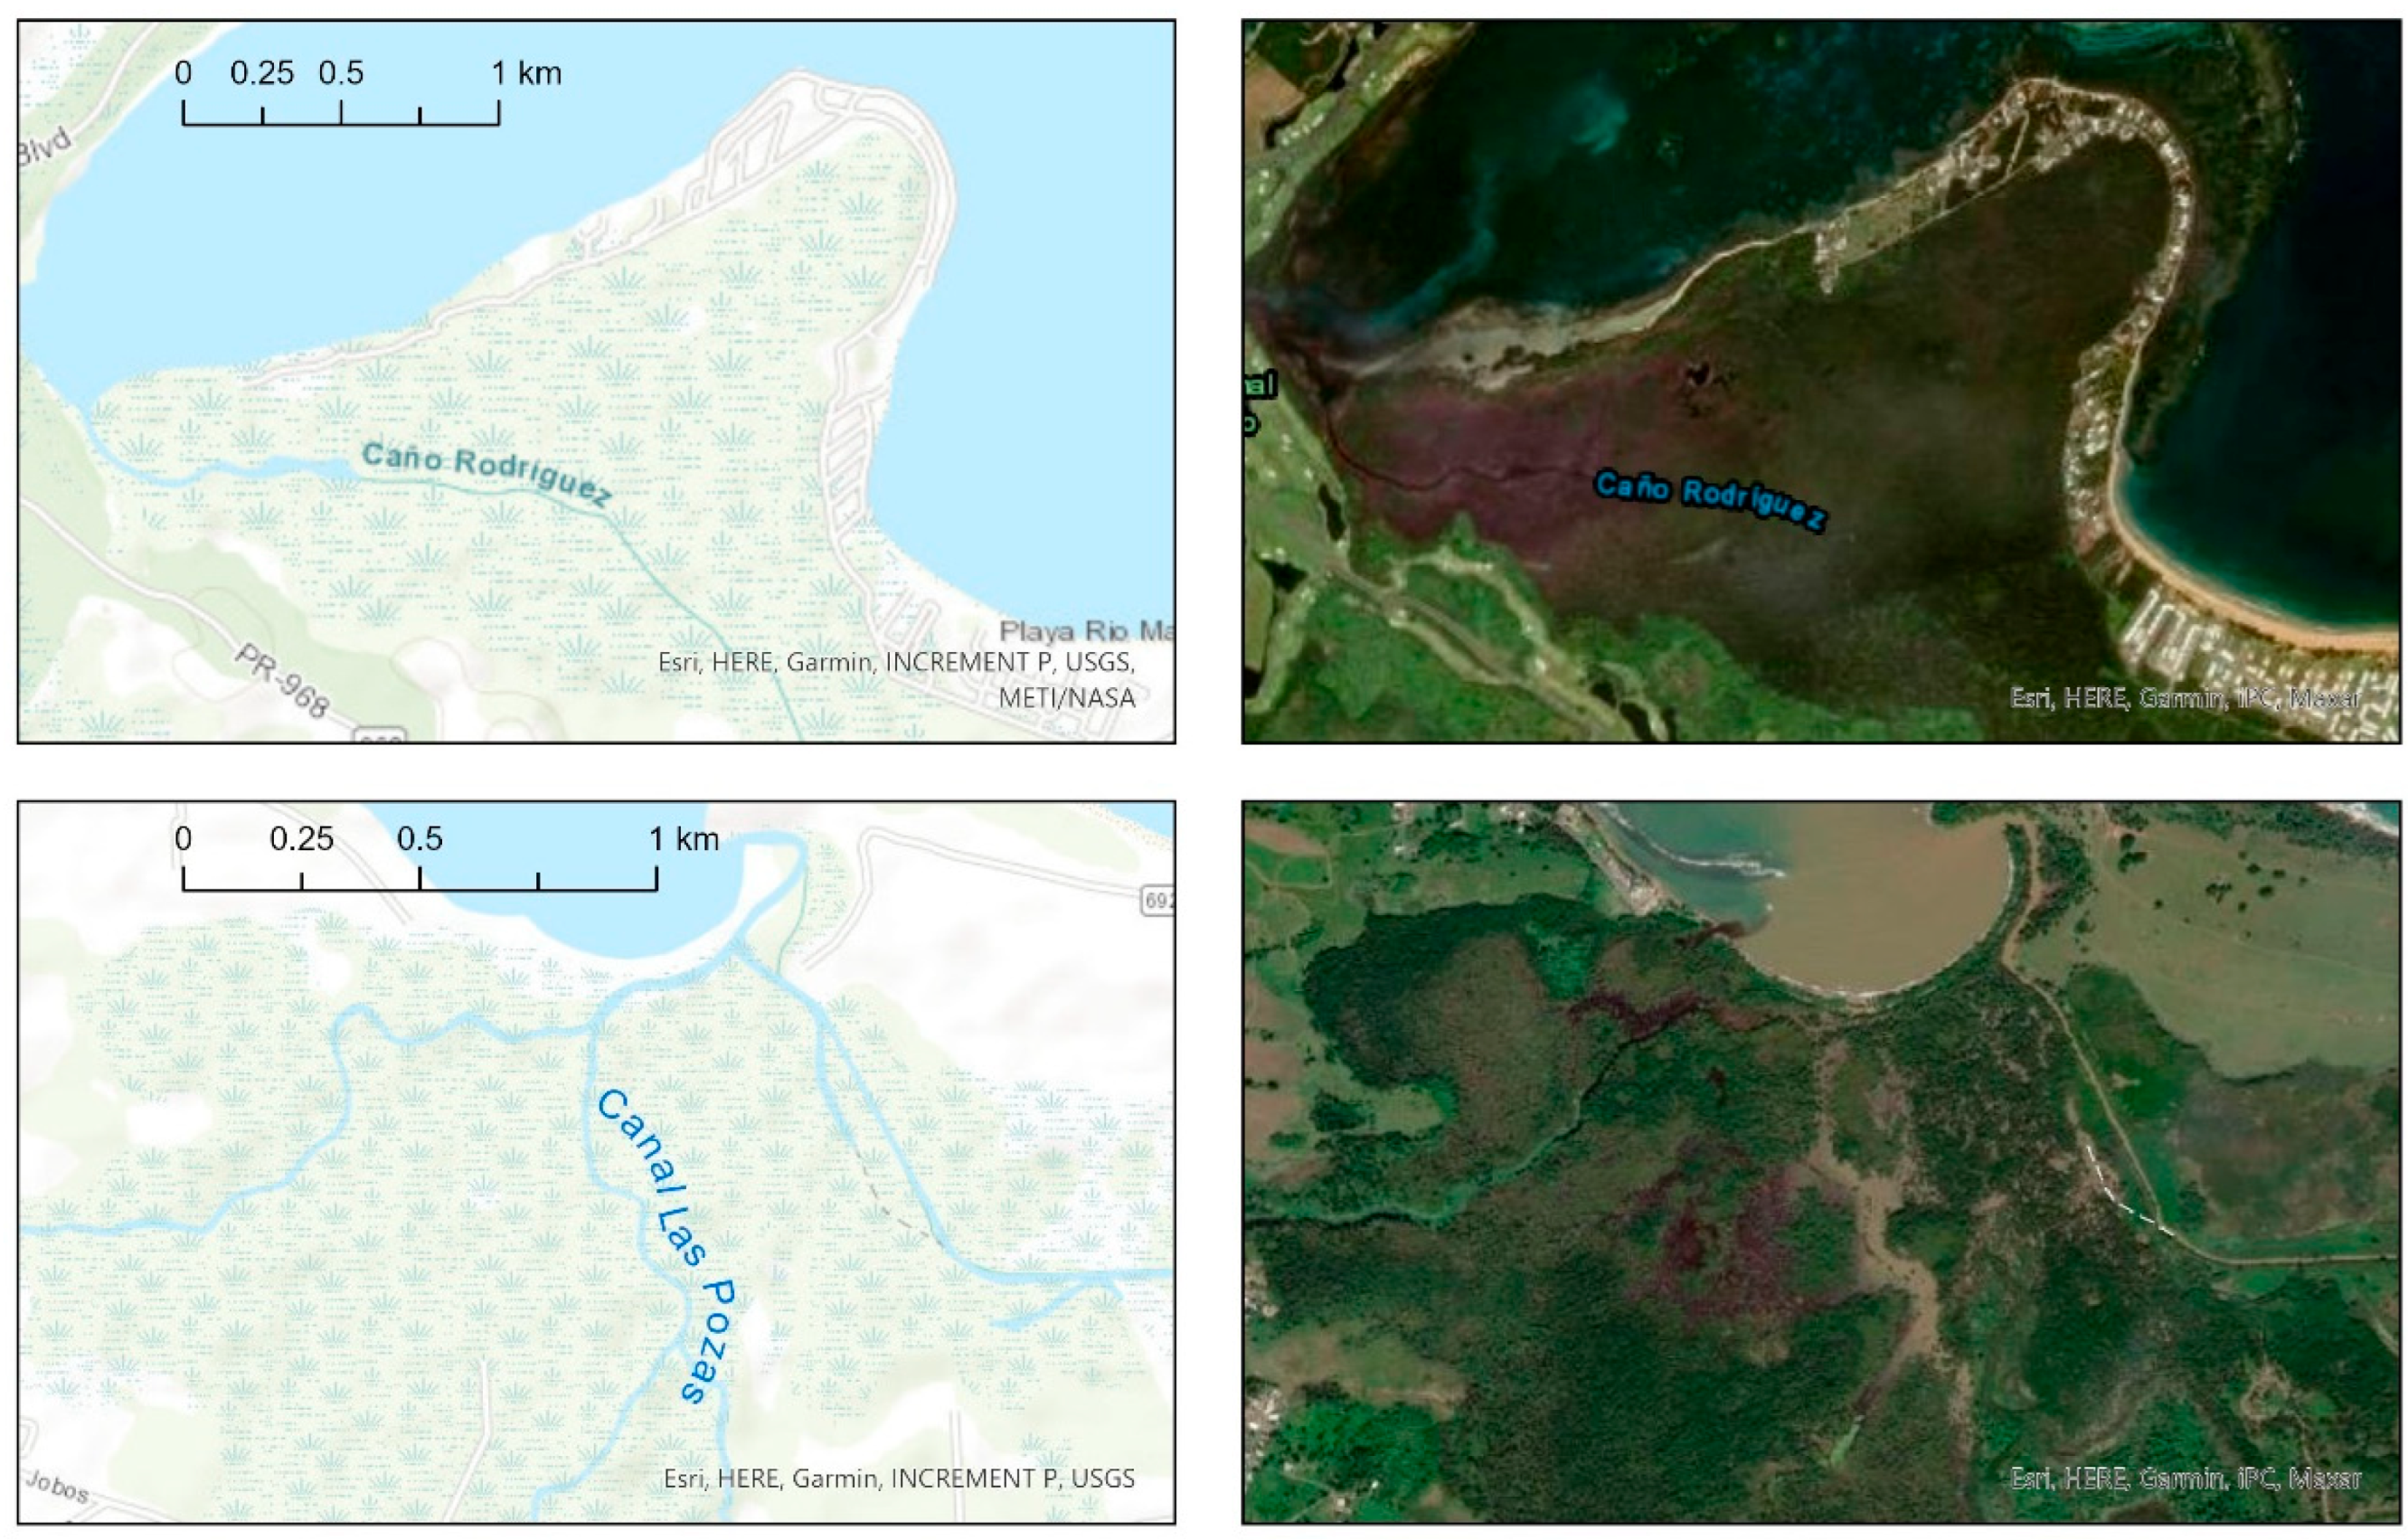

Figure A2.
EVI versus NDVI in the impacts (after) and the recovery (1 year and 6 years after the hurricanes).
Figure A2.
EVI versus NDVI in the impacts (after) and the recovery (1 year and 6 years after the hurricanes).
References
- Seneviratne, S.I.; Zhang, X.; Adnan, M.; Badi, W.; Dereczynski, C.; Luca, A.D.; Ghosh, S.; Iskandar, I.; Kossin, J.; Lewis, S.; et al. Weather and Climate Extreme Events in a Changing Climate; Cambridge University Press: Cambridge, UK; New York, NY, USA, 2021. [Google Scholar]
- Zscheischler, J.; Michalak, A.M.; Schwalm, C.; Mahecha, M.D.; Huntzinger, D.N.; Reichstein, M.; Berthier, G.; Ciais, P.; Cook, R.B.; El-Masri, B.; et al. Impact of large-scale climate extremes on biospheric carbon fluxes: An intercomparison based on MsTMIP data. Glob. Biogeochem. Cycles 2014, 28, 585–600. [Google Scholar] [CrossRef]
- Peneva-Reed, E.I.; Krauss, K.W.; Bullock, E.L.; Zhu, Z.; Woltz, V.L.; Drexler, J.Z.; Conrad, J.R.; Stehman, S.V. Carbon stock losses and recovery observed for a mangrove ecosystem following a major hurricane in Southwest Florida. Estuar. Coast. Shelf Sci. 2021, 248, 106750. [Google Scholar] [CrossRef]
- Duke, N.C.; Kovacs, J.M.; Griffiths, A.D.; Preece, L.; Hill, D.J.E.; van Oosterzee, P.; Mackenzie, J.; Morning, H.S.; Burrows, D. Large-scale dieback of mangroves in Australia’s Gulf of Carpentaria: A severe ecosystem response, coincidental with an unusually extreme weather event. Mar. Freshw. Res. 2017, 68, 1816–1829. [Google Scholar] [CrossRef]
- Sippo, J.Z.; Lovelock, C.E.; Santos, I.R.; Sanders, C.J.; Maher, D.T. Mangrove mortality in a changing climate: An overview. Estuar. Coast. Shelf Sci. 2018, 215, 241–249. [Google Scholar] [CrossRef]
- Yu, M.; Rivera-Ocasio, E.; Heartsill-Scalley, T.; Davila-Casanova, D.; Rios-López, N.; Gao, Q. Landscape-Level Consequences of Rising Sea-Level on Coastal Wetlands: Saltwater Intrusion Drives Displacement and Mortality in the Twenty-First Century. Wetlands 2019, 39, 1343–1355. [Google Scholar] [CrossRef]
- Krauss, K.W.; From, A.S.; Rogers, C.S.; Whelan, K.R.T.; Grimes, K.W.; Dobbs, R.C.; Kelley, T. Structural Impacts, Carbon Losses, and Regeneration in Mangrove Wetlands after Two Hurricanes on St. John, U.S. Virgin Islands. Wetlands 2020, 40, 2397–2412. [Google Scholar] [CrossRef]
- Krauss, K.W.; Osland, M.J. Tropical cyclones and the organization of mangrove forests: A review. Ann. Bot. 2019, 125, 213–234. [Google Scholar] [CrossRef]
- Imbert, D. Hurricane disturbance and forest dynamics in east Caribbean mangroves. Ecosphere 2018, 9, e02231. [Google Scholar] [CrossRef]
- Barbier, E.B.; Hacker, S.D.; Kennedy, C.; Koch, E.W.; Stier, A.C.; Silliman, B.R. The value of estuarine and coastal ecosystem services. Ecol. Monogr. 2011, 81, 169–193. [Google Scholar] [CrossRef]
- Costanza Pérez-Maqueo, O.; Martinez, M.L.; Sutton, P.; Anderson, S.J.; Mulder, K. The Value of Coastal Wetlands for Hurricane Protection. AMBIO J. Hum. Environ. 2008, 37, 241–248. [Google Scholar] [CrossRef]
- Lugo, A.E. Visible and invisible effects of hurricanes on forest ecosystems: An international review. Austral Ecol. 2008, 33, 368–398. [Google Scholar] [CrossRef]
- Smith, T.J., III; Anderson, G.H.; Balentine, K.; Tiling, G.; Ward, G.A.; Whelan, K.R.T. Cumulative impacts of hurricanes on Florida mangrove ecosystems: Sediment deposition, storm surges and vegetation. Wetlands 2009, 29, 24–34. [Google Scholar] [CrossRef]
- Yu, M.; Gao, Q. Topography, drainage capability, and legacy of drought differentiate tropical ecosystem response to and recovery from major hurricanes. Environ. Res. Lett. 2020, 15, 104046. [Google Scholar] [CrossRef]
- Krauss, K.W.; Whelan, K.R.T.; Kennedy, J.P.; Friess, D.A.; Rogers, C.S.; Stewart, H.A.; Grimes, K.W.; Trench, C.A.; Ogurcak, D.E.; Toline, C.A.; et al. Framework for facilitating mangrove recovery after hurricanes on Caribbean islands. Restor. Ecol. 2023, 31, e13885. [Google Scholar] [CrossRef]
- Peereman, J.; Hogan, J.A.; Lin, T.-C. Disturbance frequency, intensity and forest structure modulate cyclone-induced changes in mangrove forest canopy cover. Glob. Ecol. Biogeogr. 2022, 31, 37–50. [Google Scholar] [CrossRef]
- Radabaugh, K.R.; Moyer, R.P.; Chappel, A.R.; Dontis, E.E.; Russo, C.E.; Joyse, K.M.; Bownik, M.W.; Goeckner, A.H.; Khan, N.S. Mangrove Damage, Delayed Mortality, and Early Recovery Following Hurricane Irma at Two Landfall Sites in Southwest Florida, USA. Estuaries Coasts 2020, 43, 1104–1118. [Google Scholar] [CrossRef]
- Lewis, R.R.; Milbrandt, E.C.; Brown, B.; Krauss, K.W.; Rovai, A.S.; Beever, J.W.; Flynn, L.L. Stress in mangrove forests: Early detection and preemptive rehabilitation are essential for future successful worldwide mangrove forest management. Mar. Pollut. Bull. 2016, 109, 764–771. [Google Scholar] [CrossRef]
- Paling, E.; Kobryn, H.T.; Humphreys, G. Assessing the extent of mangrove change caused by Cyclone Vance in the eastern Exmouth Gulf, northwestern Australia. Estuar. Coast. Shelf Sci. 2008, 77, 603–613. [Google Scholar] [CrossRef]
- Villamayor, B.M.R.; Rollon, R.N.; Samson, M.S.; Albano, G.M.G.; Primavera, J.H. Impact of Haiyan on Philippine mangroves: Implications to the fate of the widespread monospecific Rhizophora plantations against strong typhoons. Ocean Coast. Manag. 2016, 132, 1–14. [Google Scholar] [CrossRef]
- Jimenez, J.A.; Lugo, A.E.; Cintron, G. Tree Mortality in Mangrove Forests. Biotropica 1985, 17, 177–185. [Google Scholar] [CrossRef]
- Imbert, D.; Rousteau, A.; Scherrer, P. Ecology of Mangrove Growth and Recovery in the Lesser Antilles: State of Knowledge and Basis for Restoration Projects. Restor. Ecol. 2000, 8, 230–236. [Google Scholar] [CrossRef]
- Gauthey, A.; Backes, D.; Balland, J.; Alam, I.; Maher, D.T.; Cernusak, L.A.; Duke, N.C.; Medlyn, B.E.; Tissue, D.T.; Choat, B. The Role of Hydraulic Failure in a Massive Mangrove Die-Off Event. Front. Plant Sci. 2022, 13, 822136. [Google Scholar] [CrossRef] [PubMed]
- Cai, W.; Borlace, S.; Lengaigne, M.; van Rensch, P.; Collins, M.; Vecchi, G.; Timmermann, A.; Santoso, A.; McPhaden, M.J.; Wu, L.; et al. Increasing frequency of extreme El Niño events due to greenhouse warming. Nat. Clim. Change 2014, 4, 111–116. [Google Scholar] [CrossRef]
- Cai, W.; Wang, G.; Santoso, A.; McPhaden, M.J.; Wu, L.; Jin, F.-F.; Timmermann, A.; Collins, M.; Vecchi, G.; Lengaigne, M.; et al. Increased frequency of extreme La Niña events under greenhouse warming. Nat. Clim. Change 2015, 5, 132–137. [Google Scholar] [CrossRef]
- Lu, Z.; Schultze, A.; Carré, M.; Brierley, C.; Hopcroft, P.O.; Zhao, D.; Zheng, M.; Braconnot, P.; Yin, Q.; Jungclaus, J.H.; et al. Increased frequency of multi-year El Niño–Southern Oscillation events across the Holocene. Nat. Geosci. 2025, 18, 337–343. [Google Scholar] [CrossRef]
- Barrera, R.; Acevedo; Amador, V.M.; Marzan, M.; Adams, L.E.; Paz-Bailey, G. El Niño Southern Oscillation (ENSO) effects on local weather, arboviral diseases, and dynamics of managed and unmanaged populations of Aedes aegypti (Diptera: Culicidae) in Puerto Rico. J. Med. Entomol. 2023, 60, 796–807. [Google Scholar] [CrossRef]
- Feng, Y.; Negrón-Juárez, R.I.; Chambers, J.Q. Remote sensing and statistical analysis of the effects of hurricane María on the forests of Puerto Rico. Remote Sens. Environ. 2020, 247, 111940. [Google Scholar] [CrossRef]
- Svejkovsky, J.; Ogurcak, D.E.; Ross, M.S.; Arkowitz, A. Satellite Image-Based Time Series Observations of Vegetation Response to Hurricane Irma in the Lower Florida Keys. Estuaries Coasts 2020, 43, 1058–1069. [Google Scholar] [CrossRef]
- Li, Q.; Bonebrake, T.C.; Michalski, J.R.; Wong, F.K.K.; Fung, T. Combining multi-temporal airborne LiDAR and Sentinel-2 multispectral data for assessment of disturbances and recovery of mangrove forests. Estuar. Coast. Shelf Sci. 2023, 291, 108444. [Google Scholar] [CrossRef]
- Pasch, R.J.; Penny, A.B.; Berg, R. National Hurricane Center Tropical Cyclone Report–Hurricane Maria; (AL152017); National Hurricane Center: Miami, FL, USA, 2017. [Google Scholar]
- López-Marrero, T.; Heartsill-Scalley, T.; Rivera-López, C.F.; Escalera-García, I.A.; Echevarría-Ramos, M. Broadening Our Understanding of Hurricanes and Forests on the Caribbean Island of Puerto Rico: Where and What Should We Study Now? Forests 2019, 10, 710. [Google Scholar] [CrossRef]
- Gao, Q.; Yu, M. Elevation Regimes Modulated the Responses of Canopy Structure of Coastal Mangrove Forests to Hurricane Damage. Remote Sens. 2022, 14, 1497. [Google Scholar] [CrossRef]
- Sabo, A.M.; Roy, S.S.; Pestle, W.J. Effects of climate change and extreme weather events on natural and archaeological landscapes in southwestern Puerto Rico. Remote Sens. Appl. Soc. Environ. 2024, 36, 101370. [Google Scholar] [CrossRef]
- NOAA Office for Coastal Management. 2020. C-CAP Land Cover, Puerto Rico. 2010. Available online: https://www.fisheries.noaa.gov/inport/item/48301 (accessed on 1 May 2025).
- Gao, Q.; Yu, M. Elevation and Distribution of Freshwater and Sewage Canals Regulate Canopy Structure and Differentiate Hurricane Damages to a Basin Mangrove Forest. Remote Sens. 2021, 13, 3387. [Google Scholar] [CrossRef]
- Gorelick, N.; Hancher, M.; Dixon, M.; Ilyushchenko, S.; Thau, D.; Moore, R. Google Earth Engine: Planetary-scale geospatial analysis for everyone. Remote Sens. Environ. 2017, 202, 18–27. [Google Scholar] [CrossRef]
- Wang, J.; Yang, D.; Chen, S.; Zhu, X.; Wu, S.; Bogonovich, M.; Guo, Z.; Zhu, Z.; Wu, J. Automatic cloud and cloud shadow detection in tropical areas for PlanetScope satellite images. Remote Sens. Environ. 2021, 264, 112604. [Google Scholar] [CrossRef]
- Pasquarella; Brown, C.F.; Czerwinski, W.; Rucklidge, W.J. Comprehensive Quality Assessment of Optical Satellite Imagery Using Weakly Supervised Video Learning. In Proceedings of the IEEE/CVF Conference on Computer Vision and Pattern Recognition, Vancouver, BC, Canada, 18–22 June 2023; pp. 2124–2134. [Google Scholar]
- Chen, Z.J.; Zhang, M.; Zhang, H.; Liu, Y. Mapping Mangrove Using a Red-Edge Mangrove Index (REMI) Based on Sentinel-2 Multispectral Images. IEEE Trans. Geosci. Remote Sens. 2023, 61, 4409511. [Google Scholar] [CrossRef]
- Baloloy, A.B.; Blanco, A.C.; Ana, R.R.C.S.; Nadaoka, K. Development and application of a new mangrove vegetation index (MVI) for rapid and accurate mangrove mapping. ISPRS J. Photogramm. Remote Sens. 2020, 166, 95–117. [Google Scholar] [CrossRef]
- Kruse, F.A.; Lefkoff, A.B.; Boardman, J.W.; Heidebrecht, K.B.; Shapiro, A.T.; Barloon, P.J.; Goetz, A.F.H. The spectral image processing system (SIPS)—Interactive visualization and analysis of imaging spectrometer data. Remote Sens. Environ. 1993, 44, 145–163. [Google Scholar] [CrossRef]
- Funk, C.; Peterson, P.; Landsfeld, M.; Pedreros, D.; Verdin, J.; Shukla, S.; Husak, G.; Rowland, J.; Harrison, L.; Hoell, A.; et al. The climate hazards infrared precipitation with stations—A new environmental record for monitoring extremes. Sci. Data 2015, 2, 150066. [Google Scholar] [CrossRef]
- Pebesma, E.; Bivand, R. Spatial Data Science with Applications in R; Chapman & Hall: Boca Raton, FL, USA, 2023. [Google Scholar]
- Bivand, R.; Millo, G.; Piras, G. A Review of Software for Spatial Econometrics in R. Mathematics 2021, 9, 1276. [Google Scholar] [CrossRef]
- Yu, M.; Gao, Q. Assessment of Surface Inundation Monitoring and Drivers after Major Storms in a Tropical Island. Remote Sens. 2024, 16, 503. [Google Scholar] [CrossRef]
- Yu, M.; Gao, Q. Prolonged coastal inundation detected with synthetic aperture radar significantly retarded functional recovery of mangroves after major hurricanes. Landsc. Ecol. 2023, 38, 169–183. [Google Scholar] [CrossRef]
- Choy, S.C.; Booth, W.E. Prolonged inundation and ecological changes in an Avicennia mangrove: Implications for conservation and management. Hydrobiologia 1994, 285, 237–247. [Google Scholar] [CrossRef]
- Lovelock, C.E.; Krauss, K.W.; Osland, M.J.; Reef, R.; Ball, M.C. The Physiology of Mangrove Trees with Changing Climate. In Tropical Tree Physiology—Adaptations and Responses in a Changing Environment; Goldstein, G., Santiago, L.S., Eds.; Springer International Publishing: Cham, Switzerland, 2016; pp. 149–179. [Google Scholar]
- Beard, K.H.; Vogt, K.A.; Vogt, D.J.; Scatena, F.N.; Covich, A.P.; Sigurdardottir, R.; Siccama, T.G.; Crowl, T.A. Structural and functional responses of a subtropical forest to 10 years of hurricanes and droughts. Ecol. Monogr. 2005, 75, 345–361. [Google Scholar] [CrossRef]
- Escalera-García, I.A.; Rivera-López, C.F.; López-Marrero, T. Mortalidad de Mangles en Cabo Rojo, Puerto Rico; Centro Interdisciplinario de Estudios del Litoral; Universidad de Puerto Rico: Mayaguez, Puerto Rico, 2020. [Google Scholar]
- Estudios Técnicos Inc. Plan de Manejo Reserva Natural Humedal Punta Tuna; Estudios Técnicos Inc.: San Juan, Puerto Rico, 2009. [Google Scholar]


Disclaimer/Publisher’s Note: The statements, opinions and data contained in all publications are solely those of the individual author(s) and contributor(s) and not of MDPI and/or the editor(s). MDPI and/or the editor(s) disclaim responsibility for any injury to people or property resulting from any ideas, methods, instructions or products referred to in the content. |
© 2025 by the authors. Licensee MDPI, Basel, Switzerland. This article is an open access article distributed under the terms and conditions of the Creative Commons Attribution (CC BY) license (https://creativecommons.org/licenses/by/4.0/).