
Alteration Information Extraction and Mineral Prospectivity Mapping in the Laozhaiwan Area Using Multisource Remote Sensing Data

 ,
,
Abstract
1. Introduction
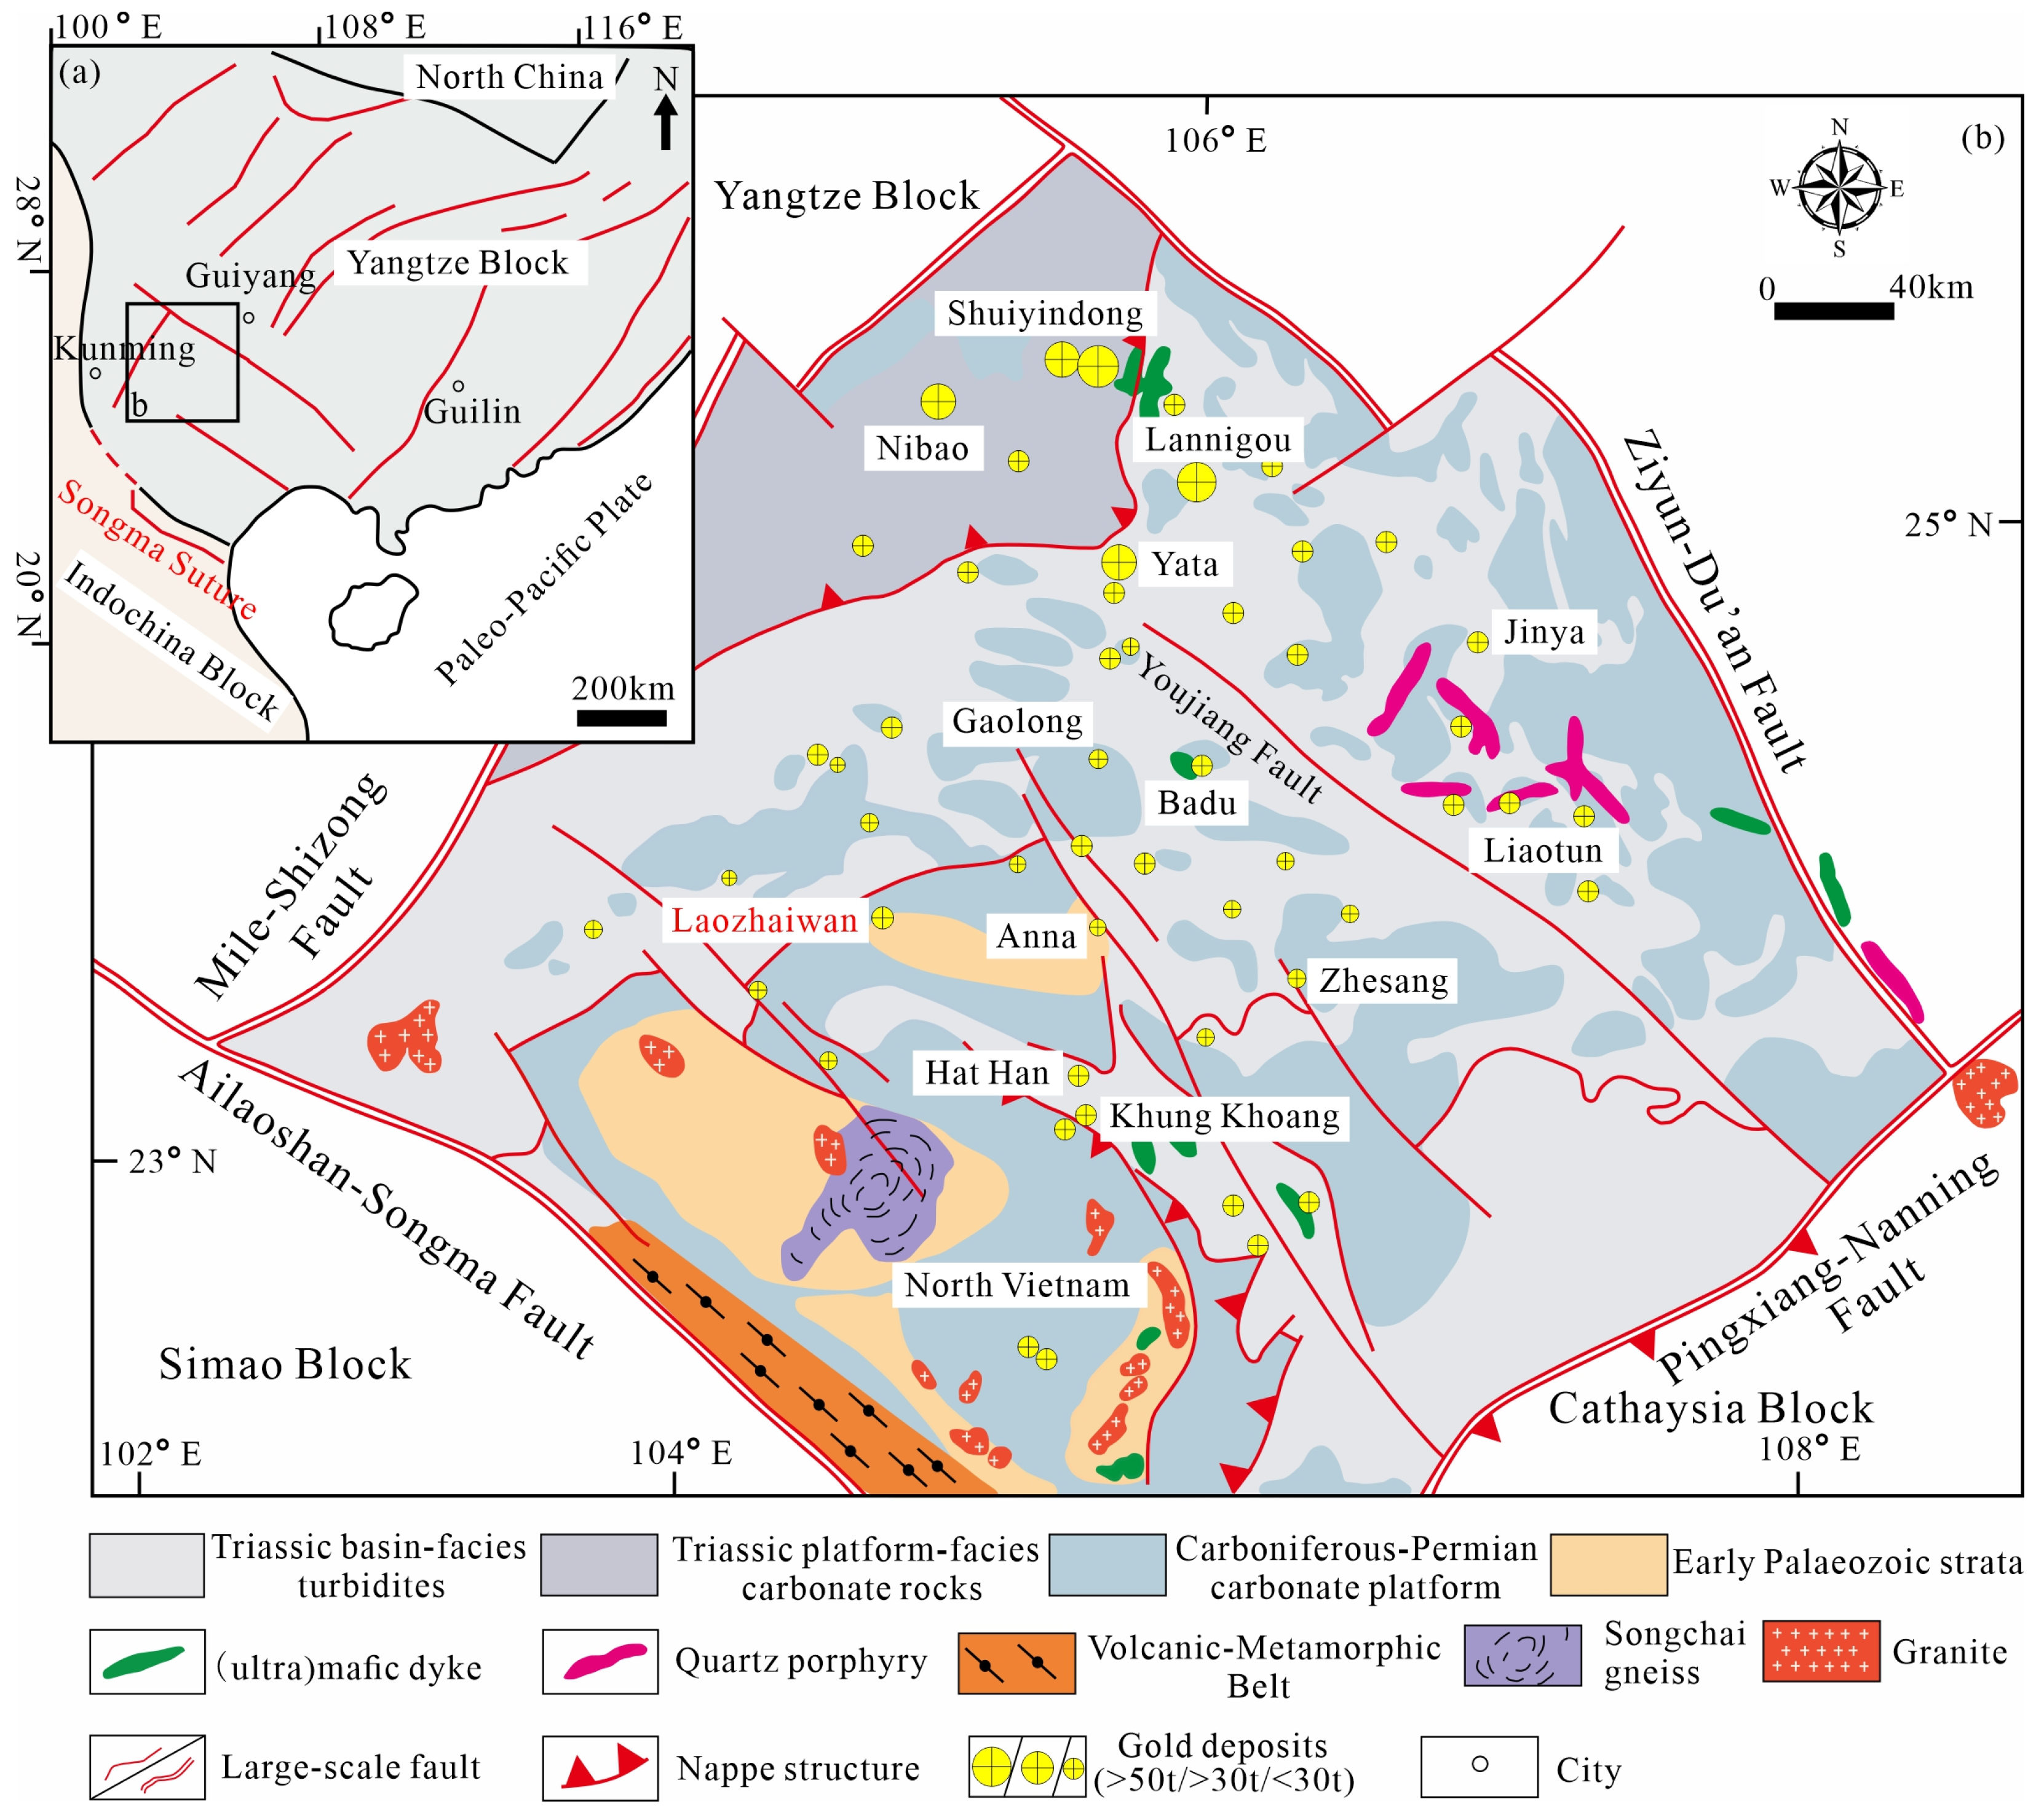
2. Geological Setting
3. Materials and Methods
3.1. Remote Sensing Data
3.2. Remote Sensing Structural Interpretation Methods
3.3. Remote Sensing Alteration Information Extraction Methods
3.3.1. Spectral Characteristics of Alteration Minerals
3.3.2. Principal Component Analysis (PCA)
3.3.3. Spectral Angle Mapper (SAM)
4. Results
4.1. Structure Interpretation Based on Sentinel-2A Data
4.2. Alteration Information Extraction Based on Sentinel-2A and ASTER Multispectral Data
4.3. Alteration Information Extraction Based on ZY1-02D Hyperspectral Data
4.4. Delimitation of Prospecting Potential Areas
5. Discussion
5.1. Analysis of Remote Sensing Work Accuracy
5.2. Analysis of Multi-Source Remote Sensing Application in Mineral Exploration
6. Conclusions
Author Contributions
Funding
Data Availability Statement
Acknowledgments
Conflicts of Interest
References
- Wang, S.C.; Wang, J. Evolution and Prospects of the Strategic Significance of Gold. Econ. Land Resour. China 2019, 32, 33–37. (In Chinese) [Google Scholar]
- Wang, M.C.; Li, Z.X.; Mao, Y.L.; Shu, P.H. Geological features and genesis of the Laozhaiwan gold deposit in southeastern Yunnan Province. Geol. Explor. 2011, 47, 261–267. (In Chinese) [Google Scholar]
- Luo, G.; Yang, X.F. Geological characteristics and metallogenic regularity of fine disseminated type gold deposit at Laozhaiwan in Guangnan area, Yunnan, China. Geol. Bull. China 2010, 29, 1362–1370. (In Chinese) [Google Scholar]
- Dong, P. A test study on alteration mapping using Landsat TM data and geographic information system. In Methodology and Practice of Remote Sensing for Mineral Exploration; Science Press: Beijing, China, 1995; pp. 24–28. [Google Scholar]
- Pour, A.B.; Hashim, M.; van Genderen, J. Detection of hydrothermal alteration zones in a tropical region using satellite remote sensing data: Bau gold field, Sarawak, Malaysia. Ore Geol. Rev. 2013, 54, 181–196. [Google Scholar] [CrossRef]
- Swayze, G.A.; Clark, R.N.; Goetz, A.F.H.; Livo, K.E.; Breit, G.N.; Kruse, F.A.; Sutley, S.J.; Snee, L.W.; Lowers, H.A.; Post, J.L. Mapping advanced argillic alteration at cuprite, Nevada, using imaging spectroscopy. Econ. Geol. 2014, 109, 1179–1221. [Google Scholar] [CrossRef]
- Zhao, Z.F.; Zhou, J.X.; Lu, Y.X.; Chen, Q.; Cao, X.M.; He, X.H.; Fu, X.H.; Zeng, S.H.; Feng, W.J. Mapping alteration minerals in the Pulang porphyry copper ore district, SW China, using ASTER and WorldView-3 data: Implications for exploration targeting. Ore Geol. Rev. 2021, 134, 104171. [Google Scholar] [CrossRef]
- Chen, Q.; Zhao, Z.F.; Xia, J.S.; Zhao, X.; Yang, H.Y.; Zhang, X.L. Improving the accuracy of hydrothermal alteration mapping based on image fusion of ASTER and Sentinel-2A data: A case study of Pulang Cu deposit, Southwest China. Geocarto Int. 2022, 37, 13923–13948. [Google Scholar] [CrossRef]
- Wu, X.T.; Chen, H.; Zhang, X.F.; Wang, J.L.; Yu, B.; Feng, Y.L.; Dai, J.J. Extraction of mineralization elements and delineation of prospecting targets using multi-source remote sensing satellite data in vegetation-covered areas: A case study of the Yimen area, Yunnan Province. Geol. Explor. 2025, 61, 268–278. (In Chinese) [Google Scholar]
- Zhang, G.; Zhao, Z.F.; Zhang, X.L.; Wu, X.T.; Zheng, Y.F.; Feng, L.X.; Huang, Z.Q. Comprehensive Multi-Source remote sensing data integration for enhanced mineralization alteration extraction and geological structure interpretation in the Lala region of Sichuan Province. Ore Geol. Rev. 2024, 168, 106032. [Google Scholar] [CrossRef]
- Hu, Z.H.; Tang, J.X.; Zhang, T.B.; Wu, H.; Xu, Z.Z.; Bei, X.J. Characteristics of Remote Sensing Alternation Anomalies form ASTER in the Duobuza Porphyry Copper Deposit. Remote Sens. Nat. Resour. 2012, 24, 150–154. (In Chinese) [Google Scholar]
- Zhang, T.; Yi, G.; Li, H.; Wang, Z.; Tang, J.; Zhong, K.; Li, Y.; Wang, Q.; Bie, X. Integrating Data of ASTER and Landsat-8 OLI (AO) for Hydrothermal Alteration Mineral Mapping in Duolong Porphyry Cu-Au Deposit, Tibetan Plateau, China. Remote Sens. 2016, 8, 890. [Google Scholar] [CrossRef]
- Feng, Y.L.; Dai, J.J.; Bai, L.Y.; Wu, C.Y. Prospecting Prediction for the Yulong Metallogenic Belt in Tibet Based on Remote Sensing Alteration Information and Structural Interpretation. Remote Sens. 2024, 16, 1343. [Google Scholar] [CrossRef]
- Chen, Q.; Cai, D.Y.; Xia, J.S.; Zeng, M.; Yang, H.Y.; Zhang, R.S.; He, Y.; Zhang, X.X.; Chen, Y.; Zhao, Z.F. Remote sensing identification of hydrothermal alteration minerals in the Duobuza porphyry copper mining area in Tibet using WorldView-3 and GF-5 data: The impact of spatial and spectral resolution. Ore Geol. Rev. 2025, 180, 106573. [Google Scholar] [CrossRef]
- Sabins, F.F. Remote sensing for mineral exploration. Ore Geol. Rev. 1999, 14, 157–183. [Google Scholar] [CrossRef]
- Leverington, D.W.; Moon, W.M. Landsat-TM-Based discrimination of Lithological units associated with the Purtuniq ophiolite, Quebec, Canada. Remote Sens. 2012, 4, 1208–1231. [Google Scholar] [CrossRef]
- Zhang, Y.J.; Zeng, Z.M.; Chen, W. The methods for extraction of alteration alteration from the ETM + (TM) data and their application: Method selection and technological flow chart. Remote Sens. Land Resour. 2003, 2, 44–49. [Google Scholar]
- Nguyen, H.C.; Jung, J.; Lee, J.; Choi, S.U.; Hong, S.Y.; Heo, J. Optimal atmospheric correction for above-ground forest biomass estimation with the ETM+ remote sensor. Sensors 2015, 15, 18865–18886. [Google Scholar] [CrossRef] [PubMed]
- Pour, A.B.; Hashim, M. The application of ASTER remote sensing data to porphyry copper and epithermal gold deposits. Ore Geol. Rev. 2012, 44, 1–9. [Google Scholar] [CrossRef]
- Chen, Q.; Zhao, Z.; Jiang, Q.; Zhou, J.-X.; Tian, Y.; Zeng, S.; Wang, J. Detecting subtle alteration information from ASTER data using a multifractal-based method: A case study from Wuliang Mountain. SW China. Ore Geol. Rev. 2019, 115, 103182. [Google Scholar] [CrossRef]
- Wu, C.Y.; Dai, J.J.; Zhou, A.; He, L.; Tian, B.; Lin, W.H.; Zhao, T.C.; Bai, L.Y. Mapping alteration zones in the Southern section of Yulong copper belt, Tibet using multi-source remote sensing data. Front. Earth Sci. 2023, 11, 1164131. [Google Scholar] [CrossRef]
- Courba, S.; Youssef, H.; Jamal, A.; Abdessalam, O.; Mohamed, E.A.; Larbi, B.; Assia, I.; Zineb, A.; Slimane, S.; Lahcen, O.; et al. Litho-structural and hydrothermal alteration mapping for mineral prospection in the Maider basin of Morocco based on remote sensing and field investigations. Remote Sens. Appl. Soc. Environ. 2023, 31, 100980. [Google Scholar] [CrossRef]
- Yang, D.Y.; Shao, H.X.; Chang, H.L.; Zhang, R.X.; Ding, B.Z. Landsat 8 and ASTER remote sensing data for ore prospecting in the postmasburg manganese ore field, South Africa. Earth Sci. Inform. 2025, 18, 102. [Google Scholar] [CrossRef]
- Lima, T.A.; Beuchle, R.; Langner, A.; Grecchi, R.C.; Griess, V.C.; Achard, F. Comparing Sentinel-2 MSI and Landsat 8 OLI imagery for monitoring selective logging in the Brazilian Amazon. Remote Sens. 2019, 11, 961. [Google Scholar] [CrossRef]
- Wang, D.; Chen, J.P.; Dai, X. Extracting geological and alteration information and predicting antimony ore based on multisource remote sensing data in Huangyangling, Xinjiang. Front. Earth Sci. 2024, 12, 1366727. [Google Scholar] [CrossRef]
- Sun, Y.; Tian, S.; Di, B. Extracting mineral alteration information using Worldview-3 data. Geosci. Front. 2017, 8, 1051–1062. [Google Scholar] [CrossRef]
- Chen, Q.; Zhao, Z.; Zhou, J.; Zeng, M.; Xia, J.; Sun, T.; Zhao, X. New insights into the Pulang porphyry copper deposit in southwest China: Indication of alteration minerals detected using ASTER and WorldView-3 data. Remote Sens. 2021, 13, 2798. [Google Scholar] [CrossRef]
- Zhang, G.; Chen, Q.; Zhao, Z.F.; Zhang, X.L.; Chao, J.Q.; Zhou, D.Y.; Chai, W.; Yang, H.Y.; Lai, Z.B.; He, Y. Nickel grade inversion of lateritic Nickel ore using WorldView-3 data incorporating geospatial location information: A case study of north Konawe, Indonesia. Remote Sens. 2023, 15, 3660. [Google Scholar] [CrossRef]
- Chen, Q.; Zhao, Z.F.; Zhou, J.X.; Zhu, R.F.; Xia, J.S.; Sun, T.; Zhao, X.; Chao, J.Q. ASTER and GF-5 satellite data for mapping hydrothermal alteration minerals in the Longtoushan Pb–Zn deposit. SW China. Remote Sens. 2022, 14, 1253. [Google Scholar] [CrossRef]
- Liu, Y.N.; Sun, D.X.; Hu, X.N.; Ye, X.; Li, Y.D.; Liu, S.F.; Cao, K.Q.; Chai, M.Y.; Zhou, W.Y.N.; Zhang, J.; et al. The advanced hyperspectral imager: Aboard China’s GaoFen-5 satellite. IEEE Geosci. Remote Sens. Mag. 2019, 7, 23–32. [Google Scholar] [CrossRef]
- Dong, X.F.; Gan, F.P.; Li, N.; Yan, B.K.; Zhang, L.; Zhao, J.Q.; Yu, J.C.; Liu, R.Y.; Ma, Y.N. Fine mineral identification of GF-5 hyperspectral image. Int. J. Remote Sens. 2020, 24, 454–464. [Google Scholar] [CrossRef]
- Van der Meer, F.D.; Van der Werff, H.M.A.; Van Ruitenbeek, F.J.A.; Hecker, C.A.; Bakker, W.H.; Noomen, M.F.; van der Meijde, M.; Carranza, E.J.M.; de Smeth, J.B.; Woldai, T. Multi-and hyperspectral geologic remote sensing: A review. Int. J. Appl. Earth Obs. Geoinf. 2012, 14, 112–128. [Google Scholar] [CrossRef]
- Goetz, A.F.H. Three decades of hyperspectral remote sensing of the Earth: A personal view. Remote Sens. Environ. 2009, 113, S5–S16. [Google Scholar] [CrossRef]
- Fan, Y.H.; Wan, Y.Q.; Wang, H.; Yang, X.K.; Liang, M.; Pan, C.J.; Zhang, S.P.; Wang, W.B.; Tan, F.R. Application of an airborne hyper-spectral survey system CASI/SASIin the gold-silver-lead-zinc ore district of Huaniushan, Gansu. China. Geol. Croat. 2021, 74, 73–83. [Google Scholar] [CrossRef]
- Canbaz, O.; Gürsoy, O.; Karaman, M.; Çalışkan, A.B.; Gokce, A. Hydrothermal alteration mapping using EO-1 Hyperion hyperspectral data in Kosedag, Central Eastern Anatolia (Sivas-Turkey). Arab. J. Geosci. 2021, 14, 2245. [Google Scholar] [CrossRef]
- Liu, L.; Feng, J.L.; Rivard, B.; Xu, X.L.; Zhou, J.; Han, L.; Yang, J.L.; Ren, G.L. Mapping alteration using imagery from the Tiangong-1 hyperspectral spaceborne system: Example for the Jintanzi gold province, China. Int. J. Appl. Earth Obs. Geoinf. 2018, 64, 275–286. [Google Scholar] [CrossRef]
- Li, N.; Dong, X.F.; Gan, F.P.; Yan, B.K. Application Evaluation of ZY-1-02D Satellite Hyperspectral Data in Geological Survey. Spacecr. Eng. 2020, 9, 186–191. (In Chinese) [Google Scholar]
- An, X.W. Intergrated information metallogenic prediction of Carlin-type gold in Fuyuan, Yunnan. Master’s Thesis, China University of Geosciences, Beijing China, 2011. [Google Scholar]
- Cheng, Z.Y.; Zhao, P.S. The Remote Sensing Alteration Information Extraction and Metallogenic Prognosis of the Boka Gold Deposit in Yunnan Province. Remote Sens. Nat. Resour. 2011, 23, 135–140. [Google Scholar]
- Zhang, J.; Su, Q.W.; Liu, X.F.; He, Z.H.; Zhou, Y.M.; Li, Z.; Zhao, K. Characteristics of geology and isotopic geochemistry of the Laozhaiwan gold deposit in southeastern Yunnan Province, China. Acta Petrol. Sin. 2014, 30, 2657–2668. (In Chinese) [Google Scholar]
- Zhou, Y.G. Geology, Geochemistry and Metallogenic Model of Carlin-type Gold Deposits in Southeast Yunnan Province, China. Ph.D. Thesis, Central South University, Changsha, China, 2009. (In Chinese). [Google Scholar]
- Yang, L.; Deng, J.; Groves, D.I.; Wang, Q.F.; Zhang, L.; Wu, W.; Qin, K.; Zhang, Q.Z. Recognition of two contrasting structural and mineralogical-gold mineral systems in the Youjiang basin, China-Vietnam: Orogenic gold in the south and Carlin-type in the north. Geosci. Front. 2020, 11, 21–38. [Google Scholar] [CrossRef]
- Jin, X.Y.; Zhao, J.X.; Feng, Y.X.; Hofstra, A.H.; Deng, X.D.; Zhao, X.F.; Li, J.W. Calcite U-Pb dating unravels the age and hydrothermal history of the giant Shuiyindong Carlin-type gold deposit in the Golden Triangle, South China. Econ. Geol. 2021, 116, 1253–1265. [Google Scholar] [CrossRef]
- Li, C.; Miu, Y.; Li, W.C.; Li, Y.C.; Zhang, Y.Q.; Li, S. Metallogenic Regularity and Metallogenic Model of Gold Deposits in Southeastern Yunnan. Geotecton. Metallog. 2025, 1–22. (In Chinese) [Google Scholar] [CrossRef]
- Marshall, M.; Belgiu, M.; Boschetti, M.; Pepe, M.; Stein, A.; Nelson, A. Field-level crop yield estimation with PRISMA and Sentinel-2. ISPRS J. Photogramm. Remote Sens. 2022, 187, 191–210. [Google Scholar] [CrossRef]
- Claverie, M.; Ju, J.; Masek, J.G.; Dungan, J.L.; Vermote, E.F.; Roger, J.C.; Skakun, S.V.; Justice, C. The Harmonized Landsat and Sentinel-2 surface reflectance data set. Remote Sens. Environ. 2018, 219, 145–161. [Google Scholar] [CrossRef]
- Dai, J.J.; Qu, X.M.; Xin, H.B. Extraction of Alteration Mineral Information Using ASTER Remote Sensing Data in Duolong area, Tibet, China. Geol. Bull. China 2010, 29, 752–759. [Google Scholar]
- Yao, F.J.; Zhang, Y.J.; Yang, J.M.; Geng, X.X. Application of ASTER remote sensing data to extraction of alterration zoning information from Dexing porphyry copper deposit. Miner. Depos. 2012, 31, 881–890. [Google Scholar]
- Pour, A.B.; Hashim, M.; Park, Y.; Hong, J.K. Mapping alteration mineral zones and lithological units in Antarctic regions using spectral bands of ASTER remote sensing data. Geocarto Int. 2018, 33, 1281–1306. [Google Scholar] [CrossRef]
- Pour, A.B.; Hashim, M.; Hong, K.J.; Park, Y. Lithological and alteration mineral mapping in poorly exposed lithologies using Landsat-8 and ASTER satellite data: North-eastern Graham Land, Antarctic Peninsula. Ore Geol. Rev. 2019, 108, 112–133. [Google Scholar] [CrossRef]
- Zhang, X.L.; Zhao, Z.F.; Chen, Q.; Chai, W.; Li, Z.Y.; Yang, H.Y.; Niu, L. Mapping hydrothermal alteration of the Pulang porphyry copper deposit, SW China, using ASTER and ZY1-02D satellite data. Ore Geol. Rev. 2023, 161, 16. [Google Scholar] [CrossRef]
- Ding, W.Q.; Ding, L.; Li, Q.T.; Li, J.X.; Zhang, L.Y. Lithium-Rich Pegmatite Detection Integrating High-Resolution and Hyperspectral Satellite Data in Zhawulong Area, Western Sichuan, China. Remote Sens. 2023, 15, 3969. [Google Scholar] [CrossRef]
- Wu, C.Y.; Dai, J.J.; Chen, W.; Jiang, B.; Wang, D.H.; Wang, C.L.; Wang, W.J.; Sun, H.Z.; Wang, Q.; Chen, W.; et al. Extraction of remote sensing alteration information and its ore prospecting indication in Sumochagan Obao fluorite mining area, Inner Mongolia. Miner. Depos. 2023, 42, 845–858. [Google Scholar]
- Han, L.L.; Ding, W.C.; Chen, X.H.; Liu, M.L.; Wang, Y.; Xu, S.L.; Zhang, D.; Cui, Y.J. Linear structure extraction and quantitative analysis of multi-source remote sensing information in West Junggar Basin. Geol. China 2019, 46, 1209–1223. (In Chinese) [Google Scholar]
- Tong, Y.X.; Li, X.S.; Yang, J.Q.; Wang, F.C.; Cao, S.Q.; Wei, J.L. Identification of alteration minerals and linear structures and prediction of metallogenic favorable area based on ZY 1-02D hyperspectral data. Geol. China 2025, 1–22. (In Chinese) [Google Scholar]
- Hunt, G.R. Visible and near-infrared spectra of minerals and rocks: I silicate minerals. Mod. Geol. 1970, 1, 283–300. [Google Scholar]
- Gan, F.P.; Wang, W.S.; Ma, G.N. Identification of Mineral Spectral Lineages Using Characteristic Spectral Bands in Hyperspectral Remote Sensing. Earth Sci. Front. 2003, 02, 445–454. (In Chinese) [Google Scholar]
- Zhang, C.Y.; Qin, Q.M.; Chen, L.; Wang, N.; Zhao, S.S. Research and development of mineral identification utilizing hyperspectral remote sensing. Opt. Precis. Eng. 2015, 23, 2407–2418. (In Chinese) [Google Scholar] [CrossRef]
- Lu, Y. Application of Hyperspectral Mineral Mapping Technology in Metallic Mineral and Oil-Gas Exploration. Ph.D. Thesis, China University of Geosciences, Beijing, China, 2018. (In Chinese). [Google Scholar]
- Chen, Q.; Zhao, Z.F.; Jiang, Q.G.; Tan, S.C.; Tian, Y.G. Identification of metamorphic rocks in Wuliangshan Mountains (Southwest China) using ASTER data. Arab. J. Geosci. 2018, 11, 311. [Google Scholar] [CrossRef]
- Zoheir, B.; El-Wahed, M.A.; Pour, A.B.; Abdelnasser, A. Orogenic gold in transpression and transtension zones: Field and remote sensing studies of the Barramiya-Mueilha Sector, Egypt. Remote Sens. 2019, 11, 2122. [Google Scholar] [CrossRef]
- Loughlin, W.P. Principal components analysis for alteration mapping. Photogramm. Photogramm. Eng. Remote Sens. 1991, 57, 1163–1169. [Google Scholar]
- Pour, B.A.; Hashim, M. Identification of hydrothermal alteration minerals for exploring of porphyry copper deposit using ASTER data, SE Iran. J. Asian Earth Sci. 2011, 42, 1309–1323. [Google Scholar] [CrossRef]
- Crosta, A.P.; Moore, J. Enhancement of Landsat Thematic Mapper imagery for residual soil mapping in SW Minais Gerais State, Brazil: A prospecting case history in Greenstone belt terrain. In Proceedings of the 7th ERIM Thematic Conference: Remote Sensing for Exploration Geology, Calgary, AB, Canada, 2–6 October 1989; pp. 1173–1187. [Google Scholar]
- Kruse, F.A.; Lefkoff, A.B. Knowledge-Based geologic mapping with imaging spectrometers. Remote Sens. Rev. 1993, 8, 3–28. [Google Scholar] [CrossRef]
- Lanfranchi, R.A.; Cruz, S.C.P.; Rocha, W.F. Application of remote sensing and reflectance spectroscopy to explore iron-enriched domains in the north region of the intracontinental sector of the Araçuaí West Congo Orogen. Ore Geol. Rev. 2021, 128, 103916. [Google Scholar] [CrossRef]
- Zadeh, M.H.; Honarmand, M. A remote sensing-based discrimination of high- and low-potential mineralization for porphyry copper deposits; a case study from Dehaj-Sarduiyeh copper belt, SE Iran. Eur. J. Remote Sens. 2017, 50, 332–342. [Google Scholar] [CrossRef]
- Jing, L.H.; Li, G.M.; Ding, H.F.; Zhao, J.; Li, J.X.; Zhang, X.N. Remote sensing prosecting, geological evaluation, and significant discovery of porphyry copper deposits in the middle-western segment of Bangonghu-Nujiang metallogenic belt, Tibet. Acta Petrol. Sinca 2025, 41, 362–382. (In Chinese) [Google Scholar]
- Salehi, T.; Tangestani, M.H. Large-scale mapping of iron oxide and hydroxide minerals of Zefreh porphyry copper deposit, usingWorldview-3 VNIR data in the Northeastern Isfahan, Iran. Int. J. Appl. Earth Obs. Geoinf. 2018, 73, 156–169. [Google Scholar]
- Pour, A.B.; Park, T.-Y.S.; Park, Y.; Hong, J.K.; Muslim, A.M.; Läufer, A.; Crispini, L.; Pradhan, B.; Zoheir, B.; Rahmani, O. Landsat-8, advanced spaceborne thermal emission and reflection radiometer, and WorldView-3 multispectral satellite imagery for prospecting copper-gold mineralization in the northeastern Inglefield Mobile Belt (IMB), Northwest Greenland. Remote Sens. 2019, 11, 2430. [Google Scholar] [CrossRef]
- Guha, A.; Yamaguchi, Y.; Chatterjee, S.; Rani, K.; Vinod Kumar, K. Emittance spectroscopy and broadband thermal remote sensing applied to phosphorite and its utility in geoexploration: A study in the parts of Rajasthan, India. Remote Sens. 2019, 11, 1003. [Google Scholar] [CrossRef]


| Sensor | Subsystem | Band | Spectral Range (µm) | Ground Resolution (m) | Swath Width (km) | Year of Launch |
|---|---|---|---|---|---|---|
| Sentinel-2 | VNIR | 1 | 0.433–0.453 | 60 | 290 | 2015–2017 |
| 2 | 0.458–0.523 | 10 | ||||
| 3 | 0.543–0.578 | |||||
| 4 | 0.650–0.680 | |||||
| 5 | 0.698–0.713 | 20 | ||||
| 6 | 0.733–0.74 | |||||
| 7 | 0.773–0.793 | |||||
| 8 | 0.785–0.900 | 10 | ||||
| 8A | 0.855–0.875 | 20 | ||||
| 9 | 0.935–0.955 | 60 | ||||
| SWIR | 10 | 1.360–1.390 | ||||
| 11 | 1.565–1.655 | 20 | ||||
| 12 | 2.100–2.280 | |||||
| ASTER | VNIR | 1 | 0.520–0.600 | 15 | 60 | 1999 |
| 2 | 0.630–0.690 | |||||
| 3B | 0.760–0.860 | |||||
| SWIR | 4 | 0.760–0.860 | 30 | |||
| 5 | 1.600–1.700 | |||||
| 6 | 2.145–2.185 | |||||
| 7 | 2.185–2.225 | |||||
| 8 | 2.235–2.285 | |||||
| 9 | 2.295–2.365 | |||||
| TIR | 10 | 2.360–2.430 | 90 | |||
| 11 | 8.125–8.475 | |||||
| 12 | 8.475–8.825 | |||||
| 13 | 8.925–9.275 | |||||
| 14 | 10.25–10.95 | |||||
| ZY1-02D | VNIR | 1–76 | 0.400–1.040 | 30 | 60 | 2019 |
| SWIR | 77–166 | 1.005–2.500 |
| Cation/Functional Group | Spectral Feature Band/nm | Primary Minerals | Primary Absorption/Secondary Absorption |
|---|---|---|---|
| Fe2+ | 1000–1100 | Siderite | 1060 nm, 1270 nm |
| Pyrite | Primary absorption at 1000 nm, secondary absorption from 1000 to 1500 nm | ||
| Fe3+ | 600–900 | Hematite | Primary absorption at 870 nm |
| Limonite | Primary absorption at 950 nm | ||
| Goethite | Primary absorption at 1000 nm | ||
| Al-OH | 2160–2210 | Pyrophyllite | 2050 nm, 2320 nm |
| Kaolinite | Primary absorption around 2200 nm, secondary absorption at 2160 nm | ||
| Montmorillonite | Primary absorption around 2215 nm, secondary absorption at 2440 nm | ||
| Sericite | Primary absorption around 2205 nm, secondary absorptions at 2115 nm, 2355 nm, and 2440 nm | ||
| Mg-OH | 2300–2400 | Epidote | Primary absorption around 2330 nm, secondary absorption at 2225 nm. |
| Tremolite | A broad double-peak spectral band around 2290–2310 nm and a secondary absorption near 2385 nm |
| Data Types | Selected Band Number | Spectral Range (nm) |
|---|---|---|
| 4–97 | 0.421–1.341 | |
| ZY1-02D | 103–124 | 1.442–1.795 |
| 134–160 | 1.963–2.400 |
| (a) Eigenvectors | Band 3 | Band 4 | Band 8A | Band 11 | |
|---|---|---|---|---|---|
| PC 1 | 0.329499 | 0.387907 | 0.552720 | 0.659893 | |
| PC 2 | 0.163049 | 0.446855 | −0.812673 | 0.336598 | |
| PC 3 | −0.456453 | −0.570806 | −0.127748 | 0.670456 | |
| PC 4 | 0.810245 | −0.569236 | −0.133202 | 0.041612 | |
| (b) Eigenvectors | Band 1 | Band 3 | Band 4 | Band 6 | |
| PC 1 | −0.211582 | −0.598971 | −0.644556 | −0.425458 | |
| PC 2 | −0.472605 | 0.711732 | −0.185925 | −0.485297 | |
| PC 3 | −0.824861 | −0.308721 | 0.436730 | 0.183201 | |
| PC 4 | −0.226897 | 0.198397 | −0.599372 | 0.741559 | |
| (c) Eigenvectors | Band 10 | Band 12 | Band 14 | ||
| PC 1 | −0.404117 | −0.510792 | −0.758802 | ||
| PC 2 | −0.588802 | −0.489575 | 0.643140 | ||
| PC 3 | −0.700001 | 0.706688 | −0.102909 | ||
| Sampling Points | Alteration Types | Correlation | Field Samples and Curves |
|---|---|---|---|
| 1 | Limonite | 0.824 |  |
| 5 | Limonite | 0.927 |  |
| 6 | Limonite | 0.915 |  |
| 14 | Sericite | 0.803 | 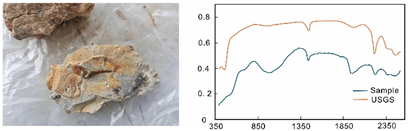 |
| 15 | Sericite | 0.815 |  |
| 21 | Sericite | 0.879 | 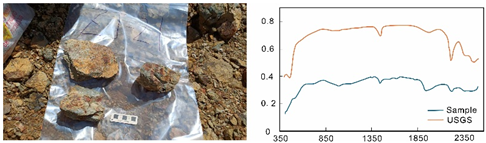 |
Disclaimer/Publisher’s Note: The statements, opinions and data contained in all publications are solely those of the individual author(s) and contributor(s) and not of MDPI and/or the editor(s). MDPI and/or the editor(s) disclaim responsibility for any injury to people or property resulting from any ideas, methods, instructions or products referred to in the content. |
© 2025 by the authors. Licensee MDPI, Basel, Switzerland. This article is an open access article distributed under the terms and conditions of the Creative Commons Attribution (CC BY) license (https://creativecommons.org/licenses/by/4.0/).
Share and Cite
Chen, Q.; Cai, D.; Zhao, Z.; Yang, X.; Wang, Y.; Jiang, X.; Xu, L.; Duan, H.; He, Y.; Zhang, X.; et al. Alteration Information Extraction and Mineral Prospectivity Mapping in the Laozhaiwan Area Using Multisource Remote Sensing Data. Remote Sens. 2025, 17, 2178. https://doi.org/10.3390/rs17132178
Chen Q, Cai D, Zhao Z, Yang X, Wang Y, Jiang X, Xu L, Duan H, He Y, Zhang X, et al. Alteration Information Extraction and Mineral Prospectivity Mapping in the Laozhaiwan Area Using Multisource Remote Sensing Data. Remote Sensing. 2025; 17(13):2178. https://doi.org/10.3390/rs17132178
Chicago/Turabian StyleChen, Qi, Dayu Cai, Zhifang Zhao, Xiaoguang Yang, Yilong Wang, Xiao Jiang, Lei Xu, Haichuan Duan, Yang He, Xiaoxiao Zhang, and et al. 2025. "Alteration Information Extraction and Mineral Prospectivity Mapping in the Laozhaiwan Area Using Multisource Remote Sensing Data" Remote Sensing 17, no. 13: 2178. https://doi.org/10.3390/rs17132178
APA StyleChen, Q., Cai, D., Zhao, Z., Yang, X., Wang, Y., Jiang, X., Xu, L., Duan, H., He, Y., Zhang, X., Wang, Y., & Xu, T. (2025). Alteration Information Extraction and Mineral Prospectivity Mapping in the Laozhaiwan Area Using Multisource Remote Sensing Data. Remote Sensing, 17(13), 2178. https://doi.org/10.3390/rs17132178