
A Fire Segmentation Method with Flame Detail Enhancement U-Net in Multispectral Remote Sensing Images Under Category Imbalance


Abstract
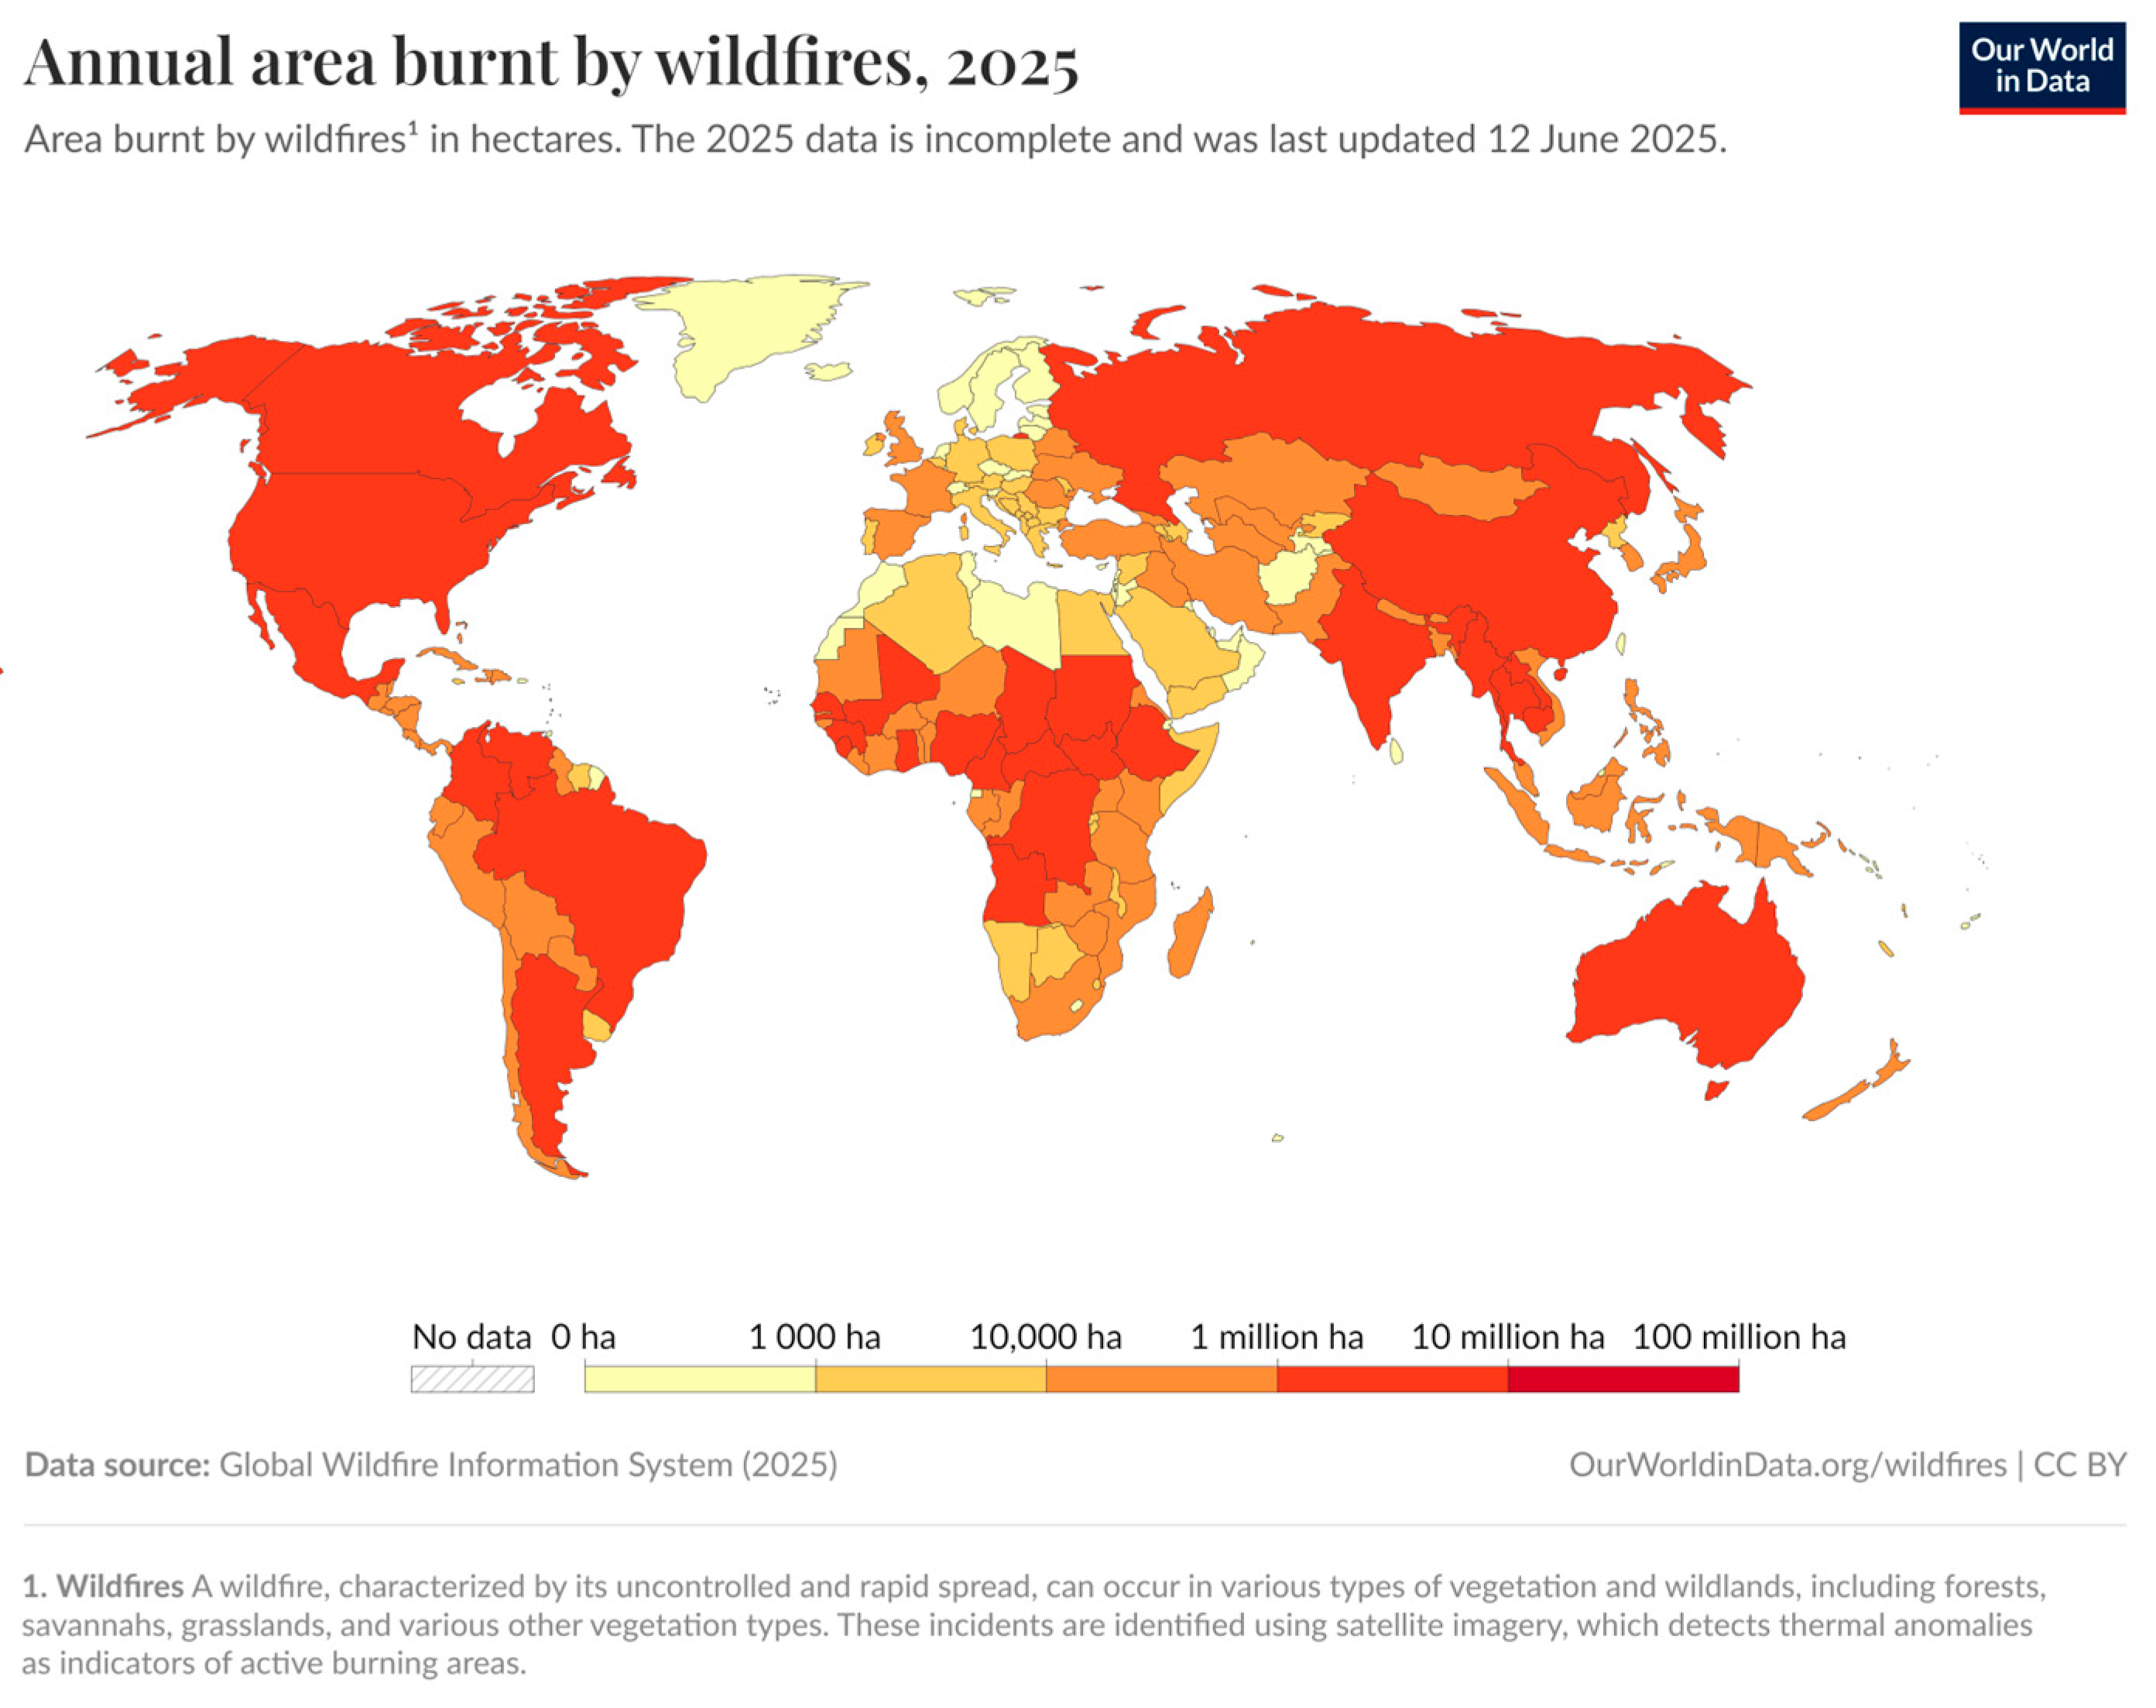
1. Introduction
2. Model
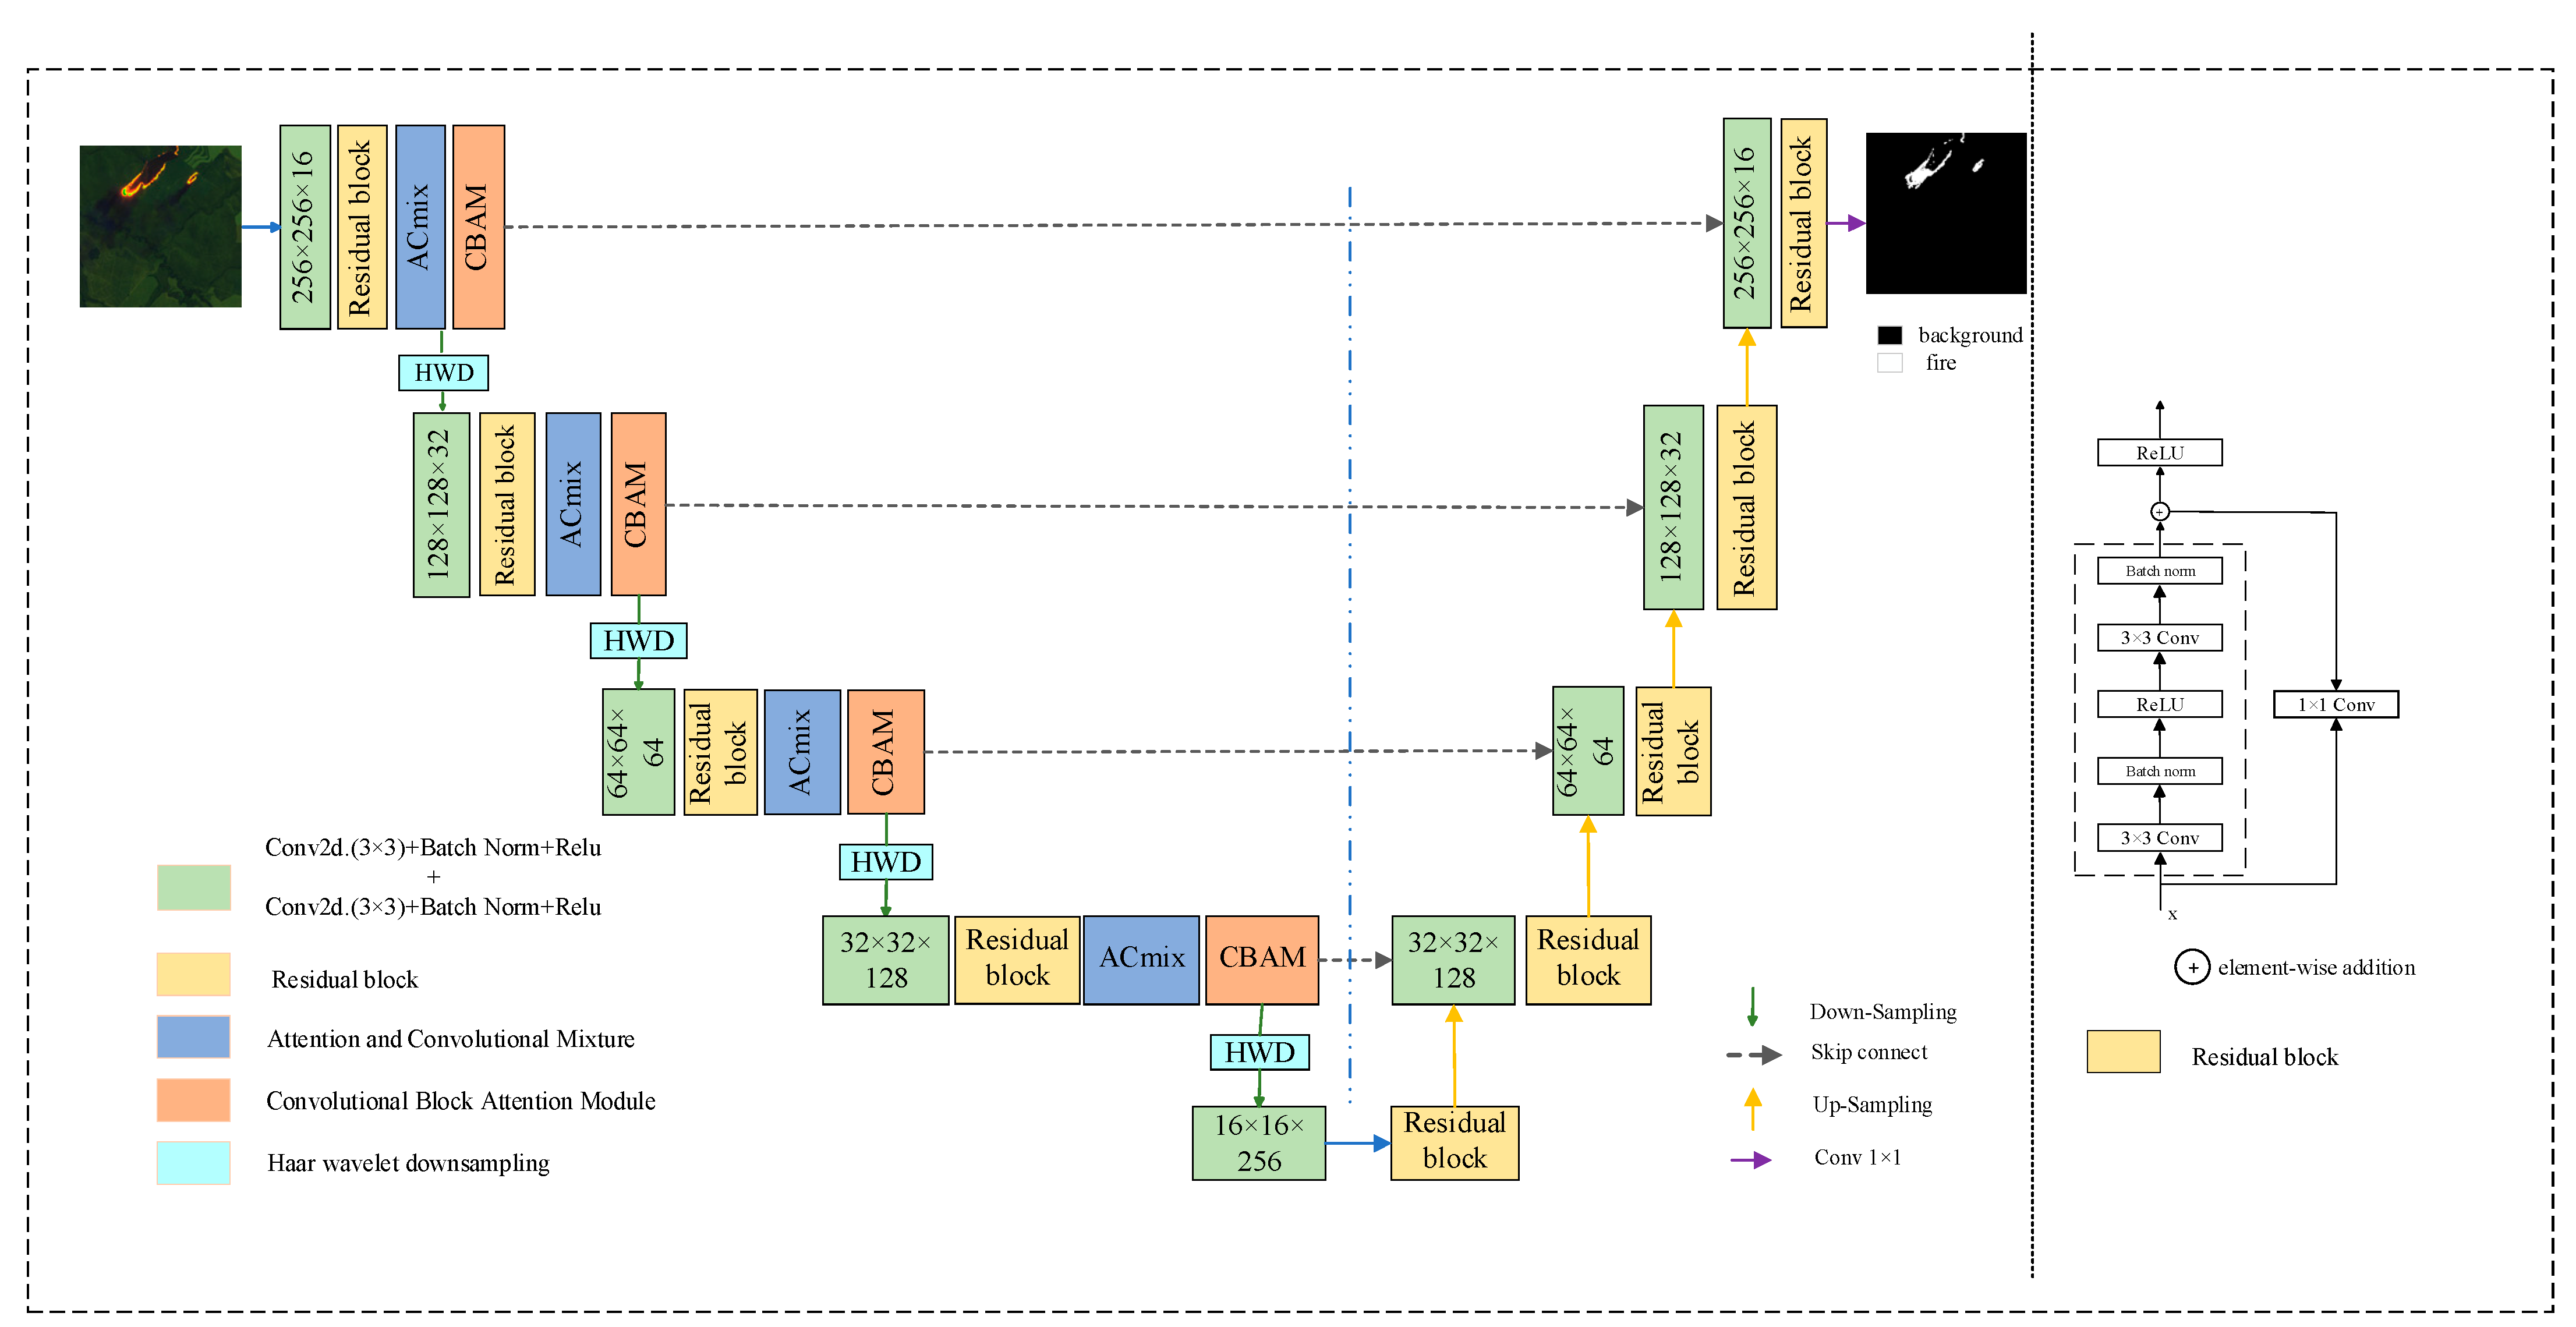
2.1. Network Architecture
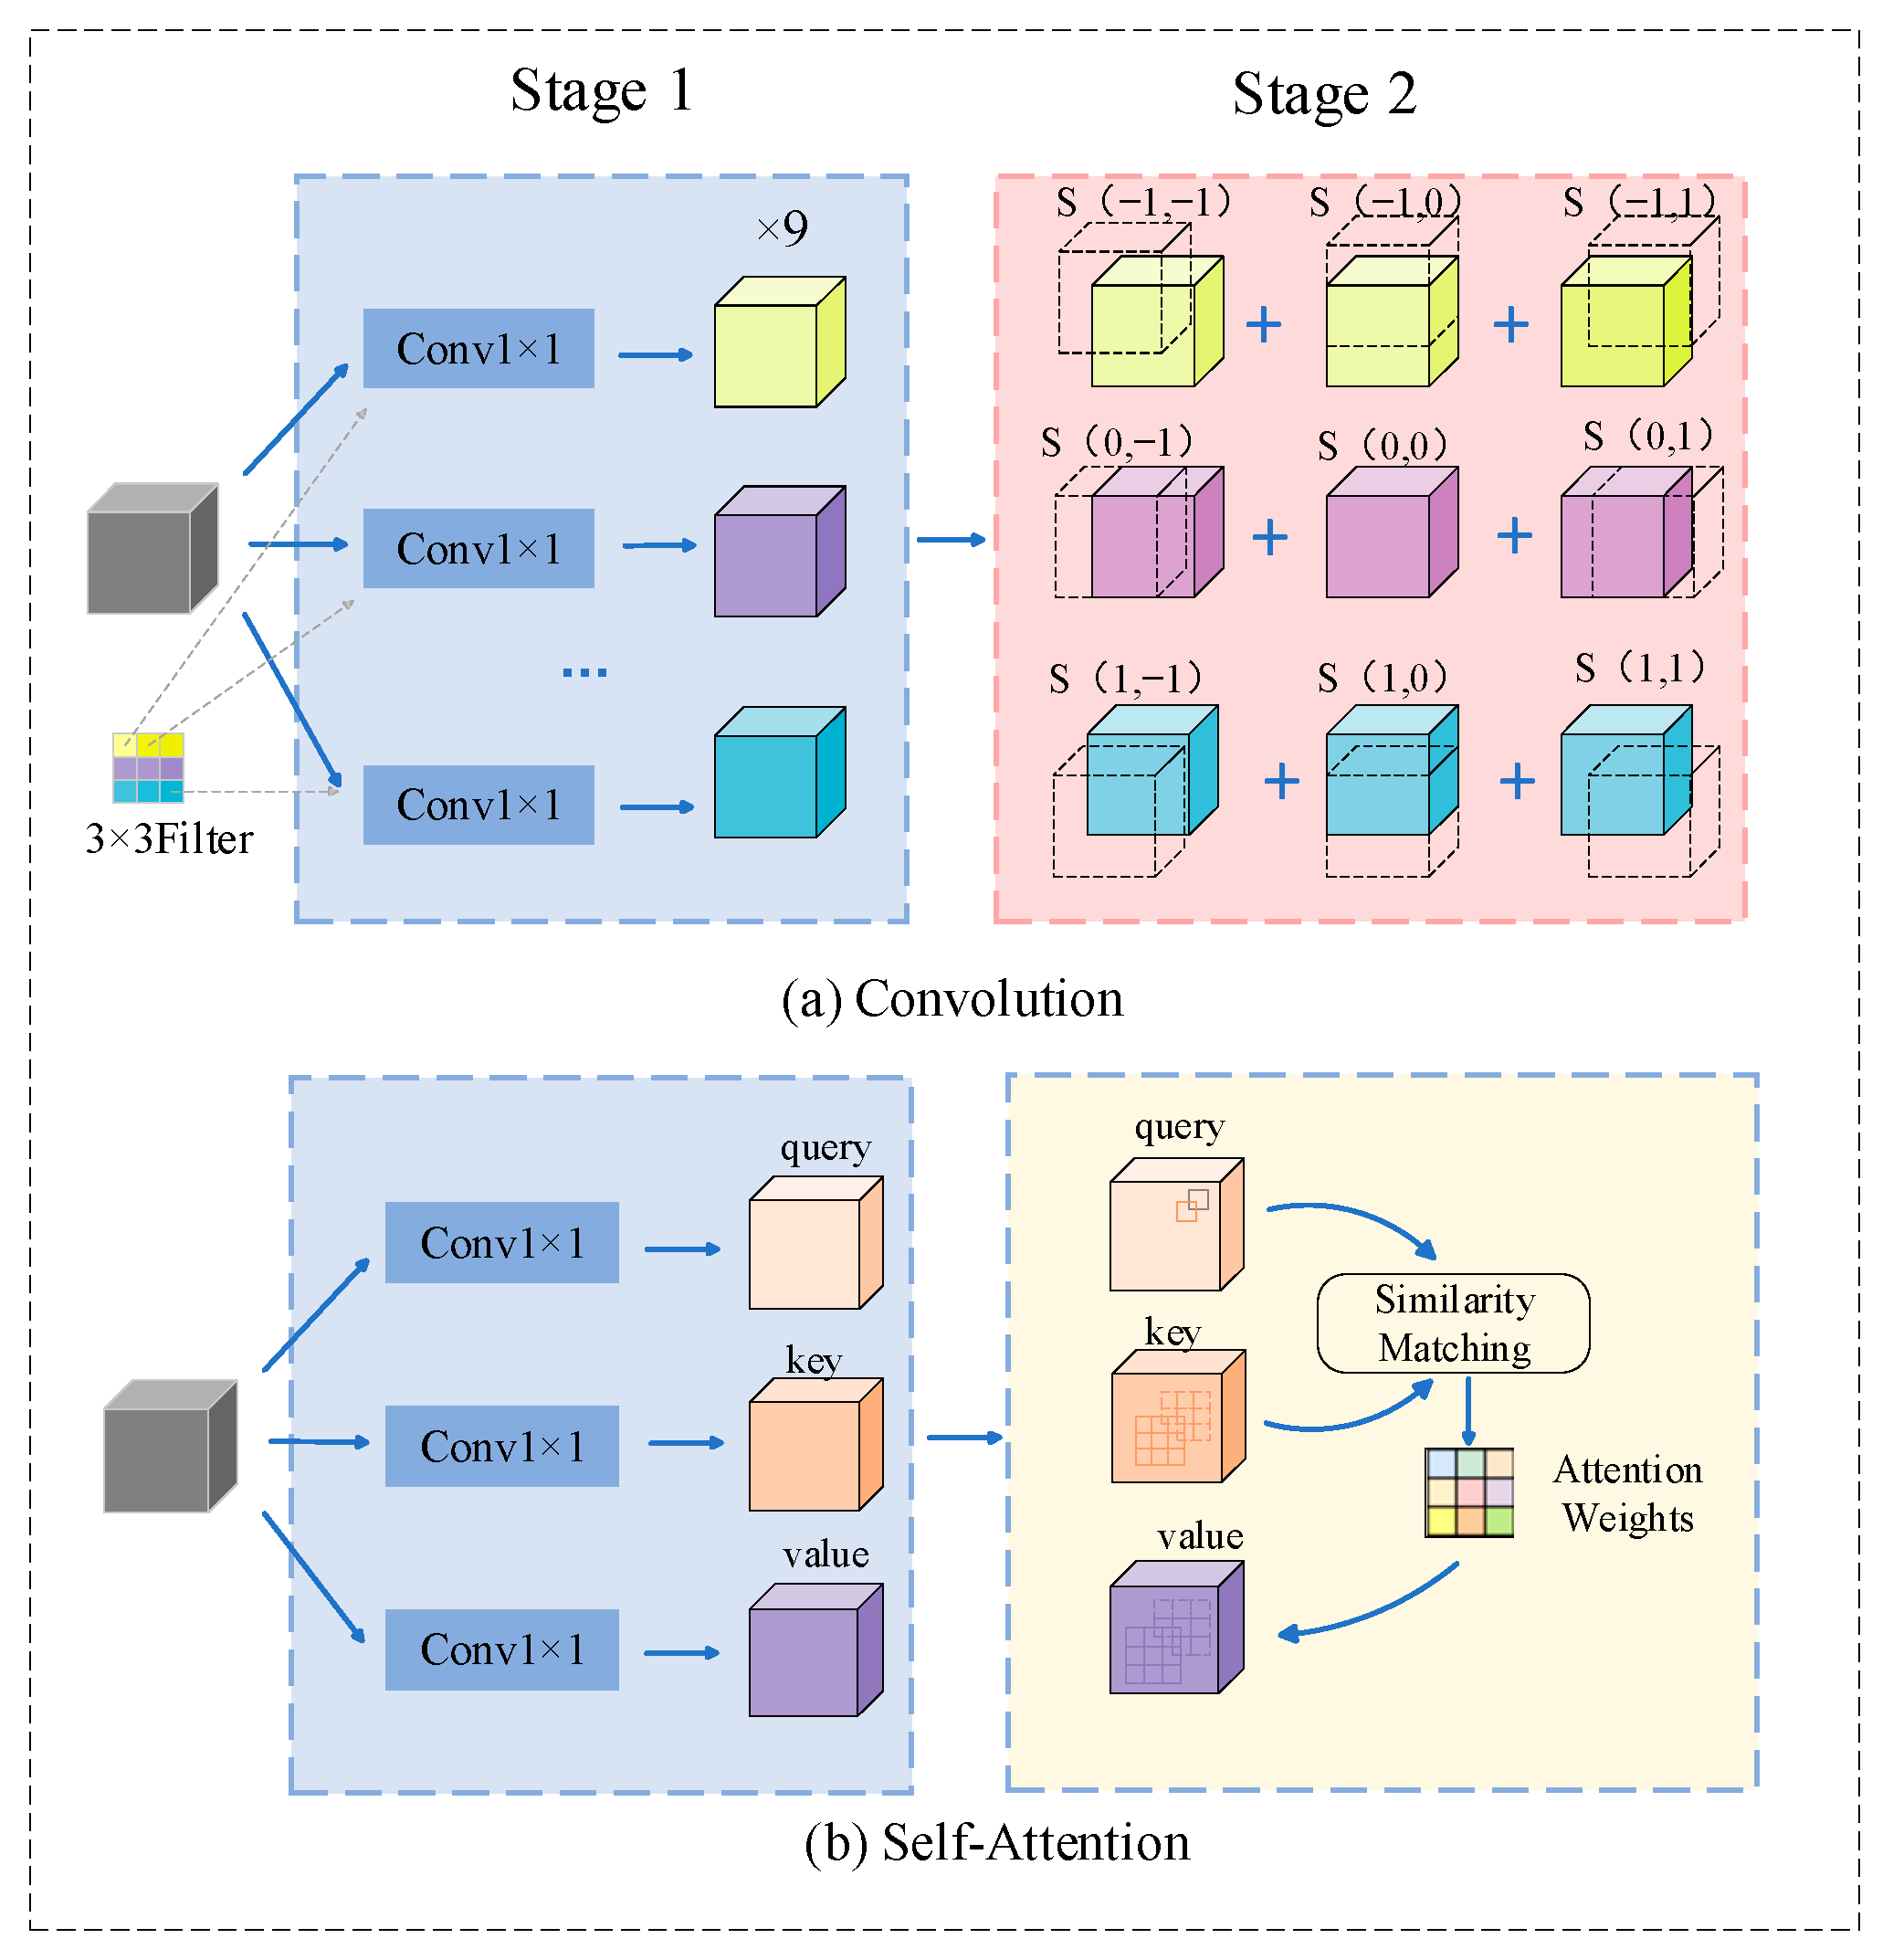
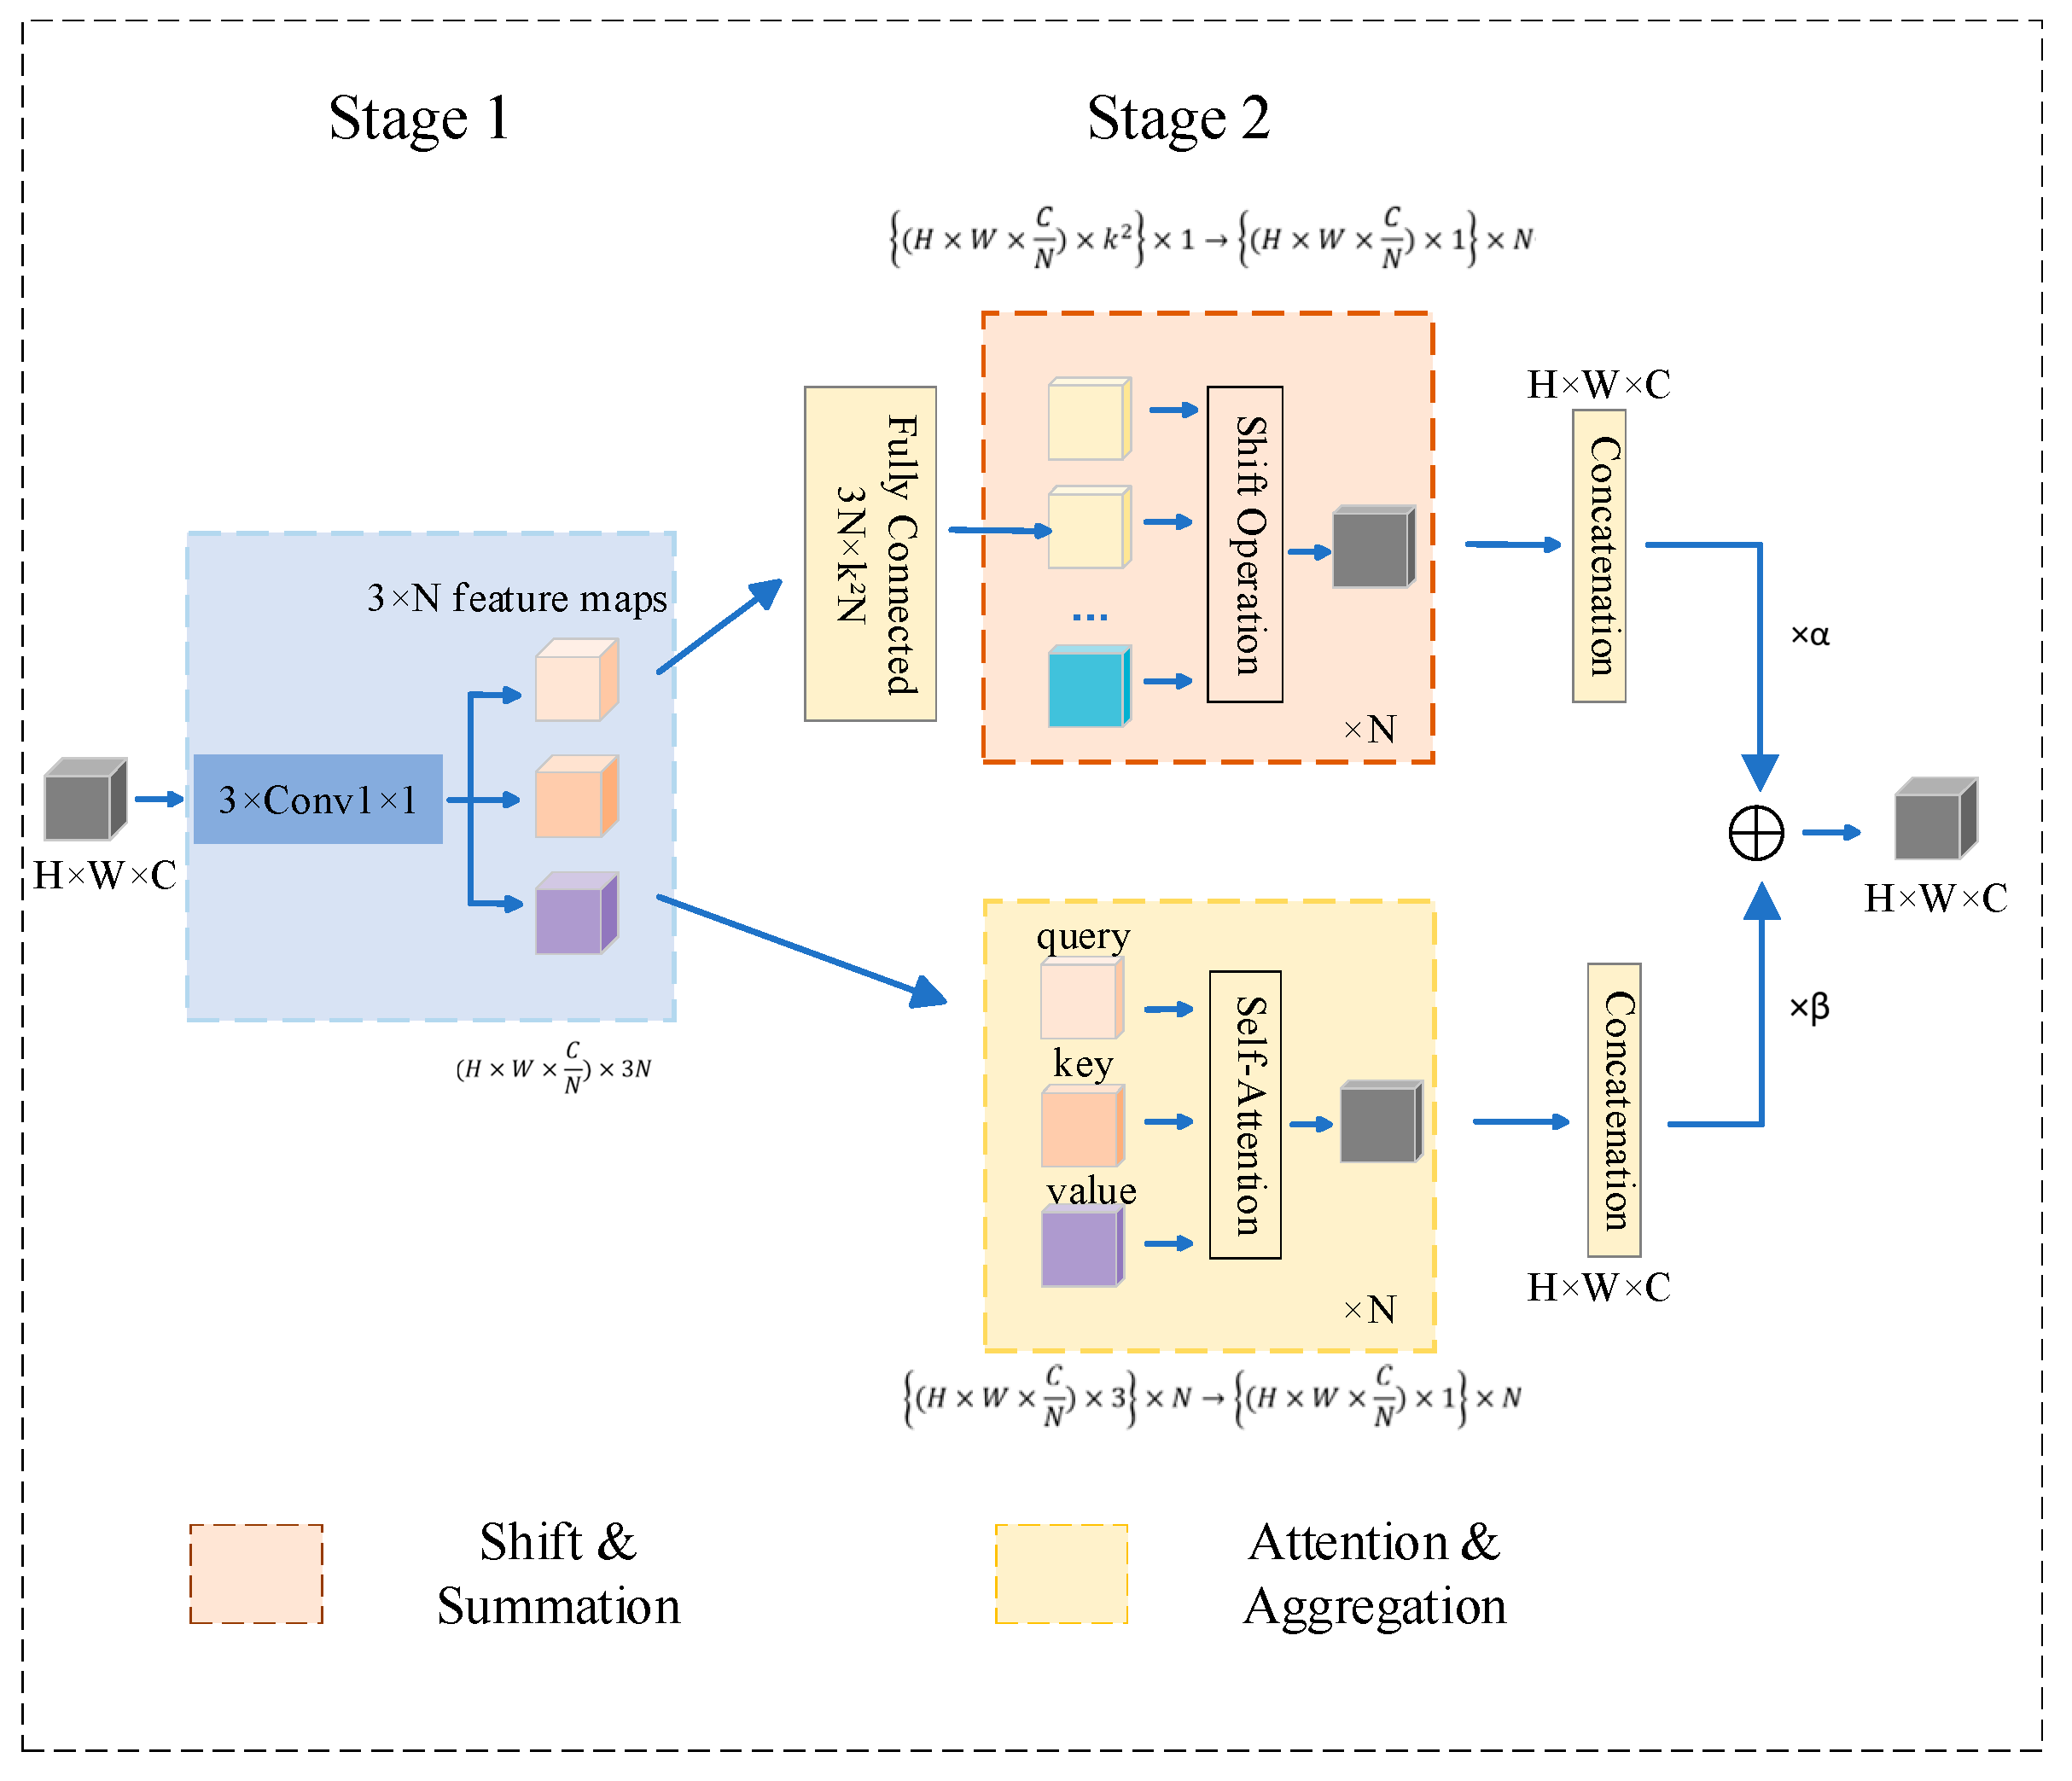
2.2. Self-Attention and Convolutional Mixture (ACmix)
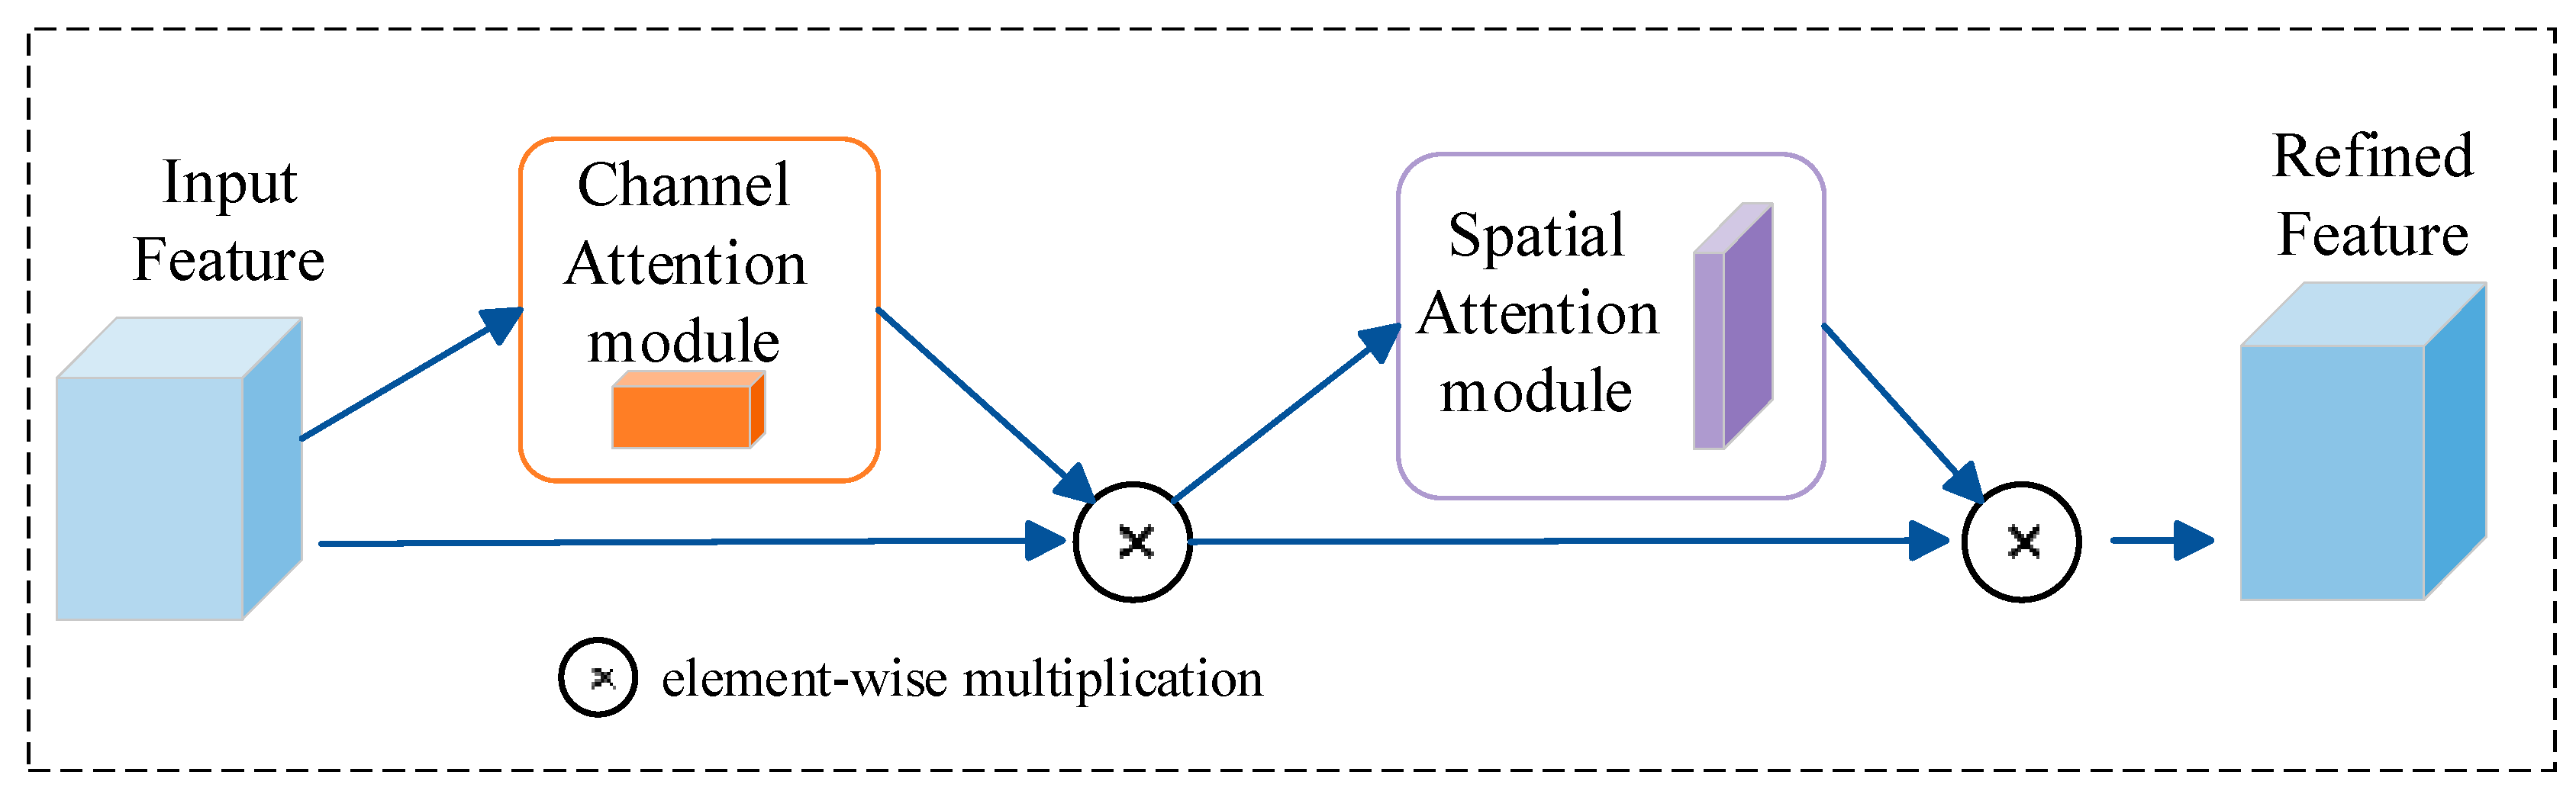
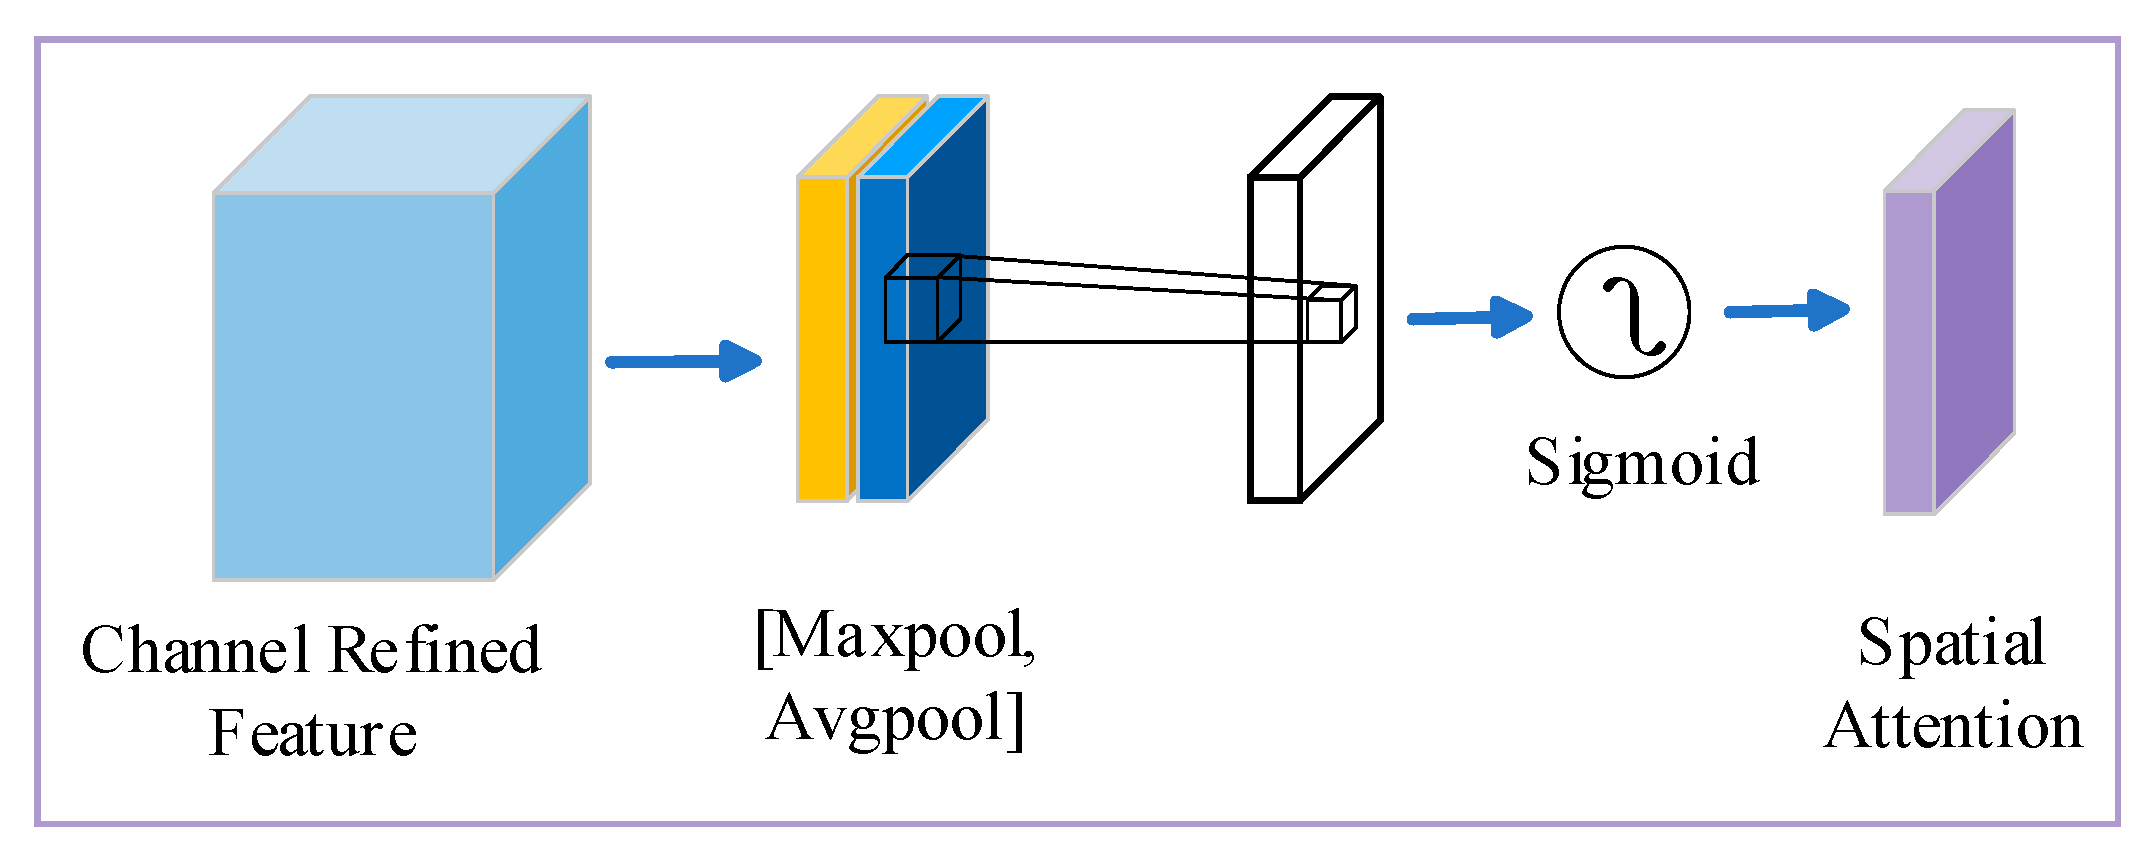
2.3. Convolutional Block Attention Module (CBAM)
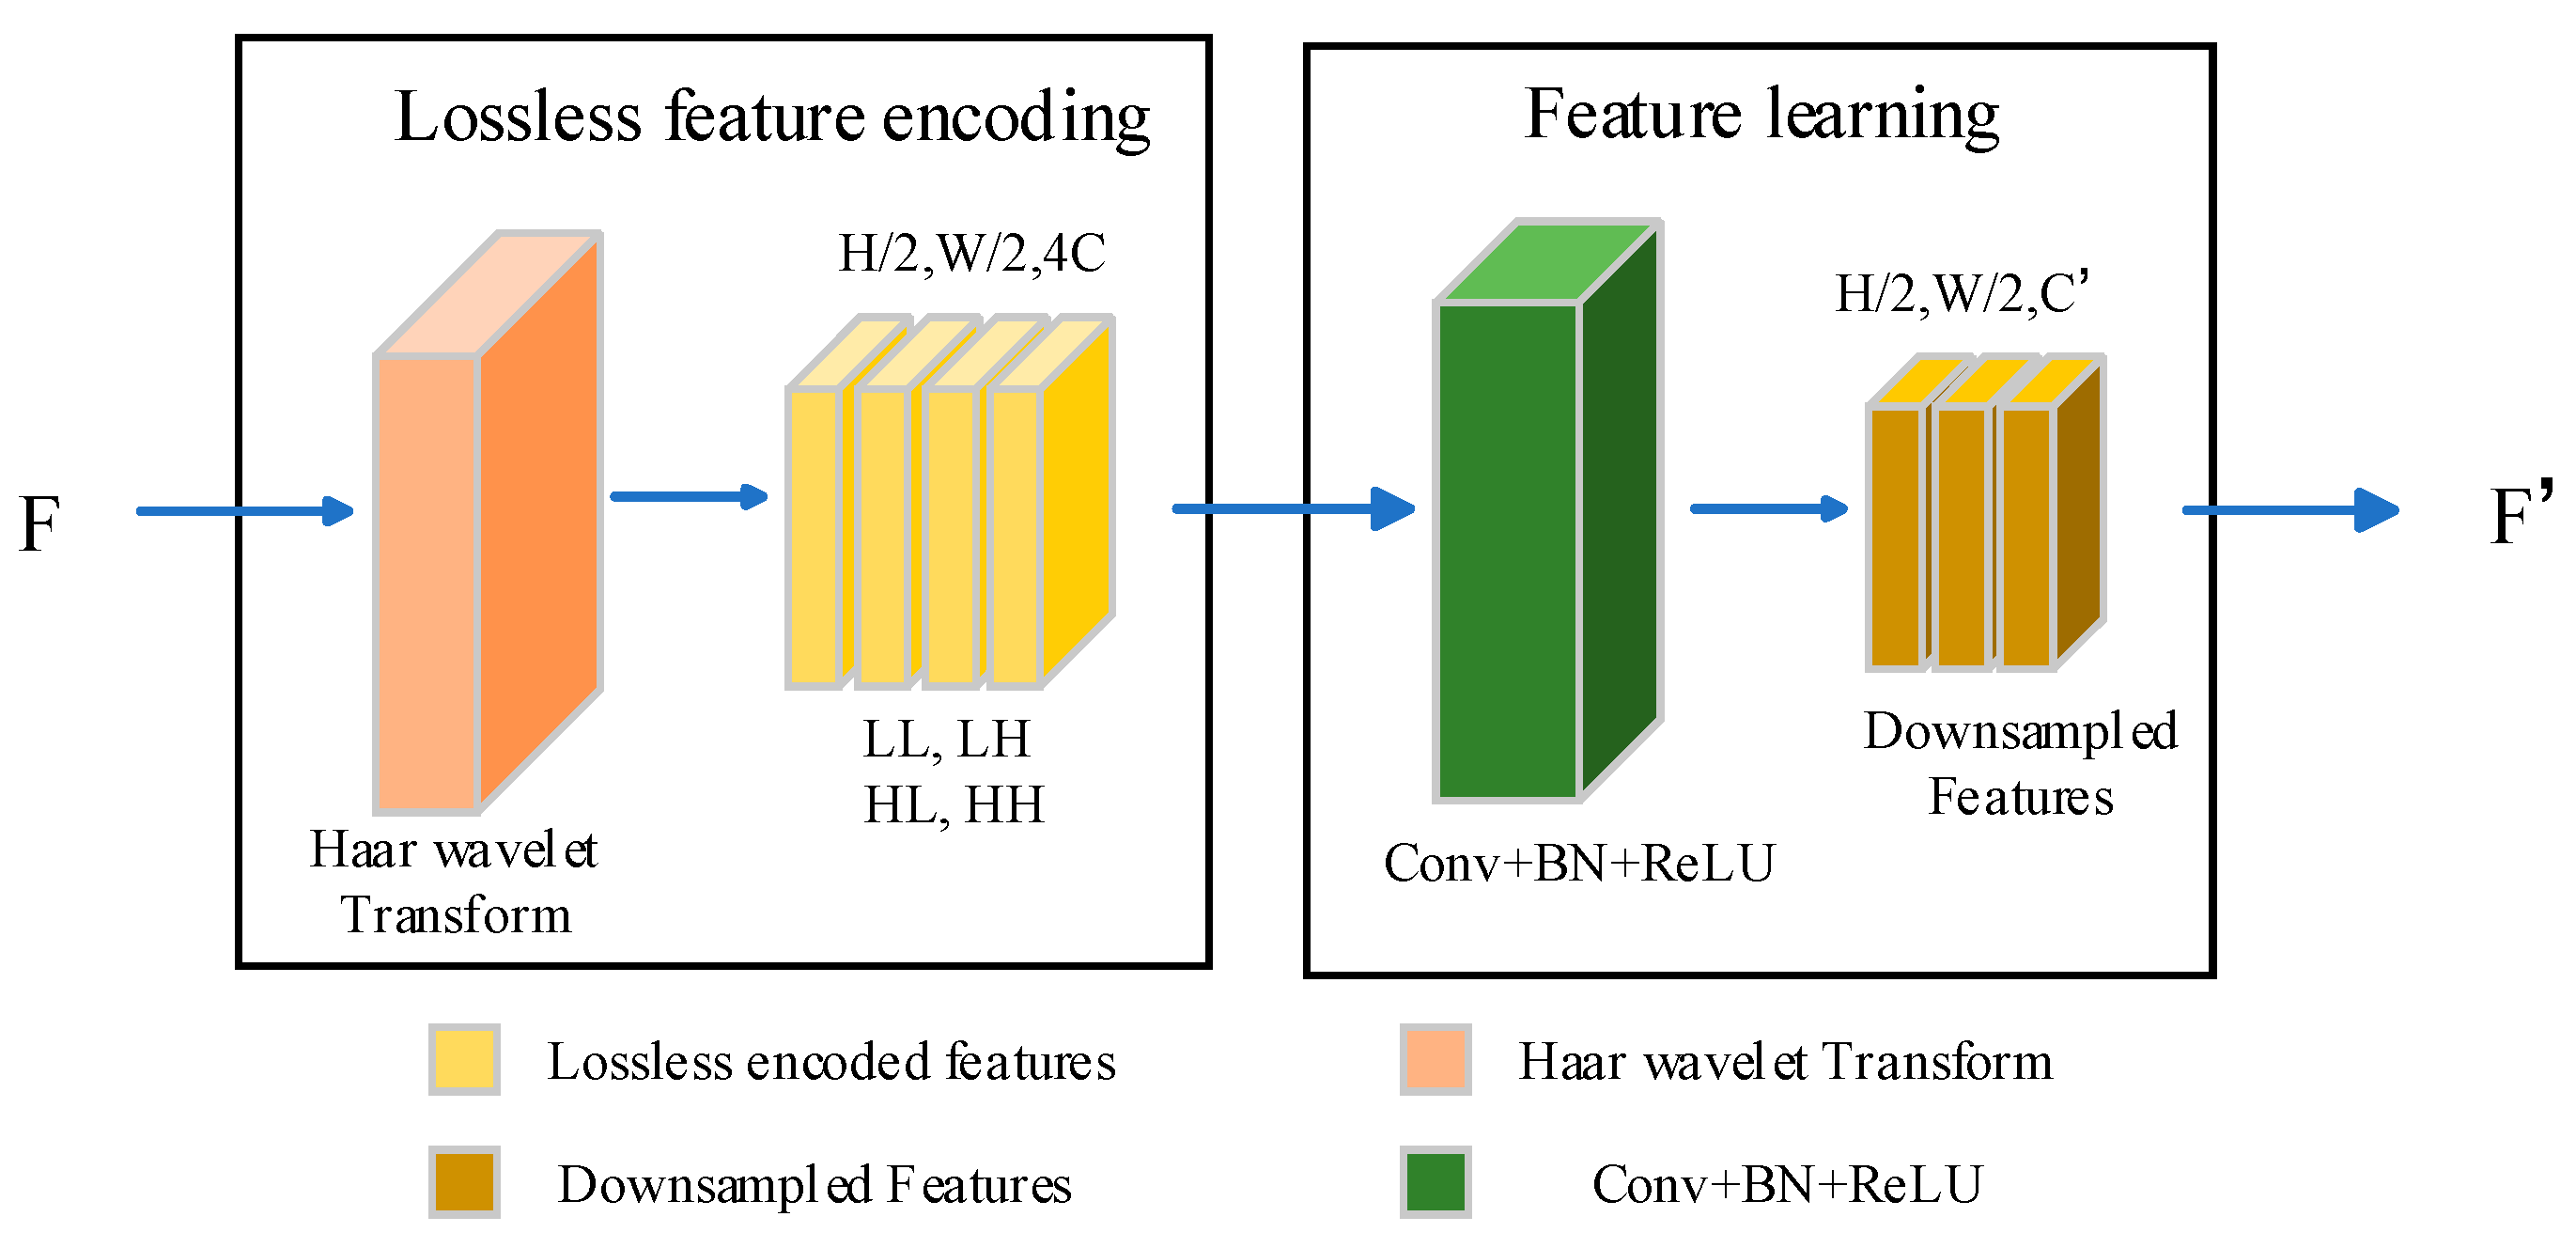
2.4. Haar Wavelet Downsampling (HWD)
3. Datasets and Evaluation Metrics
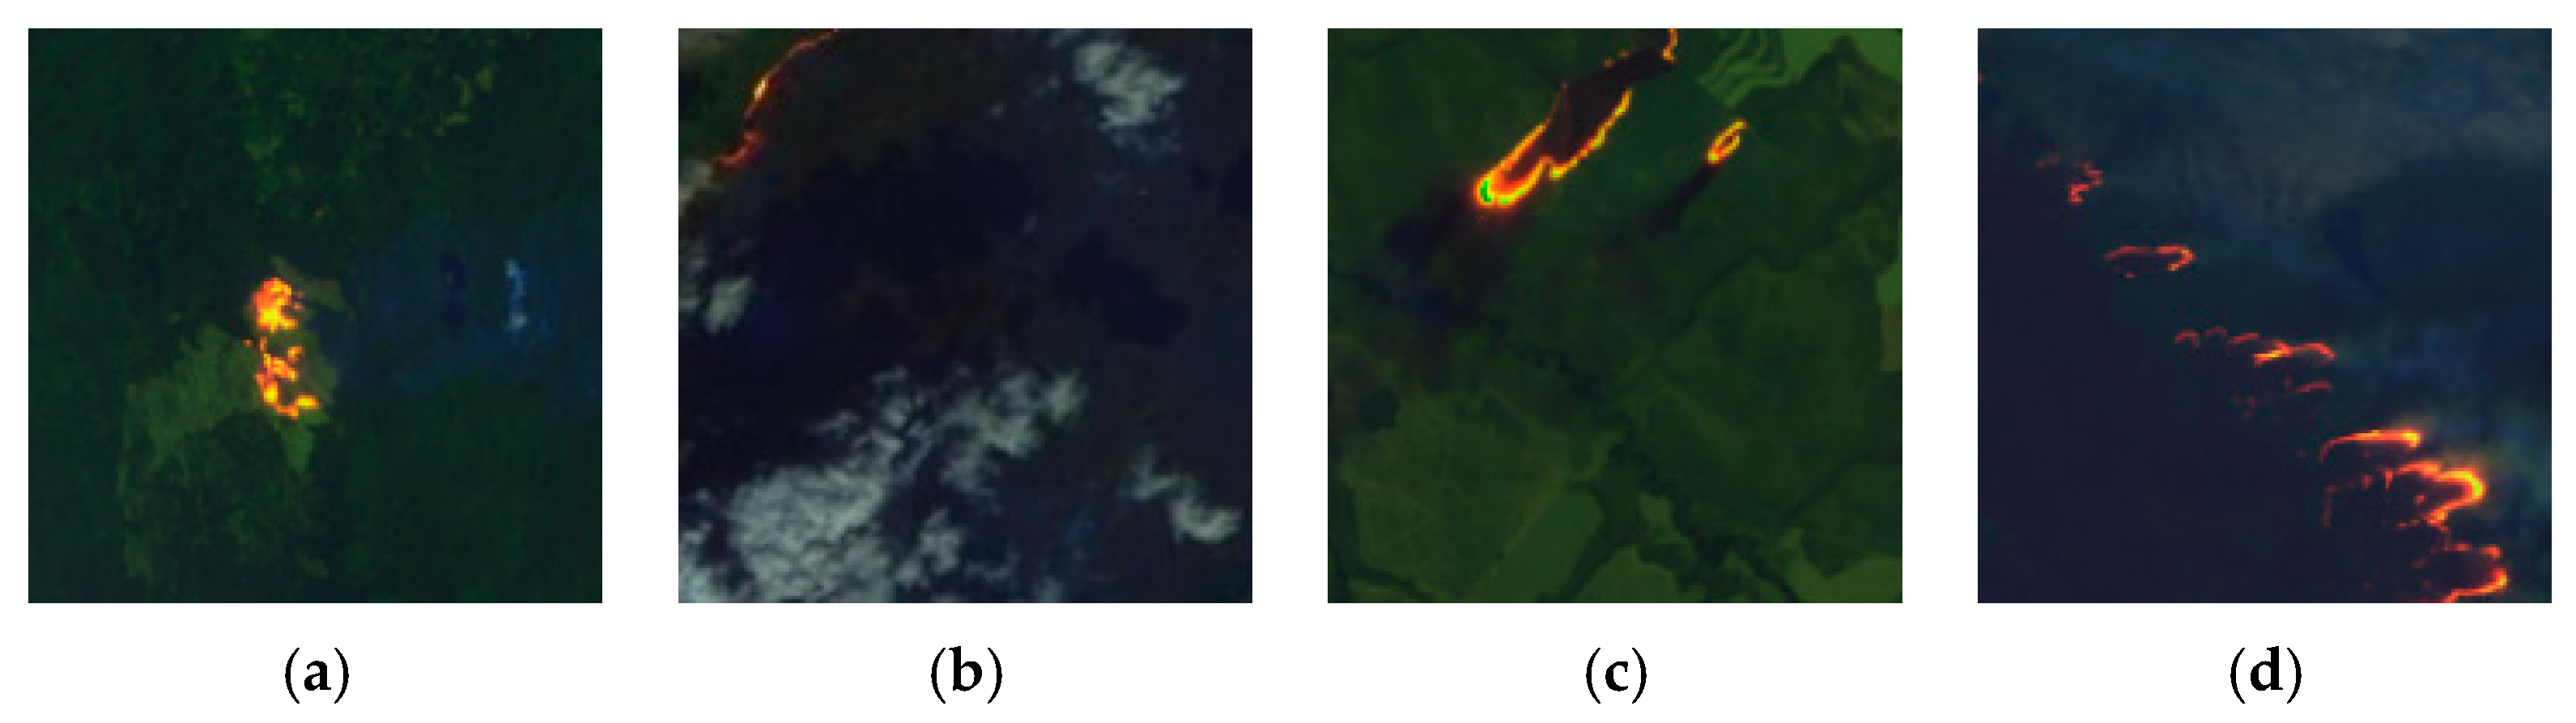
3.1. Datasets
3.2. Evaluation Metrics
4. Analysis of Fire Detection Results
4.1. Training Parameter Settings
4.2. Ablation Experiments
4.3. Fire Detection Results
4.3.1. Overall Fire Detection Results Analysis
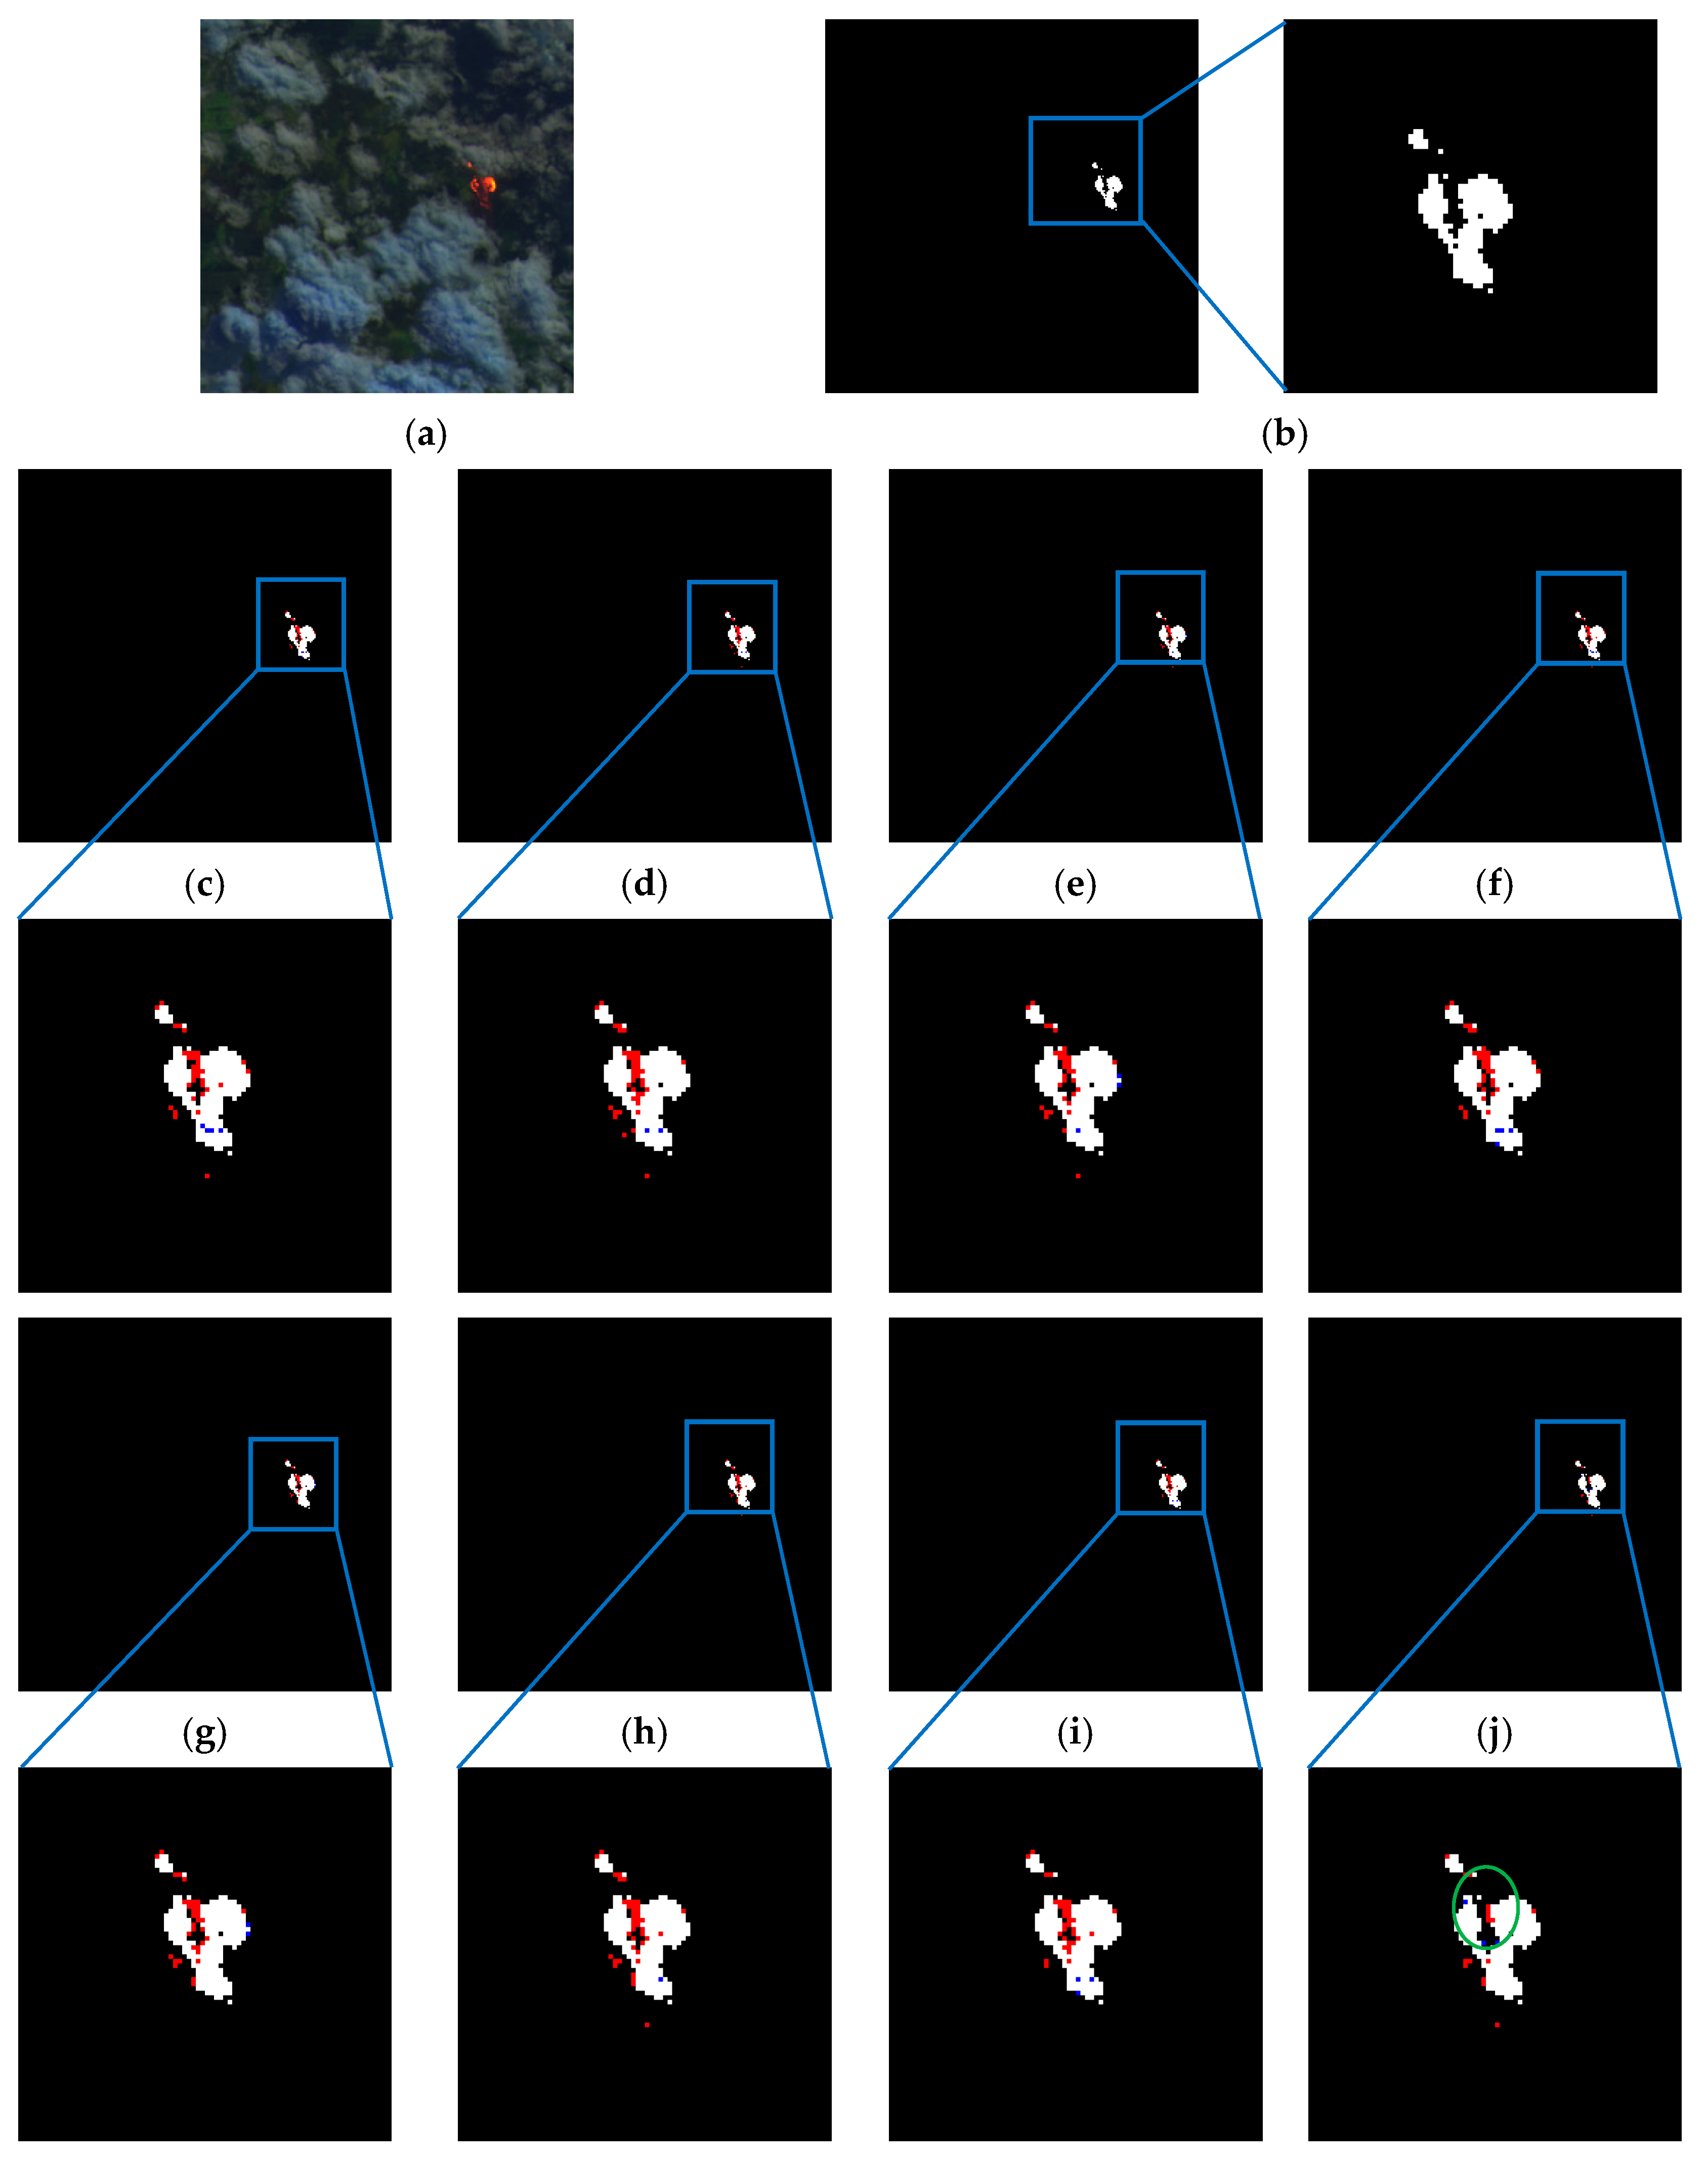
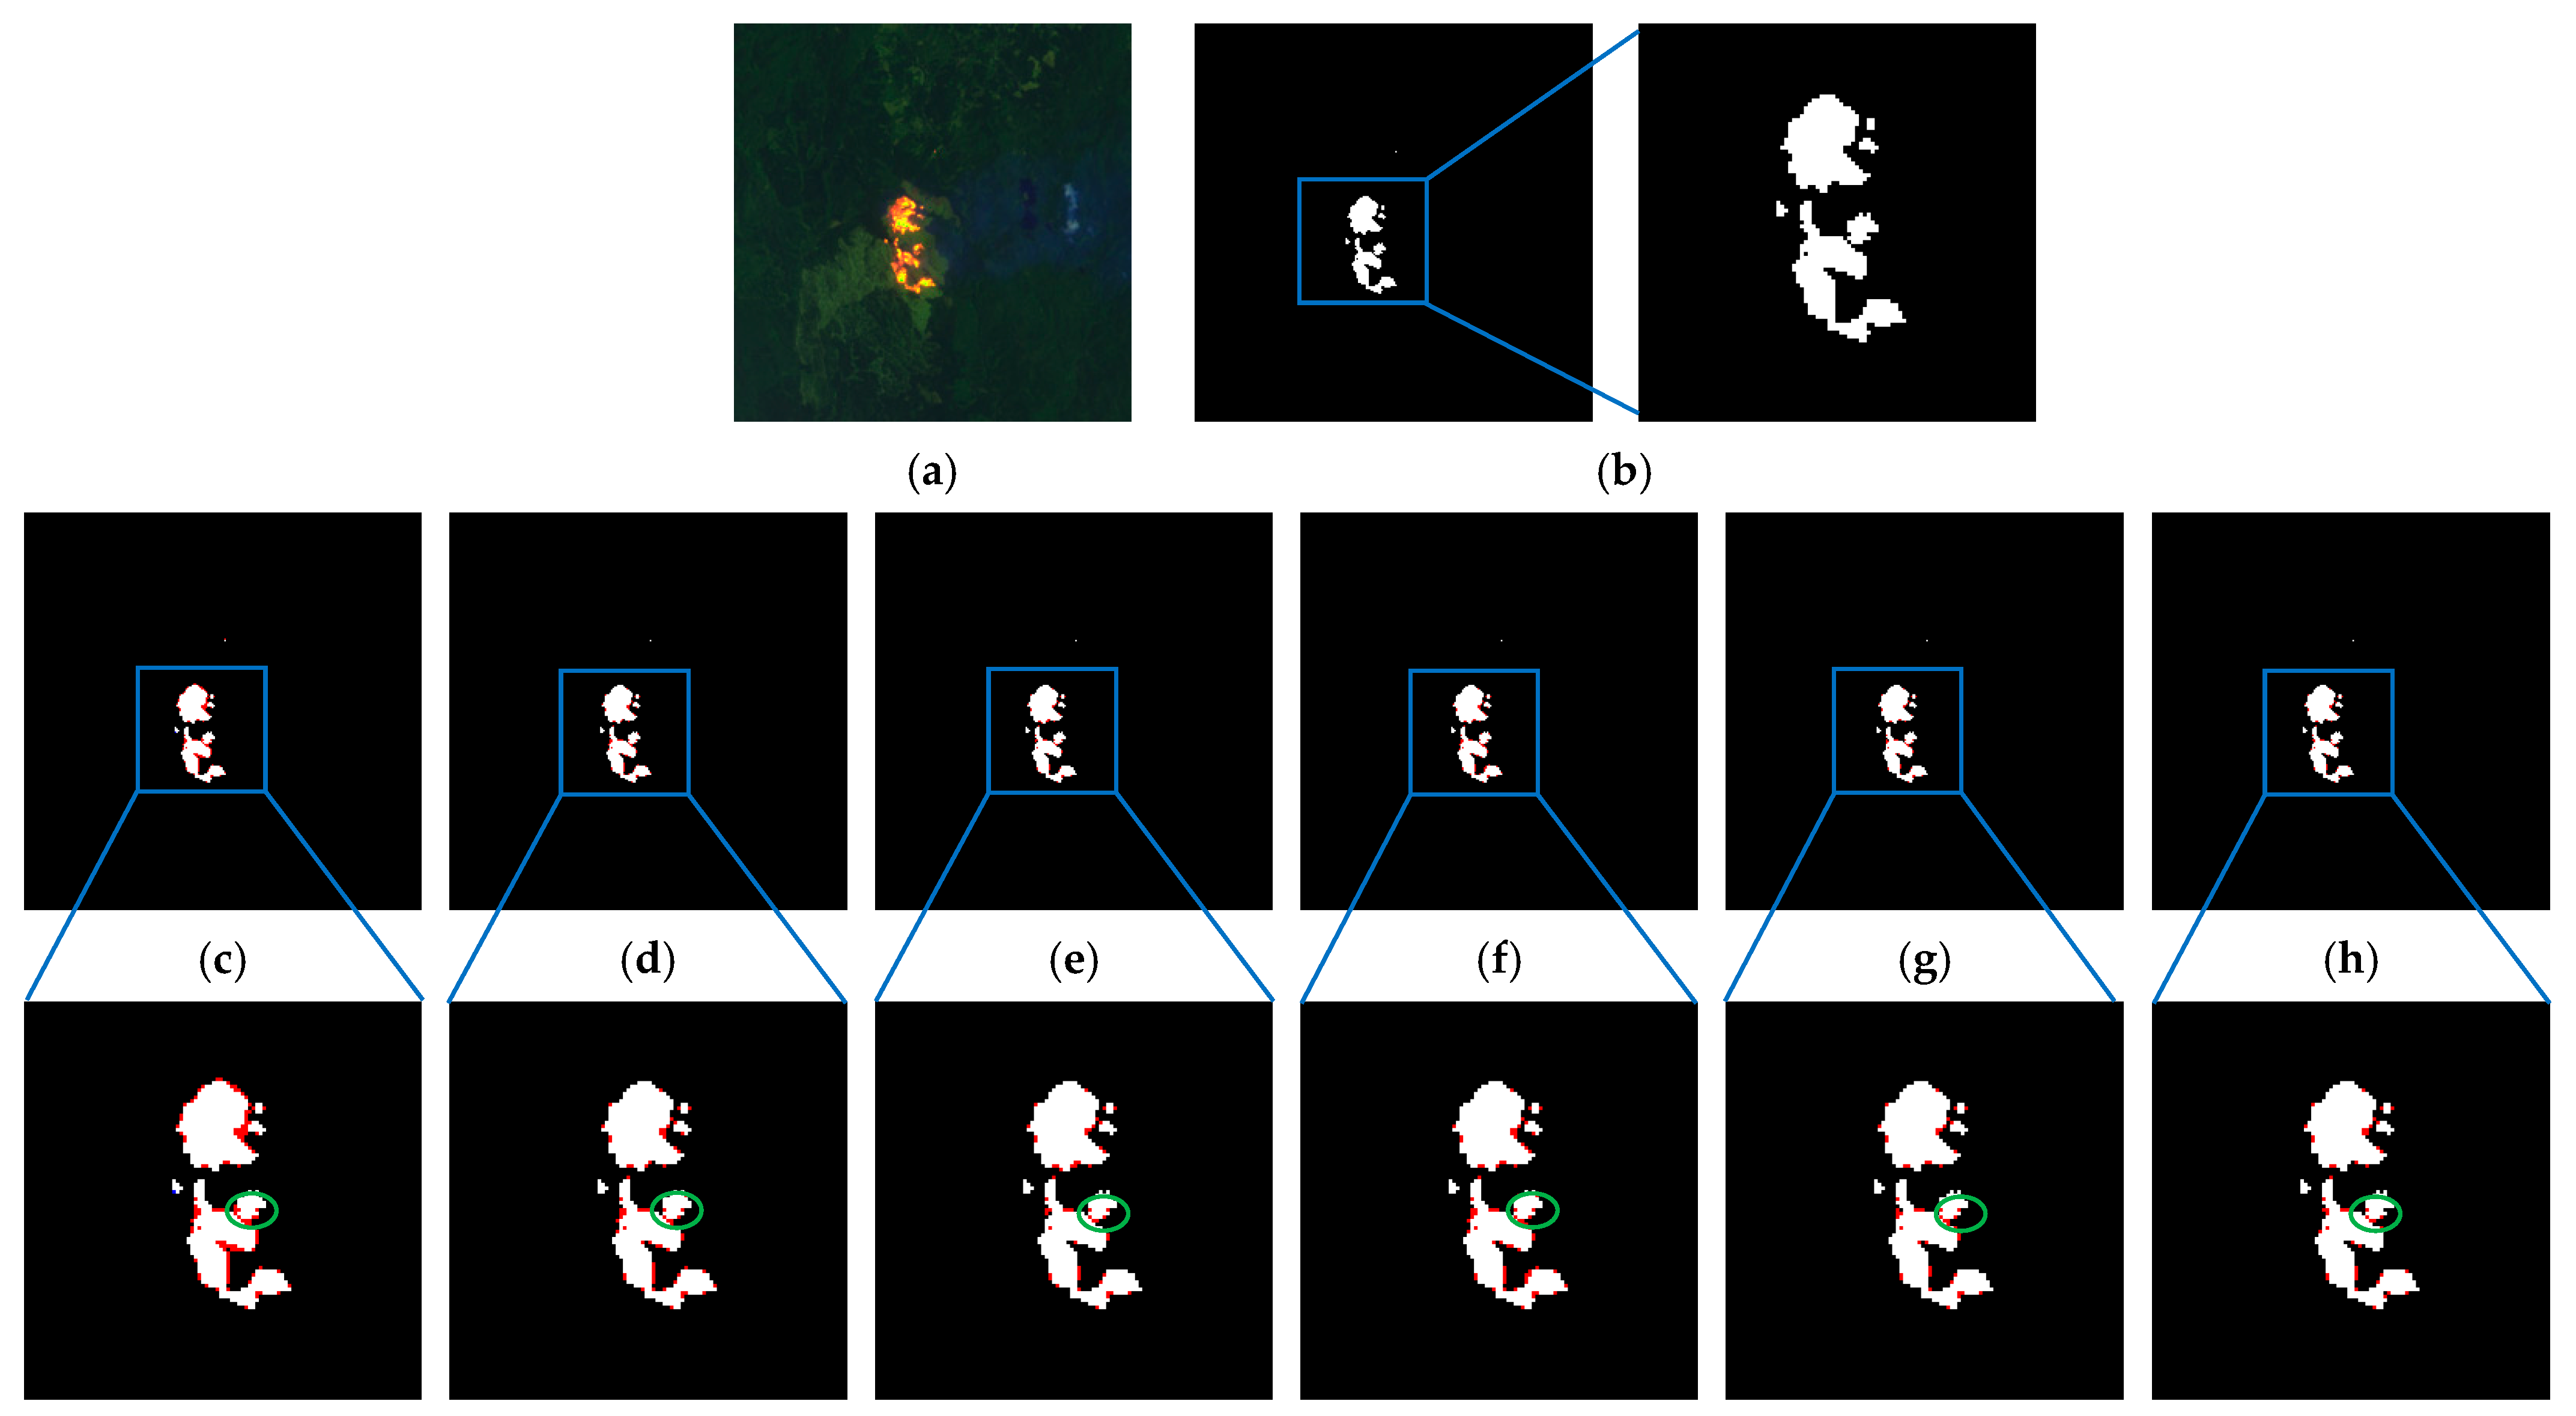
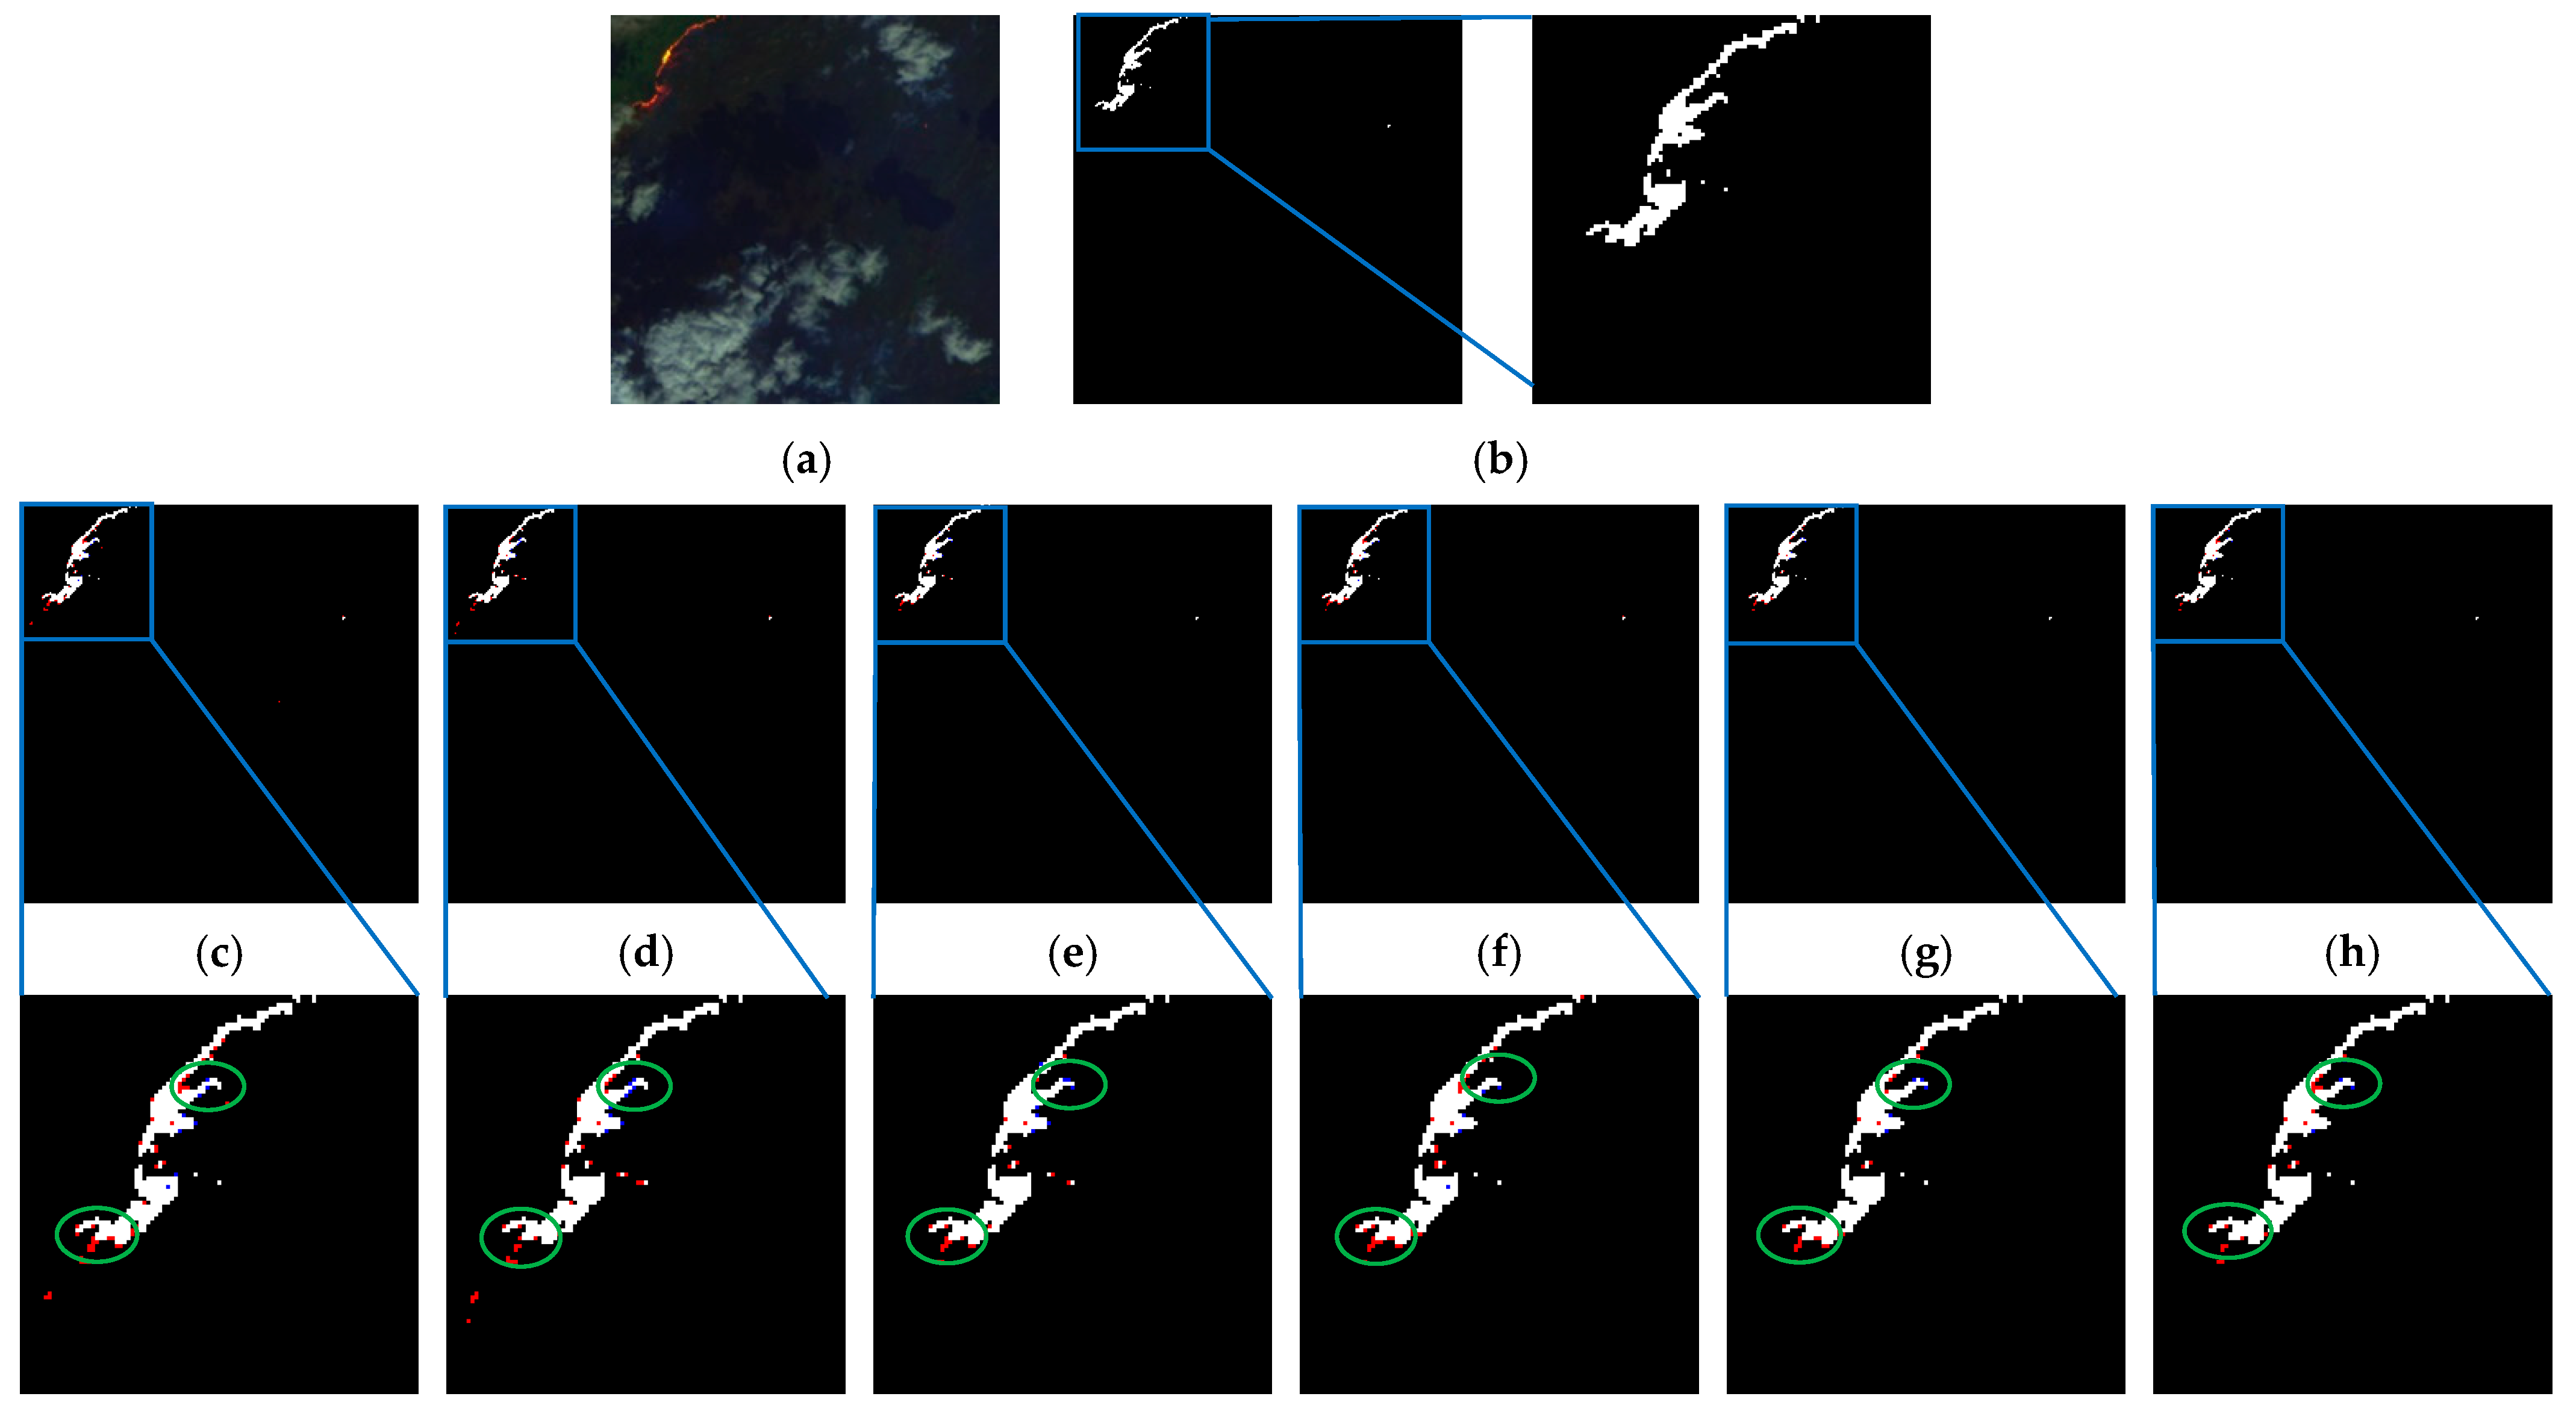
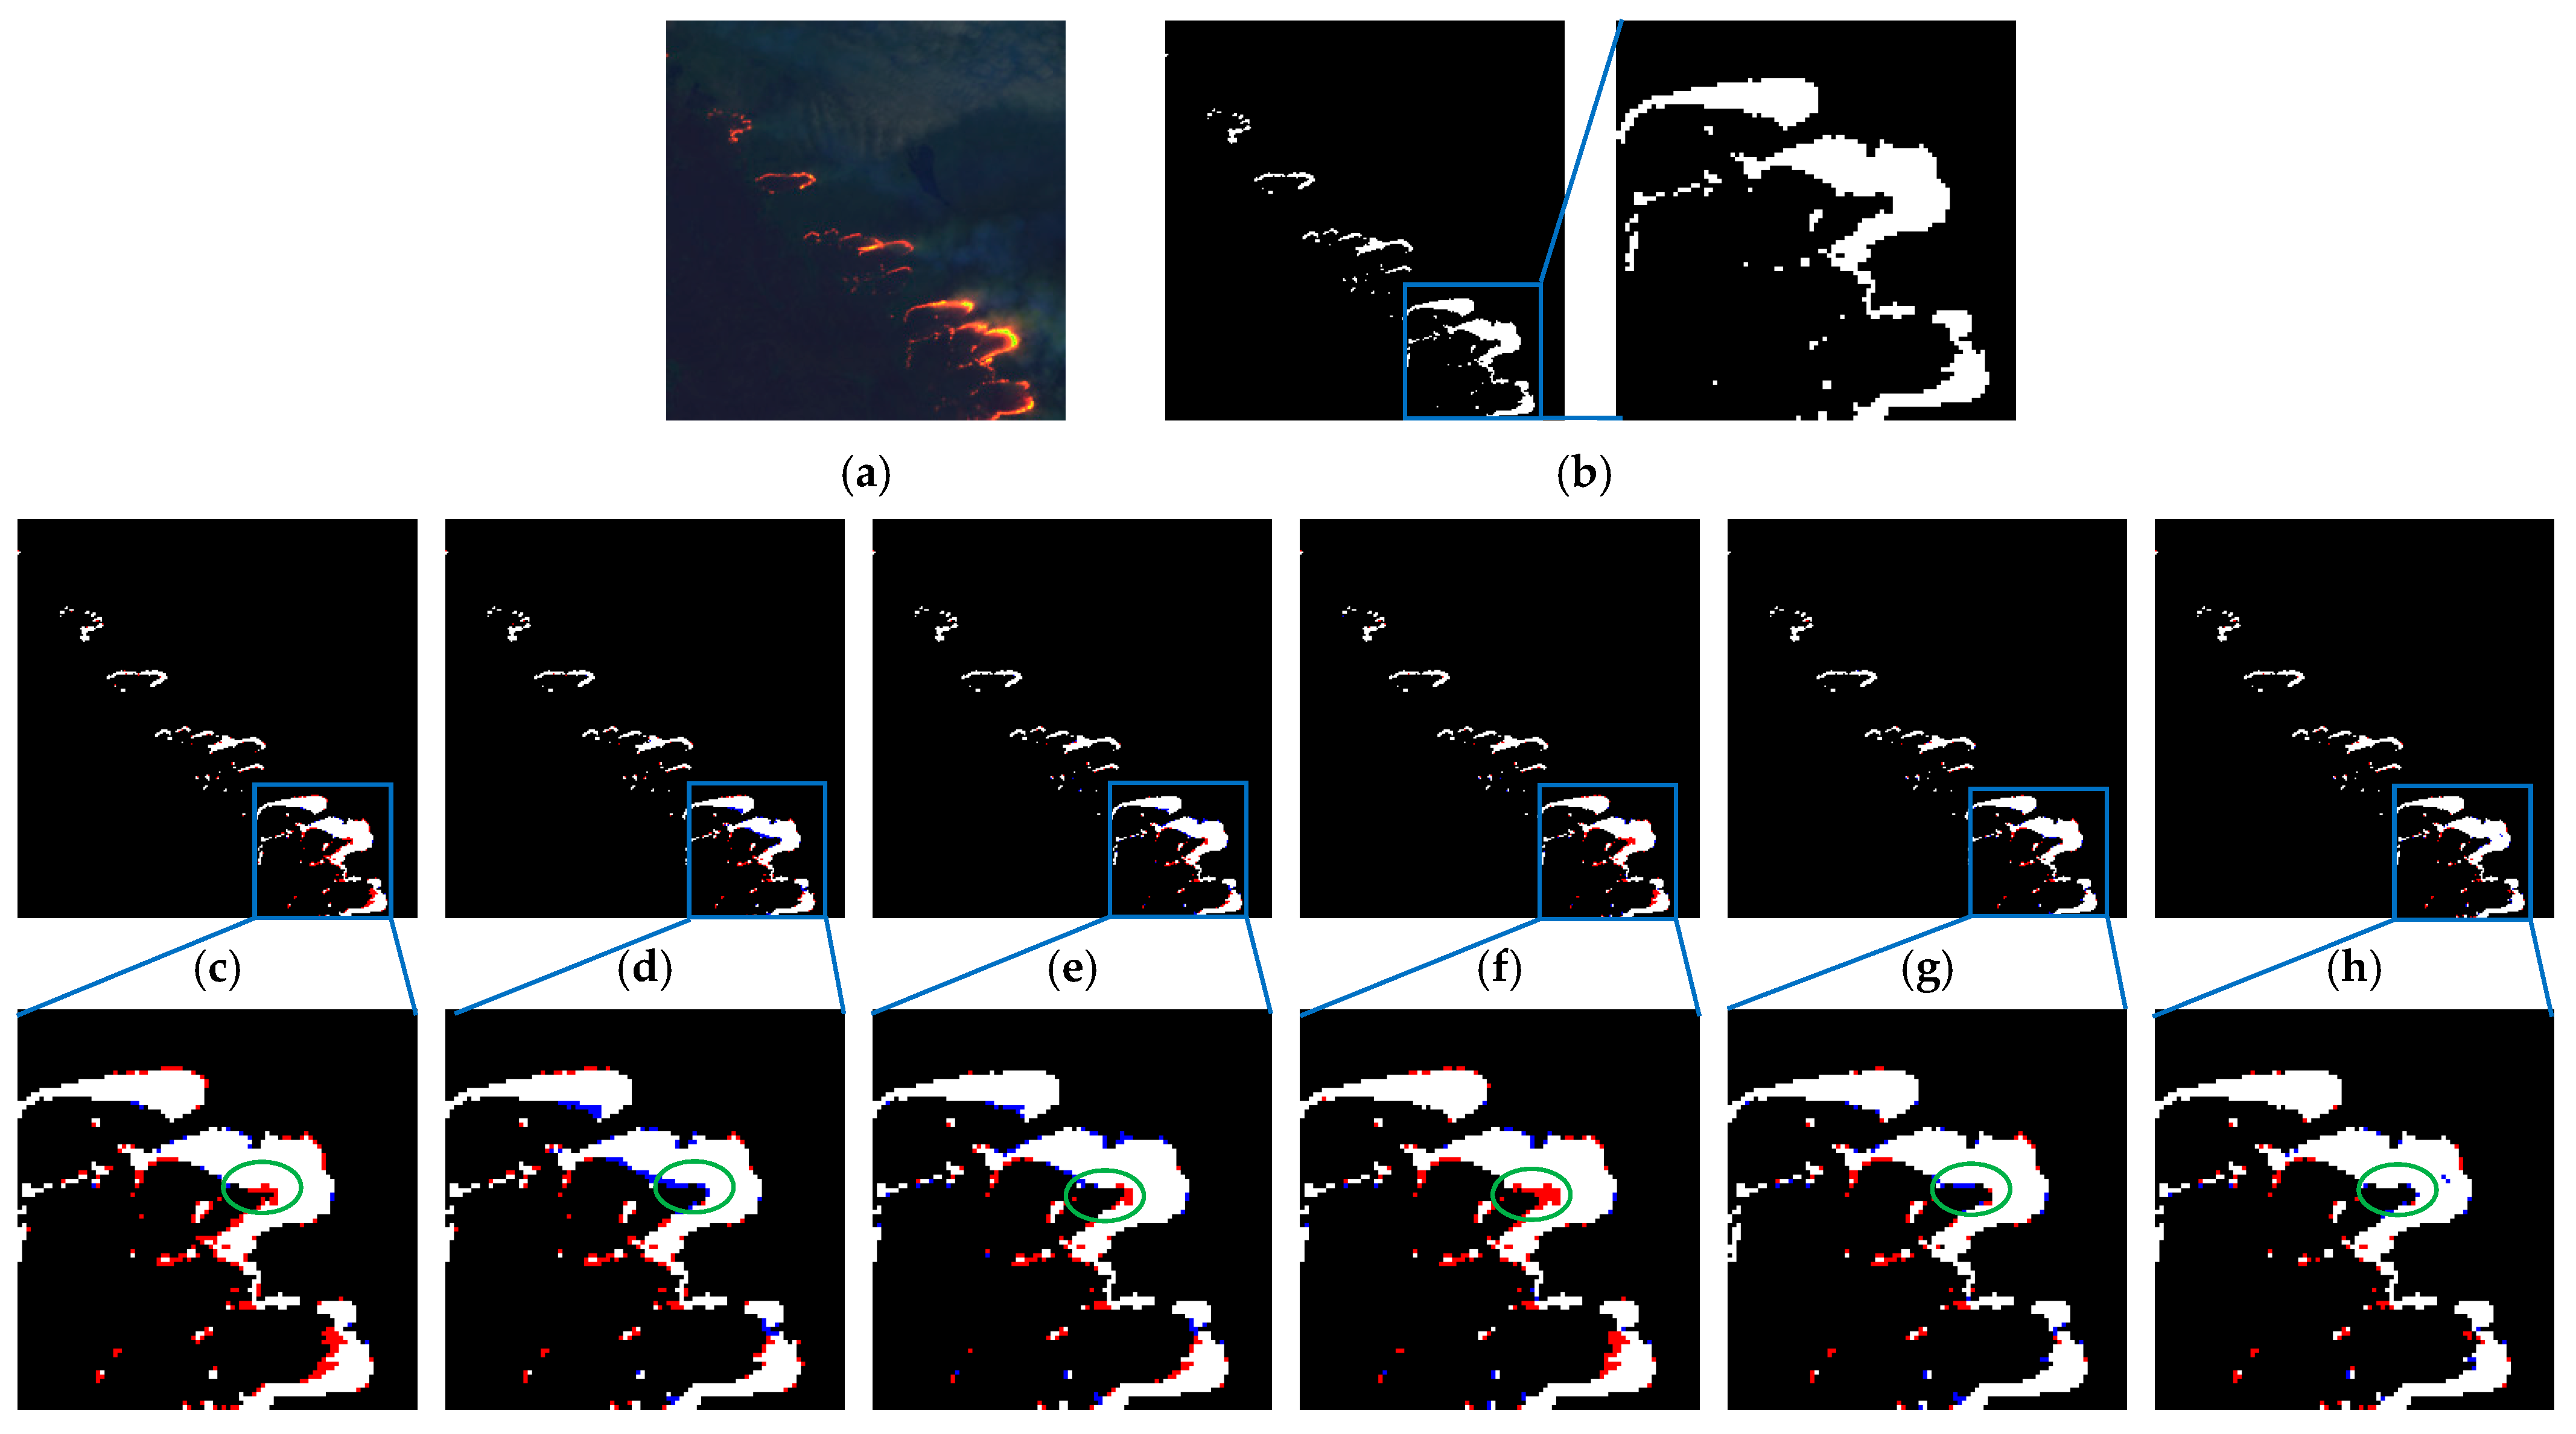
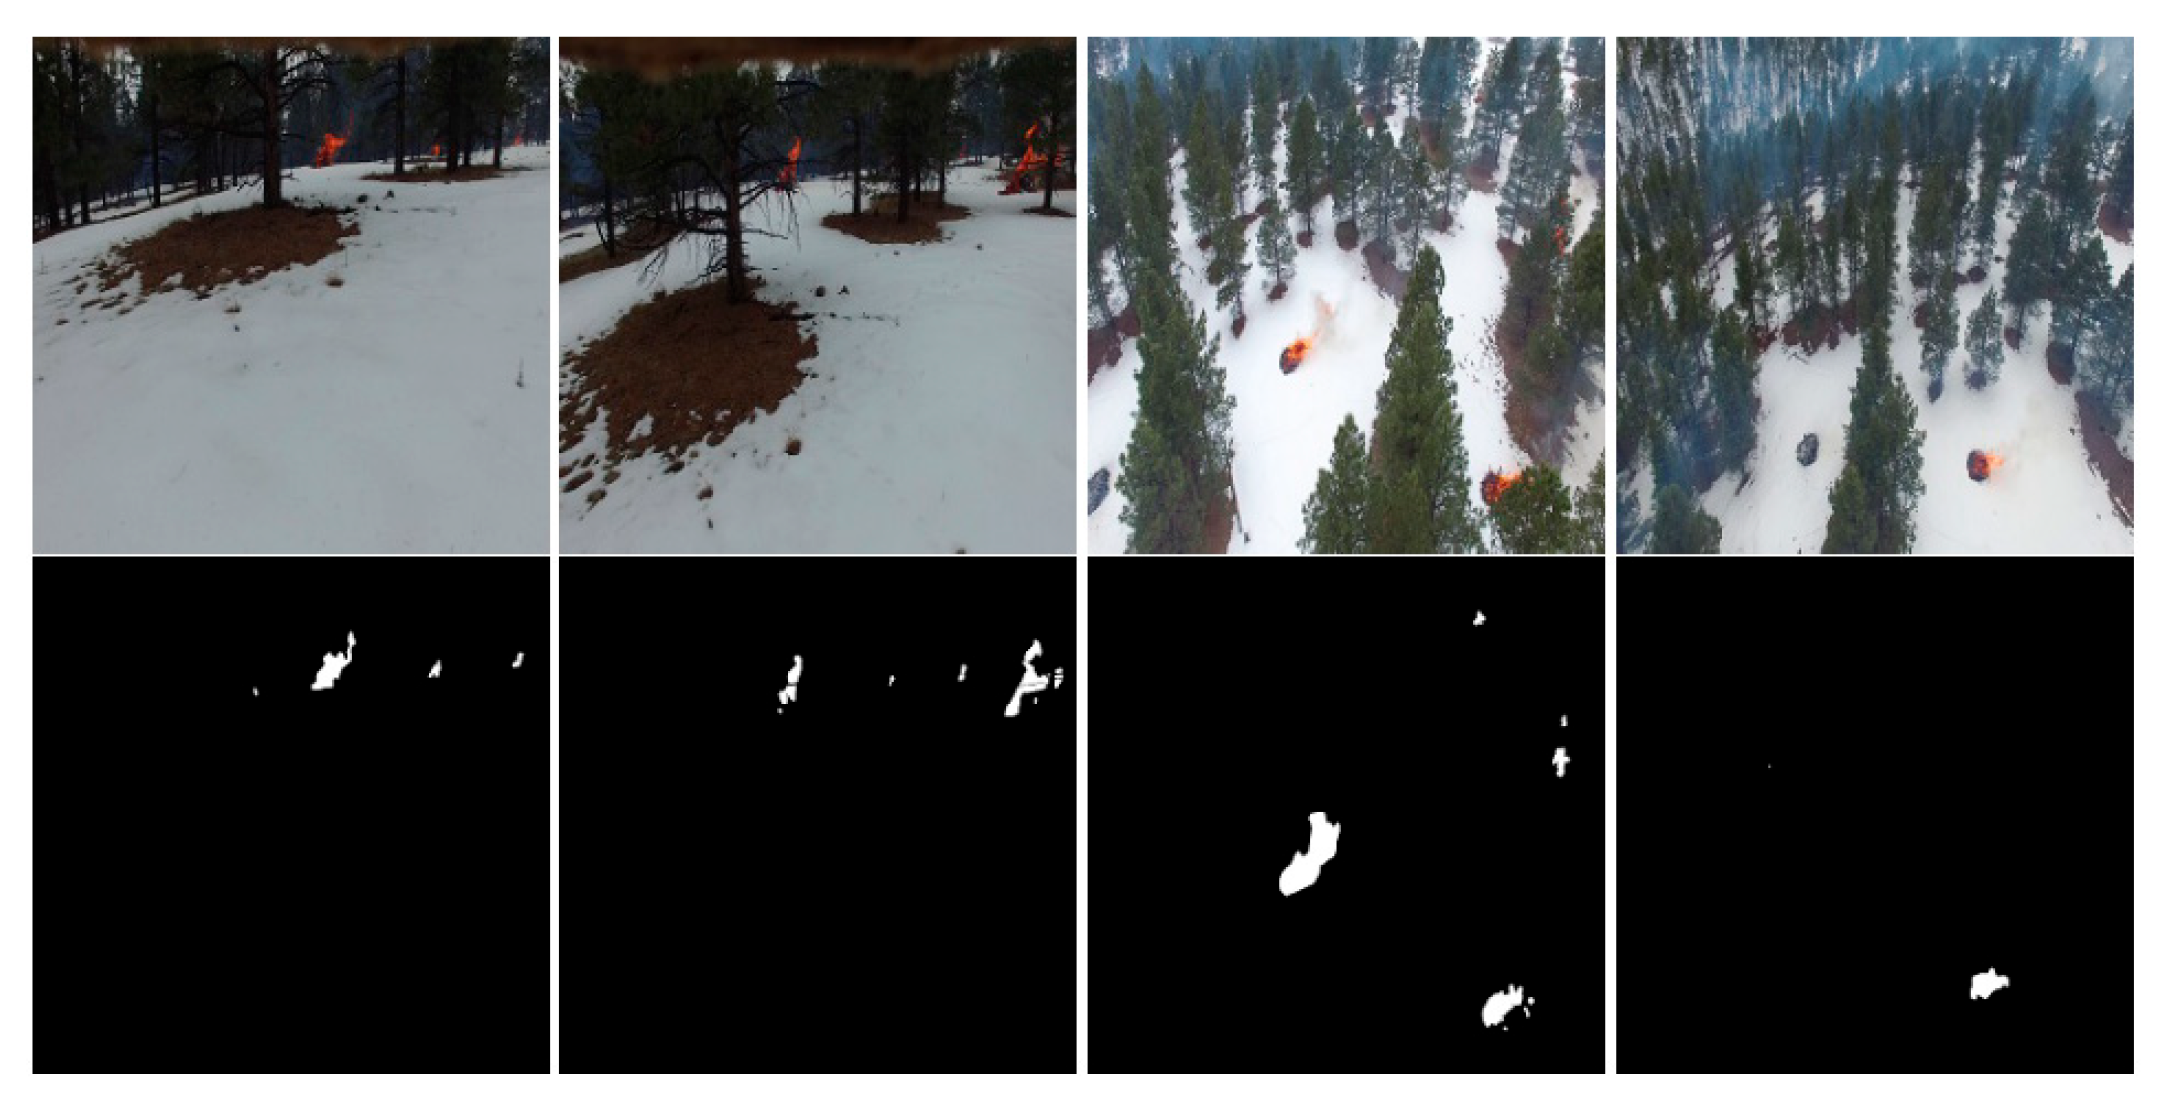
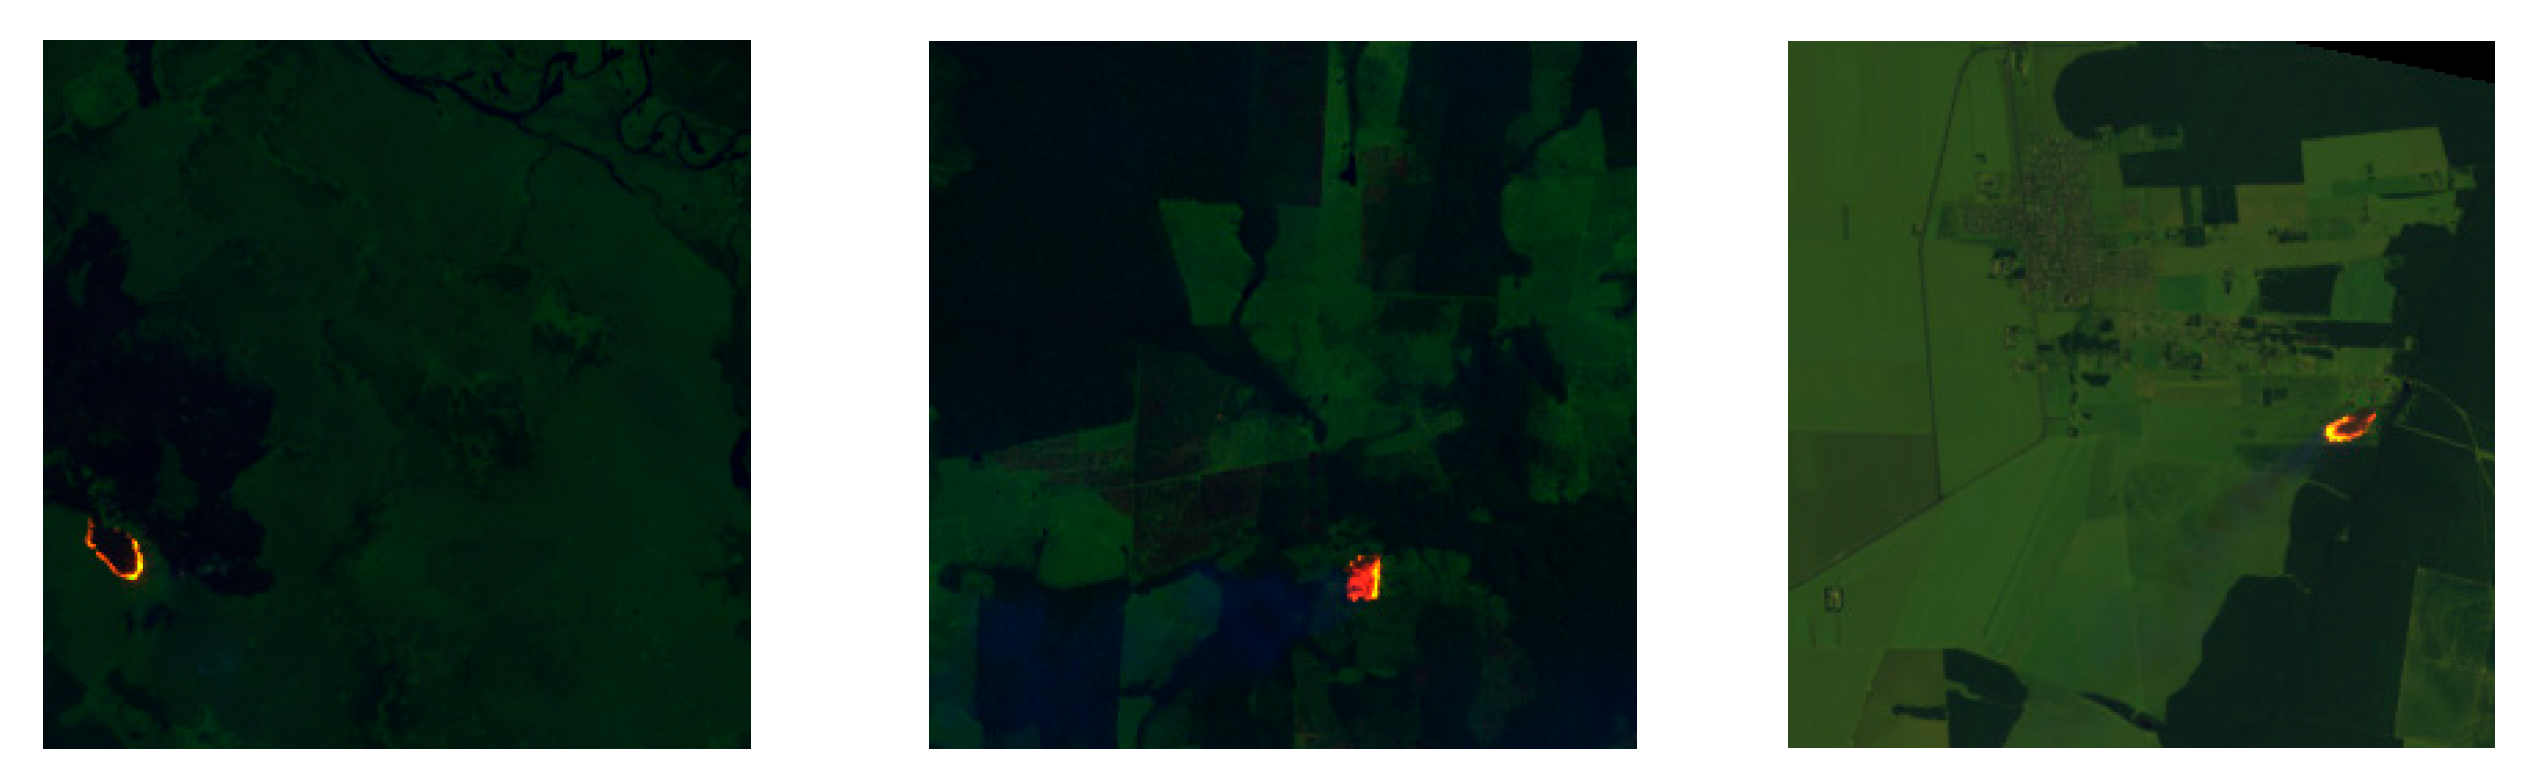
4.3.2. Analysis of Small Targets and Cloud Cover Results
5. Discussion
6. Conclusions
Author Contributions
Funding
Data Availability Statement
Conflicts of Interest
References
- Adams, M.A.; Shen, Z. Introduction to the characteristics, impacts and management of forest fire in China. For. Ecol. Manag. 2015, 356, 1. [Google Scholar] [CrossRef]
- Ramos, L.; Casas, E.; Bendek, E.; Romero, C.; Rivas-Echeverría, F. Computer vision for wildfire detection: A critical brief review. Multimed. Tools Appl. 2024, 83, 83427–83470. [Google Scholar] [CrossRef]
- Global Wildfire Information System (2025)—With Minor Processing by Our World in Data. Available online: https://ourworldindata.org/grapher/annual-area-burnt-by-wildfires?tab=maps (accessed on 22 June 2025).
- Abdusalomov, A.; Umirzakova, S.; Bakhtiyor Shukhratovich, M.; Mukhiddinov, M.; Kakhorov, A.; Buriboev, A.; Jeon, H.S. Drone-Based Wildfire Detection with Multi-Sensor Integration. Remote Sens. 2024, 16, 4651. [Google Scholar] [CrossRef]
- Fraser, R.H.; Van der Sluijs, J.; Hall, R.J. Calibrating Satellite-Based Indices of Burn Severity from UAV-Derived Metrics of a Burned Boreal Forest in NWT, Canada. Remote Sens. 2017, 9, 279. [Google Scholar] [CrossRef]
- Tong, H.; Yuan, J.; Zhang, J.; Wang, H.; Li, T. Real-Time Wildfire Monitoring Using Low-Altitude Remote Sensing Imagery. Remote Sens. 2024, 16, 2827. [Google Scholar] [CrossRef]
- Thangavel, K.; Spiller, D.; Sabatini, R.; Amici, S.; Sasidharan, S.T.; Fayek, H.; Marzocca, P. Autonomous satellite wildfire detection using hyperspectral imagery and neural networks: A case study on Australian wildfire. Remote Sens. 2023, 15, 720. [Google Scholar] [CrossRef]
- Sun, Y.; Jiang, L.; Pan, J.; Sheng, S.; Hao, L. A satellite imagery smoke detection framework based on the Mahalanobis distance for early fire identification and positioning. Int. J. Appl. Earth Obs. Geoinf. 2023, 118, 103257. [Google Scholar] [CrossRef]
- Barmpoutis, P.; Papaioannou, P.; Dimitropoulos, K.; Grammalidis, N. A Review on Early Forest Fire Detection Systems Using Optical Remote Sensing. Sensors 2020, 20, 6442. [Google Scholar] [CrossRef]
- Pourshakouri, F.; Darvishsefat, A.A.; Samadzadegan, F.; Attarod, P.; Amini, S. An improved algorithm for small and low-intensity fire detection in the temperate deciduous forests using MODIS data: A preliminary study in the Caspian Forests of Northern Iran. Nat. Hazards 2023, 116, 2529–2547. [Google Scholar] [CrossRef]
- Cardíl, A.; Tapia, V.M.; Monedero, S.; Quiñones, T.; Little, K.; Stoof, C.R.; Ramirez, J.; de Miguel, S. Characterizing the rate of spread of large wildfires in emerging fire environments of northwestern Europe using Visible Infrared Imaging Radiometer Suite active fire data. Nat. Hazards Earth Syst. Sci. 2023, 23, 361–373. [Google Scholar] [CrossRef]
- Zhang, T.; Wooster, M.J.; Xu, W. Approaches for synergistically exploiting VIIRS I- and M-Band data in regional active fire detection and FRP assessment: A demonstration with respect to agricultural residue burning in Eastern China. Remote Sens. Environ. 2017, 198, 407–424. [Google Scholar] [CrossRef]
- Hong, Z.; Tang, Z.; Pan, H.; Zhang, Y.; Zheng, Z.; Zhou, R.; Ma, Z.; Zhang, Y.; Han, Y.; Wang, J.; et al. Active fire detection using a novel convolutional neural network based on Himawari-8 satellite images. Front. Environ. Sci. 2022, 10, 794028. [Google Scholar] [CrossRef]
- Thompson, D.K.; Morrison, K. A classification scheme to determine wildfires from the satellite record in the cool grasslands of southern Canada: Considerations for fire occurrence modelling and warning criteria. Nat. Hazards Earth Syst. Sci. 2020, 20, 3439–3454. [Google Scholar] [CrossRef]
- Ghali, R.; Jmal, M.; Mseddi, W.S.; Attia, R. Recent advances in fire detection and monitoring systems: A review. In Proceedings of the 10th International Conference on Sciences of Electronics, Technologies of Information and Telecommunications, Hammamet, Tunisia, 20–22 December 2020. [Google Scholar] [CrossRef]
- Zhang, Z.; Shen, T.; Zou, J. An improved probabilistic approach for fire detection in videos. Fire Technol. 2014, 50, 745–752. [Google Scholar] [CrossRef]
- Celik, T.; Demirel, H. Fire detection in video sequences using a generic color model. Fire Saf. J. 2009, 44, 147–158. [Google Scholar] [CrossRef]
- Chen, X.; An, Q.; Yu, K.; Ban, Y. A novel fire identification algorithm based on improved color segmentation and enhanced feature data. IEEE Trans. Instrum. Meas. 2021, 70, 3075380. [Google Scholar] [CrossRef]
- Jang, E.; Kang, Y.; Im, J.; Lee, D.-W.; Yoon, J.; Kim, S.-K. Detection and monitoring of forest fires using Himawari-8 geostationary satellite data in South Korea. Remote Sens. 2019, 11, 271. [Google Scholar] [CrossRef]
- Tennant, E.; Jenkins, S.F.; Miller, V.; Robertson, R.; Wen, B.; Yun, S.-H.; Taisne, B. Automating tephra fall building damage assessment using deep learning. Nat. Hazards Earth Syst. Sci. 2024, 24, 4585–4608. [Google Scholar] [CrossRef]
- Zhu, J.; Zhang, H.; Li, S.; Wang, S.; Ma, H. Cross teaching-enhanced multispectral remote sensing object detection with transformer. IEEE J. Sel. Top. Appl. Earth Obs. Remote Sens. 2025, 18, 2401–2413. [Google Scholar] [CrossRef]
- Zhang, S.; Zhang, S.; Guo, T.; Xu, R.; Liu, Z.; Du, Q. Clutter Modeling and Characteristics Analysis for GEO Spaceborne-Airborne Bistatic Radar. Remote Sens. 2025, 17, 1222. [Google Scholar] [CrossRef]
- Yu, L.; Qin, H.; Huang, S.; Wei, W.; Jiang, H.; Mu, L. Quantitative study of storm surge risk assessment in an undeveloped coastal area of China based on deep learning and geographic information system techniques: A case study of Double Moon Bay. Nat. Hazards Earth Syst. Sci. 2024, 24, 2003–2024. [Google Scholar] [CrossRef]
- Hwang, G.; Jeong, J.; Lee, S.J. SFA-Net: Semantic Feature Adjustment Network for Remote Sensing Image Segmentation. Remote Sens. 2024, 16, 3278. [Google Scholar] [CrossRef]
- Kukuk, S.B.; Kilimci, Z.H. Comprehensive analysis of forest fire detection using deep learning models and conventional machine learning algorithms. Int. J. Comput. Exp. Sci. Eng. 2021, 7, 84–94. [Google Scholar] [CrossRef]
- Jin, C.; Wang, T.; Alhusaini, N.; Zhao, S.; Liu, H.; Xu, K.; Zhang, J. Video fire detection methods based on deep learning: Datasets, methods, and future directions. Fire 2023, 6, 315. [Google Scholar] [CrossRef]
- Sun, H.R.; Shi, B.J.; Zhou, Y.T.; Chen, J.H.; Hu, Y.L. A smoke detection algorithm based on improved YOLO v7 lightweight model for UAV optical sensors. IEEE Sens. J. 2024, 24, 26136–26147. [Google Scholar] [CrossRef]
- Hu, X.; Liu, W.; Wen, H.; Yuen, K.-V.; Jin, T.; Junior, A.C.N.; Zhong, P. AF-Net: An Active Fire Detection Model Using Improved Object-Contextual Representations on Unbalanced UAV Datasets. IEEE J. Sel. Top. Appl. Earth Obs. Remote Sens. 2024, 17, 13558–13569. [Google Scholar] [CrossRef]
- Seydi, S.T.; Saeidi, V.; Kalantar, B.; Ueda, N.; Halin, A.A. Fire-Net: A deep learning framework for active forest fire detection. J. Sens. 2022, 2022, 8044390. [Google Scholar] [CrossRef]
- Han, Y.; Zheng, C.; Liu, X.; Tian, Y.; Dong, Z. Burned Area and Burn Severity Mapping with a Transformer-Based Change Detection Model. IEEE J. Sel. Top. Appl. Earth Obs. Remote Sens. 2024, 17, 13866–13880. [Google Scholar] [CrossRef]
- Ronneberger, O.; Fischer, P.; Brox, T. U-net: Convolutional networks for biomedical image segmentation. In Proceedings of the Medical Image Computing and Computer-Assisted Intervention—MICCAI 2015, Munich, Germany, 5–9 October 2015. [Google Scholar] [CrossRef]
- Siddique, N.; Paheding, S.; Elkin, C.P.; Devabhaktuni, V. U-Net and its variants for medical image segmentation: A review of theory and applications. IEEE Access 2021, 9, 82031–82057. [Google Scholar] [CrossRef]
- Zhang, P.; Ban, Y.; Nascetti, A. Learning U-Net without forgetting for near real-time wildfire monitoring by the fusion of SAR and optical time series. Remote Sens. Environ. 2021, 261, 112467. [Google Scholar] [CrossRef]
- Xu, Z.; Li, H.; Long, B. MSU-Net: Multi-scale self-attention semantic segmentation method for oil-tea camellia planting area extraction in hilly areas of southern China. Expert Syst. Appl. 2025, 263, 125779. [Google Scholar] [CrossRef]
- Long, J.; Shelhamer, E.; Darrell, T. Fully convolutional networks for semantic segmentation. In Proceedings of the IEEE/CVF Conference on Computer Vision and Pattern Recognition, Boston, MA, USA, 7–12 June 2015. [Google Scholar] [CrossRef]
- Zhao, H.; Shi, J.; Qi, X.; Wang, X.; Jia, J. Pyramid scene parsing network. In Proceedings of the IEEE/CVF Conference on Computer Vision and Pattern Recognition, Honolulu, HI, USA, 21–26 July 2017. [Google Scholar] [CrossRef]
- Wang, Z.; Yang, P.; Liang, H.; Zheng, C.; Yin, J.; Tian, Y.; Cui, W. Semantic segmentation and analysis on sensitive parameters of forest fire smoke using smoke-unet and landsat-8 imagery. Remote Sens. 2021, 14, 45. [Google Scholar] [CrossRef]
- Afsar, R.; Sultana, A.; Abouzahra, S.N.; Aspiras, T.; Asari, V.K. Using ResWnet for semantic segmentation of active wildfires from Landsat-8 imagery. In Proceedings of the SPIE—The International Society for Optical Engineering, National Harbor, MD, USA, 19–24 August 2024. [Google Scholar] [CrossRef]
- Schroeder, W.; Oliva, P.; Giglio, L.; Quayle, B.; Lorenz, E.; Morelli, F. Active fire detection using Landsat-8/OLI data. Remote Sens. Environ. 2016, 185, 210–220. [Google Scholar] [CrossRef]
- Kumar, S.S.; Roy, D.P. Global operational land imager Landsat-8 reflectance-based active fire detection algorithm. Int. J. Digit. Earth 2018, 11, 154–178. [Google Scholar] [CrossRef]
- Murphy, S.W.; de Souza Filho, C.R.; Wright, R.; Sabatino, G.; Pabon, R.C. HOTMAP: Global hot target detection at moderate spatial resolution. Remote Sens. Environ. 2016, 177, 78–88. [Google Scholar] [CrossRef]
- de Almeida Pereira, G.H.; Fusioka, A.M.; Nassu, B.T. Active fire detection in Landsat-8 imagery: A large-scale dataset and a deep-learning study. ISPRS J. Photogramm. Remote Sens. 2021, 178, 171–186. [Google Scholar] [CrossRef]
- Pan, X.; Ge, C.; Lu, R.; Song, S.; Chen, G.; Huang, Z.; Huang, G. On the Integration of Self-Attention and Convolution. In Proceedings of the IEEE/CVF Conference on Computer Vision and Pattern Recognition, New Orleans, LA, USA, 18–24 June 2022; pp. 805–815. [Google Scholar] [CrossRef]
- Woo, S.; Park, J.; Lee, J.Y.; Kweon, I.S. CBAM: Convolutional block attention module. In Proceedings of the European Conference on Computer Vision, Munich, Germany, 8–14 September 2018. [Google Scholar] [CrossRef]
- Xu, G.; Liao, W.; Zhang, X.; Li, C.; He, X.; Wu, X. Haar wavelet downsampling: A simple but effective downsampling module for semantic segmentation. Pattern Recognit. 2023, 143, 109819. [Google Scholar] [CrossRef]
- Zhang, Z.; Liu, Q.; Wang, Y. Road extraction by deep residual u-net. IEEE Geosci. Remote Sens. Lett. 2018, 15, 749–753. [Google Scholar] [CrossRef]
- Huang, H.; Lin, L.; Tong, R.; Hu, H.; Zhang, Q.; Iwamoto, Y. Unet 3+: A full-scale connected unet for medical image segmentation. In Proceedings of the IEEE International Conference on Acoustics, Speech and Signal Processing, Barcelona, Spain, 4–8 May 2020. [Google Scholar] [CrossRef]
- Cao, H.; Wang, Y.; Chen, J.; Jiang, D.; Zhang, X.; Tian, Q.; Wang, M. Swin-Unet: Unet-Like Pure Transformer for Medical Image Segmentation. In Proceedings of the European Conference on Computer Vision, Tel Aviv, Israel, 23–27 October 2022. [Google Scholar] [CrossRef]
- Zeng, Y.; Li, J.; Zhao, Z.; Liang, W.; Zeng, P.; Shen, S.; Zhang, K.; Shen, C. WET-UNet: Wavelet integrated efficient transformer networks for nasopharyngeal carcinoma tumor segmentation. Sci. Prog. 2024, 107, 00368504241232537. [Google Scholar] [CrossRef]


| Method | ACmix | CBAM | HWD | P (%) | R (%) | IoU (%) | F1 (%) |
|---|---|---|---|---|---|---|---|
| ResU-Net | 96.03 | 84.22 | 81.31 | 89.69 | |||
| Improvement 1 | √ | 95.28 | 95.28 | 90.99 | 95.28 | ||
| Improvement 2 | √ | 96.58 | 93.59 | 90.60 | 95.06 | ||
| Improvement 3 | √ | 96.49 | 93.22 | 90.16 | 94.82 | ||
| Improvement 4 | √ | √ | 96.22 | 94.83 | 91.43 | 95.53 | |
| Improvement 5 | √ | √ | 96.05 | 95.66 | 92.04 | 95.86 | |
| Improvement 6 | √ | √ | 96.43 | 94.06 | 90.89 | 95.23 | |
| FDE U-Net | √ | √ | √ | 97.05 | 95.87 | 92.25 | 95.97 |
| Method | P (%) | R (%) | IoU (%) | F1 (%) | Para (M) | FLOPS | Inference Time | FPS |
|---|---|---|---|---|---|---|---|---|
| U-Net [31] | 94.91 | 84.43 | 80.71 | 89.32 | 1.95 | 5.44 G | 17.33 ms | 57.69 |
| ResU-Net [46] | 96.03 | 84.22 | 81.31 | 89.69 | 2.03 | 4.23 G | 19.81ms | 50.45 |
| U-Net3+ [47] | 96.49 | 90.16 | 87.30 | 93.22 | 2.31 | 2.02 G | 18.05 ms | 55.39 |
| SwinU-Net [48] | 95.85 | 95.66 | 91.86 | 95.76 | 8.73 | 4.42 G | 24.30 ms | 41.15 |
| WET-UNet [49] | 96.99 | 93.38 | 90.76 | 95.15 | 6.32 | 3.16 G | 26.10 ms | 38.31 |
| FDE U-Net | 97.05 | 95.87 | 92.25 | 95.97 | 2.25 | 4.16 G | 20.13 ms | 49.7 |
| Method | Image 1 | Image 2 | Image 3 | Image 4 | ||||||||||||
|---|---|---|---|---|---|---|---|---|---|---|---|---|---|---|---|---|
| GT | TP | FN | FP | GT | TP | FN | FP | GT | TP | FN | FP | GT | TP | FN | FP | |
| U-Net | 781 | 780 | 1 | 124 | 410 | 402 | 8 | 47 | 1347 | 1269 | 78 | 150 | 1711 | 1693 | 18 | 250 |
| ResU-Net | 781 | 0 | 74 | 401 | 9 | 36 | 1273 | 74 | 111 | 1632 | 79 | 146 | ||||
| U-Net3+ | 781 | 0 | 56 | 402 | 8 | 25 | 1281 | 66 | 95 | 1640 | 71 | 128 | ||||
| SwinU-Net | 781 | 0 | 78 | 405 | 5 | 38 | 1300 | 47 | 121 | 1678 | 33 | 186 | ||||
| WET-UNet | 781 | 0 | 53 | 404 | 6 | 25 | 1296 | 51 | 89 | 1664 | 47 | 106 | ||||
| FDE U-Net | 781 | 0 | 52 | 406 | 4 | 25 | 1306 | 41 | 68 | 1683 | 28 | 102 | ||||
| Method | P (%) | R (%) | IoU (%) | F1 (%) |
|---|---|---|---|---|
| U-Net | 89.03 | 84.94 | 76.89 | 86.94 |
| ResU-Net | 91.72 | 82.73 | 76.97 | 86.99 |
| U-Net3+ | 90.07 | 87.10 | 79.46 | 88.56 |
| SwinU-Net | 92.61 | 88.84 | 83.04 | 90.72 |
| WET-UNet | 93.45 | 87.56 | 82.58 | 90.45 |
| FDE U-Net | 93.82 | 89.73 | 84.69 | 91.71 |
| Method | P (%) | R (%) | IoU (%) | F1 (%) |
|---|---|---|---|---|
| U-Net | 92.76 | 85.31 | 80.36 | 88.88 |
| ResU-Net | 93.18 | 84.07 | 79.55 | 88.39 |
| U-Net3+ | 91.95 | 91.45 | 84.85 | 91.70 |
| SwinU-Net | 94.19 | 91.32 | 86.58 | 92.71 |
| WET-UNet | 94.35 | 90.66 | 86.36 | 92.62 |
| FDE U-Net | 95.33 | 92.36 | 87.89 | 93.49 |
| Method | P (%) | R (%) | IoU (%) | F1 (%) |
|---|---|---|---|---|
| U-Net | 93.52 | 84.21 | 79.89 | 88.64 |
| ResU-Net | 94.85 | 83.66 | 80.12 | 88.91 |
| U-Net3+ | 95.28 | 86.17 | 82.87 | 90.50 |
| SwinU-Net | 96.21 | 91.31 | 88.00 | 93.59 |
| WET-UNet | 95.89 | 91.54 | 88.19 | 93.72 |
| FDE U-Net | 96.41 | 92.06 | 88.98 | 94.18 |
Disclaimer/Publisher’s Note: The statements, opinions and data contained in all publications are solely those of the individual author(s) and contributor(s) and not of MDPI and/or the editor(s). MDPI and/or the editor(s) disclaim responsibility for any injury to people or property resulting from any ideas, methods, instructions or products referred to in the content. |
© 2025 by the authors. Licensee MDPI, Basel, Switzerland. This article is an open access article distributed under the terms and conditions of the Creative Commons Attribution (CC BY) license (https://creativecommons.org/licenses/by/4.0/).
Share and Cite
Zou, R.; Xin, Z.; Liao, G.; Huang, P.; Wang, R.; Qiao, Y. A Fire Segmentation Method with Flame Detail Enhancement U-Net in Multispectral Remote Sensing Images Under Category Imbalance. Remote Sens. 2025, 17, 2175. https://doi.org/10.3390/rs17132175
Zou R, Xin Z, Liao G, Huang P, Wang R, Qiao Y. A Fire Segmentation Method with Flame Detail Enhancement U-Net in Multispectral Remote Sensing Images Under Category Imbalance. Remote Sensing. 2025; 17(13):2175. https://doi.org/10.3390/rs17132175
Chicago/Turabian StyleZou, Rui, Zhihui Xin, Guisheng Liao, Penghui Huang, Rui Wang, and Yuhu Qiao. 2025. "A Fire Segmentation Method with Flame Detail Enhancement U-Net in Multispectral Remote Sensing Images Under Category Imbalance" Remote Sensing 17, no. 13: 2175. https://doi.org/10.3390/rs17132175
APA StyleZou, R., Xin, Z., Liao, G., Huang, P., Wang, R., & Qiao, Y. (2025). A Fire Segmentation Method with Flame Detail Enhancement U-Net in Multispectral Remote Sensing Images Under Category Imbalance. Remote Sensing, 17(13), 2175. https://doi.org/10.3390/rs17132175