Technical Note

Flood and Rice Damage Mapping for Tropical Storm Talas in Vietnam Using Sentinel-1 SAR Data

by
Pepijn van Rutten
1,2,
Irene Benito Lazaro
1,
Sanne Muis
1,3,
Aklilu Teklesadik
2 and
Marc van den Homberg
2,4,*
1
Institute for Environmental Studies (IVM), Vrije Universiteit Amsterdam, 1081 HV Amsterdam, The Netherlands
2
510, An Initiative of the Netherlands Red Cross, 2593 HT The Hague, The Netherlands
3
Deltares, 2629 HV Delft, The Netherlands
4
Faculty of Geo-Information Science and Earth Observation, University of Twente, 7522 NB Enschede, The Netherlands
*
Author to whom correspondence should be addressed.
Remote Sens. 2025, 17(13), 2171; https://doi.org/10.3390/rs17132171
Submission received: 19 April 2025 / Revised: 27 May 2025 / Accepted: 11 June 2025 / Published: 25 June 2025
(This article belongs to the Section Earth Observation for Emergency Management)

Abstract

In the Asia–Pacific, where rice is an essential crop for food security and economic activity, tropical cyclones and consecutive floods can cause substantial damage to rice fields. Humanitarian organizations have developed impact-based forecasting models to be able to trigger early actions before floods arrive. In this study we show how Sentinel-1 SAR data and Otsu thresholding can be used to estimate flooding and damage caused to rice fields, using the case study of tropical storm Talas (2017). The current most accurate global Digital Elevation Model FABDEM was used to derive flood depths. Subsequently, rice yield loss curves and rice field maps were used to estimate economic damage. Our analysis results in a total of 475 km2 of inundated rice fields in seven Northern Vietnam provinces. Flood depths were mostly shallow, with 2 km2 having a flood depth of more than 0.5 m. Using these flood extent and depth values with rice damage curves results in lower damage values than the ones based on ground reporting, indicating a likely underestimation of flood depth. However, this study demonstrates that Sentinel-1-derived flood maps with the high-resolution DEM can deliver rapid damage estimates, also for those areas where there is no ground-based reporting of rice damage, showing its potential to be used in impact-based forecasting model training.

Graphical Abstract

1. Introduction

Tropical storms and subsequent flooding are the two most prominent natural hazards in the Asia–Pacific [1]. Vietnam is very vulnerable to tropical storm-induced flooding because of its long coastline and low-lying densely populated coastal areas [2]. On average, five storms hit Vietnam every year, and since 1989, at least 15,000 people have died due to floods in the country [3,4]. Accounting for 15% of worldwide rice volume, Vietnam’s rice export is the third largest in the world [5]. Flooding due to tropical storms can cause large damage to rice fields, having devastating impacts on individual farmer’s livelihoods as well as on district and province levels [6].
Timely disaster response after a tropical storm makes landfall is crucial in reducing further damage and losses. A relatively recent development is anticipatory action, which focuses on acting even before the disaster hits. Anticipatory action makes use of impact-based forecasting (IBF), which looks beyond ‘what the weather will be’ to ‘what the weather will do’ and utilizes historical data and machine learning to predict the impact [1,7]. By prioritizing areas that are predicted to be impacted most, financial funds can be released days before the disaster happens [8]. Examples of anticipatory action are the evacuation of livestock and assets, and the installation of shelter-strengthening kits, as well as the early harvesting of mature crops [8]. The latter is centered in this study, which focuses on rice as a major crop in Vietnam. IBF of rice field damage caused by flooding has the potential to enable the early release of funds that can help impacted farmers before, during and after the disaster.
To ensure impact-based forecasting of rice damage has sufficiently high performance, including low false-positive and false-negative rates, IBF models need to be trained with structurally collected data on rice damage. During and directly after tropical storms, adverse weather conditions can make it challenging to perform fieldwork and collect data on the ground [5]. Data collection following guidelines like the Disaster and Needs Assessment takes three to ten days for emergency relief. It can take three months to obtain data on the physical costs for recovery and rehabilitation [9,10]. Moreover, the rice damage data are only available at an aggregated level.
Alternatively, flood damage on rice fields can be derived from other variables, by taking into account that rice damage depends on the cultivation stage during which the tropical storm made landfall, flood depth and flood duration [11]. Flood damage can then be expressed as a percentage of rice yield loss following flood damage curves [11].
Satellites can be used to detect flooding over vast areas of land that are difficult to access [5]. The twin Sentinel-1 A and B Synthetic Aperture Radar (SAR) satellites have been used for flood detection in this study. A large benefit over multispectral equipment is that the C-band (5.405 GHz) signal can penetrate through clouds, enabling Sentinel-1 to take clear images regardless of weather conditions, including during tropical storms. When the Sentinel-1 signal hits a body of water, the flat surface causes the signal to be reflected away from the sensor. This greatly decreases the signal that is retrieved by the satellite compared to other surfaces, hence distinguishing water from non-water pixels [12]. Each of the two Sentinel satellites has a return period of 12 days, resulting in a 6-day return cycle [13]. Classification methods like Otsu thresholding, k-nearest neighbors and support vector machine can then be used to map surface water [14]. After mapping of the flood area, flood depth can be estimated through the usage of a Digital Elevation Model (DEM). Examples of methodologies and tools that utilize DEMs to estimate flood depth include FwDET by Cohen et al. (2019), FLEXTH by Betterle & Salamon (2024), and INFLOS by Poterek et al. (2025) [15,16,17].
The goal of this study is to rapidly map large-scale flood and rice damage. To achieve this, we demonstrate a workflow using Earth Observation data, as these data have the potential to fill gaps in fieldwork observations. Earth Observation studies on flooding often include flood extent or flood depth estimates, but do not translate this to flood damage. The novel described methodology utilizes local rice damage curves to estimate economic damage from flood depth maps. If this workflow can be demonstrated, it can subsequently be repeated for many historical events and be used as structurally generated input for IBF model training.
As a case study for this, flood area and flood depth during the 2017 tropical storm Talas were estimated for seven provinces in Vietnam, utilizing Sentinal-1 data, Otsu thresholding and the FABDEM DEM. The economic damage to rice fields caused by flooding was estimated using damage curves [18].

2. Case Study Description

We selected tropical storm Talas as a case study due to its reported high damage on rice fields. According to data presented by the Viet Nam Disaster and Dyke Management Authority (VDDMA) that were gathered by governmental organizations and the Red Cross, tropical storm Talas caused 14 fatalities, damaged 2700 houses and a total of 49,635 hectares of rice fields and caused USD 109 million in damage [19]. Talas made landfall in the Northern Coastal area of Vietnam on 16 July 2017, impacting the Red River Delta, which is one of the two major rice-producing areas in Vietnam. Maximum sustained wind speeds were higher than 90 km/h and occurred in Ha Tinh, Nghe An and Quang Binh provinces [20]. Total precipitation reached more than 300 mm locally, with a maximum of 364 mm in Hoanh Son in the province of Ha Tinh [21]. Rainfall of more than 200 mm over a 24 h period was also reported. The moment of landfall coincided with the start of the Lua Mua rice cultivation season in July, when the young rice plants could be more easily submerged and were particularly vulnerable to the impact of flooding. The provinces that were included in the analysis were Hoa Binh, Ha Nam, Nam Dinh, Ninh Binh, Thanh Hoa, Nghe An and Ha Tinh. Their locations and the path of tropical storm Talas are shown in Figure 1.

3. Methodology

3.1. Input Data

In our study we use three main inputs, all derived from Earth Observation, to estimate flood depths and rice damage: (1) Sentinel-1 SAR data; (2) Digital Elevation Map (DEM); and (3) rice field areas. Sentinel-1 Ground Range Detected C-band images of the Talas floods on 18 July 2017 were downloaded from Google Earth Engine in log scaling. The images were preprocessed using the Sentinel-1 Toolbox, comprising thermal noise removal, radiometric calibration and terrain correction [22]. Additionally, a 3 × 3 Lee filter was used to reduce speckle or noise [23]. VV polarization was chosen over VH polarization as this was found to result in fewer false positives in flood detection [24]. To distinguish flooded areas from permanent waterbodies, a 30 m resolution land-use map of Vietnam presented by JAXA was used [25]. The DEM used for flood depth estimation was (Forest and Buildings removed Copernicus Digital Elevation Model) FABDEM version 1.2. FABDEM uses the Copernicus GLO-30 DEM and removes buildings and trees using machine learning [26]. The spatial resolution of FABDEM is 1 arc second (approximately 30 m at the equator). We selected FABDEM because it has been reported to be the most accurate global DEM in floodplain areas, such as the Red River Delta [27]. Its mean vertical error is −0.03 m and the 90% error was 4.90 m [27]. Usage of FABDEM ensures that flood depth can be rapidly mapped on a large scale, even for areas where local high-resolution, high-accuracy DEMs are not available. For rice field area, 10 m resolution maps of rice fields in 2017 based on time series Modis and Sentinel-1 data as presented by Han et al. (2021) [28] were used. Ground-reported data published by the VDDMA were used for comparison with our Sentinel-1-based flood detection and are available at https://tinyurl.com/9annnu45 (accessed on 16 April 2025).

3.2. Flood Area Mapping

The Sentinel-1 SAR data were used for flood area estimation. The processing included the following. Firstly, Otsu thresholding was used on the VV backscattering dB values of the Sentinel-1 imagery. Otsu thresholding is a method that minimizes variance within one subset of bimodally distributed data while maximizing variance between the two subsets [29]. Water pixels have low VV backscattering values, as water reflects the SAR signal away from the sensor. Otsu thresholding can then be used to determine the threshold between water, with low pixel values, and non-water, with high pixel values. Typical values of water pixels in VV backscattering are around −14.0 dB [30]. The threshold during the floods caused by tropical storm Talas indicated a similar value of −13.49 dB for the entire Sentinel-1 SAR image, covering all included provinces and part of the South China Sea. A binary water map was made accordingly. Secondly, terrain slope was calculated using FABDEM elevation data. Similar to Chi et al. (2022), pixels classified as water were removed in areas with a slope greater than 5%, as stagnant flooding was deemed unlikely on slopy terrain [31].
Method validation was performed by following the same process on Sentinel-1 images of typhoon Molave-induced flooding in the Vietnamese province of Quang Tri. This was performed as there was a Sentinel-1-derived flood depth map available for this event, but not for tropical storm Talas [31]. Results were compared visually with this published flood extent map that was generated using a similar methodology, but used multiple Sentinel-1 images and a less accurate DEM [31]. Although quantitative data were not available, visual comparison showed an almost identical flood area.

3.3. Flood Depth Mapping

The process of determining flood depth is shown schematically in Figure 2. It consists of 4 main steps: (1) reprojecting the DEM and binary flood extent map to the same projection, resolution and shape; (2) eroding the flood border elevation data; (3) interpolating the flood level within this border; (4) subtracting the DEM to obtain a final depth map. Previous studies have used similar approaches and methods [31,32].
To reduce the effect of noise on water depth estimation, a noise filter was used to filter out water areas smaller than one hectare. Similarly, non-water areas smaller than two hectares embedded within water areas were marked as water pixels. All datasets were prepared in the same projection, resolution and shape as part of step 1.
For step 2, the DEM elevation values corresponding with the flooded pixels at the inner boundary of the binary water map were extracted, because these boundary values were seen as a close approximation of the maximum water level. A common assumption is that the water level within this area would be flat in the case of smaller water areas [32]. However, it was found that some of the detected floods were of such an extent that this assumption would not be valid, as the elevation levels within one flooded area differed substantially. This was primarily the case when the flooded area extended towards the coastline, covering the natural elevation decline eastwards to the Pacific Ocean. For step 3, nearest-neighbor interpolation was used to take these gradual elevation changes into account. The closest neighboring DEM boundary value was used to fill the water area. Using multiple closest neighbors was considered but proved to be impractical as this method could not be applied to smaller water areas. For step 4, water depth was estimated by subtracting the DEM elevation values from the constructed water level.
It was common that the DEM was locally higher than the interpolated water level, resulting in a negative water depth. A higher-resolution DEM and flood extent map may help in reducing these errors. On the other hand, a higher-resolution analysis also increases the computational time needed. For IBF model training, large-scale damage estimations of multiple events are needed. Therefore, the trade-off between resolution and computational time was examined. To investigate how image resolution could influence the estimation of water depths, including negative water depths, a sensitivity analysis was performed on a smaller selected area by running the entire analysis for a 10, 30, 100 and 250 m resolution. The chosen resolution for the analysis is discussed in Section 4. Similar to the methodology of the FwDET tool, water areas with a negative water depth were replaced with a value of, in the case of this study, 0.001 m [33]. As a final step, permanent waterbodies as reclassified from the JAXA land-use map were removed from the water depth map, resulting in our overall flood depth map.

3.4. Rice Damage Estimation

Damage caused to rice fields depends on the rice cultivation stage, flood depth and flood duration and can be expressed as a percentage of yield loss [11]. Damage curves as determined for the Ha Tinh province by Giang & Vy (2021) were used to assign yield loss percentages to all flooded rice pixels according to the local flood depths and rice maps of Han et al. (2021) [18,28]. Due to their relative proximity, the Giang & Vy (2021) damage curves for Ha Tinh were used for all provinces included in this study. The authors report a good fit of their damage functions to the empirical damage data reported by farmers, with R2 values > 0.990 [18]. For storm Talas, the flood duration was difficult to estimate because of a lack of data following the 6-day return cycle of Sentinel-1. Examination of Sentinel-1 SAR imagery showed less saturated soils in the first available image after the first one (two days after the storm), namely eight days after Talas made landfall. Because a more precise duration indication was lacking, the median duration of the damage curves presented by Giang & Vy (2021) was taken, which was 4.5 days [18]. To estimate economic damage caused by the flood damage to rice fields, the percentual yield loss was multiplied by the average yield per hectare, which was 5.8 tons of rice per hectare, and adjusted for km2 [34]. To correctly calculate area, the raster was reprojected to the EPSG:8875 equal area projection. The number of tons of rice lost was multiplied by the price of Vietnamese rice per metric ton in the year of the flood, which was approximately USD 203 [35]. The VDDMA-reported impacted rice area, for which information on the percentage of damage was available, was used to calculate a reference economic damage estimate. As the negative flood values as well as the flood boundary depth of 0 (Figure 2) could lead to an underestimation of flood depth, economic damage was also calculated for flood depths of +0.2 m and +0.3 m. The former was picked because the rice damage curve starts at this depth, and the latter because the damage percentage corresponding to a 0.3 m depth was around 30%, which is largely the lowest damage percentage reported by the VDDMA. This also gave insight into the sensitivity of the economic damage estimate to flood depth estimations.

4. Results

4.1. Estimates of Flooded Rice Area

The generated flood area map was overlayed with the rice field map to calculate the area of affected rice fields. The results compared to the VDDMA ground data are shown in Table 1. The total rice area flooded in the included provinces was 475 km2, compared to 428 km2 in the VDDMA dataset, which did not report any impact in the Ninh Binh province. The most severely impacted province was Nam Dinh, while the least impacted province was Hoa Binh, in both this study as well as the VDDMA validation data. The percentage of flooded rice fields in relation to total rice fields per province is shown in Figure 3. For the calculation of the total rice field area per province, the rice field maps as presented by Han et al. (2021) were used [28].

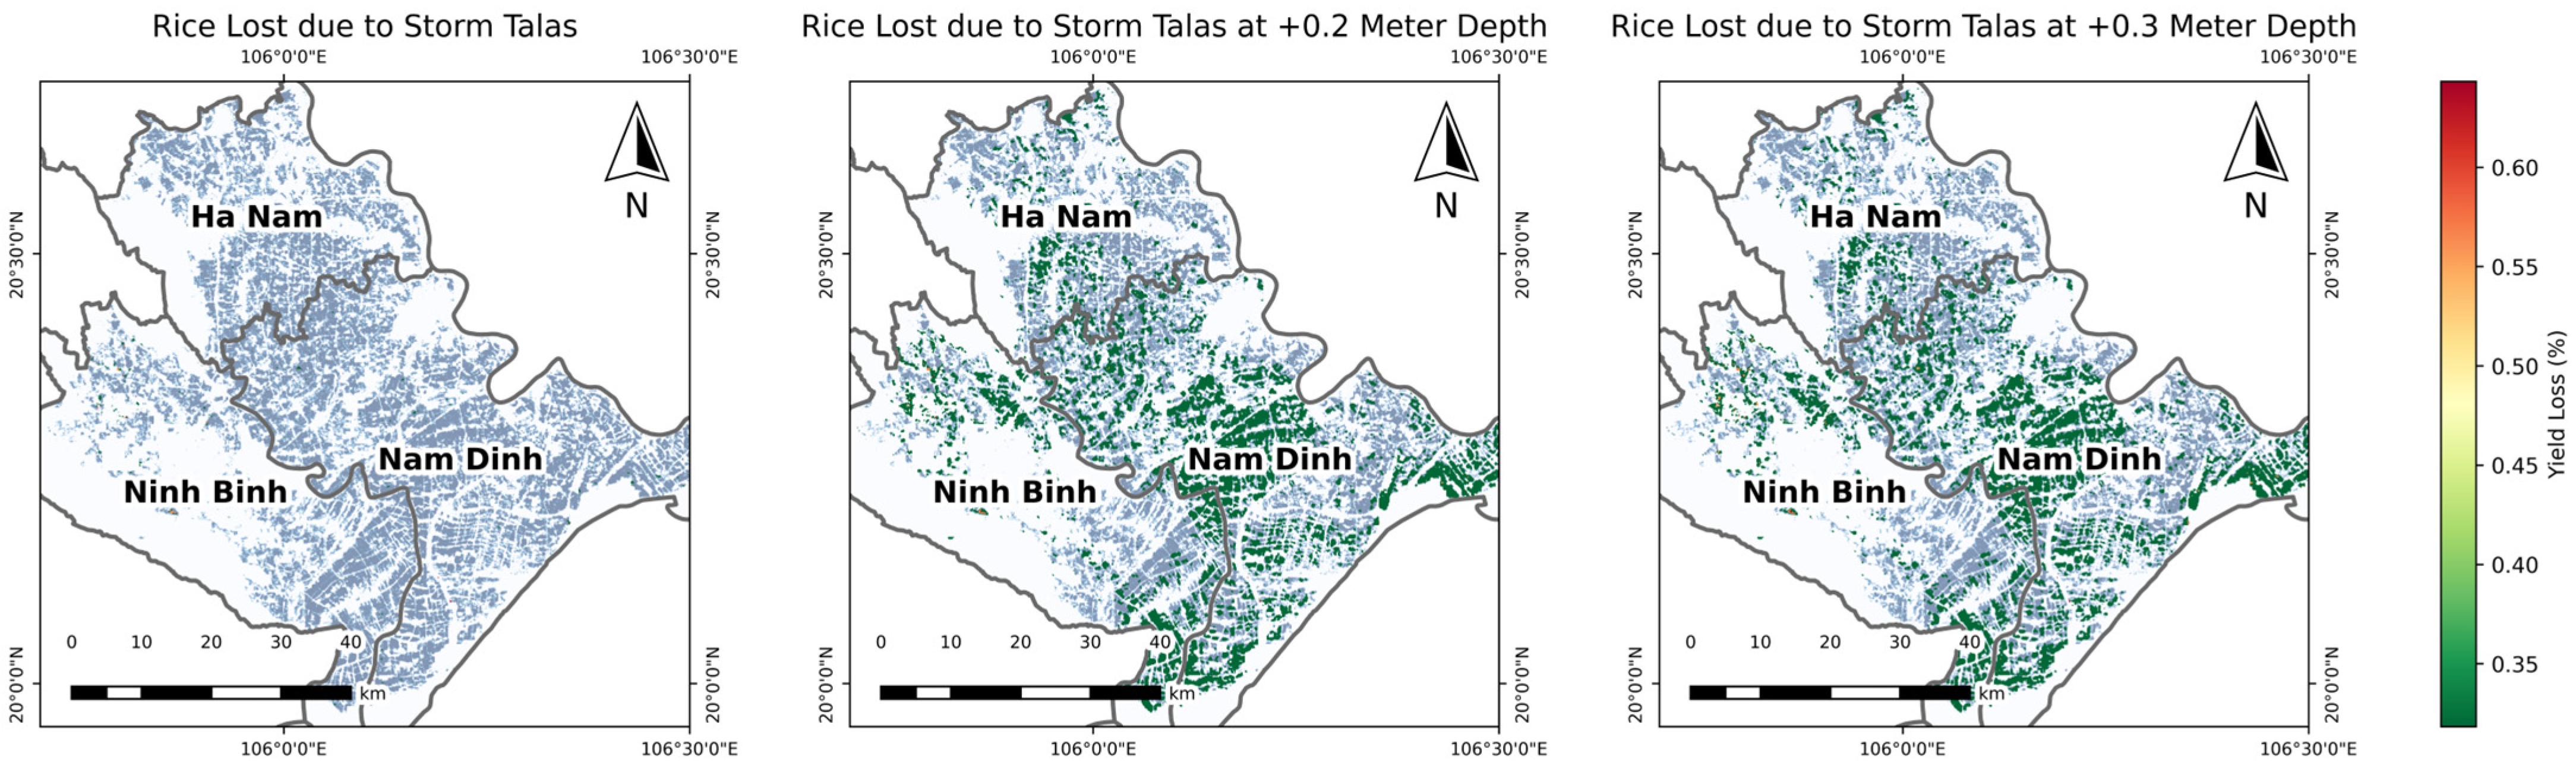
4.2. Flood Depth and Rice Damage

The sensitivity analysis showed that, out of the 10, 30, 100 and 250 m resolution analyses, the raster resolution resulting in the smallest area with negative water depths was the 100 m resolution. More importantly, the 100 m resolution did not show large differences in water depth estimation compared to the 10 m resolution (Sentinel-1) and the 30 m resolution (FABDEM). Because of these minimal differences in water depth and the faster computational time, 100 m resolution data were used for flood depth estimation. The estimated flood depths caused by tropical storm Talas were shallow, namely less than 0.5 m for most of the flooded area. Of the total flooded area, only 2 km2 had a flood depth of more than 0.5 m. The flood level +0.2 and +0.3 m analysis yielded an economic damage estimate closest to the VDDMA data, indicating that the flood level estimated was likely too shallow. Figure 4 shows the yield loss for Nam Dinh, Ninh Binh and Ha Nam, three of the provinces experiencing the highest percentage of rice yield loss. While Ninh Binh was the second most impacted according to the results presented, there was no impact listed in the VDDMA dataset. The economic damage per province is shown in Table 2.

5. Discussion

This study presented one of the first attempts to combine rice damage curves with Sentinel-1-derived flood maps for Vietnam. By combining Earth Observation data with rice damage curves, a rapid assessment of rice damage was performed for the case of tropical storm Talas (2017). While there was no reported rice damage in Ninh Binh, our analysis using Sentinel-1 images showed that more than 80 km2 was flooded. This shows that Sentinel-1 images have the potential to be used in addition to ground data.
The impacted rice area estimated with Sentinel-1 data was within a ±19% difference with the VDDMA ground data for the provinces of Nam Dinh, Ha Nam and Hoa Binh. Ha Tinh and Nghe An showed a larger underestimation of approximately 70%. One possible explanation for these underestimations is strong winds that can also damage rice [36], as these provinces were the only two to be exposed to wind speeds of more than 90 km/h [20], and the VDDMA data did not show the cause of rice damage. As Phan et al. (2019) mention, adverse weather conditions during ground surveys may also lead to errors in damage estimates [5]. Another cause of differences between the reported VDDMA ground data and this analysis is the uncertainty in flood duration, where the long return period of Sentinel-1 of 6–12 days is a limiting factor. These factors may explain the large difference in reported rice damage and analysis results in the Thanh Hoa province. Similar differences in statistical data and Sentinel-1-derived data have been observed before [5]. Another uncertainty regarding the impacted rice area is the estimation of the flood area from Otsu thresholding on Sentinel-1 data. As this method is binary, it may cut off some areas falsely classified as non-flooded or include areas that are falsely classified as flooded. Phan et al. (2019) report a 90.94% overall accuracy of their Otsu thresholding-derived water surface map with known permanent waterbodies, with the main limitation being the detection of small canals [5]. While a distinction can be made between water and non-water pixels, this involves higher errors for rice paddies than for rivers [37]. This is because the rice fields themselves may be partly submerged as part of wet cultivation. The backscattering is further influenced by the type of vegetation that is (partly) submerged as well as the water depth [38]. While misclassifications happen more often in paddy fields and should be considered when interpreting the results of this study, Tran et al. (2022) show that automatic Otsu thresholding on Sentinel-1 timeseries data is effective in classifying surface waters in paddy fields [37]. Considering multiple Sentinel-1 images covering a pre- and post-flood period may be a helpful addition in estimating and reducing misclassifications. While Otsu thresholding provided a threshold value often found for water areas (−13.49 compared to −14.0 reported for flooded rice fields in Indonesia by Wakabayashi et al. (2019) [30]), Otsu thresholding on a provincial level could furthermore result in a higher threshold value than for the entire region, as less water surface area with low backscatter values would be included for inland provinces.
Estimated flood depths were likely too shallow, as the resulting damage estimates derived from the flood level +0.2- and +0.3 m were the closest to the reported damage. To improve estimates, dikes and other important flood-preventing infrastructure can be considered in future research. Although FABDEM was the highest-resolution global DEM available at the time of writing, more accurate DEMs may help in acquiring correct flood depths, as the elevation differences in rice fields in the study areas are minimal and therefore require high vertical accuracy. Moreover, a higher-resolution DEM, or additional data on dikes, may provide local dike heights, bringing potential improvements in the elevation estimate of the outer flood border that was used to calculate flood depths, further improving flood depth estimates. With regard to depth estimates, the usage of nearest-neighbor interpolation for the water surface may not fully reflect the actual water levels and may lead to errors in the final damage estimation. FwDET [15], a water depth estimation tool widely used for emergency response, also uses similar nearest-neighbor interpolation for water surface estimation. However, other more sophisticated methodologies, such as hydrodynamic modeling, may provide more accurate depth estimates. For rapid damage estimations of many events, hydrodynamic modeling was considered out of scope because of its high computational cost requirement. Other available flood depth estimation tools, such as the INFLOS tool by Poterek et al. (2025) and the FLEXTH tool by Betterle & Salamon (2024), the former utilizing a natural-neighbor algorithm and the latter featuring a method to expand flood depth estimates into no-data regions, are computationally efficient and can potentially provide smoother and more realistic water surface estimations than the sometimes granular results from nearest-neighbor interpolation [16,17].
Another uncertainty lies in the usage of the rice damage curves as presented by Giang & Vy (2021) for the Ha Tinh province [18]. While more applicable to the specific region of North-central Vietnam than commonly used global damage functions for agriculture, such as Huizinga et al. (2017), the application of one local damage curve to all provinces included in this study ignores any possible spatial differences and therefore brings an uncertainty [39]. This is because rice varieties and growth stages in the seven provinces included in this study may have different susceptibility to damage caused by flooding. The damage curves used were also divided into three depth categories instead of a smooth depth function. This meant that most flood depths were binned into the lower categories of rice damage, creating a more granular result. A final limitation lies in the determination of flood duration due to a lack of Sentinel-1 images before, during and after the flood. The 6-day return cycle meant that a precise day for the start and end of the flood could not be determined from the Earth Observation data. As flood duration is an important factor in the final damage estimate, a shorter or longer flood duration than the median chosen in this study could affect the estimations significantly. It is therefore recommended to include flood duration in future research where possible.

6. Conclusions

The adoption of IBF models means there is an increasing need for accurate and consistent training data. By combining the globally available Earth Observation datasets of Sentinel-1 and FABDEM with local rice damage curves, we present a methodology for rapid large-scale rice damage estimation. The novel method presented in this study has the potential to be used on many (historical) events. These rice damage estimates can serve as an important addition to ground-reported data. As shown in this study, rice damage estimates can be made even for areas that were not included in the VDDMA ground dataset. By filling these data gaps, IBF model input data can be improved.
Overall, the total economic damage estimates were in line with damage reported by the VDDMA ground data for the flood depth +0.2 m and +0.3 m simulations, at 20.9 and 21.2 million US dollars, respectively. This shows flood depth was likely underestimated. The rice area impacted as shown in this study highlights there is a large potential for analyzing flooding with single-image Sentinel-1 data, and more provinces could be covered than by ground surveys, as well as more rapidly, while there are very few studies doing so in Vietnam. This study made a start in closing this gap. Future research on the estimation of rice damage caused by flooding can look at the possible underestimation of flood depths and can be expanded to cover a wider variety of crops. To improve estimates in future research, Earth Observation data can be used to estimate the growth stage of rice at the time of a disaster. When the results of this study have been verified on more tropical storm events, they have the potential to serve as an addition to ground survey damage reports and improve the training data of impact-based forecasting models.

Author Contributions

Conceptualization, P.v.R. and I.B.L.; methodology, P.v.R., I.B.L., M.v.d.H. and S.M.; software, P.v.R., A.T. and I.B.L.; validation, P.v.R.; formal analysis, P.v.R.; investigation, P.v.R.; data curation, P.v.R. and A.T.; writing—original draft preparation, P.v.R.; writing—review and editing, P.v.R., I.B.L., M.v.d.H., S.M. and A.T.; visualization, P.v.R.; supervision, I.B.L., M.v.d.H. and S.M. All authors have read and agreed to the published version of the manuscript.

Funding

This research received no external funding.

Data Availability Statement

The data used are publicly available. The Python 3.10 code used in this research is available on request from the corresponding author.

Conflicts of Interest

The authors declare no conflicts of interest.

References

  1. Yu, J.; Liu, J.; Baek, J.-W.; Fong, C.; Fu, M. Impact-Based Forecasting for Improving the Capacity of Typhoon-Related Disaster Risk Reduction in Typhoon Committee Region. Trop. Cyclone Res. Rev. 2022, 11, 163–173. [Google Scholar] [CrossRef]
  2. Nguyen, K.-A.; Liou, Y.-A.; Terry, J.P. Vulnerability of Vietnam to Typhoons: A Spatial Assessment Based on Hazards, Exposure and Adaptive Capacity. Sci. Total Environ. 2019, 682, 31–46. [Google Scholar] [CrossRef]
  3. Toan, D.V.; Trinh, N.Q.; Tien, P.V.; Toan, L.T.; Trung, L.T.; Tien, N.N. A statistical analysis of typhoons in the period 1951–2013 in vietnam’s coastal zones. Vietnam J. Mar. Sci. Technol. 2014, 14, 176–186. [Google Scholar] [CrossRef]
  4. Luu, C.; Von Meding, J. Analyzing Flood Fatalities in Vietnam Using Statistical Learning Approach and National Disaster Database. In Resettlement Challenges for Displaced Populations and Refugees; Asgary, A., Ed.; Sustainable Development Goals Series; Springer International Publishing: Cham, Switzerland, 2019; pp. 197–205. ISBN 978-3-319-92497-7. [Google Scholar]
  5. Phan, A.; Ha, D.N.; Man, C.D.; Nguyen, T.T.; Bui, H.Q.; Nguyen, T.T.N. Rapid Assessment of Flood Inundation and Damaged Rice Area in Red River Delta from Sentinel 1A Imagery. Remote Sens. 2019, 11, 2034. [Google Scholar] [CrossRef]
  6. Chau, V.N.; Cassells, S.; Holland, J. Economic Impact upon Agricultural Production from Extreme Flood Events in Quang Nam, Central Vietnam. Nat. Hazards 2015, 75, 1747–1765. [Google Scholar] [CrossRef]
  7. Kooshki Forooshani, M.; Van Den Homberg, M.; Kalimeri, K.; Kaltenbrunner, A.; Mejova, Y.; Milano, L.; Ndirangu, P.; Paolotti, D.; Teklesadik, A.; Turner, M.L. Towards a Global Impact-Based Forecasting Model for Tropical Cyclones. Nat. Hazards Earth Syst. Sci. 2024, 24, 309–329. [Google Scholar] [CrossRef]
  8. IFRC. Philippines: Typhoon Early Action Protocol Summary; Reliefweb: New York, NY, USA, 2021. [Google Scholar]
  9. Ninh, N.H.; Trung, V.K.; Hop, H.T.B. Country Assessment: Closer Look on the Current State of L&D in Southeast Asia; Asia-Pacific Network for Global Change Research: Kobe, Japan, 2020. [Google Scholar]
  10. Van Den Homberg, M.; Monné, R.; Spruit, M. Bridging the Information Gap of Disaster Responders by Optimizing Data Selection Using Cost and Quality. Comput. Geosci. 2018, 120, 60–72. [Google Scholar] [CrossRef]
  11. Shrestha, B.B.; Perera, E.D.P.; Kudo, S.; Miyamoto, M.; Yamazaki, Y.; Kuribayashi, D.; Sawano, H.; Sayama, T.; Magome, J.; Hasegawa, A.; et al. Assessing Flood Disaster Impacts in Agriculture under Climate Change in the River Basins of Southeast Asia. Nat. Hazards 2019, 97, 157–192. [Google Scholar] [CrossRef]
  12. Munawar, H.S.; Hammad, A.W.A.; Waller, S.T. Remote Sensing Methods for Flood Prediction: A Review. Sensors 2022, 22, 960. [Google Scholar] [CrossRef]
  13. European Space Agency. S1 Mission. Available online: https://sentiwiki.copernicus.eu/web/s1-mission#Sentinel-1-Mission (accessed on 10 June 2025).
  14. Yu, Z.; An, Q.; Liu, W.; Wang, Y. Analysis and Evaluation of Surface Water Changes in the Lower Reaches of the Yangtze River Using Sentinel-1 Imagery. J. Hydrol. Reg. Stud. 2022, 41, 101074. [Google Scholar] [CrossRef]
  15. Cohen, S.; Raney, A.; Munasinghe, D.; Loftis, J.D.; Molthan, A.; Bell, J.; Rogers, L.; Galantowicz, J.; Brakenridge, G.R.; Kettner, A.J.; et al. The Floodwater Depth Estimation Tool (FwDET v2.0) for Improved Remote Sensing Analysis of Coastal Flooding. Nat. Hazards Earth Syst. Sci. 2019, 19, 2053–2065. [Google Scholar] [CrossRef]
  16. Betterle, A.; Salamon, P. Water Depth Estimate and Flood Extent Enhancement for Satellite-Based Inundation Maps. Nat. Hazards Earth Syst. Sci. 2024, 24, 2817–2836. [Google Scholar] [CrossRef]
  17. Poterek, Q.; Caretto, A.; Braun, R.; Clandillon, S.; Huber, C.; Ceccato, P. INterpolated FLOod Surface (INFLOS), a Rapid and Operational Tool to Estimate Flood Depths from Earth Observation Data for Emergency Management. Remote Sens. 2025, 17, 329. [Google Scholar] [CrossRef]
  18. Giang, P.Q.; Vy, T.T. Will Climate Change Exacerbate the Economic Damage of Flood to Agricultural Production? A Case Study of Rice in Ha Tinh Province, Vietnam. Front. Environ. Sci. 2021, 9, 643947. [Google Scholar] [CrossRef]
  19. Viet Nam Disaster and Dyke Management Authority. (Phong Chong Thien Tai) Phụ Lục TỔNG HỢP THIỆT HẠI DO THIÊN TAI NĂM 2017. Available online: http://phongchongthientai.mard.gov.vn/FileUpload/2019-08/u4fxaVGl-kKJ8YgF2017-00.%20THIET%20HAI%20NAM%202017_tinh,%20tp_ngay%2031.12.2017.pdf (accessed on 12 March 2025).
  20. UNOSAT; UNITAR. Tropical Cyclone Talas-17: Path and Wind Speed Zones; UNITAR: Geneva, Switzerland, 2017. [Google Scholar]
  21. ESCAP/WMO; Typhoon Committee. Member Report Socialist Republic of Viet Nam; 10/2017; ESCAP/WMO Typhoon Committee: Hanoi, Vietnam, 2017. [Google Scholar]
  22. Google for Developers. Sentinel-1 SAR GRD: C-Band Synthetic Aperture Radar Ground Range Detected, Log Scaling. Available online: https://developers.google.com/earth-engine/datasets/catalog/COPERNICUS_S1_GRD#description (accessed on 12 March 2025).
  23. Rubel, O.; Lukin, V.; Rubel, A.; Egiazarian, K. Selection of Lee Filter Window Size Based on Despeckling Efficiency Prediction for Sentinel SAR Images. Remote Sens. 2021, 13, 1887. [Google Scholar] [CrossRef]
  24. Chen, S.; Jiang, M. Application Research of Sentinel-1 SAR in Flood Range Extraction and Polarization Analysis. J. Geo-Inf. Sci. 2021, 23, 1063–1070. [Google Scholar] [CrossRef]
  25. Phan, D.C.; Trung, T.H.; Truong, V.T.; Sasagawa, T.; Vu, T.P.T.; Bui, D.T.; Hayashi, M.; Tadono, T.; Nasahara, K.N. First Comprehensive Quantification of Annual Land Use/Cover from 1990 to 2020 across Mainland Vietnam. Sci. Rep. 2021, 11, 9979. [Google Scholar] [CrossRef]
  26. Neal, J.; Hawker, L. FABDEM V1-2; University of Bristol: Bristol, UK, 2023. [Google Scholar]
  27. Hawker, L.; Uhe, P.; Paulo, L.; Sosa, J.; Savage, J.; Sampson, C.; Neal, J. A 30 m Global Map of Elevation with Forests and Buildings Removed. Environ. Res. Lett. 2022, 17, 024016. [Google Scholar] [CrossRef]
  28. Han, J.; Zhang, Z.; Luo, Y.; Cao, J.; Zhang, L.; Cheng, F.; Zhuang, H.; Zhang, J.; Tao, F. NESEA-Rice10: High-Resolution Annual Paddy Rice Maps for Northeast and Southeast Asia from 2017 to 2019. Earth Syst. Sci. Data 2021, 13, 5969–5986. [Google Scholar] [CrossRef]
  29. Otsu, N. A Threshold Selection Method from Gray-Level Histograms. IEEE Trans. Syst. Man Cybern. 1979, 9, 62–66. [Google Scholar] [CrossRef]
  30. Wakabayashi, H.; Motohashi, K.; Kitagami, T.; Tjahjono, B.; Dewayani, S.; Hidayat, D.; Hongo, C. Flooded area extraction of rice paddy field in indonesia using Sentinel-1 SAR data. Int. Arch. Photogramm. Remote Sens. Spat. Inf. Sci. 2019, 42, 73–76. [Google Scholar] [CrossRef]
  31. Chi, V.T.; Quang, D.N.; Tinh, N.X.; Tanaka, H. Estimation of Floodwater Depth in Quang Tri Province Using Sentinel-1 Data. Tohoku J. Nat. Disaster Sci. 2022, 58, 99–104. [Google Scholar]
  32. Cian, F.; Marconcini, M.; Ceccato, P.; Giupponi, C. Flood Depth Estimation by Means of High-Resolution SAR Images and Lidar Data. Nat. Hazards Earth Syst. Sci. 2018, 18, 3063–3084. [Google Scholar] [CrossRef]
  33. Peter, B.G.; Cohen, S.; Lucey, R.; Munasinghe, D.; Raney, A.; Brakenridge, G.R. Google Earth Engine Implementation of the Floodwater Depth Estimation Tool (FwDET-GEE) for Rapid and Large Scale Flood Analysis. IEEE Geosci. Remote Sens. Lett. 2022, 19, 1501005. [Google Scholar] [CrossRef]
  34. U.S. Department of Agriculture. Vietnam Rice Area, Yield and Production. Available online: https://ipad.fas.usda.gov/countrysummary/Default.aspx?id=VM&crop=Rice (accessed on 1 November 2024).
  35. Vo, T.; Gilleski, S. Grain and Feed Update; U.S. Department of Agriculture: Hanoi, Vietnam, 2021.
  36. Masutomi, Y.; Iizumi, T.; Takahashi, K.; Yokozawa, M. Estimation of the Damage Area Due to Tropical Cyclones Using Fragility Curves for Paddy Rice in Japan. Environ. Res. Lett. 2012, 7, 014020. [Google Scholar] [CrossRef]
  37. Tran, K.H.; Menenti, M.; Jia, L. Surface Water Mapping and Flood Monitoring in the Mekong Delta Using Sentinel-1 SAR Time Series and Otsu Threshold. Remote Sens. 2022, 14, 5721. [Google Scholar] [CrossRef]
  38. Zhang, B.; Wdowinski, S.; Gann, D.; Hong, S.-H.; Sah, J. Spatiotemporal Variations of Wetland Backscatter: The Role of Water Depth and Vegetation Characteristics in Sentinel-1 Dual-Polarization SAR Observations. Remote Sens. Environ. 2022, 270, 112864. [Google Scholar] [CrossRef]
  39. Huizinga, J.; de Moel, H.; Szewczyk, W. Global Flood Depth-Damage Functions: Methodology and the Database with Guidelines; Publications Office of the European Union: Luxembourg, 2017. [Google Scholar]
Figure 1. Location of the provinces in the study area and the path of tropical storm Talas.
Remotesensing 17 02171 g001
Figure 2. Schematic overview of the methodology used for flood depth estimation using a binary flood raster, created using Otsu thresholding, and FABDEM elevation data. Blue squares represent water pixels, white squares represent non-water pixels, and cyan squares represent pixels for which the nearest-neighbor interpolation was performed. The numbers written within the squares represent the DEM elevation values. The steps to derive flood depth from the elevation of flood boundary pixels in combination with nearest-neighbor interpolation are similar to the method used by Chi et al. (2022), who use the Floodwater Depth Estimation Tool in Google Earth Engine, or FwDET-GEE [31,33]. Filtering steps such as noise removal were adjusted to the Sentinel-1 data of storm Talas.
Remotesensing 17 02171 g002
Figure 3. Flooded rice fields estimated from the Sentinel-1-derived flood area map as a percentage of total rice area as presented by Han et al. (2021) [28] per province.
Remotesensing 17 02171 g003
Figure 4. Maps showing the percentage of yield loss in the provinces of Nam Dinh, Ha Nam and Ninh Binh for three flood depth estimates.
Remotesensing 17 02171 g004
Table 1. Estimated flooded rice field area in km2 per province following the performed analysis, compared to reported flood rice area by VDDMA.
ProvinceReported Flooded Rice Area (km2)Estimated Flooded Rice Area (km2)Difference (%)
Nam Dinh214255+19
Ninh Binh-86-
Ha Tinh8126−68
Nghe An6117−72
Ha Nam4335−19
Thanh Hoa2856+100
Hoa Binh220
Total428475+11
Table 2. Results of economic damage analysis based on FABDEM and Sentinel-1 at three different flood depths, compared to VDDMA-reported rice damage per province in millions of US dollars.
ProvinceReported Rice Damage
(Million USD)
Estimated Rice Damage Flood Depth (m)Flood Depth + 0.2 (m)Flood Depth + 0.3 (m)
Nam Dinh9.5–14.40.0710.310.3
Ninh Binh-0.13.83.8
Ha Tinh2.9–4.80.11.61.6
Nghe An1.2–2.00.11.11.1
Ha Nam1.5–2.50.011.41.5
Thanh Hoa1.0–1.60.32.72.8
Hoa Binh0.06–0.090.010.10.1
Total16.2–25.40.0720.921.2
Disclaimer/Publisher’s Note: The statements, opinions and data contained in all publications are solely those of the individual author(s) and contributor(s) and not of MDPI and/or the editor(s). MDPI and/or the editor(s) disclaim responsibility for any injury to people or property resulting from any ideas, methods, instructions or products referred to in the content.

