Abstract
Gridded precipitation datasets (GPDs) have complemented gauge-based measurements in global hydrology by providing spatiotemporally continuous rainfall estimates for streamflow prediction. However, these datasets suffer from uncertainties in space and time, particularly in complex terrains like the Himalayas. Merging multi-GPDs offers a potential solution to reduce such uncertainties, but the actual contribution of the merged product to hydrological modeling remains underexplored in data-scarce and topographically complex regions. Here, we applied a gauge-independent merging technique called Signal-to-Noise Ratio optimization (SNR-opt) to merge three precipitation products: ERA5, SM2RAIN, and IMERG-late. The resulting Merged Gridded Precipitation Dataset (MGPD) was evaluated using the hydrological model (HYMOD) across three major river basins in the Central Himalayas (Koshi, Narayani, and Karnali). The results show that MGPD significantly outperforms the individual GPDs in streamflow simulation. This is evidenced by higher Nash–Sutcliffe Efficiency (NSE) values, 0.87 (Narayani) and 0.86 (Karnali), compared to ERA5 (0.83, 0.82), SM2RAIN (0.83, 0.85), and IMERG-Late (0.82, 0.78). In Koshi, the merged product (NSE = 0.80) showed slightly lower performance than SM2RAIN (NSE = 0.82) and ERA5 (NSE = 0.81), likely due to the poor performance of IMERG-Late (NSE = 0.69) in this basin. These findings underscore the value of merging precipitation datasets to enhance the accuracy and reliability of hydrological modeling, especially in ungauged or data-scarce mountainous regions, offering important implications for water resource management and forecasting.
1. Introduction
Precipitation is a key component of the water cycle and Earth’s surface energy balance. The measurement of precipitation and its spatio-temporal variability has improved with the introduction of satellite observations, which offer large-scale, frequent, near-real-time coverage [1]. However, satellite-based precipitation estimates still suffer from uncertainties that vary across space and time, leading to biased or inaccurate estimates, particularly in regions with complex climate and topography [2,3]. These uncertainties propagate into streamflow predictions through hydrological models, one of the most critical applications of precipitation data. Thus, accurate and high-resolution precipitation inputs are essential for generating reliable streamflow [4].
To meet this need, various gridded precipitation datasets (GPDs), including satellite-based and reanalysis products, have been developed to estimate rainfall over different spatial and temporal scales. For satellite products, PERSIANN, TMPA, CHIRPS, IMERG, CMORPH, AMSR-E, GPM, and MSWEP have made noteworthy advancements in spatial resolution, observation frequency, and estimation accuracy. They have been applied in climatological, hydrological, agricultural, and monitoring studies [5,6]. Similarly, reanalysis estimates such as ERA-40, ERA-Interim, ERA5, CFSR, JRA-55, and MERRA have provided long-term precipitation records through the integration of global climate models and sufficient meteorological variables [7,8].
Despite the improvement in the estimation accuracy, GPDs exhibit significant uncertainties. These uncertainties arise from multiple factors such as topography, instrument limitations, and data retrieval processes. Satellite estimates are affected by inadequate sampling, retrieval deficiencies, and limited sensitivity to electromagnetic signals, while reanalysis estimates inherit errors from meteorological inputs and forecast models [8,9]. For instance, Li et al. [10] demonstrated that total bias in IMERG is due to missed or falsely detected events, incorrect event start/end times and rainfall intensity errors. Zhang et al. [11] found inconsistent superiority among four individual GPDs—CHIRPS, TRMM, PERSIANN-CDR, and MSWEP at annual, seasonal, and monthly scales and spatial distribution in China. Similarly, Tang et al. [5] conducted an assessment of reanalysis products in China and concluded that ERA5 is acceptable at the daily scale but degrades at the hourly scale due to the inability to reproduce the peak time, magnitude, and variation in diurnal cycles. Additionally, a study over the Tibetan Plateau [12] showed that sparse sampling of soil moisture inputs and radio frequency interference in SM2RAIN-ASCAT result in long sampling intervals and reduced retrieval effectiveness.
Due to these uncertainties, the direct application of GPDs in hydrological models for streamflow simulation remains challenging [13]. Satellite and reanalysis products are inherent, with more than 70% random error among total precipitation errors [14], and relative errors in precipitation can increase significantly (up to 3 times) when transformed to corresponding relative errors in streamflow [15]. Nikolopoulos et al. [16] demonstrated that the accuracy of flood simulations using satellite precipitation datasets strongly depends on the resolution of the satellite product. Furthermore, the amplification of errors in flow simulation depends on the spatial scale of the hydrological model and size of the river basin, adding further complications to their utility [17]. For instance, comparisons among the performance of the ERA-Interim, MERRA-2, and CFSR in the hydrological cycle showed large discrepancies between the reanalysis estimates and the observed data [18]. These inconsistencies in accuracy prove the complementary behaviour of GPDs across time and space.
To address these issues and take advantage of the complementary strengths of different GPDs, different forms of multi-source merging methods have been developed [19,20]. The principle of such methods is to combine information from independent sources to reduce random errors and improve overall predictions [21]. Merging approaches can be divided into two categories: gauge-dependent and gauge-independent.
Gauge-dependent approaches, such as machine learning [22], Dynamic Bayesian Model Averaging (DBMA) [23], and Multi-Source Weighted-Ensemble Precipitation (MSWEP) [24], typically use gauge observations such as the benchmark for estimating the correct individual weight. However, the gauge observations are theoretically biased due to random errors in the observations themselves [25,26]. Additionally, low gauge network density can introduce bias up to 40% when correcting the GPD’s rain/no-rain classification error.
In the gauge-independent category, different methods such as Triple Collocation (TC) [27], the Double Instrumental Variable method (IVd), the Three-Cornered Hat technique [28], and Quadruple Collocation [29] have been developed to estimate the error covariance matrix in the absence of ground truth. Among these, TC is the most widely adopted due to its ability to assess the accuracy of three independent datasets without requiring gauge observations. TC methods have been validated using high-density gauge networks and have demonstrated their utility in multi-source merging [30,31,32]. For instance, Lyu et al. [33] applied the TC method for merging the CMORPH, PERSIANN, and ERA5 over Mainland China and found that this technique surpassed the individual GPD product and popular Dynamic Bayesian model averaging (DBMA)-based merging approach. Similarly, Dong et al. [32] demonstrated that TC-based merging outperformed ERA-Interim, PERSIANN-CDR, and SM2RAIN in Europe. Although there has been a surge of interest in TC, its limitations—requirement for exactly three datasets, a unit-sum constraint on weights, and assumption of zero error cross-correlation—can hinder its effectiveness in precipitation magnitude and following streamflow simulation [21,34,35,36].
As an alternative solution to TC and Signal-to-Noise Ratio Optimisation (SNR-opt) [21] has emerged as a more flexible solution that improves merging accuracy [37]. SNR-opt relaxes the unit-sum constraint on weight and addresses non-zero error cross-correlation by solving the full spectrum of the error covariance matrix. SNR-opt has demonstrated superior performance compared to TC in regions of High Mountain Asia (HMA), where precipitation estimates are uncertain due to complex terrain and sparse gauge networks [34].
Despite these advancements in precipitation prediction, their applicability and benefits in hydrological simulations across South Asia remain underexplored. In particular, no studies to date have systematically evaluated whether improvements in precipitation merging translate into better hydrological performance across the region’s diverse climatic and topographic conditions. Most existing research continues to focus on simulating individual GPDs, without assessing the added value of merged precipitation products in hydrological modelling [38,39]. Motivated by this gap, we aim to (i) re-state and evaluate an SNR-opt based multi-GPD merging scheme and (ii) force the merged gridded precipitation product (MGPD) into the HYMOD model to assess streamflow simulation improvements relative to individual GPDs. This study provides valuable insights for improving hydrological predictions in ungauged or sparsely gauged regions.
The remainder of this study is arranged as follows. First, the methodology section explains the merging approach in detail. This is followed by an introduction to GPDs and MGPD, which are evaluated using real-world datasets through two distinct evaluation frameworks. The study then examines the effectiveness of the proposed method within these frameworks, with particular emphasis on identifying daily precipitation events and minimising magnitude-related errors, as presented in the results section. The discussion interprets these findings, contrasts them with prior research, and proposes possible enhancements. Lastly, the conclusion highlights the main contributions and suggests avenues for future investigation.
2. Materials and Methods
2.1. Study Area
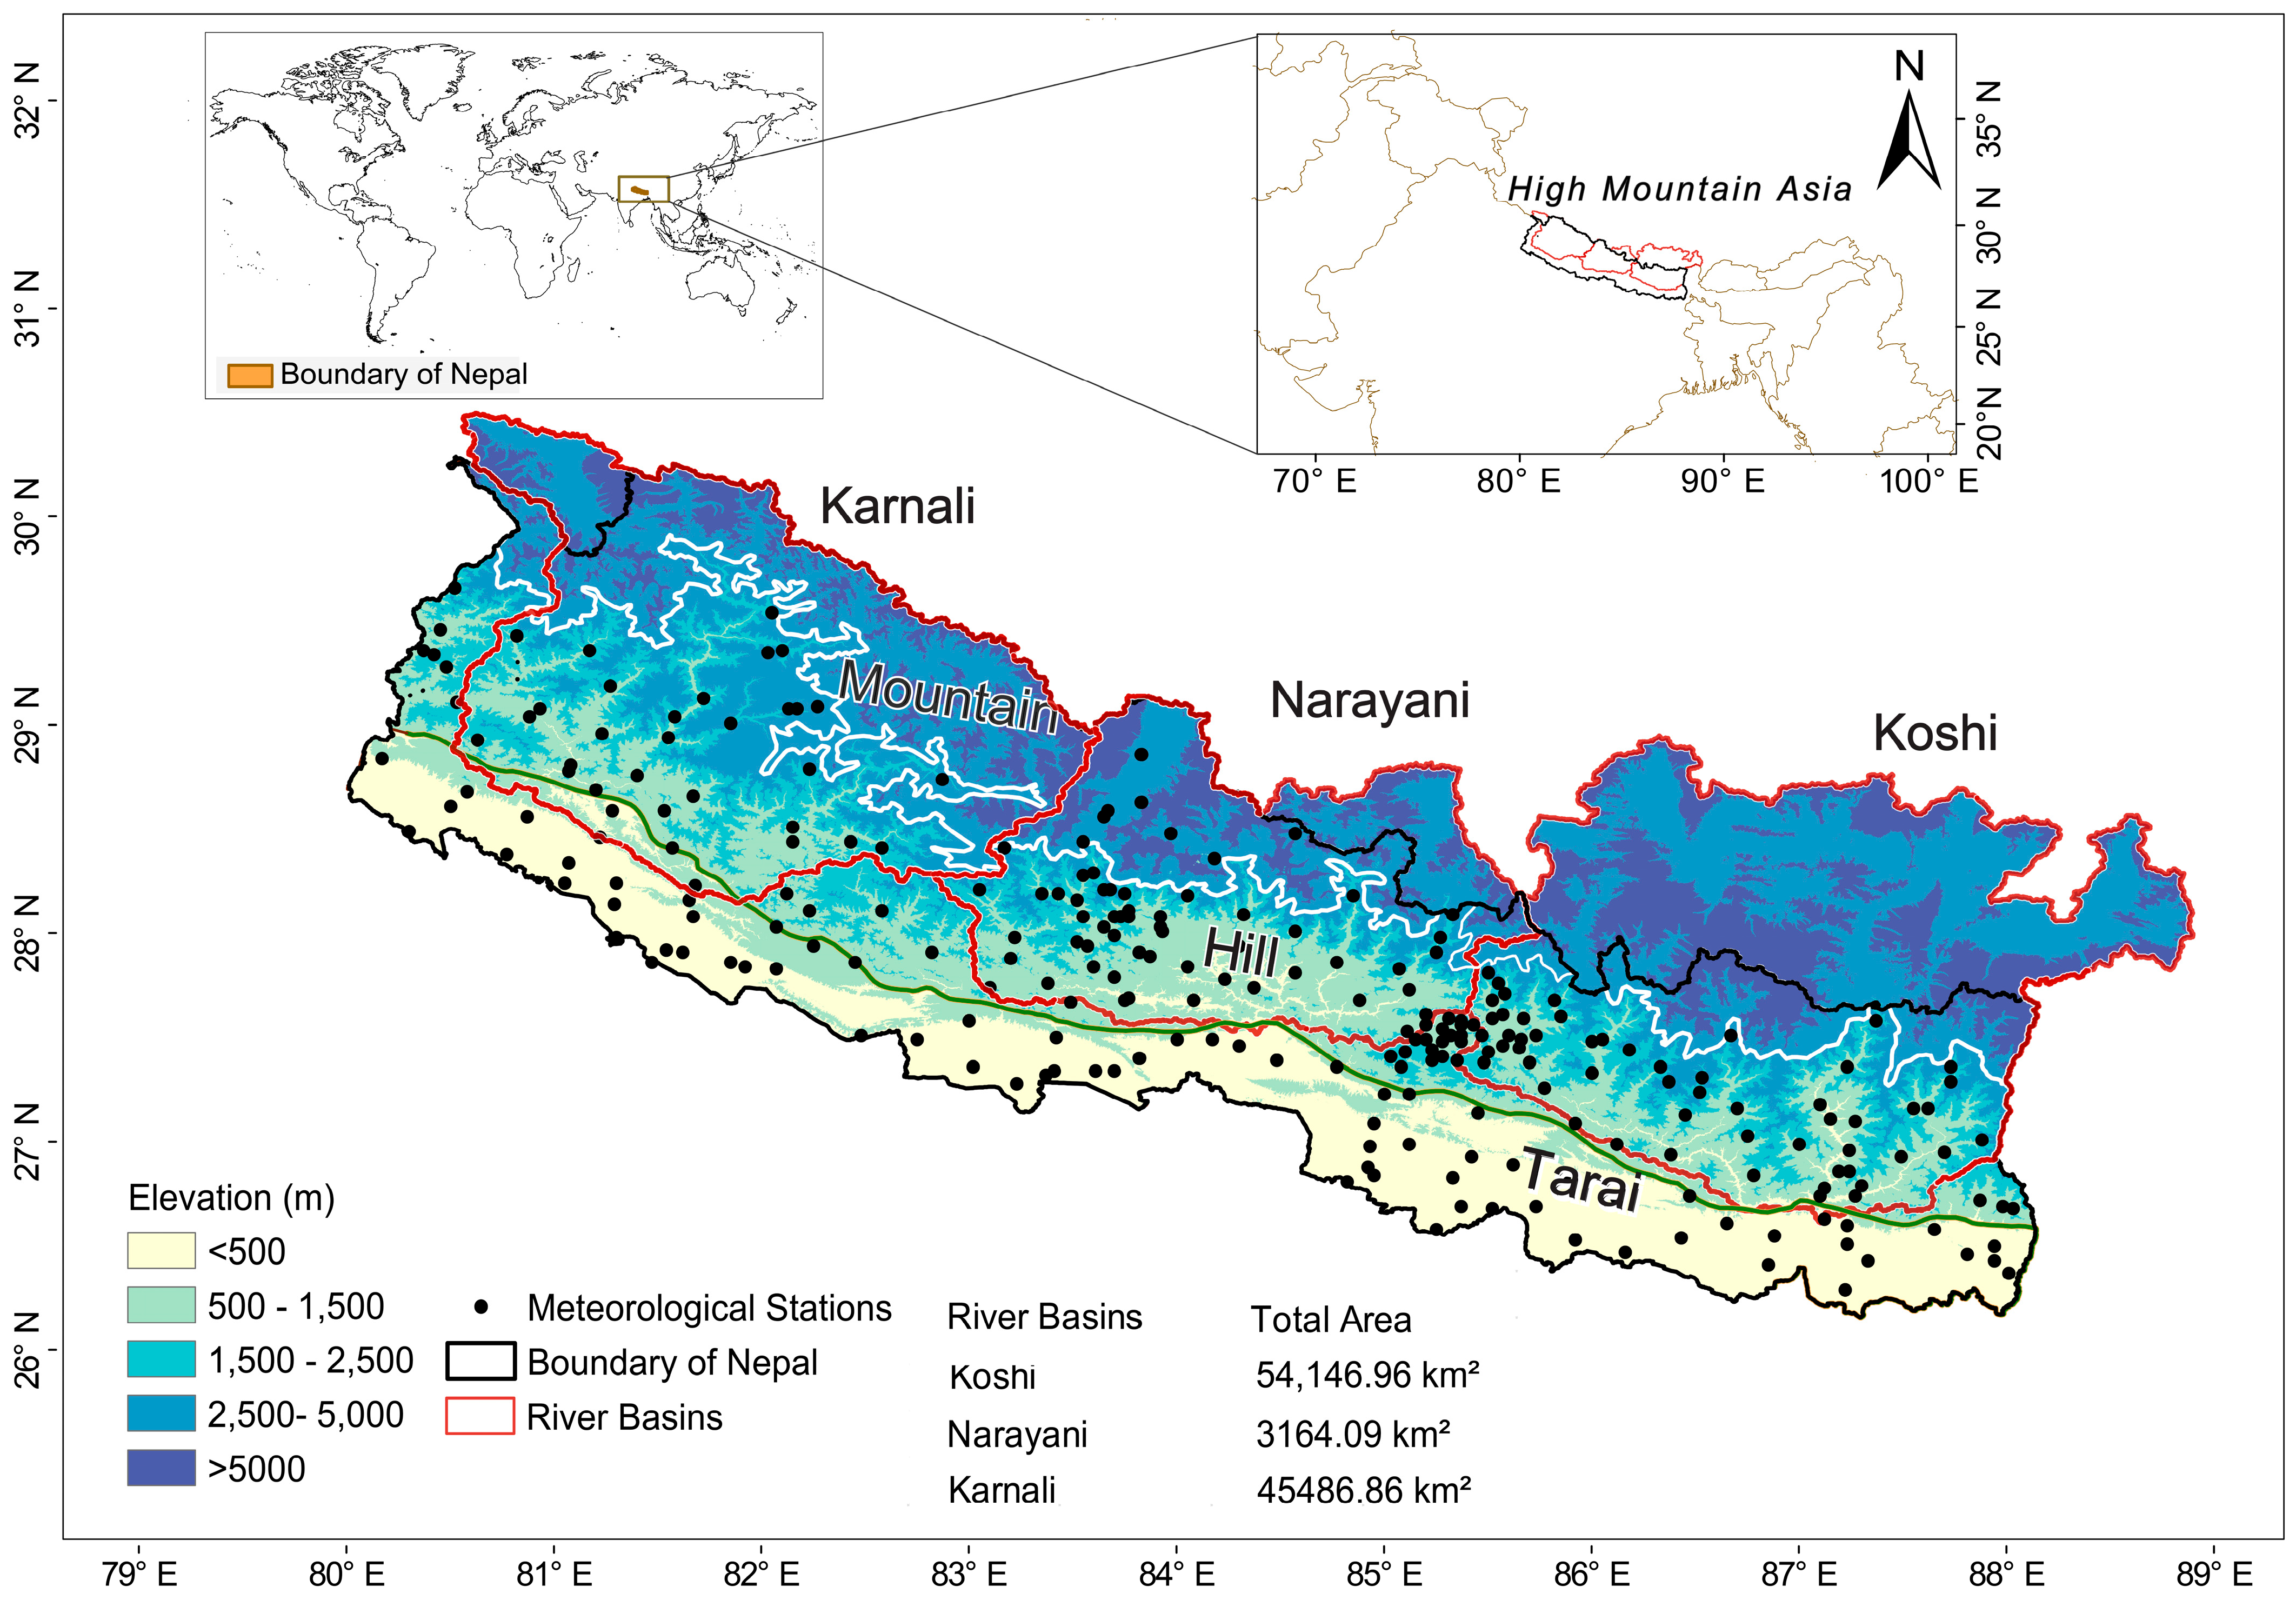
Nepal (Figure 1) was used as the study area to evaluate the efficacy of the MGPD and its application for streamflow prediction. Nepal lies in the southern region of the Central Himalayas (80~88°E and 26~30°N), with a significant change in altitude and terrain, ranging from the Himalayan, Hilly, and Tarai regions. The Himalaya region is covered with snow and glaciers, whereas Hilly and Tarai are mostly covered by forest and agricultural land [40]. The Himalayan region acts as a barrier, which largely impedes humid air mass circulation, resulting in most of the precipitation occurring on the southern slope and less precipitation in the North [41]. The country receives two different rainfall systems throughout the year, with monsoonal rainfall through the eastern side and winter season rainfall through the western side of the country. Major rainfall in the form of a monsoon occurs during the summer season.
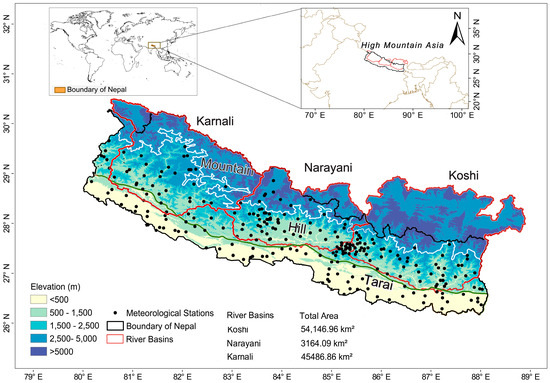
Figure 1.
Nepal; study area (WGS 1984 projection) across the Central Himalayas illustrating the Koshi, Narayani, and Karnali River basins and physiographic zones. The map outlines catchment areas and meteorological stations and variations in the elevation of Nepal.
Hydrological validation was performed over three major river basins of the country —Koshi, Narayani, and Karnali—with areas of 54,146.96 km2, 3164.09 km2, and 45,486.86 km2, respectively. These basins originate from the Himalayas, traverse through the physiographic zones of Nepal, and merge with the Ganges River of India. While the Koshi and Karnali basins are transboundary, Narayani is contained within Nepal. The average rainfall and temperature of the basin are (1800 mm, 16 °C), (1795 mm, 16.92 °C), and (1479 mm, 19 °C), respectively, for Koshi, Narayani, and Gandaki basins. In addition, the average streamflow for basins is 1525 m3/s, 1583 m3/s, and 1369 m3/s, respectively.
2.2. Data
2.2.1. Gridded Precipitation Datasets (GPDs)
Merging works on the principle of taking advantage of complementary strengths among the input, which means independent products in parent data. Previous studies have accepted relative independence among the reanalysis, RS-retrieved precipitation products, and soil-moisture estimation [14,26]. Hence, ERA5, SM2RAIN, and IMERG-late run (i.e., IMERG-late) were selected based on their distinct sourcing methods, spatiotemporal resolutions, and noise profiles [42,43].
Three collocated precipitation datasets in a triplet need to be of the same spatial scale and temporal resolution. So, all GPDs with fine spatial resolution were resampled to the same 0.25° spatial resolution (to match ERA5) and aggregated to a daily time scale. The characteristics of each precipitation product are summarized in Table 1.

Table 1.
Summary of the three precipitation products evaluated in this study.
2.2.2. Gauge Observation
For eight years (2008 to 2015), daily gauged data were collected from the Department of Hydrology and Meteorology (DHM), Government of Nepal. A total of 253-gauge stations were selected based on different climate classes and elevation zones, which facilitates the reliability of MGPD. DHM maintains all of the selected gauge records through extreme, internal, and spatial consistency checks.
2.3. Methodological Framework
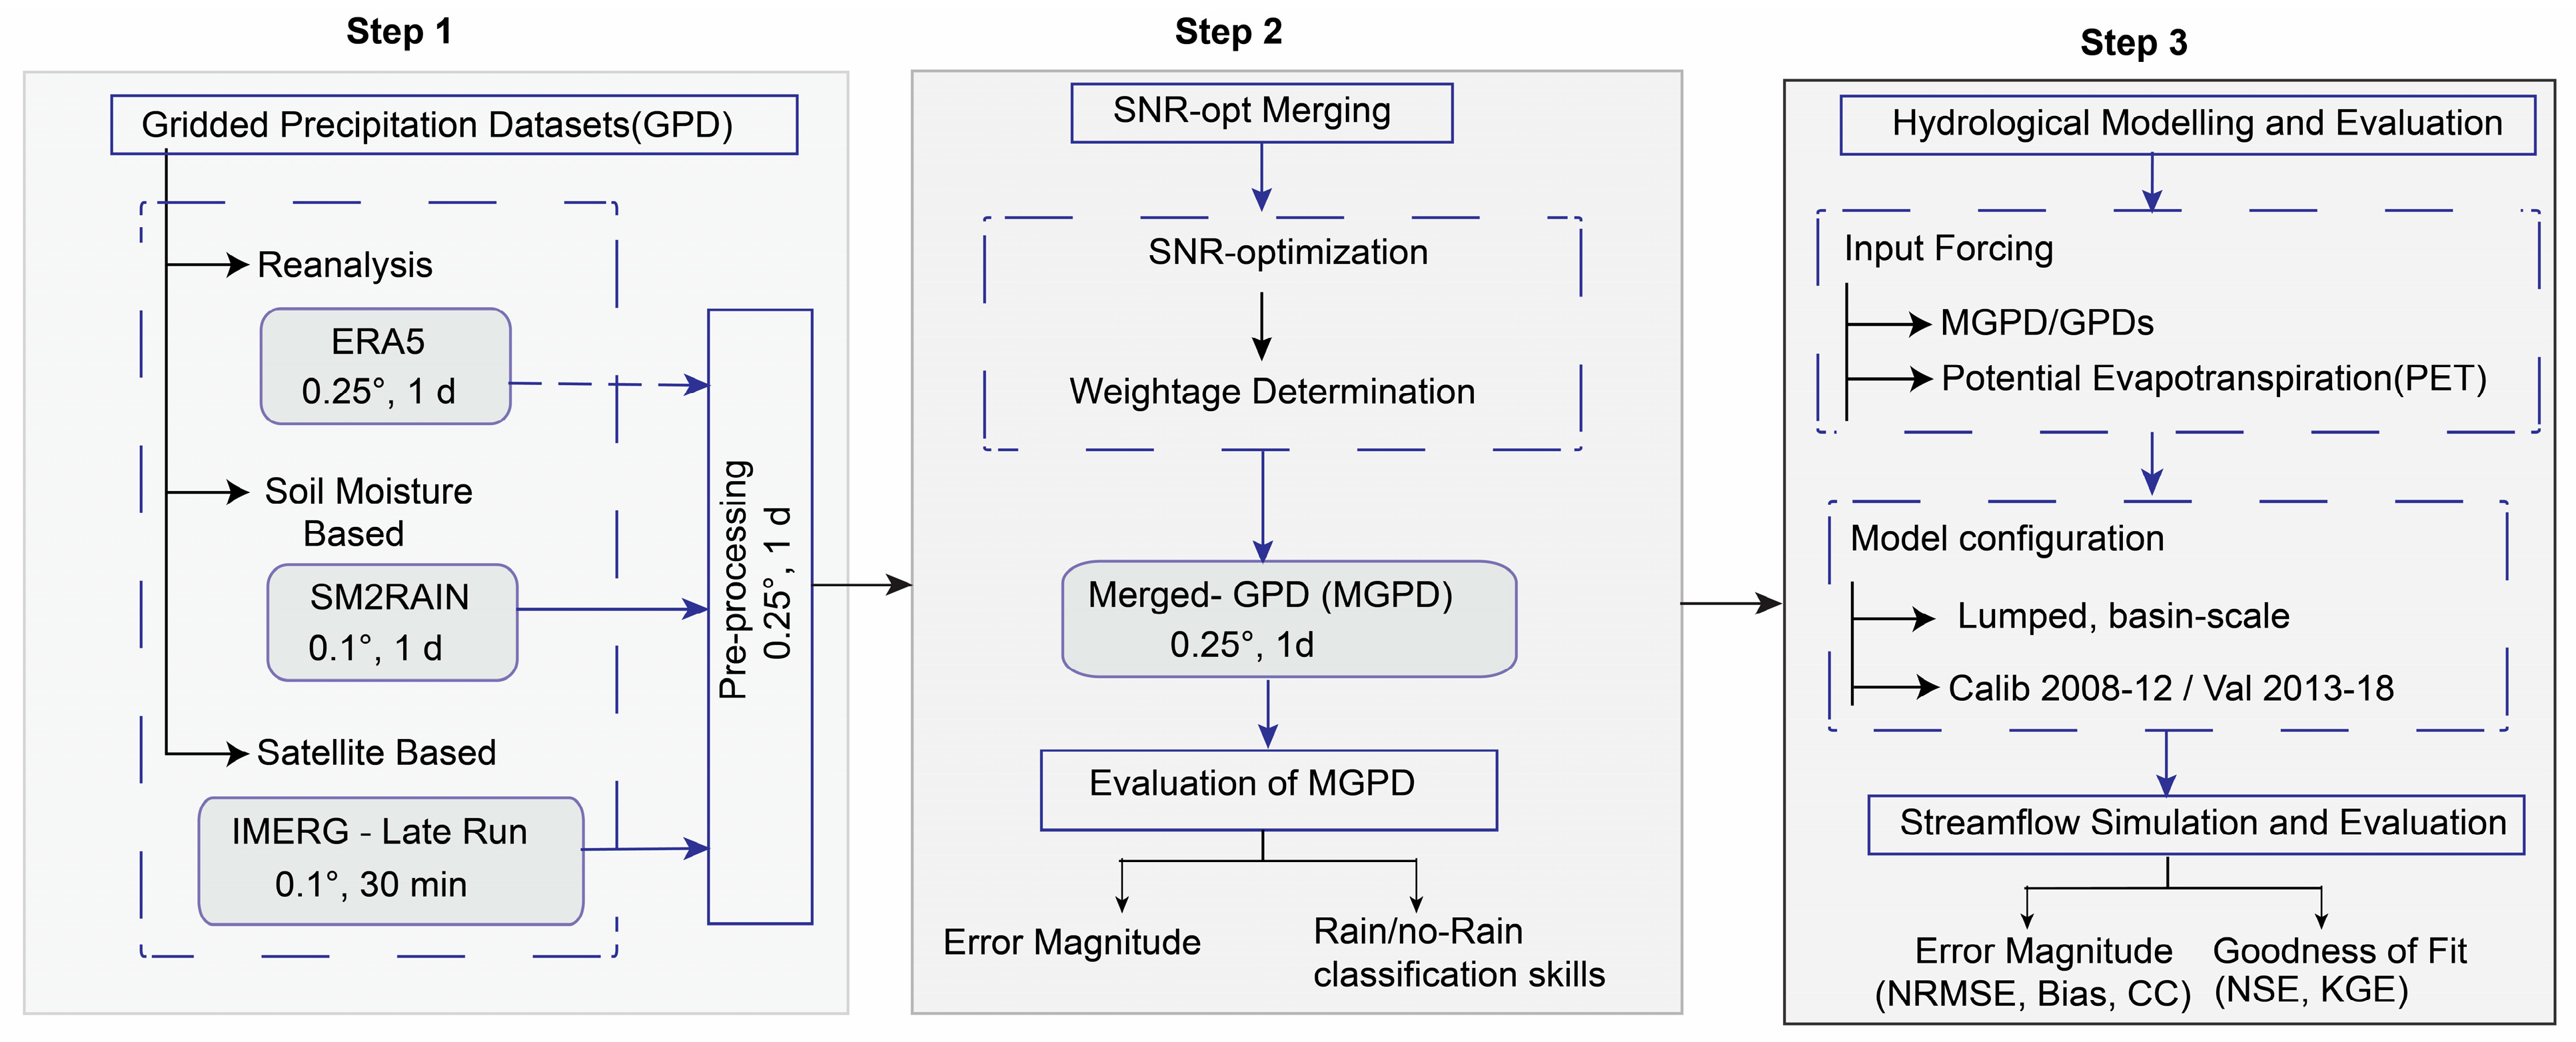
The methodological framework illustrating the entire workflow is outlined in Figure 2, organized into three sequential steps.
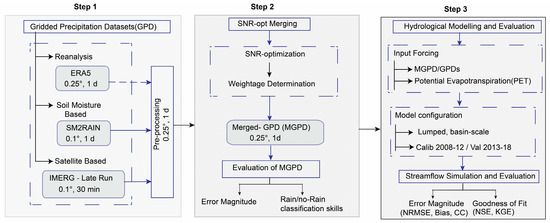
Figure 2.
Methodological framework for precipitation merging and hydrological validation.
2.3.1. Merging Method
Here, the vectors and matrices are denoted in bold-italic (x, u, C, N), scalars in italic (y, β) and functions/operators in upright roman (min, , , diag, abs).
SNR Optimization (SNR-Opt)
Let us assume are the merging weights that minimize the MSE of prediction , where is a column vector of the parent products. The weights can be obtained by solving the following optimization problem:
The solution to this problem is given by
In the general case, relates to the scalar (zero mean) as with multiplicative and additive factors , and a zero-mean additive noise . Importantly, while and are column vectors of size , is a scalar (or equivalently, a column vector of size 1). Their lengths are effectively canceled out through matrix multiplication, simplifying both the equations and their expansions.
After debiasing in advance using , we find that and , indicating that the optimum weights depend upon the matrix of noise to signal ratios . This equation can be succinctly expressed as
Note that this derivation presumes that has a zero mean and has been pre-adjusted to have a zero-mean predicting , with this integrated method improving accuracy by incorporating a reliable mean value sourced from authoritative data such as that from reanalysis.
This method outperforms traditional TC-based weighted averages by more effectively reducing the mean squared error. While it requires knowledge of , the results are less sensitive to . Even with a roughly estimated , SNR-opt demonstrates superior performance in minimizing the mean squared error [21].
SNR Estimation
For SNR-opt-based merging, it is essential to estimate the SNR matrix and the scaling factor without knowing the true value. This estimation uses an empirical covariance matrix of , , derived from measurements of the parent products (with additive biases removed). Assuming is known, can be approximated as
The estimation of and involves solving a 1-norm-minimization problem to minimize (not zero) the off-diagonals of , produced by the solution , subject to the diagonals of that are positive. This process is called SNR estimation (SNR-est):
where represents the Hadamard (elementwise) product. Where is a column vector of ones. is the identity matrix. extracts the diagonal elements of a matrix. applies the absolute value elementwise.
Assuming uncorrelated and identically distributed errors, we approximate I for some β, and A suitable initial value for can be obtained by scaling the leading eigenvector of by the square root of its corresponding eigenvalue. The initial estimate is then refined through the following projected sub-gradient descent steps, as follows:
Gradient descent step:
Projection step:
where is the step size and for this study, parameters were set to to ensure any of the initialized diagonals of are positive and . Note that because the optimization concludes a projection step as outlined in Equation (8), the convergence of exhibits reduced sensitivity to a β multiplier smaller than 1.
The SNR-est method overcomes key limitations of traditional techniques such as TC. While the TC method assumes the off-diagonal elements of the error covariance matrix to be zero, often leading to unrealistic diagonal outcomes (e.g., negative error variances), the SNR-est method avoids such infeasible solutions. By minimizing the off-diagonal elements while preserving positive diagonal entries, SNR-est produces more robust and physically meaningful results. More details of SNR-est can be found in [21].
We utilized three precipitation products, ERA5 (reanalysis), SM2RAIN (soil-moisture-based), and IMERG-late (satellite-based), and merged them using SNR-est and SNR-opt.
2.3.2. Hydrological Model
HYMOD is a simple lumped daily hydrological model based on the theory of excess infiltration [46]. It requires precipitation and potential evapotranspiration (PET) as inputs, has a parsimonious structure, and has been successfully applied over catchments worldwide for streamflow modelling [47,48,49]. The model passes through two phases, calibration and validation, where calibration requires only five parameters (Table 2) [47].
Table 2.
Parameters for hydrological modeling.
For each basin, we calibrated the model for 2008 to 2012 and validated it for 2013 to 2018. We used basin-averaged precipitation derived from MGPD and its parent GPD product, along with a common PET input for all simulations. PET was calculated using the Oudin formula, a simple temperature-based method [50]. For this calculation, we used daily gridded mean air temperature data obtained from the ERA5 reanalysis dataset. The initial model parameters and their respective ranges were selected based on guidance from previous studies [49,50].
2.4. Parameters for Assessment of Merged Product
The merged precipitation product (MGPD) and parent datasets (ERA5, SM2RAIN, IMERG-late) were evaluated using three complementary approaches: error magnitude, precipitation detection, and streamflow simulation (Table 3). The details of extreme precipitation index used for error magnitude evaluation are summarized in Table 4.
Table 3.
Performance criteria for satellite precipitation merging and streamflow simulation.
Table 4.
Parameters of ETCCDI for extreme precipitation evaluation.
2.4.1. Error Magnitude
Daily-scale comparisons were performed between gridded precipitation datasets (GPDs) and ground-based rain gauge data (2008–2015) using Root Mean Square Error (RMSE), Kling–Gupta Efficiency (KGE), and bias as evaluation metrics (Table 3 (a)). Only grid cells containing at least one rain gauge were evaluated, totalling 253 stations. Raster values were extracted to point gauge locations using the nearest neighbour method [51]. In cases where a grid cell contained two or more gauges, the average of the station values was used for representation. Spatial maps and frequency distributions of evaluation metrics (RMSE) were then generated to visualize regional error patterns, and the improvement in MGPD over parent datasets was quantified by calculating the change in RMSE (ΔRMSE). For KGE and bias, we presented only violin plots to conserve space and maintain visual clarity.
Furthermore, for the assessment of extreme precipitation, eight different climate indices defined by the Expert Team on Climate Change Detection and Indices (ETCCDI) [52] were evaluated (Table 4). These indices evaluate extreme precipitation and its projected changes [53].
2.4.2. Rainfall Classification
The classification capability of MGPD and GPDs is defined as their ability to correctly identify rainfall occurrence and non-occurrence. This capacity was evaluated using categorical metrics (Table 3 (b)), including Probability of Detection (POD), False Alarm Ratio (FAR), Frequency Bias (FB), and Critical Success Index (CSI).
Daily precipitation occurrences, based on a threshold of ≥1 mm, were compared between (M)GPDs and the gauge data to calculate hits, misses, and false alarms. The distributions of these categorical metrics were visualized using violin plots, which effectively capture density trends, interquartile ranges, and median values.
2.4.3. Streamflow Simulation
Simulated streamflow from the HYMOD model for three major Himalayan basins (Koshi, Narayani, Karnali) was evaluated against observed discharge data at the basin outlets. Model performance was evaluated using five metrics (Table 3 (c)) grouped as goodness-of-fit (Nash–Sutcliffe Efficiency (NSE), Kling–Gupta Efficiency (KGE)), Error magnitude (Normalized Root Mean Square Error (NRMSE), Bias) and temporal correlation (Correlation Coefficient (CC)). These measurements provide a comprehensive comparison of precipitation products in terms of accuracy, bias, and overall hydrological reliability.
3. Results
3.1. Evaluation of the Merged Precipitation Product
3.1.1. Error Magnitude Assessment
The performance of the SNR-opt-based merged precipitation product (MGPD) was evaluated against three satellite-based datasets (ERA5, SM2RAIN, and IMERG-late) in terms of magnitude error
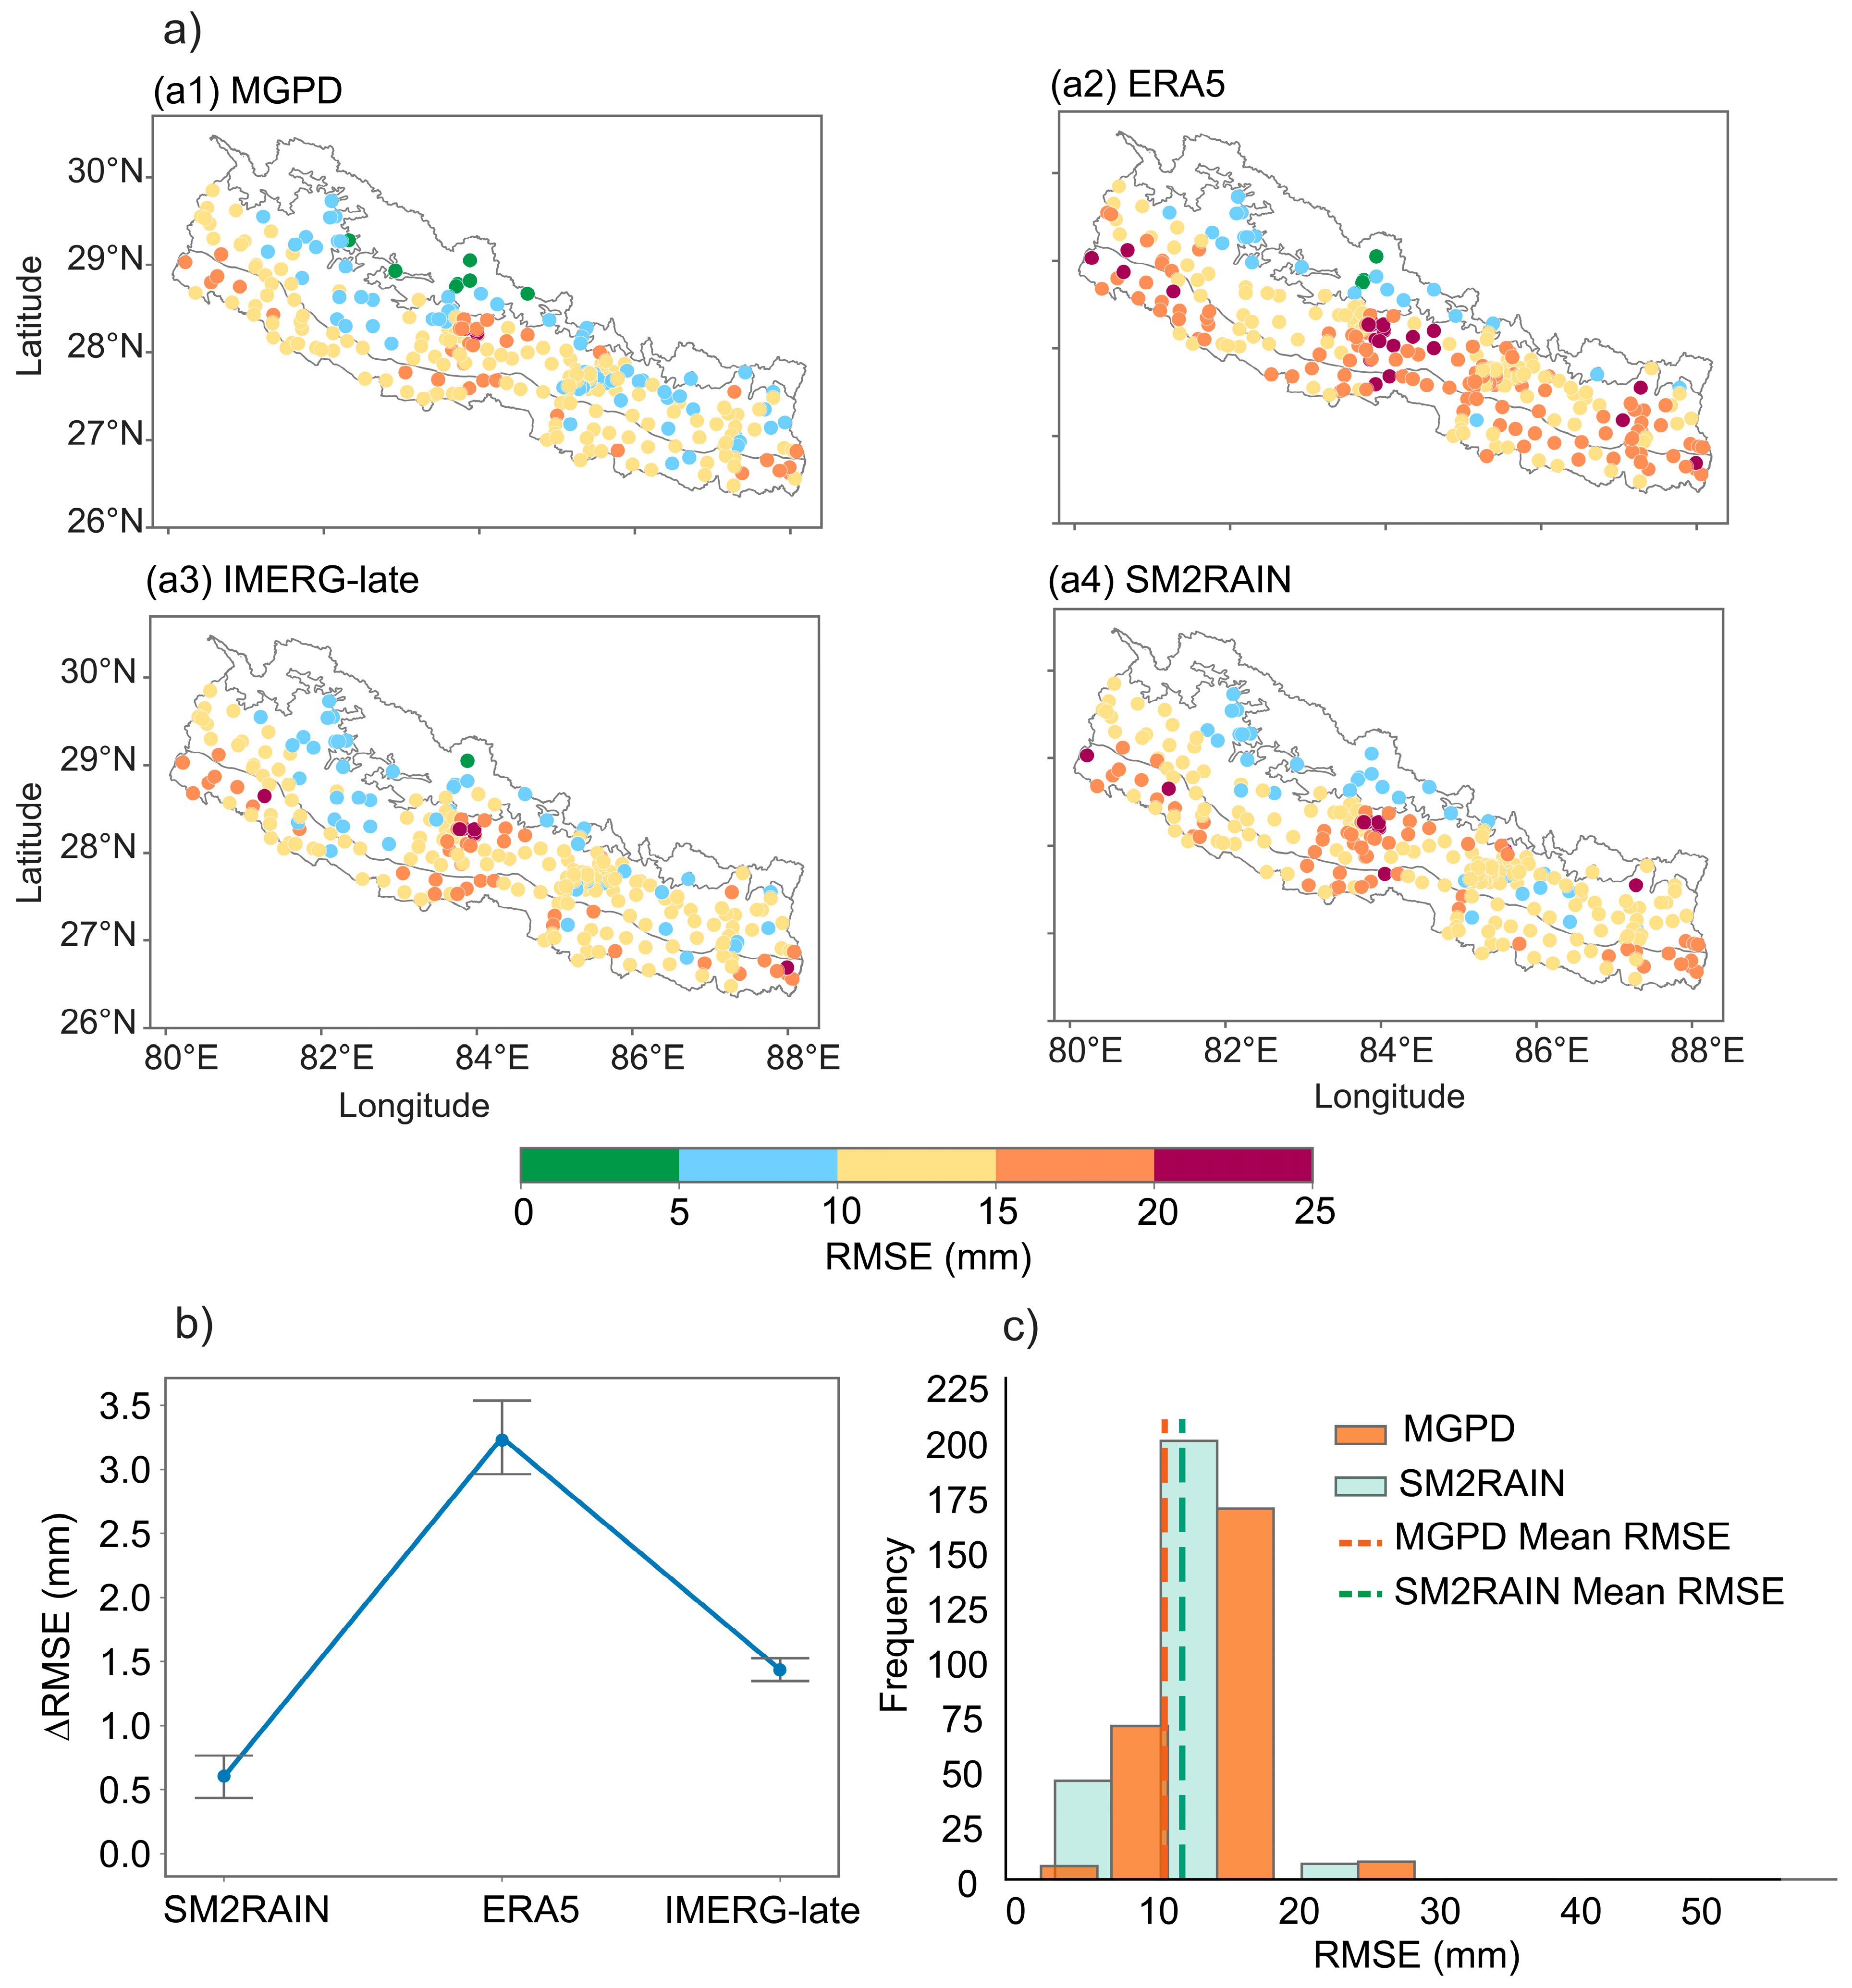
Figure 3a illustrates the spatial distribution of RMSE for all GPD products. The MGPD (Figure 3(a1)) shows consistently lower RMSE values (mostly ≤ 10 mm) compared to ERA5, SM2RAIN, and IMERG-late. In contrast, ERA5 (Figure 3(a2)) exhibits higher errors, greater than 15 mm, in central and eastern Nepal, while IMERG-late (Figure 3(a3)) and SM2RAIN (Figure 3(a4)) demonstrate intermediate performance. The mean RMSE of the merged product (9.80 mm) is notably lower than ERA5 (13.50 mm), IMERG-late (11.30 mm), and SM2RAIN (10.50 mm), confirming its accuracy on a regional scale.
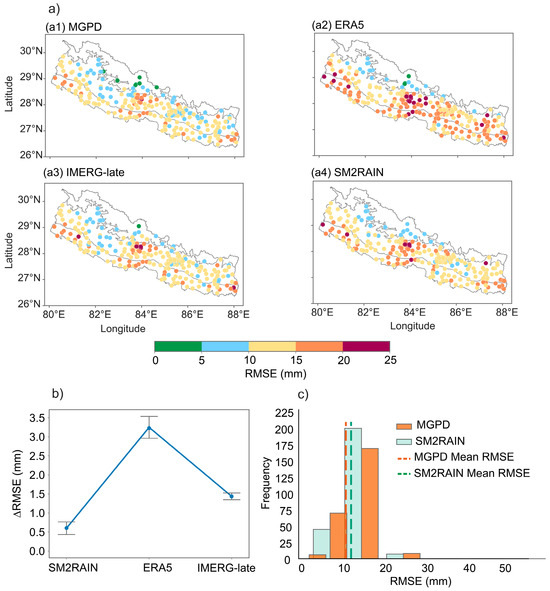
Figure 3.
Spatial evaluation of RMSE for MGPD and parent (ERA5, SM2RAIN, and IMERG-late) precipitation datasets across Nepal. (a) RMSE distribution at 253-gauge stations for MGPD and GPDs. (b) RMSE differences between GPDs and MGPD: vertical bars denote 95% confidence intervals; circular markers highlight mean RMSE deviations and the connecting line marks the trend across each product. The Δ symbol (y-axis) indicates the improvement magnitude (higher Δ = greater error reduction) in the merged product. (c) Frequency distribution of RMSE values in merged vs best satellite product (SM2RAIN), with the vertical dashed line representing the mean RMSE of each product.
Figure 3b shows the difference in RMSE between each GPD and the MGPD. Positive values of ΔRMSE show that the merged product outperforms all the parent products. SM2RAIN is the best-performing satellite product, with the smallest ΔRMSE (mean: 0.7 mm, 95% CI: 0.4–0.8 mm), followed by IMERG-late (mean: 1.5 mm, CI: 1.3–1.6 mm) and ERA5 (mean: 3.3 mm, CI: 2.9–3.6 mm). The error ranges of the merged product do not overlap with the parent GPD, illustrating the reliability of MGPD.
The frequency histogram in Figure 3c supports this finding, since the RMSE distribution of merged products is skewed toward the lower values compared to SM2RAIN, with 58% of stations showing RMSE less than 10 mm for the merged product versus 42% for SM2RAIN.
The performance statistics reflect similar efficiency in Figure 4. MGPD records the highest median KGE and small interquartile range, with bias centered around 0; in contrast, ERA5, IMERG-late, and SM2RAIN show poorer performance with lower KGE values and positive bias distribution, further confirming the superiority of the MGPD.
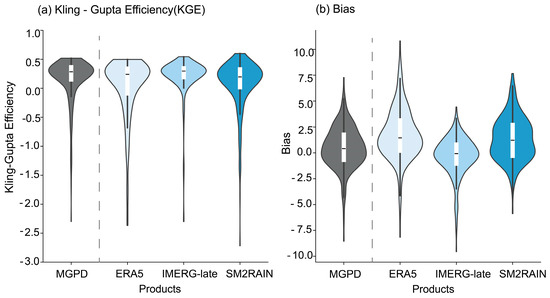
Figure 4.
Violin plots of Kling–Gupta Efficiency (KGE) and bias for the merged product (MGPD) and its parent datasets (ERA5, IMERG-late, SM2RAIN) at all gauge stations for 2008–2018.
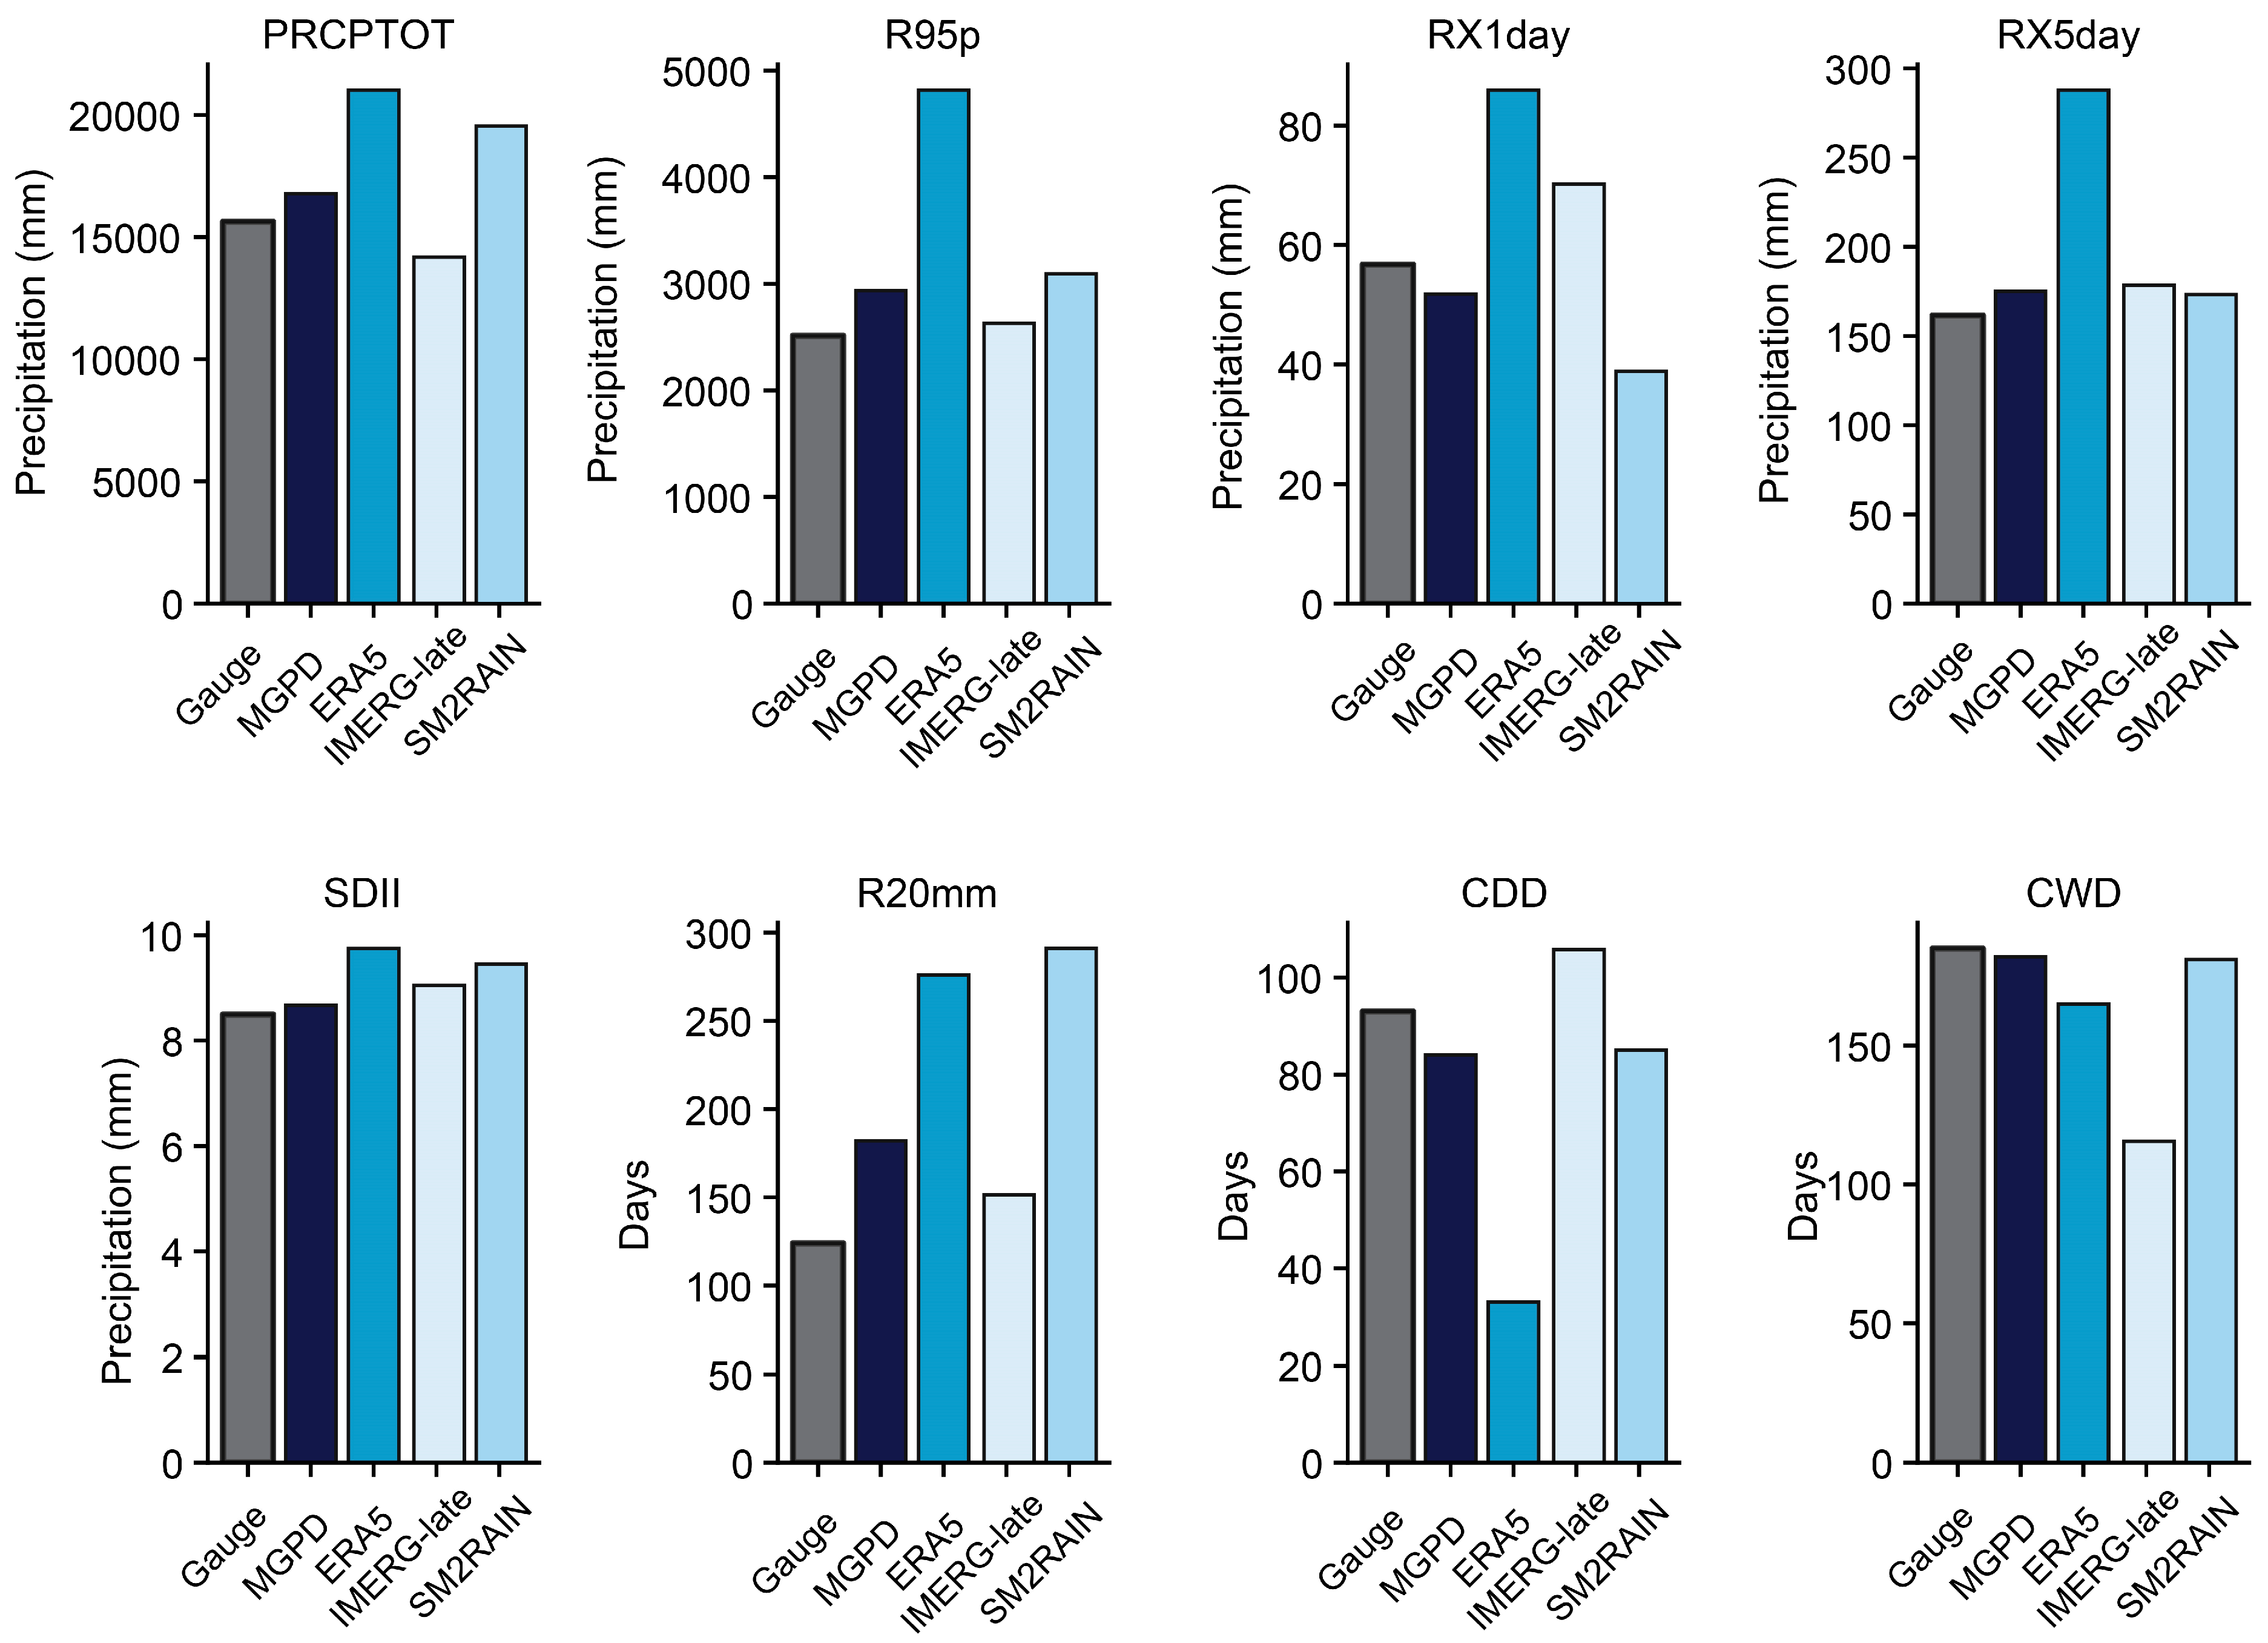
For the extreme precipitation index, as shown in Figure 5, a comparison was made between Gauge and (M)GPDs with respect to eight different ETCCDI indices. The result shows that MGPD tracks the gauge reference most closely. It reproduces the annual rainfall total (PRCPTOT) within ±5% of the gauge value, while the ERA5 overestimates by around 25% and IMERG-late underestimates by just over 15%. Amongst the intensity-based indices (R95p, RX1day, RX5day, SDII), the merged product showed the smallest positive bias, ERA5 shows the largest exaggeration of extreme-day totals, while SM2RAIN and IMERG-late provide mid-range outcomes. Threshold counts follow the same pattern with MGPD yielding 20 mm-day exceedance (R20mm) and wet-/dry-spell lengths (CWD, CDD) closest to gauge observations. ERA5 exaggerates heavy-rain counts (CWD) and truncates dry spells (CWD), and IMERG-late tends to the opposite. Taken together, the ETCCDI comparison confirms that the SNR-optimized merge not only reduces the mean-square error, but also best preserves the climatology of the extremes essential for impact studies.

Figure 5.
Annual values of eight ETCCDI extreme-precipitation indices (PRCPTOT, R95p, RX1day, RX5day, SDII, R20mm, CDD, CWD) averaged over 2008–2018. Bars show gauge reference and gridded products.
3.1.2. Rainfall Classification Performance
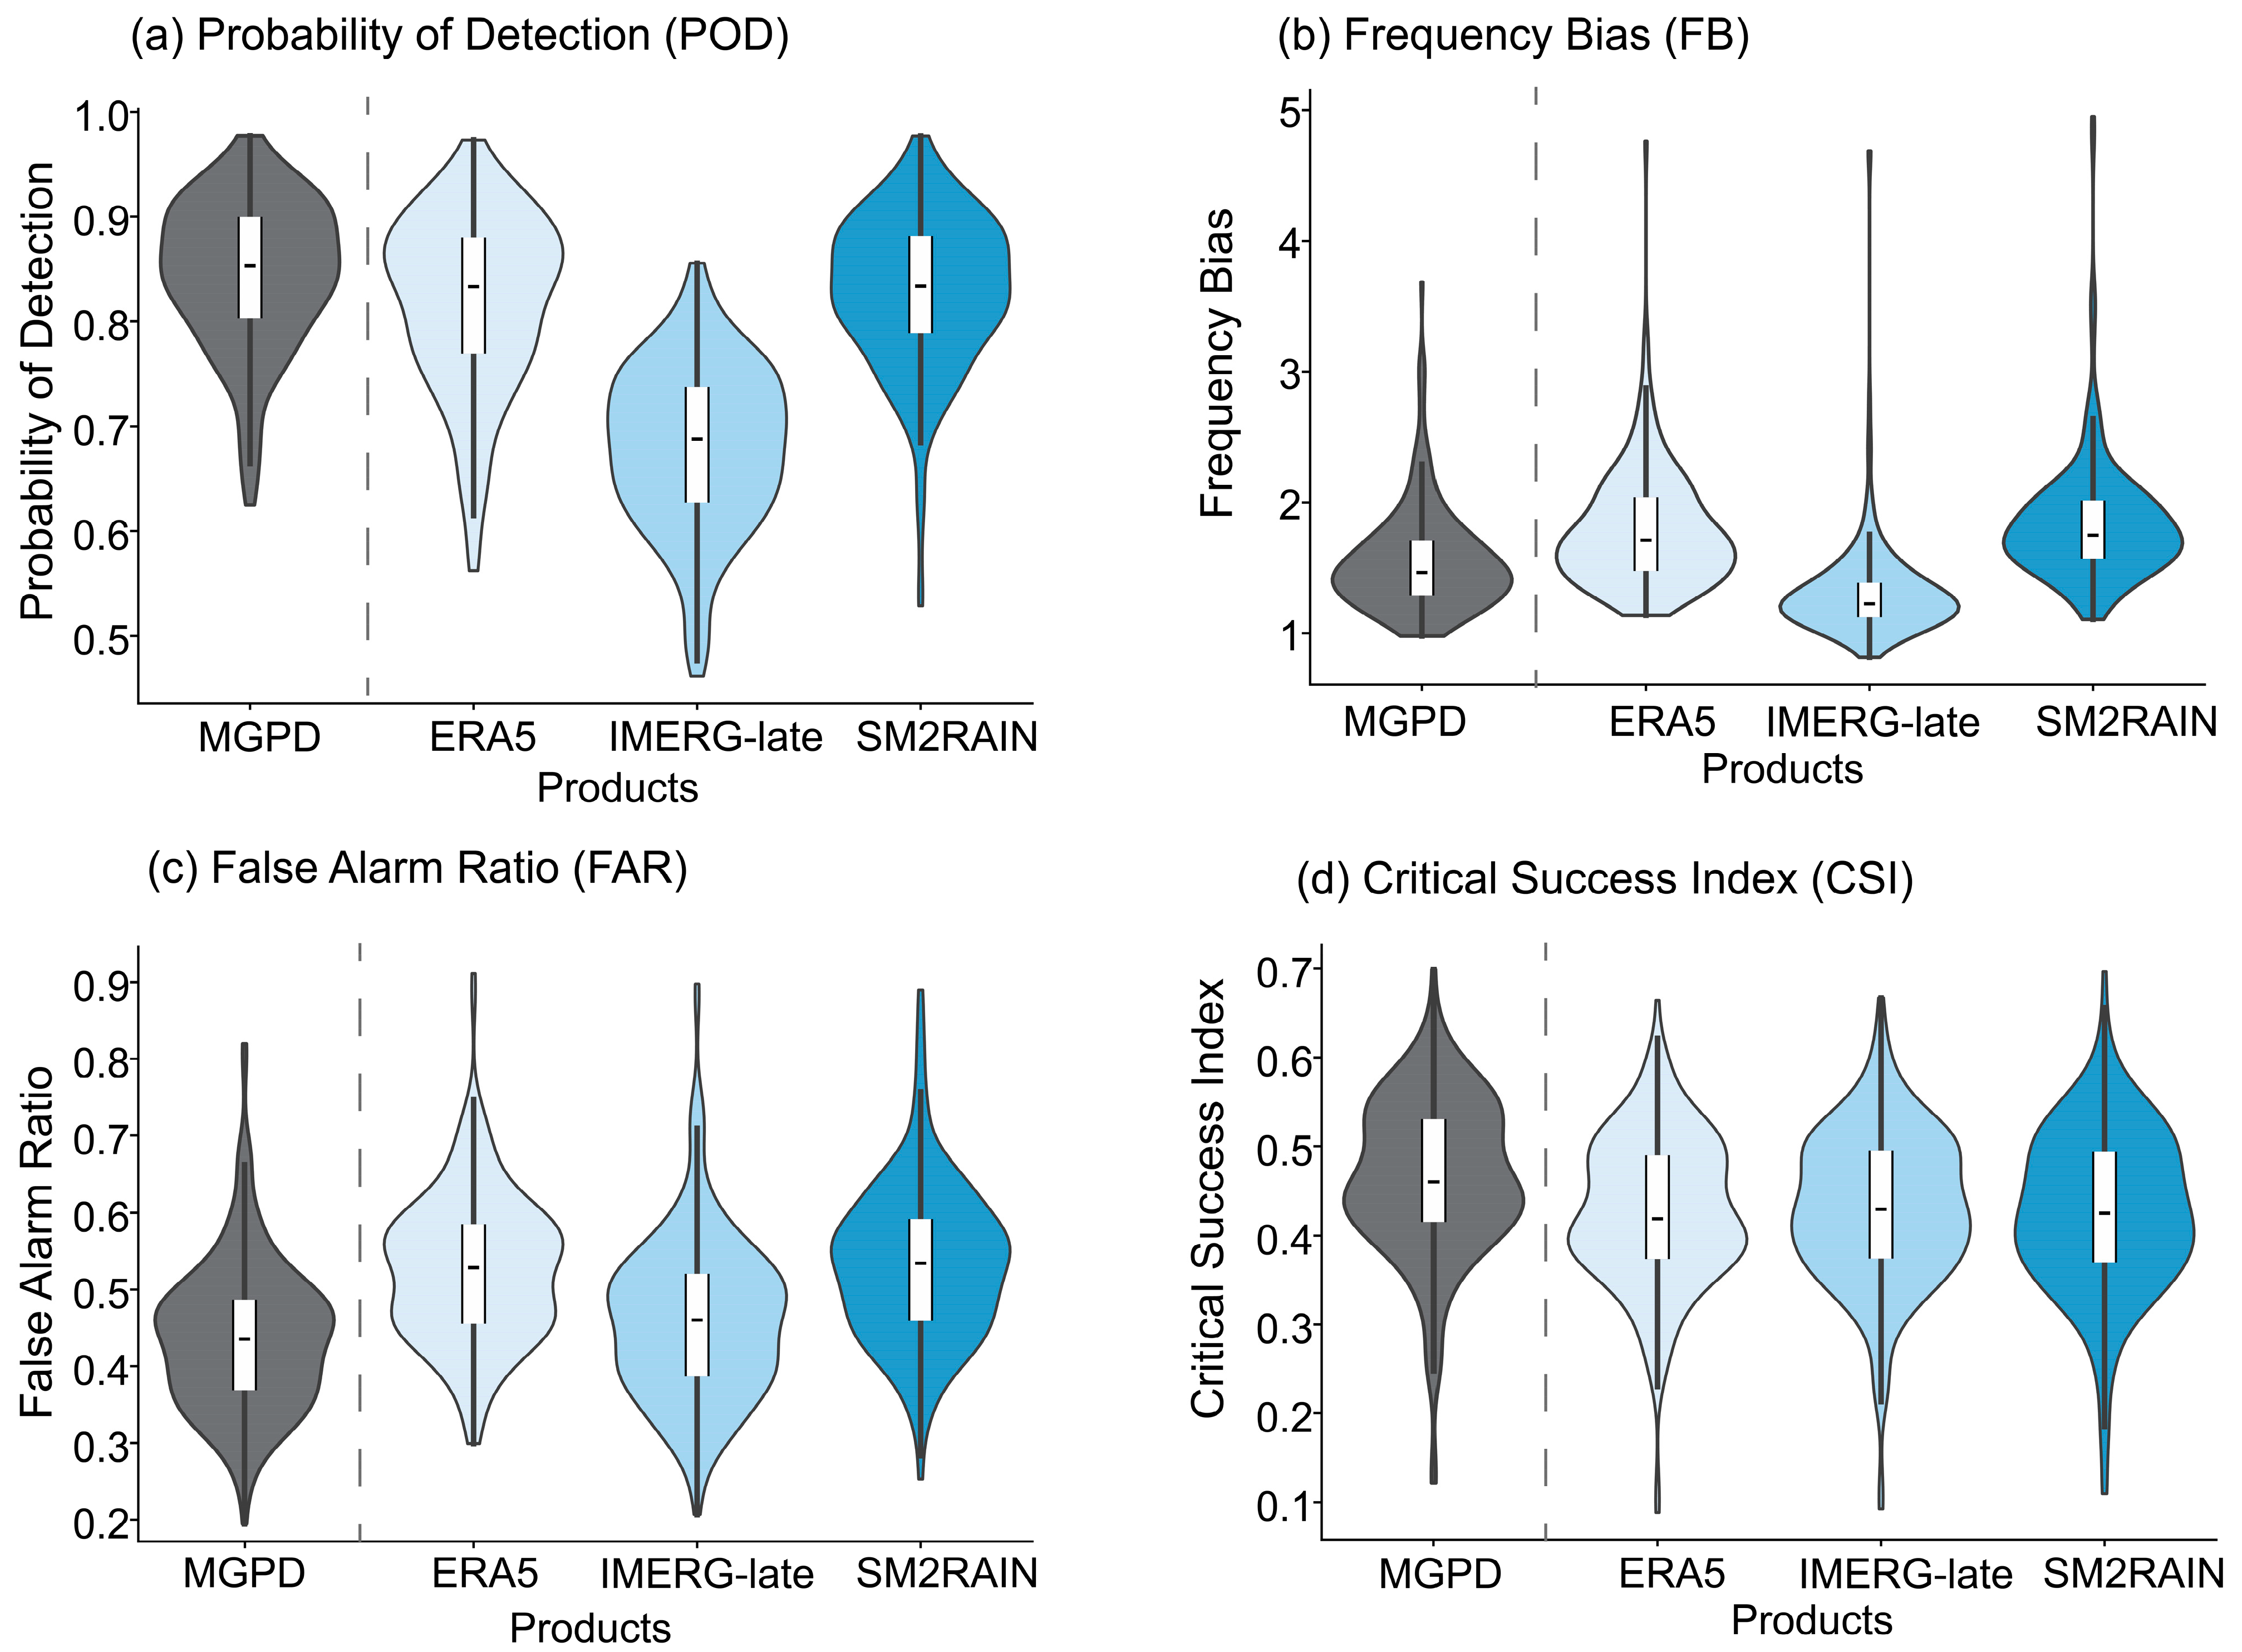
A comparative analysis of precipitation detection was conducted for MGPD and parent GPD. The violin plot (Figure 6) highlights the performance of each dataset, illustrating their detection accuracy, systematic biases, and overall reliability.
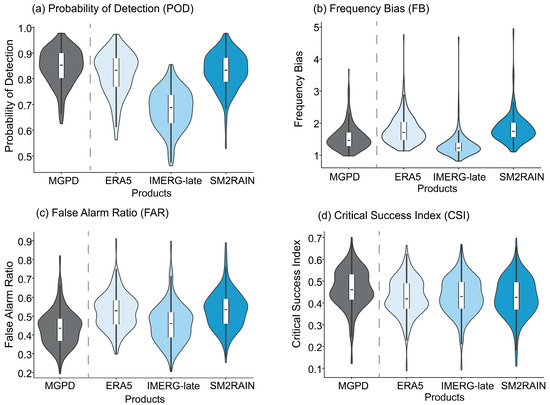
Figure 6.
Violin plots illustrate the precipitation detection performance of GPDs and MGPD across four metrics: (a) Probability of Detection (POD), (b) Frequency Bias (FB), (c) False Alarm Ratio (FAR), and (d) Critical Success Index (CSI). Plot distribution highlights relative detection accuracy, systematic biases, and interquartile variability among the datasets. Violin shapes denote the density and spread of metric values, highlighting variations in false alarm rates, overestimation tendency, and overall reliability.
The MGPD and SM2RAIN exhibit the highest POD values (Figure 6a) with medians of 0.86 and 0.84, respectively, indicating that the precipitation events are accurately detected. ERA5 showed moderate POD (median 0.83), and IMERG-late showed the lowest POD (median 0.68), suggesting that satellite retrievals that struggle with low rainfall or shallow convection over land are likely the cause of under-detection. In terms of Frequency Bias (FB) (Figure 6b), IMERG-late shows almost unity median, indicating balanced prediction of rain event frequency. In contrast, ERA5 and SM2RAIN significantly over-predicted (medians: 1.60 and 1.55, respectively) rainfall events. The slight overestimation (median: 1.20) of MGPD product results in a trade-off between multiple sources of error, and its narrower interquartile range (IQR: 1.55–1.15) suggests a consistent performance than individual GPDs.
The advantage of merging is further illustrated by the FAR (Figure 6c), with MGPD having the lowest FAR (median 0.43), due to the integration of complementary data sources to filter out the false signals. In contrast, ERA5 showed the highest FAR (median 0.54), followed by SM2RAIN and IMERG-late (median 0.53 and 0.47, respectively). Similarly, the Critical Success Index (CSI) (Figure 6d) has shown that the MGPD performs better with a median of 0.47, striking a balance between accurate detection and reduced false alarms. Meanwhile, SM2RAIN, IMERG-late, and ERA5 exhibit comparable CSI (median: 0.42), reflecting their limitations of missed detections and false alarms.
3.1.3. Streamflow Simulation Results
The performance of MGPD forcings was compared with the results from individual datasets: ERA5, IMERG-late, and SM2RAIN (Table 3 (c)). The relative contribution of each dataset to the merged product for each basin is shown in Table 5. The weights of the precipitation products were calculated as per the signal-to-noise ratios of each dataset to minimize the mean squared error (MSE).
Table 5.
SNR-opt-based MGPD weights for precipitation merging across three basins.
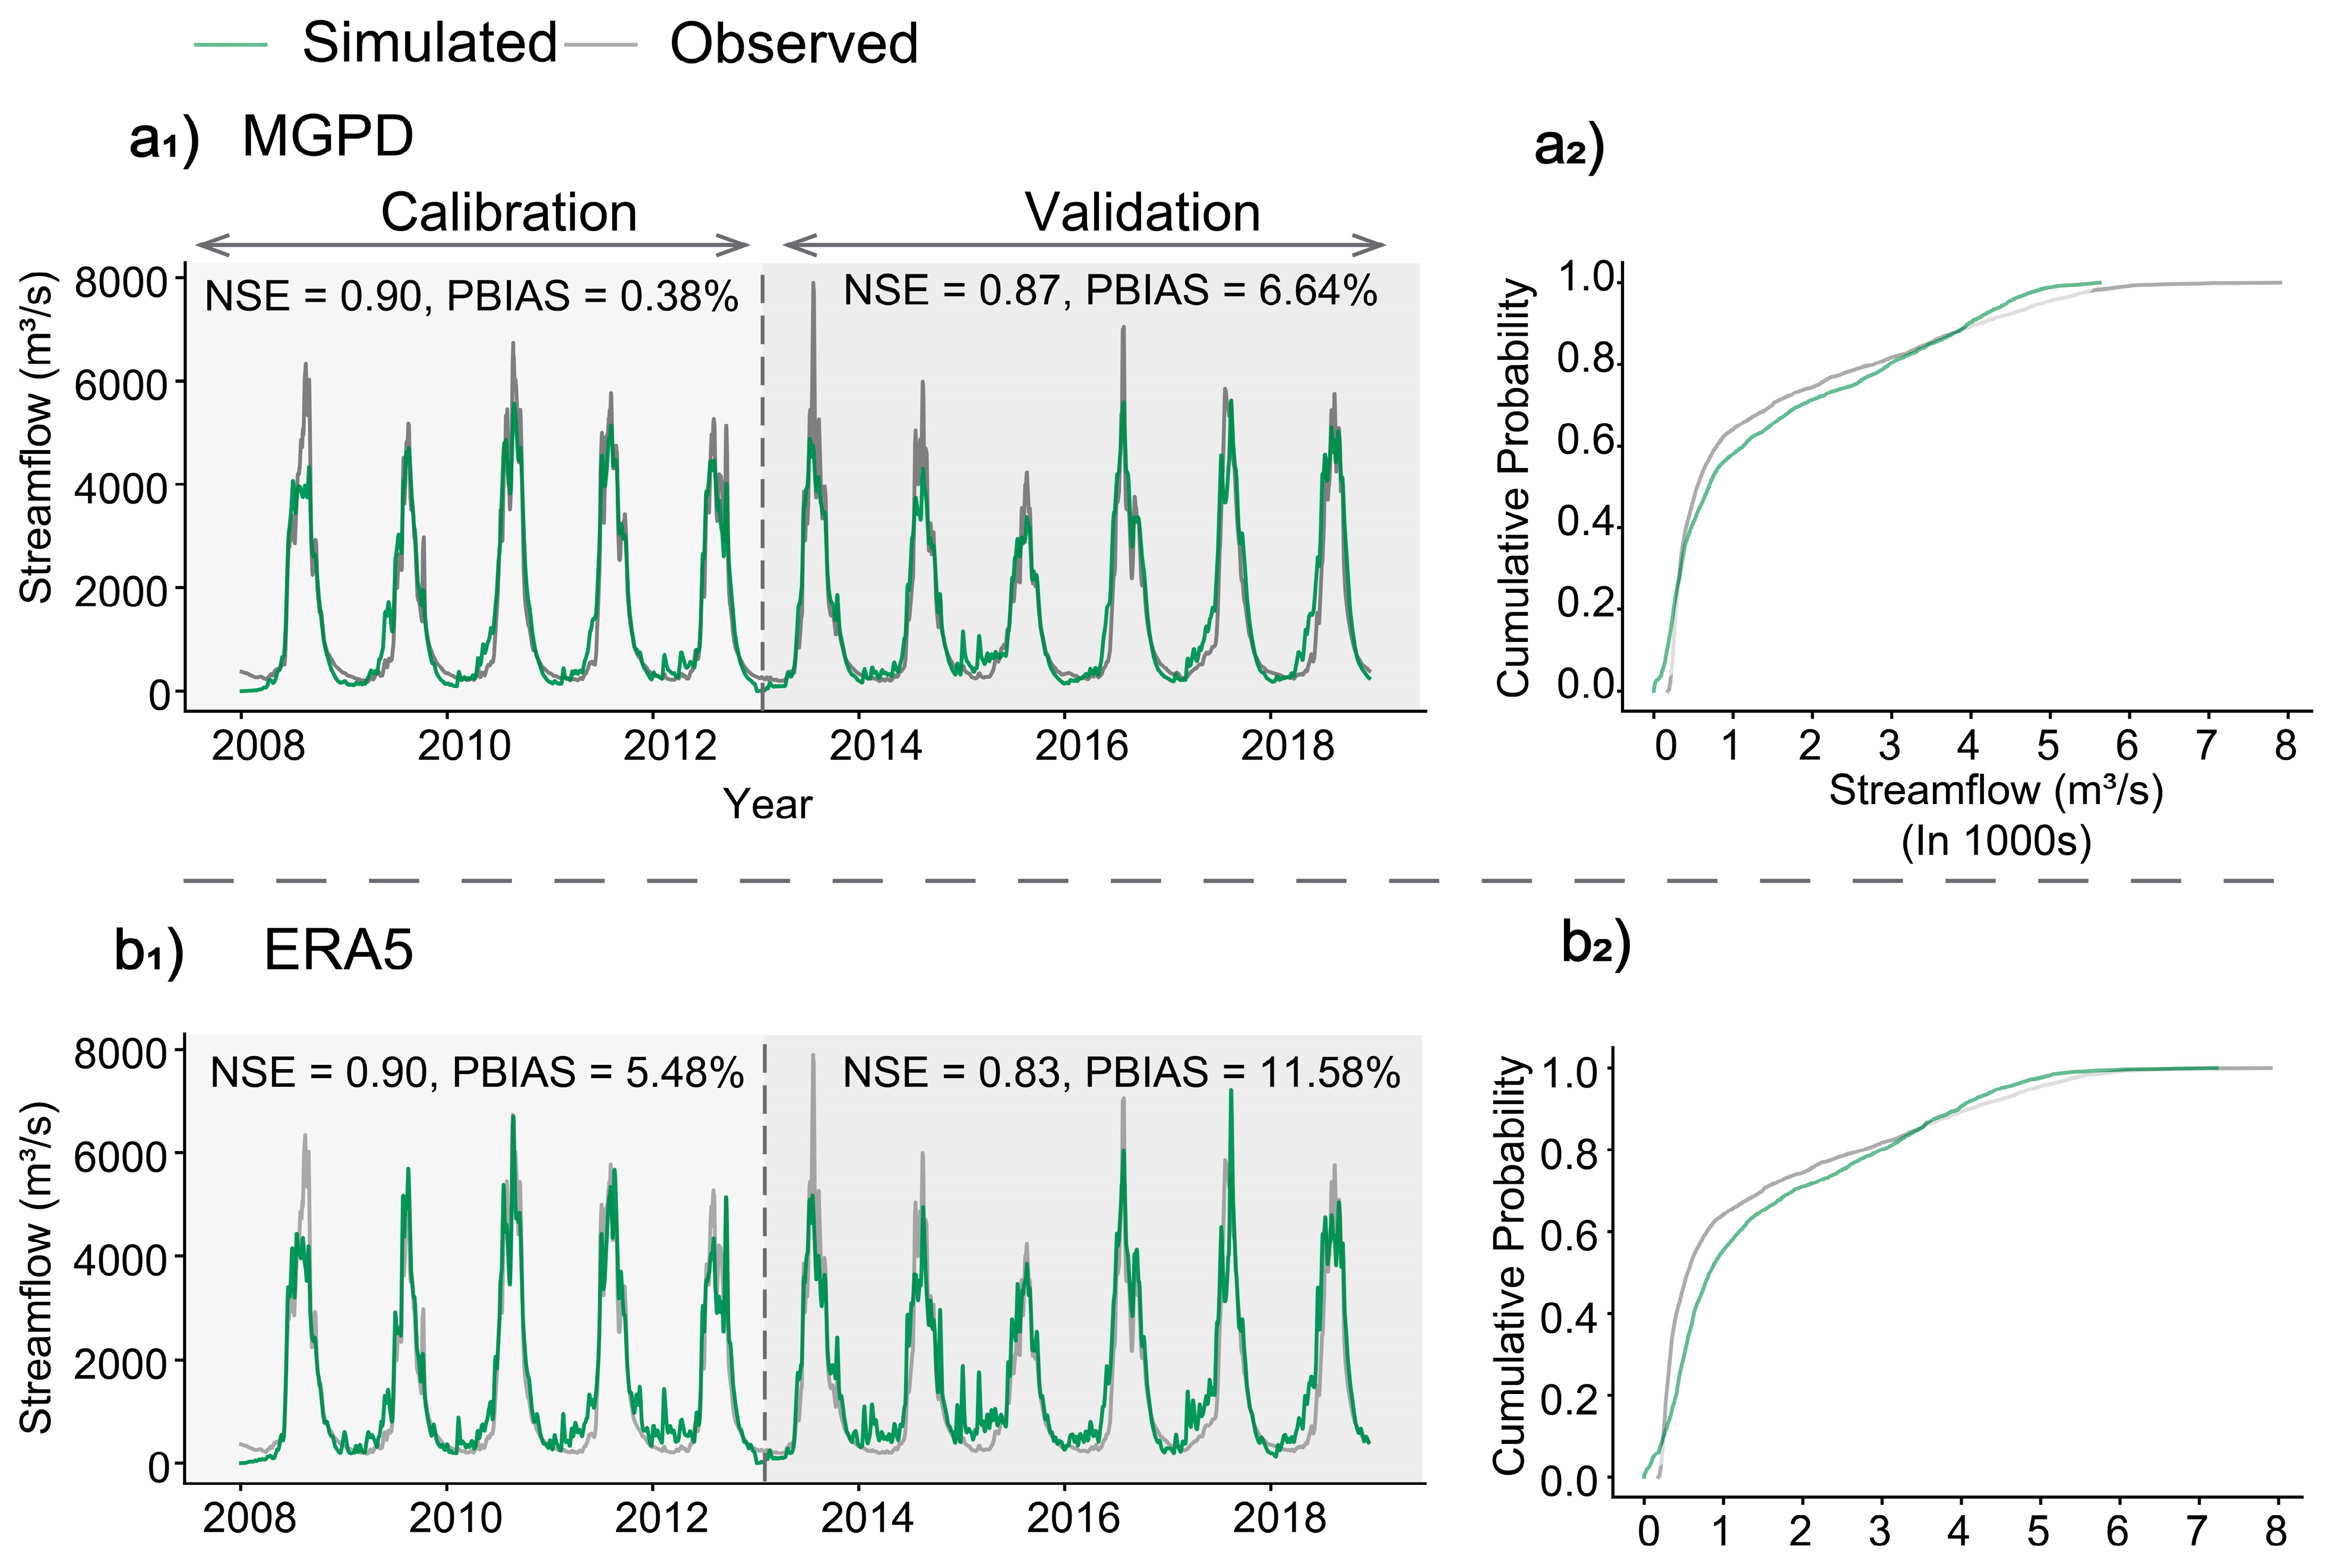
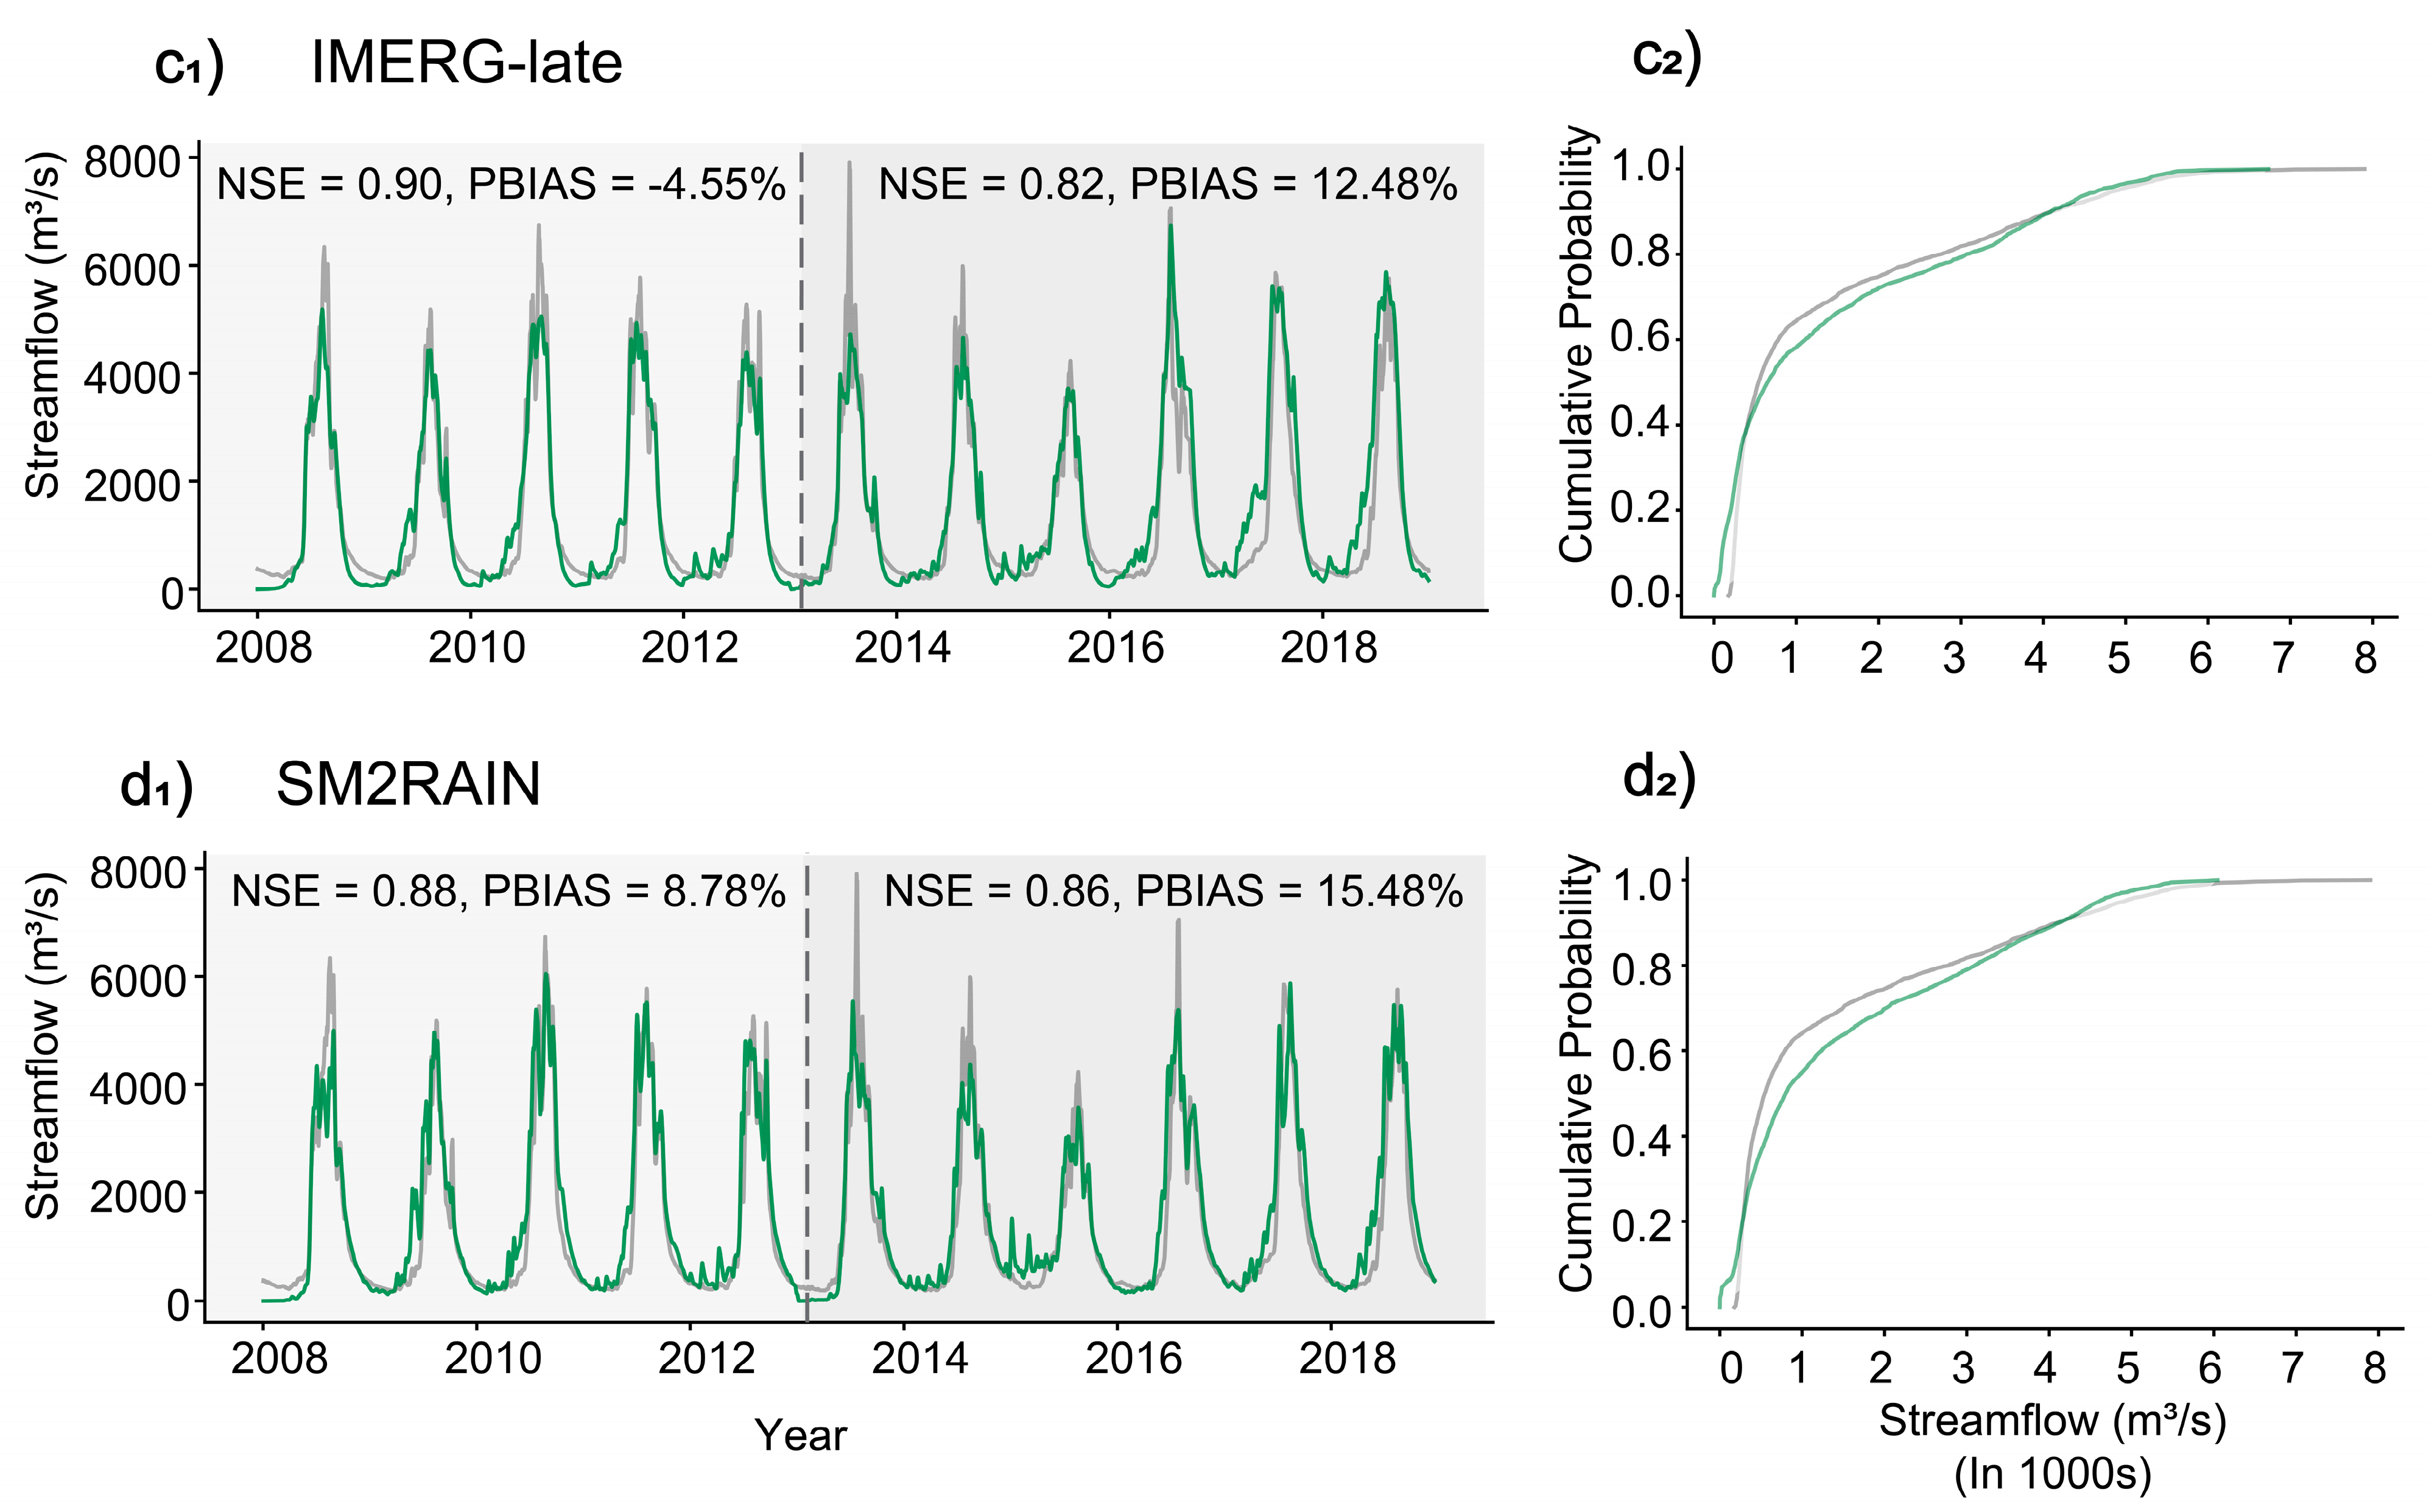
In the Narayani Basin (Figure 7), the HYMOD model forced with MGPD performs better than the parent GPD, with simulated streamflow closely aligning with observations (NSE: 0.87, CC: 0.93, PBIAS: 6.64%). The time series captured monsoon peaks (e.g., 2014 and 2017 events) and baseflow dynamics, and the cumulative distribution function (CDF) showed close overlap with the discharges at the outlet. The inability of ERA5 and SM2RAIN to resolve the extremities of spatial rainfall in complex topography resulted in systematic overestimation of the predicted streamflow (PBIAS (ERA5): 11.6%, SM2RAIN: 15.5%). Merging reduced these biases by 43–57%, showing its dominance over GPDs. Similar patterns were observed in the Koshi and Karnali basins (Supplementary Figures S1 and S2), where the merged product improved peak flow timing (Koshi CC: 0.95 vs. SM2RAIN: 0.93) and minimized dry-season biases (Karnali PBIAS: 1.98% vs. ERA5: 12.13%).
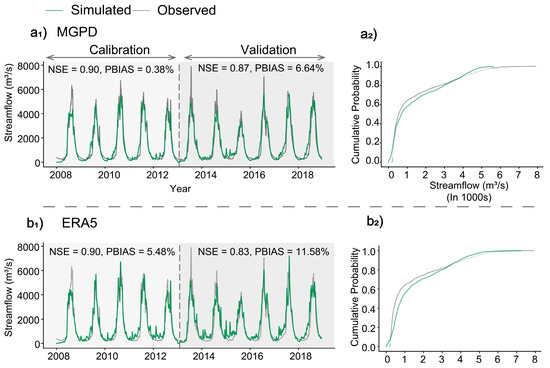
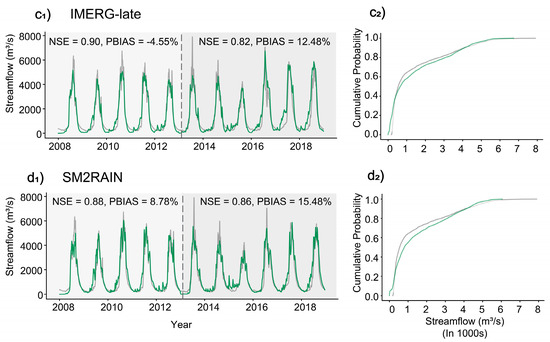
Figure 7.
Comparison of simulated (green) and observed (gray) streamflow for four different precipitation forcings: (a1,a2) MGPD, (b1,b2) ERA5, (c1,c2) IMERG-late, and (d1,d2) SM2RAIN in the Narayani Basin. Left panels (a1–d1) show the time-series plots for calibration (left, up to the dashed vertical line) and validation (right). Right panels (a2–d2) show the cumulative distribution functions (CDFs) of streamflow for observed and simulated data.
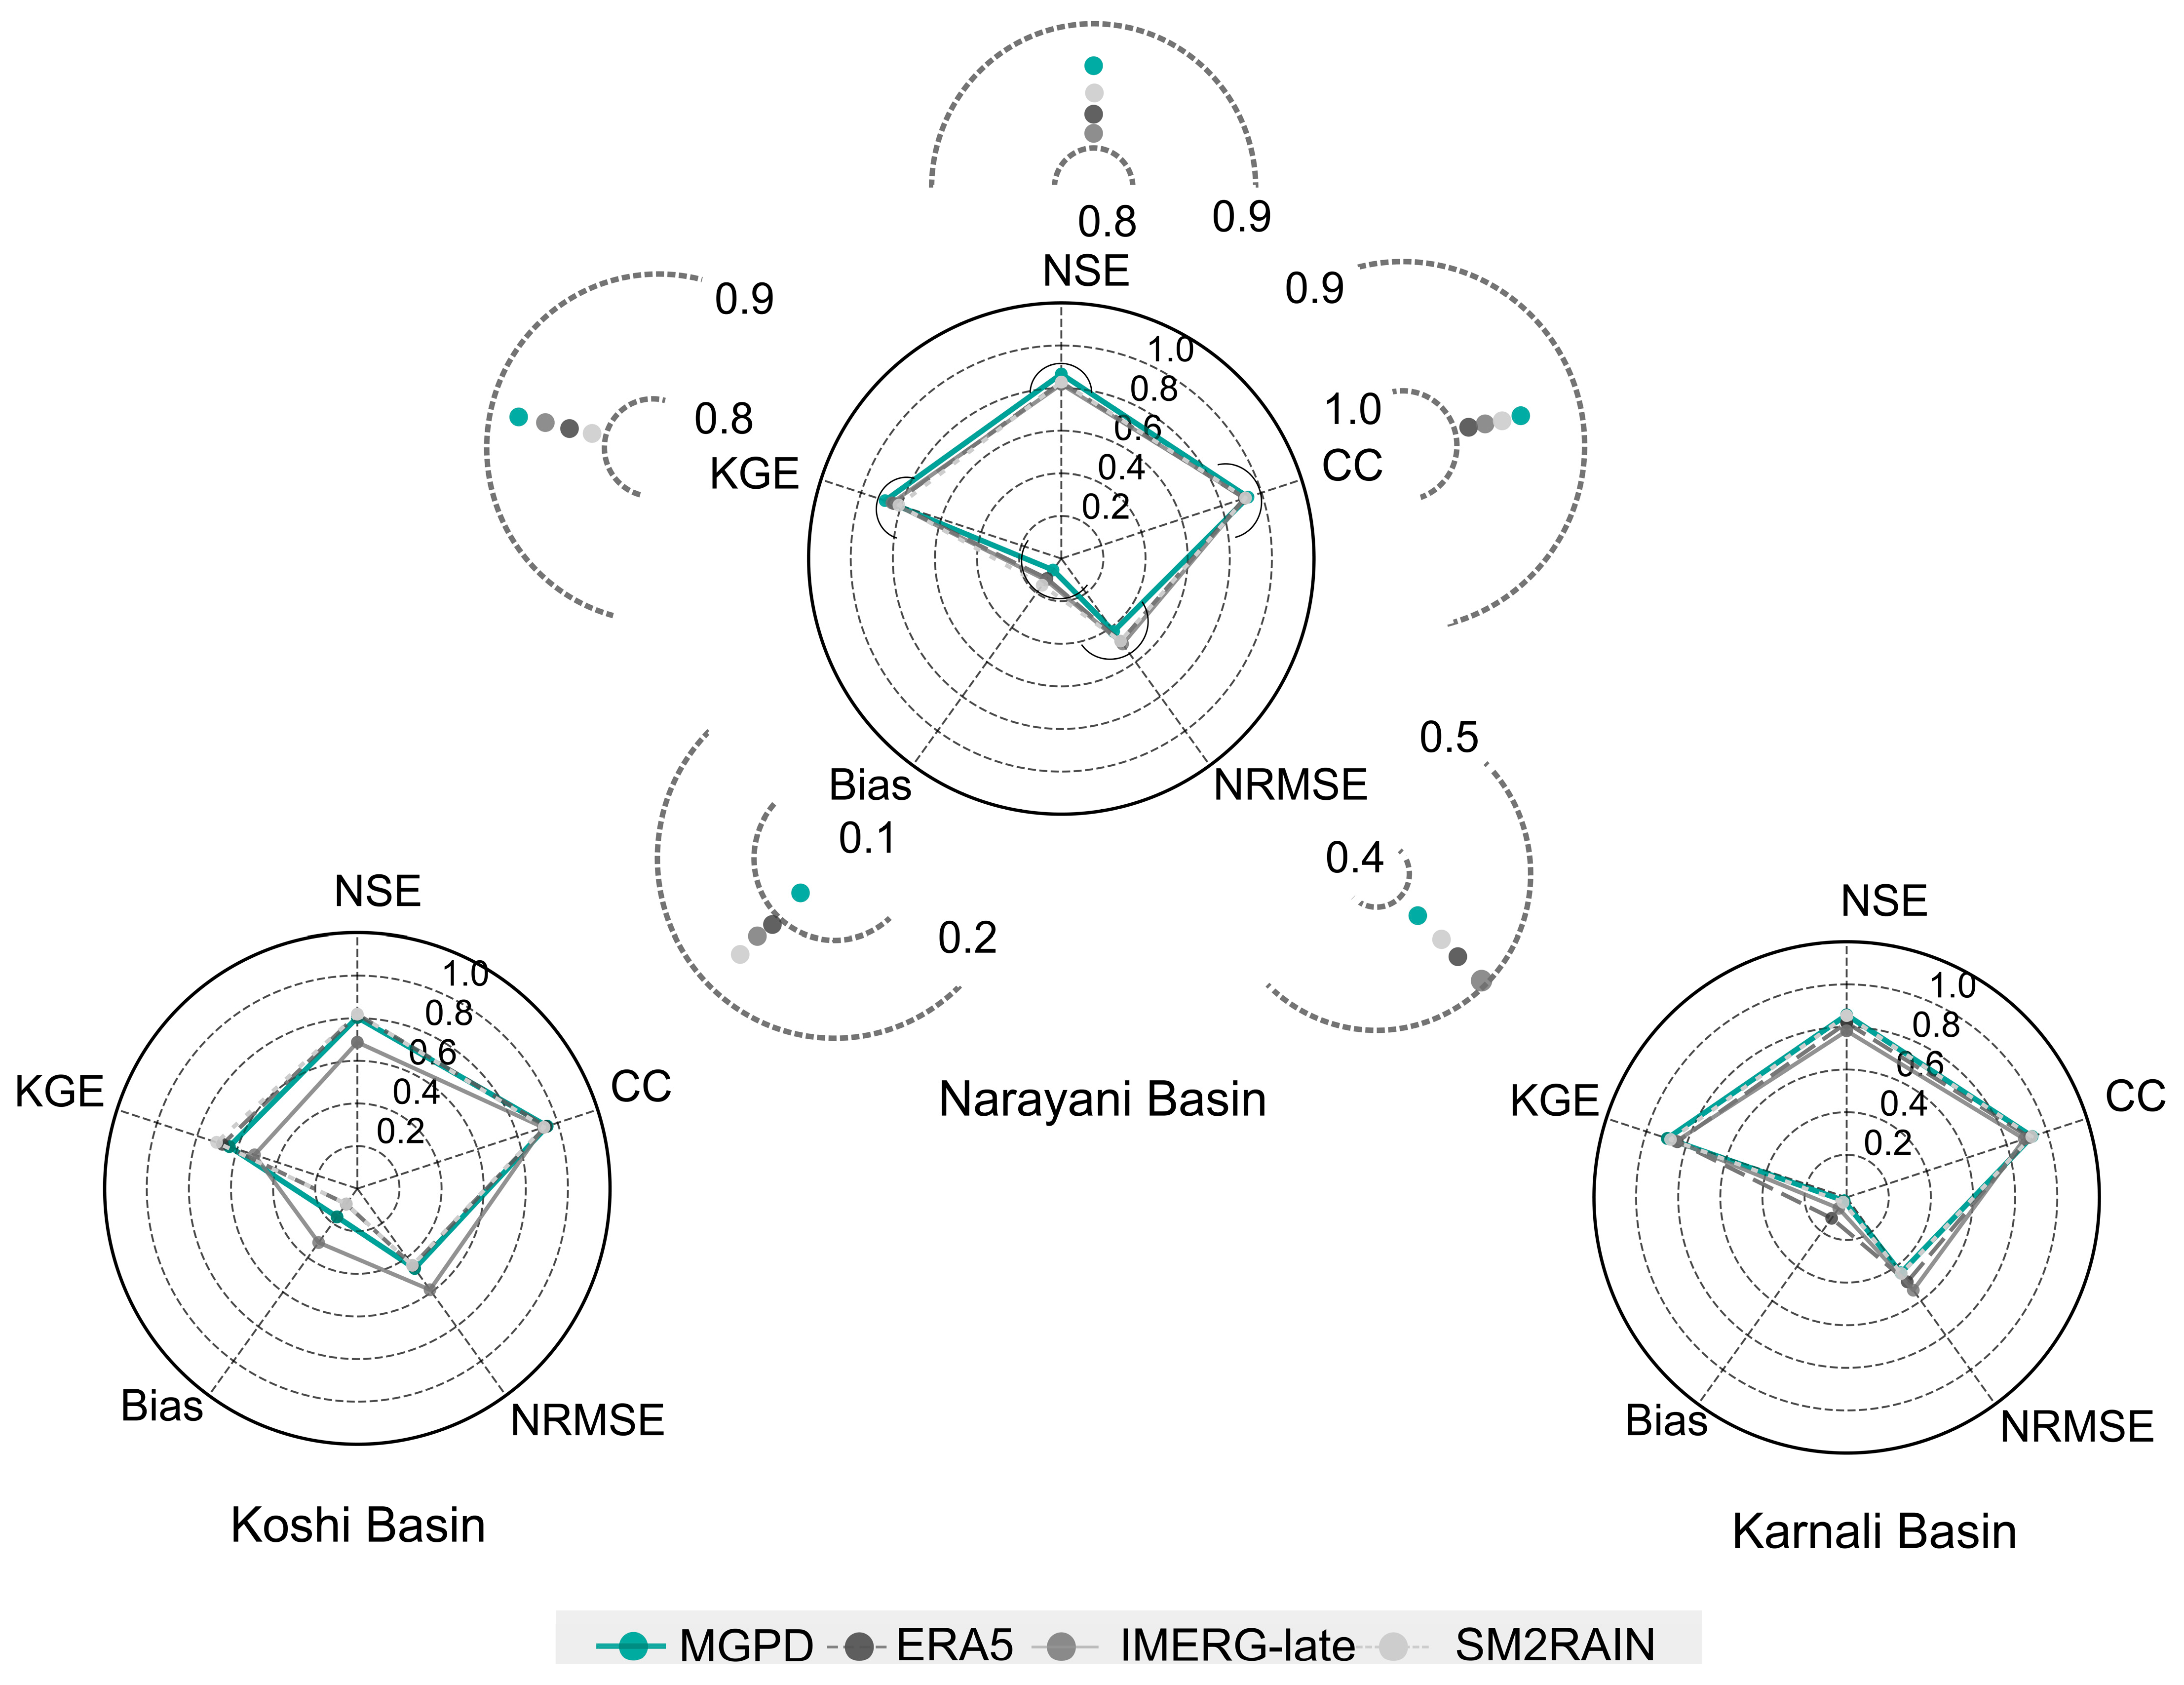
Radar charts (Figure 8) synthesize the performance of the HYMOD model when forced with MGPD, compared to parent datasets using evaluation metrics (Table 3 (c)). In the Narayani Basin, the merged product dominated all metrics, achieving the highest NSE (0.87), CC (0.93), and KGE (0.88), alongside the lowest NRMSE (0.42) and PBIAS (6.64%). Similarly, in the Karnali Basin, the merged product reached almost zero bias PBIAS (1.98%) with the highest NSE and KGE values (0.86 and 0.90), outperforming SM2RAIN (NSE: 0.85; KGE: 0.87) and ERA5 (NSE: 0.82; KGE: 0.84).
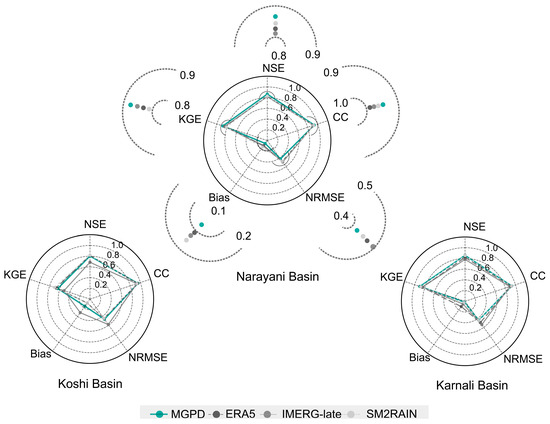
Figure 8.
Radar plots comparing the performance of streamflow prediction from precipitation products (MGPD, ERA5, IMERG-late, SM2RAIN) across the Koshi (left), Narayani (centre), and Karnali (right) basins using five metrics: NSE, CC, KGE, Bias, and NRMSE. Each polygon represents a score of the dataset, with concentric rings indicating metric values. Surrounding the Narayani Basin’s central chart are enlarged radial plots focusing on individual metric ranges, offering a closer view of performance differences among the datasets.
For the Koshi basin, MGPD outperformed IMERG-late (CC: 0.929, NSE: 0.687), achieving the highest CC (0.948) and moderate NSE (0.804). Although merged forcing reduced the RMSE by 28% compared to IMERG-late, it lags behind SM2RAIN (NSE: 0.820) and ERA5 (NSE: 0.810). These results highlight the poor performance of IMERG-late in the Koshi basin and the impact of individual precipitation products in the SNR-opt-based merging. Meanwhile, the utility of MGPD is validated through balanced performance—high CC, moderate Bias (0.164), and improved KGE (0.639)—despite marginally higher NRMSE and NSE than SM2RAIN and ERA5.
The MGPD’s weights (Table 5) reveal SM2RAIN as the dominant contributor (48–49%), consistent with its lower RMSE across all basins. However, merging with ERA5 and IMERG-late further reduced Bias (e.g., Narayani: IMERG-late (0.125), ERA5 (0.11) MGPD 0.066) compared to individual products. The HYMOD results validate that merged products inherit strengths from parent datasets while suppressing their weaknesses. Detailed Radar charts for the Koshi and Karnali basins are provided in Supplementary Figures S3 and S4.
Furthermore, to evaluate the performance of precipitation forcings in monthly flow, NSE and KGE scores were assessed. Figure 9 shows that MGPD attains the highest values even at the monthly scale (Koshi KGE/NSE = 0.82/0.88, Narayani 0.88/0.94, Karnali 0.97/0.95), while SM2RAIN yields the lower values although it had higher weightage (Table 5). Similarly, ERA5 and IMERG-late occupy an intermediate position but diverge by basin. Replication of poor performance of IMERG-late and its impact on the MGPD can be observed in the NSE score for the monthly flow as well as in the Koshi basin.
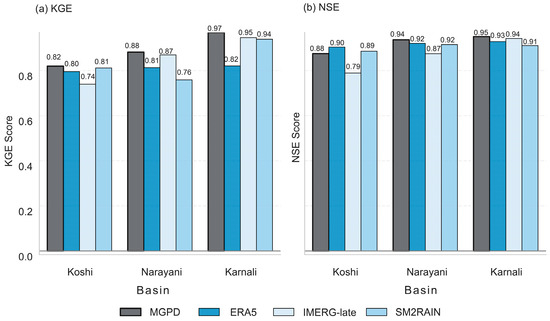
Figure 9.
Kling–Gupta Efficiency (KGE) and Nash–Sutcliffe Efficiency (NSE) scores for monthly streamflow simulations across the Koshi, Narayani, and Karnali basins, comparing four precipitation forcings: MGPD, ERA5, IMERG-late, and SM2RAIN.
4. Discussion
4.1. Performance of the Merged Precipitation Product
4.1.1. Analysis of Error Magnitude and Rainfall Classification
The study evaluated the performance of SNR-opt merging in Nepal by integrating three parent datasets, i.e., satellite estimates (IMERG-late), soil moisture estimates (SM2RAIN), and reanalysis product (ERA5), for the period of 2008–2015. We found that the Merged Gridded Precipitation Dataset (MGPD) provides better precipitation estimates compared to the parent GPDs.
The MGPD performed better in terms of RMSE than all parent datasets across most of the stations, confirming the effectiveness of the merging by compensating for the errors and utilising the complementary strengths of multi-source datasets. The weighting of the datasets in the merged product further reflects both the limitations and reliability of the individual precipitation datasets. For instance, SM2RAIN contributed the highest weights (41–49%) in merging, demonstrating its stable performance in detecting moderate rainfall. This is consistent with the study of Brocca et al. [54], who emphasized that SM2RAIN’s better detection of low to medium rainfall events reduced RMSEs and improved the accuracy of overall rainfall estimation. This balance was further enhanced as the underestimation of extreme precipitation by SM2RAIN was compensated by the overestimations inherent in IMERG-late, where radiometer biases propagate into morphed estimates due to interpolation over time [55]. ERA5 also contributed to bias adjustments by amplifying the frequency of precipitation due to model uncertainties in the complex topography of Nepal. These results align with the findings by Shah et al. [34], who also reported a significant reduction in RMSE using SNR-opt-based merging across High Mountain Asia.
In addition to a reduction in RMSE, MGPD attained the highest KGE values, which penalizes correlation error, mean bias, and variability error [56], indicating that MGPD not only reproduces average rainfall amount (low bias), but also reproduces its daily variability and timing more accurately than single-parent GPD. Furthermore, the performance of MGPD in eight ETCCDI extreme precipitation indices shows that it generates both total and extreme rainfall precisely. MGPD matched gauge-derived annual total (PRCPTOT), and small positive bias in intensity-oriented metrics—R95p, RX1 day, RX5 day, and SDII—while ERA5 showed the greatest overestimation of single, 5-day, and annual total rainfall, which is a known tendency of a reanalysis product over the region’s complex topography [57].
Threshold metrics show the same hierarchy, with MGPD providing similar counts to heavy (R20 mm), dry (CDD), and wet (CWD) days as the gauge network. ERA5 overcounts the heavy days and underestimates the dry days, while IMERG-late does the opposite since it tends to damp short-duration convective peaks and misses the very highest intensity [58]. Meanwhile, SM2RAIN fluctuates through all the indices and provides almost double the count of the heavy days (R20mm) than MGPD and gauge, due to soil-moisture inversion responding to moderate wetting of the pulse of rainfall events, thereby overcounting threshold exceedance.
Beyond the error magnitude, the superiority of merged products is validated in precipitation classification. MGPD achieved the highest POD, lowest FAR, and highest CSI, highlighting that multi-source precipitation merging can filter out false signals and reduce missed events, making rainfall estimations reliable. These outcomes are similar to the results of Li et al., [59] in which the POD values of MGPD increased by 28% and the FAR values decreased by 22% in complex terrain, which is slightly more than the improvement in this study (POD increased by 26.5% and FAR reduced by 20.3%). However, in terms of FB, MGPD was ranked lower than IMERG-late and overestimated the rainfall events. This is due to the overprediction tendencies of ERA5 in the areas with sparse observational constraints [60] and underestimation of SM2RAIN due to its increased sensitivity to soil moisture caused by non-rainfall processes (e.g., irrigation or dew) [54]. A similar trend was observed by Lei et al. [61], where POD decreased for the merged product despite improvement in other metrics due to the uneven quality of the input datasets. For instance, the lowest POD and high FAR of IMERG-late degraded the overall detection score of MGPD, suggesting that satellite retrievals struggle to detect shallow convection over land and are prone to false alarms due to cloud contamination and surface emissivity errors [62]. While MGPD outperformed parent datasets in most of the detection metrics, moderate values of FAR and CSI in all precipitation datasets suggest some inconsistencies. These findings are consistent with observations from previous studies, which highlight that sparse gauge networks in the complex terrain of the Central Himalayas can introduce uncertainties in the precipitation datasets, in which ground truth may not reflect actual rainfall conditions [63].
These results imply that gauge-independent merging is an alternative utility for hydrological modelling and climate studies in data-scarce regions. These results are consistent with previous studies [21,34,61] and illustrate that multi-source merging reduces biases and minimizes error propagation. This agreement between these studies and our results proves that the SNR-opt merging approach is effective in enhancing precipitation products [21,34]. These findings have important implications for flood forecasting in the monsoon-driven river basins, particularly in the regions of complex rainfall patterns like Nepal, where small rainfall errors propagate into large uncertainties in streamflow simulation.
4.1.2. Analysis of Streamflow Simulation
The primary focus of the study is to quantify the added value of MGPD in Hydrological modeling; so, we evaluated the performance of MGPD and parent datasets by forcing them against the HYMOD model.
A comparison among the simulated results showed the overall improvement in the MGPD-forced hydrological model in simulating the discharges at the outlets accurately. Although the merged product performed well for the Narayani and Karnali basins, it achieved a slightly lower NSE for the Koshi basin than SM2RAIN and ERA5, while outperforming IMERG-late. These results demonstrate that the inclusion of poorly performing IMERG-late data in the Koshi basin degraded the overall effectiveness of merging, aligning with Gao et.al [64], who highlighted that the efficacy of merging is strongly dependent on the performance of individual datasets. IMERG-late, during the low-intensity and shallow precipitation events, is likely to show the lowest Probability of Detection [55].
These results comply with the recent studies made on hydrological modeling of the merged product, refs. [64,65], which highlights improvement in performance metrics (NSE, CC, NRMSE, and KGE) with MGPD forcings. This is further supported by Maggioni et al. [66], who indicated that the integration of satellite data and reanalysis data reduces bias in the hydrological model by balancing over-predicted and under-predicted forecasts.
The monthly-flow assessment further supports the validity of MGPD forcings in streamflow simulation. When the performance metrics (NSE and KGE) were evaluated, MGPD retained higher values for all basins, demonstrating that even for different flow intensity and hydrological regimes, it preserves the accurate information of extreme flows better than its parent datasets. Similarly, ERA5 and IMERG-late occupy an intermediate position, which varies according to basin, illustrating how product skill changes with altitude and physiography. Conversely, SM2RAIN yields the lowest NSE and KGE across all basins, reflecting the weakest skill in predicting monthly streamflow. This is because the ASCAT sensor cannot distinguish liquid-water changes when the surface is frozen or insulated by snow, leading to unreliable soil-moisture increments [67]. Furthermore, as SM2RAIN receives the largest weight in the SNR-opt for the moderate rainfall, its mountain-specific errors can influence the merged field when the other parents (e.g., IMERG-late) are weak, explaining the slightly lower NSE of MGPD in the Koshi basin.
Overall, these findings underscore that the performance of the precipitation products for hydrological modeling can vary significantly among different basins, based on their specific characteristics. The results agree with Duan et al. [68], who emphasized that individual open-access precipitation datasets cannot replace ground-based measurements in the data-scarce region for accurate flow simulation. Thus, the merged product provides an alternative for efficient water management and planning.
4.2. Limitations and Future Directions
The findings of this study open several future research opportunities. However, it is also important to acknowledge some limitations. Firstly, while interpreting the results of this study, it should be noted that (i) GPDs were evaluated against point-scale rain-gauge observations; as each gauge samples only a small fraction of a 0.25° grid cell, some representativeness error may persist; (ii) only GPDs were used as forcings in hydrological modeling due to the limitations of gauged data, which could result in certain uncertainties compared to real-time hydrological responses, and (iii) HYMOD’s structural simplicity may oversimplify key processes like snowmelt and spatial heterogeneity in glacier-fed basins. These factors can affect the accuracy of water balance components beyond streamflow, such as soil erosion and groundwater recharge.
In addition, the SNR-opt merging method has its own inherent limitations. As a linear Ordinary Least Squares (OLSs) method, it is sensitive to outliers and assumes negligible off-diagonal elements in the error covariance matrix. Significant error correlations between datasets can reduce accuracy.
The future research can explore different combinations of open-source precipitation products based on spatial context, leveraging land-use and climate change. Similarly, the merged products can be evaluated at sub-daily scales for flash flood forecasting and validated in glacierized basins using process-based models to account for snowmelt.
5. Conclusions
Merging of the Gridded Precipitation Data (GPD) is a viable approach to reduce the uncertainties associated with individual parent GPDs. However, the effectiveness of merged precipitation products in hydrological simulations remains a challenge, especially in data-scarce and complex regions such as South Asia.
In this study, we employed the SNR-opt algorithm to merge three GPDs, i.e., ERA5, SM2RAIN, and IMERG-late, to produce Merged Gridded Precipitation Data (MGPD). This MGPD was then utilized to simulate the streamflow across three major basins (Koshi, Narayani, Karnali) in the Central Himalayas. From the analysis, our conclusions are as follows:
- (i)
- MGPD outperformed individual GPDs in terms of both magnitude errors and rainfall classification, effectively integrating diverse sources to reduce bias and random errors;
- (ii)
- Streamflow simulations using MGPD further demonstrated its superiority, benefitting from error compensation and bias minimization, leading to improved hydrological performance.
These results highlight the value of precipitation merging in hydrological applications, showing that integrating satellite, reanalysis, and soil moisture-derived datasets can significantly improve hydrological forecasting, particularly in ungauged and topographically complex regions.
Supplementary Materials
The following supporting information can be downloaded at https://www.mdpi.com/article/10.3390/rs17132170/s1.
Author Contributions
Conceptualization, S.S. and S.G.; methodology, S.G.; software, S.G.; validation, S.S. and M.H.; formal analysis, S.G.; resources, R.A. and S.K.; data curation, S.S.; writing—original draft preparation, S.G.; writing—review and editing, R.A., M.H. and M.A.; visualization, S.G., S.S. R.A. and M.H.; supervision, R.A., S.S. and S.K.; project administration, R.A., S.K. and S.S. All authors have read and agreed to the published version of the manuscript.
Funding
This research received no external funding.
Data Availability Statement
The datasets used in this research work are sourced from publicly available domains. IMERG late https://gpm.nasa.gov/data/directory (accessed on 15 January 2025), ERA-5 Re-analysis: https://www.ecmwf.int/en/forecasts/dataset/ecmwf-reanalysis-v5 (accessed on 22 January 2025), and SM2RAIN: https://zenodo.org/records/2580285#.XLrYDugzbIU (accessed on 28 January 2025).
Conflicts of Interest
The authors declare no conflicts of interest.
References
- Huffman, G.J.; Bolvin, D.T.; Braithwaite, D.; Hsu, K.-L.; Joyce, R.J.; Kidd, C.; Nelkin, E.J.; Sorooshian, S.; Stocker, E.F.; Tan, J. Integrated Multi-satellite Retrievals for the Global Precipitation Measurement (GPM) Mission (IMERG). In Satellite Precipitation Measurement: Volume 1; Levizzani, V., Kidd, C., Kirschbaum, D.B., Kummerow, C.D., Nakamura, K., Turk, F.J., Eds.; Springer International Publishing: Cham, Switzerland, 2020; pp. 343–353. [Google Scholar] [CrossRef]
- Ghomlaghi, A.; Nasseri, M.; Bayat, B. Comparing and Contrasting the Performance of High-Resolution Precipitation Products via Error Decomposition and Triple Collocation: An Application to Different Climate Classes of the Central Iran. J. Hydrol. 2022, 612, 128298. [Google Scholar] [CrossRef]
- Miri, M.; Masoudi, R.; Raziei, T. Performance Evaluation of Three Satellites-Based Precipitation Data Sets Over Iran. J. Indian Soc. Remote Sens. 2019, 47, 2073–2084. [Google Scholar] [CrossRef]
- Tudaji, M.; Nan, Y.; Tian, F. Assessing the value of high-resolution rainfall and streamflow data for hydrological modeling: An analysis based on 63 catchments in southeast China. Hydrol. Earth Syst. Sci. 2025, 29, 1919–1937. [Google Scholar] [CrossRef]
- Tang, G.; Clark, M.P.; Papalexiou, S.M.; Ma, Z.; Hong, Y. Have Satellite Precipitation Products Improved over Last Two Decades? A Comprehensive Comparison of GPM IMERG with Nine Satellite and Reanalysis Datasets. Remote Sens. Environ. 2020, 240, 111697. [Google Scholar] [CrossRef]
- Livneh, B.; Deems, J.S.; Schneider, D.; Barsugli, J.J.; Molotch, N.P. Filling in the gaps: Inferring spatially distributed precipitation from gauge observations over complex terrain. Water Resour. Res. 2014, 50, 8589–8610. [Google Scholar] [CrossRef]
- Serreze, M.C.; Clark, M.P.; Bromwich, D.H. Monitoring Precipitation over the Arctic Terrestrial Drainage System: Data Requirements, Shortcomings, and Applications of Atmospheric Reanalysis. April 2003. Available online: https://journals.ametsoc.org/view/journals/hydr/4/2/1525-7541_2003_4_387_mpotat_2_0_co_2.xml (accessed on 8 March 2025).
- Sun, Q.; Miao, C.; Duan, Q.; Ashouri, H.; Sorooshian, S.; Hsu, K.-L. A Review of Global Precipitation Data Sets: Data Sources, Estimation, and Intercomparisons. Rev. Geophys. 2018, 56, 79–107. [Google Scholar] [CrossRef]
- Beck, H.E.; Vergopolan, N.; Pan, M.; Levizzani, V.; van Dijk, A.I.J.M.; Weedon, G.P.; Brocca, L.; Pappenberger, F.; Huffman, G.J.; Wood, E.F. Global-scale evaluation of 22 precipitation datasets using gauge observations and hydrological modeling. Hydrol. Earth Syst. Sci. 2017, 21, 6201–6217. [Google Scholar] [CrossRef]
- Li, R.; Guilloteau, C.; Kirstetter, P.-E.; Foufoula-Georgiou, E. A New Event-Based Error Decomposition Scheme for Satellite Precipitation Products. Geophys. Res. Lett. 2023, 50, e2023GL105343. [Google Scholar] [CrossRef]
- Zhang, L.; Chen, X.; Lai, R.; Zhu, Z. Performance of satellite-based and reanalysis precipitation products under multi-temporal scales and extreme weather in mainland China. J. Hydrol. 2022, 605, 127389. [Google Scholar] [CrossRef]
- Zhang, K.; Zhao, L.; Yang, K.; Song, L.; Ni, X.; Han, X.; Ma, M.; Fan, L. Uncertainty Quantification of Satellite Soil Moisture Retrieved Precipitation in the Central Tibetan Plateau. Remote Sens. 2023, 15, 2600. [Google Scholar] [CrossRef]
- Zeng, Q.; Zhao, Q.; Luo, Y.-T.; Ma, S.-G.; Kang, Y.; Li, Y.-Q.; Chen, H.; Xu, C.-Y. Uncertainty estimation of hydrological modelling using gridded precipitation as model inputs in the Gandaki River Basin. J. Hydrol. Reg. Stud. 2024, 53, 101825. [Google Scholar] [CrossRef]
- Dong, J.; Crow, W.T.; Duan, Z.; Wei, L.; Lu, Y. A double instrumental variable method for geophysical product error estimation. Remote Sens. Environ. 2019, 225, 217–228. [Google Scholar] [CrossRef]
- Maggioni, V.; Vergara, H.J.; Anagnostou, E.N.; Gourley, J.J.; Hong, Y.; Stampoulis, D. Investigating the Applicability of Error Correction Ensembles of Satellite Rainfall Products in River Flow Simulations. J. Hydrometeorol. 2013, 14, 1194–1211. [Google Scholar] [CrossRef]
- Nikolopoulos, E.I.; Anagnostou, E.N.; Borga, M. Using High-Resolution Satellite Rainfall Products to Simulate a Major Flash Flood Event in Northern Italy. J. Hydrometeorol. 2013, 14, 171–185. [Google Scholar] [CrossRef]
- Falck, A.S.; Maggioni, V.; Tomasella, J.; Vila, D.A.; Diniz, F.L.R. Propagation of satellite precipitation uncertainties through a distributed hydrologic model: A case study in the Tocantins–Araguaia basin in Brazil. J. Hydrol. 2015, 527, 943–957. [Google Scholar] [CrossRef]
- Lorenz, C.; Kunstmann, H. The Hydrological Cycle in Three State-of-the-Art Reanalyses: Intercomparison and Performance Analysis. J. Hydrometeorol. 2012, 13, 1397–1420. [Google Scholar] [CrossRef]
- Baez-Villanueva, O.M.; Zambrano-Bigiarini, M.; Beck, H.E.; McNamara, I.; Ribbe, L.; Nauditt, A.; Birkel, C.; Verbist, K.; Giraldo-Osorio, J.D.; Thinh, N.X. RF-MEP: A novel Random Forest method for merging gridded precipitation products and ground-based measurements. Remote Sens. Environ. 2020, 239, 111606. [Google Scholar] [CrossRef]
- Zhang, L.; Li, X.; Zheng, D.; Zhang, K.; Ma, Q.; Zhao, Y.; Ge, Y. Merging multiple satellite-based precipitation products and gauge observations using a novel double machine learning approach. J. Hydrol. 2021, 594, 125969. [Google Scholar] [CrossRef]
- Kim, S.; Sharma, A.; Liu, Y.Y.; Young, S.I. Rethinking Satellite Data Merging: From Averaging to SNR Optimization. IEEE Trans. Geosci. Remote Sens. 2022, 60, 4405215. [Google Scholar] [CrossRef]
- Chen, S.; Xiong, L.; Ma, Q.; Kim, J.-S.; Chen, J.; Xu, C.-Y. Improving daily spatial precipitation estimates by merging gauge observation with multiple satellite-based precipitation products based on the geographically weighted ridge regression method. J. Hydrol. 2020, 589, 125156. [Google Scholar] [CrossRef]
- Ma, Y.; Yang, Y.; Han, Z.; Tang, G.; Maguire, L.; Chu, Z.; Hong, Y. Comprehensive evaluation of Ensemble Multi-Satellite Precipitation Dataset using the Dynamic Bayesian Model Averaging scheme over the Tibetan Plateau. J. Hydrol. 2017, 556, 634–644. [Google Scholar] [CrossRef]
- Beck, H.E.; van Dijk, A.I.J.M.; Levizzani, V.; Schellekens, J.; Miralles, D.G.; Martens, B.; de Roo, A. MSWEP: 3-hourly 0.25° global gridded precipitation (1979–2015) by merging gauge, satellite, and reanalysis data. Hydrol. Earth Syst. Sci. 2017, 21, 589–615. [Google Scholar] [CrossRef]
- Tian, F.; Hou, S.; Yang, L.; Hu, H.; Hou, A. How Does the Evaluation of the GPM IMERG Rainfall Product Depend on Gauge Density and Rainfall Intensity? J. Hydrometeorol. 2018, 19, 339–349. [Google Scholar] [CrossRef]
- Dong, J.; Crow, W.T.; Chen, X.; Tangdamrongsub, N.; Gao, M.; Sun, S.; Qiu, J.; Wei, L.; Gao, H.; Duan, Z. Statistical uncertainty analysis-based precipitation merging (SUPER): A new framework for improved global precipitation estimation. Remote Sens. Environ. 2023, 283, 113299. [Google Scholar] [CrossRef]
- Stoffelen, A. Toward the true near-surface wind speed: Error modeling and calibration using triple collocation. J. Geophys. Res. Oceans 1998, 103, 7755–7766. [Google Scholar] [CrossRef]
- Sjoberg, J.P.; Anthes, R.A.; Rieckh, T. The Three-Cornered Hat Method for Estimating Error Variances of Three or More Atmospheric Datasets. Part I: Overview and Evaluation. J. Atmos. Ocean. Technol. 2021, 38, 555–572. [Google Scholar] [CrossRef]
- Gruber, A.; Su, C.-H.; Crow, W.T.; Zwieback, S.; Dorigo, W.A.; Wagner, W. Estimating error cross-correlations in soil moisture data sets using extended collocation analysis. J. Geophys. Res. Atmos. 2016, 121, 1208–1219. [Google Scholar] [CrossRef]
- Duan, Z.; Duggan, E.; Chen, C.; Gao, H.; Dong, J.; Liu, J. Comparison of Traditional Method and Triple Collocation Analysis for Evaluation of Multiple Gridded Precipitation Products across Germany. J. Hydrometeorol. 2021, 1, 2983–2999. [Google Scholar] [CrossRef]
- Li, C.; Tang, G.; Hong, Y. Cross-evaluation of ground-based, multi-satellite and reanalysis precipitation products: Applicability of the Triple Collocation method across Mainland China. J. Hydrol. 2018, 562, 71–83. [Google Scholar] [CrossRef]
- Dong, J.; Lei, F.; Wei, L. Triple Collocation Based Multi-Source Precipitation Merging. Front. Water 2020, 2, 1. [Google Scholar] [CrossRef]
- Lyu, F.; Tang, G.; Behrangi, A.; Wang, T.; Tan, X.; Ma, Z.; Xiong, W. Precipitation Merging Based on the Triple Collocation Method across Mainland China. IEEE Trans. Geosci. Remote Sens. 2020, 59, 3161–3176. [Google Scholar] [CrossRef]
- Shah, S.; Liu, Y.; Kim, S.; Sharma, A. Advancing High-Mountain Precipitation Reconstruction Through Merging of Multiple Data Sources: Triple Collocation Versus Signal-to-Noise Ratio Optimization. IEEE Trans. Geosci. Remote Sens. 2024, 62, 4212315. [Google Scholar] [CrossRef]
- Gu, J.; Ye, Y.; Jiang, Y.; Guan, H.; Huang, J.; Cao, Y. Improving daily precipitation estimation using a double triple collocation-based (DTC) merging framework. J. Hydrol. 2025, 648, 132422. [Google Scholar] [CrossRef]
- Pan, M.; Fisher, C.K.; Chaney, N.W.; Zhan, W.; Crow, W.T.; Aires, F.; Entekhabi, D.; Wood, E.F. Triple collocation: Beyond three estimates and separation of structural/non-structural errors. Remote Sens. Environ. 2015, 171, 299–310. [Google Scholar] [CrossRef]
- Kim, S.; Shah, S.; Liu, Y.; Sharma, A. Improving Precipitation Merging: A Generalized Two-Stage Framework Using the Signal-to-Noise Ratio Optimization (SNR-opt). In Proceedings of the Copernicus Meetings, General Assembly 2025, Vienna, Austria, 27 April–2 May 2025; Copernicus Publications: Göttingen, Germany, 2025. EGU25-530. [Google Scholar] [CrossRef]
- Belay, H.; Melesse, A.M.; Tegegne, G. Merging Satellite Products and Rain-Gauge Observations to Improve Hydrological Simulation: A Review. Earth 2022, 3, 72. [Google Scholar] [CrossRef]
- Cao, D.; Li, H.; Hou, E.; Song, S.; Lai, C. Assessment and Hydrological Validation of Merged Near-Real-Time Satellite Precipitation Estimates Based on the Gauge-Free Triple Collocation Approach. Remote Sens. 2022, 14, 3835. [Google Scholar] [CrossRef]
- Uddin, K.; Shrestha, H.L.; Murthy, M.; Bajracharya, B.; Shrestha, B.; Gilani, H.; Pradhan, S.; Dangol, B. Development of 2010 national land cover database for the Nepal. J. Environ. Manag. 2015, 148, 82–90. [Google Scholar] [CrossRef]
- Paudel, B.; Panday, D.; Dhakal, K. Climate. In The Soils of Nepal; Ojha, R.B., Panday, D., Eds.; Springer International Publishing: Cham, Switzerland, 2021; pp. 15–27. [Google Scholar] [CrossRef]
- Hersbach, H.; Comyn-Platt, E.; Bell, B.; Berrisford, P.; Biavati, G.; Horányi, A.; Sabater, J.M.; Nicolas, J.; Peubey, C.; Radu, R.; et al. ERA5 Post-Processed Daily Statistics on Pressure Levels from 1940 to Present. In Copernicus Climate Change Service (C3S) Climate Data Store (CDS); 2023. Available online: https://cds.climate.copernicus.eu/datasets/derived-era5-pressure-levels-daily-statistics?tab=overview (accessed on 5 February 2025).
- Huffman, G.J.; Bolvin, D.T.; Joyce, R.; Nelkin, E.J.; Tan, J.; Braithwaite, D.; Hsu, K.; Kelley, O.A.; Nguyen, P.; Sorooshian, S.; et al. Algorithm Theoretical Basis Document (ATBD) for Integrated Multi-Satellite Retrievals for GPM (IMERG) Version 07; Technical Report; National Aeronautics and Space Administration (NASA), NASA Goddard Space Flight Center: Greenbelt, MD, USA, 2023. Available online: https://gpm.nasa.gov (accessed on 15 January 2025).
- Dee, D.P.; Uppala, S.M.; Simmons, A.J.; Berrisford, P.; Poli, P.; Kobayashi, S.; Andrae, U.; Balmaseda, M.A.; Balsamo, G.; Bauer, P.; et al. The ERA-Interim reanalysis: Configuration and performance of the data assimilation system. Q. J. R. Meteorol. Soc. 2011, 137, 553–597. [Google Scholar] [CrossRef]
- Brocca, L.; Filippucci, P.; Hahn, S.; Ciabatta, L.; Massari, C.; Camici, S.; Schüller, L.; Bojkov, B.; Wagner, W. SM2RAIN-ASCAT (2007-2018): Global daily satellite rainfall data from ASCAT soil moisture observations. Earth Syst. Sci. Data 2019, 11, 1583–1601. [Google Scholar] [CrossRef]
- Boyle, D.P.; Gupta, H.V.; Sorooshian, S. Multicriteria calibration of hydrologic models. Calibration Watershed Models 2011, 6, 185–196. [Google Scholar] [CrossRef]
- Sun, W.; Ishidaira, H.; Bastola, S. Towards improving river discharge estimation in ungauged basins: Calibration of rainfall-runoff models based on satellite observations of river flow width at basin outlet. Hydrol. Earth Syst. Sci. 2010, 14, 2011–2022. [Google Scholar] [CrossRef]
- Quan, Z.; Teng, J.; Sun, W.; Cheng, T.; Zhang, J. Evaluation of the HYMOD model for rainfall-runoff simulation using the GLUE method. In Remote Sensing and GIS for Hydrology and Water Resources (Proceedings RSHS14 and ICGRHWE14, Guangzhou, China, August 2014); IAHS Publ. 368; Copernicus GmbH: Wallingford, UK, 2015; pp. 180–185. [Google Scholar] [CrossRef]
- Bastola, S. The regionalization of a parameter of HYMOD, a conceptual hydrological model, using data from across the globe. HydroResearch 2022, 5, 13–21. [Google Scholar] [CrossRef]
- Oudin, L.; Hervieu, F.; Michel, C.; Perrin, C.; Andréassian, V.; Anctil, F.; Loumagne, C. Which potential evapotranspiration input for a lumped rainfall-runoff model? Part 2—Towards a simple and efficient potential evapotranspiration model for rainfall-runoff modelling. J. Hydrol. 2005, 303, 290–306. [Google Scholar] [CrossRef]
- Chen, C.; Chen, Q.; Duan, Z.; Zhang, J.; Mo, K.; Li, Z.; Tang, G. Multiscale Comparative Evaluation of the GPM IMERG v5 and TRMM 3B42 v7 Precipitation Products from 2015 to 2017 over a Climate Transition Area of China. Remote Sens. 2018, 10, 944. [Google Scholar] [CrossRef]
- Zhang, X.; Alexander, L.; Hegerl, G.C.; Jones, P.; Tank, A.K.; Peterson, T.C.; Trewin, B.; Zwiers, F.W. Indices for monitoring changes in extremes based on daily temperature and precipitation data. WIREs Clim. Change 2011, 2, 851–870. [Google Scholar] [CrossRef]
- de Medeiros, F.J.; de Oliveira, C.P.; Avila-Diaz, A. Evaluation of extreme precipitation climate indices and their projected changes for Brazil: From CMIP3 to CMIP6. Weather Clim. Extrem. 2022, 38, 100511. [Google Scholar] [CrossRef]
- Brocca, L.; Ciabatta, L.; Massari, C.; Moramarco, T.; Hahn, S.; Hasenauer, S.; Kidd, R.; Dorigo, W.; Wagner, W.; Levizzani, V. Soil as a natural rain gauge: Estimating global rainfall from satellite soil moisture data. J. Geophys. Res. Atmos. 2014, 119, 5128–5141. [Google Scholar] [CrossRef]
- Bogerd, L.; Overeem, A.; Leijnse, H.; Uijlenhoet, R. A Comprehensive Five-Year Evaluation of IMERG Late Run Precipitation Estimates over the Netherlands. J. Hydrometeorol. 2021, 1, 1855–1868. [Google Scholar] [CrossRef]
- Knoben, W.J.M.; Freer, J.E.; Woods, R.A. Technical note: Inherent benchmark or not? Comparing Nash–Sutcliffe and Kling–Gupta efficiency scores. Hydrol. Earth Syst. Sci. 2019, 23, 4323–4331. [Google Scholar] [CrossRef]
- Xin, Y.; Lu, N.; Jiang, H.; Liu, Y.; Yao, L. Performance of ERA5 reanalysis precipitation products in the Guangdong-Hong Kong-Macao greater Bay Area, China. J. Hydrol. 2021, 602, 126791. [Google Scholar] [CrossRef]
- Biswas, S.; Singh, C.; Bharti, V. An assessment of GPM IMERG Version 7 rainfall estimates over the North West Himalayan region. Atmos. Res. 2025, 315, 107910. [Google Scholar] [CrossRef]
- Li, Z.; Wang, H.; Zhang, T.; Zeng, Q.; Xiang, J.; Liu, Z.; Yang, R. Multi-Source Precipitation Data Merging for High-Resolution Daily Rainfall in Complex Terrain. Remote Sens. 2023, 15, 4345. [Google Scholar] [CrossRef]
- Hersbach, H.; Bell, B.; Berrisford, P.; Hirahara, S.; Horányi, A.; Muñoz-Sabater, J.; Nicolas, J.; Peubey, C.; Radu, R.; Schepers, D.; et al. The ERA5 global reanalysis. Q. J. R. Meteorol. Soc. 2020, 146, 1999–2049. [Google Scholar] [CrossRef]
- Lei, H.; Zhao, H.; Ao, T. A two-step merging strategy for incorporating multi-source precipitation products and gauge observations using machine learning classification and regression over China. Hydrol. Earth Syst. Sci. 2022, 26, 2969–2995. [Google Scholar] [CrossRef]
- Tan, J.; Huffman, G.J.; Bolvin, D.T.; Nelkin, E.J. IMERG V06: Changes to the Morphing Algorithm. J. Atmos. Ocean. Technol. 2019, 36, 2471–2482. [Google Scholar] [CrossRef]
- Ouyang, L.; Lu, H.; Yang, K.; Leung, L.R.; Wang, Y.; Zhao, L.; Zhou, X.; Zhu, L.; Chen, Y.; Jiang, Y.; et al. Characterizing Uncertainties in Ground ‘Truth’ of Precipitation Over Complex Terrain Through High-Resolution Numerical Modeling. Geophys. Res. Lett. 2021, 48, e2020GL091950. [Google Scholar] [CrossRef]
- Maggioni, V.; Meyers, P.C.; Robinson, M.D. A Review of Merged High-Resolution Satellite Precipitation Product Accuracy during the Tropical Rainfall Measuring Mission (TRMM) Era. J. Hydrometeorol. 2016, 17, 1101–1117. [Google Scholar] [CrossRef]
- Gao, Z.; Tang, G.; Jing, W.; Hou, Z.; Yang, J.; Sun, J. Evaluation of Multiple Satellite, Reanalysis, and Merged Precipitation Products for Hydrological Modeling in the Data-Scarce Tributaries of the Pearl River Basin, China. Remote Sens. 2023, 15, 5349. [Google Scholar] [CrossRef]
- Rahman, K.U.; Shang, S.; Shahid, M.; Wen, Y. Hydrological evaluation of merged satellite precipitation datasets for streamflow simulation using SWAT: A case study of Potohar Plateau, Pakistan. J. Hydrol. 2020, 587, 125040. [Google Scholar] [CrossRef]
- Chiaravalloti, F.; Brocca, L.; Procopio, A.; Massari, C.; Gabriele, S. Assessment of GPM and SM2RAIN-ASCAT rainfall products over complex terrain in southern Italy. Atmos. Res. 2018, 206, 64–74. [Google Scholar] [CrossRef]
- Duan, Z.; Tuo, Y.; Liu, J.; Gao, H.; Song, X.; Zhang, Z.; Yang, L.; Mekonnen, D.F. Hydrological evaluation of open-access precipitation and air temperature datasets using SWAT in a poorly gauged basin in Ethiopia. J. Hydrol. 2019, 569, 612–626. [Google Scholar] [CrossRef]


Disclaimer/Publisher’s Note: The statements, opinions and data contained in all publications are solely those of the individual author(s) and contributor(s) and not of MDPI and/or the editor(s). MDPI and/or the editor(s) disclaim responsibility for any injury to people or property resulting from any ideas, methods, instructions or products referred to in the content. |
© 2025 by the authors. Licensee MDPI, Basel, Switzerland. This article is an open access article distributed under the terms and conditions of the Creative Commons Attribution (CC BY) license (https://creativecommons.org/licenses/by/4.0/).