Article

A Cooperative GNSS Vector-DLL (CoVDLL) Method for Multiple UAVs Positioning

1
College of Automation Engineering, Nanjing University of Aeronautics and Astronautics, Nanjing 210016, China
2
Guangdong Laboratory of Artificial Intelligence and Digital Economy (SZ), Shenzhen 518060, China
3
School of Physics and Optoelectronic Engineering, Hangzhou Institute for Advanced Study (UCAS), Hangzhou 310024, China
*
Author to whom correspondence should be addressed.
Remote Sens. 2025, 17(13), 2156; https://doi.org/10.3390/rs17132156
Submission received: 8 March 2025 / Revised: 8 June 2025 / Accepted: 12 June 2025 / Published: 23 June 2025
(This article belongs to the Topic GNSS Measurement Technique in Aerial Navigation)

Abstract

Currently, the Global Navigation Satellite System (GNSS) plays a critical role in providing position information for UAVs. Traditional GNSS receivers typically employ the scalar-tracking (ST) method to track signals and extract observations. An advanced alternative to ST is the Vector Delay Lock Loop (VDLL), which enables more reliable navigation solution estimation for GNSS receivers. To enhance GNSS positioning performance for UAVs, this paper proposes a cooperative VDLL (CoVDLL) that incorporates ranging information. While single VDLL (S-VDLL) explores the inherent relationship between signal tracking parameters and navigation solutions, the CoVDLL leverages signal tracking parameters from multiple UAVs along with their ranging data. To optimize navigation solution estimation in the CoVDLL, a Factor Graph Optimization (FGO) algorithm is employed to realize the navigation solution’s optimal estimation. Experiments conducted under various settings demonstrate that the CoVDLL method reduces positioning errors by an average of approximately 30% compared to the single-VDLL approach.

1. Introduction

The Global Navigation Satellite System (GNSS) has been extensively employed across various applications, including Unmanned Aerial Vehicles (UAVs) [1,2]. GNSS receivers provide Position, Velocity, and Time (PVT) information when enough satellites are in view. In the UAV positioning applications, this PVT information serves as critical guidance data, enabling the UAV to follow predefined trajectories and land accurately at designated destinations [1,2,3]. Moreover, for UAV swarm operations, precise positioning is essential for organizing and controlling the swarm to execute specific tasks effectively. The accuracy of this positioning information is a pivotal factor that determines the performance of UAV swarms in mission execution. Therefore, investigating methods to enhance GNSS positioning accuracy, particularly for UAV swarm applications, is of paramount importance.
Two promising approaches have emerged with significant potential to improve GNSS positioning accuracy for UAV swarms. The first approach involves advanced GNSS signal tracking and positioning technologies, i.e., vector tracking (VT). The second approach leverages cooperative ranging information among UAV swarms [4,5]. Cooperative positioning and navigation have proven effective in enhancing both accuracy and robustness, facilitating mutual assistance among individual UAVs within the swarm [4,5,6]. Inter-ranging measurements are exploited in the cooperative GNSS for UAV swarms, in which the GNSS is built based on the scalar tracking [7,8,9,10,11]. UWB is usually employed to measure the inter-ranging information [7,8,9,10,11]. These methods hold great promise for advancing the capabilities of UAV swarms in complex operational environments.
VT is an advanced GNSS signal tracking technology that fully leverages the fact that all channels share the same Position, Velocity, and Time (PVT) information in a receiver [12,13]. In VT, a navigation filter—typically a Kalman filter—is used to simultaneously perform signal tracking and PVT information estimation [13,14,15,16,17,18]. Measurements such as frequency errors and code phase errors, derived from frequency and code discriminators, are input into the navigation filter to estimate the system states. These estimated states, along with the PVT information, are used to update and predict signal tracking parameters [18]. Previous studies have extensively investigated, compared, and presented both VT and scalar-tracking technologies [19,20,21,22,23,24,25,26,27]. A wealth of research and experimental data demonstrate that VT outperforms scalar tracking in various aspects [19,20,21,22,23,24,25,26,27]. The advantages of VT over scalar tracking can be summarized as follows: (1) Improved sensitivity: VT maintains lock on weak signals better than scalar tracking, owing to its collective processing of signals; (2) robustness against interference: by integrating data from multiple satellites, VT is more resistant to signal blockage and interference, providing higher accuracy in challenging environments such as urban canyons or dense foliage; (3) enhanced multipath mitigation: the centralized processing of signals enables VT to mitigate multipath effects, as the combined signals can help distinguish between direct and reflected signals; (4) faster reacquisition: VT accelerates the signal reacquisition process, quickly recovering signals after temporary losses due to its joint processing of signals.
In addition to advancements in GNSS signal tracking technologies, significant research has been conducted on cooperative GNSS algorithms to enhance positioning accuracy [7,9,11,28,29,30,31,32] Unlike conventional GNSS systems that depend on standalone receivers operating in isolation, cooperative GNSS employs a collaborative approach among multiple receivers to improve overall performance, accuracy, and reliability. This innovative methodology involves the exchange of information between multiple GNSS receivers to enhance both positioning accuracy and system robustness [33,34].
The cooperative framework can be implemented through various strategies, including the sharing of raw satellite observations, computed positions, or error correction data. The core principle of this approach lies in utilizing spatial diversity and the complementary perspectives of different receivers to address common challenges such as signal obstructions, multipath effects, and interference [7,11,28,33,34]. Cooperative GNSS systems can range from basic data-sharing configurations to sophisticated networked architectures. At its most fundamental level, receivers exchange raw GNSS data, which is then processed collectively to refine positioning solutions. More advanced implementations involve network-based systems where a centralized server aggregates data from multiple receivers, processes the information, and disseminates enhanced positioning data back to users [7,11,28].
The advantages of cooperative GNSS can be categorized as follows: (a) Enhanced positioning accuracy: by integrating data from multiple sources, cooperative GNSS can substantially mitigate errors associated with atmospheric disturbances, satellite clock biases, and orbital inaccuracies; (b) improved system robustness: the collaborative nature of this approach effectively reduces the impact of signal blockages and multipath effects, which are particularly prevalent in urban environments and other challenging operational scenarios. Their advantages are demonstrated with the cooperative scalar tracking-based GNSS [7,11,28,29,34]. In view of the difference between the VT and scalar tracking, cooperative VT can realize mutual aiding between the GNSS receivers and improve the VT performance. On the contrary, the scalar-tracking GNSS cannot realize the signal-tracking mutual aiding because the navigation solutions cannot be fed back to aid the signal tracking in the scalar tracking.
Recently, researchers paid attention to the robustness of the VT; some adaptive methods are proposed to enhance the navigation data estimation and signal tracking [23,29]. The cooperative scheme utilizing the mutual information from the UAV swarm is ignored, and it has great potential in improving the VT performance. Given the distinct advantages of VT and cooperative GNSS technologies, it is crucial to explore their integration in the context of UAV positioning and navigation applications. This paper introduces a novel CoVDLL method designed to enhance the positioning accuracy of UAV swarms. The key contributions of this work are outlined as follows:
(1)
In view of the VT technology utilizing the navigation data to predict signal tracking parameters, full usage of the mutual navigation information from the UAV swarm has great potential to improve the positioning accuracy. This study explores the application of VT technology in UAV GNSS positioning and proposes a CoVDLL framework to improve the positioning accuracy of UAV swarms. Additionally, an inter-ranging-based cooperative positioning model for UAVs is developed and thoroughly investigated.
(2)
Based on the inter-ranging information, the state vector of the CoVDLL is constructed. A Factor Graph Optimization (FGO) method is incorporated with the CoVDLL to realize the optimal estimation of the UAV swarms’ position. A cost function is defined, including the VDLL measurement factor, state transformation factor, and the inter-ranging factor. A nonlinear solver is employed to solve for the state estimation with the cost function.
Reminder: the paper is organized as Section 2 describes the vector tracking mechanism, equations, and the navigation filter; Section 3 introduces the cooperative vector tracking and the FGO method; Experiments and the results are presented and analyzed in the following Section 4. Finally, the results are discussed, future works are suggested, and the conclusion is draw.

2. Phase Lock Loop Assisted Vector Delay Lock Loop (PLL-A-DLL)

As previously mentioned, a conventional GNSS receiver employs a Phase-Locked Loop (PLL) to track carrier signals and a Delay-Locked Loop (DLL) to track the C/A ranging code. Pseudo-range and pseudo-range rate measurements are independently extracted from all tracking channels, and a least squares or Kalman Filter algorithm is used to compute the Position, Velocity, and Time (PVT) information [7,27,33,34]. In this study, a PLL-assisted Vector Delay-Locked Loop (PLL-A-VDLL) architecture is adopted as the foundational framework for developing the cooperative VDLL. The structure of the PLL-A-VDLL GNSS receiver is illustrated in Figure 1.
The GNSS signal undergoes initial sampling and down-conversion to an intermediate frequency (IF). The acquired satellite signals within the IF signal are then distributed to individual channels for signal tracking. In each tracking channel, the incoming signal is multiplied with local carrier signal replicas in both the in-phase and quadrature arms [22,23]. Subsequently, the signal is correlated with three local code replicas, spaced at intervals of 0.5 chips. Following integration and dumping, carrier and code discriminators are employed to extract the carrier phase errors and code phase errors between the incoming signals and the local signal replicas.
In the carrier signal tracking process, the discriminator outputs from all tracking channels are fed back into the carrier loop filter. The local carrier signal replica is then updated by the carrier Numerically Controlled Oscillator (NCO) based on the outputs of the carrier loop filter. The results of the carrier signal tracking, specifically the Doppler shifts, serve as measurements for the navigation processor, which utilizes an Extended Kalman Filter (EKF). For code tracking, the code discriminator outputs from all channels are used as inputs to the navigation processor [7,27,33,34].
The navigation solutions generated by the EKF are fed back to the tracking channels to adjust the code signal tracking parameters. New local signal replicas are generated and multiplied with the incoming signals. Updated measurements from the carrier and code discriminators are then processed by the navigation processor EKF to produce new navigation solutions. As illustrated in Figure 1, prior ephemeris data are required while the navigation solutions are fed back to update the signal tracking parameters. Specifically, the Line-Of-Sight (LOS) vector is calculated using the satellite positions from the ephemeris and the user receiver position. The changes in Position, Velocity, and Time (PVT) are projected onto the LOS direction between the satellite and the user receiver to determine the signal tracking parameters [23].
PVT changes are regarded as the state vector in the EKF. The state vector of the navigation processor EKF. The error state vector X is defined as
X = [ Δ p   Δ v   Δ t b   Δ t d ] 8 × 1 T
where state Δ p = Δ p x   Δ p y   Δ p z denotes the three-dimensional position error vector in the Earth-Centered-Earth-Fixed (ECEF) coordinates; Δ v = Δ v x   Δ v y   Δ v z denotes the three-dimensional velocity errors vector; Δ t b denote the time bias error and Δ t d denotes the time drift error; in addition, the units of the Δ t b and Δ t d are meter and meters per second.
The state propagation model is expressed as
X k + 1 = Δ p Δ v Δ t b Δ t d k + 1 = F k , k + 1 X k + W = I 3 × 3   T I 3 × 3 0 3 × 2 0 3 × 3 I 3 × 3 0 3 × 2 0 2 × 3 0 2 × 3 T 2 × 2 k , k + 1 Δ p Δ v Δ t b Δ t d k + W
T 2 × 2 = 1   T 0   1
where F k , k + 1 denotes the state transformation matrix, T denotes the updating period and W denotes the process noise vector.
In the EKF, pseudo-range error Δ ρ and pseudo-range rate error Δ ρ ˙ from each tracking channel are employed in the measurement vector Z . Pseudo-range error for i t h satellite at k + 1 t h epoch is expressed as
Δ ρ k + 1 i = Δ τ k + 1 i c f C / A
where Δ τ k + 1 i denotes the code phase error extracted from the code discriminator; Δ ρ k + 1 i denotes the pseudo-range error; the constant c denotes the light speed; f C / A is the C/A code frequency, which is 1.023 MHz. In the VDLL, the relationship between the code phase error and position is illustrated in the following Figure 2. The position error vector is projected to the LOS vector between the user receiver and the satellite. The relationship between the position increment and the code phase error is modeled as
Δ τ k + 1 i = Δ p T L O S k + 1 i + c Δ t b , k + 1 + ω k + 1 i
where L O S k + 1 i denotes the Line-Of-Sight (LOS) vector at the k + 1 t h epoch for i t h satellite; Δ t b , k + 1 denotes the time bias increment; and ω k + 1 i denotes the C/A code noise. One thing to note is that the model is constructed assuming that the Ionosphere and Troposphere factor-induced code phase errors are compensated.
Similarly, the pseudo-range rate error Δ ρ ˙ is expressed as
Δ ρ ˙ k + 1 i = Δ f D o p p l e r i c f L 1
where f D o p p l e r i denotes the doppler shift frequency extracted from the carrier signal tracking with unit Hz; the variable f L 1 denotes the GPS L1 carrier signal frequency (1575.42 MHz). The relationship between the position increment and the code phase error is modeled as
Δ f D o p p l e r i = Δ v T L O S k + 1 i + c Δ t d , k + 1 + η k + 1 i
where L O S k + 1 i denotes the LOS vector at the k + 1 t h epoch for i t h satellite; Δ t d , k + 1 denotes the time drift increment, and η k + 1 i denotes the carrier frequency doppler measurement noise.
Assuming there are N well-tracked in-view satellites, the measurement model is expressed as
Z k + 1 = Δ ρ k + 1 Δ ρ ˙ k + 1 = H k + 1 X k + 1 + Λ
Δ ρ k + 1 = Δ ρ k + 1 1 Δ ρ k + 1 i Δ ρ k + 1 N T
Δ ρ ˙ k + 1 = Δ ρ ˙ k + 1 1 Δ ρ ˙ k + 1 i Δ ρ ˙ k + 1 N T
where the superscript i denote the satellite index, Λ denotes the measurement noise vector, H denotes the observation matrix expressed as
H = L O S x 1 L O S y 1 L O S z 1       0       0       0       1       0 L O S x i L O S y i L O S z i       0       0       0       1       0                             L O S x N L O S y N L O S z N       0       0       0       1       0       0         0       0 L O S x 1 L O S y 1 L O S z 1       0       1                                                                 0         0       0 L O S x i L O S y i L O S z i       0       1                                                                             0         0       0 L O S x N L O S y N L O S z N       0       1
where L O S i = L O S x i L O S y i L O S z i denotes the LOS vector from the user receiver to the i t h satellite.
With the system propagation and measurement models set up in the Equations (1)–(11), the Extended Kalman Filter (EKF) is executed. In the EKF, the first step includes the state vector and covariance matrix prediction.
X k + 1 = F k , k + 1 X k  
Γ k + 1 = F k , k + 1 Γ k F k , k + 1 T + Q
where X k + 1 means the predicted state according to the system propagation model; Q is the prediction noise covariance diagonal matrix with the size of 8 × 8 and Γ k + 1 is the predicted covariance matrix.
X ^ k + 1 = X k + 1 + K k + 1 Z k + 1 H k + 1 X k + 1
K k + 1 = Γ k + 1 H k + 1 T H k + 1 Γ k , k + 1 H k + 1 T + R 1
Γ k + 1 = I 2 × 2 K k + 1 H k + 1 Γ k + 1
where K k + 1 means the Kalman gain matrix; R denotes the measurement noise covariance diagonal matrix with size of 8 × 8 size; I 8 × 8 means an identity matrix with 8 × 8 size here.

3. Cooperative Vector Delay Lock Loop

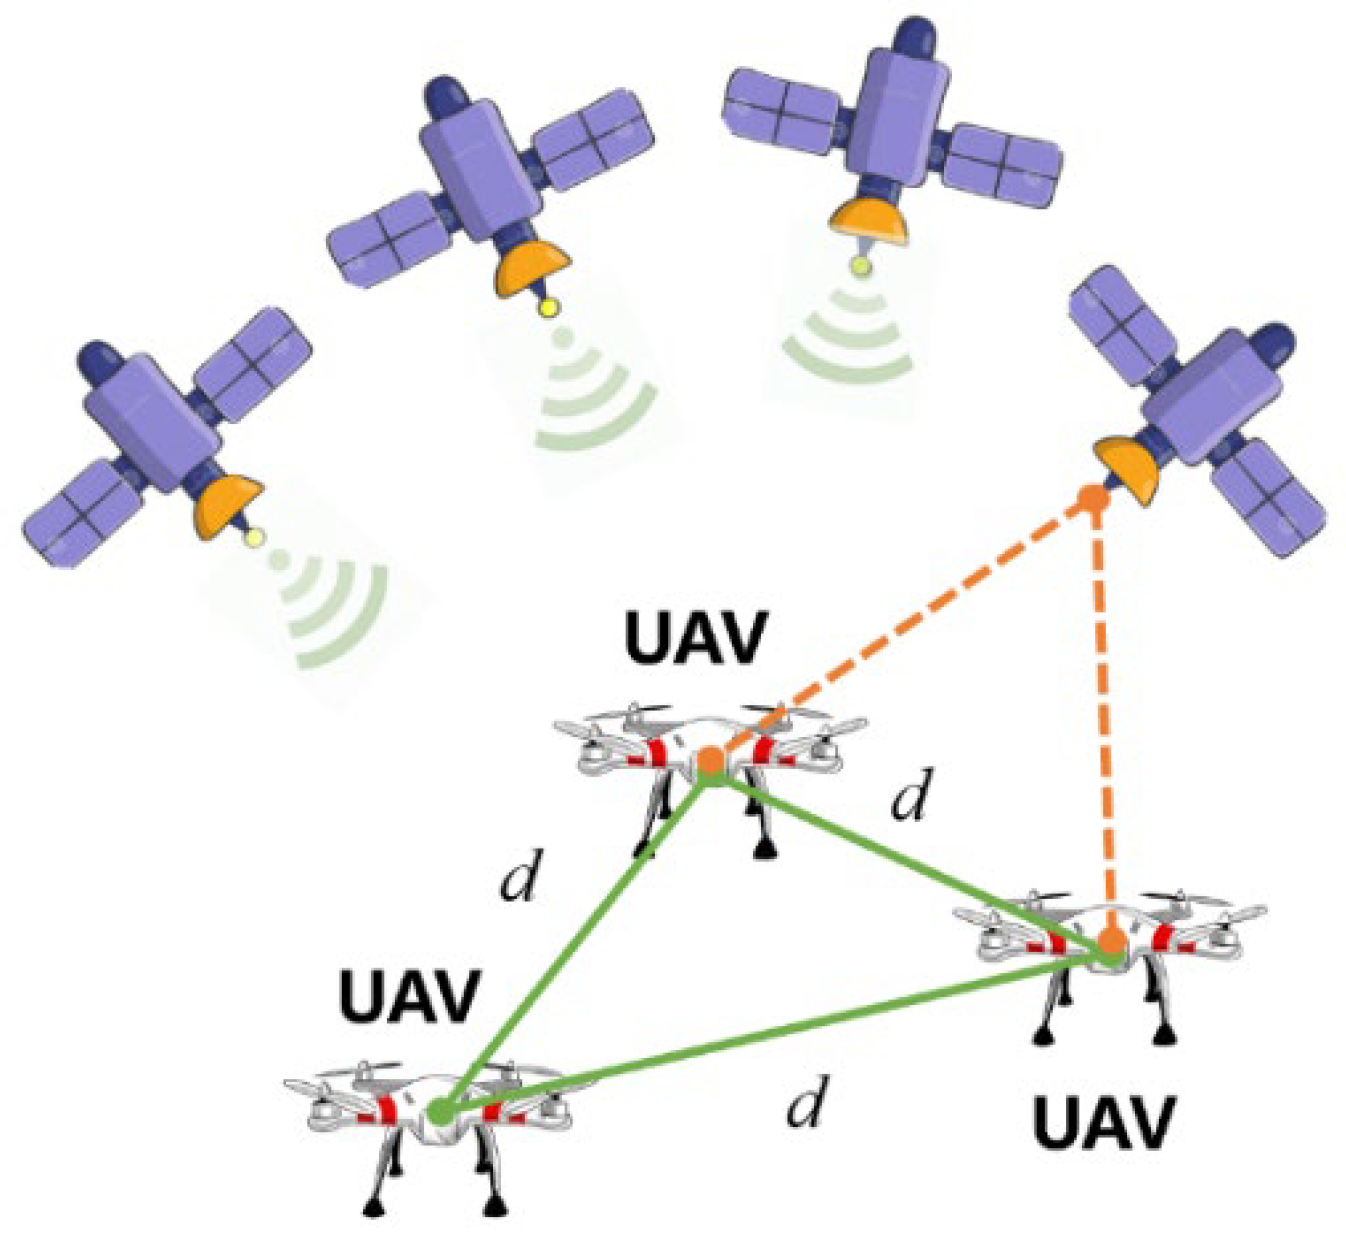
As aforementioned, in the VDLL, signal tracking is carried out by utilizing the inherent relationship between the navigation solutions and signal tracking parameters. Superior performance of the VDLL comes from fully utilizing the characteristic that all the tracking channels share the same navigation solutions. Predicted position is employed to calculate the code phase and accomplish the local signal replica updating. In this way, the channel with strong signals can help the channels with weak signals. In the multiple UAVs, ranging measurement between the UAV individuals could be utilized. Ranging information can be utilized to construct cooperative VDLL with multiple UAVs. Figure 3 shows the schematic illustration of the multiple UAV system. VDLLs from different UAVs are correlated through the inter-ranging information between these UAVs. Navigation solutions are estimated cooperatively with the VDLLs. An FGO method is employed to construct the CoVDLL system.

3.1. Factor Graph Optimization

Factor Graph Optimization (FGO) is an efficient algorithm widely used to solve complex optimization problems by decomposing them into smaller, more manageable components [9,29]. In the FGO, the variables are nodes, and the constraints are regarded as factors connecting these nodes. The optimization process involves iteratively updating the variables based on messages passed between nodes and factors, aiming to converge to the optimal solution. One of the key advantages of the FGO is its ability to handle various types of constraints and dependencies in a unified framework, making it applicable to a wide range of problems across different domains such as computer vision, robotics, and machine learning [9,29]. By exploiting the graphical structure of the problem, the FGO algorithm can efficiently explore the solution space and find high-quality solutions even in large-scale, highly nonlinear optimization problems.
In the factor graph, the states’ probability relationship is usually described by a joint probability density function of a set of variables.
f θ 1 , , θ N = i = 1 N f θ i | θ 1 , , θ i 1
where θ = θ 1 , , θ N denotes a set of variables, f denotes the joint density function.
Based on the joint probability density function, optimal estimates of the states are realized through solving for the maximum values of the transformed global function. The state’s optimal estimation is expressed as
θ ^ = argmax θ G θ 1 , θ 2 , , θ N
where G is the global function, which is normally divided into different factors.
G X 1 , X 2 , , X N = j = 1 m f λ j
where λ j X 1 , X 2 , , X N .
Therefore, the state estimation can be expressed as
θ ^ = argmax θ G θ 1 , θ 2 , , θ N = argmax θ j = 1 m f λ j
Each factor has a corresponding cost function, which is usually expressed as
f λ j exp 1 2 ξ 2
where the ξ denotes the residual vector, and the function ξ 2 is described as
ξ 2 = ξ T 1 ξ
Finding the optimal estimates of the states can be described as
arg min θ log G θ 1 , θ 2 , , θ N = arg min θ 1 2 i ξ i i 2
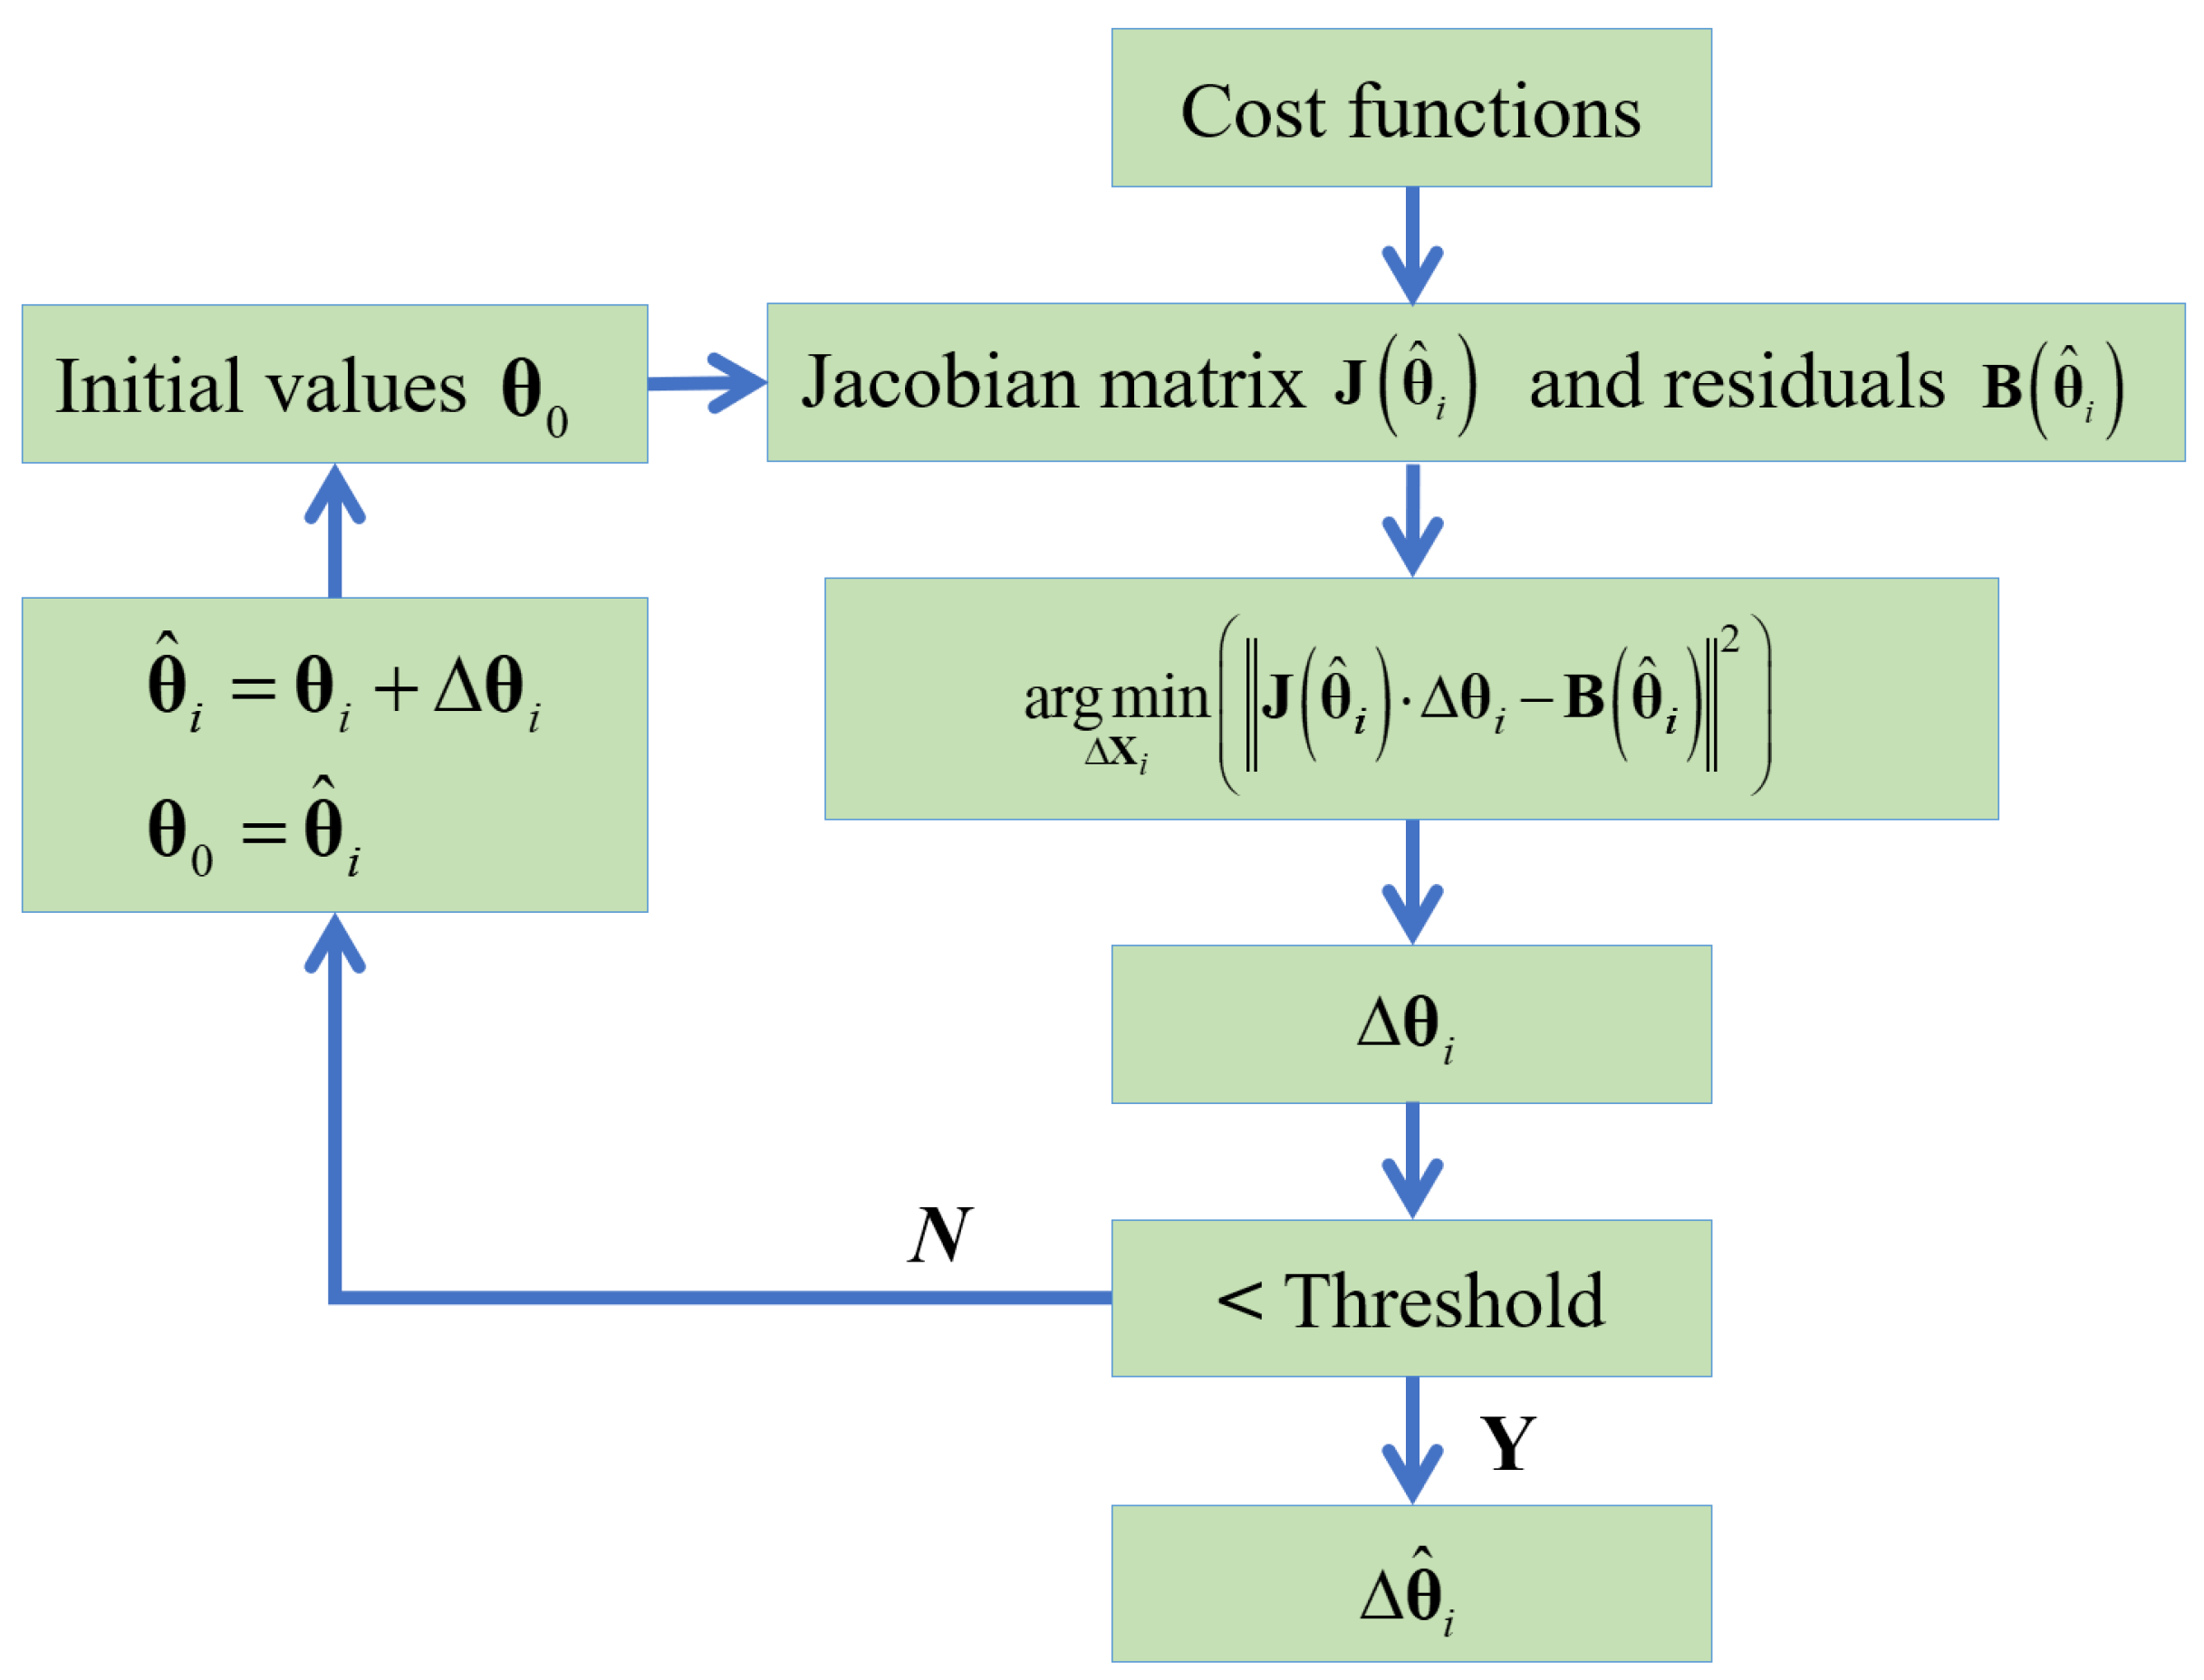
Normally, we solve for the state increments and correct the set initial states. Optimal state estimates are realized while the residuals or the iteration count meets set thresholds. Increments estimation can be described as
Δ θ i = arg min Δ θ i ln f Δ θ i = J θ ^ i Δ θ i B θ ^ i 2
where J θ ^ i is the Jacobian matrix, B θ ^ i denotes the residuals. The iteration process is summarized as:
First Step: set up the cost functions for each state constraint and define the state’s initial state values θ ^ i = θ 0
Second Step: determining the Jacobian matrix J θ ^ i and the residuals B θ ^ i at the value θ ^ i = θ 0 ;
Third Step: calculating and updating the state increments Δ X i using the equation J θ ^ i Δ θ i = B θ ^ i
Fourth Step: correcting and updating the state vector θ ^ i = θ i + Δ θ i .
Repeat the steps (1–4) until the iteration count satisfies the pre-defined threshold or the residuals meet the pre-defined threshold. The iterative process is presented in the Figure 4.

3.2. CoVDLL

In the CoVDLL system, different VDLLs in the UAVs are correlated with the ranging measurements. In another way, the VDLL states are correlated with the ranging measurements, which are regarded as constraints in the FGO algorithm. Based on the factor graph theory presented in sub-Section 3.1, the CoVDLL factor graph is presented in Figure 5. There are three factors in the CoVDLL system, i.e., state transformation factor, measurement factor, and cooperative ranging factor. For clearly presenting the relationship between the constraints and factors, Figure 5 presents the factor graph with the assumption that there are three UAVs. In addition, the following descriptions are illustrated with the assumption that there are three UAVs in the system. The state vector of the multiple VDLLs is defined as
X = X U 1 , X U 2 , X U 3 T
where
X U 1 = X 1 U 1 , X 2 U 1 , , X k U 1 T
X U 2 = X 1 U 2 , X 2 U 2 , , X k U 2 T
X U 3 = X 1 U 3 , X 2 U 3 , , X k U 3 T
the superscript U 1 , U 2 and U 3 denote the index of the UAV, and the subscript k denotes the epoch.
In the CoVDLL system, there are a total of three factors defined as the state transformation factor, the measurement factor, and the cooperative ranging factor.
(1)
State transformation factor
As described in the Equation (2), the consecutive state vectors are correlated with the state propagation model. The state transformation factor is described as
X k + 1 U i = F k , k + 1 U i X k U i + N 0 , Σ k + 1 U i , t r a n s
X k + 1 = h t r a n s X k + N 0 , Σ k + 1 t r a n s
The cost function is defined as
E k + 1 t r a n s Σ k + 1 t r a n s 2 = X k + 1 h t r a n s X k Σ k + 1 t r a n s 2
where E k + 1 t r a n s denotes the costs at k + 1 epoch, the Σ k + 1 t r a n s is the covariance matrix.
(2)
Measurement Factor
Relationship between the state vector and the measurements is defined as
Z k + 1 U i = H k + 1 U i X k + 1 U i + N 0 , Σ k + 1 U i , M
Z i + 1 = h M X i + 1 + N 0 , Σ i + 1 M
Similarly, the cost function of the measurement factor is defined as
E i + 1 M Σ i + 1 M 2 = Z i + 1 h M X i + 1 Σ i + 1 M 2  
where E k + 1 M denotes the costs at k + 1 epoch, the Σ k + 1 t r a n s is the covariance matrix.
(3)
Cooperative Ranging Factor
Relationship between the cooperative ranging measurement d k U i j is defined as
d k + 1 U i j d k U i j = Δ p k + 1 U i Δ p k + 1 U j + N 0 , Σ k + 1 U i j , D
E k + 1 D i j Σ k + 1 D 2 = d k + 1 U i j d k U i j Δ p k + 1 U i Δ p k + 1 U j Σ k + 1 D i j 2 = Z k + 1 D i j h D i j X k + 1 Σ k + 1 D i j 2  
In summary, in the CoVDLL system, the global cost function is defined as
X = arg min k + 1 N E k + 1 t r a n s Σ k + 1 t r a n s 2 + E i + 1 M Σ i + 1 M 2 + E k + 1 D 1 2 Σ k + 1 D 2 + E k + 1 D 1 3 Σ k + 1 D 2 + E k + 1 D 2 3 Σ k + 1 D 2  
where the function arg min means minimizing the cost function.

4. Experimental Results and Analysis

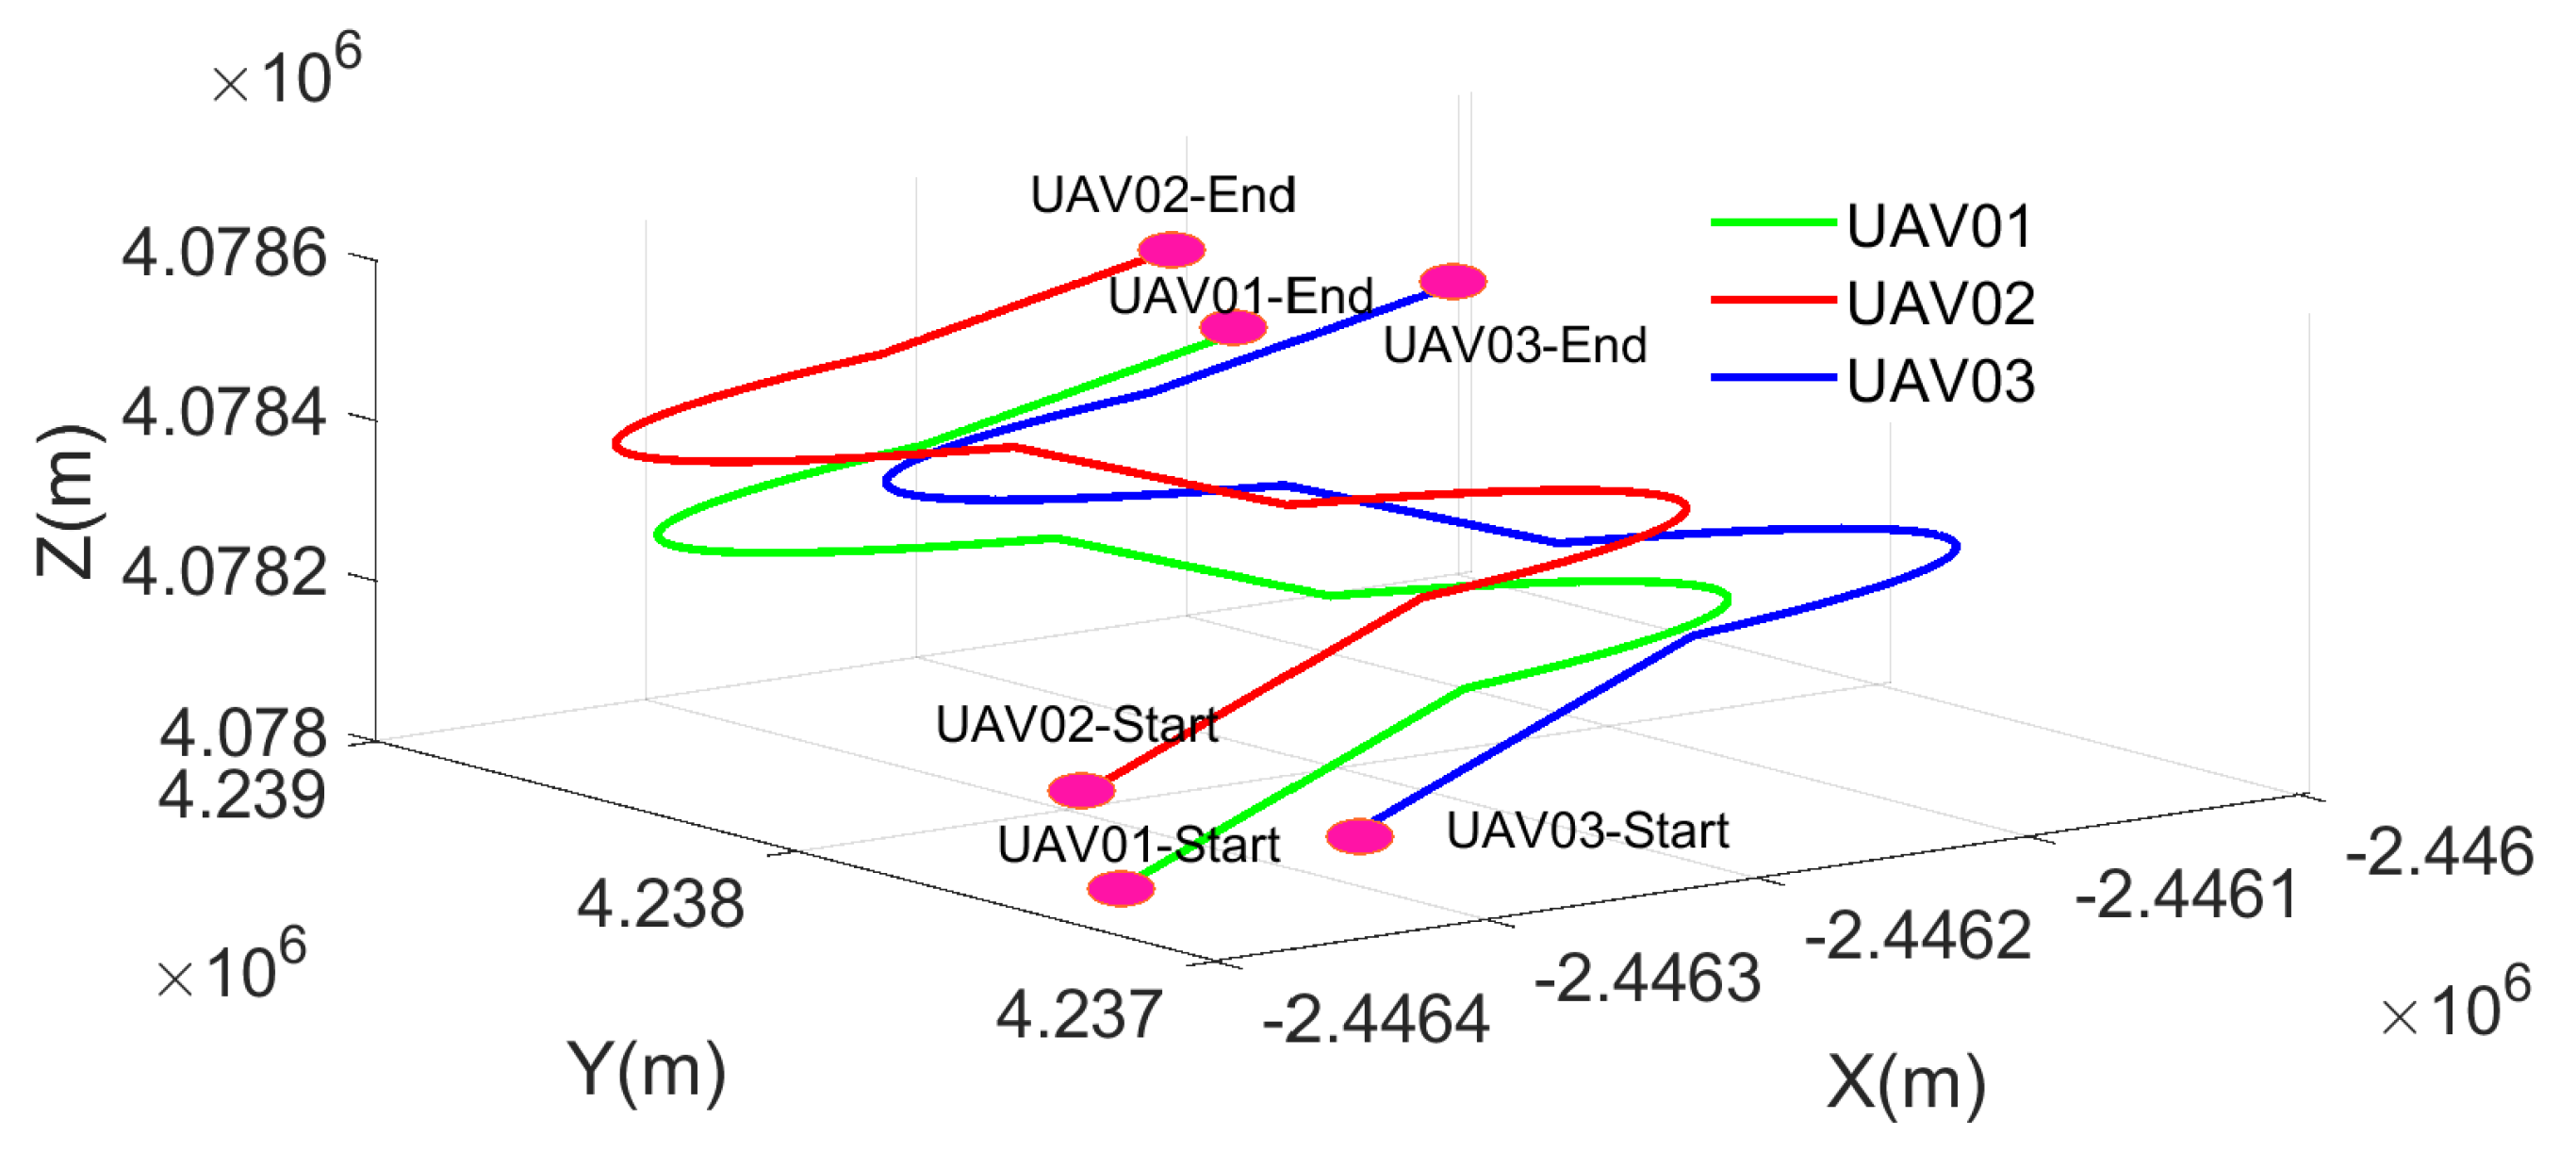
With the methods described in the previous sections, GNSS intermediate frequency (IF) datasets are generated to verify the performance of the proposed cooperative VDLLs with UAV swarms’ applications. A GNSS IF signal simulation software V1 from Beijing EPOO Technology (No. 145, Tongle Road, Nan Dulehe Town, Pinggu District, Beijing, China) is employed here to generate the GNSS IF signal with a pre-designed trajectory. Before simulation, the trajectory is designed and the parameters are set up in the simulation software with the corresponding function button. Parameters of the trajectory include time duration, acceleration, moving type (linear or circle), etc. Figure 6 shows the designed trajectories.
After setting up the trajectory parameters, the software runs and generates the GNSS IF signal dataset for further processing. The sampling frequency of the IF dataset is 5.714 MHz, and the IF signal frequency value is 4.309 MHz. Signal strength is set to 45 dB-Hz during the simulation. A GNSS software-defined receiver (GNSS-SDR) is utilized here to process the GNSS IF dataset and generate navigation solutions. Along with the IF dataset, the trajectory reference is generated at the same time with the frequency value of 50 Hz. After time synchronization, the trajectory reference is utilized to calculate the position errors of the CoVDLLs.

4.1. Experiment with Fixed Inter-Ranging Measurements

In the first experiment, we simulated three different UAVs flying trajectories. In detail, the trajectories are generated with fixed distances of 100 m, which are presented in Figure 7. The start points of the UAV01, UAV02, and UAV03 trajectories are set as (−2,446,392.31 m, 4,237,275.21 m, 4,078,049.95 m), (−2,446,430.61 m, 4,237,441.55 m, 4,078,214.23 m), and (−2,446,368.91 m, 4,237,507.89 m, 4,078,178.50 m) in the Earth-Centered-Earth-Fixed (ECEF) coordinates. The following Table 1 shows the details of the trajectory, which is composed of six different parts.
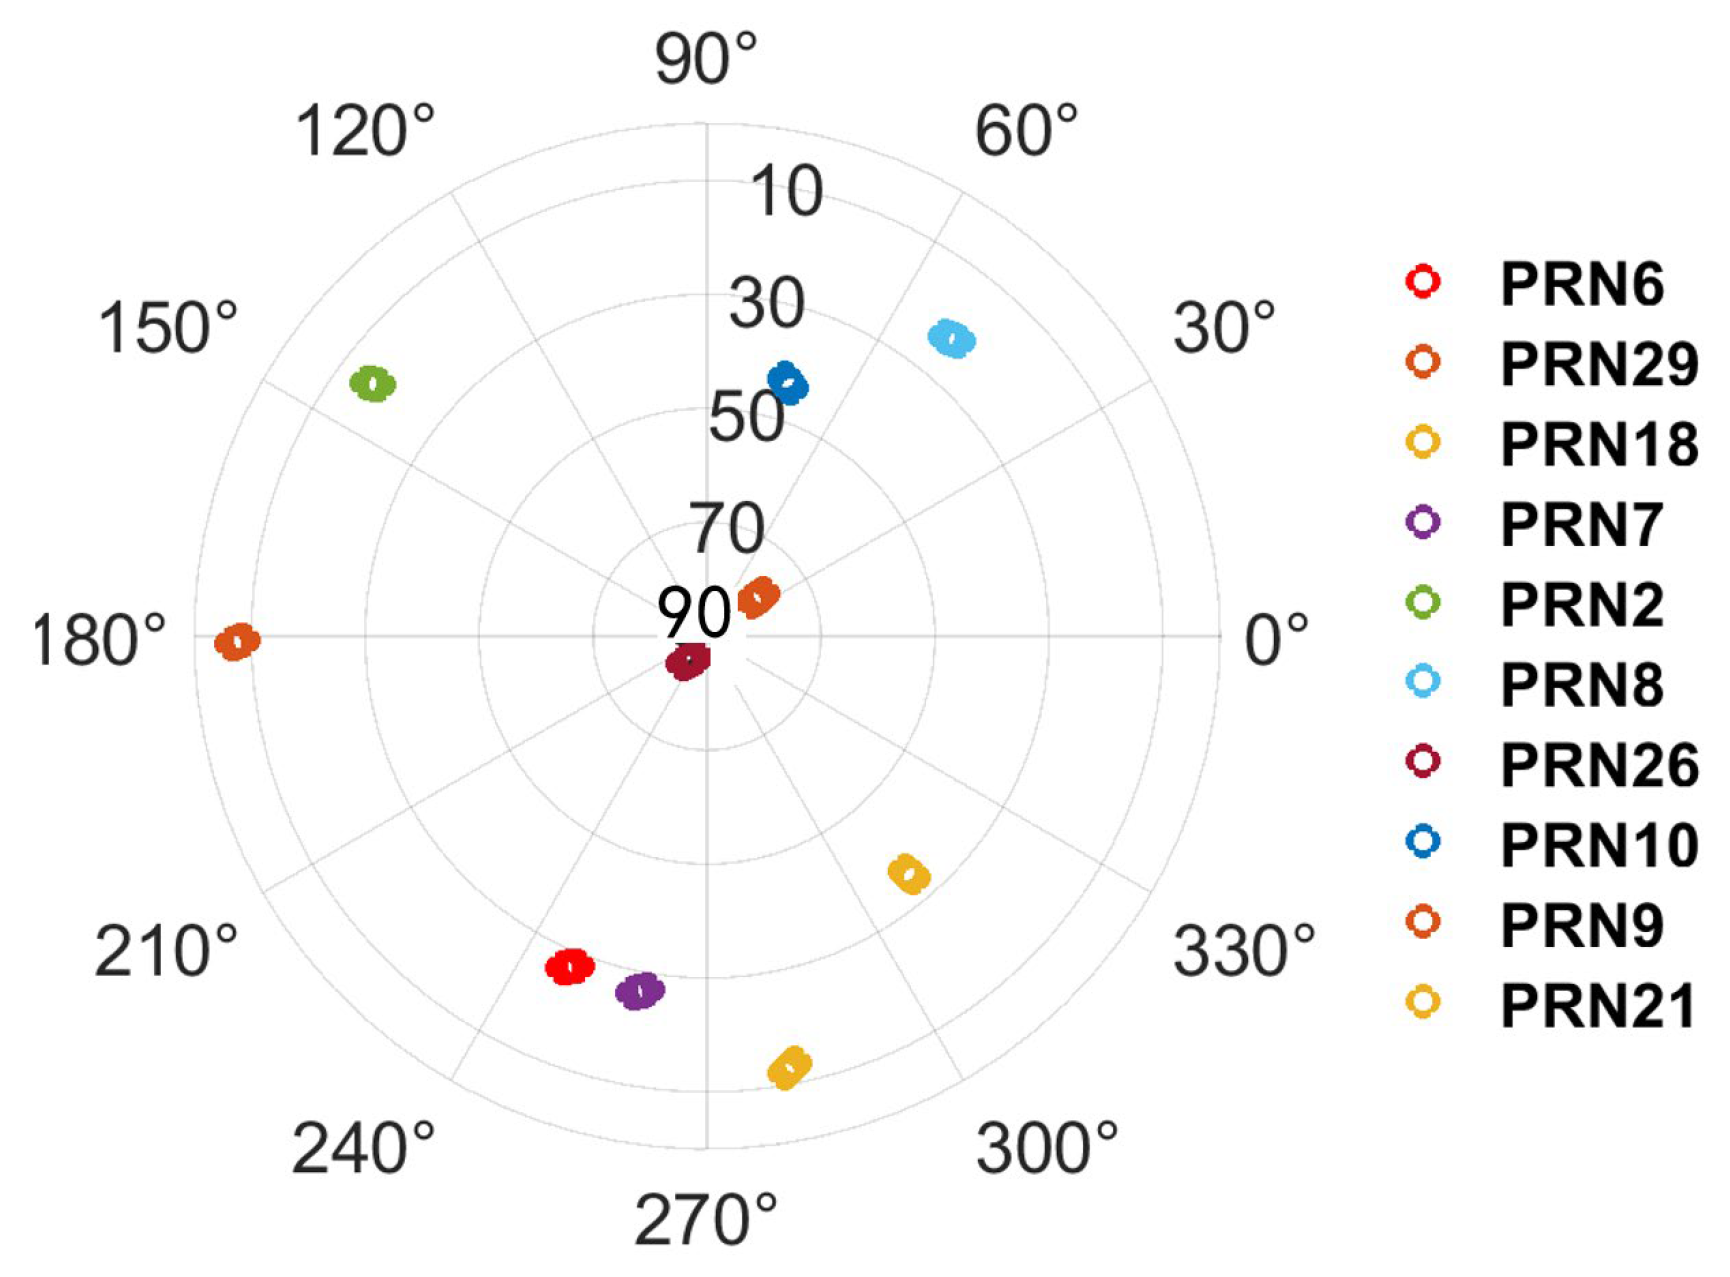
In the simulated GNSS IF datasets, a total of 10 available satellites were included. Figure 7 shows the in-view satellites, including PRN#2, PRN#6, PRN#7, PRN#8, PRN#9, PRN#10, PRN#18, PRN#21, PRN#26, and PRN#29. A total of twelve satellites are well-tracked and included in the navigation solutions estimation. One thing to note is that sometimes the satellites with lower elevation angles are excluded from the navigation solutions estimation. In this experiment, we did not exclude the satellites with a predefined elevation angle threshold. In addition, we used the GTSAM library (MATLAB version) to realize the FGO method. The standard deviation parameters of the velocity, pseudorange, and the cooperative ranging measurements are set as 0.1 m/s, 10 m, and 1 m.
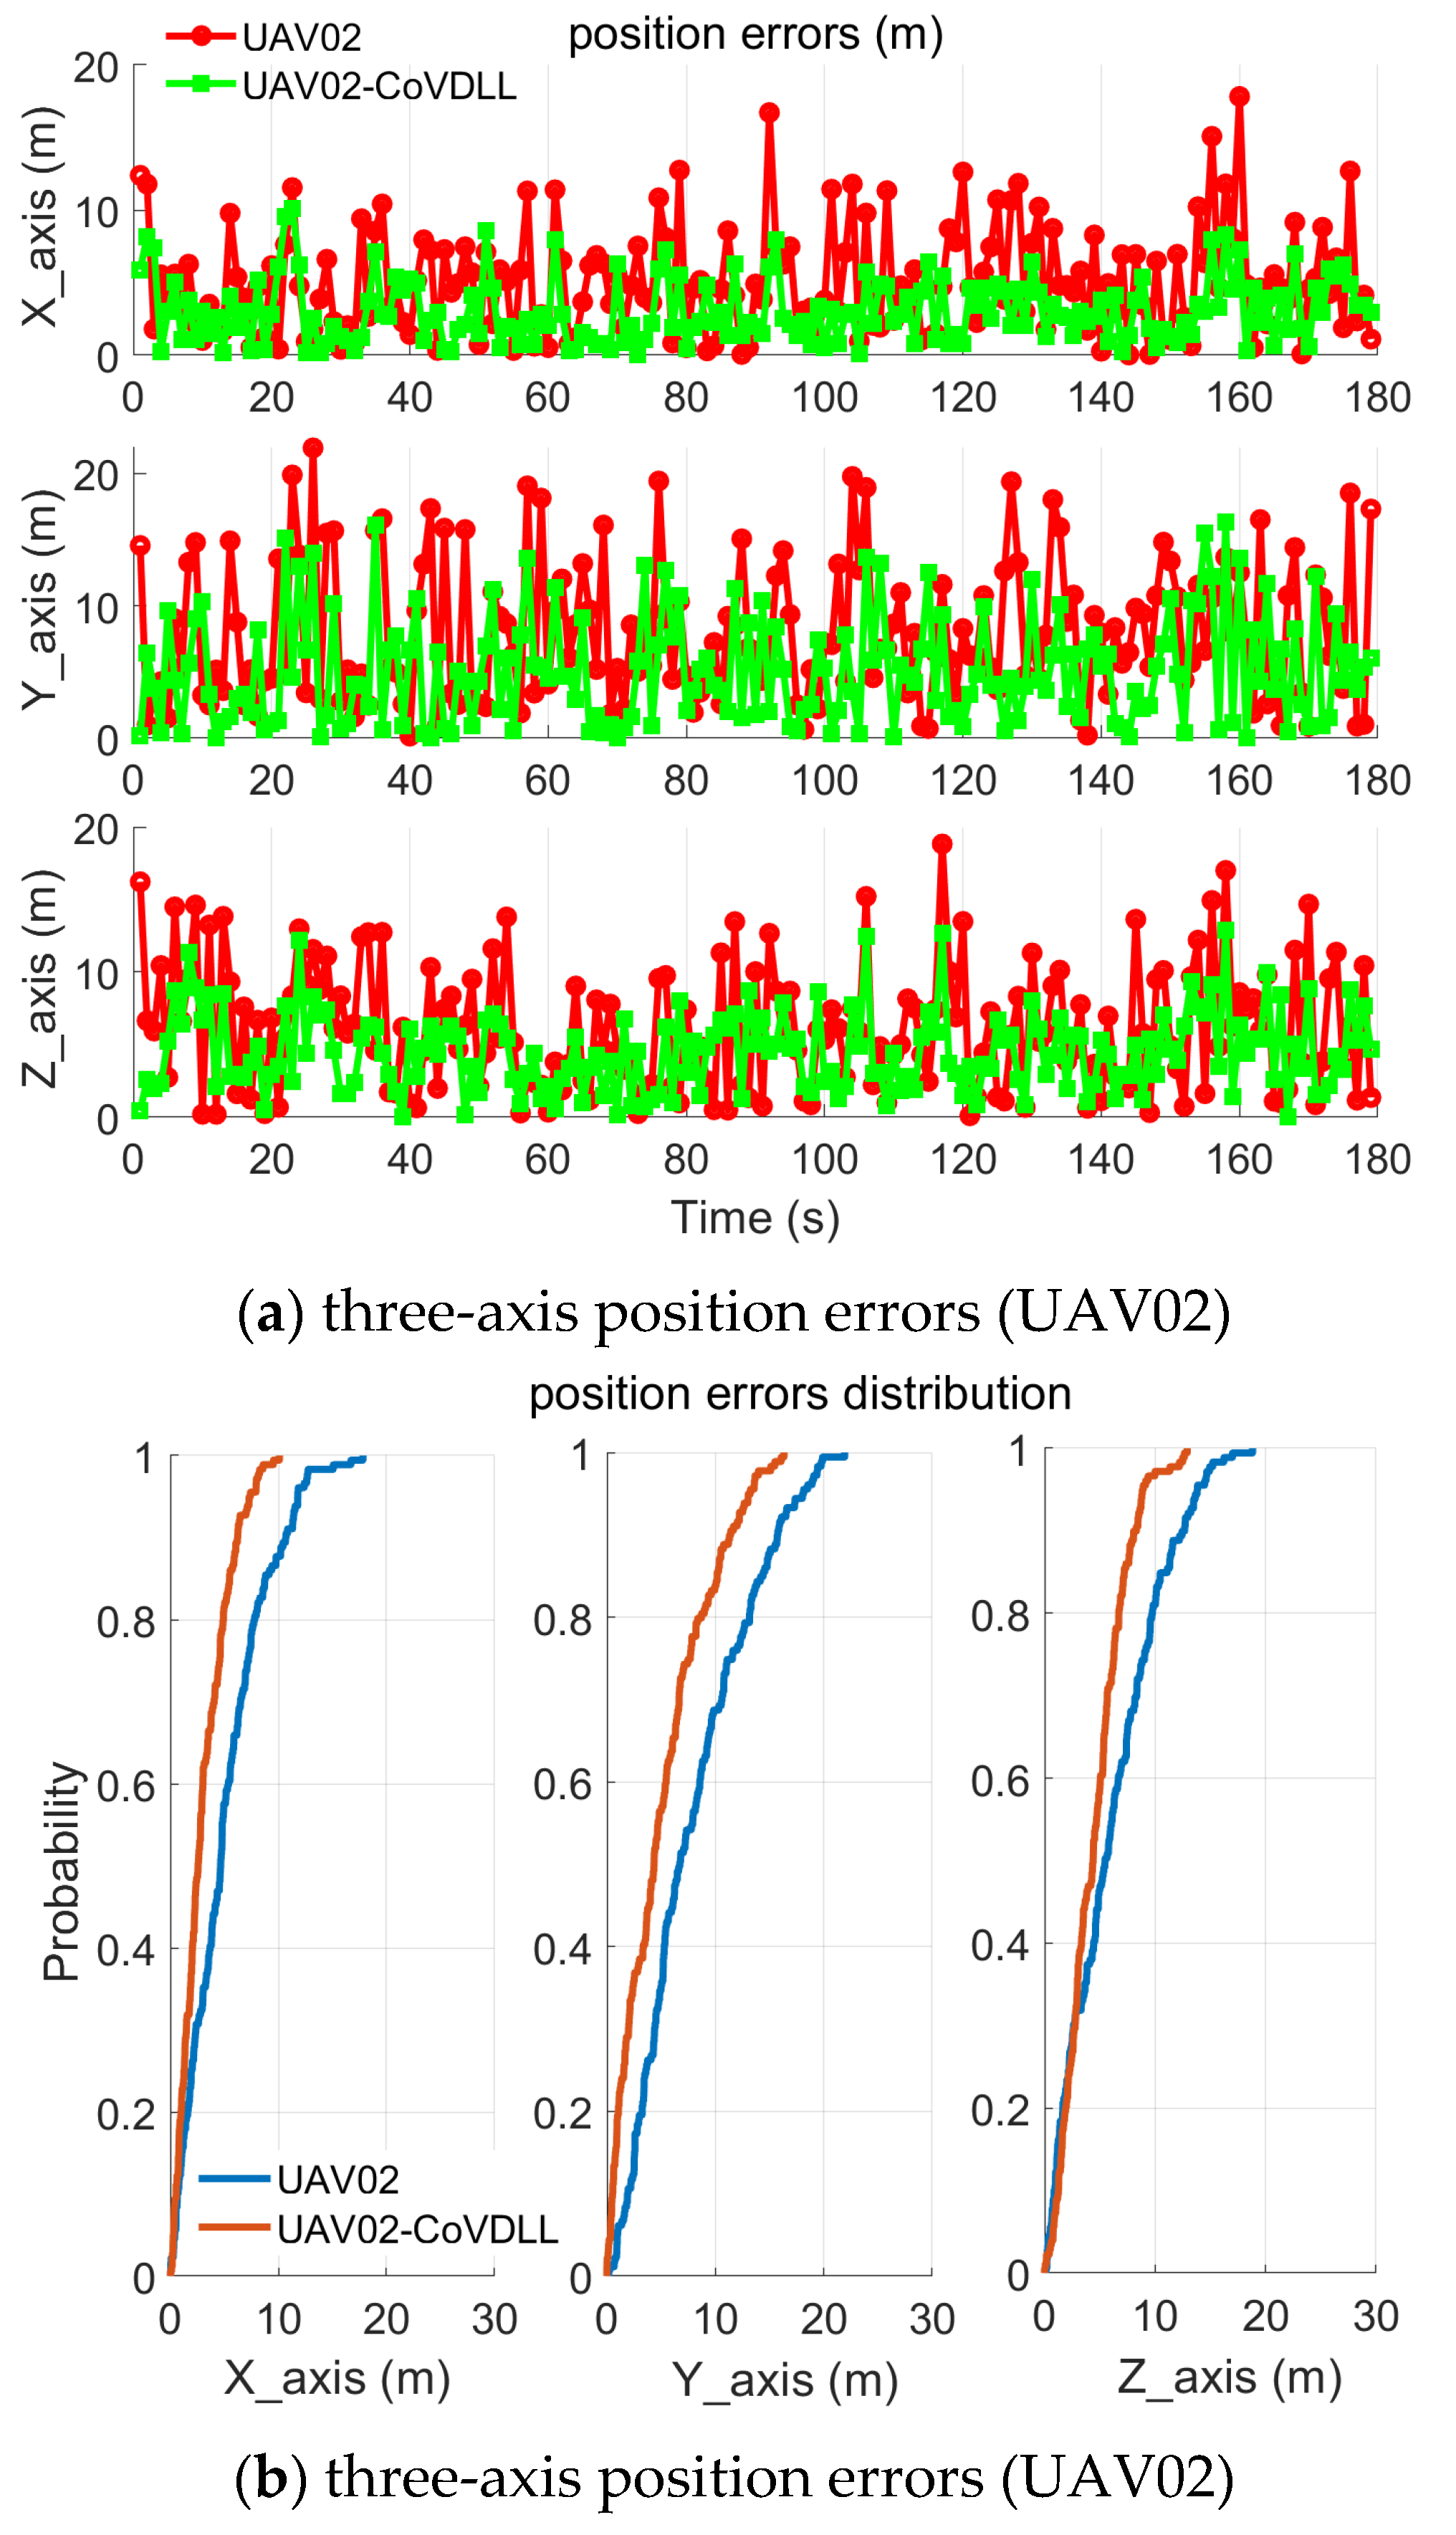
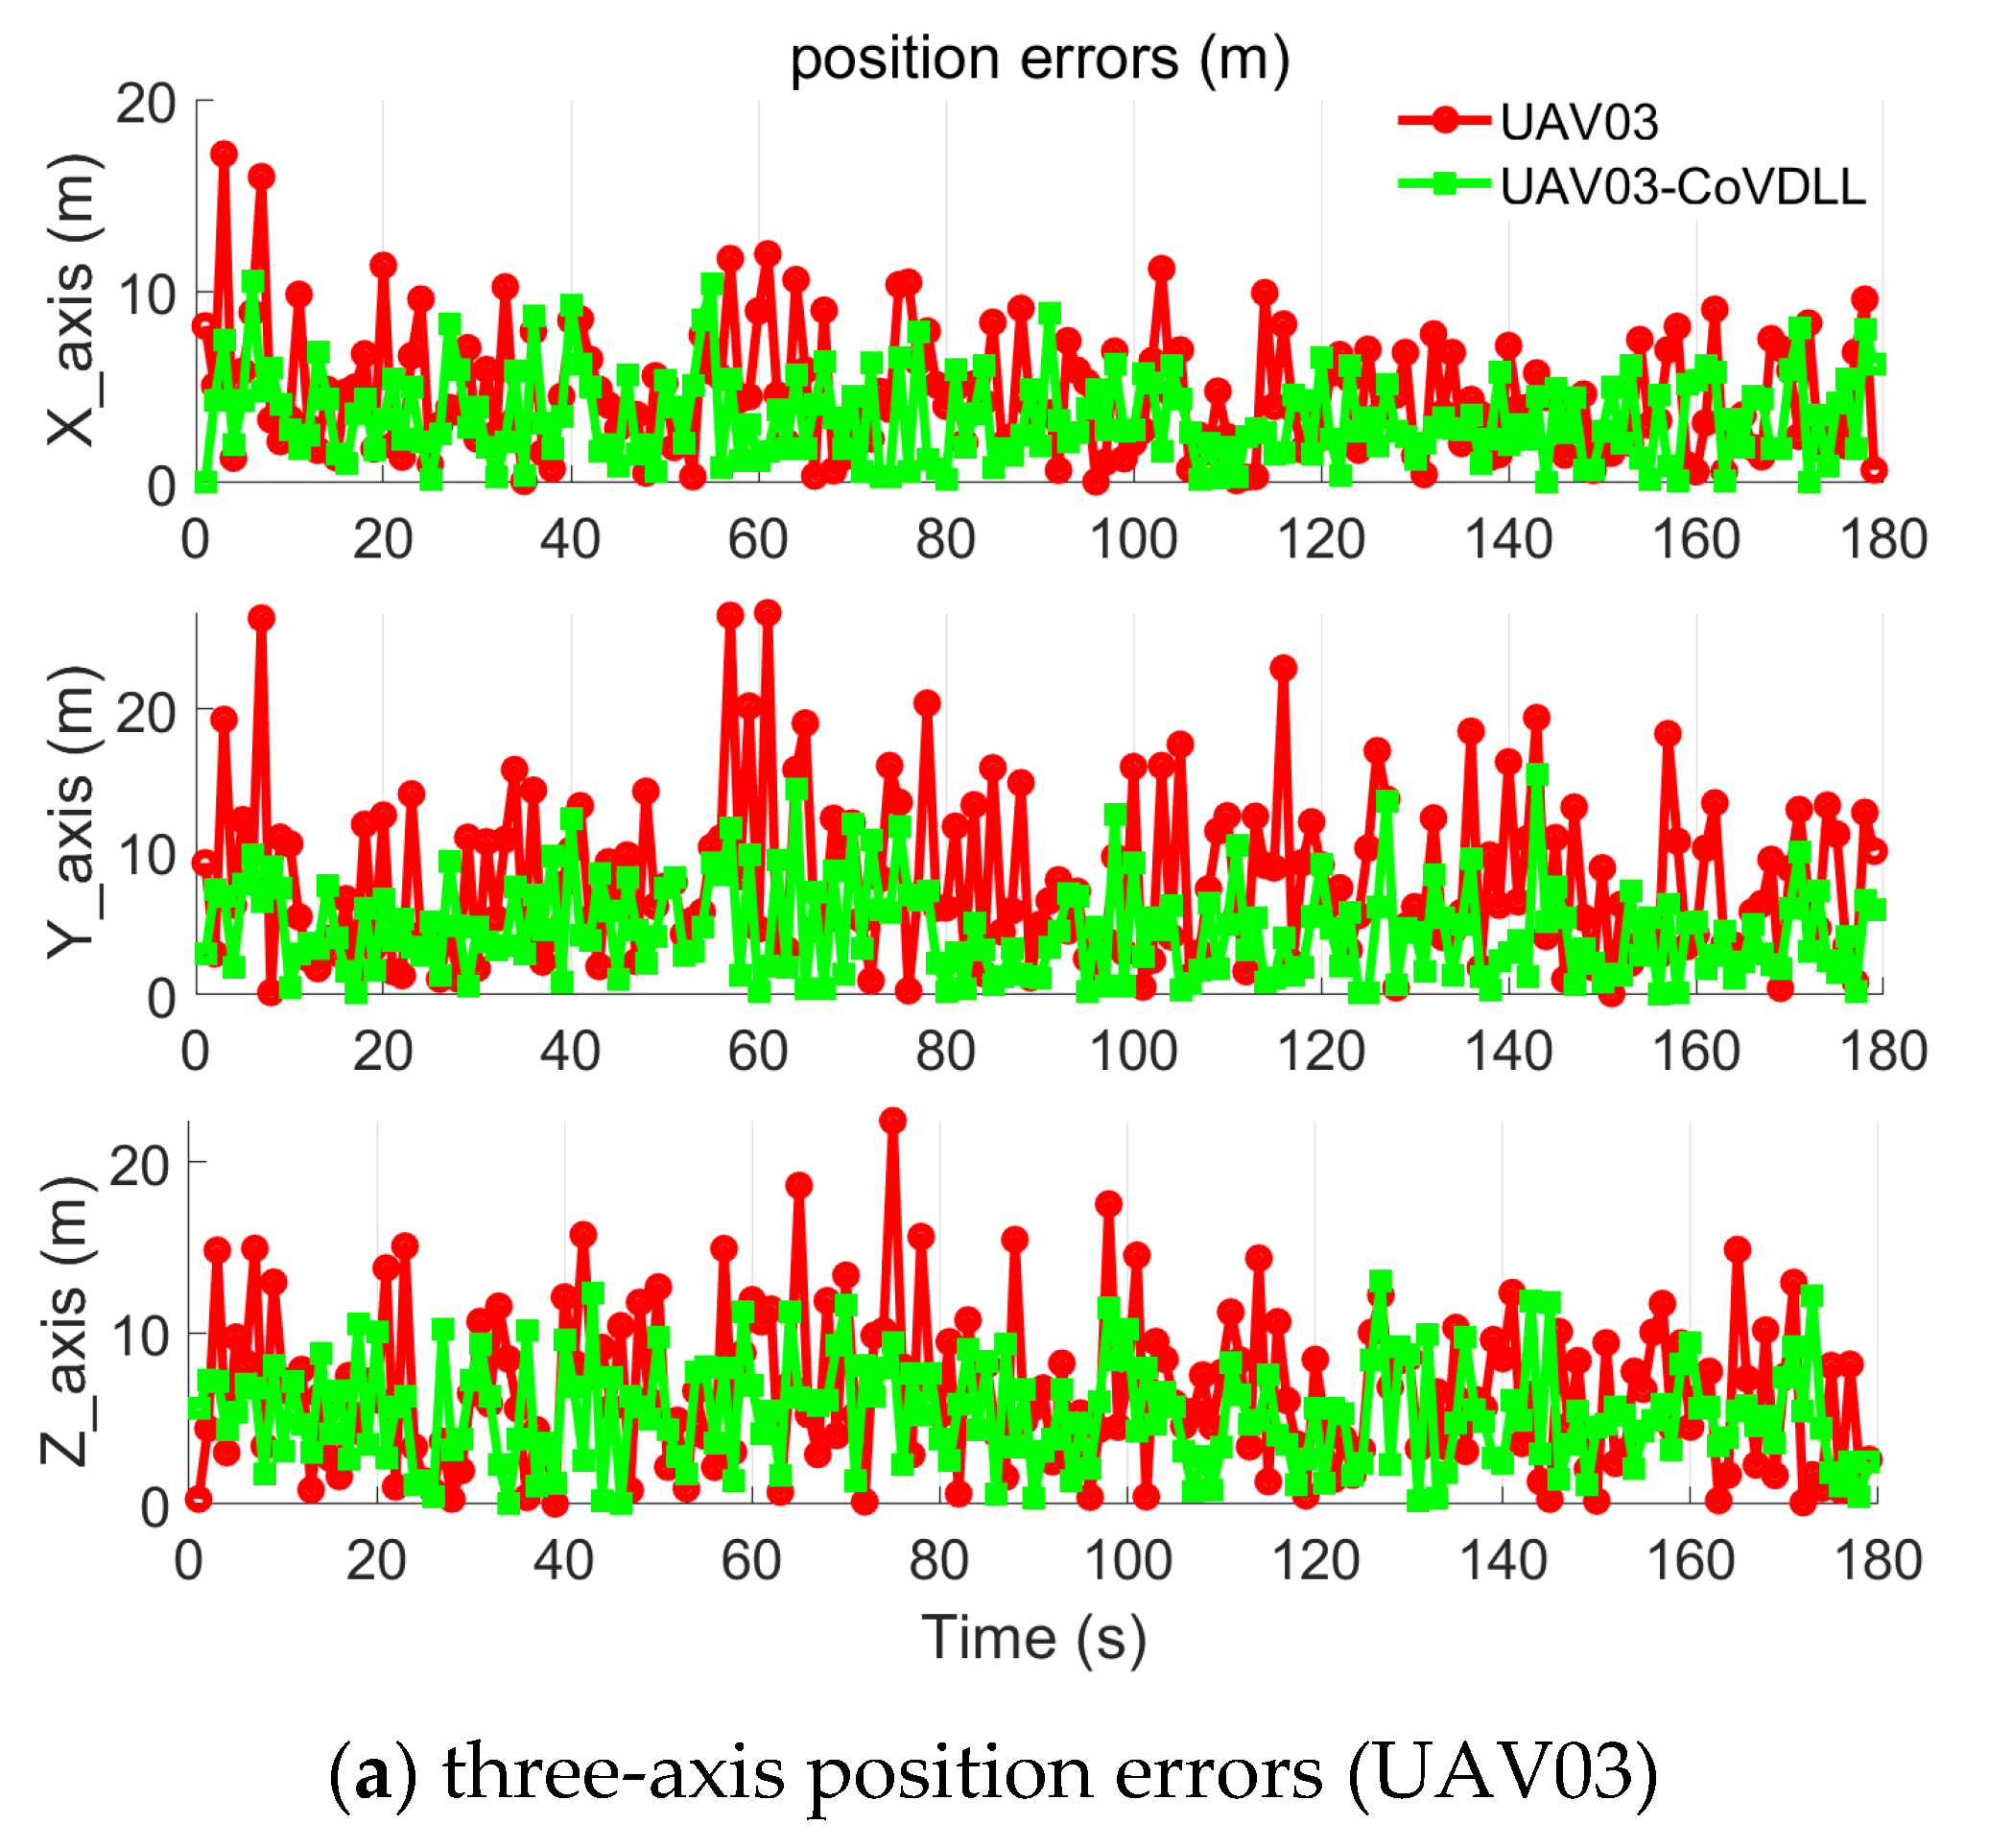
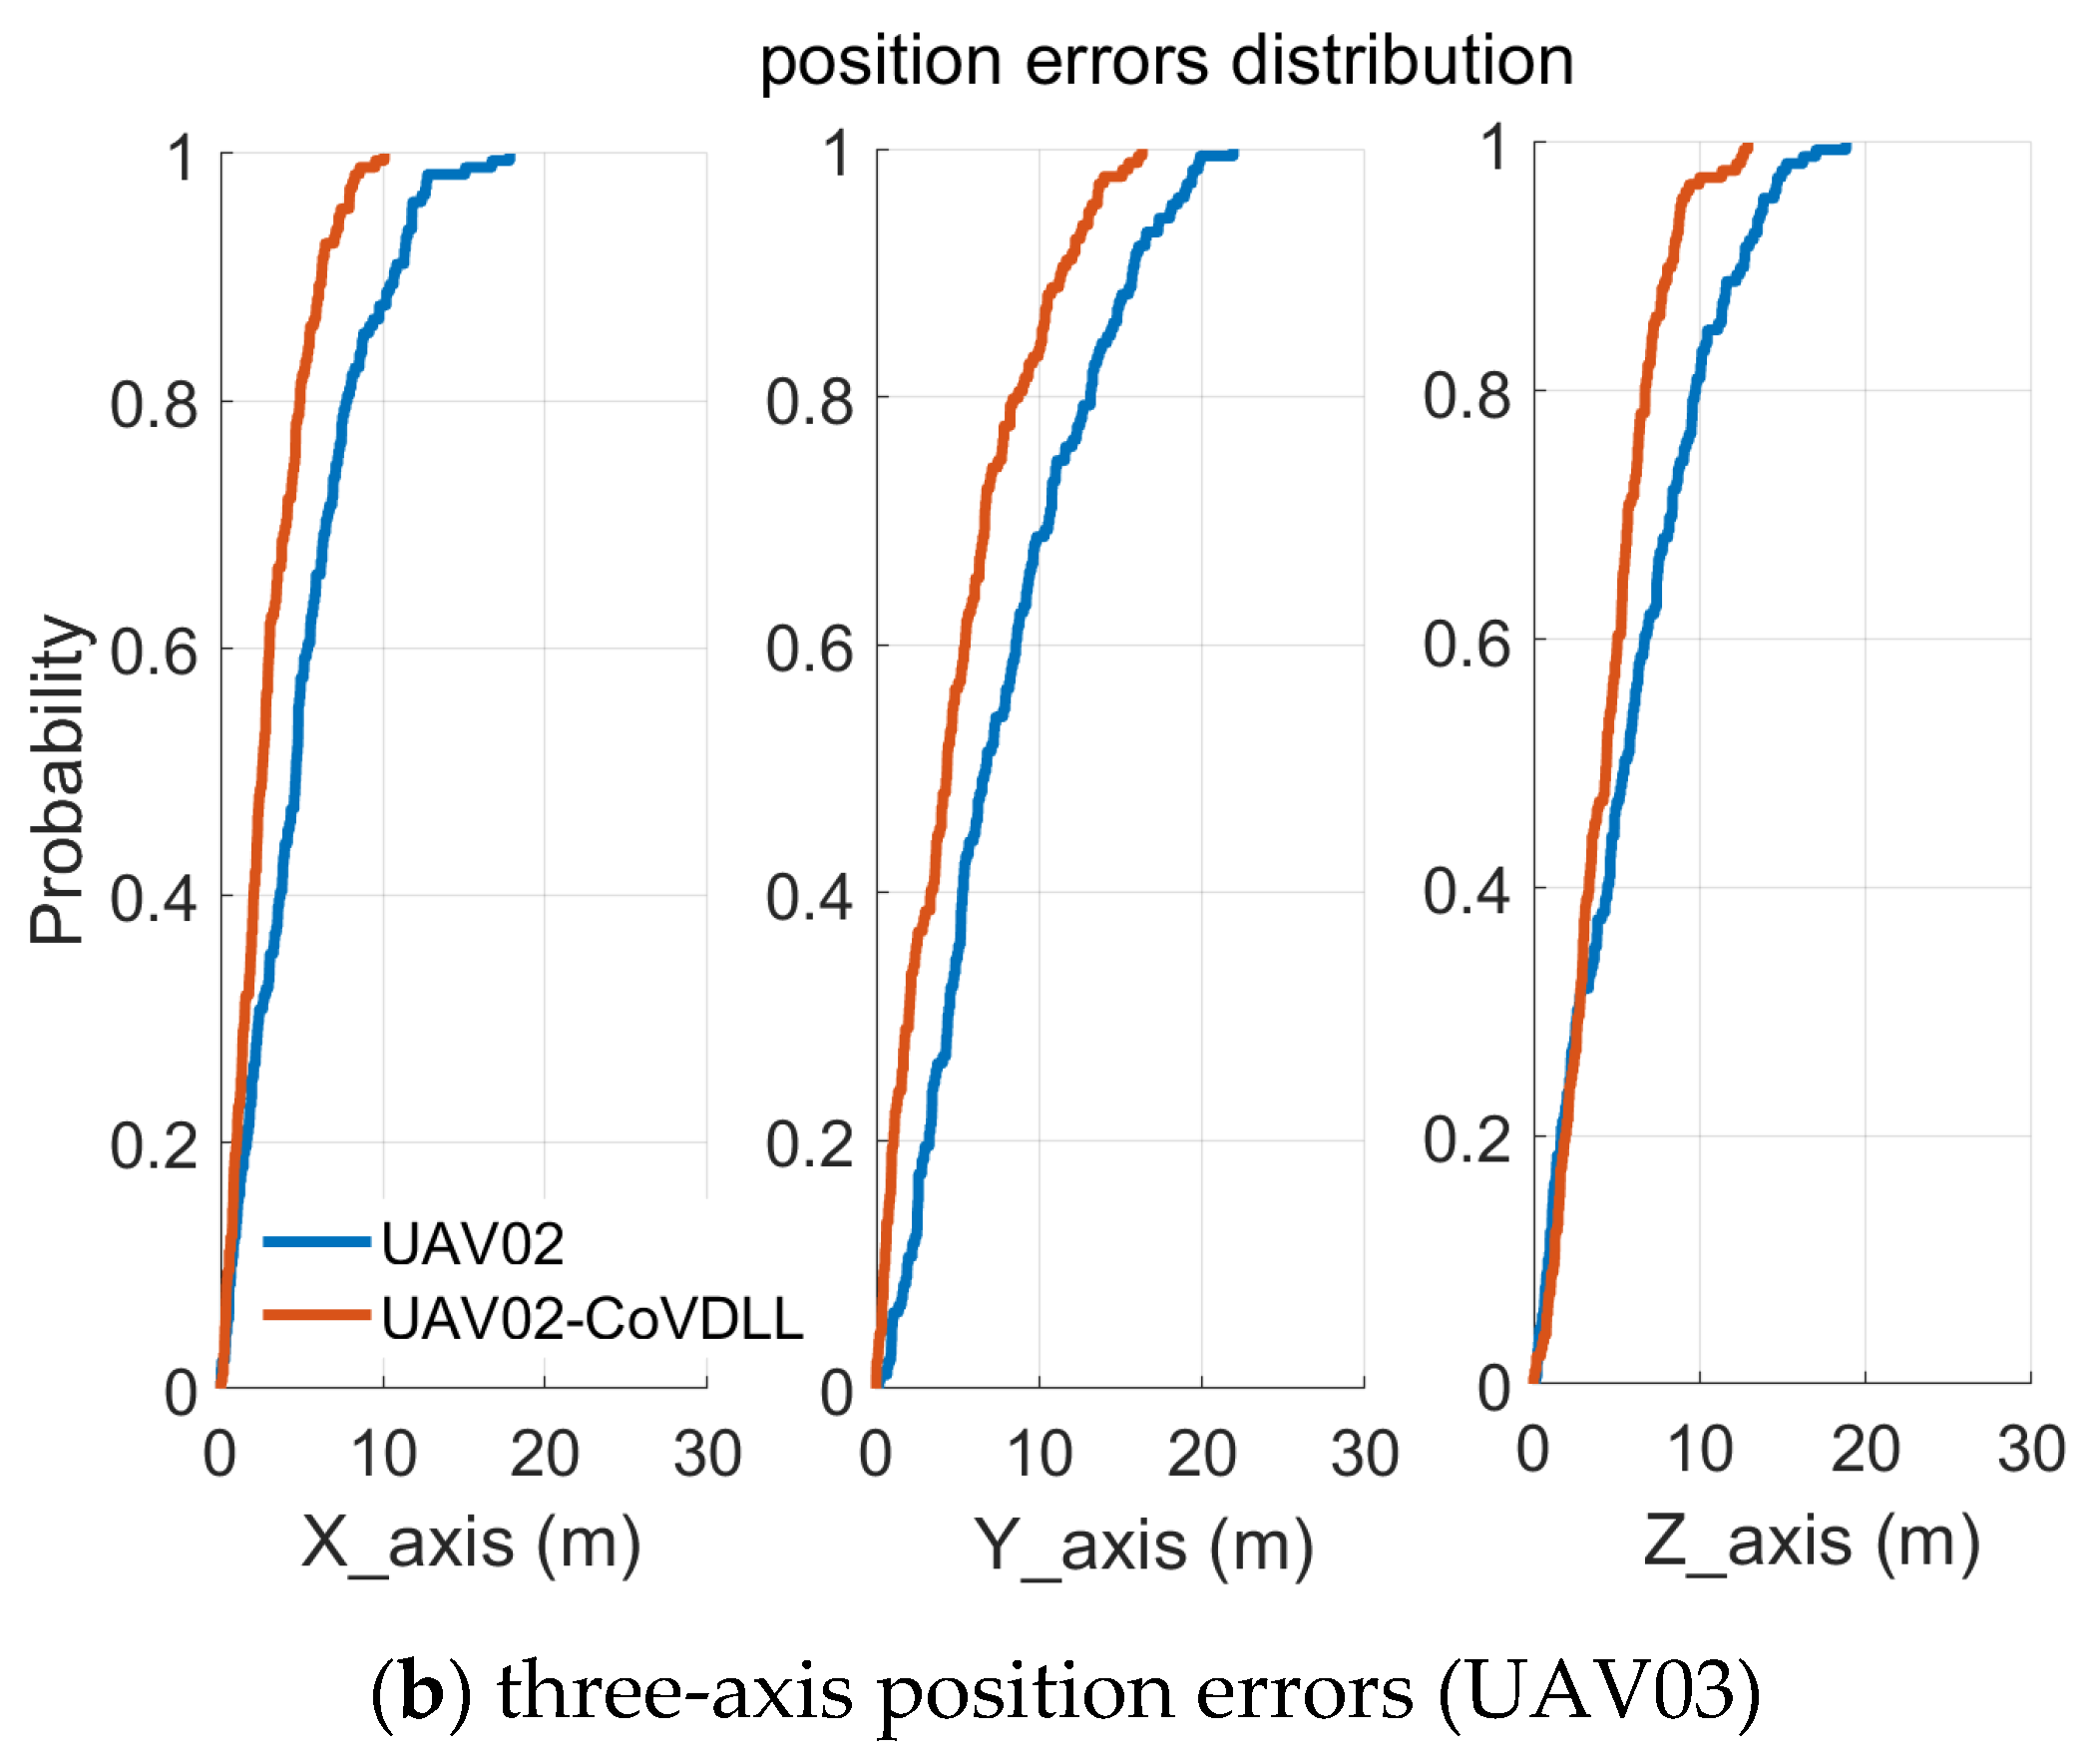
With trajectory reference, horizontal position errors are calculated, analyzed and presented in the Figure 8, Figure 9 and Figure 10. Figure 8a, Figure 9a, and Figure 10a present the three-axis position errors from the UAV01, UAV02, and UAV03 individually in the ECEF coordinates. Figure 8b, Figure 9b, and Figure 10b present the cumulative distribution of the three-axis position errors from the UAV01, UAV02, and UAV03 individually. By comparing the positioning results presented in the Figures, it is obvious that the CoVDLL can effectively reduce the three-axis positioning errors. Table 2 shows the statistical analysis results, including the mean and Standard Deviation (STD) values of the three-axis position errors. Mean values of the three-axis position errors of the UAV01 decreased by 44.3%, 44.1%, and 42.5%, and the STD values decreased by 40.4%, 44.8%, and 34.7% while comparing the VDLL and the CoVDLL methods; for UAV02, mean values of the three-axis position errors decreased by 39.9%, 36.0%, and 25.7%, and the STD values decreased by 39.8%, 21.2%, and 36.3%; and for UAV03, the mean values of the three-axis position errors decreased by 25.7%, 43.2%, and 19.0%, and the STD values decreased by 27.3%, 41.0%, and 31.0%.

4.2. Experiment with Time-Varying Inter-Ranging Measurements

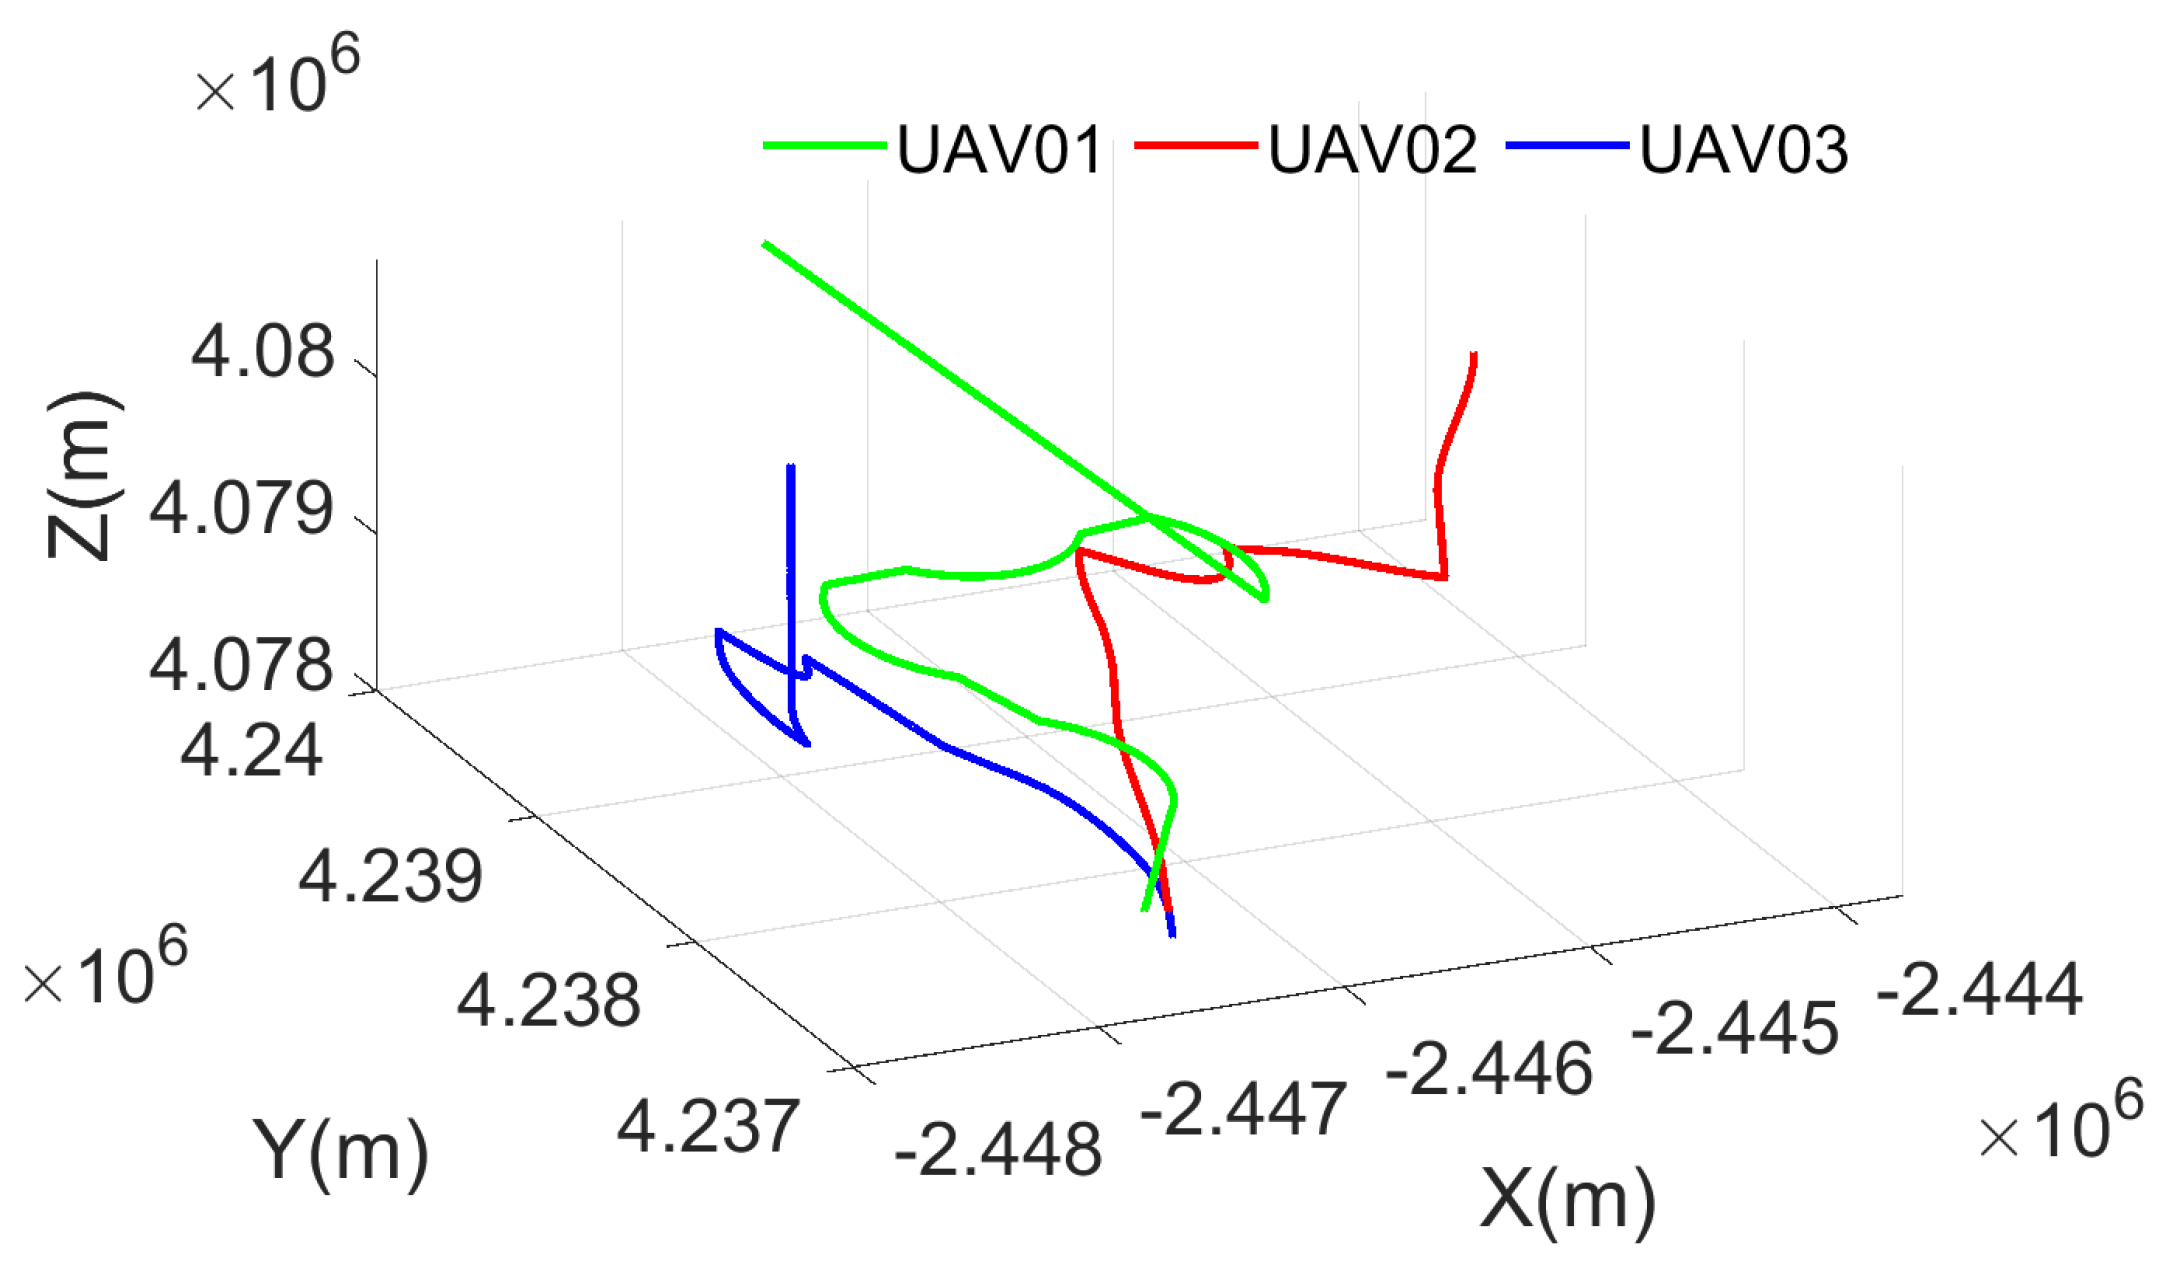
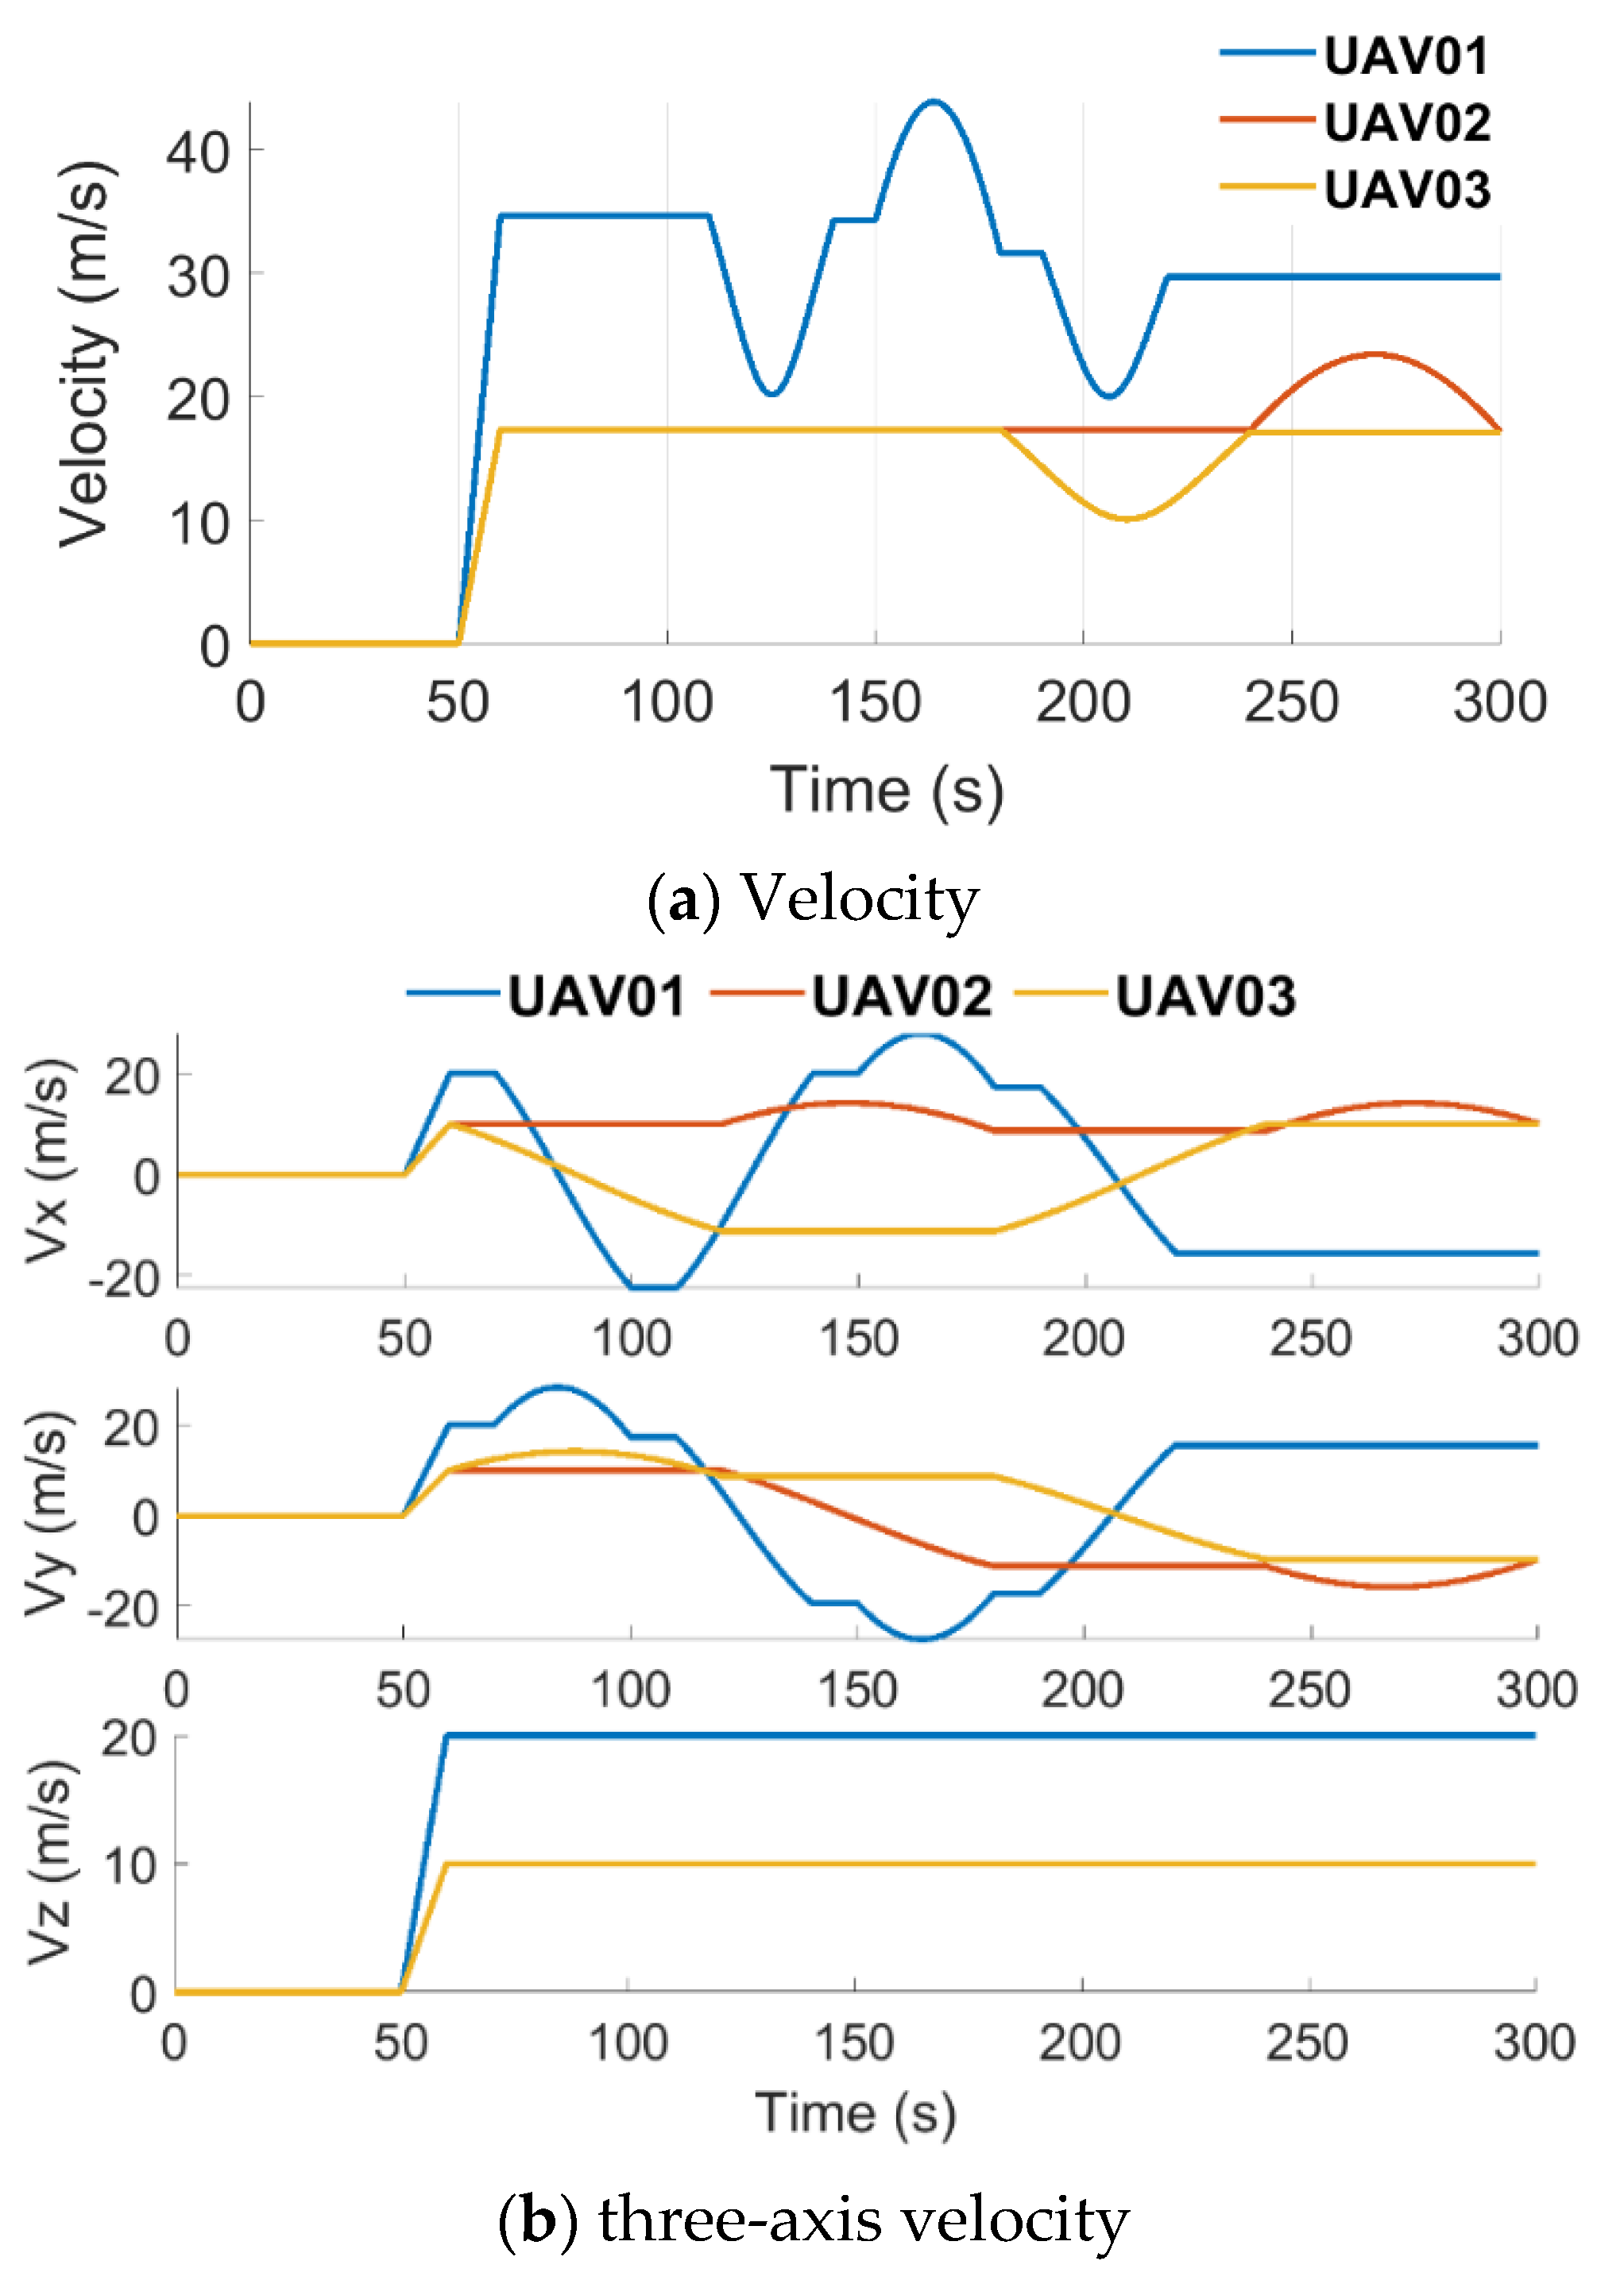
In this first experiment, we designed an experiment with fixed inter-ranging UAVs. This subsection describes an experiment with time-varying inter-ranging UAVs. Dynamic trajectories are presented in Figure 11 with the ECEF coordinates, in which the green line represents the UAV01 trajectory, the red line represents the UAV02 trajectory, and the blue line represents the trajectory of the UAV03. It can be observed that the trajectory curves are quite different, which means the trajectories have different velocity, acceleration, and heading angle information. Figure 12 shows the velocity information changing with time. Maximum values of the UAV01 velocity reach 40 m/s, and the UAV02 and UAV03 velocities reach 20 m/s. In addition, Figure 12b gives details describing the three-axis velocity information. Part of the UAV02 and UAV03 velocity are similar since trajectory settings are similar. UAV02 and UAV03 have different heading angles; therefore, their trajectories are different (Figure 11) even if part of their velocity values is similar.
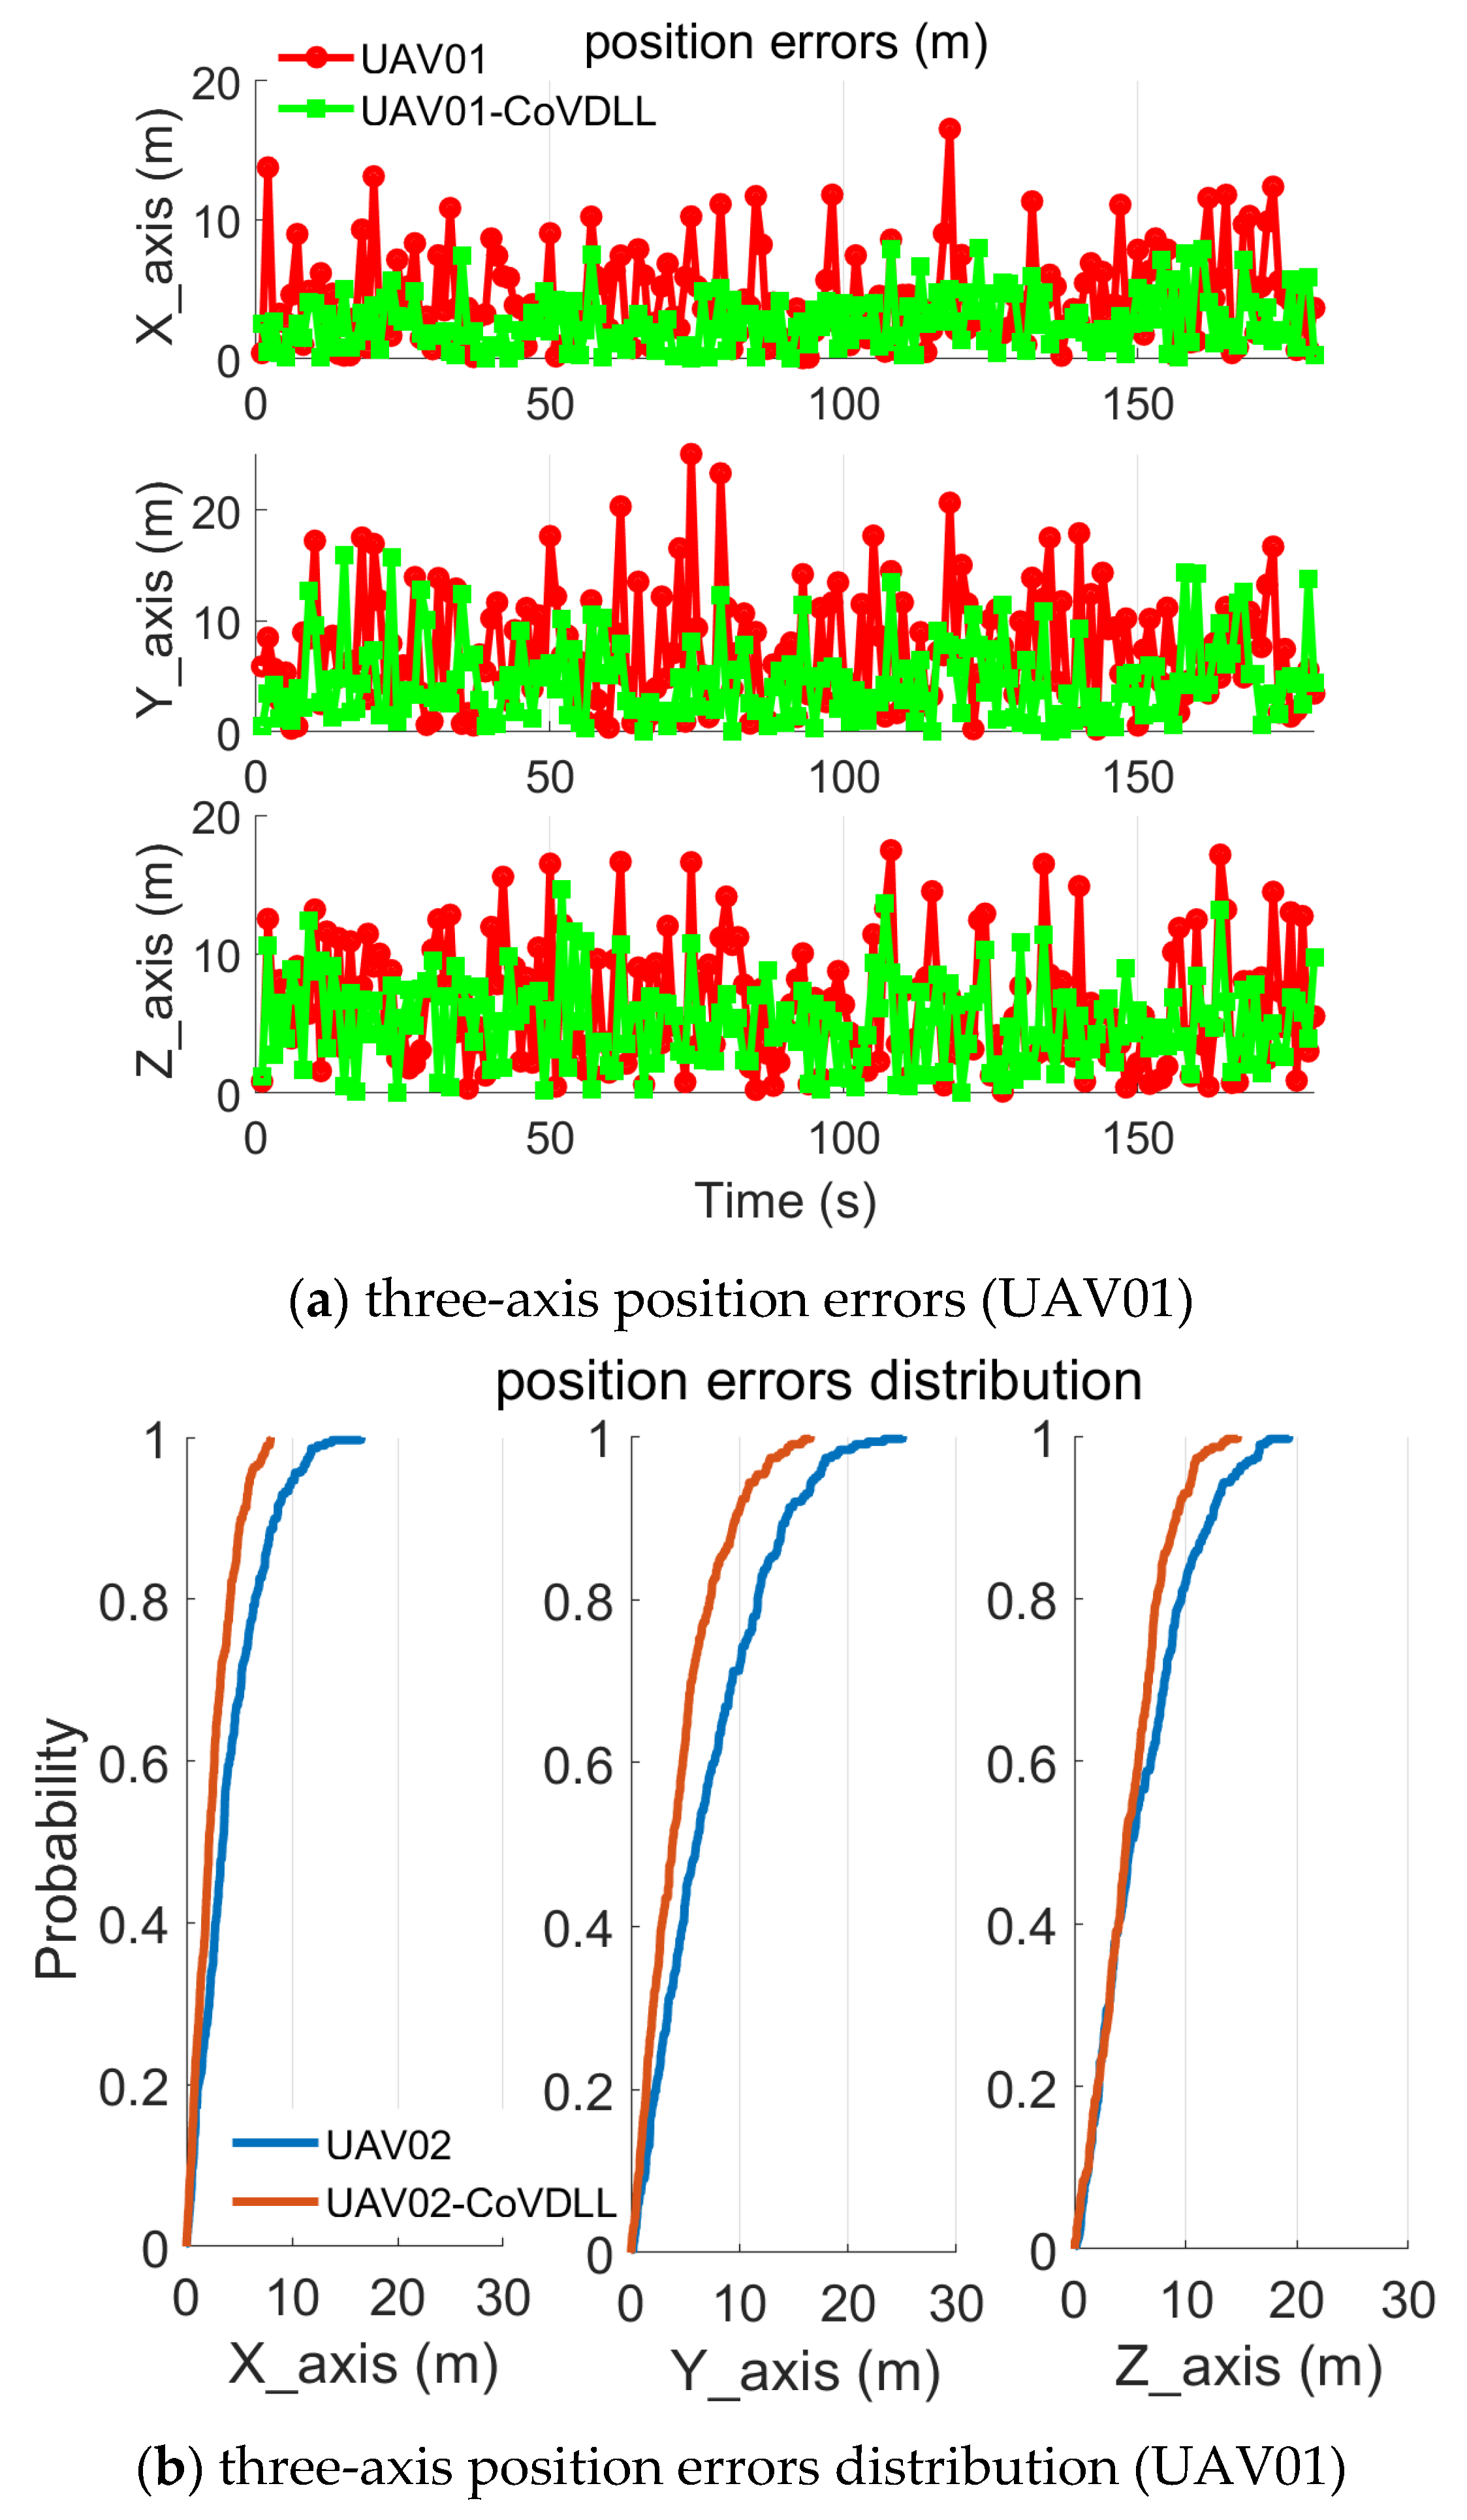
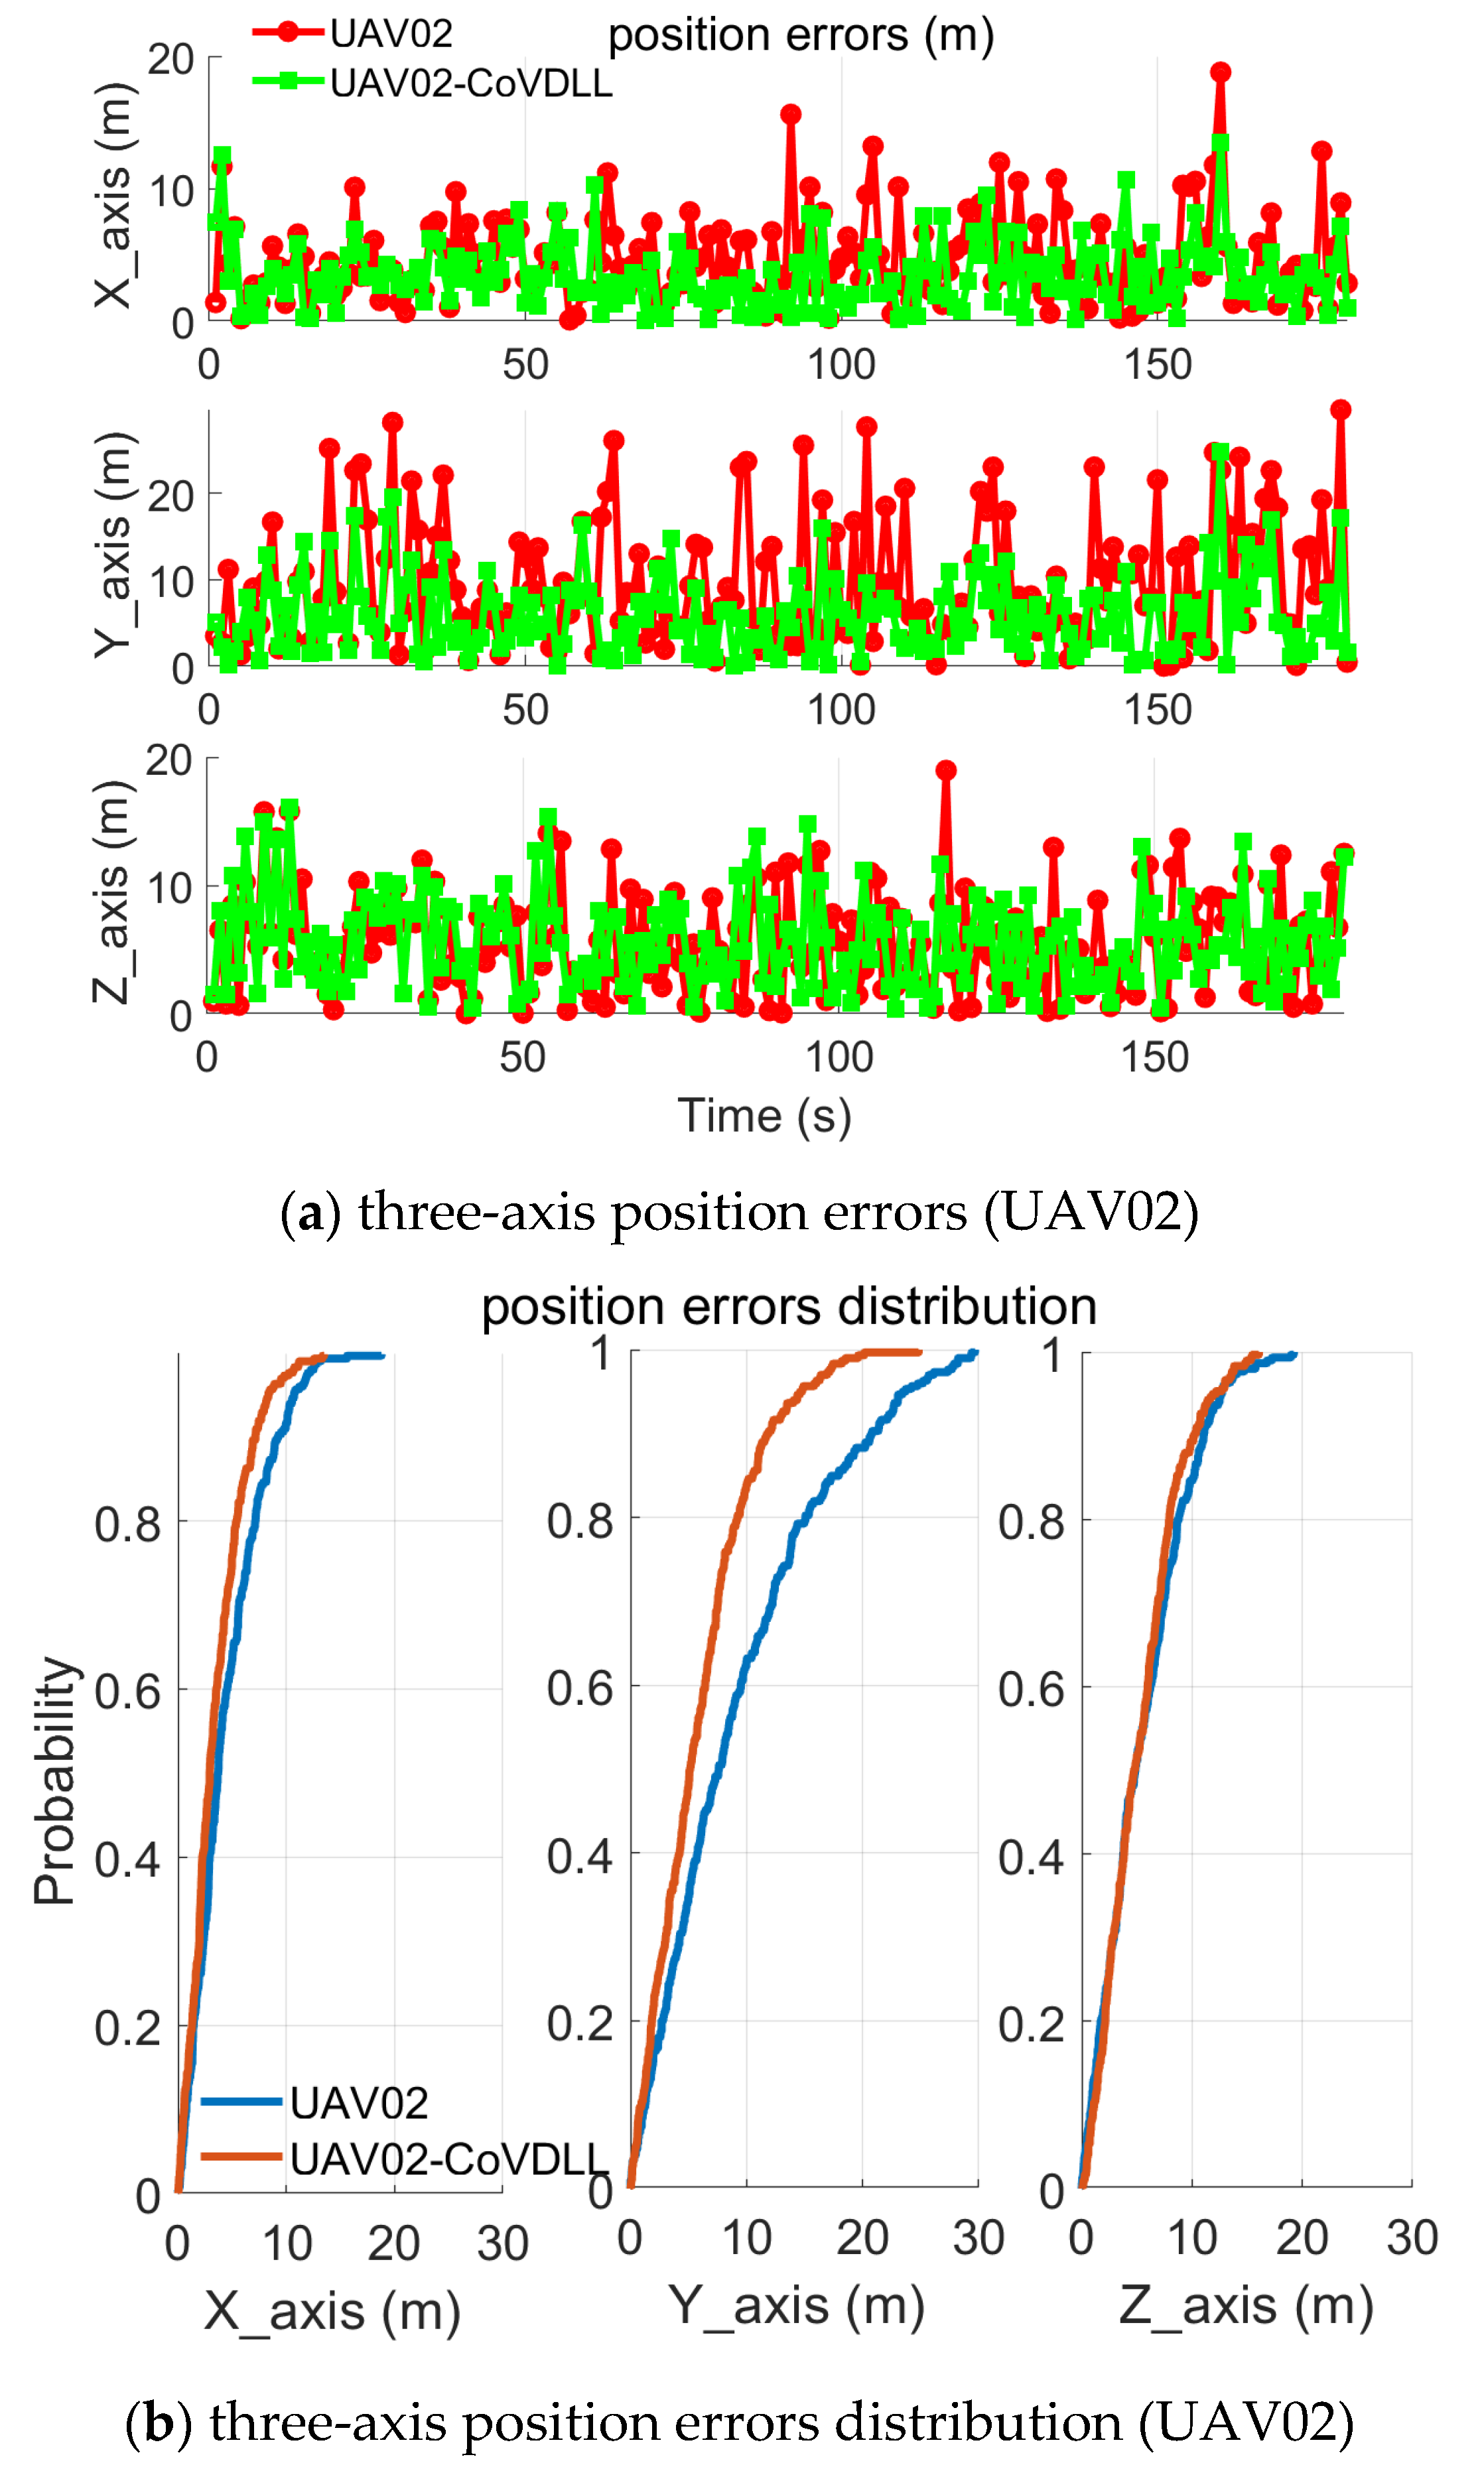
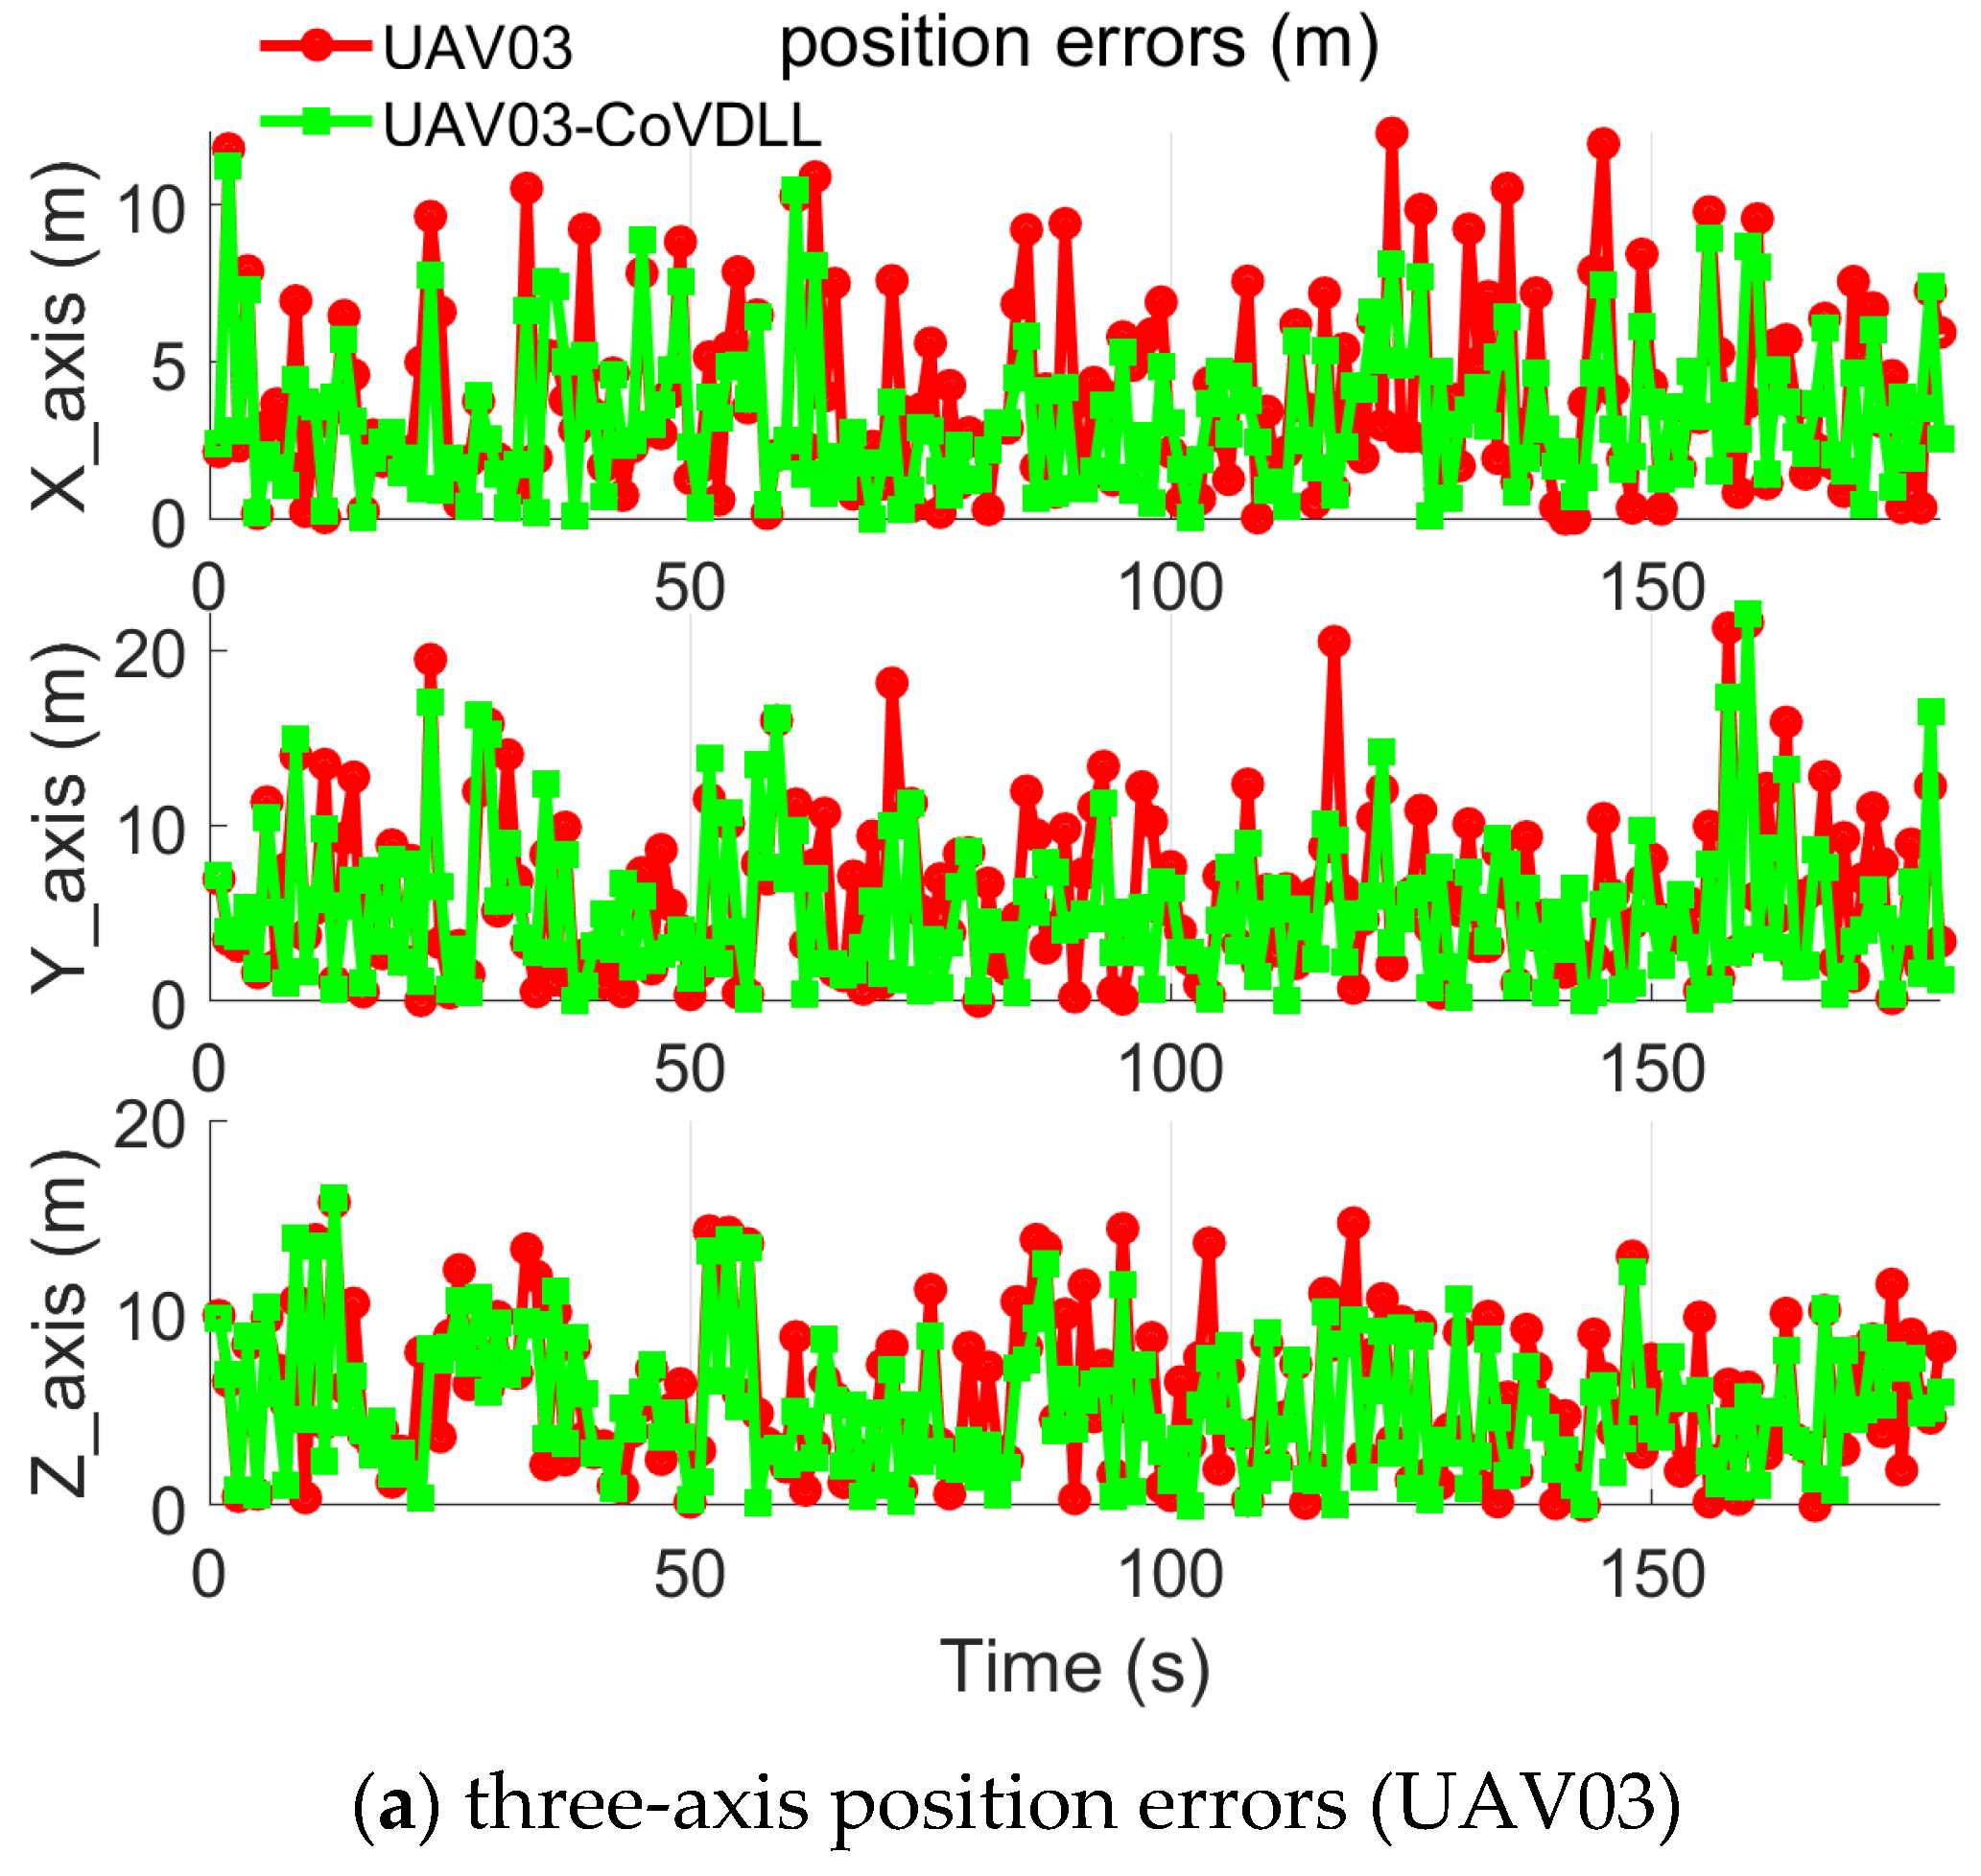
In aspects of the satellites, similar in-view satellites are included in the position determination and calculation due to the fact that the two experiments have the same ephemeris setting. Horizontal position errors from the DLL and CoVDLL are analyzed and compared in the Figure 13, Figure 14 and Figure 15. The red line represents the horizontal position results from the single VDLL method, and the green line represents the horizontal position results from the CoVDLL. It can be observed that the CoVDLL method contributes to three-axis positioning results compared with the VDLL method, which indicates that the cooperative method is effective at reducing the position errors. Statistical analysis results, i.e., mean values and the standard deviation values of the three-axis position errors, are listed in Table 3. In summary, mean values of the three-axis position errors of the UAV01 decreased by 37.7%, 36.1%, and 17.6%, and the STD values decreased by 39.3%, 31.7%, and 27.9% while comparing the VDLL and the CoVDLL methods; for UAV02, mean values of the three-axis position errors decreased by 21.5%, 36.0%, and 4.7%, and the STD values decreased by 20.7%, 39.0%, and 11.9%; and for UAV03, the mean values of the three-axis position errors decreased by 19.1%, 20.3%, and 10.0%, and the STD values decreased by 23.7%, 19.7%, and 15.4%.

5. Limitations and Future Works

This paper presents a CoVDLL positioning method for multiple UAVs, utilizing an FGO algorithm. Experimental results from dynamic tests highlight its effectiveness in enhancing positioning accuracy for UAVs. However, we believe several promising areas warrant further investigation:
(1)
Due to hardware computational limitations, the proposed method was validated only through a three-UAV simulation. In addition, limited by the hardware equipment, we did not have enough equipment to collect real-world flying datasets to evaluate the CoVDLL. Future work should include field tests with real-world UAVs and GNSS signals to thoroughly evaluate the algorithm’s performance. Additionally, expanding the experiments to include more UAVs would provide a more comprehensive assessment. Furthermore, since the computational load of FGO is significantly higher than that of the Kalman Filter, optimizing the moving-window size is essential to reduce computational demands while maintaining performance.
(2)
Limited by the simulation settings and software, UAVs are typically equipped with various onboard sensors, such as Inertial Measurement Units (IMUs), LiDAR, and visual cameras. Software including the GNSS IF signal simulation, IMU measurements simulation, and other sensor simulations has the potential to help to evaluate the proposed method. These sensors can capture UAV motion and environmental data, which can be leveraged to estimate position and other dynamic information. In our experiments, we observed only marginal improvements in z-axis position errors (Figure 15). Integrating VDLL with other sensors to utilize dynamic information—such as velocity and observation angles—could lead to the development of a multi-sensor fusion system; potentially enhancing both positioning accuracy and system reliability.
(3)
GNSS IF signal simulation software here has limited function, i.e., no spoofing simulation function and no signal blockage or signal degradation simulation function. Therefore, in the simulation, we did not carry out the assessment of the CoVDLL under a signal-challenging environment. This study assumes ideal GNSS signal conditions to achieve satisfactory positioning results. It would be valuable to test the proposed method in challenging GNSS environments to evaluate how the cooperative scheme can improve positioning accuracy under adverse signal conditions, i.e., signal spoofing and weak signal.

6. Conclusions

In this paper, we propose a CoVDLL method for UAV swarm applications. The FGO method is used to integrate the VDLL data from different UAV agents along with inter-ranging measurements. A nonlinear optimizer is employed to estimate the navigation solutions. Numerical simulations are conducted to evaluate the performance of the method with three UAV trajectories. The experimental results support the following conclusions:
(1)
The CoVDLL method effectively reduces position errors compared to individual VDLL methods, and including inter-ranging measurements significantly enhances the construction of the CoVDLL.
(2)
The nonlinear optimization technique proves to be effective in achieving optimal position estimations by utilizing the correlated ranging information.

Author Contributions

Conceptualization, C.L., C.J. and S.C.; methodology, C.J.; software, C.L. and Y.C.; validation, C.L., C.J. and X.W.; formal analysis, Z.S.; investigation, C.J.; resources, C.J. and Y.C.; data curation, S.C. and X.W.; writing—original draft preparation, C.L. and C.J.; writing—review and editing, C.L., X.W. and S.C.; visualization, Z.S.; supervision, S.C.; project administration, S.C. and X.W.; funding acquisition, S.C. All authors have read and agreed to the published version of the manuscript.

Funding

This research was funded by the “National Natural Science Foundation of China (42101445)”, “Jiangsu Province Natural Science Foundation of China (BK20241388)”, and the “Nanjing University of Aeronautics and Astronautics Startup Funding for Yong Talents” (YQR23046). Thanks EPOO Technology Company a lot for providing the GNSS IF signal generation software.

Data Availability Statement

The datasets are available; please e-mail the corresponding author.

Acknowledgments

Thanks EPOO technology company a lot for providing the GNSS IF signal generation software.

Conflicts of Interest

The authors declare no conflicts of interest.

References

  1. Gao, B.; Hu, G.; Zhong, Y.; Zhu, X. Cubature Kalman filter with both adaptability and robustness for tightly-coupled GNSS/INS integration. IEEE Sens. J. 2021, 21, 14997–15011. [Google Scholar] [CrossRef]
  2. Gao, G.; Gao, B.; Gao, S.; Hu, G.; Zhong, Y. A hypothesis test-constrained robust Kalman filter for INS/GNSS integration with abnormal measurement. IEEE Trans. Veh. Technol. 2022, 72, 1662–1673. [Google Scholar] [CrossRef]
  3. Ruan, L.; Li, G.; Dai, W.; Tian, S.; Fan, G.; Wang, J.; Dai, X. Cooperative relative localization for UAV swarm in GNSS-denied environment: A coalition formation game approach. IEEE Internet Things J. 2021, 9, 11560–11577. [Google Scholar] [CrossRef]
  4. Ng, Y.; Gao, G.X. GNSS multi-receiver vector tracking. IEEE Trans. Aerosp. Electron. Syst. 2017, 53, 2583–2593. [Google Scholar] [CrossRef]
  5. Xu, B.; Jia, Q.; Hsu, L.T. Vector tracking loop-based GNSS NLOS detection and correction: Algorithm design and performance analysis. IEEE Trans. Instrum. Meas. 2019, 69, 4604–4619. [Google Scholar] [CrossRef]
  6. Zhao, S.; Akos, D. An open-source GPS/GNSS vector tracking loop-implementation, filter tuning, and results. In Proceedings of the 2011 International Technical Meeting of The Institute of Navigation, San Diego, CA, USA, 24–26 January 2011; pp. 1293–1305. [Google Scholar]
  7. Shen, J.; Wang, S.; Zhai, Y.; Zhan, X. Cooperative relative navigation for multi-UAV systems by exploiting GNSS and peer-to-peer ranging measurements. IET Radar Sonar Navig. 2021, 15, 21–36. [Google Scholar] [CrossRef]
  8. Vetrella, A.R.; Fasano, G.; Accardo, D.; Moccia, A. Differential GNSS and vision-based tracking to improve navigation performance in cooperative multi-UAV systems. Sensors 2016, 16, 2164. [Google Scholar] [CrossRef]
  9. Causa, F.; Fasano, G.; Grassi, M. Improving autonomy in GNSS-challenging environments by multi-UAV cooperation. In Proceedings of the 2019 IEEE/AIAA 38th Digital Avionics Systems Conference (DASC), San Diego, CA, USA, 8–12 September 2019; IEEE: Piscataway, NJ, USA; pp. 1–10. [Google Scholar]
  10. Sivaneri, V.O.; Gross, J.N. Flight-testing of a cooperative UGV-to-UAV strategy for improved positioning in challenging GNSS environments. Aerosp. Sci. Technol. 2018, 82, 575–582. [Google Scholar] [CrossRef]
  11. Goel, S.; Kealy, A.; Gikas, V.; Retscher, G.; Toth, C.; Brzezinska, D.G.; Lohani, B. Cooperative localization of unmanned aerial vehicles using GNSS, MEMS inertial, and UWB sensors. J. Surv. Eng. 2017, 143, 04017007. [Google Scholar] [CrossRef]
  12. Marçal, J.; Nunes, F. Robust vector tracking for GNSS carrier phase signals. In Proceedings of the 2016 International Conference on Localization and GNSS (ICL-GNSS), Barcelona, Spain, 28–30 June 2016; IEEE: Piscataway, NJ, USA; pp. 1–6. [Google Scholar]
  13. Jiang, C.; Chen, S.; Chen, Y.; Liu, D.; Bo, Y. GNSS vector tracking method using graph optimization. IEEE Trans. Circuits Syst. II Express Briefs 2020, 68, 1313–1317. [Google Scholar] [CrossRef]
  14. Luo, Y.; Wang, Y.; Wu, S.; Wang, P. Multipath effects on vector tracking algorithm for GNSS signal. Sci. China Inf. Sci. 2014, 57, 1–13. [Google Scholar] [CrossRef]
  15. Ren, T.; Petovello, M.; Basnayake, C. Improving GNSS bit synchronization and decoding using vector tracking. In Proceedings of the 26th International Technical Meeting of the Satellite Division of The Institute of Navigation (ION GNSS+ 2013), Nashville, TN, USA, 16–20 September 2013; pp. 121–134. [Google Scholar]
  16. Yang, H.; Zhou, B.; Wang, L.; Wei, Q.; Ji, F.; Zhang, R. Performance and evaluation of GNSS receiver vector tracking loop based on adaptive cascade filter. Remote Sens. 2021, 13, 1477. [Google Scholar] [CrossRef]
  17. Jiang, C.; Chen, Y.; Xu, B.; Jia, J.; Sun, H.; Chen, C.; Duan, Z.; Bo, Y.; Hyyppä, J. Vector tracking based on factor graph optimization for GNSS NLOS bias estimation and correction. IEEE Internet Things J. 2022, 9, 16209–16221. [Google Scholar] [CrossRef]
  18. Abedi, A.A.; Mosavi, M.R. Low computational-complexity vector tracking for low-cost GNSS receivers. Measurement 2022, 195, 111171. [Google Scholar] [CrossRef]
  19. Jiang, C.; Chen, S.; Chen, Y.; Bo, Y.; Wang, C.; Tao, W. Performance analysis of GNSS vector tracking loop based GNSS/CSAC integrated navigation system. J. Aeronaut. Astronaut. Aviat. 2017, 49, 289–297. [Google Scholar]
  20. Bhattacharyya, S.; Gebre-Egziabher, D. Integrity monitoring with vector GNSS receivers. IEEE Trans. Aerosp. Electron. Syst. 2014, 50, 2779–2793. [Google Scholar] [CrossRef]
  21. Xu, B.; Hsu, L.T. Open-source MATLAB code for GPS vector tracking on a software-defined receiver. GPS Solut. 2019, 23, 46. [Google Scholar] [CrossRef]
  22. Lashley, M.; Bevly, D.M.; Hung, J.Y. Performance analysis of vector tracking algorithms for weak GPS signals in high dynamics. IEEE J. Sel. Top. Signal Process. 2009, 3, 661–673. [Google Scholar] [CrossRef]
  23. Jiang, C.; Chen, Y.; Chen, C.; Hyyppa, J. Walking Gait Assisted Vector Tracking GNSS for Pedestrian Position. IEEE Trans. Instrum. Meas. 2023, 72, 8506711. [Google Scholar] [CrossRef]
  24. Chan, B.; Petovello, M.G. Collaborative vector tracking of GNSS signals with ultra-wideband augmentation in degraded signal environments. In Proceedings of the 2011 International Technical Meeting of The Institute of Navigation, San Diego, CA, USA, 24–26 January 2011; pp. 404–413. [Google Scholar]
  25. Gao, W.; Yang, R.; Huang, J.; Zhan, X. Quasi-deep integration for DPE/INS in GNSS navigation domain: Framework design and optimization. IEEE Trans. Aerosp. Electron. Syst. 2025, 61, 6774–6793. [Google Scholar] [CrossRef]
  26. Yang, R.; Ling, K.V.; Poh, E.K.; Morton, Y. Generalized GNSS signal carrier tracking: Part I—Modeling and analysis. IEEE Trans. Aerosp. Electron. Syst. 2017, 53, 1781–1797. [Google Scholar] [CrossRef]
  27. Yan, Z.; Chen, X.; Tang, X.; Zhu, X. The implementation and comparison between Kalman filter-based and vector tracking loops. In Proceedings of the IEEE International Conference on Sensing, Measurement & Data Analytics in the Era of Artificial Intelligence (ICSMD), Xi’an, China, 15–17 October 2020; pp. 45–50. [Google Scholar]
  28. Burchfield, S.; Givhan, C.; Martin, S. A Beam Steering Vector Tracking GNSS Software-Defined Receiver for Robust Positioning. Sensors 2025, 25, 1951. [Google Scholar] [CrossRef] [PubMed]
  29. Goel, S.; Kealy, A.; Lohani, B. Development and experimental evaluation of a low-cost cooperative UAV localization network prototype. J. Sens. Actuator Netw. 2018, 7, 42. [Google Scholar] [CrossRef]
  30. Jin, R.; Zhang, G.; Hsu, L.T.; Hu, Y. A Survey on Cooperative Positioning Using GNSS Measurements. IEEE Transactions on Intelligent Vehicles 2024, 1–20. [Google Scholar] [CrossRef]
  31. Chen, M.; Xiong, Z.; Xiong, J.; Wang, R. A hybrid cooperative navigation method for UAV swarm based on factor graph and Kalman filter. Int. J. Distrib. Sens. Netw. 2022, 18, 15501477211064758. [Google Scholar] [CrossRef]
  32. Ding, X.; Li, K.; Yang, Y. A navigation-data-tolerated EKF carrier loop for GNSS signals. IEICE Trans. Commun. March 2025. [Google Scholar] [CrossRef]
  33. Jiang, C.; Xu, B.; Hsu, L.T. Probabilistic approach to detect and correct GNSS NLOS signals using an augmented state vector in the extended Kalman filter. GPS Solut. 2021, 25, 72. [Google Scholar] [CrossRef]
  34. Gleason, S. A real-time on-orbit signal tracking algorithm for GNSS surface observations. Remote Sens. 2019, 11, 1858. [Google Scholar] [CrossRef]
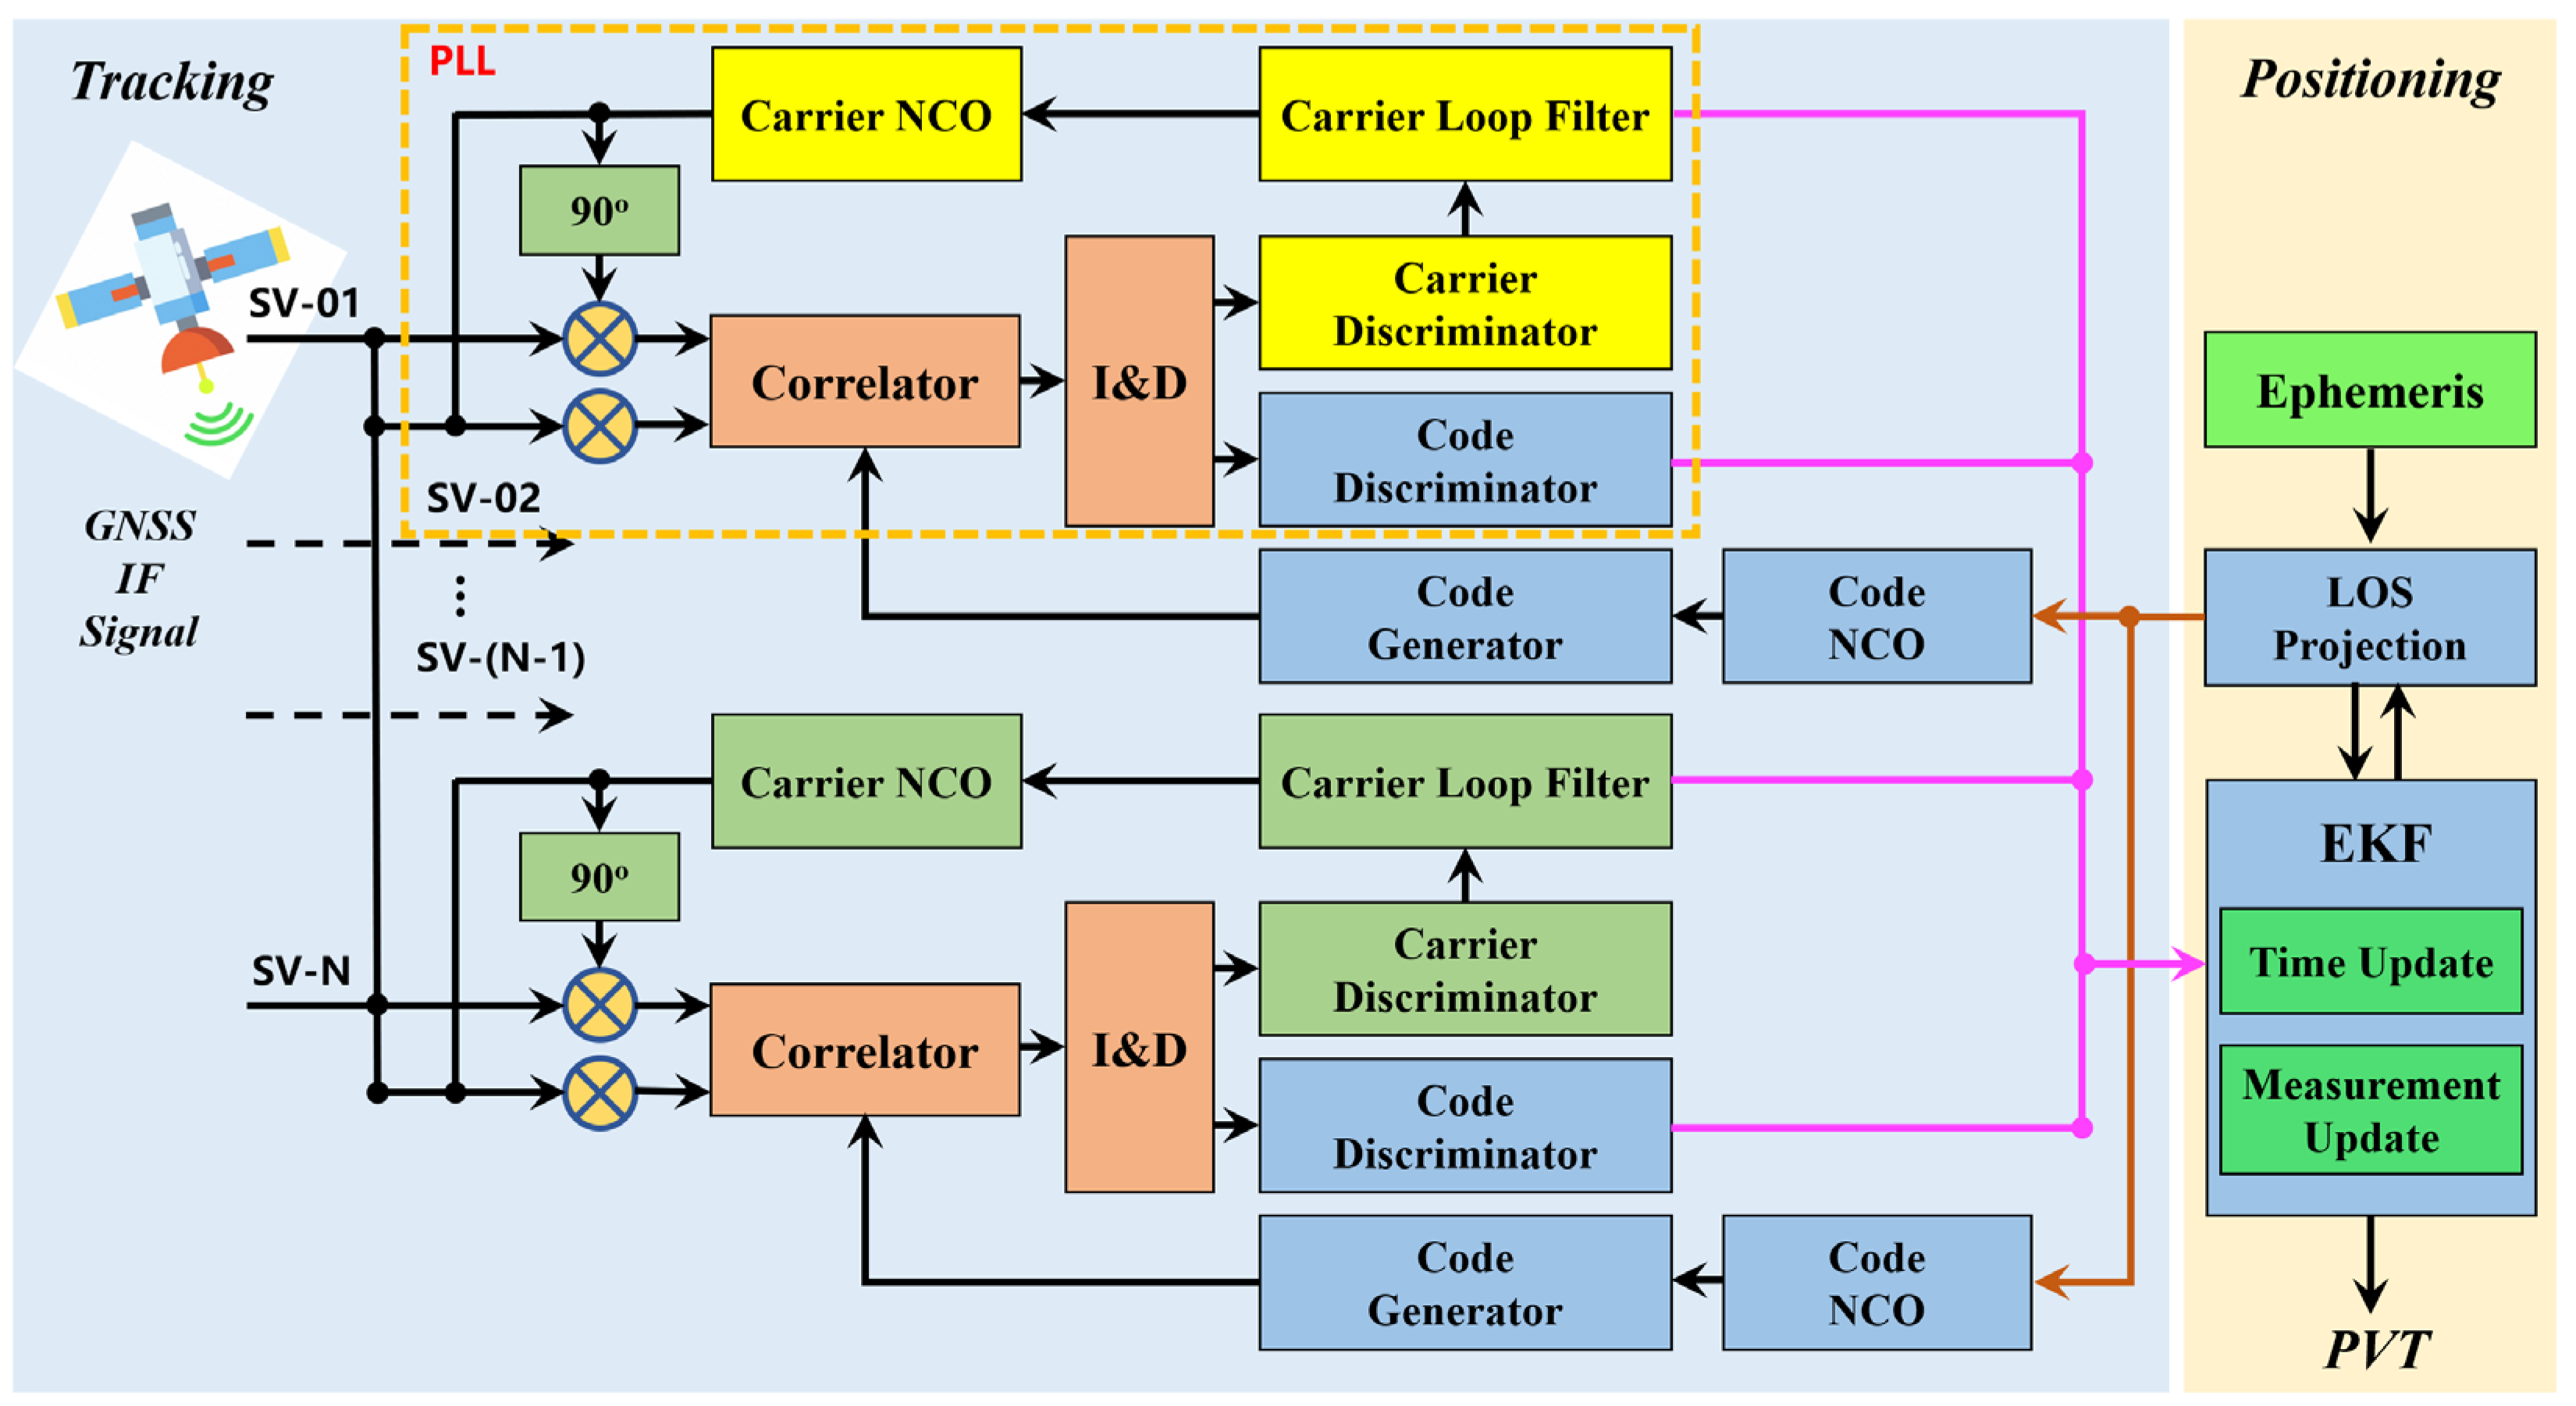
Figure 1. Working flow of the PLL-Assisted-VDLL GNSS receiver.
Remotesensing 17 02156 g001
Figure 2. Relationship between the position error vector and the code phase error.
Remotesensing 17 02156 g002
Figure 3. Illustration of the multiple UAVs.
Remotesensing 17 02156 g003
Figure 4. Flowchart of the FGO algorithm.
Remotesensing 17 02156 g004
Figure 5. Factor graph of the CoVDLL.
Remotesensing 17 02156 g005
Figure 6. Three-dimensional plot of the trajectories in ECEF coordinates.
Remotesensing 17 02156 g006
Figure 7. Satellite distribution.
Remotesensing 17 02156 g007
Figure 8. Position errors for UAV01 in the fixed inter-ranging experiment.
Remotesensing 17 02156 g008
Figure 9. Position errors for UAV02 in the fixed inter-ranging experiment.
Remotesensing 17 02156 g009
Figure 10. Position errors for UAV03 in the fixed inter-ranging experiment.
Remotesensing 17 02156 g010aRemotesensing 17 02156 g010b
Figure 11. Dynamic trajectories.
Remotesensing 17 02156 g011
Figure 12. Velocity information vs. time.
Remotesensing 17 02156 g012
Figure 13. Position errors for UAV01 in the time-varying inter-ranging experiment.
Remotesensing 17 02156 g013
Figure 14. Position errors for UAV02 in the time-varying inter-ranging experiment.
Remotesensing 17 02156 g014
Figure 15. Position errors for UAV03 in the time-varying inter-ranging experiment.
Remotesensing 17 02156 g015aRemotesensing 17 02156 g015b
Table 1. Trajectory Description.
TimeAction
0 ~ 50 sstatic
50 s ~ 60 suniform acceleration
60 s ~ 90 scircular motion
90 s ~ 100 suniform motion
100 s ~ 130 scircular motion
130 s ~ 180 suniform motion
Table 2. STD values from the fixed inter-ranging experiment (Horizontal position errors).
Mean ValuesSTD Values
VDLL (m)CoVDLL (m)VDLL (m)CoVDLL (m)
UAV01X-Axis5.332.973.862.30
Y-Axis6.983.905.342.95
Z-Axis5.223.003.492.28
UAV02X-Axis5.043.033.672.21
Y-Axis7.945.085.204.10
Z-Axis6.044.494.302.74
UAV03X-Axis4.513.353.152.29
Y-Axis7.894.485.633.32
Z-Axis6.495.264.453.07
Table 3. STD values (Horizontal position errors).
Mean ValuesSTD Values
VDLL (m)CoVDLL (m)VDLL (m)CoVDLL (m)
UAV01X-Axis4.062.533.081.87
Y-Axis7.104.545.173.53
Z-Axis6.075.004.233.05
UAV02X-Axis4.463.503.292.61
Y-Axis9.285.947.284.44
Z-Axis5.565.303.963.49
UAV03X-Axis4.193.393.172.42
Y-Axis6.555.225.024.03
Z-Axis5.514.964.023.40
Disclaimer/Publisher’s Note: The statements, opinions and data contained in all publications are solely those of the individual author(s) and contributor(s) and not of MDPI and/or the editor(s). MDPI and/or the editor(s) disclaim responsibility for any injury to people or property resulting from any ideas, methods, instructions or products referred to in the content.