Article

Enhancing Highway Scene Understanding: A Novel Data Augmentation Approach for Vehicle-Mounted LiDAR Point Cloud Segmentation

1
State Key Laboratory of Information Engineering in Surveying, Mapping and Remote Sensing, Wuhan University, Wuhan 430072, China
2
Shanxi Intelligent Transportation Laboratory Co., Ltd., Shanxi Transportation Research Institute Group Co., Ltd., Taiyuan 030032, China
3
School of Remote Sensing Information Engineering, Wuhan University, Wuhan 430072, China
*
Author to whom correspondence should be addressed.
These authors contributed equally to this work.
Remote Sens. 2025, 17(13), 2147; https://doi.org/10.3390/rs17132147
Submission received: 7 May 2025 / Revised: 15 June 2025 / Accepted: 19 June 2025 / Published: 23 June 2025

Abstract

The intelligent extraction of highway assets is pivotal for advancing transportation infrastructure and autonomous systems, yet traditional methods relying on manual inspection or 2D imaging struggle with sparse, occluded environments, and class imbalance. This study proposes an enhanced MinkUNet-based framework to address data scarcity, occlusion, and imbalance in highway point cloud segmentation. A large-scale dataset (PEA-PC Dataset) was constructed, covering six key asset categories, addressing the lack of specialized highway datasets. A hybrid conical masking augmentation strategy was designed to simulate natural occlusions and enhance local feature retention, while semi-supervised learning prioritized foreground differentiation. The experimental results showed that the overall mIoU reached 73.8%, with the IoU of bridge railings and emergency obstacles exceeding 95%. The IoU of columnar assets increased from 2.6% to 29.4% through occlusion perception enhancement, demonstrating the effectiveness of this method in improving object recognition accuracy. The framework balances computational efficiency and robustness, offering a scalable solution for sparse highway scenes. However, challenges remain in segmenting vegetation-occluded pole-like assets due to partial data loss. This work highlights the efficacy of tailored augmentation and semi-supervised strategies in refining 3D segmentation, advancing applications in intelligent transportation and digital infrastructure.

1. Introduction

With the growing demand for digital and intelligent transformation of transportation infrastructure, emerging applications such as high-precision maps, intelligent transportation systems, and autonomous driving have experienced rapid development. Consequently, there is an increasing demand for the refined and intelligent extraction of road assets [1].
Traditional road asset extraction methods mainly rely on manual inspection or 2D image recognition, which are often limited by insufficient information dimensions and low accuracy [2]. In contrast, point cloud data generated by 3D laser scanning (LiDAR) not only provides accurate geometric and semantic information, ultra-high spatial resolution, and large-scale modeling capabilities but also holds broad application prospects in the construction of road asset databases [3]. With the advent of convolutional neural networks, deep learning-based point cloud segmentation methods have become the mainstream approach for intelligent asset extraction, offering effective support for asset recognition in complex road environments [4,5]. Therefore, developing high-precision and efficient point cloud-based segmentation methods for road assets is of great significance in promoting intelligent transportation and digital infrastructure construction.
Semantic segmentation methods based on point cloud data directly utilize point clouds as input to end-to-end spatial feature learning networks [6], offering strong robustness and generalization capabilities. To handle large-scale and multi-class point cloud scenes, networks such as PointNet [7] and PointNet++ [8] typically use raw points as input. These methods are simple in structure, invariant to point ordering, efficient in computation, and effective in feature extraction. Networks like RandLA-Net [9], BAAF-Net [10], and SCF-Net [11] adopt random sampling strategies, which result in low computational complexity and high storage efficiency. However, despite their efficiency advantages, these methods still exhibit significant limitations in capturing contextual details [12] and modeling complex local structures [13], thereby restricting their performance in fine-grained asset recognition tasks. In addition, most existing deep learning-based methods are developed under the assumption of densely distributed foreground objects and balanced category distributions [14]. In contrast, highway road assets are often sparsely distributed, highly diverse in category, and frequently occluded or observed at long distances, which considerably weakens the effectiveness of feature extraction and model training [15]. Therefore, designing efficient point cloud segmentation methods tailored to the sparse distribution and diverse morphology of highway assets has become a critical challenge [5].
To address the above challenges, this paper proposes a highway road asset extraction method based on an improved MinkUNet [16] framework. The method effectively addresses issues such as data scarcity, category imbalance, and severe occlusion in highway scenarios. Specifically, a highway road asset point cloud segmentation dataset is constructed. Then, a highway-aware hybrid conical masking data augmentation strategy is designed, which effectively tackles the aforementioned challenges. Finally, the proposed method achieves the best asset segmentation performance on a benchmark dataset, demonstrating its effectiveness and superior extraction capabilities.
In summary, this paper makes the following three major contributions:
  • A large-scale point cloud dataset for highway road infrastructure is constructed, including six major asset categories. This fills the gap in existing large-scale highway asset segmentation datasets and provides valuable data support for related research.
  • A semi-supervised learning-based method for highway point cloud asset segmentation is proposed. Extensive experiments show that the segmentation accuracy for various asset types and the overall performance reach optimal levels, validating the superiority of the proposed approach.
  • A highway-aware hybrid conical masking data augmentation strategy is developed, which effectively alleviates challenges related to uneven asset distribution and the loss of local information. This significantly enhances the network’s ability to recognize road assets in complex environments and its robustness to occlusions.

2. Related Work

In this section, we categorize related work on deep learning-based point cloud semantic segmentation methods into two main types: fully supervised and semi- supervised approaches.

2.1. Fully Supervised Point Cloud Semantic Segmentation

In the field of LiDAR point cloud processing for semantic segmentation, a key challenge lies in effectively managing sparse and irregularly distributed data. To address this, various strategies have been employed to reformat raw point clouds into more tractable representations, such as converting them into volumetric 3D voxel grids [16,17,18,19,20], compressing them into 2D bird’s-eye-view images, and mapping them into 2D range images [5,21,22,23,24,25,26]. PolarNet [27] introduced a novel approach by projecting point clouds onto a polar-coordinate-based 2D grid, thereby achieving a more uniform distribution of points. The integration of novel 3D sparse convolutional layers has enabled researchers to leverage 3D sparse CNNs [20,28] for increasingly successful voxelized feature representation. In this area, researchers continue to explore diverse technical paths to address the inherent non-uniformity of point clouds. Some researchers opt to process raw point coordinates directly [7,8,29,30], while others transform point clouds into 2D images to benefit from well-established 2D convolutional architectures, thus also sparking interest in sparse voxel grids for 3D scenes.
Traditionally, these methods are developed under fully supervised frameworks, which rely heavily on point clouds with dense annotations—an expensive and time-consuming process. Our work takes a different direction by aiming to enhance the current state of LiDAR point cloud semantic segmentation without a heavy dependence on large-scale manual labeling.
Although fully supervised methods for point cloud semantic segmentation have developed rapidly, their reliance on densely annotated datasets remains a limitation. Hence, there is a growing need to enhance semantic segmentation capabilities without such extensive manual annotation.

2.2. Semi-Supervised Point Cloud Semantic Segmentation

Unlike 2D environments, the concept of partial supervision in point cloud processing remains relatively underexplored. In the realm of 3D semantic segmentation, particularly under semi-supervised conditions, several notable methods have emerged, illustrating the innovative breadth of this research area.
Liu et al. [31] explored the use of a weight-sharing model within a 3D UNet architecture to ensure consistency in feature extraction throughout the segmentation process. This approach contrasts with other efforts that develop customized networks specifically designed for 3D segmentation, prioritizing efficiency and domain-specific adaptation. Xu et al. [32] made a significant contribution by showing that semi-supervised learning outcomes can approximate those from fully supervised settings. Building on this idea, they proposed a weakly supervised segmentation network using the softmax cross-entropy loss.
Based on this concept, Wei et al. [33] introduced a feature redistribution mechanism within the KPConv framework [30], effectively expanding supervision both within and across samples. Zhang et al. [34] and their team incorporated self-supervised learning principles into 3D segmentation. They developed a system that integrates self-distillation mechanisms and context-aware modules into the RandLA-Net architecture, enhancing network interpretability through auxiliary signals derived from graph topology. Hu et al. [35] proposed a semantic query network capable of capturing broad semantic features, particularly beneficial for minimal supervision training on randomly selected point locations. To tackle the challenge of identifying subcategories within broader semantic classes, Su et al. [36] introduced a multi-prototype classifier, where each prototype represents a distinct subcategory, allowing for finer-grained discrimination. Yang et al. [37] approached segmentation from a multiple-instance learning perspective, integrating Transformer architectures [38] to better capture intra- and inter-point cloud relationships. Complementarily, Han et al. [39] developed a novel sampling method integrated into RandLA-Net to facilitate parameter sharing during training.
In summary, semi-supervised learning methods for point cloud semantic segmentation have made considerable progress. However, they remain difficult to apply directly to complex highway scenes and lack the granularity required for accurate highway asset extraction. As a result, exploring semi-supervised segmentation tailored for highway scenarios has become a research hotspot in this domain.

3. PEA-PC Dataset

3.1. Scene Description

In this study, the constructed dataset is derived from vehicle-mounted LiDAR point cloud data collected along the Pingyang section of the Shanxi Province Expressway. As shown in Figure 1, the Pingyang Expressway section is part of the Jingkun Expressway in China, located between Pingding County and Yangqu County in Taiyuan City, Shanxi Province. It is commonly referred to as the “Pingyang Section”. The route begins east of Shenshuiquan in Chankou Town, Pingding County, connecting to the Hebei section of the Jingkun Expressway. It passes through the suburban district of Yangquan City, Yuxian County, Yangqu County, and Jiancaoping District of Taiyuan City, and ends northwest of Beishantou Village in Yangqu Town, Jiancaoping District, where it connects with the original Taiyuan Expressway and the Northwest Ring Expressway of Taiyuan. This expressway is a dual six-lane highway crossing the Taihang Mountains and is situated at the intersection of plains, low hills, and high mountainous terrain.
The route features highly variable topography and a complex geological and hydrological environment. It includes prominent structural features such as mountains, canyons, steep slopes, and tall bridge piers, with numerous bridges and tunnels distributed along the route. These distinctive characteristics result in a rich variety of road assets and complex spatial distribution patterns, offering a challenging and representative data environment for research on road asset segmentation using point cloud data, and demonstrating high research value and practical significance.

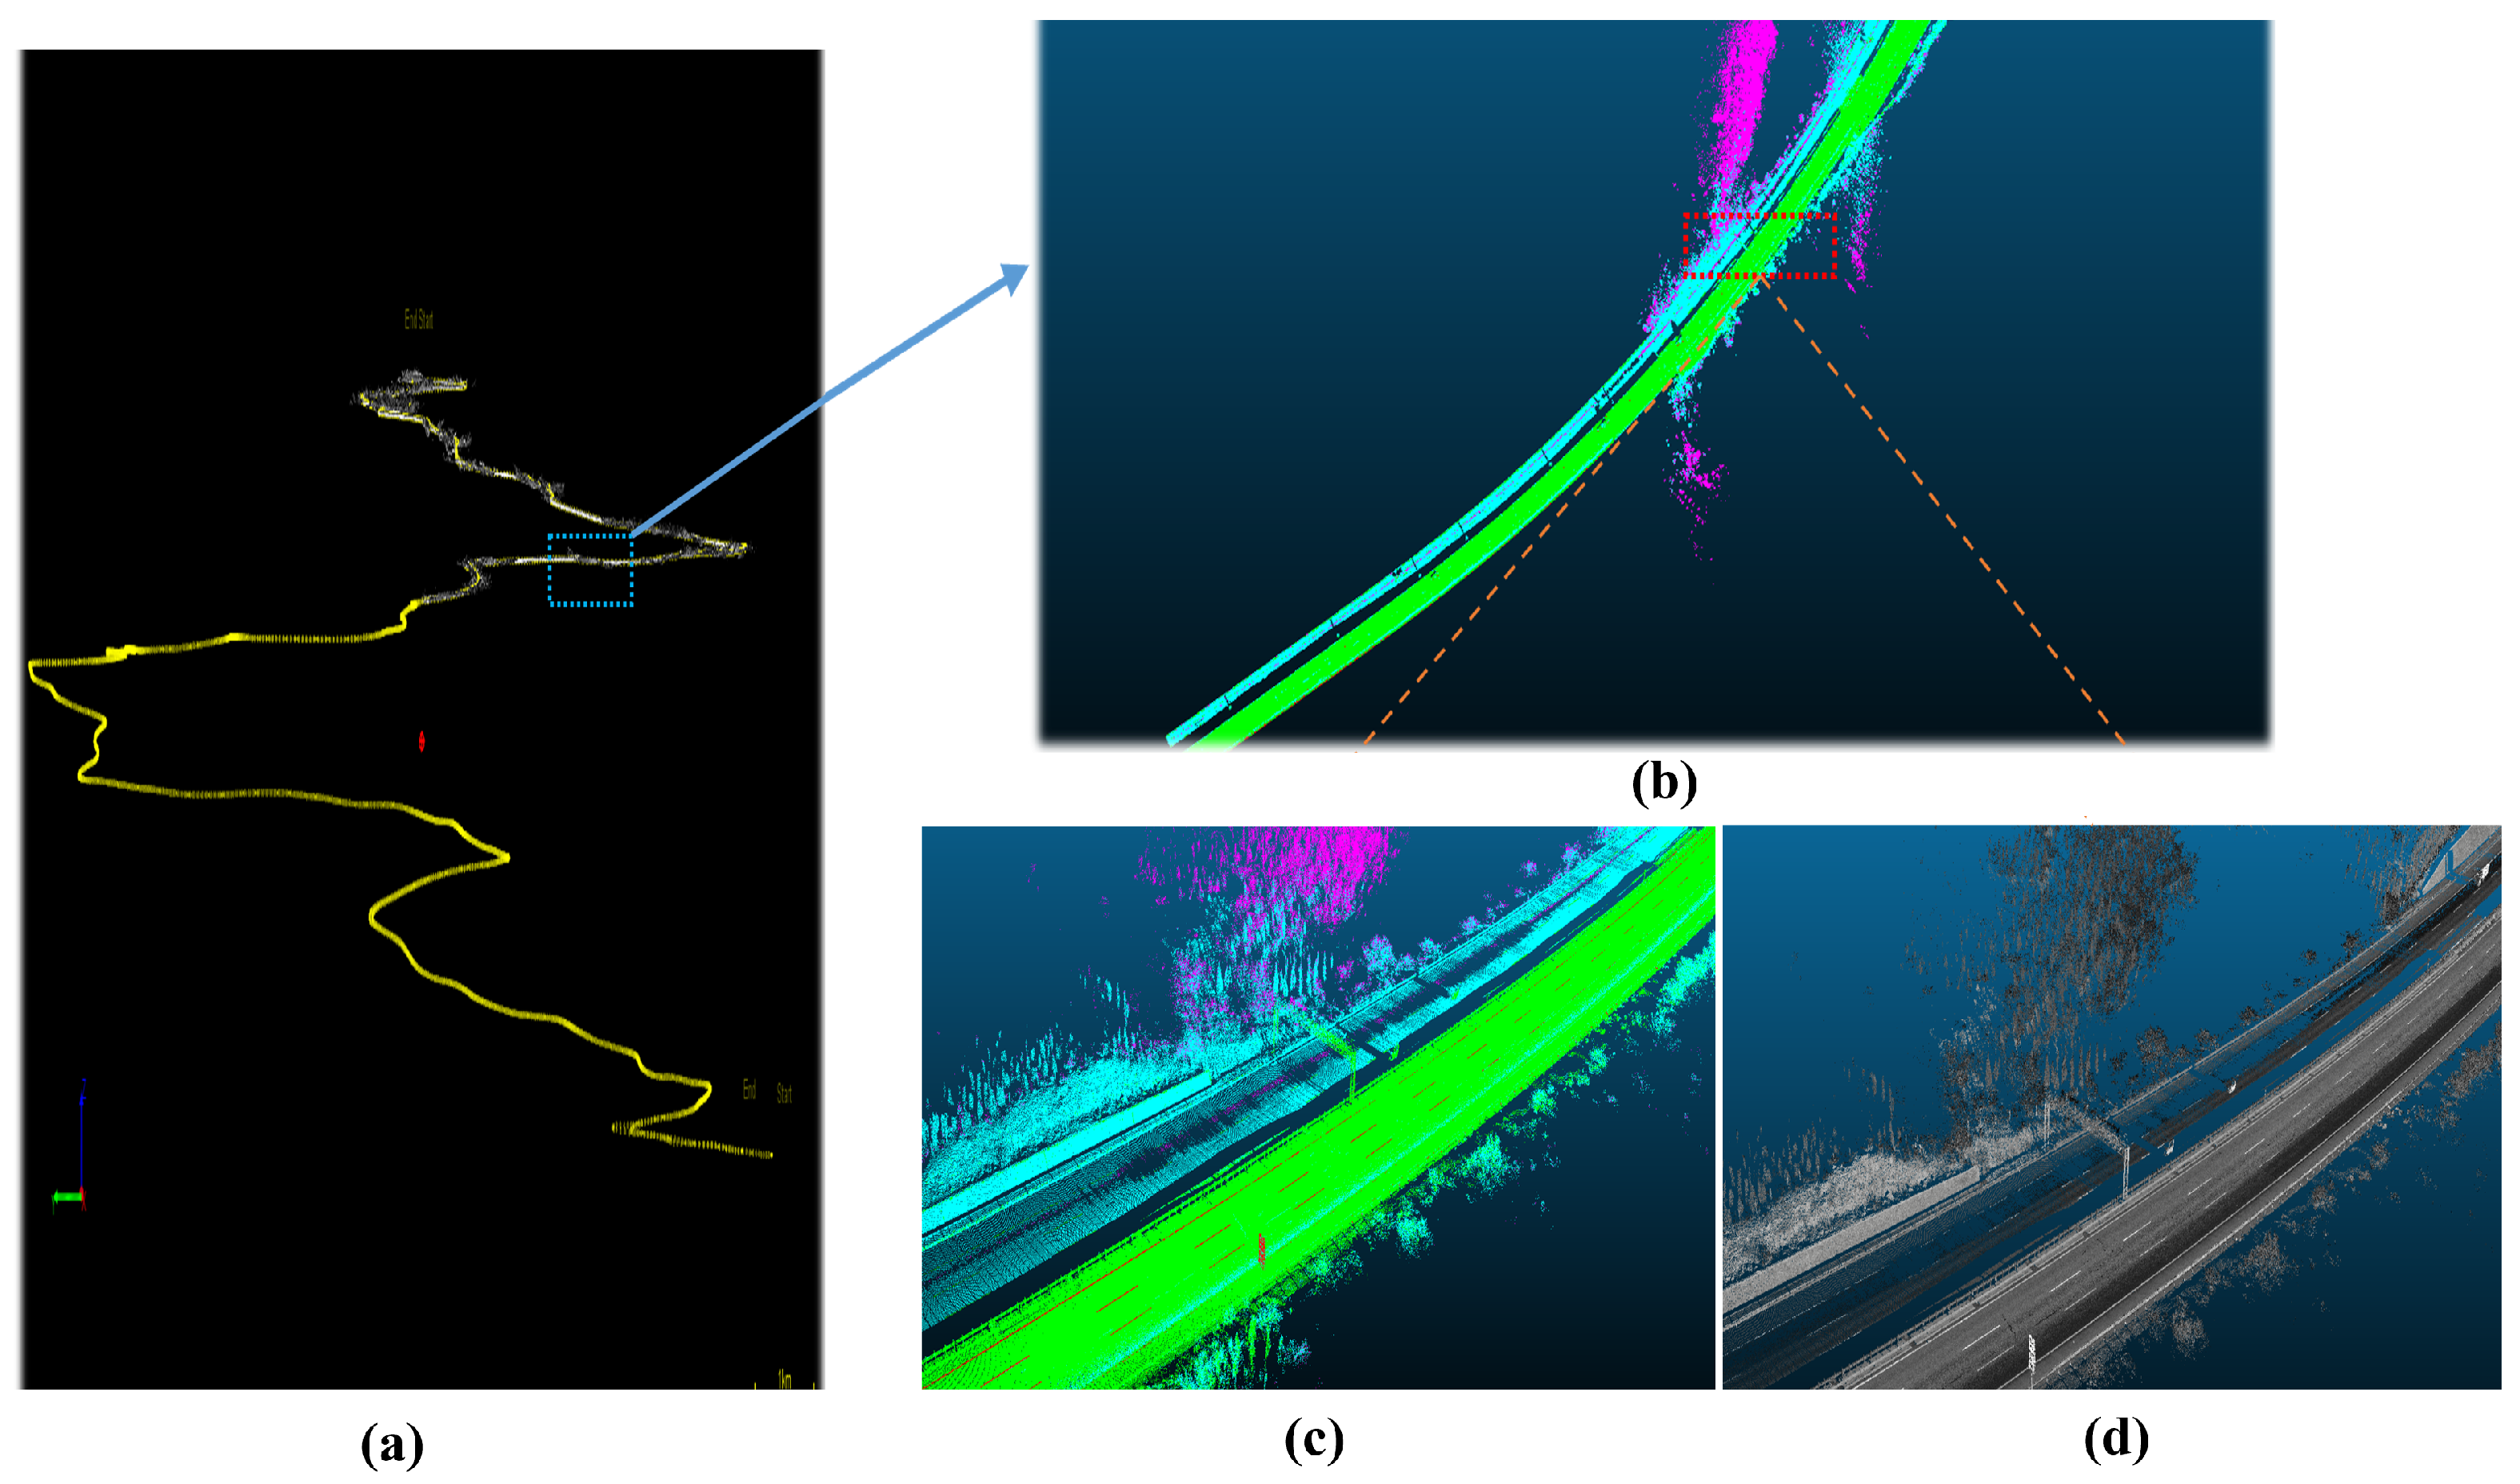
3.2. Point Cloud Collection

The LiDAR equipment used is the HiScan-C SU1 3D Mobile Mapping System, which offers high accuracy, dense point clouds, excellent object recognition, and precise measurements. Figure 2a presents an oblique view of the Pingyang section of the Jingkun Expressway. Figure 2b highlights a representative segment that contains most categories of roadside assets. In Figure 2c, point cloud intensity values are visualized as a scalar field using the CloudCompare software (v2.11.1), with standard color rendering applied to depict road surfaces and roadside objects. This visualization leverages differences in material reflectivity, which aids in the identification of object types. Figure 2d also visualizes the point cloud intensity as a scalar field, but rendered in grayscale mode, allowing clearer observation of real surface textures, fine edges, linear structures, cracks, and boundary lines. Data acquisition was scheduled on weekday mornings under favorable weather conditions to minimize the impact of environmental and traffic factors on the data quality. Figure 3 shows a horizontal view of the complete point cloud dataset collected.

3.3. Annotation

The collected data were exported in segments of 512 MB each, totaling 350 segments. Given the labor-intensive and time-consuming nature of point cloud annotation, 14 non-adjacent segments were randomly selected for manual labeling using the Cloudcompare point cloud software tool; the points associated with these asset types in the selected segments were meticulously annotated, resulting in the Pingyang Expressway Asset Point Cloud Dataset (PEA-PC Dataset). The dataset includes six categories of highway assets:
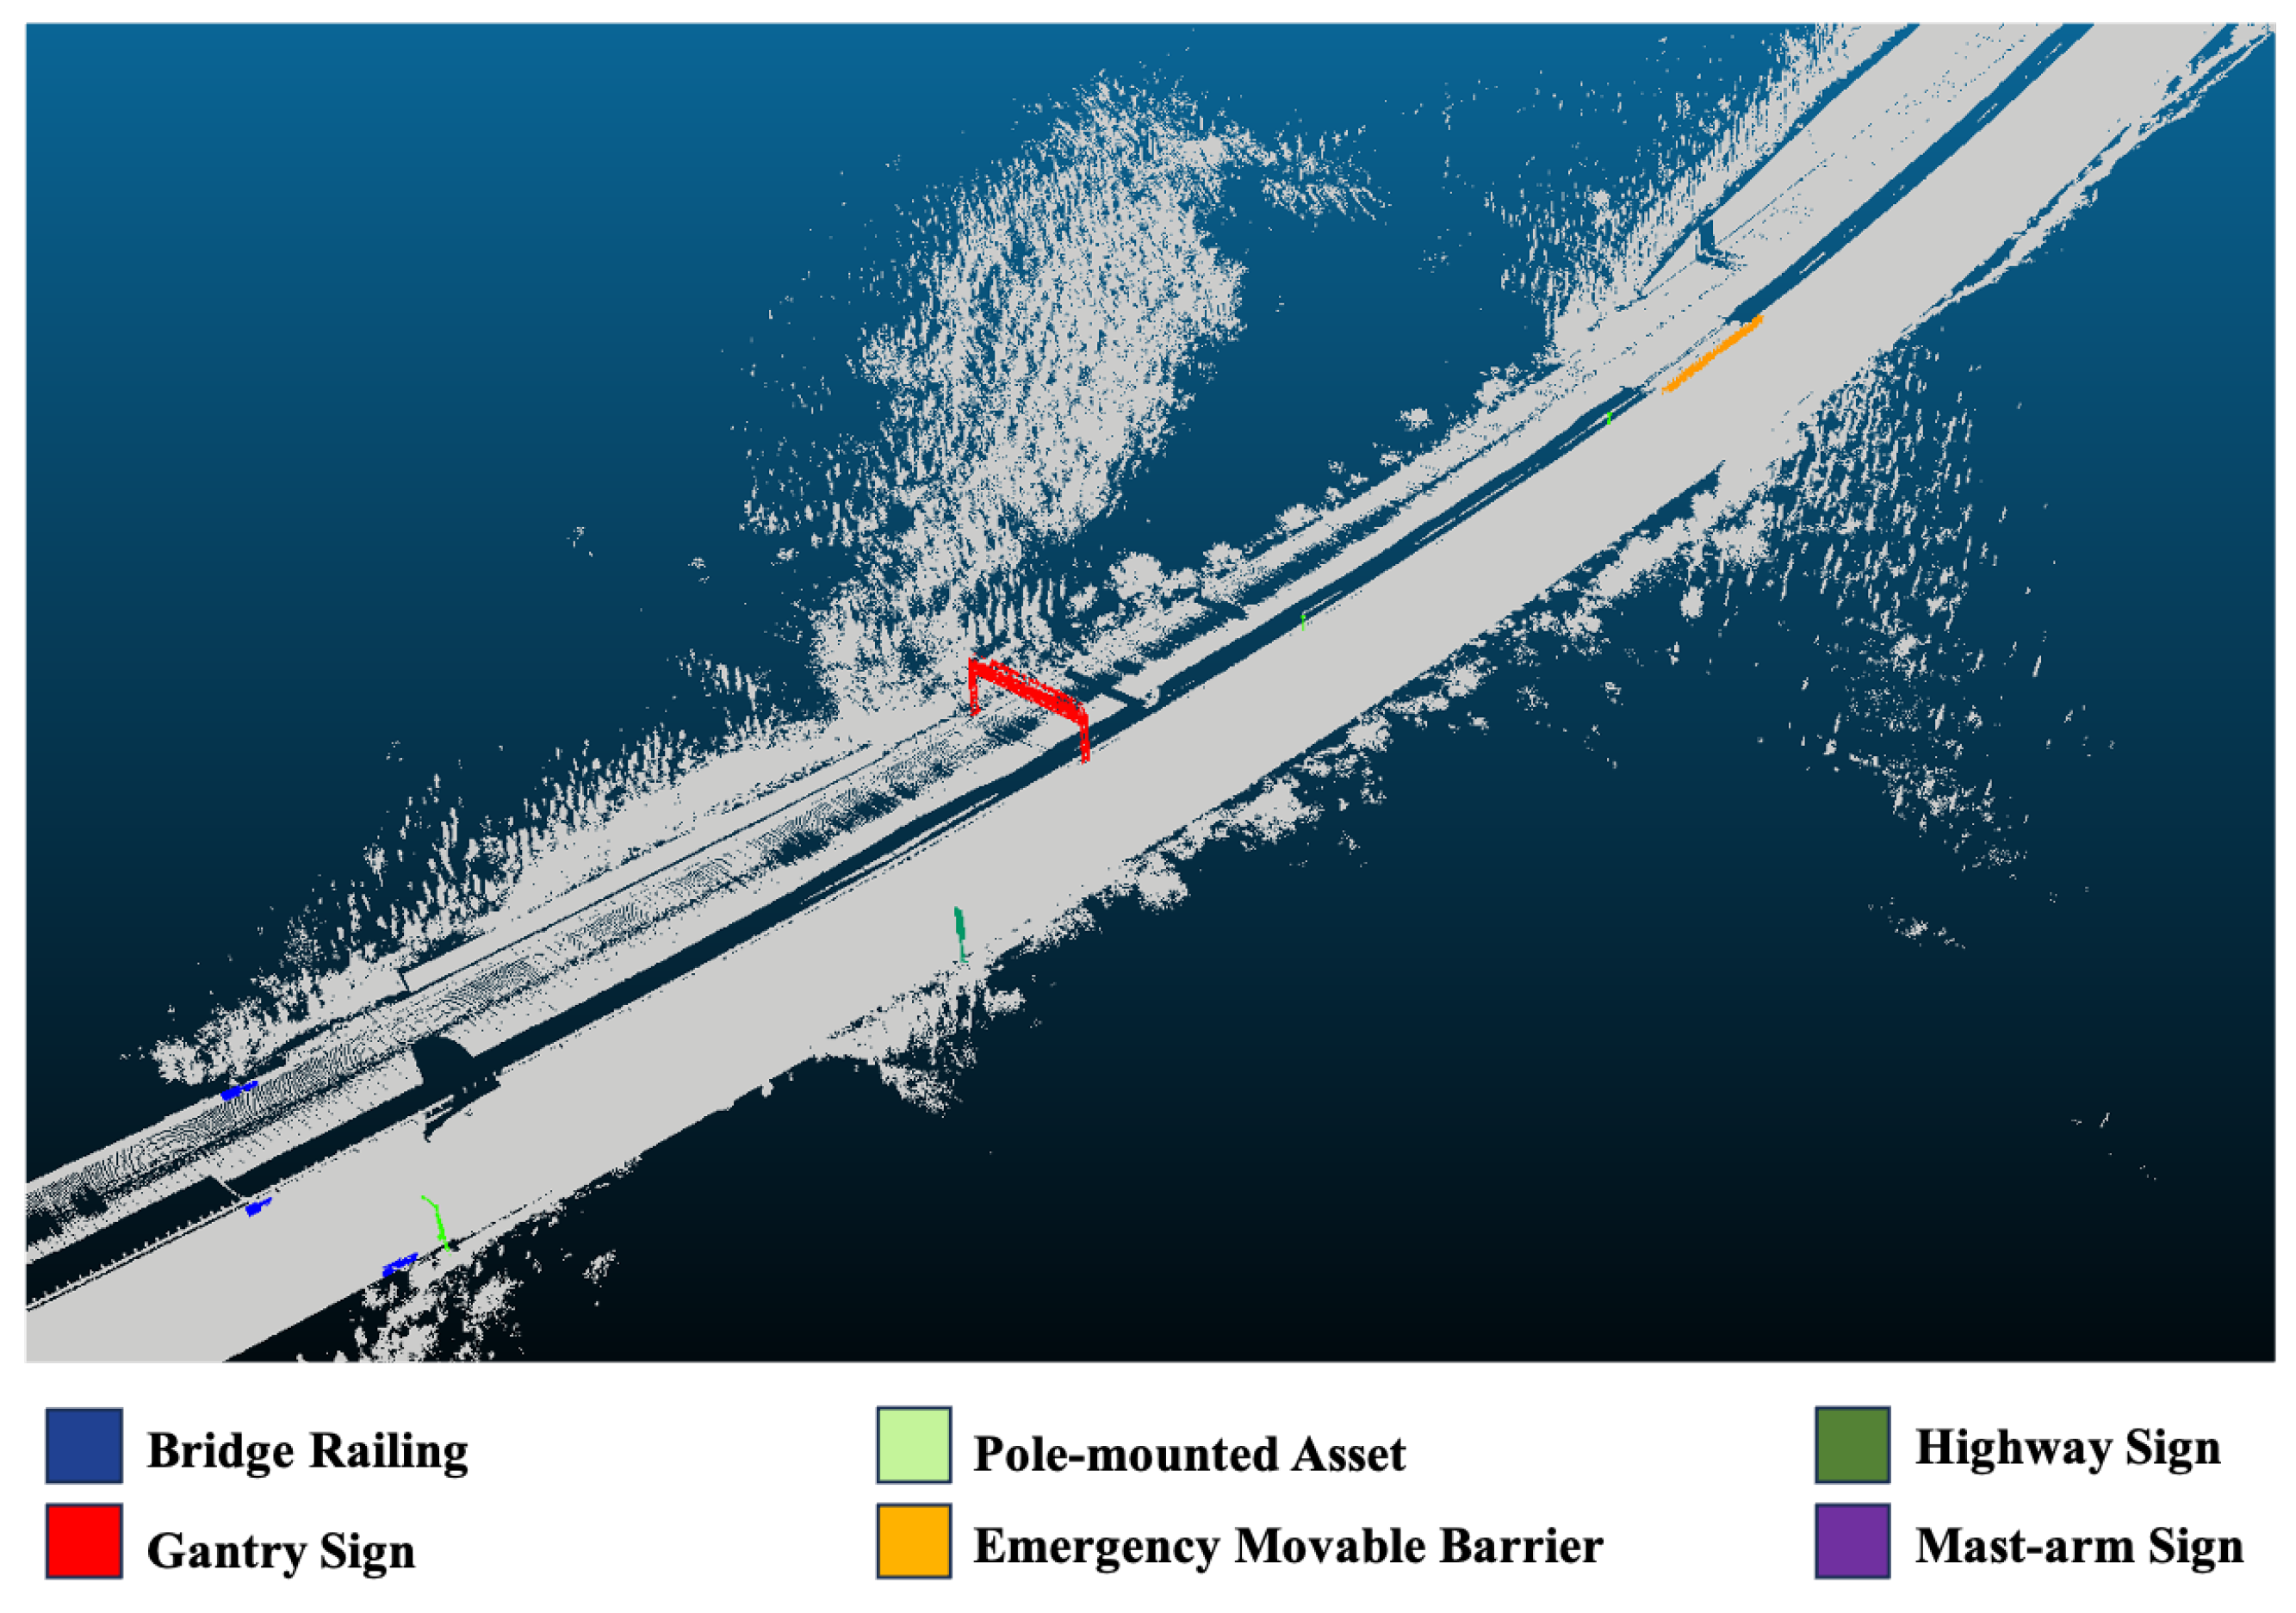
  • Bridge railing: These are typically long and difficult to annotate. Annotation was focused on their junctions with roadside guardrails, usually found at the beginning of bridge sections.
  • Highway sign: These include directional or guidance signs to aid navigation, warning signs to alert road users to potential hazards or changing road conditions, prohibition or regulatory signs (e.g., speed limits, no left turn), and informational signs indicating services, tourist attractions, restrooms, etc.
  • Pole-mounted assets: These include various facilities or devices mounted on roadside poles, such as camera mounts and warning lights.
  • Mast-arm sign: Signs mounted on overhead cantilever structures.
  • Emergency movable barrier: Temporary barriers used to guide or restrict traffic during emergencies or maintenance.
  • Gantry signs: Large overhead sign structures that span the road, often used for traffic guidance on expressways.

4. Method

4.1. Baseline Method

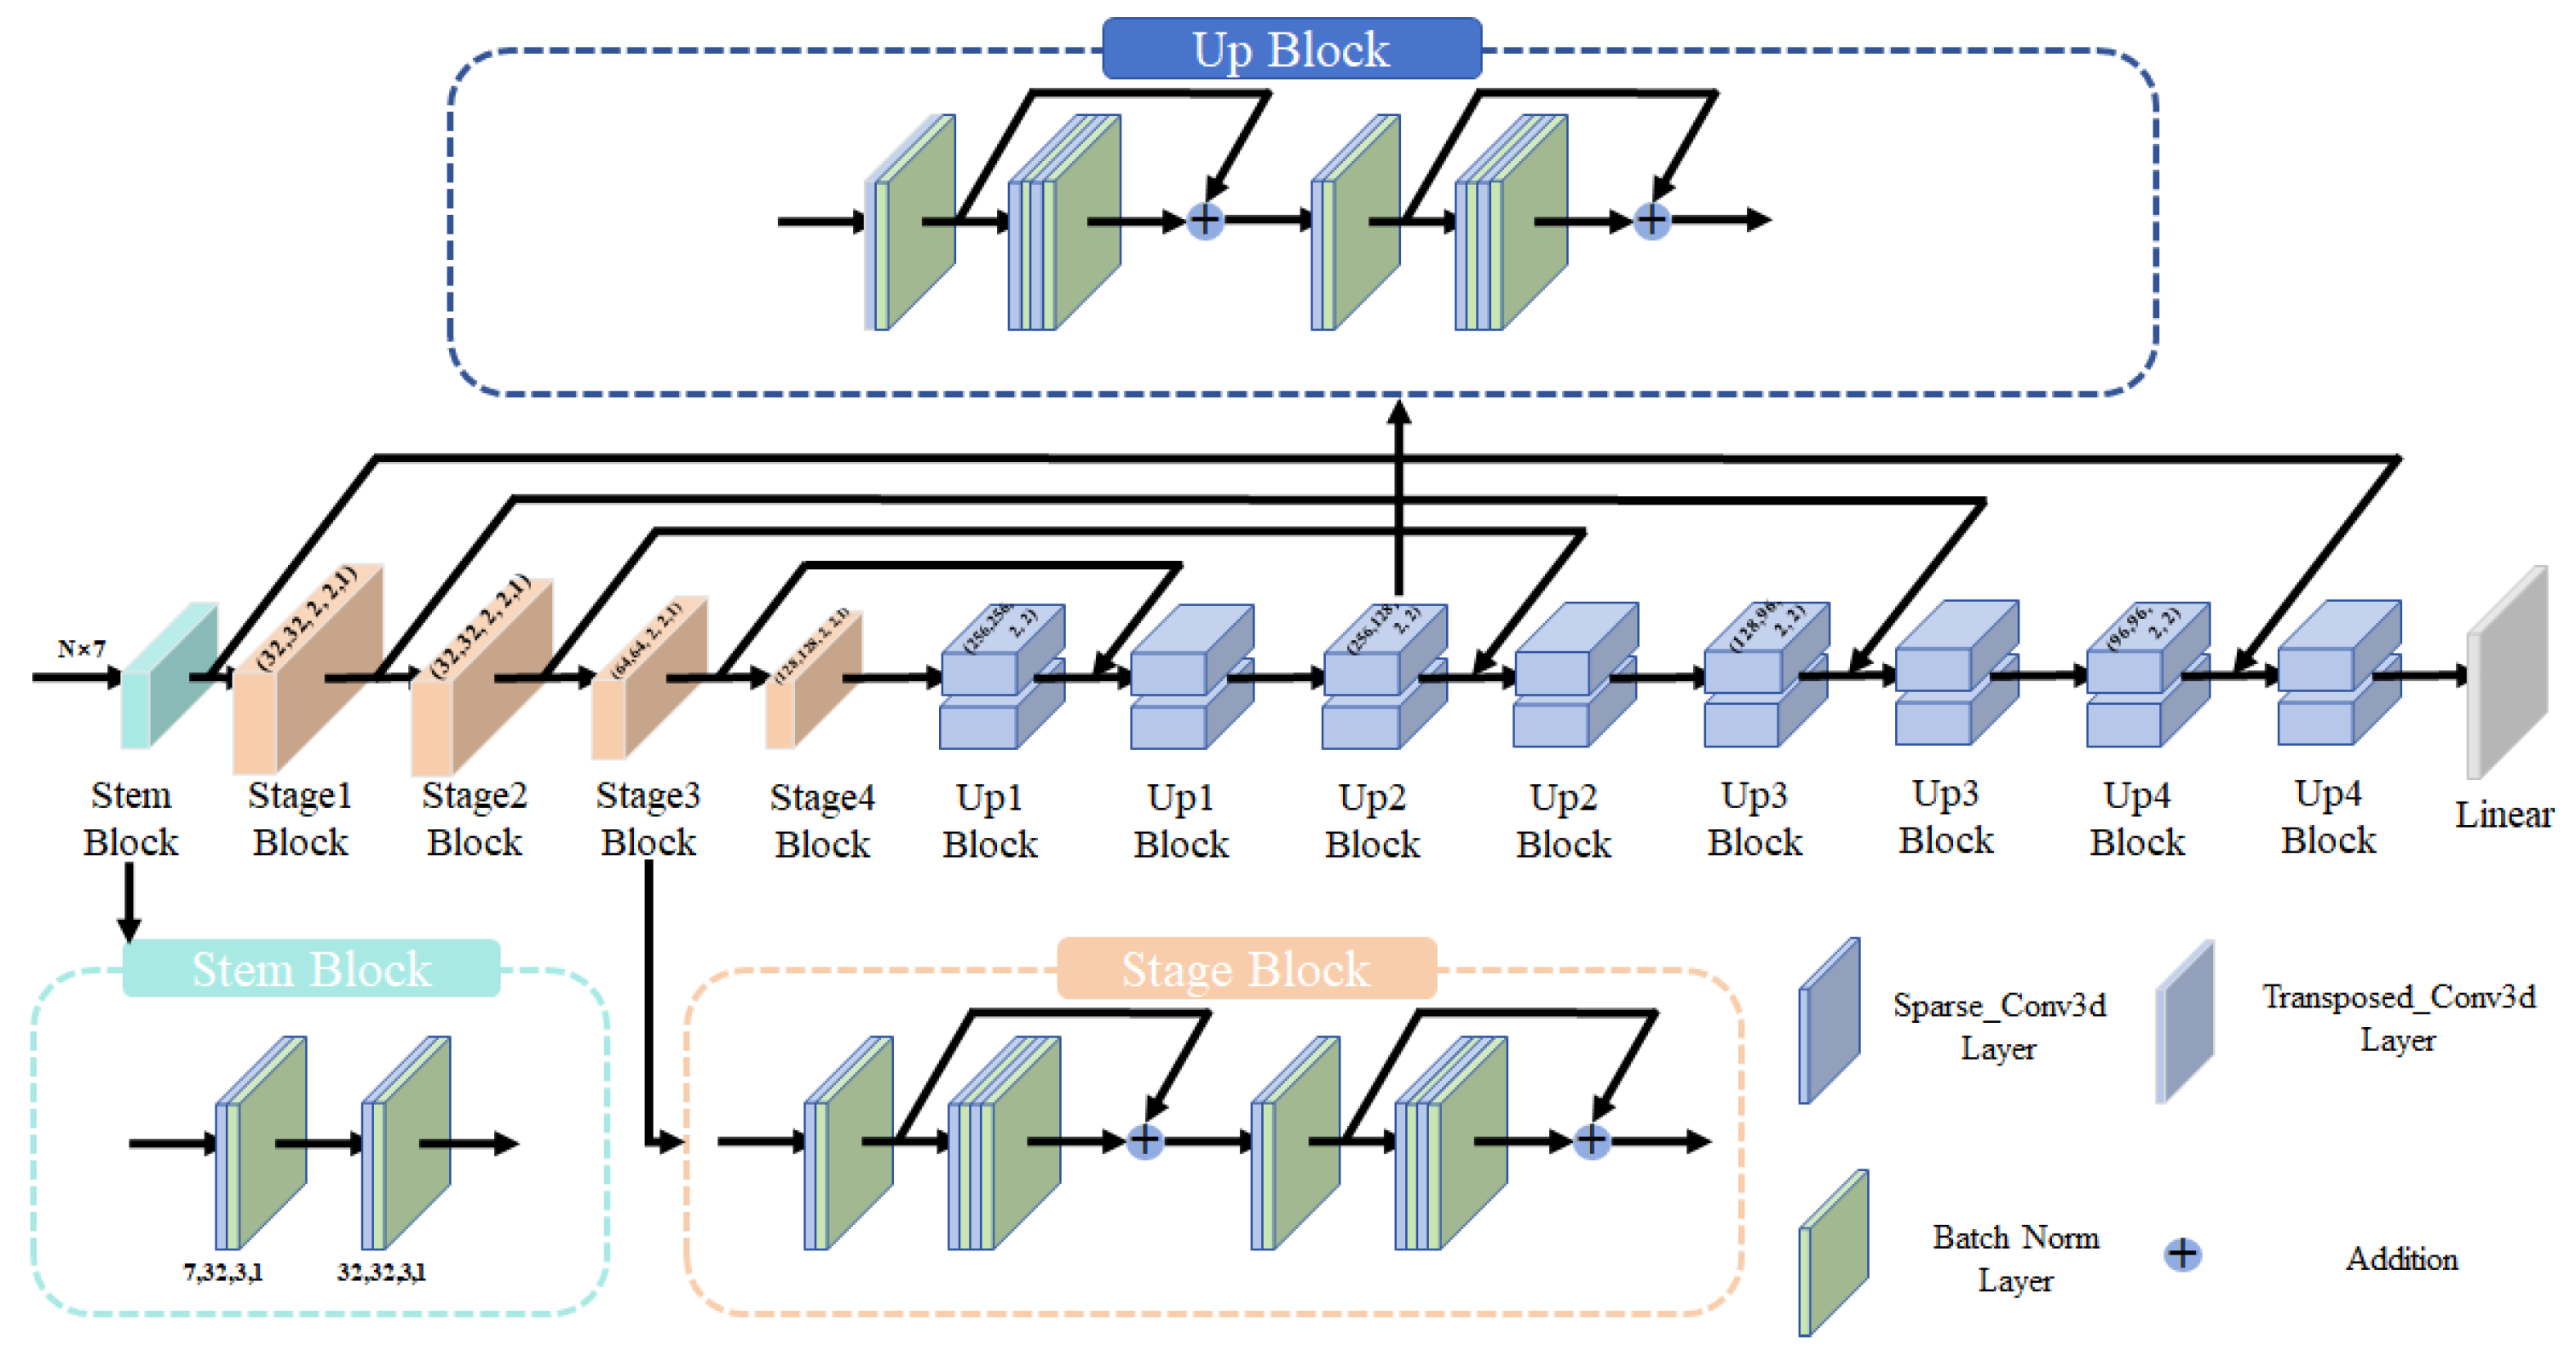
4.1.1. Model Introduction and Network Structure

In this study, we employed MinkUNet [16] as our baseline model, which is a 3D fully convolutional neural network tailored for point cloud data. MinkUNet is inspired by the classic U-Net [40] architecture, demonstrating outstanding performance when dealing with the sparse nature of point cloud data. The key features of MinkUNet include its efficient processing of point cloud data and effective extraction of features for different categories in semantic segmentation tasks.
As show in Figure 4, the network structure of MinkUNet consists of an encoder and a decoder. The encoder progressively reduces the resolution of feature maps through a series of convolutional and pooling layers to capture higher-level semantic information. Conversely, the decoder gradually restores the resolution and fuses features with corresponding layers of the encoder through skip connections to retain more spatial information. The encoder is composed of a series of basic convolution blocks and residual blocks, which achieve deep feature extraction from point cloud data by gradually increasing the size and stride of convolution kernels. The decoder utilizes basic deconvolution blocks and residual blocks, restoring feature maps to their original resolution through upsampling operations.
MinKUNet provides a powerful tool for road asset segmentation tasks in highway scenarios through its efficient data processing capabilities, optimized memory usage, and unique feature extraction mechanism. As shown in Table 1, classical methods such as PointNet++ and RandLA-Net perform poorly on pole-mounted assets, with mIoU scores of only 6.2% and 13.2%, respectively. Recently proposed models such as SPVNAS [18] (27.6%), LACV-Net [41] (22.9%), and MCNet [42] (15.8%) achieve better overall segmentation in large-scale outdoor scenes, but they are primarily designed for general-purpose object categories. These models struggle with pole-like assets due to their high occlusion rate, sparse and elongated geometry, and frequent structural incompleteness in LiDAR scans.
In contrast, our proposed MinKUNet explicitly targets the fine-grained segmentation of pole-mounted roadside assets in highway scenarios. It integrates structural-aware feature encoding and occlusion-robust learning modules, achieving the highest mIoU of 29.4% among all the compared methods. These results validate the need for task-specific model design when addressing the unique challenges posed by pole extraction under severe occlusion and geometric ambiguity.

4.1.2. Optimization Strategies and Loss Function

To optimize the parameters of the MinkUNet model and enhance its semantic segmentation performance on point cloud data, we adopted Focal Loss [43] as the loss function. This loss function is specifically designed to enhance the model’s learning on difficult-to-distinguish samples while addressing the issue of class imbalance. Our main training objective is to minimize Focal Loss by assigning a smaller loss contribution to correctly classified samples and a larger loss to misclassified samples, making the model focus more on difficult samples during training. This loss function is particularly suited for datasets where the discrepancy between class instances is significant. The implemented loss, L Focal , is tailored to enhance the model’s sensitivity towards less represented classes. This is achieved by dynamically scaling the cross-entropy loss, based on the confidence of the classification. Specifically, L Focal is defined as follows.
For a dataset containing N classes, let y i n be a binary indicator, which equals 1 if the n t h point is of class i and 0 otherwise. Similarly, p i n represents the predicted probability that the n t h point belongs to class i. The Focal Loss then incorporates a modulating factor ( 1 p i n ) γ into the traditional cross-entropy loss, aimed at reducing the loss contribution from easy to classify examples and thus focusing more on hard, misclassified points. The term γ (>0) effectively adjusts the rate at which easy examples are down-weighted. Additionally, an α -balancing parameter is introduced to counteract class imbalance further.
The form of the focal loss L Focal is given by
L Focal = n = 1 N i = 1 n s α i · y i n · ( 1 p i n ) γ · log ( p i n )
where α i is a weighting factor for class i, designed to inversely compensate for the frequency of the class across the dataset. In this implementation, α i is derived from the median frequency balancing method, where each class weight, w i , is calculated as the median of the class frequencies divided by the frequency of the respective class, i.e., w i = median ( r ) / r i , with r i being the ratio of points that belong to class i.
To address the widespread issue of class imbalance in our dataset, we have utilized a modified version of Focal Loss. In addition to addressing class imbalance, label smoothing is incorporated to enhance the model’s generalization capabilities by preventing overconfidence in its predictions. A smoothing factor, ε , is applied, transforming the traditional one-hot-encoded labels into a distribution that allocates a small proportion of the confidence to non-target classes. This modification aims to provide a more nuanced approach to classification that accommodates the ambiguity inherent in point cloud data. The incorporation of label smoothing introduces a small, constant value ε to each target class label. Traditionally, for a classification task with C classes, the target label for a class i is represented as a one-hot vector in which the i t h element is 1 and all other elements are 0. Label smoothing modifies this representation by reducing the target value for the correct class by ε and distributing an equal amount of ε among the other C 1 classes. Mathematically, for a given label y i in a one-hot-encoded vector, the smoothed label y ˜ i is calculated as
y ˜ i = ( 1 ε ) · y i + ε C 1 · ( 1 y i )
After introducing label smoothing, the focal-smoothed loss L F o c a l S m o o t h e d is defined as
L Focal Smoothed = n = 1 N i = 1 n s α i · y ˜ i n · ( 1 p ˜ i n ) γ · log ( p ˜ i n )
where y ˜ i n and p ˜ i n , respectively, represent the smoothed labels and predicted probabilities. This adjustment encourages the model to be less confident in its predictions, thereby reducing the risk of overfitting and enhancing its generalization performance, which is a common scenario in real-world datasets. This strategy is particularly beneficial in highway scenarios where we deal with a majority of background points and a significant number of foreground points generated through data augmentation methods.

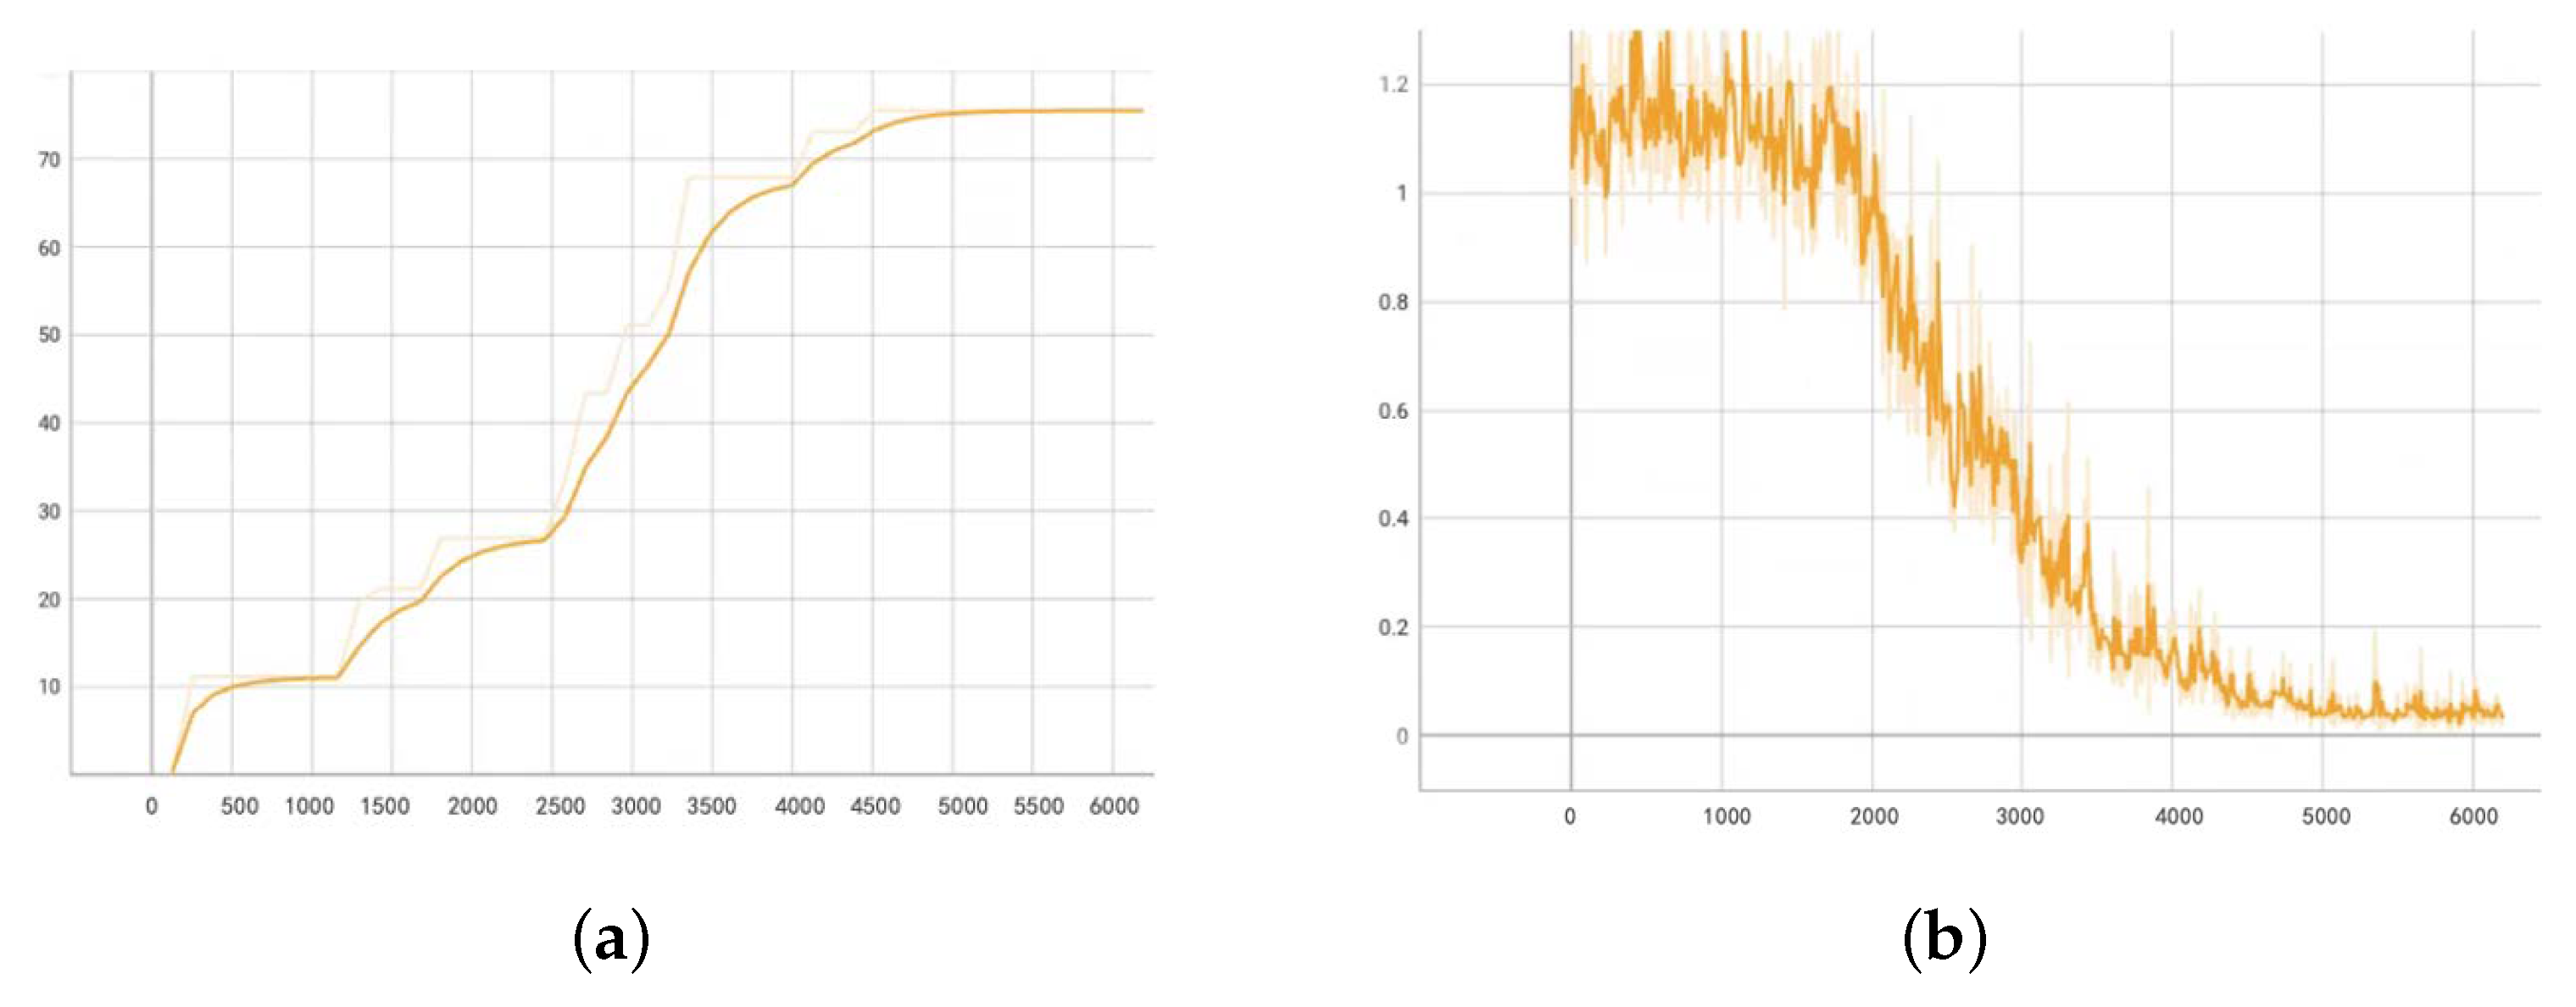
4.1.3. Training Process and Performance Improvement

We used the gradient backpropagation algorithm to optimize network parameters, one of the most common methods in deep learning. In each iteration, by calculating the gradient of the loss function relative to the network parameters, we could accurately understand how the parameters need to be adjusted to reduce the total loss. Gradient backpropagation allowed us to effectively update each parameter with the goal of minimizing Focal Loss. In terms of implementation details, to optimize the gradient backpropagation process, we adopted batch normalization and residual connections. Batch normalization helps accelerate the training of deep networks by reducing internal covariate shift and improving training stability. Residual connections allow gradients to flow directly to earlier layers, mitigating the problem of gradient vanishing in deep model training.
We also implemented an early stopping strategy to prevent overfitting. If there was no significant improvement in performance on the validation set over several training epochs, the training process will automatically stop. This not only saves computational resources but also ensures that the model does not overfit the training data before achieving sufficient generalization capability. During training, we also paid special attention to adjusting the learning rate. We used a learning rate decay strategy, adopting step decay, which gradually reduces the learning rate at different stages of training. This helps the model converge quickly in the early stages and adjust parameters meticulously in later stages, thus more accurately approaching the global optimum. To further enhance training efficiency and model performance, we chose the Adam optimizer [44]. Adam is an adaptive learning rate optimization algorithm that combines the advantages of AdaGrad [45] and RMSProp optimizers, automatically adjusting different learning rates for different parameters. This method not only speeds up convergence during the training process but also improves the performance of the model at the end of training.
Throughout the training process, we closely monitored training loss and performance on the validation set to ensure that the model not only performs well on the training set but also possesses good generalization ability. By continuously adjusting and optimizing the above training strategies, we were able to significantly improve the semantic segmentation performance of MinkUNet on complex point cloud data. At the end of the model, we used a classifier composed of linear layers to map the extracted features to predefined categories. Additionally, the model incorporated point transform modules that further enhanced the representational power of features through a series of linear layers and activation functions. During the training process, we applied dropout techniques to reduce overfitting and improve the generalization capability of the model. The model’s weights were initialized using standard methods to ensure stability and convergence speed during training.
In the experiments, MinkUNet demonstrated its effective processing capabilities for point cloud data, providing a solid foundation for subsequent data augmentation and model optimization. Figure 5 shows a training curve visualization for the segmentation performance and objective functions. The following experiments showcase how we further enhanced the semantic segmentation performance of MinkUNet on highway point cloud data through specific data augmentation strategies.
To further improve the model’s learning focus and generalization under complex highway scenes, we introduced a semi-supervised strategy by setting the background category as an ignore class during loss computation (i.e., using ignore_index = −1). This ensures that background points do not contribute to gradient backpropagation, allowing the model to concentrate on distinguishing critical foreground categories such as pole-like assets. While not explicitly supervised, background points still provide contextual cues and support learning the overall spatial distribution. This design enhances the semi-supervised learning characteristics of the model, mitigating foreground–background imbalance and boosting segmentation robustness in real-world occlusion scenarios.

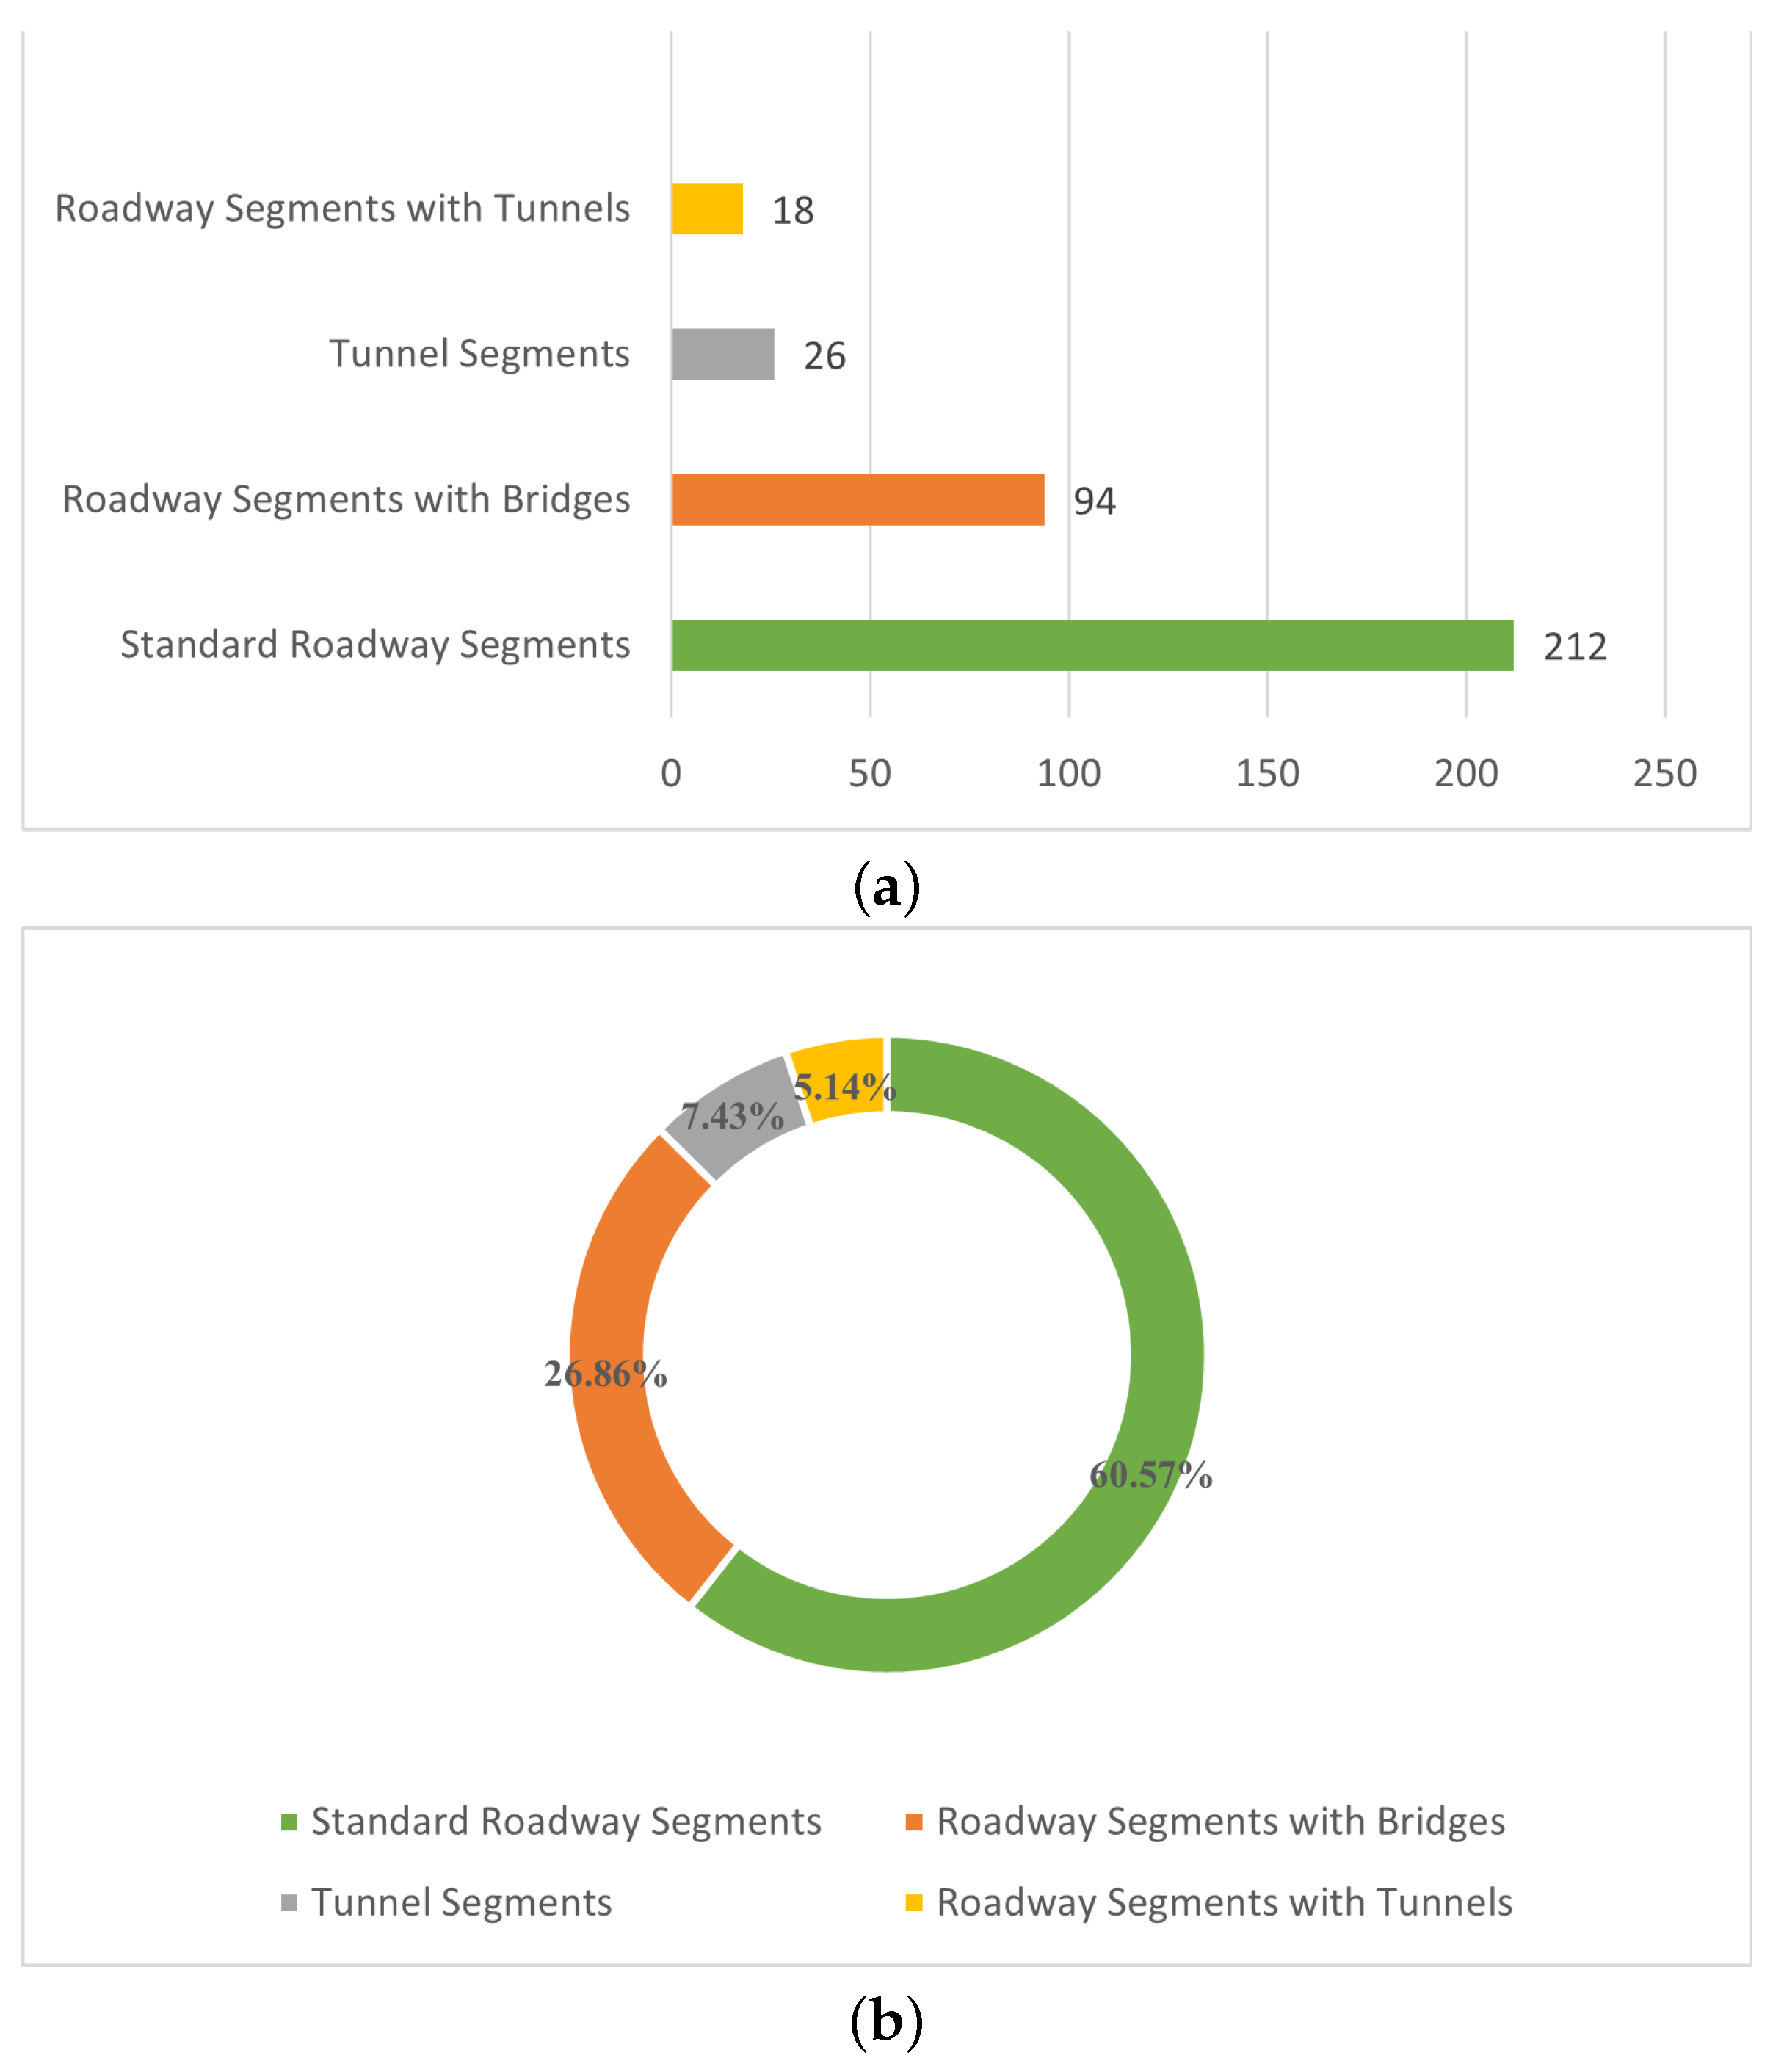
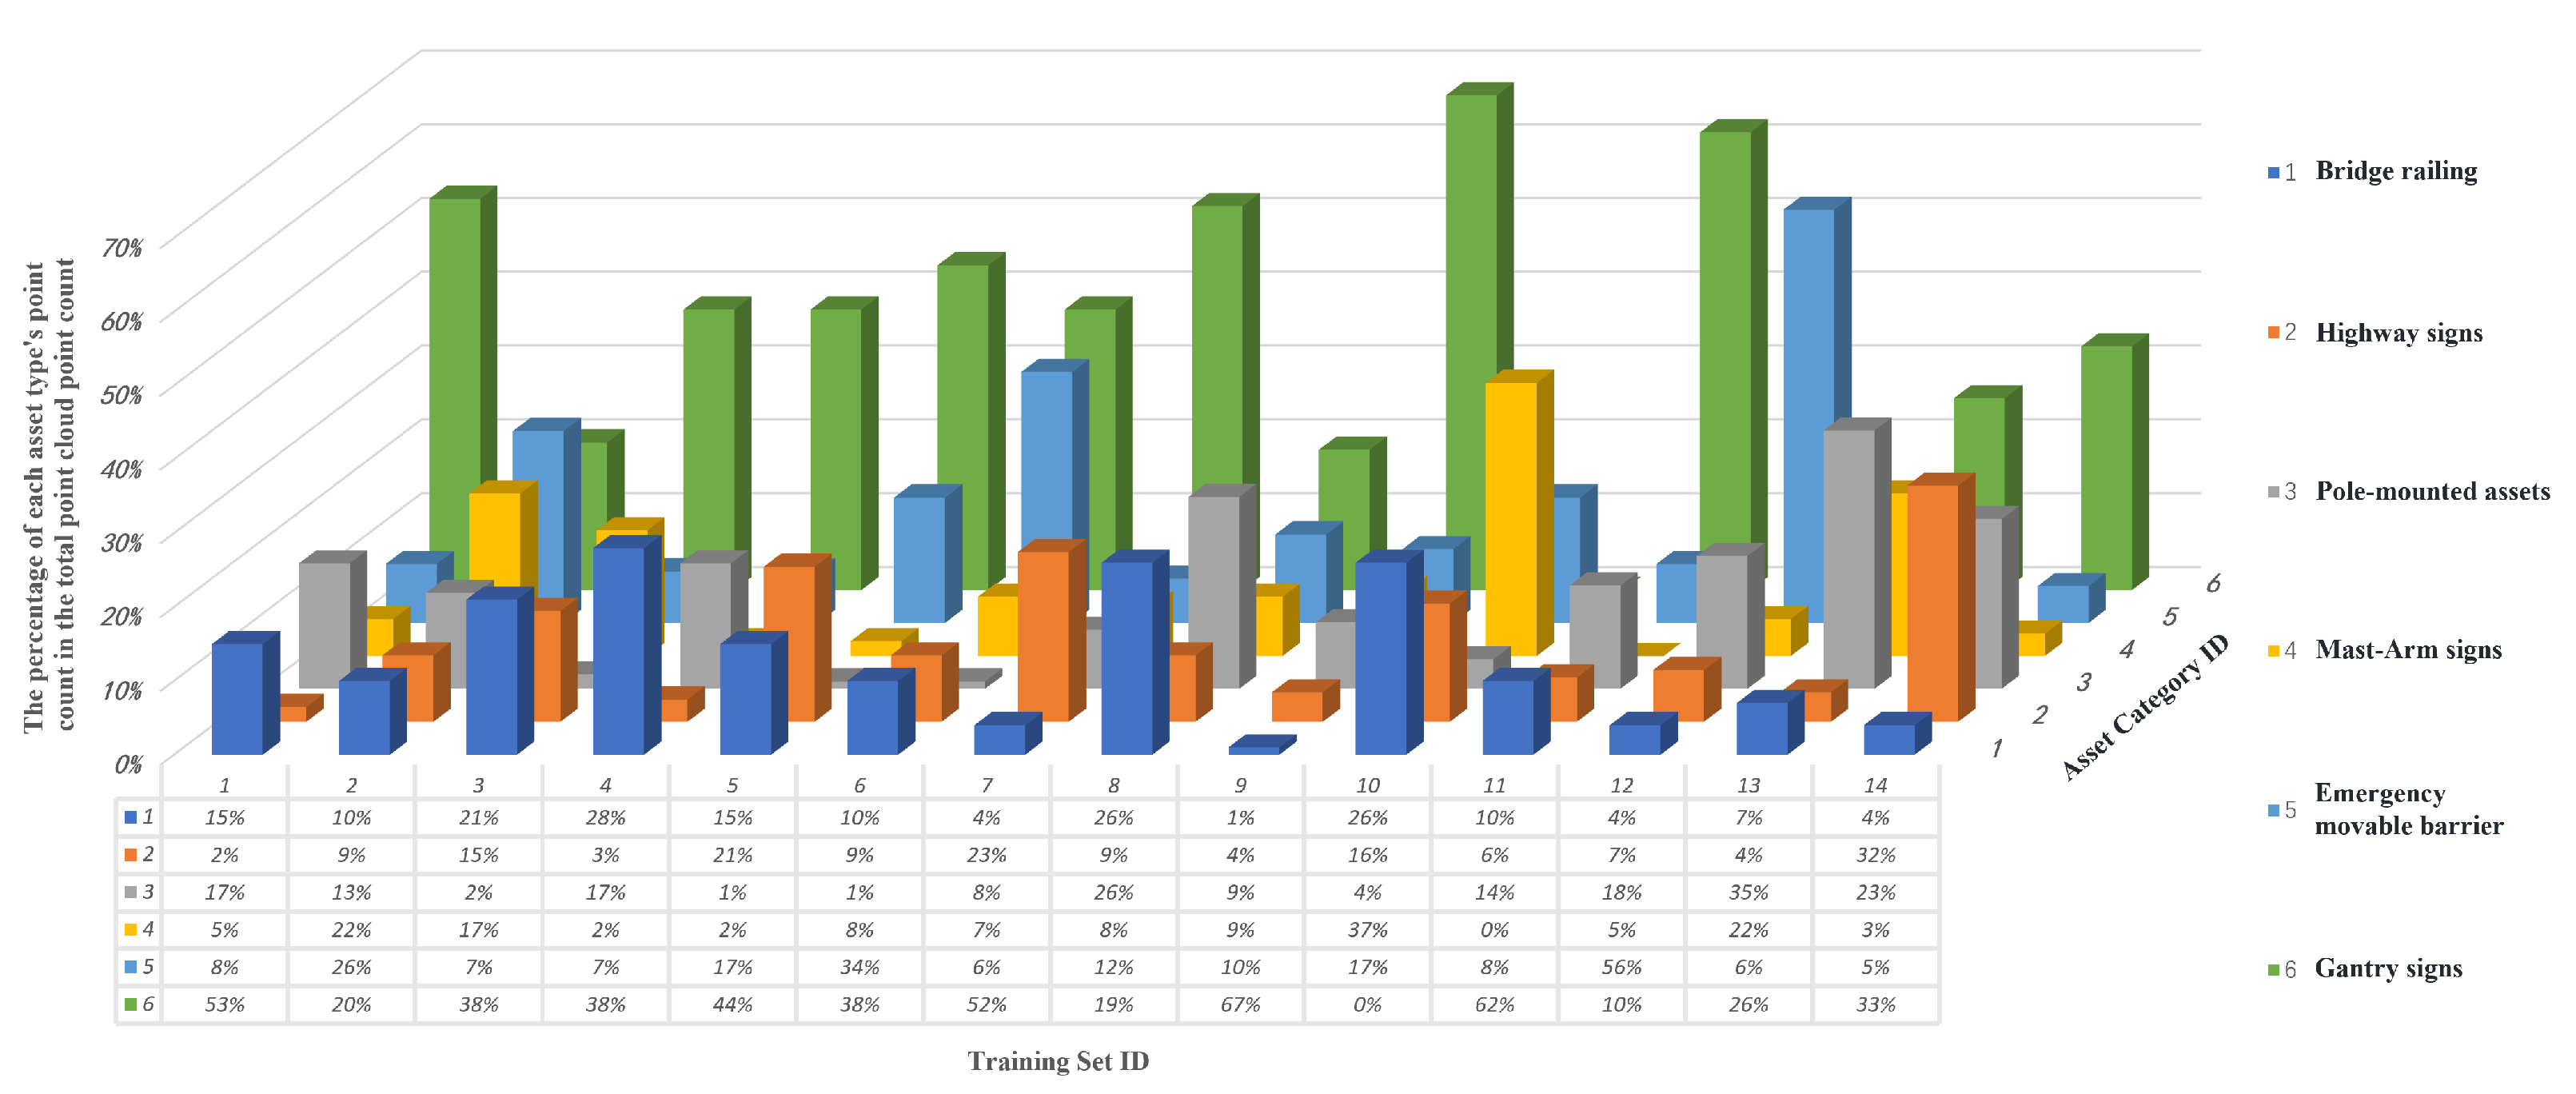
4.2. Data Statistics

To achieve better segmentation, the 124 km of highway point cloud data was divided into 350 sections and categorized according to road surface types:
  • Standard roadway segments: This category includes the most common parts of the highway, primarily composed of straight and curved road sections, without any special structures like bridges or tunnels. These segments are mainly used for vehicles to travel straight or navigate through curves.
  • Roadway segments with bridges: This category encompasses those highway segments that include bridge structures. Bridges are used to cross natural obstacles such as rivers and valleys, or man-made barriers like other roads. These segments combine the characteristics of standard road surfaces with those of bridge structures.
  • Tunnel segments: This category specifically refers to highway segments composed entirely of tunnels. Tunnels are used to pass through mountains or other difficult-to-avoid obstacles and represent a special and technically demanding part of highways.
  • Roadway segments with tunnels: This classification includes those segments that have tunnel structures on the basis of standard road surfaces. These segments combine the features of standard roadways and tunnels and may include standard road surfaces in the sections entering or exiting the tunnels.
Each category reflects different structural characteristics and engineering technical requirements on highways. This classification helps in more detailed consideration during the planning, maintenance, and management of highways. Figure 6a provides a detailed display of the specific quantity of each type of road surface, and Figure 6b shows the proportion of each road surface type in the total data. Figure 7 shows the distribution of asset points in each segment of the training set, with the X-axis representing ’Training Set ID’, the Y-axis representing ’Asset Category ID’, and the Z-axis indicating ’The percentage of each asset type’s point count in the total point cloud count’. The classification of road surfaces shows that standard roadways and bridges occupy the vast majority of the highway, hence our study also focuses on this part.

4.3. Mixing for Augmentation

In our approach to semantic segmentation of point cloud data, a meticulous data augmentation pipeline is critical for training a robust model. Our augmentation techniques are designed to reflect real-world variations and to enhance the model’s focus on the vicinity of roadways, which is of particular interest in our study. Herein, we detail the specific augmentation techniques employed.

4.3.1. Initial Background Filtering

We commence our data preprocessing by filtering out non-roadside background points using color information. Points with colors indicative of the road and its immediate environment are retained, while others are discarded. This step ensures that our dataset predominantly consists of data relevant to our target areas, thereby facilitating more efficient learning by reducing the noise from irrelevant background points.

4.3.2. Data Segmentation Along Roadways

Subsequently, the data is segmented along the road direction, creating slices that are aligned with the road’s orientation. This segmentation is not arbitrary; it is informed by the typical trajectory and field of view of the sensors used in collecting the dataset. By focusing on road-adjacent slices, we ensure that the model’s attention is directed towards areas of interest, such as road boundaries and nearby objects, which are critical for autonomous navigation and other related applications.

4.3.3. Routine Augmentation and Cleaning

To imbue the model with rotational and scaling invariance, each point cloud slice undergoes a random rotation between 0 and 360 degrees and is scaled by a random factor between 0.95 and 1.05. These transformations are crucial for ensuring that the model learns to recognize objects regardless of their orientation and relative size in the point cloud. The augmentation pipeline is implemented with careful consideration of the data’s characteristics. For instance, intensity values are thresholded at the 5th percentile to filter out extremely low intensity noise. Color normalization is conducted by scaling RGB values to the [0, 1] range, ensuring consistency across the dataset. Sparse quantization is applied to reduce redundancy, keeping only the unique points that contribute to the dataset’s diversity. By integrating these detailed augmentation techniques, our model is exposed to a wide range of scenarios and learns to generalize across different conditions. The augmentation pipeline not only enhances the model’s performance on the primary task but also ensures robustness against variations that are commonly encountered in real-world operations.

4.3.4. Mixing Strategy Details

The mixing strategy [46] is an intricate part of our augmentation process. For slices containing foreground objects, a probabilistic approach is adopted, where a foreground slice may be selected with a 50% chance to be mixed with another randomly chosen foreground slice, provided they are not identical. This is to introduce variety and simulate the potential overlap of objects in different scenes. For slices devoid of foreground objects, we downsample them to simulate scenarios with sparse point clouds and then enrich them with points from two randomly selected foreground-containing slices. This not only balances the dataset with regard to the foreground–background ratio but also creates synthetic scenes from which the model can learn from a diverse set of object configurations.
In the processing of point cloud data, pole-like assets such as street lamps and traffic sign poles are often subject to occlusion issues due to the presence of surrounding trees. These trees can be located not only on the sides of the roads but also on the medians, posing challenges to data acquisition and processing. Directly inputting such occluded data into the network impedes the model’s ability to learn the distinctive features of pole-like assets. Therefore, we have devised a specific method to simulate this natural occlusion and to specially treat the affected areas. Our approach involves the use of conical masks to simulate the occlusion of pole-like assets by trees. The procedure is as follows:
  • Construction of conical masks: We randomly select the top or nearby upper points of pole-like roadside assets (e.g., surveillance poles, streetlights) as the apex of the conical mask. The axis of the cone is primarily oriented vertically upward, but can be adaptively adjusted according to the growth direction of typical occluders such as trees. To align with the scale characteristics of roadside poles on highways, the semi-apex angle ( θ ) is generally set between 5 and 10 , simulating the natural spread of occlusion. The cone length (L) is typically controlled between 1 and 5 m, covering the typical occlusion distance around such pole-like structures.
  • Point cloud manipulation: Within the conical masks, we downsample points representing the foreground (i.e., the pole-like assets) to simulate the partial occlusion effect of leaves and branches. Meanwhile, we maintain the background points to preserve the integrity of the scene.
  • Intensity and color adjustment: For points within the conical masks, we adjust their intensity and color information to reflect the changes in lighting and color that occur due to occlusion in natural environments.
  • Data merging and network training: The processed point cloud data, post-occlusion simulation, is merged back and then fed into the network for training. This treatment not only enhances the model’s capability to recognize pole-like assets in complex environments but also improves the model’s adaptability and robustness to occlusion scenarios.
By implementing this specially designed occlusion and perturbation handling process, our model is better equipped to learn and understand the characteristics of pole-like assets under natural occlusion conditions, thereby increasing accuracy and reliability in practical applications.

5. Experiment

5.1. Setups

To address the issues of sparsity and the scarcity of asset targets in highway road point cloud data, MinkUNet was selected as the baseline network. By comprehensively utilizing the point cloud’s three-dimensional spatial information, reflectance intensity, and color information, and gradually optimizing data augmentation strategies in response to the complexity and diversity of highway scenes, we significantly improve the recognition and classification capabilities of highway assets while maintaining high accuracy.
We conducted experiments using the designed multi-source data fusion model. The hardware and software configurations are shown in Table 2.

5.1.1. Dataset

Prior to training, segments entirely consisting of tunnel points were eliminated from over 350 sections of data. Subsequently, 17 segments were randomly selected from the remaining data as the training set. From the rest of the segments, three containing a complete set of asset categories were chosen and divided into validation and test sets in a 1:2 ratio. The training set was duplicated twice; in the first duplicate, each large segment was divided into 5 smaller segments, and in the second duplicate, each large segment was divided into 10 smaller segments, while in the original training set, each large segment was divided into 20 smaller segments. With this setup, the training, validation, and test sets were fully constructed.

5.1.2. Evaluation Metrics

In our comprehensive study, we quantitatively evaluate the performance of deep learning models in segmenting road assets in highway scenarios. To accurately measure the effectiveness of our approach, we implement a rigorous metric known as the IoU (intersection over union) [47], which is a standard criterion for semantic segmentation tasks.
The formula for calculating the IoU in point cloud segmentation is defined as follows:
I o U = T P T P + F P + F N
where
  • T P (true positive) represents the number of points correctly classified to the category.
  • F P (false positive) represents the number of points incorrectly classified to the category, but actually belonging to other categories.
  • F N (false negative) represents the number of points that should have been classified to the category but were not correctly classified.
The mIoU (mean intersection over union) metric is insightful as it considers both the precision and recall of model predictions, offering a balanced assessment of segmentation accuracy across different object categories. This metric is integrated into our training process as a callback function, allowing for real-time monitoring and recording of IoU scores during training.
Our custom mIoU callback function, instantiated based on the number of classes present in the dataset, aims to exclude ignore labels for some category evaluations, as well as identifiers for output and target tensors. Designed to run seamlessly within a distributed training framework, this callback ensures that IoU calculations can be aggregated across multiple processes to produce a global performance metric. At the start of each training epoch, the callback function initializes counters for the total number of true point clouds, correctly predicted point clouds, and positively predicted point clouds for each category. After each training step, the callback updates these counters based on predictions and targets, excluding point clouds with ignore labels. At the end of each epoch, IoU for each category is calculated by dividing the number of correctly predict points by the union of predicted and actual points. The individual IoU scores are then combined to calculate the mIoU, which is the average of all category IoU scores. The results of the mIoU calculations are recorded for further analysis, and the final mIoU score is reported as a percentage, providing a clear and easily interpretable metric to compare model performance. Our experiments demonstrate that our model significantly enhances the identification and classification capabilities for highway assets while maintaining high accuracy, through the comprehensive utilization of point cloud three-dimensional spatial information, reflectivity, and color information. The mIoU score on the test set exceeds the baseline, confirming the robustness and generalizability of our segmentation framework.

5.2. Implementation Details

5.2.1. Semi-Supervised Learning Strategy

In semi-supervised learning, unlabeled data is utilized to help the model better understand the overall structure or distribution of the data. Traditional semi-supervised learning focuses on using a small amount of labeled data alongside a large volume of unlabeled data to train models. In our experiment, background classes are treated as “ignore” categories. Their contribution to the model is primarily indirect, helping the model to focus more on learning the limited, significant category features. During the model training process, these background points are not subject to explicit evaluation metrics or predictions.
This approach allows the model training to concentrate more on distinguishing between various foreground categories, as background points do not impact performance evaluation. This can aid the model in better learning the features of foreground categories in the presence of a large amount of background data. Although the background itself is not a target category, background points can help the model understand the data distribution and feature learning more comprehensively. The model also needs to learn to distinguish between foreground and background, and data augmentation strategies are differentiated for data containing foreground points and data containing only background points. Understanding the overall data distribution helps the model make more accurate judgments when processing foreground categories, enhancing the model’s discrimination ability.
This benefits not only the model’s training but also its evaluation. This is because background categories constitute the majority of the data, and including them in the evaluation could lead to results bias towards the recognition performance of the background, overlooking the accurate differentiation of foreground categories. Excluding background points from the calculation allows for a more accurate assessment of the model’s performance in distinguishing different foreground categories, more accurately reflecting the model’s ability to recognize key targets.

5.2.2. Experimental Progression and Analysis

During the data preprocessing stage, we establish a set of standard enhancement methods. Background points distant from the road, such as power towers, power lines, vegetation, etc., often appear purple and exhibit lower reflectivity. Thus, we employed a color filter to discard points with RGB values of (255,0,255) and normalized RGB values to the [0, 1] range to ensure dataset consistency. An intensity filter removed the bottom 10% of points based on reflectivity, mitigating interference from background points far from the road. However, since background points near the road are more prevalent and have a greater impact on target assets, we performed voxelization on the point cloud data to minimize redundancy. The voxel grid size was set to 5 cm, meaning that one sample point was selected every 5 cubic centimeters, ensuring that the number of points per sample did not exceed 1,500,000. Additionally, the point cloud underwent rotation and scaling to enhance data diversity and complexity, endowing the model with rotational and scaling invariance. Specifically, each point cloud slice experienced a random rotation between 0 and 360 degrees and was scaled by a random factor ranging from 0.95 to 1.05. These transformations are crucial for ensuring that the model can recognize objects regardless of their orientation and relative size within the point cloud.
We conducted training and testing on datasets segmented into quintiles, deciles, and vigintiles, and observed that features learned on the decile-segmented dataset were more detailed, with higher accuracy metrics. Hence, we continued our training efforts on this dataset.
However, conventional data augmentation yielded unsatisfactory segmentation results, with an mIoU of 40.8% and an IoU of only 2.6% for pole-like assets. Therefore, we needed to improve our data augmentation strategies, particularly for pole-like assets. In the previous data processing phase, we filtered out background noise around roads and sliced the data. In cases where slices were reasonably large, each slice represented a unit data segment along the road’s direction. At this point, data slices were divided into two collections: those containing target points and those containing only background categories. We applied different augmentation methods to these two types of slices. For each slice containing target points, there was a 50% chance it would be mixed with another random slice from the same collection to create a new, augmented slice, further increasing data complexity. For each background-only slice, we downsampled it before mixing it with two randomly chosen target-containing slices from the other collection, simulating combinations of different scenes, thus creating a new, enhanced training set. Experiments with this new augmented dataset showed significant improvements in segmentation accuracy, with mIoU reaching 73.8%, a 33% increase. Bridge railings, emergency movable barriers, and gantry signs achieved over 95% accuracy.
Although the overall segmentation accuracy was satisfactory, the accuracy for pole-like assets remained suboptimal, increasing by only 16% to 18.6%. Therefore, we needed to design specific augmentation methods for pole-like assets. Considering that the poor performance of pole-like assets was largely due to occlusions, as trees surrounding these assets on median strips and road-sides significantly impacted their data integrity and subsequent identification and segmentation. We devised a conical occlusion augmentation scheme to simulate occlusion scenarios. By randomly selecting some poles and creating conical occlusion zones around them, and adjusting the reflectivity within these zones, we aimed to enhance the data and improve the model’s ability to recognize and segment pole-like assets that are only partially visible due to tree or vehicle occlusions.
Specifically, we first precisely identify and selected poles with specific labels to focus our augmentation efforts. This step is crucial as it ensures the accuracy and efficiency of subsequent enhancements, focusing on improving the model’s recognition capabilities for specific object types. To maintain the diversity and realism of the augmentation process, we calculate the Euclidean distances between these poles and filter out those suitable for occlusion augmentation based on a predefined minimum distance criterion. This step aims to mimic the natural distribution of objects in the real world, preventing repetitive or excessive enhancement effects in overly dense areas, which is crucial for preventing model overfitting. For each selected pole, we simulate real-world line-of-sight occlusions caused by conical trees by constructing a conical occlusion mask based on specific radius and height parameters. Each conical mask is created starting from the apex, randomly selecting a series of apex points for each segment of data containing pole-like assets. To simulate realistic occlusion effects and ensure even distribution of occlusions across all pole-like assets without excessive feature loss, we set minimum distances between apex points. After determining an apex, the next apex could only be a pole-like asset beyond this threshold distance.
For each selected apex, we calculate the perpendicular distances from all points to this apex, considering only those points below it. A circular base is then defined at a position directly below the apex, at a distance equal to the apex height minus the mask height, and all points within a given occlusion radius from the pole’s base point are considered to be within the occlusion zone, forming a circular plane area. All points below the apex and above (including within) this circular plane are considered within the occlusion zone. By calculating the distances of other points to the apex and considering points with horizontal distances less than the mask radius and heights lower than the apex-circular base plane height as occluded, we expand this into a conical occlusion mask. Within the simulated occlusion areas, we implemented a downsampling strategy, selectively retaining a portion of the points to mimic the visual information loss and reduction in target object point cloud density caused by occlusions under real observation conditions.
Moreover, by adjusting the intensity of these retained points, we enhance the occlusion effect. After incorporating this data augmentation strategy and conducting tests, we observed a significant improvement in the segmentation accuracy of pole-like assets, confirming the effectiveness of this method.

5.3. Experimental Results

5.3.1. Overview of Results

In the present research, we conduct in-depth semantic segmentation experiments on the point cloud data of the Beijing– Kunming Expressway. By introducing innovative data augmentation techniques and an improved segmentation model, the experimental results demonstrate that our model can accurately segment multiple types of objects such as guardrails in large-scale highway scenes, showcasing its robust scene-understanding capabilities. Figure 8 presents a global perspective of the qualitative experimental results, with the extracted road asset point clouds superimposed on the original mobile laser scanning (MLS) point clouds. Figure 9 shows close-up views of selected highway assets. Overall, this method employs a unified framework and common parameter settings to process all types of detected highway assets and is applicable to all mentioned categories. Furthermore, this category list can be expanded without the concern of designing unique feature descriptors for each new category.

5.3.2. Detailed Analysis of Segmentation Performance

Upon further examination, we identified that data augmentation techniques were pivotal in improving model performance. In addition to standard augmentations such as point cloud rotation and scaling, we introduced novel strategies like background point partial filtering and segmentation along the road. These methods effectively address challenges associated with the scarcity of foreground points and class imbalances. The occlusion augmentation technique, in particular, closely mimics real-world visual occlusions, providing a rich and varied training environment that closely resembles actual conditions. This approach’s novelty lies in balancing the diversity and realism of data augmentation, thereby boosting the model’s robustness and generalization capabilities, and setting a precedent for efficient and precise segmentation in point cloud processing.
Implementing a mixed augmentation strategy and conical occlusion enhancement for pole-like assets led to a significant increase in segmentation accuracy for pole categories, as shown in Table 3, jumping from 2.6% with the baseline MinkUNet network to 29.4%. This made it possible to distinctly identify pole-like roadside assets from trees. Testing the model with only the mask augmentation strategy, without mixed data enhancement, still resulted in a 3.2% improvement over the baseline. This highlights the efficacy of the mask data augmentation in enhancing occlusion, mitigating information loss for real-world pole-like assets, and thereby improving their recognition and segmentation.
Moreover, the mixed data augmentation strategy corrected the severe imbalance between foreground and background points and diversified the highway scene dataset. This significantly improved the model’s overall segmentation accuracy and generalization. The synergistic application of these strategies further amplified their effectiveness. Together, these methods markedly advanced the model’s learning capabilities.
Table 4 showcases our model’s superior performance in classifying various categories within highway scenes, notably achieving impressive IoU scores of 95.6% for bridge railings and 98.7% for emergency movable barriers. These results notably outperform the traditional MinkUNet model. A key factor contributing to this significant improvement is our model’s comprehensive utilization of the point cloud data attributes. During the input phase, it integrates the point cloud’s coordinates, intensity, and color data into the network, enhancing the extraction of depth features and the processing of spatial information.

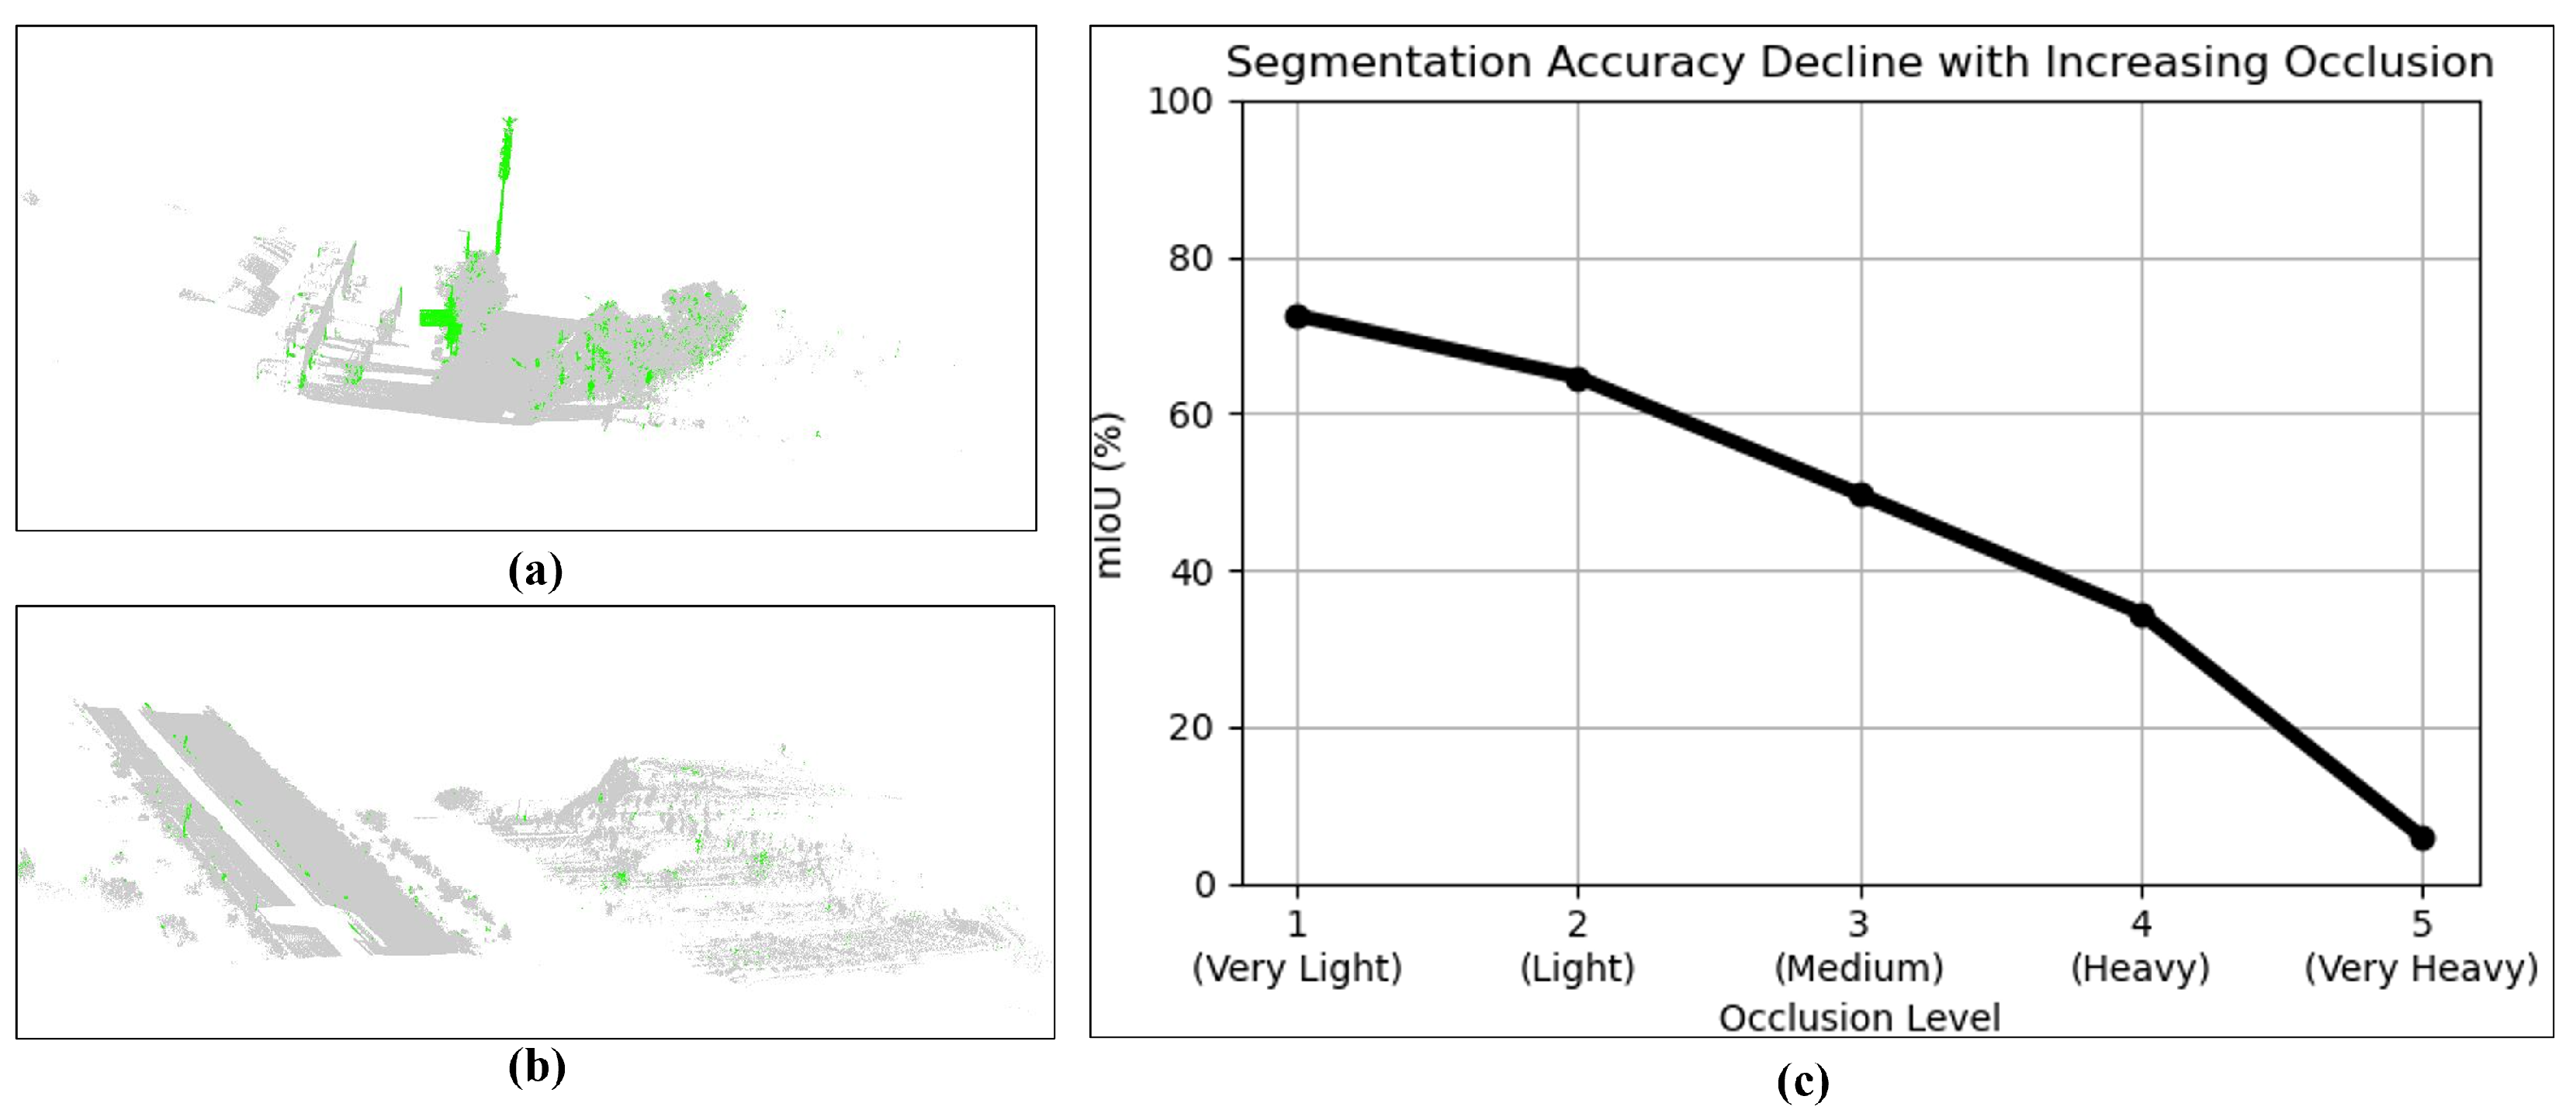
5.3.3. Error Analysis

Despite the noticeable performance enhancement across almost all categories compared to the MinkUNet baseline model, showing higher accuracy and robustness, our model still has shortcomings. Although specific data augmentation methods for pole-like assets resulted in significant improvements over the baseline model, their accuracy remains suboptimal. Detailed analysis revealed that this is due to the unique environment of highways. The pole-like assets we defined, including highway surveillance camera gantries and highway median separator warning lights, are often surrounded by vegetation of varying heights, and some even overlap with vegetation. Consequently, part of the asset information was lost during data collection, posing challenges for subsequent identification and segmentation. Although we designed conical masks to simulate real-world tree obstructions for pole-like assets, we did not tailor the orientation and radius parameters for individual masks of pole-like assets.
Below, we enumerate some common misclassifications and omissions of pole-like assets. As shown in Figure 10a,c (left), the point cloud density of portions attached to poles is smaller due to scanning angles and obstructions, leading to these segments being overlooked during segmentation, with only parts of them being recognized. As demonstrated in Figure 10b,c (right), a pole-like object, structurally similar to the target pole-like assets but not belonging to road assets, was mistakenly classified as a pole-like asset. Figure 10d illustrates that pole-like assets in highway medians are often surrounded by low vegetation, which, due to its height and shape similarities to pole-like assets, is erroneously identified by the model as a pole-like asset.
In order to verify the impact of different vegetation occlusions on the experimental results, we selected 10 highway sections with dense pole-shaped assets, manually quantified the degree of occlusion of each target, and divided it into five levels (from very light to very heavy) according to the occlusion ratio. We calculated the average segmentation mIoU of pole-shaped assets at each level and plotted the occlusion–performance degradation curve. The results are shown on the right-hand side of Figure 11.
Figure 11 shows the performance degradation under increasing occlusion levels. Subfigures (a) and (b) present two example segments with different occlusion intensities. Green points represent correctly segmented pole-mounted assets. It is evident that severe vegetation coverage leads to point loss and reduced detection accuracy. The curve in (c) shows a clear declining trend in segmentation performance (mIoU) as occlusion becomes heavier, confirming the sensitivity of the model to occlusion-related density loss and geometric ambiguity.

6. Conclusions

In this study, we propose a highway road asset extraction method based on an improved MinkUNet architecture, effectively addressing the challenges of data scarcity, class imbalance, and complex occlusions in highway scenarios. We first construct a large-scale point cloud dataset tailored for highway infrastructure, named the PEA-PC Dataset. Then, we design a highway-aware hybrid conical masking data augmentation strategy, which introduces spatially aware local occlusion simulation and target-enhancement mechanisms. This strategy effectively alleviates the problems of sparse foreground points and unbalanced class distributions, while enhancing the network’s ability to understand deep semantic information and spatial structures. The experimental results demonstrate that our proposed model achieves the best segmentation accuracy across several key asset categories as well as in overall performance, thereby confirming the superiority of the proposed approach. Despite the excellent segmentation performance on multiple asset types, the model still faces challenges in identifying pole-like assets. This is primarily due to frequent occlusions caused by vegetation, vehicles, and other objects, which lead to a loss of local features and blurred geometric shapes, ultimately affecting the model’s decision-making capabilities.
Future work will explore more realistic occlusion modeling, domain adaptation techniques, and diversified sensor fusion strategies to enhance the robustness of the proposed approach. Further research may focus on improving the model’s adaptability to complex scenes by adjusting occlusion augmentation parameters—such as occlusion height and radius—according to the characteristics of different datasets and tasks.

Author Contributions

Conceptualization, D.Z. and Y.Y. (Yuanyang Yi); methodology, D.Z. and Y.Y. (Yuanyang Yi); validation, D.Z., Y.Y. (Yuanyang Yi) and Y.W.; formal analysis, D.Z.; investigation, Y.Y. (Yuanyang Yi); resources, Y.Y. (Yuanyang Yi); data curation, Y.W. and Y.Y. (Yuanyang Yi); writing—original draft preparation, Y.Y. (Yuanyang Yi); writing—review and editing, D.Z.; visualization, X.Z.; supervision, Y.H. and Y.Y. (Yuyan Yan); project administration, Z.S. and J.G.; funding acquisition, Z.S. All authors have read and agreed to the published version of the manuscript.

Funding

This work is supported by the Shanxi Provincial Science and Technology Major Special Project (202201150401020), the Key R&D Project of China Metallurgical Group Corporation (2342G25S29) and the Fundamental Research Program of Shanxi Province (202203021222427).

Data Availability Statement

The data that support the findings of this study are available from the corresponding author, upon reasonable request.

Conflicts of Interest

Yanjun Hao, Xiaojin Zhao and Junkai Guo were employed by the company Shanxi Transportation Research Institute Group Co., Ltd. The remaining authors declare that the research was conducted in the absence of any commercial or financial relationships that could be construed as a potential conflict of interest.

References

  1. Lian, R.; Wang, W.; Mustafa, N.; Huang, L. Road extraction methods in high-resolution remote sensing images: A comprehensive review. IEEE J. Sel. Top. Appl. Earth Obs. Remote Sens. 2020, 13, 5489–5507. [Google Scholar] [CrossRef]
  2. Suleymanoglu, B.; Soycan, M.; Toth, C. 3D road boundary extraction based on machine learning strategy using lidar and image-derived mms point clouds. Sensors 2024, 24, 503. [Google Scholar] [CrossRef] [PubMed]
  3. Wang, Y.; Shi, T.; Yun, P.; Tai, L.; Liu, M. Pointseg: Real-time semantic segmentation based on 3D lidar point cloud. arXiv 2018, arXiv:1807.06288. [Google Scholar]
  4. Liu, R.; Wu, J.; Lu, W.; Miao, Q.; Zhang, H.; Liu, X.; Lu, Z.; Li, L. A Review of Deep Learning-Based Methods for Road Extraction from High-Resolution Remote Sensing Images. Remote Sens. 2024, 16, 2056. [Google Scholar] [CrossRef]
  5. Wu, B.; Wan, A.; Yue, X.; Keutzer, K. Squeezeseg: Convolutional neural nets with recurrent crf for real-time road-object segmentation from 3D lidar point cloud. In Proceedings of the 2018 IEEE International Conference on Robotics and Automation (ICRA), Brisbane, Australia, 21–25 May 2018; pp. 1887–1893. [Google Scholar]
  6. Ren, X.; Yu, B.; Wang, Y. Semantic Segmentation Method for Road Intersection Point Clouds Based on Lightweight LiDAR. Appl. Sci. 2024, 14, 4816. [Google Scholar] [CrossRef]
  7. Qi, C.R.; Su, H.; Mo, K.; Guibas, L.J. Pointnet: Deep learning on point sets for 3D classification and segmentation. In Proceedings of the IEEE Conference on Computer Vision and Pattern Recognition, Honolulu, HI, USA, 21–26 July 2017; pp. 652–660. [Google Scholar]
  8. Qi, C.R.; Yi, L.; Su, H.; Guibas, L.J. Pointnet++: Deep hierarchical feature learning on point sets in a metric space. Adv. Neural Inf. Process. Syst. 2017, 30, 5105–5114. [Google Scholar]
  9. Hu, Q.; Yang, B.; Xie, L.; Rosa, S.; Guo, Y.; Wang, Z.; Trigoni, N.; Markham, A. Randla-net: Efficient semantic segmentation of large-scale point clouds. In Proceedings of the IEEE/CVF Conference on Computer Vision and Pattern Recognition, Seattle, WA, USA, 16–20 June 2020; pp. 11108–11117. [Google Scholar]
  10. Qiu, S.; Anwar, S.; Barnes, N. Semantic segmentation for real point cloud scenes via bilateral augmentation and adaptive fusion. In Proceedings of the IEEE/CVF Conference on Computer Vision and Pattern Recognition, Vancouver, BC, Canada, 19–24 June 2021; pp. 1757–1767. [Google Scholar]
  11. Fan, S.; Dong, Q.; Zhu, F.; Lv, Y.; Ye, P.; Wang, F.Y. SCF-Net: Learning spatial contextual features for large-scale point cloud segmentation. In Proceedings of the IEEE/CVF Conference on Computer Vision and Pattern Recognition, Vancouver, BC, Canada, 19–24 June 2021; pp. 14504–14513. [Google Scholar]
  12. Yu, X.; Tang, L.; Rao, Y.; Huang, T.; Zhou, J.; Lu, J. Point-bert: Pre-training 3D point cloud transformers with masked point modeling. In Proceedings of the IEEE/CVF Conference on Computer Vision and Pattern Recognition, New Orleans, LA, USA, 19–24 June 2022; pp. 19313–19322. [Google Scholar]
  13. Zhao, H.; Jiang, L.; Jia, J.; Torr, P.H.; Koltun, V. Point transformer. In Proceedings of the IEEE/CVF International Conference on Computer Vision, Montreal, QC, Canada, 10–17 October 2021; pp. 16259–16268. [Google Scholar]
  14. Chen, Z.; Liu, X.C. Roadway asset inspection sampling using high-dimensional clustering and locality-sensitivity hashing. Comput.-Aided Civ. Infrastruct. Eng. 2019, 34, 116–129. [Google Scholar] [CrossRef]
  15. Balado, J.; Martínez-Sánchez, J.; Arias, P.; Novo, A. Road environment semantic segmentation with deep learning from MLS point cloud data. Sensors 2019, 19, 3466. [Google Scholar] [CrossRef] [PubMed]
  16. Choy, C.; Gwak, J.; Savarese, S. 4D Spatio-Temporal ConvNets: Minkowski Convolutional Neural Networks. In Proceedings of the IEEE/CVF Conference on Computer Vision and Pattern Recognition, Long Beach, CA, USA, 16–20 June 2019; pp. 3075–3084. [Google Scholar]
  17. Liong, V.E.; Nguyen, T.N.T.; Widjaja, S.; Sharma, D.; Chong, Z.J. AMVNet: Assertion-based Multi-view Fusion Network for LiDAR Semantic Segmentation. arXiv 2020, arXiv:2012.04934. [Google Scholar]
  18. Tang, H.; Liu, Z.; Zhao, S.; Lin, Y.; Lin, J.; Wang, H.; Han, S. Searching Efficient 3D Architectures with Sparse Point-Voxel Convolution. In Proceedings of the European Conference on Computer Vision, Online, 25–29 October 2020. [Google Scholar]
  19. Yan, X.; Gao, J.; Li, J.; Zhang, R.; Li, Z.; Huang, R.; Cui, S. Sparse Single Sweep LiDAR Point Cloud Segmentation via Learning Contextual Shape Priors from Scene Completion. arXiv 2020, arXiv:2012.03762. [Google Scholar] [CrossRef]
  20. Zhu, X.; Zhou, H.; Wang, T.; Hong, F.; Ma, Y.; Li, W.; Li, H.; Lin, D. Cylindrical and asymmetrical 3D convolution networks for lidar segmentation. In Proceedings of the IEEE/CVF Conference on Computer Vision and Pattern Recognition, Vancouver, BC, Canada, 19–24 June 2021; pp. 9939–9948. [Google Scholar]
  21. Alonso, I.; Riazuelo, L.; Montesano, L.; Murillo, A.C. 3D-MiniNet: Learning a 2D Representation from Point Clouds for Fast and Efficient 3D LiDAR Semantic Segmentation. IEEE Robot. Autom. Lett. 2020, 5, 5432–5439. [Google Scholar] [CrossRef]
  22. Cortinhal, T.; Tzelepis, G.; Aksoy, E.E. SalsaNext: Fast, Uncertainty-Aware Semantic Segmentation of LiDAR Point Clouds. In Proceedings of the International Symposium on Visual Computing, Online, 14–16 December 2020; pp. 207–222. [Google Scholar]
  23. Milioto, A.; Vizzo, I.; Behley, J.; Stachniss, C. RangeNet++: Fast and Accurate LiDAR Semantic Segmentation. In Proceedings of the 2019 IEEE/RSJ International Conference on Intelligent Robots and Systems (IROS), Macau, China, 27–31 October 2019; pp. 4213–4220. [Google Scholar]
  24. Wu, B.; Zhou, X.; Zhao, S.; Yue, X.; Keutzer, K. SqueezeSegV2: Improved Model Structure and Unsupervised Domain Adaptation for Road-Object Segmentation from a LiDAR Point Cloud. In Proceedings of the 2019 International Conference on Robotics and Automation (ICRA), Montreal, QC, Canada, 20–24 May 2019; pp. 4376–4382. [Google Scholar]
  25. Xu, C.; Wu, B.; Wang, Z.; Zhan, W.; Vajda, P.; Keutzer, K.; Tomizuka, M. SqueezeSegV3: Spatially-Adaptive Convolution for Efficient Pointcloud Segmentation. In Proceedings of the European Conference on Computer Vision, Online, 25–29 October 2020; pp. 1–19. [Google Scholar]
  26. Xiao, A.; Yang, X.; Lu, S.; Guan, D.; Huang, J. FPS-Net: A convolutional fusion network for large-scale LiDAR point cloud segmentation. ISPRS J. Photogramm. Remote Sens. 2021, 176, 237–249. [Google Scholar] [CrossRef]
  27. Zhang, Y.; Zhou, Z.; David, P.; Yue, X.; Xi, Z.; Gong, B.; Foroosh, H. Polarnet: An improved grid representation for online lidar point clouds semantic segmentation. In Proceedings of the IEEE/CVF Conference on Computer Vision and Pattern Recognition, Seattle, WA, USA, 16–20 June 2020; pp. 9601–9610. [Google Scholar]
  28. Cheng, R.; Razani, R.; Taghavi, E.; Li, E.; Liu, B. 2-s3net: Attentive feature fusion with adaptive feature selection for sparse semantic segmentation network. In Proceedings of the IEEE/CVF Conference on Computer Vision and Pattern Recognition, Vancouver, BC, Canada, 19–24 June 2021; pp. 12547–12556. [Google Scholar]
  29. Kochanov, D.; Nejadasl, F.K.; Booij, O. KPRNet: Improving Projection-Based LiDAR Semantic Segmentation. arXiv 2020, arXiv:2007.12668. [Google Scholar]
  30. Thomas, H.; Qi, C.R.; Deschaud, J.E.; Marcotegui, B.; Goulette, F.; Guibas, L.J. KPConv: Flexible and Deformable Convolution for Point Clouds. In Proceedings of the IEEE/CVF International Conference on Computer Vision, Seoul, Republic of Korea, 27 October–2 November 2019; pp. 6411–6420. [Google Scholar]
  31. Liu, L.; Zhuang, Z.; Huang, S.; Xiao, X.; Xiang, T.; Chen, C.; Wang, J.; Tan, M. CPCM: Contextual PointCloud Modeling for Weakly Supervised PointCloud Semantic Segmentation. arXiv 2023, arXiv:2307.10316. [Google Scholar]
  32. Xu, X.; Lee, G.H. Weakly supervised semantic point cloud segmentation: Towards 10x fewer labels. In Proceedings of the IEEE/CVF Conference on Computer Vision and Pattern Recognition, Seattle, WA, USA, 16–20 June 2020; pp. 13706–13715. [Google Scholar]
  33. Wei, J.; Lin, G.; Yap, K.-H.; Liu, F.; Hung, T.-Y. Dense Supervision Propagation for Weakly Supervised Semantic Segmentation on 3D Point Clouds. arXiv 2021, arXiv:2107.11267. [Google Scholar] [CrossRef]
  34. Zhang, Y.; Qu, Y.; Xie, Y.; Li, Z.; Zheng, S.; Li, C. Perturbed self-distillation: Weakly supervised large-scale point cloud semantic segmentation. In Proceedings of the IEEE/CVF International Conference on Computer Vision, Montreal, QC, Canada, 10–17 October 2021; pp. 15520–15528. [Google Scholar]
  35. Hu, Q.; Yang, B.; Fang, G.; Guo, Y.; Leonardis, A.; Trigoni, N.; Markham, A. SQN: Weakly-supervised Semantic Segmentation of Large-scale 3D Point Clouds. In Proceedings of the Computer Vision—ECCV 2022: 17th European Conference, Tel Aviv, Israel, 23–27 October 2022; Proceedings, Part XXVII. Springer: Berlin/Heidelberg, Germany, 2022; pp. 600–619. [Google Scholar]
  36. Su, Y.; Xu, X.; Jia, K. Weakly Supervised 3D Point Cloud Segmentation via Multi-Prototype Learning. arXiv 2022, arXiv:2205.03137. [Google Scholar] [CrossRef]
  37. Yang, C.-H.; Wu, J.-J.; Chen, K.-S.; Chuang, Y.-Y.; Lin, Y.-Y. An MIL-Derived Transformer for Weakly Supervised Point Cloud Segmentation. In Proceedings of the IEEE/CVF Conference on Computer Vision and Pattern Recognition, New Orleans, LA, USA, 19–24 June 2022; pp. 11830–11839. [Google Scholar]
  38. Vaswani, A.; Shazeer, N.; Parmar, N.; Uszkoreit, J.; Jones, L.; Gomez, A.N.; Kaiser, L.; Polosukhin, I. Attention Is All You Need. In Proceedings of the Advances in Neural Information Processing Systems, Long Beach, CA, USA, 4–9 December 2017; Volume 30. [Google Scholar]
  39. Han, X.F.; Cheng, H.; Jiang, H.; He, D.; Xiao, G. Pcb-randnet: Rethinking random sampling for lidar semantic segmentation in autonomous driving scene. In Proceedings of the 2024 IEEE International Conference on Robotics and Automation (ICRA), Tokyo, Japan, 13–17 May 2024; pp. 4435–4441. [Google Scholar]
  40. Ronneberger, O.; Fischer, P.; Brox, T. U-Net: Convolutional Networks for Biomedical Image Segmentation. In Proceedings of the International Conference on Medical Image Computing and Computer-Assisted Intervention, Munich, Germany, 5–9 October 2015; pp. 234–241. [Google Scholar]
  41. Zeng, Z.; Xu, Y.; Xie, Z.; Tang, W.; Wan, J.; Wu, W. Large-scale point cloud semantic segmentation via local perception and global descriptor vector. Expert Syst. Appl. 2024, 246, 123269. [Google Scholar] [CrossRef]
  42. Gong, H.; Wang, H.; Wang, D. Multilateral Cascading Network for Semantic Segmentation of Large-Scale Outdoor Point Clouds. IEEE Geosci. Remote Sens. Lett. 2025, 22, 6501005. [Google Scholar] [CrossRef]
  43. Lin, T.Y.; Goyal, P.; Girshick, R.; He, K.; Dollár, P. Focal Loss for Dense Object Detection. In Proceedings of the IEEE International Conference on Computer Vision, Venice, Italy, 22–29 October 2017; pp. 2980–2988. [Google Scholar]
  44. Kingma, D.P.; Ba, J. Adam: A method for stochastic optimization. arXiv 2014, arXiv:1412.6980. [Google Scholar]
  45. Duchi, J.; Hazan, E.; Singer, Y. Adaptive subgradient methods for online learning and stochastic optimization. J. Mach. Learn. Res. 2011, 12, 2121–2159. [Google Scholar]
  46. Nekrasov, A.; Schult, J.; Litany, O.; Leibe, B.; Engelmann, F. Mix3d: Out-of-context data augmentation for 3D scenes. In Proceedings of the 2021 International Conference on 3D Vision (3DV), Online, 25–28 October 2021; pp. 116–125. [Google Scholar]
  47. Li, X.; Li, X.; Zhang, L.; Cheng, G.; Shi, J.; Lin, Z.; Tan, S.; Tong, Y. Improving semantic segmentation via decoupled body and edge supervision. In Proceedings of the Computer Vision—ECCV 2020: 16th European Conference, Glasgow, UK, 23–28 August 2020; Proceedings, Part XVII 16. Springer: Berlin/Heidelberg, Germany, 2020; pp. 435–452. [Google Scholar]
Figure 1. The appearance of the Jingkun expressway, Pingyang section.
Remotesensing 17 02147 g001
Figure 2. The full line map of Jingkun expressway, Pingyang section, and the point cloud map of a specific short segment. (a) shows an oblique view of the Pingyang section of the Jingkun Expressway. (b) highlights a segment with various roadside assets. (c) visualizes point cloud intensity with standard color rendering to depict road surfaces and objects. (d) shows the intensity in grayscale for better detail on textures and edges.
Remotesensing 17 02147 g002
Figure 3. A horizontal view of the complete highway point cloud.
Remotesensing 17 02147 g003
Figure 4. Structure of the point cloud processing backbone.
Remotesensing 17 02147 g004
Figure 5. Training curve visualization for segmentation performance and objective functions. (a) Training curves of the mIoU/max. (b) Training curves of the loss functions.
Remotesensing 17 02147 g005
Figure 6. Statistical overview of road surface categories in the dataset. (a) The specific quantities of four different types of road surfaces in the Shanxi expressway dataset. (b) The proportional representation of different types of road surfaces in the total data segments.
Remotesensing 17 02147 g006
Figure 7. The distribution of asset points in each segment of the training set.
Remotesensing 17 02147 g007
Figure 8. Qualitative experimental results presented from a global perspective.
Remotesensing 17 02147 g008
Figure 9. Detailed views of selected components of highway infrastructure. (a) Visualization results of bridge railing. (b) Visualization results of emergency movable barrier and median strip warning lights.
Remotesensing 17 02147 g009aRemotesensing 17 02147 g009b
Figure 10. Recognition and segmentation of pole-like assets and misclassification.The green points represent the identified pole-like assets in the figure. (a) Partial recognition of pole-like assets due to low point cloud density from scanning angles and obstructions. (b) Pole-like and pole-similar assets from a bird’s-eye view. (c) Partial recognition and segmentation of pole-like assets (left) and misclassification (right). (d) Vegetation around pole-like assets misclassified as pole-like assets.
Remotesensing 17 02147 g010
Figure 11. Visualization and quantitative analysis of segmentation performance for pole-mounted assets under different occlusion levels. (a,b) show two segments with different occlusion intensities, where green points represent correctly segmented pole-mounted assets. (c) shows a declining trend in segmentation performance (mIoU) as occlusion increases, highlighting the model’s sensitivity to occlusion-related issues.
Remotesensing 17 02147 g011
Table 1. Evaluation of different methods for pole-mounted assets.
Pole-Mounted Assets
MethodmIoU/%
PointNet++6.2
RandLA-Net13.2
SPVNSA25.6
LACV-Net22.9
MCNet15.8
MinKUNet29.4
Table 2. Experimental environment specifications.
ConfigurationNameDetails
Hardware environmentCPUw5-2465X
GPU2 × A6000
Graphics memory2 × 48 G
Software environmentOperating systemUbuntu 20.04
CUDA11.8
CUDNN8.9.04
Python3.8.18
PyTorch1.13.0
Table 3. Evaluation of different methods for pole-mounted assets.
Pole-Mounted Assets
MethodIoU (Intersection over Union)/%
MinkUNet2.6
Mask5.8
Mix18.6
Mask and Mix29.4
Table 4. IoU evaluation for different categories using various methods.
IoU (Intersection over Union)/%
MethodBridge RailingHighway SignPole-Mounted AssetMast-Arm SignEmergency Movable BarrierGantry SignmIoU/%
MinkUNet36.312.42.626.555.460.140.8
Ours96.857.329.474.597.798.473.8
Disclaimer/Publisher’s Note: The statements, opinions and data contained in all publications are solely those of the individual author(s) and contributor(s) and not of MDPI and/or the editor(s). MDPI and/or the editor(s) disclaim responsibility for any injury to people or property resulting from any ideas, methods, instructions or products referred to in the content.

