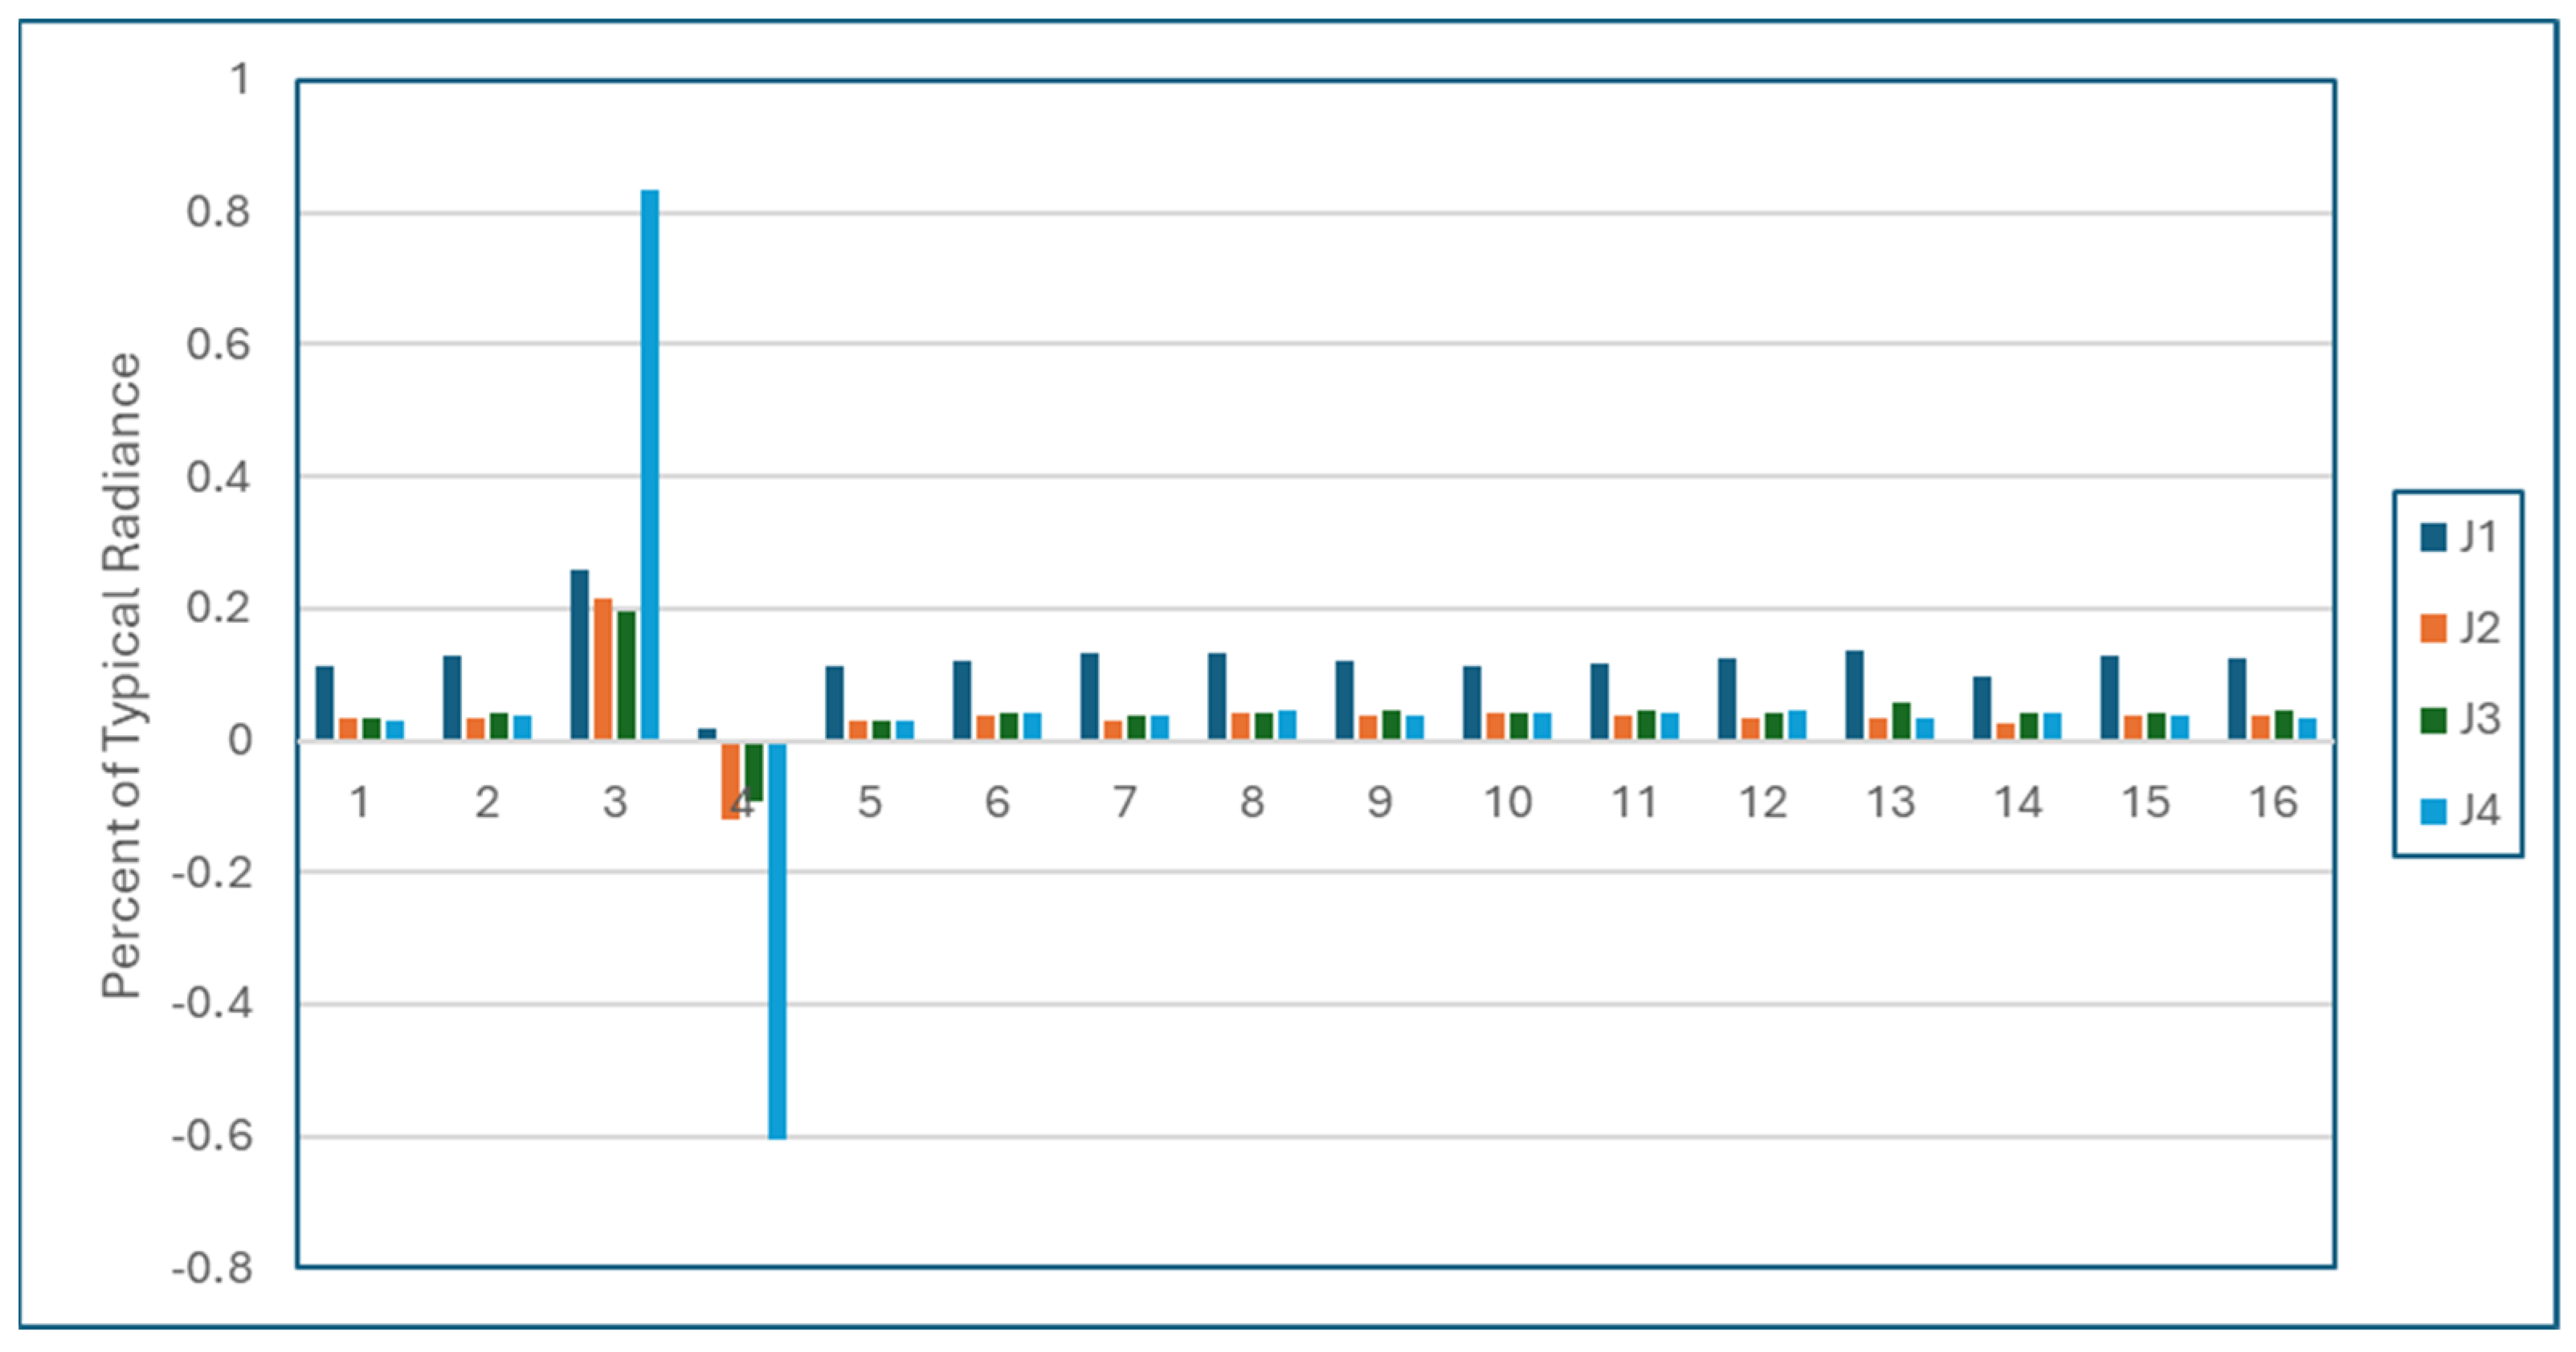
This section will review the pre-launch characterization and performance of the JPSS-4 VIIRS instrument.
3.1. RSB Calibration Performance
The RSB calibration is performed using a NIST-traceable 100 cm-diameter spherical integration source (SIS-100) and a high-radiance three-mirror collimator (TMC) SIS for the short wavelength low gain bands where the SIS-100 does not sufficiently cover the dynamic range. Also included as part of the test setup is a linear attenuator assembly (LAA), which consists of a metal sheet with evenly spaced holes designed to provide a transmission of approximately 56% [
13]. The screen is mounted on a linear drive to move it in and out of the optical path of the source. Since the RSB sources are not known to the accuracy necessary for a direct radiance versus
dn polynomial fit, the
and
, in pairs, are used to compute the shape of the calibration curve. Equation (1) presents the polynomial relationship of the VIIRS response to the SIS without the LAA in the optical path
in terms of calibration coefficients:
,
, and
:
Equation (2) similarly relates the VIIRS response to the SIS with LAA attenuation (
) to the same coefficients. This requires an additional term to account for the signal attenuation (
):
The SIS is cycled through a series of illumination levels in both fixed high gain and fixed low gain to ensure coverage across the entire dynamic range.
Figure 2 (left panel) shows an example of VIIRS response (
dn) versus the SIS-100 radiance (L) for the high-gain stage of band M2. Using the least squares fit, the calibration coefficients are estimated. The middle panel shows the fractional fit residuals, and the right panel depicts the measured SNR showing compliance against specification. The
and
for each SIS-100 source level are used in a least squares regression to determine the
, (
), and (
) values for each gain state, band, detector subframe, and HAM side. These calibration coefficients are then included as a part of the at-launch LUT that is used for on-orbit SDR generation. In most cases, the (
) term was very small and will likely be set to zero in the on-orbit calibration, as has been the case in the current VIIRS instruments. The term (
) was also seen to be extremely small (on the order of 10
−6), with no major detector dependence observed. One exception to this behavior is the larger (
) in the case of band I3, indicating some non-linearity at the lower end of the dynamic range. Such behavior was more widespread in all the SWIR bands on JPSS-1 VIIRS and was addressed on-orbit via a quartic calibration expression, an approach that could also be adopted for JPSS-4 VIIRS.
In addition to the radiometric gains, the SNR was also measured as a function of radiance using the SIS-100 data collected. A model was used to fit the measured SNR to estimate the value at a typical radiance, which is compared with the specification. Shown in
Table 2 are the band-averaged SNR values for all builds from the nominal plateau data collected, showing compliance by large margins. For ease of presenting the results, the JPSS 1–4 VIIRS are referred to as J1 to J4 in the result tables. The dynamic range of the RSBs is assessed by comparing the saturation radiance with the maximum radiance (also listed in
Table 1). The measured band average saturation radiances for all VIIRS builds are included in
Table 3. All bands on JPSS-4 saturate above L
max. In previous builds (SNPP through JPSS-2 VIIRS), bands I3 and M8 saturated early (below Lmax). Digital saturation was observed for bands M2-M7, M9-M11, and I1 (analog saturation was observed for bands M4-M7 and M9-M10 at a radiance above the digital saturation); analog saturation was also observed for bands M8, I2, and I3. Due to hardware improvements in J2 onwards, the rollover behavior for most bands is observed at larger radiance values compared to SNPP and J1. This is expected to decrease the number of pixels impacted by rollover in the SDRs on-orbit. In the case of the dual gain bands, the data collected during the radiometric testing was also used to assess whether the bands met the transitional radiance requirements.
During the temperature transition between the plateaus, the SIS-100 at a fixed illumination level is used to assess the stability of the calibration coefficients with varying temperatures. These measurements will supplement the calibration coefficients computed at each plateau while preparing the at-launch LUTs. Furthermore, the SIS-100 at a fixed illumination level was also used to assess temporal stability and stability with respect to varying bus voltages. A design requirement limits the variability of the gain between two successive calibrations to be less than 0.3%, where the two successive calibrations correspond to two SD views on orbit, separated by about 100 min. The variations for all RSB with respect to the temporal or bus voltage changes were very small, well within the 0.3% requirement. More details on the JPSS-4 VIIRS RSB can be found here [
14].
3.2. TEB Calibration Performance
The VIIRS TEB calibration is referenced to the blackbody calibration source (BCS), a NIST traceable source, with uncertainty less than 0.06 K at 10 µm and 300 K. Other blackbody sources included in the pre-launch testing were the high temperature blackbody and the three-mirror collimator (TMC) blackbody, placed outside of the TVAC chamber, with a maximum temperature of about 760 K, and required to calibrate the M13 low gain. The remaining two sources included the onboard blackbody, which provides calibration post-launch, and a cold BB source maintained at around ~90 K to simulate the deep space view required for background subtraction.
During the performance testing at the three temperature plateaus, the sources were cycled through a series of discrete temperature levels, whereas the source temperatures are fixed during the stability testing. Results from performance testing were used to assess various metrics such as NEdT, the absolute radiometric difference (ARD), the radiometric characterization uncertainty, and the radiometric response uniformity. In addition to the performance testing at the CFPA baseline temperature of 80 K, there were additional special and limited tests where the BB temperature was cycled for CFPA set points of 78 K and 82 K. Testing at additional CFPA temperatures leads to a more complete characterization of the VIIRS TEB and acts as a contingency for scenarios where an alternate CFPA set point is preferred. This proved useful for J2 VIIRS when the CFPA temperature on-orbit was changed from the baseline pre-launch temperature of 82 K to 80 K due to better-than-expected cryocooler performance. The CFPA set point chosen during preflight testing has varied over the different VIIRS builds, with 80 K in the case of SNPP, 80.5 K for J1, 82 K for J2 and J3, and 80 K for J4.
The TEB radiometric calibration assumes the radiance reaching a given detector is the sum of the source radiance and contributors along the optical path (i.e., the RTA, HAM, and aft optics). The path difference radiance between the two sources (BCS and SV) is calculated as:
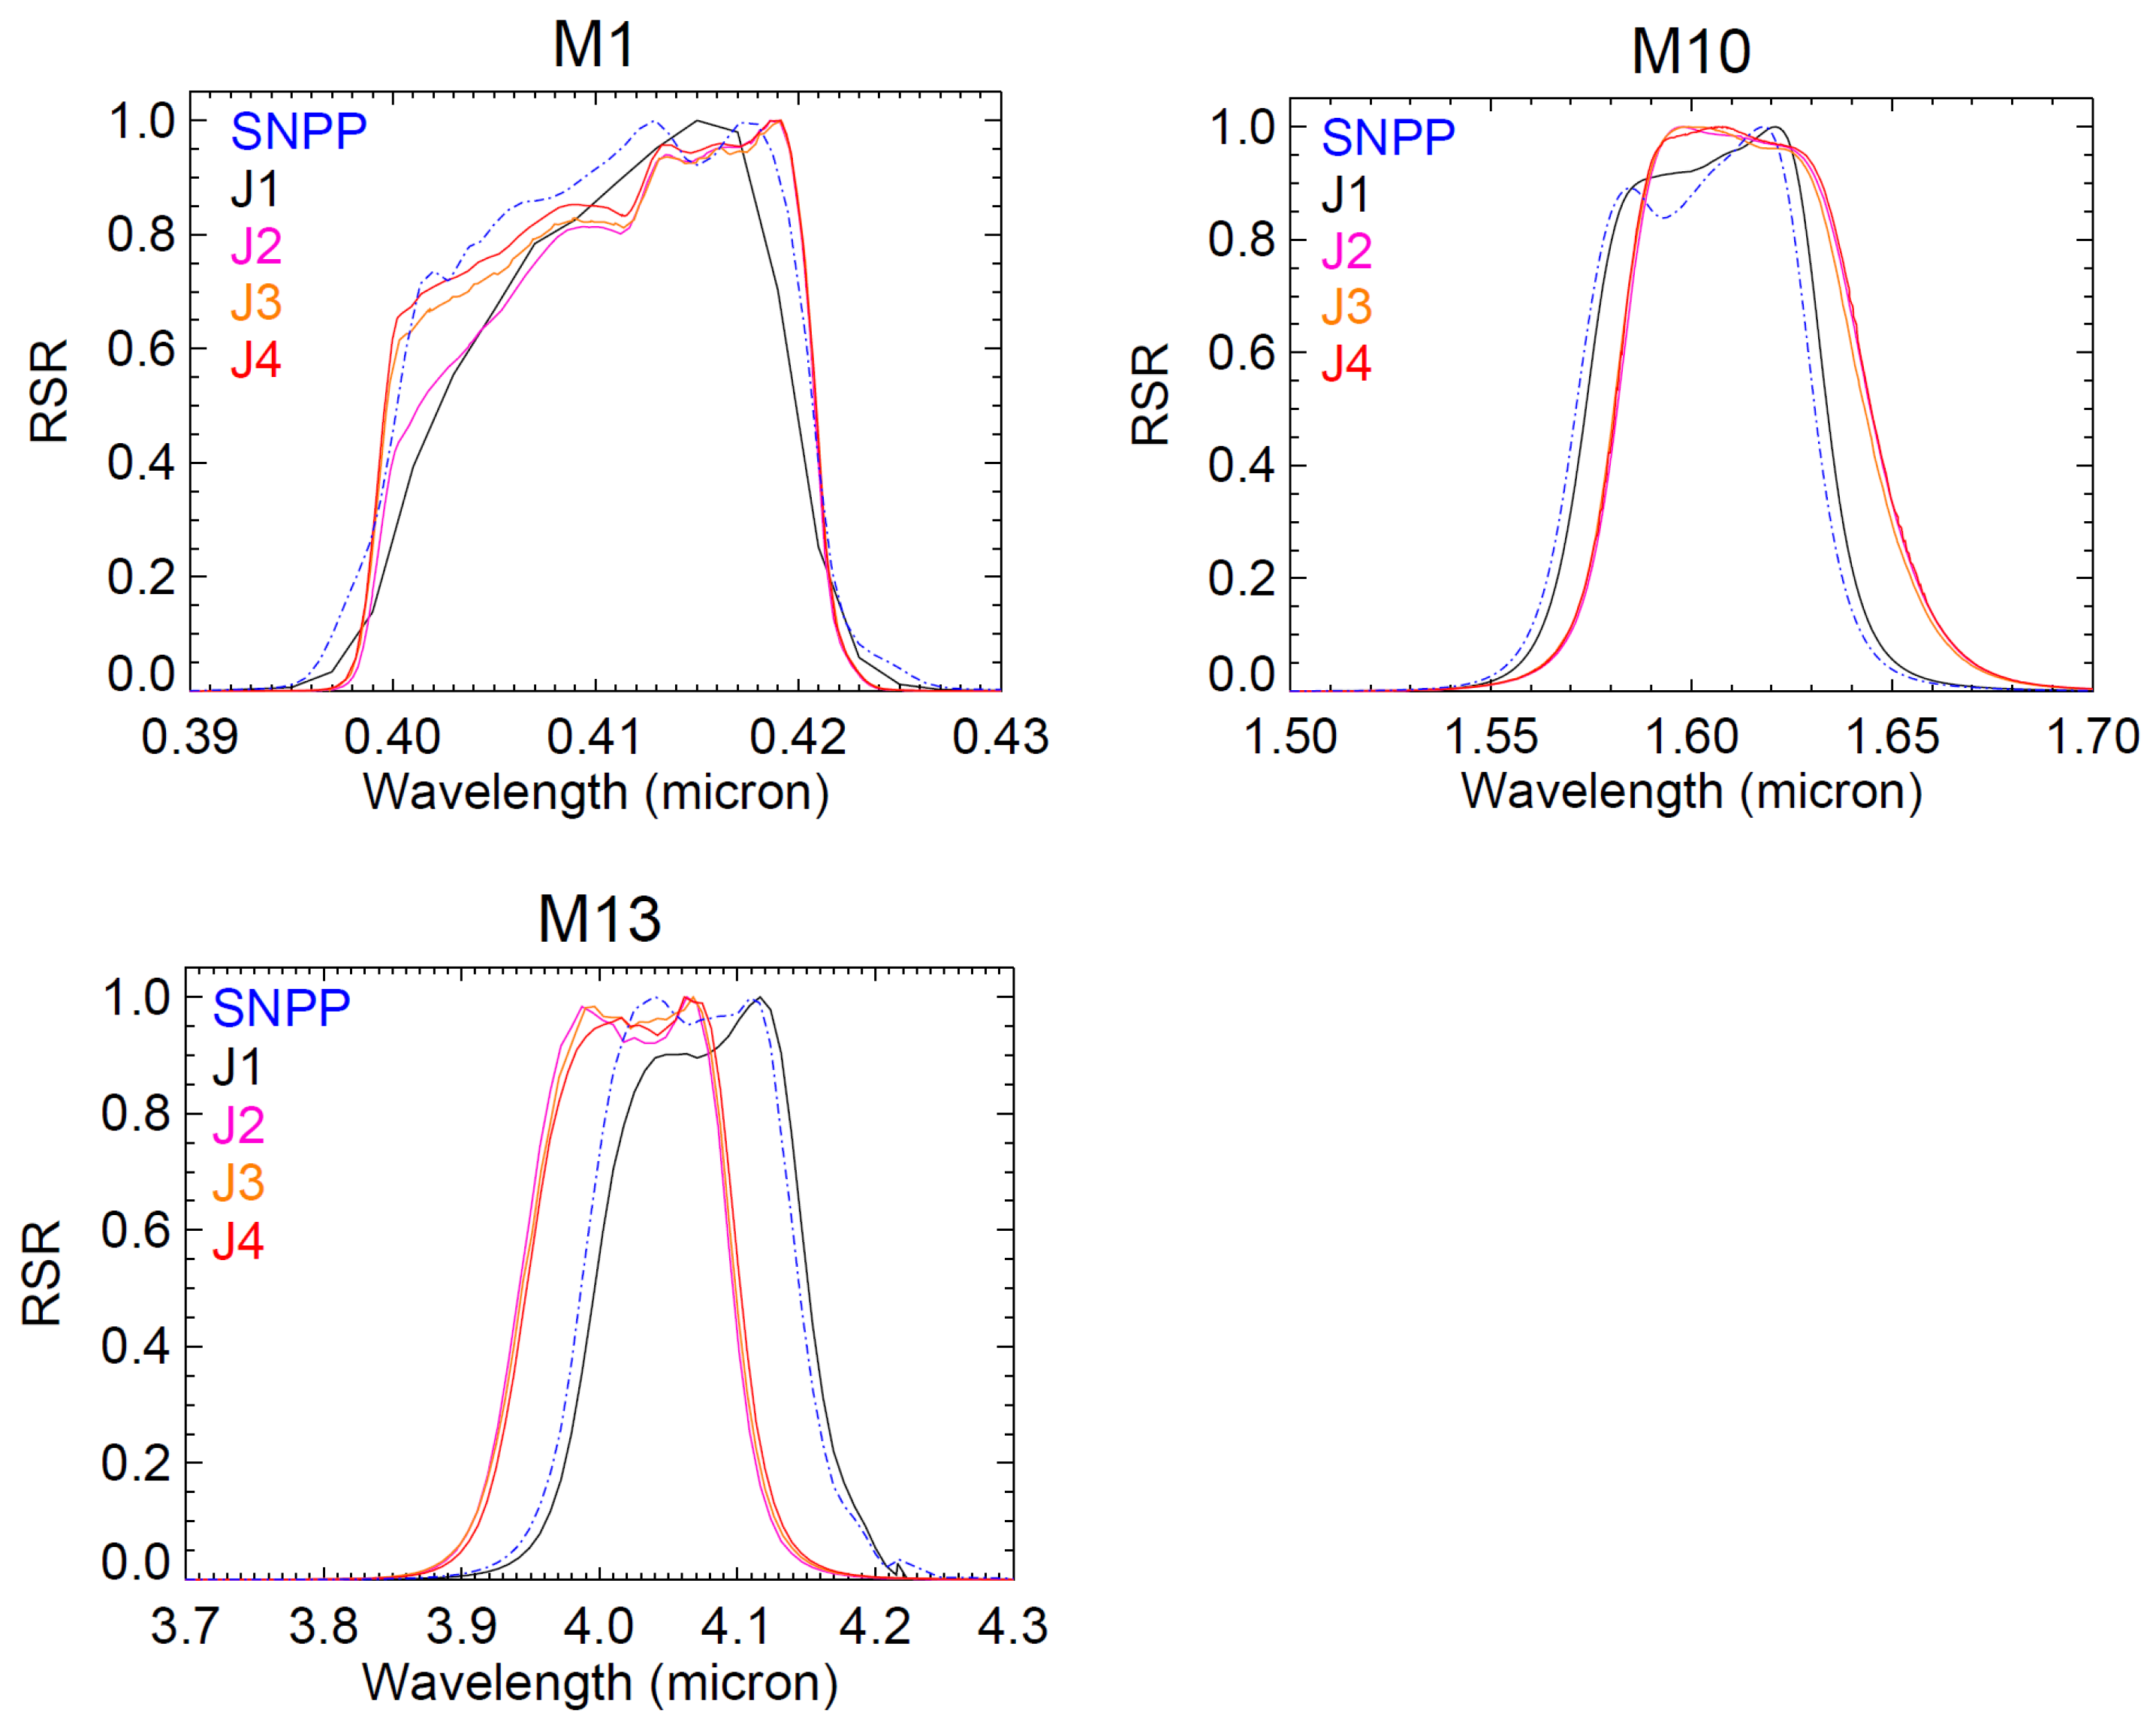
where RVS is the scan angle-dependent relative reflectance of the HAM, and the reflectance factors represent the total reflectance of the RTA mirrors. The temperature of each source is determined from one or more thermistors and the radiances for the sources are determined via Planck’s law, convolved over the J4 VIIRS RSR for each spectral band. The path difference radiance is modeled as a quadratic polynomial as follows:
where
represents the offset corrected digital response. Finally, the retrieved Earth view (EV) radiance for the BCS is determined by inverting Equation (3), expressed as:
TEB radiometric calibration coefficients were calculated for all detectors, HAM sides, electronic sides, temperature plateaus, and CFPA set points where testing was performed. NEdT is a metric to quantify the variation in the scene temperature equivalent to the system noise and was computed using the inverse of Planck’s law with respect to source temperature. SNR was modeled as a path difference source radiance divided by the square root of a quadratic polynomial.
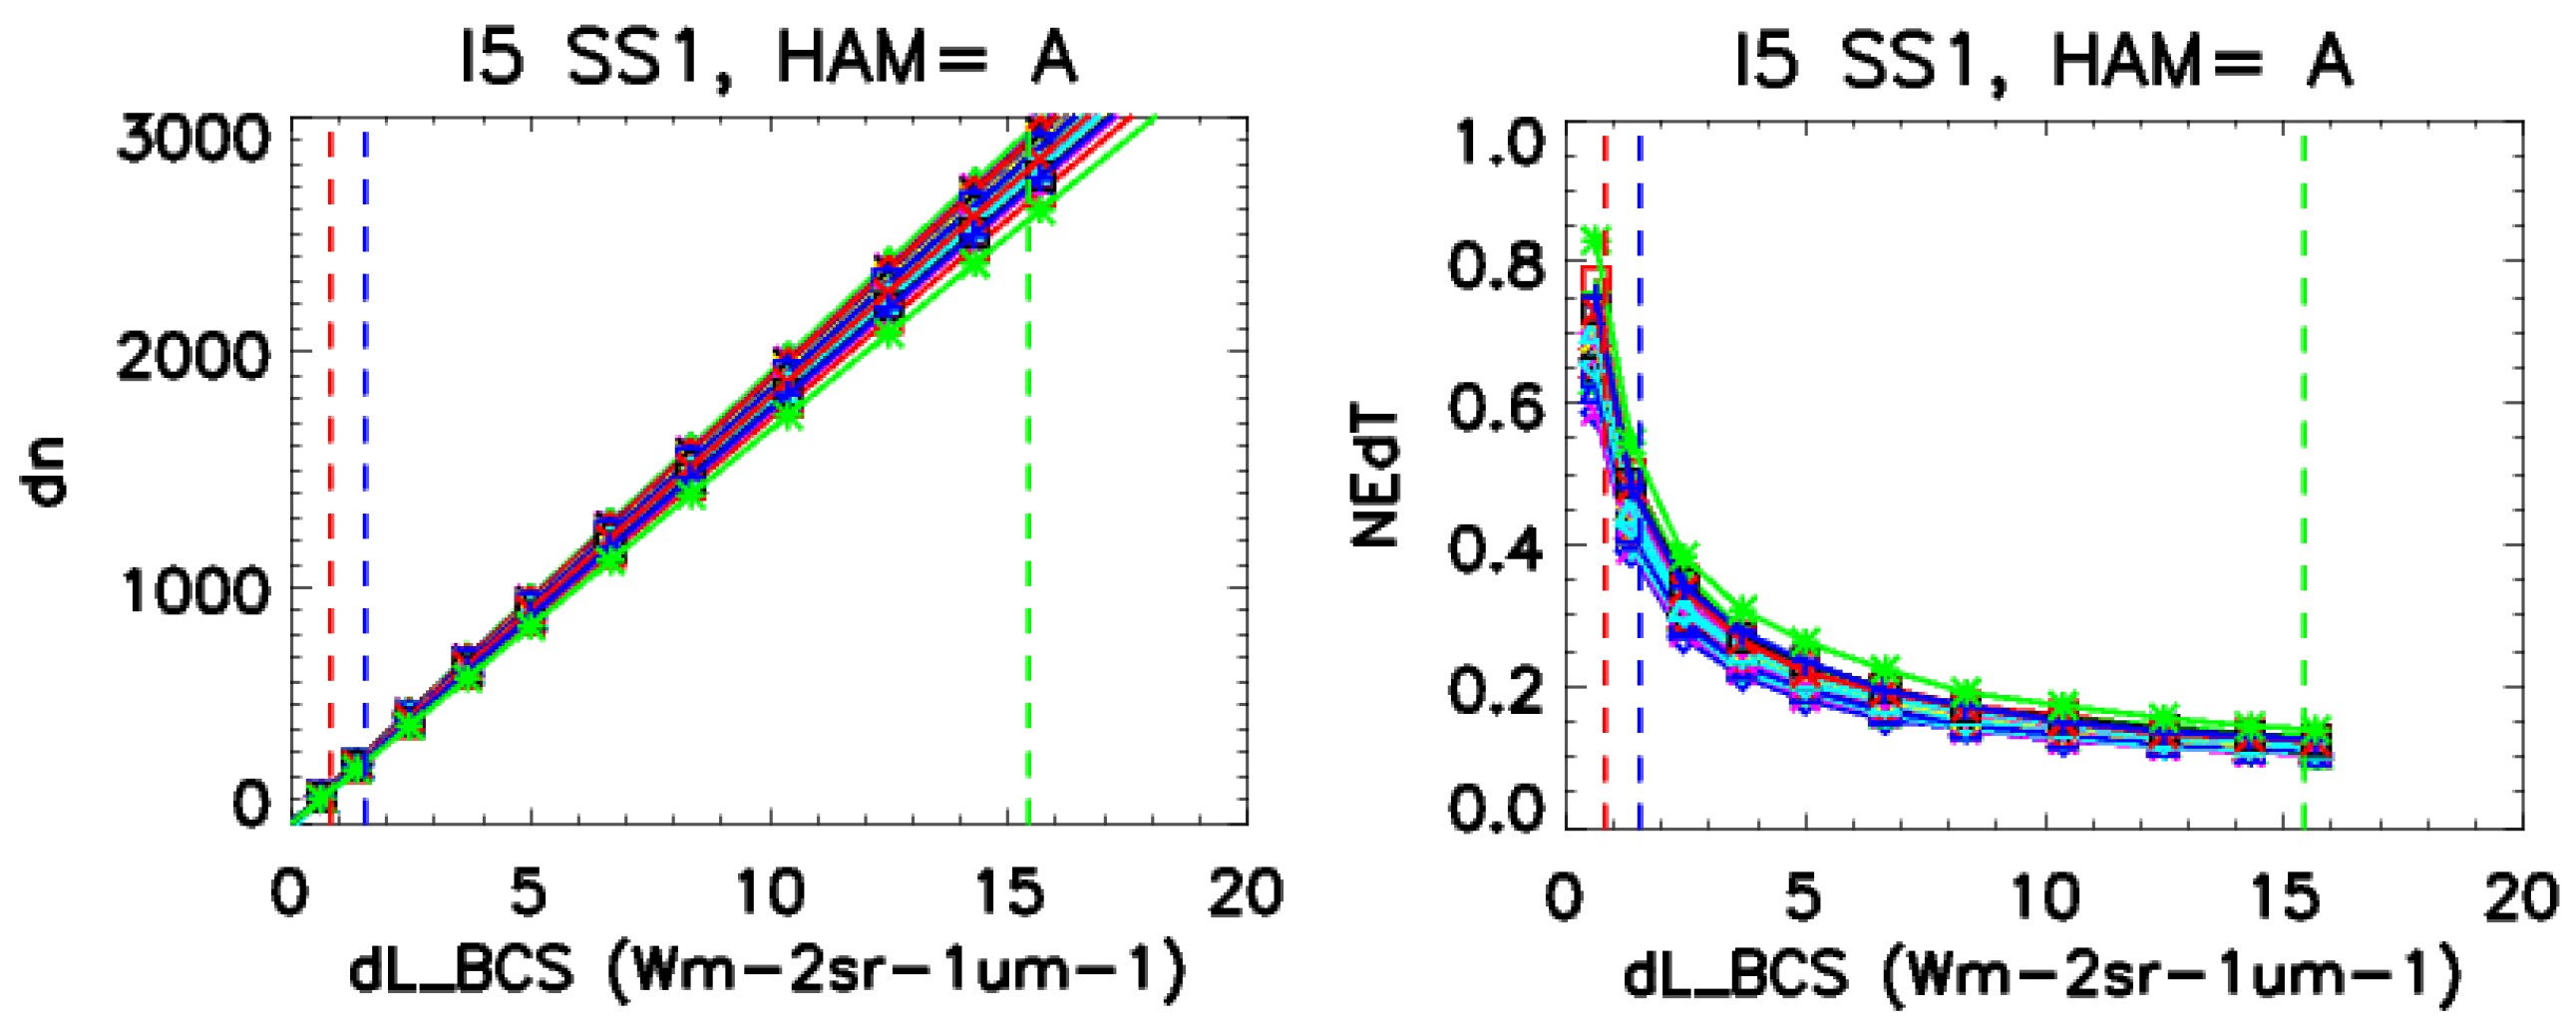
Figure 3 shows an example of the response and NEdT trends for the detectors of I5 HAM A, subsample (SS) one, electronic side A from the nominal plateau measurements. In general, the offset coefficients (
) are on the order of 10
−2 or less and show consistent behavior over instrument conditions and electronic sides. The LWIR offset term exhibited detector dependence but not TV plateau dependence, except M14, which showed some sensitivity to instrument temperature. The non-linear coefficients (
) were generally small, with values less than 10
−8. The band average gains (1/
) were computed for all TV test instrument configurations. The MWIR gains showed small changes (<2%) as a function of the CFPA set point, and the LWIR gains showed 5–10% increases as the temperature increased, a behavior that is consistent with previous VIIRS builds. The gain temperature sensitivities are used to create the on-orbit calibration coefficient LUTs that adjust for the different instrument temperatures. Separate LUTs are made for each CFPA temperature set point and electronics side configuration. The instrument stability was tested as a function of time (at each plateau), temperature (during the transitions between the plateaus), and with respect to bus voltages to simulate expected on-orbit variations. Together with the gain temperature sensitivities, the temperature dependence during the plateau transitions is also used in the generation of the on-orbit calibration coefficient LUTs.
As shown in
Figure 3, the NEdT increases as the scene temperature decreases. In the case of LWIR bands, the NEdT is below 0.5 K at even low scene temperatures, but for the MWIR bands, it increases between 3–6 K at 230 K, an expected behavior that was also observed in previous builds. The instrument requirement on the NEdT at the typical scene temperature along with the measured values for primary electronic side at the chosen CFPA set point are shown in
Table 4. There is only a slight increase in the NEdT at T
typ with the CFPA temperature for the LWIR bands, but it does show a slight increase with the instrument temperature for all bands on both electronic sides. Also listed in
Table 4 is the specification and the values from previous builds, which show compliance by a significant margin.
The dynamic range is defined, at the low end, by an SNR limit of 3, and on the high end, by the saturation, as shown in
Table 5. All bands saturate above the specified maximum temperature, with all bands except I4 and M12 saturating digitally first. These two bands exhibit analog saturation at higher radiance, a behavior common to all VIIRS builds, which leads to a rollover in the response, resulting in false lower radiance values showing up for some pixels. The small percentage of pixels affected by this behavior have been successfully flagged in the science products and can also be correlated with M13 to obtain any critical scientific information that might be compromised. Additional measurements were made for J3 and J4 to characterize the rollover region for use in fire detection algorithms.
The low gain of M13 was observed to digitally saturate only during the ambient testing in the case of J3 and J4 and, hence, is not included here. For the low end of the dynamic range, the SNR was observed to be over 100 for the bands M15, M16A, and M16B, and was between 10 and 50 for bands I5, M12, and M13, but reduced to below 3 (threshold) inside the specified dynamic range for I4 and M14. This is largely attributed to the larger noise in I4 (compared with M12) and the large difference in the RVS from space view to Earth view in the case of M14.
The ARD specification denotes the percentage difference between the calculated retrieved radiance and theoretical scene radiance based on source temperature measurements and is shown in
Table 6 for all VIIRS builds at the specified temperatures. The ARD are largely consistent over all temperature conditions (instrument and CFPA) as well as electronic sides. While the ARD for all LWIR bands is less than 0.2% above 210 K, the MWIR bands I4, M12, and M13 have an ARD up to 0.8% for scene temperatures above 270 K, indicating the fitting inaccuracy to the radiance retrieval for these bands.
Another metric used to diagnose possible detector-to-detector striping is the radiance response uniformity (RRU), which is measured by comparing the difference of the retrieved radiance per detector with the average of the measured NEdL, with a value of 1, indicating a potential for striping. As in previous builds, this metric was seen to increase with temperatures but met the design requirement that applies between L
min and 0.9 L
max for all bands except M12 at the highest scene temperature. Similar to the RSBs, the TEB calibration stability is also characterized at a fixed BCS temperature while varying the instrument conditions. The temporal and bus voltage variations were very small, with maximums of about 0.2%. For the instrument temperature, the variation with analog signal processor and OMM temperatures was measured to be about 0.4% for the LWIR bands and less than 0.2% for the MWIR bands. The gain and noise performance of the LWIR bands varies significantly with FPA temperature, and this influences the dynamic range when testing at different FPA set points. More details on the JPSS-4 VIIRS TEB can be found here [
15].
3.3. DNB Calibration Performance
The DNB radiometric calibration process requires two offset tables, one applied in the flight software and the second applied in the ground calibration, and a linear gain coefficient. In addition, an important aspect of the DNB calibration is the assessment of the stray light when the satellite passes through the penumbra. As a part of the dark offset characterization test, data is collected in the dark conditions to measure the offsets and compute the onboard table, and then a repeat run with the onboard tables uploaded to characterize the remaining offset is performed to prepare a corresponding table for ground calibration. The tables are designed to flat-field the DNB and are set at target values of 350 for HGA and HGB, 200 for MGS, and 60 for LGS in 14-bit DN. The at-launch tables were produced from the nominal plateau measurements with all samples in each of the CCDs reaching the target level. Some values of the onboard offsets for samples in HGB on the A-side (and B-side) electronics were larger than 5% of the dynamic range, which required an adjustment to the saturation threshold, a process that was also necessary for J3 VIIRS.
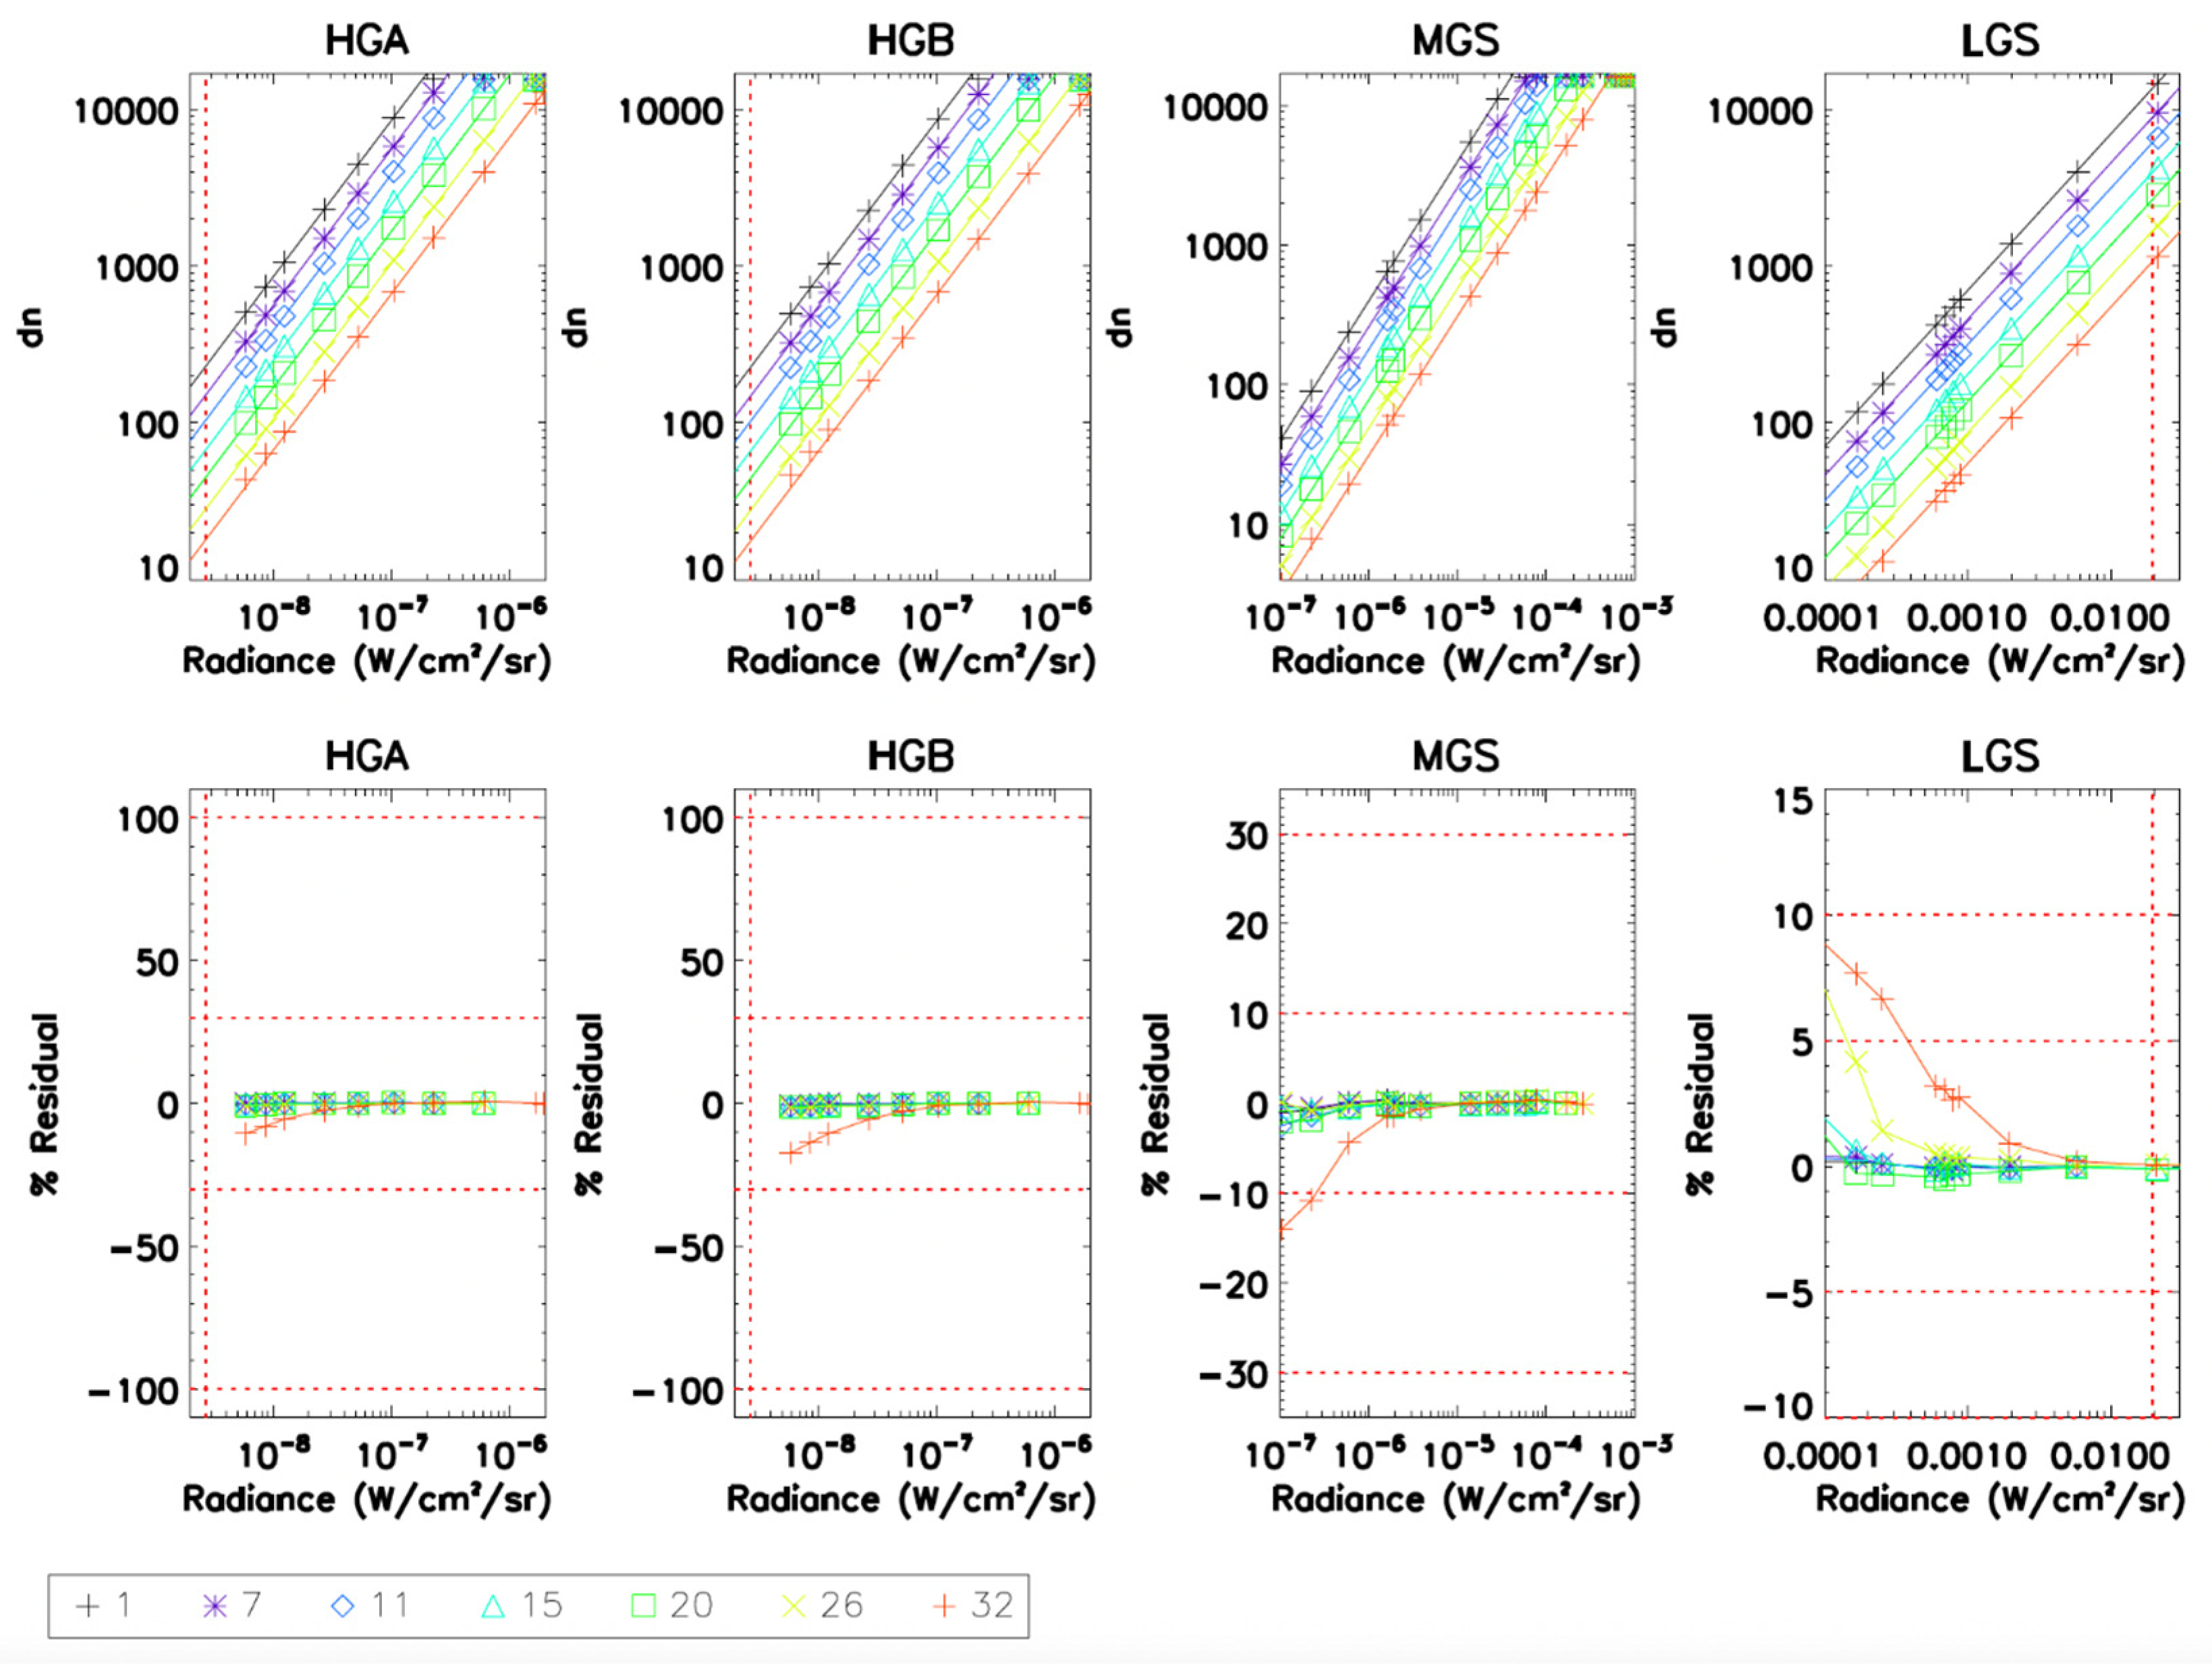
As with the RSB, the radiometric test measures the DNB response of the SIS calibrated light levels to estimate the linear gain coefficient. To characterize the low end of the MGS and HGS dynamic range, additional SIS lamps are also used, with the radiance for each of these lamp levels being calibrated before the start of the thermal vacuum testing campaign. Due to the operation of the DNB, the gains need to be computed for every detector and aggregation mode. An example of the radiance versus digital counts for select aggregation zones is plotted in
Figure 4 for all three gain stages. The fits are performed between the specified dynamic range for each gain stage, defined either by L
min or the gain transition point on the low end and the gain transition or L
max at the high end. For most cases, the relationship between the radiance and dn was well-behaved, similar to J2 and J3 VIIRS. A non-linear behavior was observed in the LGS at low radiance in some aggregation modes. The case of mode 29 resulted in linear fit residuals greater than the uncertainty requirement. Similar behavior was also observed in J2 and J3 VIIRS pre-launch testing and might require some adjustments in the on-orbit calibration to prevent this non-linear behavior from propagating to the MGS or HGS when computing the gain ratios. However, from the on-orbit performance of J2 VIIRS (NOAA-21 after launch), no major impacts due to this behavior have been observed so far, and hence, no modifications have been made to the on-orbit processing. The fit residuals are within the specified calibration uncertainty of 5% at L
max/2, 10% at the transition from LGS to MGS, 30% at the transition from MGS to HGS, and 100% at L
min, except for mode 29 in the LGS. These measurements will be used to create the at-launch tables for LGS gains, offsets, and gain ratios of MGS/LGS and HGS/LGS.
The DNB sensitivity requirement specifies a minimum SNR performance at L
min; however, since there was no measurement at L
min, a fit is used to evaluate the SNR at L
min after adjusting for the spectral differences between the SIS-100 and lunar illumination. In general, all the modes across both HGS CCDS (HGA and HGB) meet or exceed the requirement. The intra-aggregation mode uniformity evaluates the standard deviation of the calibrated radiance for all detectors within the given aggregation mode when viewing a uniform scene. The specification applies to all radiance levels from L
min to 0.9 L
max, and the limit is either 0.005 *L or half the noise, whichever is larger. In J4, only 13 modes had non-compliances, and those occurred at isolated radiance levels, where the standard deviation was larger than specified. Aggregation mode 29 had the largest fit residuals and issues with uniformity. The inter-aggregation uniformity looks at the difference in the retrieved radiance between the adjacent aggregation modes while viewing a uniform scene. This showed a greater number of non-compliances, which was also observed in previous builds. The HGS showed the best performance with non-compliances found among detectors in only five transitions, as compared to 21 transitions in LGS and 14 in MGS. More details on the JPSS-4 VIIRS DNB can be found here [
16].
3.10. OBC Characterization
In addition to the several functional and system-level tests described above, a comprehensive characterization of the onboard calibrators is also performed. The characterization of the SD and SDSM is of particular importance as the RSB and DNB rely on their observations, with both views using attenuation screens. The SD bidirectional reflectance distribution function (BRDF) and the SD and SDSM solar attenuation screen functions were also characterized by the instrument vendor at the component level. The significant OOB response observed at short wavelengths in the SDSM detectors of J1 VIIRS was addressed using hardware modifications in J2 VIIRS; however, a different source of OOB signal was identified, causing higher uncertainty. Subsequently, these issues were addressed in J3 and carried over to J4 VIIRS.
The SD’s BRDF characterization has a particular relevance towards the on-orbit calibration of the VIIRS RSB. The absolute scale of the VIIRS RSB calibration is set using the BRDF measurements acquired pre-launch and is often critical in establishing the calibration consistency between different VIIRS builds. Work is underway to assess the impacts of pre-launch BRDF measurements, possibly assessing the calibration biases between different VIIRS instruments.
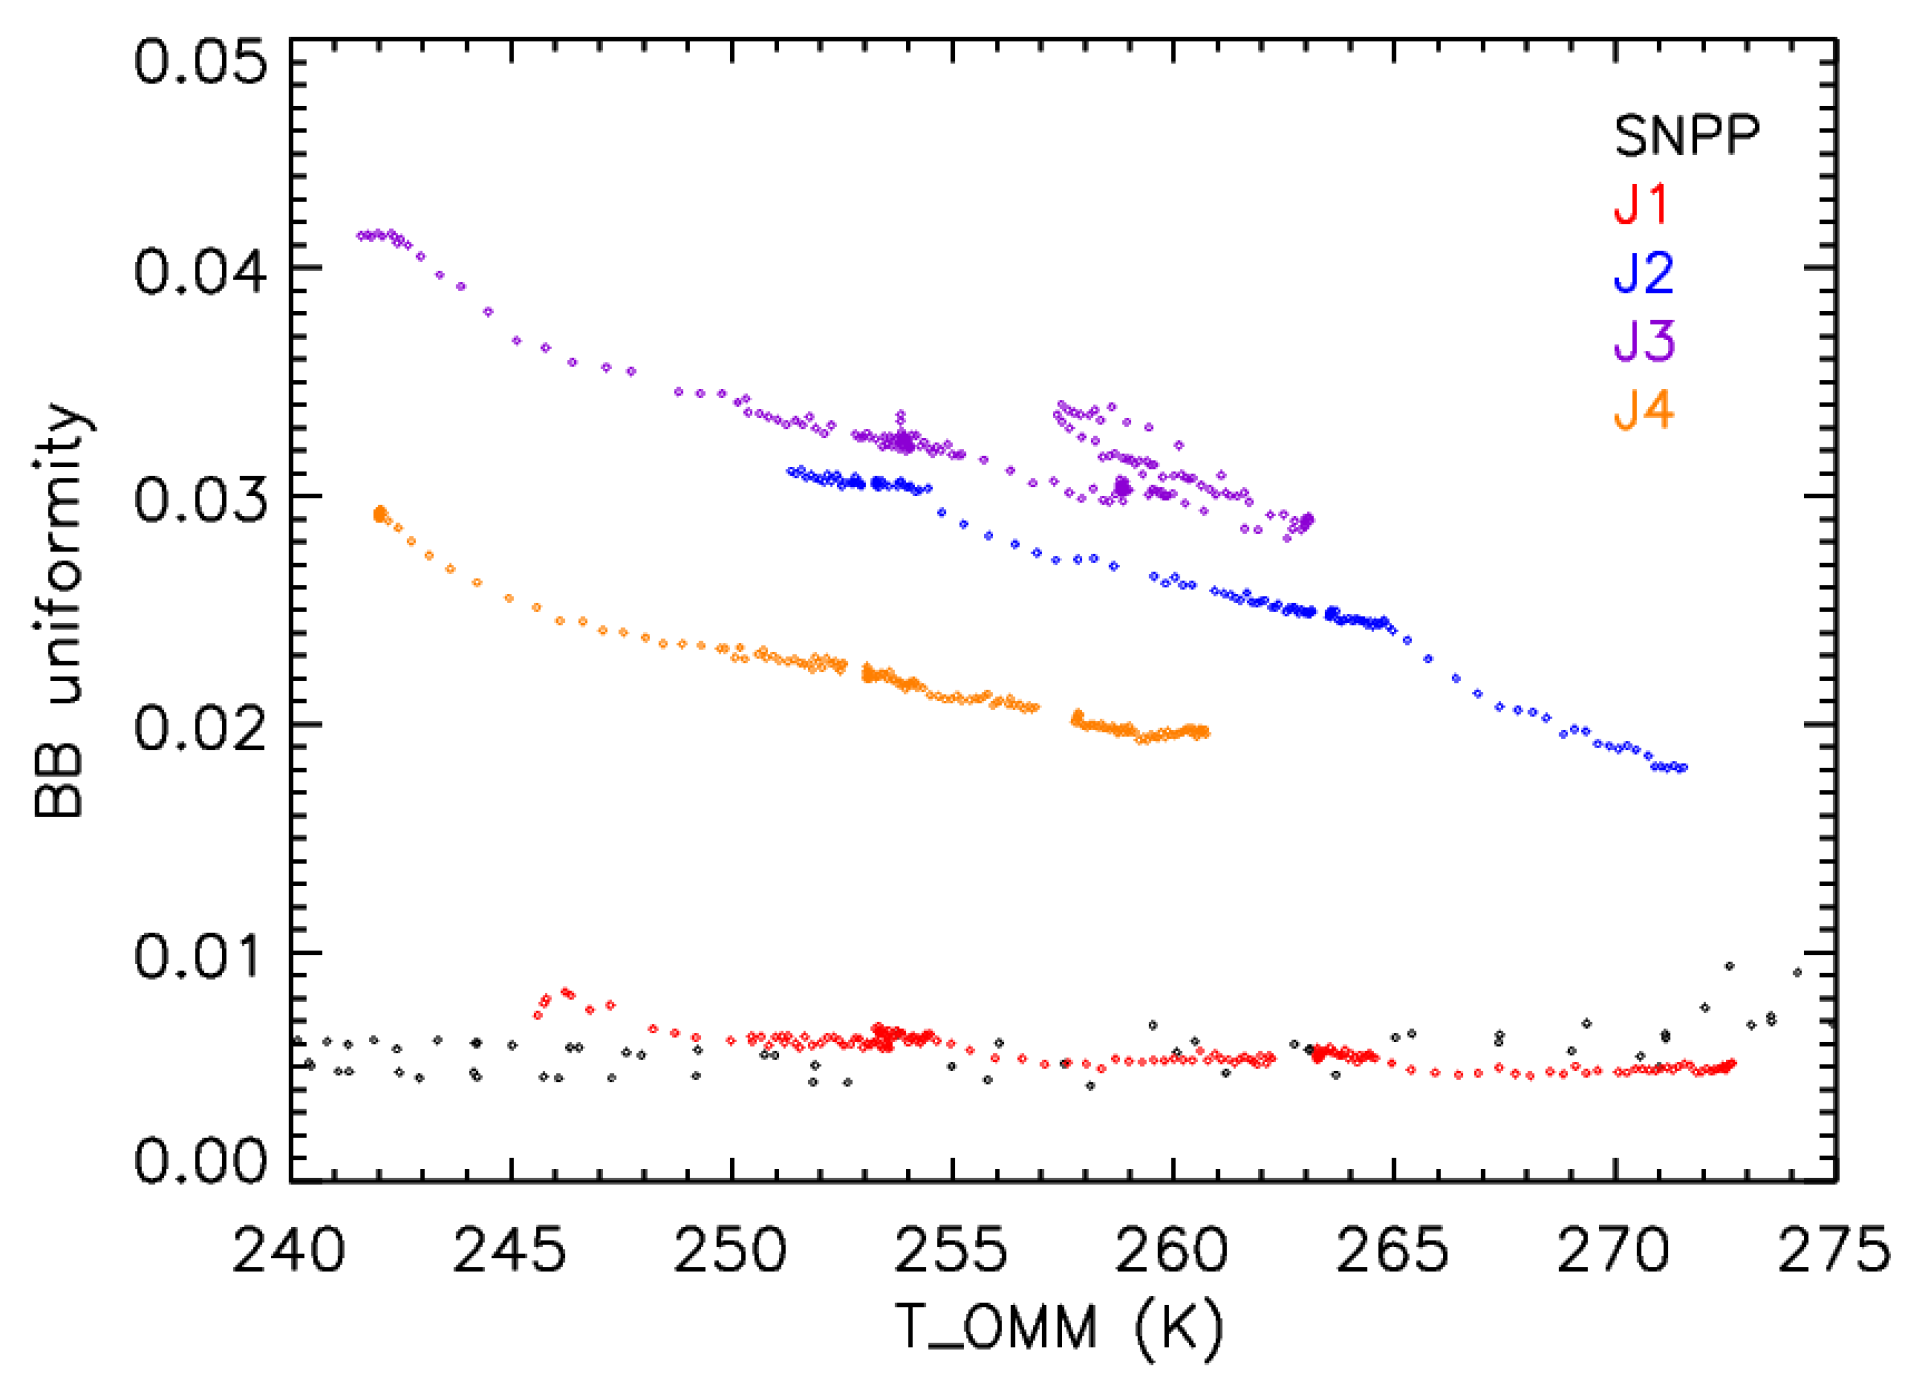
The OBC-BB, set to 292 K for most of the TV testing, has six thermistors to monitor the uniformity across the surface. The standard deviation of the six thermistor readings was used to monitor the uniformity and stability change as a function of VIIRS optical temperature, as shown in
Figure 10. The OBCBB design requirement is for less than 30 mK of uniformity over the mission lifetime and plays an important role in maintaining the radiometric accuracy of science products. The OBCBB nonuniformity observed in
Figure 10 is expected to have an additional increase from the day–night cycling observed on-orbit. While SNPP, J1, and J4 are seen to meet the 30 mK requirement, non-compliances are observed in the case of J2 and J3 VIIRS that could potentially lead to biases in the TEBs based on the satellite position on-orbit. The larger nonuniformity in the J2 was investigated by the instrument vendor and was attributed to the bonding of the heater to the back of the blackbody.


