Abstract
Grassland productivity is crucial for sustainable alpine livestock farming, yet the combined effects of climate change and topography remain unclear. Using long-term time series data of grassland NPP derived from Landsat imagery, along with meteorological and DEM data, this study employed correlation analysis and SEM to quantify climate-driven grassland NPP dynamics and topography-mediated regulatory effects in the Three-River Headwaters Region between 1990 and 2020. Significant spatiotemporal dynamics of grassland NPP were found in response to climate change over the past thirty years. Grassland NPP declined before 1994 and then grew significantly after 1995 at an average rate of 0.88 gC·m−2·a−1 (p < 0.01). Spatially, NPP increased in 69% of the region, with significant and highly significant growth in 9.5% (p < 0.05) and 35.7% (p < 0.01), mainly in the southeast. Driven by general warming and wetting, topographic modulation of hydrothermal conditions had intensified a mismatch in both time and space between grassland NPP and climate change, particularly in temperature sensitivity. The positive effect of temperature on NPP shifted to higher elevations (4000–5000 m) and lower slopes (5–25°), with NPP at higher elevations exhibiting greater sensitivity to temperature changes. However, the most substantial contributions to the overall rise in NPP occurred at altitudes of 3000–4000 m and slopes of 0–25°. The key mechanism is that NPP growth above 4000 m was constrained by precipitation scarcity despite thermal limitation alleviation from warming. Overall, the direct effects of climate change outweighed those of various topographic factors, with both showing slight declines since 2010. These findings highlight the need for differentiated governance, restoration, and adaptive management of grasslands across diverse topographic gradients.
1. Introduction
Grasslands cover 40% of the Earth’s land area [1] and are vital for ecosystem health, ecological service, and livestock farming sustainability [2]. Nearly 49% of global grasslands have degraded due to climate change and human activities, threatening sustainable development [3,4]. Understanding their evolution and drivers is crucial for global change research [5].
Grassland net primary productivity (NPP) is a key indicator of its ecological function and resource value, with its temporal stability closely linked to human well-being [6]. Recent studies have shown that climate change significantly affects the productivity trend in nearly 40% of global grasslands [7]. Climate change impacts grassland productivity by altering heat and moisture [8], extreme events [9], CO2 fertilization [10], and so on. The impact of climate change on NPP remains controversial. Studies show that between 2000 and 2010, climate change degraded 45.51% of global grasslands due to rising temperatures and changing precipitation [11]. In Central Asia, reduced precipitation led to an 84.7% decline in NPP from 1982 to 1999 [12,13]. Conversely, grassland coverage expanded as a result of forest conversion driven by climate warming and drying [14]. Temperature had a greater impact on grassland productivity in the Qinghai–Tibet Plateau than precipitation [15], while precipitation was the primary driver of greening on the Loess Plateau [16]. Some studies suggest that climate change had a limited or uncertain impact on grassland NPP, especially compared to rising human activities [13,17]. These discrepancies arise from variations in the dominant factors affecting grassland productivity across spatiotemporal scales [18]. Globally, climate change contributed 15.2% to 71.2% of the variation in grassland productivity from 1982 to 2011 [7], with significant regional differences. Climate-induced changes in hydrothermal patterns, combined with local topography, soil, and grassland types, complicate the mechanisms affecting grassland productivity.
The Three-River Headwaters Region (TRHR) on the Qinghai–Tibet Plateau is an ideal location for studying grassland productivity’s response to climate change and topography. Grassland is the dominant ecosystem in the TRHR, covering 65.4% to 69.5% of the area [19]. Moreover, the TRHR features complex topography and geomorphology, with extensive glaciers and permafrost coverage, and is strongly influenced by monsoon circulation. These factors contribute to the high sensitivity of the grassland ecosystem to climate change in the TRHR. Since the 1980s, global warming, snowmelt, and overgrazing have accelerated grassland degradation and productivity loss in the TRHR, threatening ecological security and sustainability. Existing studies have examined the relationship between climate change and grassland productivity from various perspectives, including productivity estimation [20], cover change [21], spatiotemporal pattern evolution [22], and the roles of climate change and human activities [23]. They also connect climate change to grassland productivity through factors such as growing season adjustments, phenological changes, soil microorganisms, hydrothermal conditions, glacier melting, permafrost changes, and human responses [8,24]. For example, a study based on the Noah–MP model demonstrated that permafrost thaw mainly affected NPP by altering soil moisture, with the most significant effects observed during the transitional phase before and after permafrost disappearance [25].
Previous studies indicate that in lowland areas, NPP variations are primarily driven by land use practices, whereas at high elevations, NPP is more sensitive to climate change [26,27]. Therefore, understanding the dynamic mechanisms through which climate change influences NPP at high altitudes is of paramount importance. Over the past 30 years, the TRHR has warmed, with increased precipitation but significant spatiotemporal variations [28]. Given the region’s complex topography, little is known about how the interaction between climate change and topography affects NPP and its specific manifestations in the TRHR. Research indicates that grassland NPP, NDVI, and LAI in the TRHR respond differently to climate change depending on the topographic conditions [29,30,31]. However, the complex dynamics of ecosystems and diverse topography pose challenges in this field, and research on how topography regulates grassland productivity’s responses to climate change is still limited. Over the past 30 years, what were the spatial–temporal patterns of grassland NPP distribution along topographic gradients in the TRHR under climate warming? How did grassland NPP respond to climate change under different topographic conditions? How did topography regulate the impact of climate change on grassland productivity over time? Addressing these questions will identify vulnerable and sensitive areas of grassland NPP variation, improve the understanding of grassland productivity stability, and is vital for restoring degraded ecosystems and promoting sustainable grassland resource use.
2. Data and Methods
2.1. Study Area
TRHR is the source of the Yangtze, Yellow, and Lancang rivers. Dubbed the “Water Tower of China”, it is situated in the heart of the Qinghai–Tibet Plateau (Figure 1). The region has a typical plateau continental climate with no distinct seasons, featuring alternating hot and cold periods and clear dry and wet seasons. Average annual temperatures range from −5.6 °C to 7.8 °C, with total annual precipitation ranging from 262 mm to 772 mm. The region is mainly mountainous, with complex topography and elevations ranging from 1900 m to 6800 m, sloping from west to east. The primary vegetation in the TRHR is grassland, which covers over 68% of the total area. This includes mainly alpine meadows and steppe, along with some temperate steppe and smaller patches of alpine desert and other types [19].
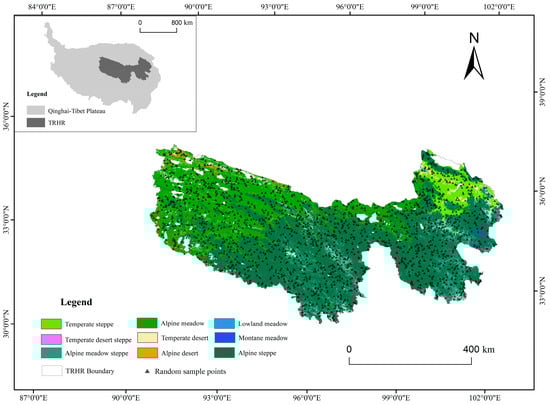
Figure 1.
Location of the TRHR with grassland types [27].
2.2. Data Sources and Preprocessing
2.2.1. Grassland NPP
As a key indicator of vegetation productivity, NPP is capable of reflecting vegetation dynamics. Most current studies use the CASA model to estimate potential grassland NPP [31,32]. Remote sensing for estimating grassland productivity has progressed rapidly, but accuracy is often limited by scarce ground survey data for validation. Since grass yield varies significantly by grassland type, this study establishes type-specific yield models by combining remote sensing imagery with extensive ground survey data.
Landsat offers advantages of higher resolution, better temporal continuity, and more stable sensors. The widely used MODIS NPP dataset only dates back to 2000, while the Landsat-derived NPP dataset can be reconstructed as far back as 1984. This study accessed Landsat 5/7/8 TM/ETM+/OLI surface reflectance data (30 m spatial, 16-day temporal resolution) via Google Earth Engine. For each period, we used at least 51 scenes of images, which could cover the entire Qinghai Plateau, including the TRHR. After radiometric, atmospheric, orthorectification, and cloud removal processing, combined with long-term ground-measured biomass data, a Landsat remote sensing dataset for the Qinghai Plateau from 1987 to 2021 was developed. Vegetation indices were calculated using this dataset. Grassland sample data were primarily sourced from the Grassland Supervision Center of the Ministry of Agriculture and Rural Affairs in China [http://www.moa.gov.cn/], the National Forestry and Grassland Administration platform [https://www.forestry.gov.cn/], and field surveys. From 2005 to 2021, a total of 16,881 samples were collected, covering the major grassland types of the Qinghai Plateau [27]. In field surveys, sample plots were established in representative grassland resource areas, and field-based surveys were conducted to systematically monitor grassland types, soil texture, and surface characteristics. In order to accurately capture the actual conditions of the regional grasslands, sample quadrats were randomly laid out with a minimum interval of 200 m. The spatial coordinates of each quadrat were recorded. The configuration of sample quadrats was adapted based on the specific characteristics of different vegetation types. In herbaceous plots, three 1 m × 1 m quadrats were typically established. Vegetation was clipped at ground level and weighed using a mechanical or electronic balance. Sampling time, elevation, and other relevant data were recorded. In plots with tall herbaceous plants or shrubs, larger 10 m × 10 m quadrats were used. Representative large, medium, and small individuals were weighed, and total biomass was estimated based on clump density. To ensure data accuracy and reduce potential human-induced bias, samples outside the defined study area and those with substantial discrepancies from field observations were excluded. The remaining high-quality data were systematically compiled and archived based on monitoring site ID, plot number, geographic coordinates, and other relevant metadata. To ensure sufficient model training, a random sampling strategy was adopted. For grassland types with fewer than 1000 samples, 80% were randomly selected for training and the remaining 20% were used for ground validation. For those with more than 1000 samples, 75% were used for training and 25% for validation. Additionally, Landsat imagery was used to extract auxiliary data such as latitude and longitude data, grassland resource types and distribution data.
The optimal model was based on grassland classification and incorporated spectral variables, vegetation indices (e.g., NDVI, EVI), and climatic variables (May–September cumulative precipitation and mean temperature) (see Supplementary Materials, Table S1). Pearson correlation analysis indicated that most variables were significantly correlated with yield (p ≤ 0.05), supporting grass yield inversion. To enhance model accuracy and reduce redundancy, the leave-one-out method was used to remove variables that weakened performance. The selected features were used to construct models with Random Forest and Gradient Boosting Tree methods. Model performance was evaluated using R2 and RMSE, with R2 consistently above 0.8, confirming model accuracy (Table 1). Finally, the Random Forest Model, which exhibited higher overall accuracy, was utilized to invert the grassland NPP (in fresh weight) annually from 1990 to 2020, achieving an average accuracy of 85% at a spatial resolution of 30 m. This study utilized the boundaries of the TRHR to clip and obtain NPP data for the research area. To enable a consistent comparison in subsequent climate-related analyses, the fresh-weight NPP was converted to units of gC·m−2·a−1 and resampled to a 250 m resolution using the nearest neighbor method.

Table 1.
Accuracy assessment of the models.
2.2.2. Meteorological Data
This includes monthly temperature and precipitation data for 1990 to 2020, with a spatial resolution of 1 km, from the National Tibetan Plateau Data Center/Third Pole Environment Data Center [https://data.tpdc.ac.cn/]. The dataset was derived from downscaling the global 0.5° climate dataset (CRU) and the high-resolution climate dataset (WorldClim) in China using the Delta spatial downscaling method, and validated with data from 496 meteorological stations, yielding credible results [33]. Annual average temperature and precipitation were calculated from the monthly data. For ease of subsequent use, the meteorological data were downscaled using bilinear interpolation and resampled to a uniform resolution of 250 m.
2.2.3. Topographic Data
Topographic data were sourced from NASA’s 30 m SRTM DEM [https://earthdata.nasa.gov/] and resampled to a 250 m grid. From this data, the corresponding altitude, slope, and aspect were calculated. Based on the topographic distribution of the TRHR and relevant studies [29,34], the topographic factors were systematically classified. Altitude was categorized into six distinct intervals: ≤3000 m, 3000–3500 m, 3500–4000 m, 4000–4500 m, 4500–5000 m, and ≥5000 m. Aspect was divided into five types: shady slope (0–45°, 315–360°, SHA), semi-shady slope (45–135°, SSHA), sunny slope (135–225°, SUN), semi-sunny slope (225–315°, SSUN), and flat slope (FLA). Slope gradient was segmented into five intervals: 0–5°, 5–15°, 15–25°, 25–35°, and ≥35°.
2.2.4. Other Data
The vector boundaries of the TRHR were sourced from the National Tibetan Plateau Data Center/Third Pole Environment Data Center [https://data.tpdc.ac.cn/zh-hans/]. The administrative boundary data were sourced from the National Geomatics Center of China [https://www.ngcc.cn/, accessed on 7 June 2025].
2.3. Methodology
2.3.1. Structural Equation Modeling
Structural Equation Modeling (SEM) is a sophisticated statistical analysis method widely employed in recent years in fields such as social sciences, psychology, and ecology. Its core principle involves linking observed and latent variables through a framework that encompasses both a measurement model and a structural model. This method examines the direct and indirect relationships among multiple variables, facilitating causal inference and mechanism analysis [35]. Incorporating latent variables allows the model to capture concepts or phenomena not fully represented by observed variables, thereby enhancing its explanatory and predictive power. SEM accounts for measurement error, effectively isolating the true score of variables from error, which reduces its impact on model estimates. This separation enhances model accuracy and reliability, allowing a clearer understanding of each variable’s unique influence and the complex interactions between them. Researchers can flexibly construct models to fit research goals and data characteristics by selecting indicators, defining latent variables, and setting path relationships. Piecewise structural equation models, often used in ecology, retain SEM strengths, lower data requirements, support diverse distributions, and keep local errors from affecting the whole model. Its operation process is as follows: First, a conceptual model is created based on theory and prior knowledge, outlining causal or correlational relationships among variables (informed by topography, climate, and grassland). The model is then fitted to the data, and if the results are unsatisfactory, significantly missing paths are added according to the d-separation principle. This process is repeated until the final model is achieved [35,36].
SEM results are usually shown in a graphical framework, where one-way arrows indicate causal relationships (with the starting point as the independent variable pointing to the response variable) and two-way arrows represent correlations. The number next to the arrow is the standardized path coefficient, indicating the strength of the direct relationship between two variables. Ranging from −1 to 1, coefficients closer to 1 or −1 signify stronger relationships, while a coefficient of 0 indicates no relationship. The overall effect of one variable on another is the sum of direct and indirect effects. The direct effect is the path coefficient to the target variable, while the indirect effect is the product of the path coefficients leading to it.
To quantitatively assess the regulatory effect of topographic factors on the impact of climate change on NPP and its dynamic changes, we randomly selected 1320 points within the TRHR using ArcGIS 10.8 [29]. For the study period from 1990 to 2020, encompassing the seven selected representative years of 1990, 1995, 2000, 2005, 2010, 2015, and 2020, we extracted observed values for six variables at each point. Finally, piecewise structural equation modeling was conducted using the R programming language. The constructed SEM was assessed using key fit indices, including p-values for relationships between variables, Root Mean Square Error of Approximation (RMSEA), and Comparative Fit Index (CFI). The results indicated p < 0.05, suggesting that the null hypothesis could not be rejected and confirming a good model fit. Moreover, both RMSEA and Standardized Root Mean Square Residual (SRMR) values were low, demonstrating strong explanatory power of the variable relationships (Supplementary Materials, Table S2).
2.3.2. Trend Analysis
Ordinary least squares estimation captures the linear trend of net productivity, accurately reflecting grassland productivity changes [37]. Univariate linear regression was used to analyze NPP, temperature, and precipitation trends at each grid point in the TRHR from 1990 to 2020.
To address the trends in temperature and precipitation changes, a Hydrothermal Change Composite Index (HCCI) was calculated to characterize the level of hydrothermal coupling between temperature and precipitation changes, which could also indicate the synergy of hydrothermal changes to some extent. The method was as follows: first, we calculated the trends of temperature and precipitation, normalizing their positive and negative values to eliminate dimensional influence. The normalized trends were then summed to obtain HCCI. A higher positive index indicates enhanced hydrothermal coupling, associated with warmer and wetter climates. A lower negative index suggests reduced coupling, implying colder and drier climates. In parallel, we categorized temperature and precipitation trends as S ≥ 0 and S < 0, yielding four temperature–precipitation combinations at the grid scale.
2.3.3. Correlation Analysis
The Pearson correlation coefficient (PCC) reflects the long-term dynamic relationship between grassland NPP and climate change [11,37].
Considering the dynamic and lagged effects of climate change on grassland NPP, this study used a 15−year sliding window to calculate the correlation trends between grassland NPP and temperature or precipitation across various topographic gradients. This window length effectively captured long-term trends while ensuring sufficient samples for robust correlation analysis. It also explored these correlations under different lag periods (0–6 years).
3. Results and Analysis
3.1. Spatiotemporal Trends of Grassland NPP and Topographic Differentiation
From 1990 to 2020, grassland NPP in the TRHR ranged from 40.3 to 1087 gC∙m−2∙a−1, averaging 238.3 gC∙m−2∙a−1. This is consistent with the results from climate models and the improved CASA model, but higher than estimates from some other remote sensing models (like the GLOPEM-CEVSA model) [20,38]. This value far exceeds the Qinghai–Tibet Plateau’s long-term average of 120.8 gC∙m−2∙a−1 (2000–2018) [39], indicating high grassland productivity potential. The spatial distribution of grassland NPP gradually increases from northwest to southeast (Figure 2d). Comparing grassland NPP with the topographic features of the TRHR reveals that altitude, slope, and aspect each show distinct variations in their relationship to NPP spatial patterns. Grassland NPP averages increase with altitude up to a peak before declining, with high values primarily occurring between 3000 and 4500 m (Figure 2 and Figure 3a). Average NPP rises with slope, hitting a minimum below 5°. It shows the most variability for slopes under 25° and levels off beyond that. NPP shows minor variation with aspect (207.4 to 247.4 gC∙m−2∙a−1), with higher values mainly on SSUN, SHA, and SSHA, peaking on SSUN (Figure 2 and Figure 3c). Overall, grassland NPP varies significantly with altitude, to a lesser extent with slope, and shows the least variation with aspect.
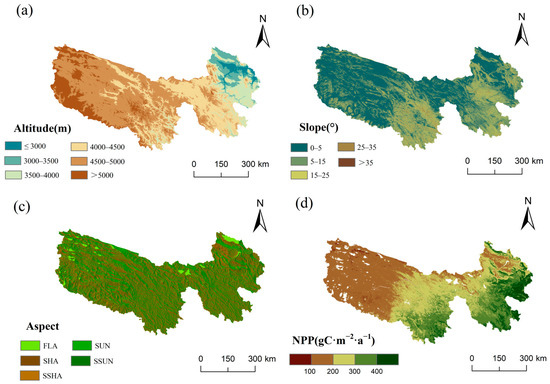
Figure 2.
Spatial distribution of topographic elements and average grassland NPP during 1990–2020 in the TRHR. (a) Altitude; (b) slope; (c) aspect; (d) grassland NPP.
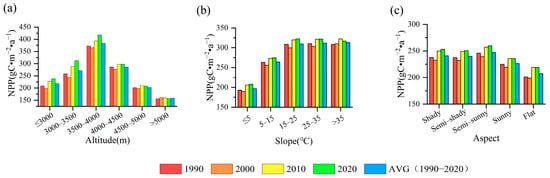
Figure 3.
Temporal dynamics of average grassland NPP across different gradients of topographic elements. (a) Altitude; (b) slope; (c) aspect.
The interannual variation in grassland NPP in the TRHR (Figure 4c) from 1990 to 2020 fluctuated between 224.68 gC∙m−2∙a−1 and 249.43 gC∙m−2∙a−1. In the past 30 years, grassland NPP had shown a significant upward trend, with an average growth rate of 0.71 gC∙m−2∙a−1 (p < 0.01). Compared to 1990 (236.17 gC∙m−2∙a−1), NPP increased to a peak of 249.43 gC∙m−2∙a−1 in 2020, representing a growth of 5.6%. However, the upward trend in NPP over the past 30 years was not consistent. Dividing the data at the lowest point in 1994 reveals two distinct periods: from 1990 to 1994, NPP declined significantly by −2.94 gC∙m−2∙a−1 (p < 0.01). In contrast, from 1995 to 2020, there was a notable increase, averaging 0.88 gC·m−2 per year (p < 0.01), with exponential growth particularly pronounced from 1995 to 2012. This trend markedly differs from the interannual variations seen in global grassland NPP [32].
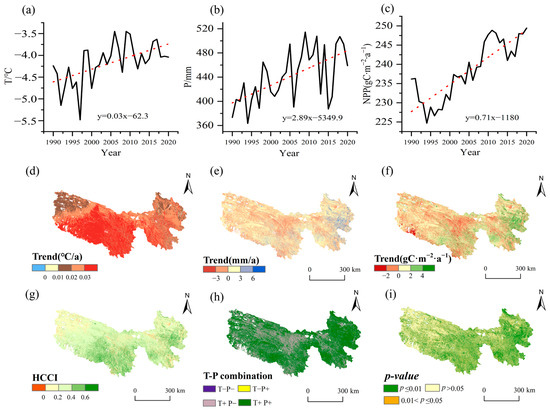
Figure 4.
Temporal trends of climate change and grassland NPP and their spatial patterns from 1990 to 2020. (a,d): Temperature; (b,e): precipitation; (c,f): NPP; (g): HCCI; (h): combination types between temperature and precipitation trends; (i): significance of NPP changes. The red dashed lines in (a–c) are the regression-fitted trend lines of the time series (black lines).
Over the past 30 years, grassland NPP changes in the study area have shown clear spatial differentiation. Increasing NPP areas account for 69%, with significant and highly significant increases at 9.5% (p < 0.05) and 35.7% (p < 0.01), respectively. These increases are mainly concentrated in the southeastern part of the study area, particularly notable in the eastern region of the Yellow River source (Figure 4f,i). Areas of decreasing NPP represent 31%, with significant reductions at 4.6% (p < 0.05), mainly in the central and western regions of the study area and the central Yellow River source. Highly significant reductions comprise 9.4% (p < 0.01), concentrated in central TRHR, the southern Lancang River source, and northern and central Yellow River source areas (Figure 4f,i). Compared to Figure 4f and Figure 2a–c, significant NPP increases are concentrated at altitudes of 3000–4000 m (eastern Yellow River source and south-central region of the TRHR) and 4000–5000 m (southwestern Yellow River source and south-central region of the TRHR), with slopes of 0–25° and no clear pattern in aspect. In contrast, areas with significant NPP decreases are mainly found below 3000 m (Gonghe Basin) and at 4000–5000 m (central Yellow River source, central TRHR, and southern Lancang River source), with slopes of 0–25° and 25–35° (southern Lancang River source) and no clear pattern in aspect.
The spatiotemporal evolution of grassland NPP varied across different topographic backgrounds. Figure 3 shows that while grassland NPP across different topographic factors exhibits similar stage change characteristics to Figure 4c, subtle differences remain over time. NPP fluctuations below 4000 m align with those in Figure 4c, showing a significant increase in 2010 compared to 2000, with the 2020 increase primarily concentrated at 3000–4000 m. Above 4000 m, NPP fluctuations decreased significantly, showing little change by 5000 m (Figure 3a). The above analysis shows that grassland NPP increased to high altitude with time in a specific altitude range, and the NPP growth at an altitude of 3000–4000 m contributed the most to the NPP of the entire TRHR. The effects of slope on NPP change in grassland with time were mainly reflected in the following aspects: Compared to 1990, NPP increased and then decreased (25–35°) at slopes less than or equal to 25° in 2000. When the slope exceeded 35°, NPP began to increase. In 2010, compared to 2000, NPP rose consistently across all slopes, especially below 35°. By 2020, NPP saw a slight increase in areas with slopes of 25° or less, but remained unchanged or even decreased in areas with slopes greater than 25° (Figure 3b). The results indicate that NPP fluctuations in areas below 25° significantly influenced the NPP changes in the TRHR. From the perspective of slope aspect, the temporal variation in NPP for SUN and FLA differed slightly from other aspects, showing a smaller decrease in 2000 compared to 1990 and minimal change in 2020 compared to 2010 (Figure 3c). These results indicate that the increase in grassland NPP on SSUN, SHA, and SSHA significantly contributed to the rise in NPP in the TRHR over the past decade.
Figure 5 further reveals the spatial pattern of NPP change rate and the statistical characteristics of topographic differences every five years. The NPP significantly decreased from 1990 to 1995 (Figure 4c), primarily due to a sharp decline in the southeastern region, which contributed most to the overall NPP, particularly in the eastern Yellow River source and central-southern TRHR, where grassland production potential was high (Figure 5a). Altitudes of 3500–5000 m, slopes of 5–35°, and all aspects except flat ones significantly contributed to the decline in regional NPP. From 1995 to 2000, NPP rebounded, but spatial differentiation was evident (Figure 5b). Increased NPP was concentrated in the south and central-eastern Yellow River headwaters, while decreased NPP was primarily observed in the western, eastern, and central areas. The increase in NPP was mainly due to significant rises in areas at altitudes of 3500–5000 m, with NPP also increasing in regions with slopes greater than 5° and across all slope directions. Conversely, the decrease in NPP was primarily attributed to declines in areas below 3500 m and with slopes less than 5°. From 2000 to 2005, grassland NPP increased significantly, mainly due to a substantial rise in the eastern TRHR (Figure 5c), particularly in areas below 4000 m in altitude and with slopes of 5–35°. In contrast, the central and western regions of the study area continued to decline, mainly due to decreased NPP in high-altitude areas above 4500 m. From 2005 to 2010, NPP entered a second rapid growth phase, with increases extending further northwest than in 2000–2005. Significant gains were particularly noted in the central and western Yellow River source and southwestern TRHR (Figure 5d). The influence of topographic differentiation significantly decreased; NPP markedly increased below 5000 m, especially in the 3000–3500 m and 4000–4500 m ranges, with a notable decline occurring above 5000 m. Areas with a slope of less than or equal to 35° had a greater contribution. From 2010 to 2015, grassland NPP in the TRHR declined (Figure 4c), especially in the central and central-eastern regions, likely due to the degradation of grasslands that had previously expanded northwest. This was also evident from the impact of altitude. Except for an increase in NPP at 3500–4000 m, significant declines occurred at other altitudes, especially at 3000–3500 m, where NPP shifted from a marked increase in the previous phase to a notable decrease. NPP across different slopes and aspects mainly showed a declining trend, particularly in areas with slopes of 15° or less, and on SUN and SSUN (Figure 5e). From 2015 to 2020, grassland NPP began to recover, with the most significant increases in eastern TRHR. The greatest contributions to NPP growth were in areas below 4000 m and with slopes under 25°, while all slope aspects showed positive contributions. In summary, changes in grassland NPP in the central and eastern TRHR significantly impacted the overall dynamics of NPP in the study area, with notable variations in altitude and slope influencing these changes over time.
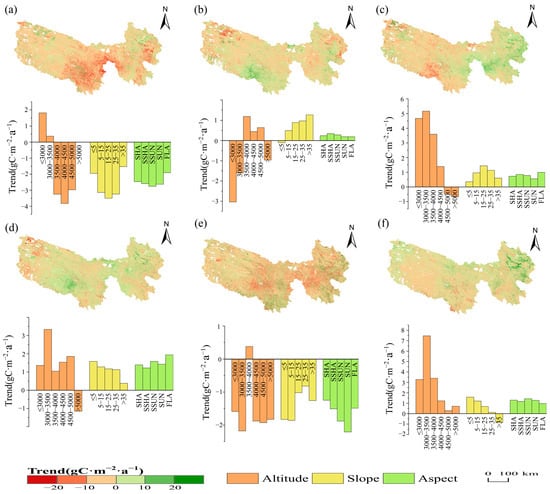
Figure 5.
Spatial–temporal trends of grassland NPP changes every five years from 1990 to 2020 and their topographic differentiation. (a): 1990–1995; (b): 1995–2000; (c): 2000–2005; (d): 2005–2010; (e): 2010–2015; (f): 2015–2020.
3.2. Direct Effects of Climate Change on Grassland NPP
Climate change is a key factor influencing grassland productivity in the TRHR [7]. From 1990 to 2020, the TRHR experienced a significant warm humidification process (Figure 4a,b). The average warming rate was 0.03 °C/a, and the precipitation variability was 2.89 mm/a. The warming rate exceeded the national average in China, while the interannual variation in precipitation surpassed the average increase nationwide [38]. The temperature exhibited a three-phase trend: a fluctuating decline from 1990 to 1997, a rapid increase from 1998 to 2010, and stable fluctuations from 2011 to 2020. Precipitation showed an overall linear increasing trend, but with significant interannual variability. Notably, the decline in precipitation rates in 1994, 2006, and 2015 ranged from 16% to 22%. The correlation coefficients for temperature and precipitation with NPP were 0.56 (p < 0.001) and 0.63 (p < 0.001), respectively. Together, they explained 51% of the interannual variation in grassland NPP (p < 0.001), highlighting the significant impact of climate change on the increase in NPP. Precipitation (standardized regression coefficient: 0.486, p < 0.01) had a greater impact on NPP than temperature (standardized regression coefficient: 0.362, p < 0.05), highlighting the critical role of precipitation in the TRHR grassland ecosystem.
Climate warming and wetting were spatially asynchronous in the past 30 years. Nearly all of the TRHR experienced significant warming, with intensity decreasing from south to north (Figure 4d). Precipitation variability displayed marked spatial differences, with precipitation rising in 64.8% and declining in 35.2% of the region. Increases were scattered, with more pronounced gains in the southeast than the northwest, particularly in the eastern Yellow River source (Yellow River Valley) and southeastern Yangtze River source. Drier areas were mainly found in the central and western Yellow River source, with the most significant precipitation reductions in the central Yellow River source and central TRHR. Based on the temperature–precipitation combination types (Figure 4h), climate change in the TRHR was primarily characterized by warming and humidification, with most areas (64.7%) experiencing warming and wetting. The trend of warming and drying was concentrated in the central Yellow River source, central TRHR, and the southern part of the Lancang River source, with some dispersion in the western TRHR. According to the HCCI, the trend of improving hydrothermal conditions decreased from southeast to northwest, with an expanding area of worsening conditions in the northwest. Additionally, the improvement in the central Yellow River source valley was less favorable than in other southeastern regions (Figure 4g).
Spatial analyses reveal that regions with the most pronounced temperature increases did not align with those exhibiting the most significant rises in grassland NPP (Figure 4). Temperature changes demonstrated a north–south gradient, while NPP variations displayed an east–west pattern, underscoring a substantial spatial mismatch and asynchronous relationship between the two phenomena. In contrast, NPP showed strong spatial synchrony with precipitation. The spatial pattern of hydrothermal combination types also aligned well with grassland NPP, more so than the HCCI. NPP rose in warming and humid areas but declined significantly in warming and drying regions. These results reinforce the limiting effect of precipitation distribution on grassland productivity in the study area. At the grid scale, most areas in the TRHR showed a positive correlation between NPP and both temperature and precipitation, with a stronger correlation with precipitation (Figure 6). NPP showed a positive correlation with temperature in 67% of the area, with an average correlation coefficient of 0.124. In comparison, 75.6% of the area showed a positive correlation with precipitation, yielding an average coefficient of 0.17. The spatial distribution of correlation coefficients between NPP and temperature or precipitation reveals significant differences. Positive correlations with temperature were mainly concentrated in the eastern and southwestern Yellow River sources, central and southern Yangtze River sources, and western Lancang River source. Conversely, negative correlations were primarily found in the southwestern, northwestern, and central-eastern Yangtze River sources, as well as the southern Lancang River source and central and northern Yellow River sources (Figure 6a,c). Positive correlations between NPP and precipitation were mainly observed in most areas of the Yellow River source, the southwestern Yangtze River source, and the western and central Lancang River source. Negative correlations were sporadically found in the northern and central parts of the study area, with the scattered statistical significance. Overall, precipitation exerts a greater influence on grassland NPP in the western TRHR than temperature (Figure 6b,d).
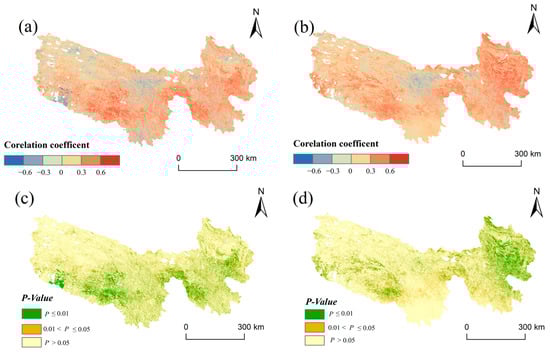
Figure 6.
Correlation analysis of climate change and grassland NPP during 1990–2020. (a,c): NPP–temperature; (b,d): NPP–precipitation.
Dynamic changes in correlation coefficients over time indicate that grassland NPP responds differently to temperature and precipitation across various topographical conditions. Under varying topographical conditions, NPP’s response to temperature can be divided into two phases around 2005. Before this year, the correlation was strong, indicating a high sensitivity of NPP to positive temperature changes. However, after 2005, the correlation significantly weakened, with some areas showing negative correlations. Before 2003, at altitudes below 5000 m, the correlation coefficients between the two variables steadily increased over time across nearly all altitudes. Additionally, high correlation coefficients increased from mid-altitudes (3500–4000 m) to higher altitudes (4000–5000 m), with the most pronounced rise in the 4000–4500 m range (Figure 7a). This transition point around the year 2000 indicates a shift in temperature’s impact on NPP to higher altitudes. While correlation coefficients for the 3000–3500 m range are relatively low, they exhibit the most significant increase. Above 5000 m, the correlation between NPP and temperature is largely insignificant. Before 2003, at slopes below 25°, the temperature–NPP correlation coefficients increased over time, nearing the values for slopes of 15–25° and 25–35° (Figure 7b). The correlations for slopes of 15–25° and 25–35° remained stable over time, while those for slopes over 35° exhibited a slight decline. After 2005, higher slopes were linked to a more rapid decline in correlation coefficients. Regarding slope aspect, the temperature–NPP correlation coefficients exhibited a trend of initially increasing and then decreasing across different aspects, with little variation among them (Figure 7c).
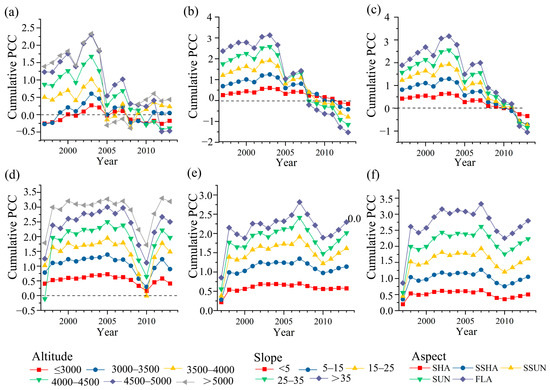
Figure 7.
Moving correlation of grassland NPP to temperature (a–c) and precipitation (d–f) for different topographic gradients centered on a 15-year sliding window from 1990 to 2020.
NPP’s response to precipitation changes lacks distinct phases. Across various topographies, the correlation with precipitation is generally strong, especially at altitudes below 3500 m and above 4500 m, though some periods might be affected by extreme events. Before 2007, the correlation between NPP and precipitation at altitudes of 4000–5000 m showed the most significant increase over time (Figure 7d). The significant decline in correlation around 2010 was primarily associated with the decrease in NPP–precipitation correlation at altitudes below 4000 m. In this phase, NPP steadily increased while precipitation remained stable. As slope increases, the NPP–precipitation correlation remains stable at angles below 15°, but declines at steeper slopes; before 2007, areas with slopes less than 25° exhibited the most significant increase in correlation over time (Figure 7e). Correlations across different slope aspects show minimal variation, with sunny and flat slopes slightly outperforming others. Overall, trends remain consistent over time (Figure 7f).
3.3. Linkage Pathways Between Topography, Climate Change, and NPP
The above results suggest an inherent linkage mechanism among topography, climate change, and grassland NPP. Figure 8 shows the SEM results based on the multi-year averages of topography, climate change, and grassland NPP in the TRHR from 1990 to 2020. It reveals that temperature has a total effect of 0.214 on NPP, while precipitation has a direct effect of 0.628, resulting in an overall impact of 0.842 on vegetation. Different topographical factors have distinct dominant pathways and effects on grassland, and altitude affects both temperature and precipitation, primarily impacting NPP via temperature. Slope mainly influences NPP by altering precipitation, while aspect affects both temperature and precipitation, though its direct effects are relatively weak. The total effects of altitude, slope, and aspect on NPP are −0.291, 0.270, and 0.05, respectively, yielding an overall topographical effect of 0.03. The combined influence of climate change and topography is 0.87. Contributions to the total effect are −33.40% from altitude, 30.93% from slope, and 5.92% from aspect.
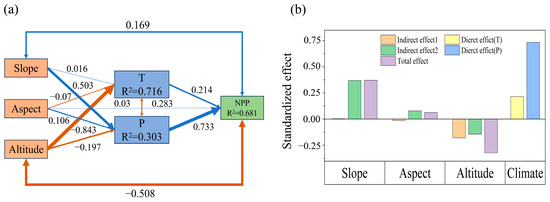
Figure 8.
Structural equation model pathways of topography, climate change, and grassland NPP from 1990 to 2020. (a): Boxes represent variables, with T for temperature and P for precipitation. Arrows indicate relationships: single arrows denote causal relationships, while double-headed arrows indicate correlations; the blue lines indicate positive effects, while orange lines denote negative effects. Line thickness corresponds to the magnitude of the standardized path coefficients, scaled by their sizes. Darker lines signify significance (p < 0.05), while lighter lines indicate non-significance; (b): Indirect Effect 1 and Indirect Effect 2 represent the influence of topography on NPP through the modulation of temperature and precipitation, respectively.
The relationship between topography, climate change, and grassland NPP across different periods reveals consistent response pathways, though the impacts of climate change and topographical effects show some variation (Figure 9). The direct effect of climate change was strong before 2010 but weakened after 2015, largely due to a decline in the temperature effect, which was stable prior to 2010 but noticeably decreased afterward. In contrast, the precipitation effect remained consistently strong throughout all periods. Altitude and slope effects were significant before 2005 but diminished after 2010, while the aspect effect remained relatively stable across periods. The total topographical effects over seven years were 0.030, 0.022, 0.028, 0.031, 0.058, 0.034, and 0.058, indicating a generally stable overall effect. In 1990, the contributions of altitude, slope, and aspect effects to the total effect were −32.38%, 29.94%, and 3.94%, respectively. In 1995, they were −35.05%, 32.92%, and 4.52%. In 2000, the contributions were −32.48%, 31.33%, and 4.14%. In 2005, they changed to −33.04%, 30.27%, and 6.16%. In 2010, the values were −27.29%, 27.52%, and 6.57%. In 2015, they were −31.38%, 30.24%, and 5.70%. Finally, in 2020, the contributions were −31.02%, 31.88%, and 6.34%. The sums of climate change and total topographical effects across seven years were 0.76, 0.91, 0.92, 0.90, 0.88, 0.74, and 0.84, respectively.
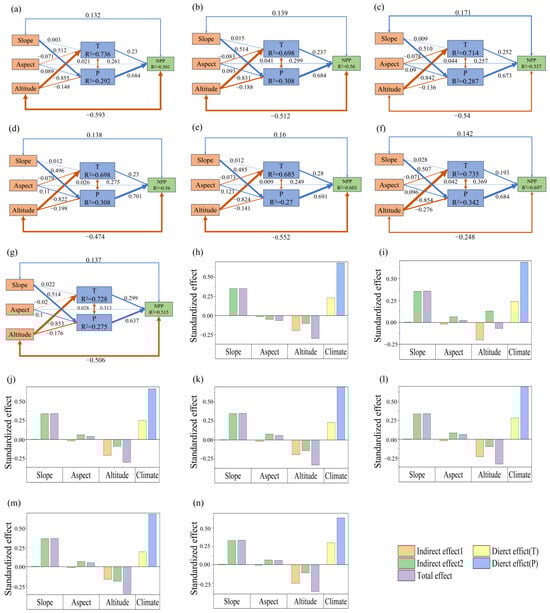
Figure 9.
Linkage pathways of topography, climate change, and grassland NPP across different periods. Boxes represent variables, with T for temperature and P for precipitation. Arrows indicate relationships: single arrows denote causal relationships, while double-headed arrows indicate correlations; the blue lines indicate positive effects, while orange lines denote negative effects. Line thickness corresponds to the magnitude of the standardized path coefficients, scaled by their sizes. Darker lines signify significance (p < 0.05), while lighter lines indicate non-significance. (a–g) correspond to the years 1990, 1995, 2000, 2005, 2010, 2015, and 2020. (h–n): Indirect Effect 1 and Indirect Effect 2 represent the influence of topography on NPP through the modulation of temperature and precipitation, respectively, also corresponding to the years 1990, 1995, 2000, 2005, 2010, 2015, and 2020.
4. Discussion
4.1. Dynamic Characteristics
Global greening and species range shifts, particularly poleward/upslope migrations, have been observed over the past 2–3 decades due to climate warming [3,40]. However, research on this in East Asia is limited. Vegetation ecosystems, with their long lifespan and gradual maturity, typically respond more slowly [41,42], leading to uncertainties in greening and biomass estimates [12]. Our study offers key insights into the dynamic response of grassland NPP to climate change in the TRHR, with a particular emphasis on the regulatory influence of topographic factors. These findings may serve as a valuable reference for understanding ecosystem responses in other high-altitude regions globally. Over the past 30 years, grassland NPP in the TRHR has largely shown a rapid increasing trend, aligning with previous studies [22,43]. The decline from 1990 to 2000 was mainly due to climate factors and overgrazing [43], while the growth after 2000 resulted from warming, increased moisture [22,28], and ecological restoration [17]. Notably, our analysis shows that precipitation has a stronger and more stable influence on grassland NPP than temperature, especially in the central and western TRHR [43]. In the central region, the negative correlation between precipitation and NPP is likely due to higher temperatures accelerating soil moisture loss, offsetting the benefits of increased rainfall. This is further influenced by the delayed response of grassland ecosystems to warming and drying trends [44]. NPP exhibits a lagged response of three years to temperature and two years to precipitation (Figure 10). This may explain the sharp decline in the precipitation–NPP correlation around 2010 (Figure 7d–f), primarily due to a 21.4% increase in precipitation in 2017, with NPP recovery only occurring in 2018. Overall, NPP responds quickly to precipitation decreases, but shows a clear time lag in response to increases.
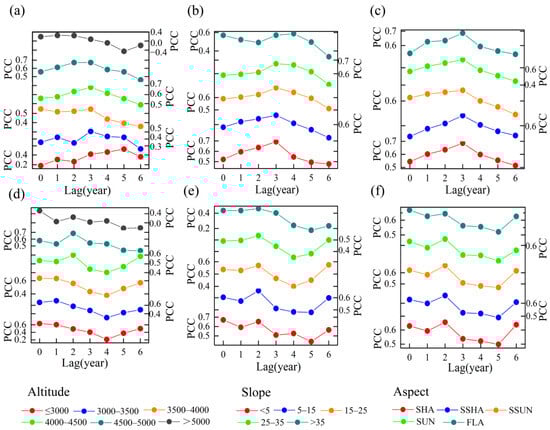
Figure 10.
Lagged response of grassland NPP to temperature (a–c) and precipitation (d–f) for different topographic gradients from 1990 to 2020.
The influence of temperature on NPP weakened after 2005, even becoming negative, likely due to human-led ecological restoration efforts. Ecological restoration projects have been identified as a key driver of vegetation cover changes in the TRHR and Yellow River basins over the past two decades [17]. Since 2005, warming in the TRHR has plateaued, but grassland NPP continues to rise, driven by increased precipitation and ecological practices such as grassland restoration and national park development (Figure 4).
4.2. Topographic Regulation Mechanisms
Topography regulates light, water, and heat distribution, indirectly shaping grassland growth. In the TRHR, NPP declines from southeast to northwest, mirroring temperature and precipitation patterns [22,43]. This study reveals that the region’s rising terrain aligns with East Asian monsoon-driven water and heat diffusion, strongly coupling NPP distribution. Changes in the southeast dominate regional trends and spatial evolution over time.
Altitude is the primary factor regulating the impact of climate change on grassland NPP in the TRHR, consistent with findings from North America [45,46]. High NPP values are predominantly concentrated at altitudes between 3000 and 4500 m, displaying an inverted U-shaped trend with increasing altitude. This distribution pattern underscores the dual regulatory role of topography in modulating both temperature and precipitation. With increasing altitude, temperature decreases, while precipitation first increases and then declines beyond a certain threshold. Additionally, the phase of precipitation transitions from liquid to solid. These altitudinal changes fundamentally reshape local hydrothermal conditions, exerting a profound influence on the spatial distribution of vegetation productivity [29]. The substantial elevation gradient of the TRHR forms a vast “natural staircase,” characterized by pronounced differences in hydrothermal conditions across elevation zones. At altitudes below 3000 m, temperatures are relatively high; however, excessive warmth enhances surface evaporation, leading to reduced soil moisture. This moisture deficit limits vegetation growth, resulting in decreased grassland NPP in these low-altitude areas. At altitudes above 4000 m, both temperature and precipitation tend to decrease. High-altitude areas are theoretically subjected to the dual constraints of limited precipitation and insufficient thermal energy. However, in the context of global warming, studies have shown that warming is more pronounced at higher elevations than at lower ones, making these regions more sensitive to temperature fluctuations [47,48]. This enhanced warming partially mitigates the thermal limitations at high altitudes. Nonetheless, declining precipitation in these areas results in insufficient water availability to support vegetation growth, leading to a corresponding decrease in grassland NPP. This explains why the areas exhibiting the most pronounced increases in grassland NPP do not spatially correspond to those experiencing the greatest warming; rather, NPP shows a stronger spatial correlation with precipitation. Within this context, the mid-altitude zone between 3000 and 4500 m represents the “optimal elevation range” for vegetation growth, where favorable temperatures, sufficient moisture, and optimal hydrothermal coupling combine to produce peak grassland NPP.
Previous studies on NDVI in the TRHR highlight the key role of topography-driven hydrothermal coupling in shaping grassland NPP [29]. Our study further analyzed NPP’s lagged response to climate change. As altitude rises from ≤3000 m to above 5000 m, the precipitation response lag first increases from 0 to 2 year, then returns to 0, while the temperature response lag shortens from 5 to 1 year. Shorter lags indicate a faster, more sensitive NPP response to climate variability. Greater moisture deficits shorten vegetation’s lagged response to precipitation, while stronger thermal deficits reduce lag time to temperature [49]. Ecological processes may also exert significant impacts, such as the changes in the growth periods in alpine grasslands [36]. As altitude increases, grassland species richness tends to decline, leading to reduced biodiversity and simplified community structure [46]. It is found that higher altitudes reduced soil seed bank richness and its role in regeneration [50]. Climate warming also impacts soil respiration processes [51]. All these processes may enhance the NPP sensitivity of high-altitude regions to climate change. Consequently, high altitudes are more sensitive to temperature, initiating growth once thermal thresholds are reached, while both high and low elevations respond to precipitation, increasing climatic heterogeneity at high elevations [52]. Over the past 30 years, the TRHR has experienced notable warming and wetting, alongside glacier retreat and permafrost thaw [24,53]. This has eased relatively high-elevation water shortages, increasing surface water availability and boosting NPP. Consequently, the temperature–NPP correlation strengthens from mid- (3500–4000 m) to high altitudes (4000–5000 m), peaking at 4000–4500 m. Grassland NPP increases have extended to higher elevations over time, but growth remains mainly between 3000 and 4000 m in the TRHR. The key mechanism is that NPP growth above 4000 m is still constrained by precipitation scarcity despite thermal limitation alleviation from warming. This differs from prior findings of peak NDVI gains at 4500–5000 m, likely reflecting NDVI’s limitations in capturing true NPP changes [54].
Slope influences grassland NPP by regulating precipitation and soil moisture. As slope increases, orographic rainfall intensifies, resulting in changes in soil moisture levels [46]. In the TRHR, NDVI responds most significantly to climate change at slopes of 5° to 15°. As slope increases, it affects water conservation, soil nutrients, and root distribution, limiting vegetation growth [29]. Slope regulates precipitation within the 0–25° range. Figure 10 shows that as slope increases, the lag in NPP response to precipitation grows from 0 to 3 years, and to temperature from 3 to 4 years. Thus, steeper slopes prolong climate impact transmission in the ecosystem, with notable lag effects for precipitation and temperature above 25° (Figure 9b,e). This is possibly due to the lower water retention capacity of steep slopes compared to gentle slopes, resulting in more variable moisture availability that can delay the effective use of precipitation within the ecosystem and extend the response lag time. Studies indicate that slope has a stronger regulatory effect on temperature at high altitudes (4500–5000 m) than at lower altitudes [29]. In summary, in the high-altitude TRHR, the slope more strongly regulates climate—especially temperature and precipitation—and particularly on slopes below 25°. With ongoing warming and wetting, the threshold for slope’s influence on precipitation may rise, indicating that steeper slopes have greater moisture regulation. This is supported by pre-2003 observations showing increasing temperature–NPP correlations over time for slopes under 25°, most notably between 0 and 15°, approaching values for 15 to 25° and 25 to 35°, while correlations decline above 35°.
Aspect affects grassland ecosystems in complex ways, regulating ecological factors like solar radiation, moisture, temperature, and soil nutrients. In arid and high-altitude regions, intense radiation on south-facing slopes accelerates evaporation, limiting vegetation growth. In contrast, semi-sunny, north-facing, and semi-shady slopes offer better hydrothermal conditions [55]. Semi-sunny slopes, in particular, regulate temperature and precipitation, making vegetation most responsive to climate change [26]. This may explain why SSUN has the highest average grassland NPP, with increases in NPP on these slopes, as well as on SHA and SSHA, driving the upward trend in NPP across the TRHR over the past decade. However, the variation in NPP and its correlation with climate change across different aspects over time is generally not pronounced, and the lag effects of temperature and precipitation relative to aspect gradient remain relatively stable (Figure 10c,f). Thus, the influence of aspect on grassland NPP in response to climate change is significantly weaker than that of altitude and slope. Similar patterns have been observed in other regions [46], likely due to aspect’s limited impact on ecological factors or the counterbalancing effects of different influences.
Overall, climate change has a more significant direct impact on grassland NPP than individual topographic factors. The influence of topographic factors on NPP is relatively stable over time, likely due to the fact that the regulation amplitudes of altitude and slope on hydrothermal conditions are obviously greater than the amplitude of climate change. Differences in topographic regulation of hydrothermal conditions under climate change have resulted in imperfect temporal and spatial synchronization between grassland NPP and climate change in the TRHR.
4.3. Limitations and Future Prospects
Large-sample field data and ground validation are crucial for accurate grassland NPP estimation in this study. However, sampling point collection and distribution remain limited due to higher elevations and logistical constraints. Relatively sparse coverage in the western region likely contributes to lower estimation accuracy for alpine meadows. As alpine meadows are primarily found in western TRHR’s high-altitude areas, this sampling bias may limit the findings’ regional generalizability. Future studies should prioritize denser plot sampling in the western region to improve representativeness.
Furthermore, due to the fact that meteorological data was resampled from a 1 km resolution to a 250 m resolution, this may have affected the analysis results of the relationship between topography, climate change, and NPP in this paper. In the future, it will be worthwhile investigating the spatial scale effects of terrain regulation processes based on higher-resolution data. The regulatory mechanism of topography on the climatic impact on grassland NPP is only based on statistical analysis results. Modeling assumptions might also introduce potential uncertainties in the mechanisms. Field-based simulation experiment data can be used to further support the research results and provide richer potential mechanisms in soil and ecologic processes. Additionally, this study highlights the coupled impacts of climate and topography on grassland NPP, with a primary focus on natural drivers. However, as pointed out in many studies, human activities such as land use also play an important role in certain areas (such as lowlands). Future work should integrate anthropogenic factors (e.g., population, grazing pressure) to examine their role in grassland NPP and their interaction with natural drivers.
5. Conclusions
The complex interactions between climate change and topographic factors, as well as their dynamic impacts on grassland NPP, remain poorly understood. Our results indicate that grassland NPP in the TRHR rapidly increased from 1990 to 2020. However, its response to climate change varied significantly across different topographic gradients, reflecting distinct temporal dynamics and spatial differentiation. The positive effect of temperature on NPP shifted toward higher elevations (4000–5000 m) and lower slopes (5–25°). However, the south regions with the most significant temperature increases do not correspond with those showing the greatest increases in grassland NPP. This discrepancy occurs because, although high-elevation areas are more sensitive to temperature rises, limited water availability restricts NPP growth. In comparison, NPP and precipitation exhibit better temporal and spatial synchronization. This difference is primarily due to varying topographic mechanisms regulating hydrothermal coupling under climate change. As a result, NPP increased at altitudes of 3000–4000 m, and slopes of 0–25° were the largest contributors to the overall NPP rise in the TRHR. Overall, climate change had a stronger direct effect on grassland NPP than individual topographic factors, with altitude and slope having greater regulatory influence than aspect.
These results underscore the need for targeted grassland management, restoration, and adaptive strategies suited to different topographic gradients. It is essential to protect and restore quality grassland at elevations of 3000–4000 m and on slopes greater than 15° to prevent degradation from climate change or human activities such as overgrazing or intensive land use.
Supplementary Materials
The following supporting information can be downloaded at https://www.mdpi.com/article/10.3390/rs17132122/s1, Table S1: Model predictor variables; Table S2: Assessment of the SEM performance for the period from 1990 to 2020.
Author Contributions
Conceptualization, Z.W. and W.Y.; methodology, Z.W., M.Q. and M.W.; software, M.Q. and M.W.; validation, Z.W. and M.W.; formal analysis, Z.W.; resources, M.W. and W.Y.; writing—original draft preparation, Z.W.; writing—review and editing, Z.W. and W.Y.; visualization, M.Q. and M.W.; funding acquisition, W.Y. and Z.W. All authors have read and agreed to the published version of the manuscript.
Funding
This study falls under the auspices of the National Natural Science Foundation of China (U20A2098, 41701219), the National Key Research and Development Program of China (“The Second Tibetan Plateau Scientific Expedition and Research Program (STEP)”, 2019QZKK0804), and the Science and Technology Program Project of Tibet Autonomous Region (XZ202501ZY0141).
Data Availability Statement
The data that support the findings of this study are available on request from the corresponding author.
Acknowledgments
The authors appreciate the anonymous reviewers for their constructive comments and suggestions that have significantly improved the content and quality of this manuscript.
Conflicts of Interest
The authors declare no conflicts of interest.
References
- Gibbs, H.K.; Salmon, J.M. Mapping the world’s degraded lands. Appl. Geogr. 2015, 57, 12–21. [Google Scholar] [CrossRef]
- Chang, J.; Tian, J.; Zhang, Z.; Chen, X.; Chen, Y.; Chen, S.; Duan, Z. Changes of grassland rain use efficiency and NDVI in Northwestern China from 1982 to 2013 and its response to climate change. Water 2018, 10, 1689. [Google Scholar] [CrossRef]
- IPCC. Summary for Policymakers. In Climate Change 2021: The Physical Science Basis. Contribution of Working Group I to the Sixth Assessment Report of the Intergovernmental Panel on Climate Change; Cambridge University Press: Cambridge, UK, 2021. [Google Scholar]
- Bardgett, R.D.; Bullock, J.M.; Lavorel, S.; Manning, P.; Schaffner, U.; Ostle, N.; Chomel, M.; Durigan, G.; Fry, E.L.; Johnson, D.; et al. Combatting global grassland degradation. Nat. Rev. Earth Environ. 2021, 2, 720–735. [Google Scholar] [CrossRef]
- Yan, J.; Zhang, G.; Deng, X.; Ling, H.; Xu, H.; Guo, B. Does climate change or human activity lead to the degradation in the grassland ecosystem in a mountain-basin system in an arid region of China? Sustainability 2019, 11, 2618. [Google Scholar] [CrossRef]
- Su, J.; Zhao, Y.; Xu, F.; Bai, Y. Multiple global changes drive grassland productivity and stability: A meta-analysis. J. Ecol. 2022, 110, 2850–2869. [Google Scholar] [CrossRef]
- Gao, Q.; Zhu, W.; Schwartz, M.W.; Ganjurjav, H.; Wan, Y.; Qin, X.; Ma, X.; Williamson, M.A.; Li, Y. Climatic change controls productivity variation in global grasslands. Sci. Rep. 2016, 6, 26958. [Google Scholar] [CrossRef] [PubMed]
- Li, C.; Sun, H.; Liu, L.; Dou, T.; Zhou, M.; Li, W.; Wu, X. The importance of permafrost in the steady and fast increase in net primary production of the grassland on the Qinghai–Tibet Plateau. Catena 2022, 211, 105964. [Google Scholar] [CrossRef]
- Craine, J.M.; Nippert, J.B.; Elmore, A.J.; Skibbe, A.M.; Hutchinson, S.L.; Brunsell, N.A. Timing of climate variability and grassland productivity. Proc. Natl. Acad. Sci. USA 2012, 109, 3401–3405. [Google Scholar] [CrossRef]
- Eze, S.; Palmer, S.M.; Chapman, P.J. Negative effects of climate change on upland grassland productivity and carbon fluxes are not attenuated by nitrogen status. Sci. Total Environ. 2018, 637, 398–407. [Google Scholar] [CrossRef]
- Gang, C.; Zhou, W.; Chen, Y.; Wang, Z.; Sun, Z.; Li, J.; Qi, J.; Odeh, I. Quantitative assessment of the contributions of climate change and human activities on global grassland degradation. Environ. Earth Sci. 2014, 72, 4273–4282. [Google Scholar] [CrossRef]
- Zhang, G.; Biradar, C.M.; Xiao, X.; Dong, J.; Zhou, Y.; Qin, Y.; Zhang, Y.; Liu, F.; Ding, M.; Thomas, R.J. Exacerbated grassland degradation and desertification in Central Asia during 2000–2014. Ecol. Appl. 2018, 28, 442–456. [Google Scholar] [CrossRef] [PubMed]
- Chen, T.; Bao, A.; Jiapaer, G.; Guo, H.; Zheng, G.; Jiang, L.; Chang, C.; Tuerhanjiang, L. Disentangling the relative impacts of climate change and human activities on arid and semiarid grasslands in Central Asia during 1982–2015. Sci. Total Environ. 2019, 653, 1311–1325. [Google Scholar] [CrossRef]
- Batllori, E.; Lloret, F.; Aakala, T.; Anderegg, W.R.L.; Aynekulu, E.; Bendixsen, D.P.; Bentouati, A.; Bigler, C.; Burk, C.J.; Camarero, J.J.; et al. Forest and woodland replacement patterns following drought-related mortality. Proc. Natl. Acad. Sci. USA 2020, 117, 29720–29729. [Google Scholar] [CrossRef] [PubMed]
- Zhang, Y.; Hu, Q.; Zou, F. Spatio-temporal changes of vegetation net primary productivity and its driving factors on the Qinghai-Tibetan Plateau from 2001 to 2017. Remote Sens. 2021, 13, 1566. [Google Scholar] [CrossRef]
- Naeem, S.; Zhang, Y.; Zhang, X.; Tian, J.; Abbas, S.; Luo, L.; Meresa, H.K. Both climate and socioeconomic drivers contribute to vegetation greening of the Loess Plateau. Sci. Bull. 2021, 66, 1160–1163. [Google Scholar] [CrossRef] [PubMed]
- Song, W.; Feng, Y.; Wang, Z. Ecological restoration programs dominate vegetation greening in China. Sci. Total Environ. 2022, 848, 157729. [Google Scholar] [CrossRef]
- Wei, Z.; Du, N.; Yu, W. Land use change and its driving factors in the ecological function area: A case study in the Hedong Region of the Gansu Province, China. J. Arid Land 2024, 16, 71–90. [Google Scholar] [CrossRef]
- Sun, Z.; Wang, J. The 30m-NDVI-based alpine grassland changes and climate impacts in the Three-River Headwaters region on the Qinghai-Tibet Plateau from 1990 to 2018. J. Resour. Ecol. 2022, 13, 186–195. (In Chinese) [Google Scholar] [CrossRef]
- Sun, Q.; Li, B.; Zhou, C.; Li, F.; Zhang, Z.; Ding, L.; Zhang, T.; Xu, L. A systematic review of research studies on the estimation of net primary productivity in the Three-River Headwater Region, China. J. Geogr. Sci. 2017, 27, 161–182. [Google Scholar] [CrossRef]
- Liu, X.; Zhang, J.; Zhu, X.; Pan, Y.; Liu, Y.; Zhang, D.; Lin, Z. Spatiotemporal changes in vegetation coverage and its driving factors in the Three-River Headwaters Region during 2000–2011. J. Geogr. Sci. 2014, 24, 288–302. [Google Scholar] [CrossRef]
- Liu, J.; Ji, Y.-H.; Zhou, G.-S.; Zhou, L.; Lyu, X.-M.; Zhou, M.-Z. Temporal and spatial variations of net primary productivity (NPP) and its climate driving effect in the Qinghai-Tibet Plateau, China from 2000 to 2020. J. Appl. Ecol. 2022, 33, 1533–1538. [Google Scholar] [CrossRef]
- Zhou, W.; Wang, T.; Xiao, J.; Wang, K.; Yu, W.; Du, Z.; Huang, L.; Yue, T. Grassland productivity increase was dominated by climate in Qinghai-Tibet Plateau from 1982 to 2020. J. Clean. Prod. 2024, 434, 140144. [Google Scholar] [CrossRef]
- Gao, X.; Lin, K.; Liu, M.; Dong, C.; Yao, Z.; Liu, Z.; Xiao, M.; Xie, X.; Huang, L. Dynamic changes in permafrost distribution over China and their potential influencing factors under climate warming. Sci. Total Environ. 2023, 874, 162624. [Google Scholar] [CrossRef]
- Hu, J.; Nan, Z.; Ji, H.; Zhao, S.; Ou, M. Effect of permafrost degradation on grassland net primary productivity in Qinghai–Tibet Plateau. Environ. Res. Lett. 2024, 19, 104051. [Google Scholar] [CrossRef]
- Zhang, J.; Ren, Z. Spatiotemporal pattern of net primary productivity in the Hanjiang River Basin. Acta Ecol. Sin. 2016, 36, 7667–7677. [Google Scholar] [CrossRef][Green Version]
- Yu, W.; Zhou, Y.; Wei, Z.; Yao, X.; Zhang, Y. Dynamic mechanisms of temperate grassland responses to climate change and human activities in the Qinghai Plateau. Geogr. Res. 2024, 43, 1941–1957. (In Chinese) [Google Scholar]
- Li, H.; Yan, L.; Wen, T.; Feng, X. Characteristics of climate change and its impact assessment in the Three-River regions. Plateau Meteorol. 2022, 41, 306–316. (In Chinese) [Google Scholar]
- Xiong, X.; Li, C.; Chen, J. Topographic regulatory role of vegetation response to climate change. Acta Geogr. Sin. 2023, 78, 2256–2270. (In Chinese) [Google Scholar]
- Zhang, W.; Jin, H.; Shao, H.; Li, A.; Li, S.; Fan, W. Temporal and spatial variations in the leaf area index and its response to topography in the Three-River Source Region, China from 2000 to 2017. ISPRS Int. J. Geo-Inf. 2021, 10, 33. [Google Scholar] [CrossRef]
- Gao, Q.; Wan, Y.; Li, Y.; Guo, Y.; Ganjurjav; Qin, X.; Jiangcun, W.; Wang, B. Effects of topography and human activity on the net primary productivity (NPP) of alpine grassland in northern Tibet from 1981 to 2004. Int. J. Remote Sens. 2013, 34, 2057–2069. [Google Scholar] [CrossRef]
- Liu, Y.; Yang, Y.; Wang, Q.; Khalifa, M.; Zhang, Z.; Tong, L.; Li, J.; Shi, A. Assessing the dynamics of grassland net primary productivity in response to climate change at the global scale. Chin. Geogr. Sci. 2019, 29, 725–740. [Google Scholar] [CrossRef]
- Peng, S.; Ding, Y.; Liu, W.; Li, Z. 1 km monthly temperature and precipitation dataset for China from 1901 to 2017. Earth Syst. Sci. Data 2019, 11, 1931–1946. (In Chinese) [Google Scholar] [CrossRef]
- Wang, C.; Wang, J.; Naudiyal, N.; Wu, N.; Cui, X.; Wei, Y.; Chen, Q. Multiple effects of topographic factors on spatio-temporal variations of vegetation patterns in the three parallel rivers region, Southeast Qinghai-Tibet Plateau. Remote Sens. 2021, 14, 151. [Google Scholar] [CrossRef]
- Lefcheck, J.S.; Freckleton, R. piecewiseSEM: Piecewise structural equation modelling in R for ecology, evolution, and systematics. Methods Ecol. Evol. 2016, 7, 573–579. [Google Scholar] [CrossRef]
- Yang, C.-Y.; Ding, Y.; Ma, F.-L.; Zhou, H.-K.; Wang, X.-L.; Zhang, Q.; Liu, X.-W.; Mutalifu, W.; Guo, L. Climate change affects plant aboveground biomass by regulating the growth periods in alpine grasslands of the Tibetan Plateau, China. J. Appl. Ecol. 2024, 35, 1260–1268. [Google Scholar] [CrossRef]
- Piao, S.L.; Fang, J.Y. Terrestrial net primary production and its spatio-temporal patterns in Qinghai-Xizang Plateau, China during 1982–1999. J. Nat. Resour. 2002, 17, 373–380. [Google Scholar] [CrossRef]
- Liu, F.; Zeng, Y.N. Spatial-temporal change in vegetation net primary productivity and its response to climate and human activities in Qinghai Plateau in the past 16 years. Acta Ecol. Sin. 2019, 39, 1528–1540. (In Chinese) [Google Scholar]
- Zhang, Y.; Qi, W.; Zhou, C.; Ding, M.; Liu, L.; Gao, J.; Bai, W.; Wang, Z.; Zheng, D. Spatial and temporal variability in the net primary production (NPP) of alpine grassland on Tibetan Plateau from 1982 to 2009. Acta Geogr. Sin. 2013, 68, 1197–1211. [Google Scholar] [CrossRef]
- CMA Climate Change Centre. Blue Book on Climate Change in China (2022); Science Press: Beijing, China, 2022. [Google Scholar]
- Renwick, K.M.; Rocca, M.E. Temporal context affects the observed rate of climate-driven range shifts in tree species. Glob. Ecol. Biogeogr. 2015, 24, 44–51. [Google Scholar] [CrossRef]
- Harsch, M.A.; Hulme, P.E.; McGlone, M.S.; Duncan, R.P. Are treelines advancing? A global meta-analysis of treeline response to climate warming. Ecol. Lett. 2009, 12, 1040–1049. [Google Scholar] [CrossRef]
- Han, Z.; Song, W.; Deng, X.; Xu, X. Grassland ecosystem responses to climate change and human activities within the Three-River Headwaters region of China. Sci. Rep. 2018, 8, 9079. [Google Scholar] [CrossRef] [PubMed]
- Rumpf, S.B.; Hülber, K.; Zimmermann, N.E.; Dullinger, S.; Lenoir, J. Elevational rear edges shifted at least as much as leading edges over the last century. Glob. Ecol. Biogeogr. 2019, 28, 533–543. [Google Scholar] [CrossRef]
- Liu, M.; Zhai, H.; Zhang, X.; Dong, X.; Hu, J.; Ma, J.; Sun, W. Time-lag and accumulation responses of vegetation growth to average and extreme precipitation and temperature events in China between 2001 and 2020. Sci. Total Environ. 2024, 945, 174084. [Google Scholar] [CrossRef]
- White, A.B.; Kumar, P.; Tcheng, D. A data mining approach for understanding topographic control on climate-induced inter-annual vegetation variability over the United States. Remote Sens. Environ. 2005, 98, 1–20. [Google Scholar] [CrossRef]
- Pepin, N.; Bradley, R.S.; Diaz, H.F.; Baraer, M.; Caceres, E.B.; Forsythe, N.; Fowler, H.; Greenwood, G.; Hashmi, M.Z.; Liu, X.D.; et al. Elevation-dependent warming in mountain regions of the world. Nat. Clim. Change 2015, 5, 424–430. [Google Scholar] [CrossRef]
- Xu, M.; Li, X.; Liu, M.; Shi, Y.; Zhou, H.; Zhang, B.; Yan, J. Spatial variation patterns of plant herbaceous community response to warming along latitudinal and altitudinal gradients in mountainous forests of the Loess Plateau, China. Environ. Exp. Bot. 2020, 172, 103983. [Google Scholar] [CrossRef]
- Bai, T.; Liu, J.; Liu, H.; Ni, F.; Han, X.; Qiao, X.; Sun, X. Elevation-dependent patterns of temporally asymmetrical vegetation response to climate in an alpine basin on the Qinghai-Tibet Plateau. Ecol. Indic. 2024, 159, 111736. [Google Scholar] [CrossRef]
- An, H.; Zhao, Y.; Ma, M. Precipitation controls seed bank size and its role in alpine meadow community regeneration with increasing altitude. Glob. Change Biol. 2020, 26, 5767–5777. [Google Scholar] [CrossRef]
- Abdalla, K.; Schierling, L.; Sun, Y.; Schuchardt, M.A.; Jentsch, A.; Deola, T.; Wolff, P.; Kiese, R.; Lehndorff, E.; Pausch, J.; et al. Temperature sensitivity of soil respiration declines with climate warming in subalpine and alpine grassland soils. Biogeochemistry 2024, 167, 1453–1467. [Google Scholar] [CrossRef]
- Guan, Y.; Liu, J.; Cui, W.; Chen, D.; Zhang, J.; Lu, H.; Maeda, E.E.; Zeng, Z.; Beck, H.E. Elevation regulates the response of climate heterogeneity to climate change. Geophys. Res. Lett. 2024, 51, e2024GL109483. [Google Scholar] [CrossRef]
- Tao, J.; Zhang, Y.; Dong, J.; Fu, Y.; Zhu, J.; Zhang, G.; Jiang, Y.; Tian, L.; Zhang, X.; Zhang, T.; et al. Elevation-dependent relationships between climate change and grassland vegetation variation across the Qinghai-Xizang Plateau. Int. J. Climatol. 2015, 35, 1638–1647. [Google Scholar] [CrossRef]
- Zhang, L.; Kuczera, G.; Kiem, A.S.; Willgoose, G. Using paleoclimate reconstructions to analyse hydrological epochs associated with Pacific decadal variability. Hydrol. Earth Syst. Sci. 2018, 22, 6399–6414. [Google Scholar] [CrossRef]
- Bochet, E.; García-Fayos, P. Factors controlling vegetation establishment and water erosion on motorway slopes in Valencia, Spain. Restor. Ecol. 2004, 12, 166–174. [Google Scholar] [CrossRef]


Disclaimer/Publisher’s Note: The statements, opinions and data contained in all publications are solely those of the individual author(s) and contributor(s) and not of MDPI and/or the editor(s). MDPI and/or the editor(s) disclaim responsibility for any injury to people or property resulting from any ideas, methods, instructions or products referred to in the content. |
© 2025 by the authors. Licensee MDPI, Basel, Switzerland. This article is an open access article distributed under the terms and conditions of the Creative Commons Attribution (CC BY) license (https://creativecommons.org/licenses/by/4.0/).