Article

A Microwave Vision-Enhanced Environmental Perception Method for the Visual Navigation of UAVs

1
Information and Navigation School, Air Force Engineering University, Xi’an 710077, China
2
Unit 94860 of PLA, Nanjing 210008, China
3
Air Defense and Antimissile School, Air Force Engineering University, Xi’an 710051, China
*
Author to whom correspondence should be addressed.
Remote Sens. 2025, 17(12), 2107; https://doi.org/10.3390/rs17122107
Submission received: 9 April 2025 / Revised: 5 June 2025 / Accepted: 18 June 2025 / Published: 19 June 2025
(This article belongs to the Section Remote Sensing Image Processing)

Abstract

Visual navigation technology holds significant potential for applications involving unmanned aerial vehicles (UAVs). However, the inherent spectral limitations of optical-dependent navigation systems prove particularly inadequate for high-altitude long-endurance (HALE) UAV operations, as they are fundamentally constrained in maintaining reliable environment perception under conditions of fluctuating illumination and persistent cloud cover. To address this challenge, this paper introduces microwave vision to assist optical vision for environmental measurement and proposes a novel microwave vision-enhanced environmental perception method. In particular, the richness of perceived environmental information can be enhanced by SAR and optical image fusion processing in the case of sufficient light and clear weather. In order to simultaneously mitigate inherent SAR speckle noise and address existing fusion algorithms’ inadequate consideration of UAV navigation-specific environmental perception requirements, this paper designs a SAR Target-Augmented Fusion (STAF) algorithm based on the target detection of SAR images. On the basis of image preprocessing, this algorithm utilizes constant false alarm rate (CFAR) detection along with morphological operations to extract critical target information from SAR images. Subsequently, the intensity–hue–saturation (IHS) transform is employed to integrate this extracted information into the optical image. The experimental results show that the proposed microwave vision-enhanced environmental perception method effectively utilizes microwave vision to shape target information perception in the electromagnetic spectrum and enhance the information content of environmental measurement results. The unique information extracted by the STAF algorithm from SAR images can effectively enhance the optical images while retaining their main attributes. This method can effectively enhance the environmental measurement robustness and information acquisition ability of the visual navigation system.

Graphical Abstract

1. Introduction

Visual navigation plays a pivotal role in advancing the autonomy and intelligence of future unmanned aerial vehicle (UAV) navigation systems [1,2,3,4]. In recent years, UAV systems have evolved into multi-mission platforms spanning micro-scale to high-altitude long-endurance (HALE) configurations, achieving full-domain airspace coverage. Future operational demands are anticipated to involve increasingly complex and uncertain environments, particularly for HALE UAVs that must maintain prolonged autonomous flight at altitudes approaching 10,000 m. These missions entail extensive operational ranges, day–night transition operations, and inevitable challenges from cloud/fog occlusion [5]. Current visual navigation systems predominantly rely on optical sensors for environmental measurement. However, such light-dependent sensing modalities exhibit heightened sensitivity to illumination variations and meteorological obstructions, rendering existing vision-based systems inadequate for achieving robust environmental perception under these conditions.
HALE UAVs are typically equipped with Synthetic Aperture Radar (SAR) during mission operations [6]. Currently, SAR is commonly integrated with Inertial Navigation Systems (INS) as an auxiliary means [7,8], utilizing SAR-derived range and Doppler information to correct INS errors. However, as a microwave sensor, SAR image information remains underutilized, with limited research reported on its application in vision-based navigation. In 2018, building upon insights from human optical vision mechanisms and computer vision image processing technologies, the theoretical framework of “microwave vision” was progressively proposed [9,10,11]. This approach integrates electromagnetic scattering principles and radar imaging mechanisms, enabling target information perception across the electromagnetic spectrum. Microwave vision can compensate for the limitations of optical sensing under variable lighting and cloudy/foggy conditions, thereby enhancing the robustness of environmental perception. Furthermore, even under ample illumination and clear weather, microwave vision can acquire microwave-band target characteristics, thereby achieving enhanced environmental perception outcomes.
Under conditions of ample illumination and clear weather, whether conducting real-time environmental measurements through onboard sensors during UAV operations or performing offline environmental mapping for three-dimensional (3D) model reconstruction, integrating microwave vision’s electromagnetic spectrum-based target perception with conventional optical vision can effectively leverage multimodal visual information, thereby achieving enhanced environmental perception outcomes. As the primary output of visual sensing systems, imagery serves as the common medium for both optical and microwave environmental perception. The cross-modal fusion between SAR and optical images enables microwave vision to augment optical vision’s environmental information acquisition capabilities. Traditional image fusion methods can be used to fuse SAR and optical images. These methods include component substitution methods [12,13,14], multiscale decomposition methods [15,16,17], and hybrid methods [18,19,20]. In recent years, improved methods specifically tailored for the fusion of SAR and optical images have emerged, often leveraging advanced algorithms that can effectively suppress noise and preserve essential features [21,22]. Moreover, the integration of deep learning techniques has significantly enhanced feature extraction capabilities, enabling the resolution of scene-specific applications such as land classification [23] and cloud removal [24].
Prior to fusion processing, SAR images typically require denoising treatment. Different denoising methods exhibit varying degrees of detail preservation, making them applicable to different levels of image fusion. Consequently, the selection of SAR image preprocessing methods becomes particularly critical in fusion frameworks [25]. However, inherent speckle noise generated during SAR imaging inevitably impacts fusion performance, yet current fusion methods insufficiently account for this issue. Furthermore, while SAR–optical image fusion serves as a universal methodology with broad applicability across domains, its implementation as a technical approach for microwave vision-enhanced environmental perception in UAV navigation must address specific operational requirements, as follows:
(1)
Preservation of optical image characteristics: The optical component of the benchmark must be preserved to the greatest extent possible. This is essential because the optical image characteristics of the benchmark are crucial for accurate matching with video keyframes.
(2)
Target information extraction from SAR images: The fusion process should focus on extracting and integrating the unique target information present in the SAR image into the optical image. This means that the fusion technique should avoid adding redundant or excessive information that could complicate the fusion result.
By addressing the limitations in existing methods and fulfilling these two demands, the fusion of SAR and optical images can be optimized for UAV visual navigation applications. This emphasizes the importance of a targeted fusion strategy that aligns with the specific requirements of UAV visual navigation tasks. Hence, this paper proposes an SAR Target-Augmented Fusion (STAF) algorithm that integrates SAR image object detection with optical data processing, where the STAF algorithm encompasses three primary steps: constant false alarm rate (CFAR) detection, morphological operations, and intensity–hue–saturation (IHS) transform. By leveraging the complementary strengths of both optical and SAR images, the proposed method significantly enhances environmental perception capabilities with microwave vision.
The main contributions of our work are as follows:
  • It is proposed to introduce microwave vision to assist optical vision to measure the environment, overcome the influence of light and cloudy weather changes, and enhance the robustness of environmental information. Moreover, the enhancement of environmental information perception by microwave vision is realized by using multimodal visual information through SAR and optical image fusion processing under conditions of sufficient light and clear weather.
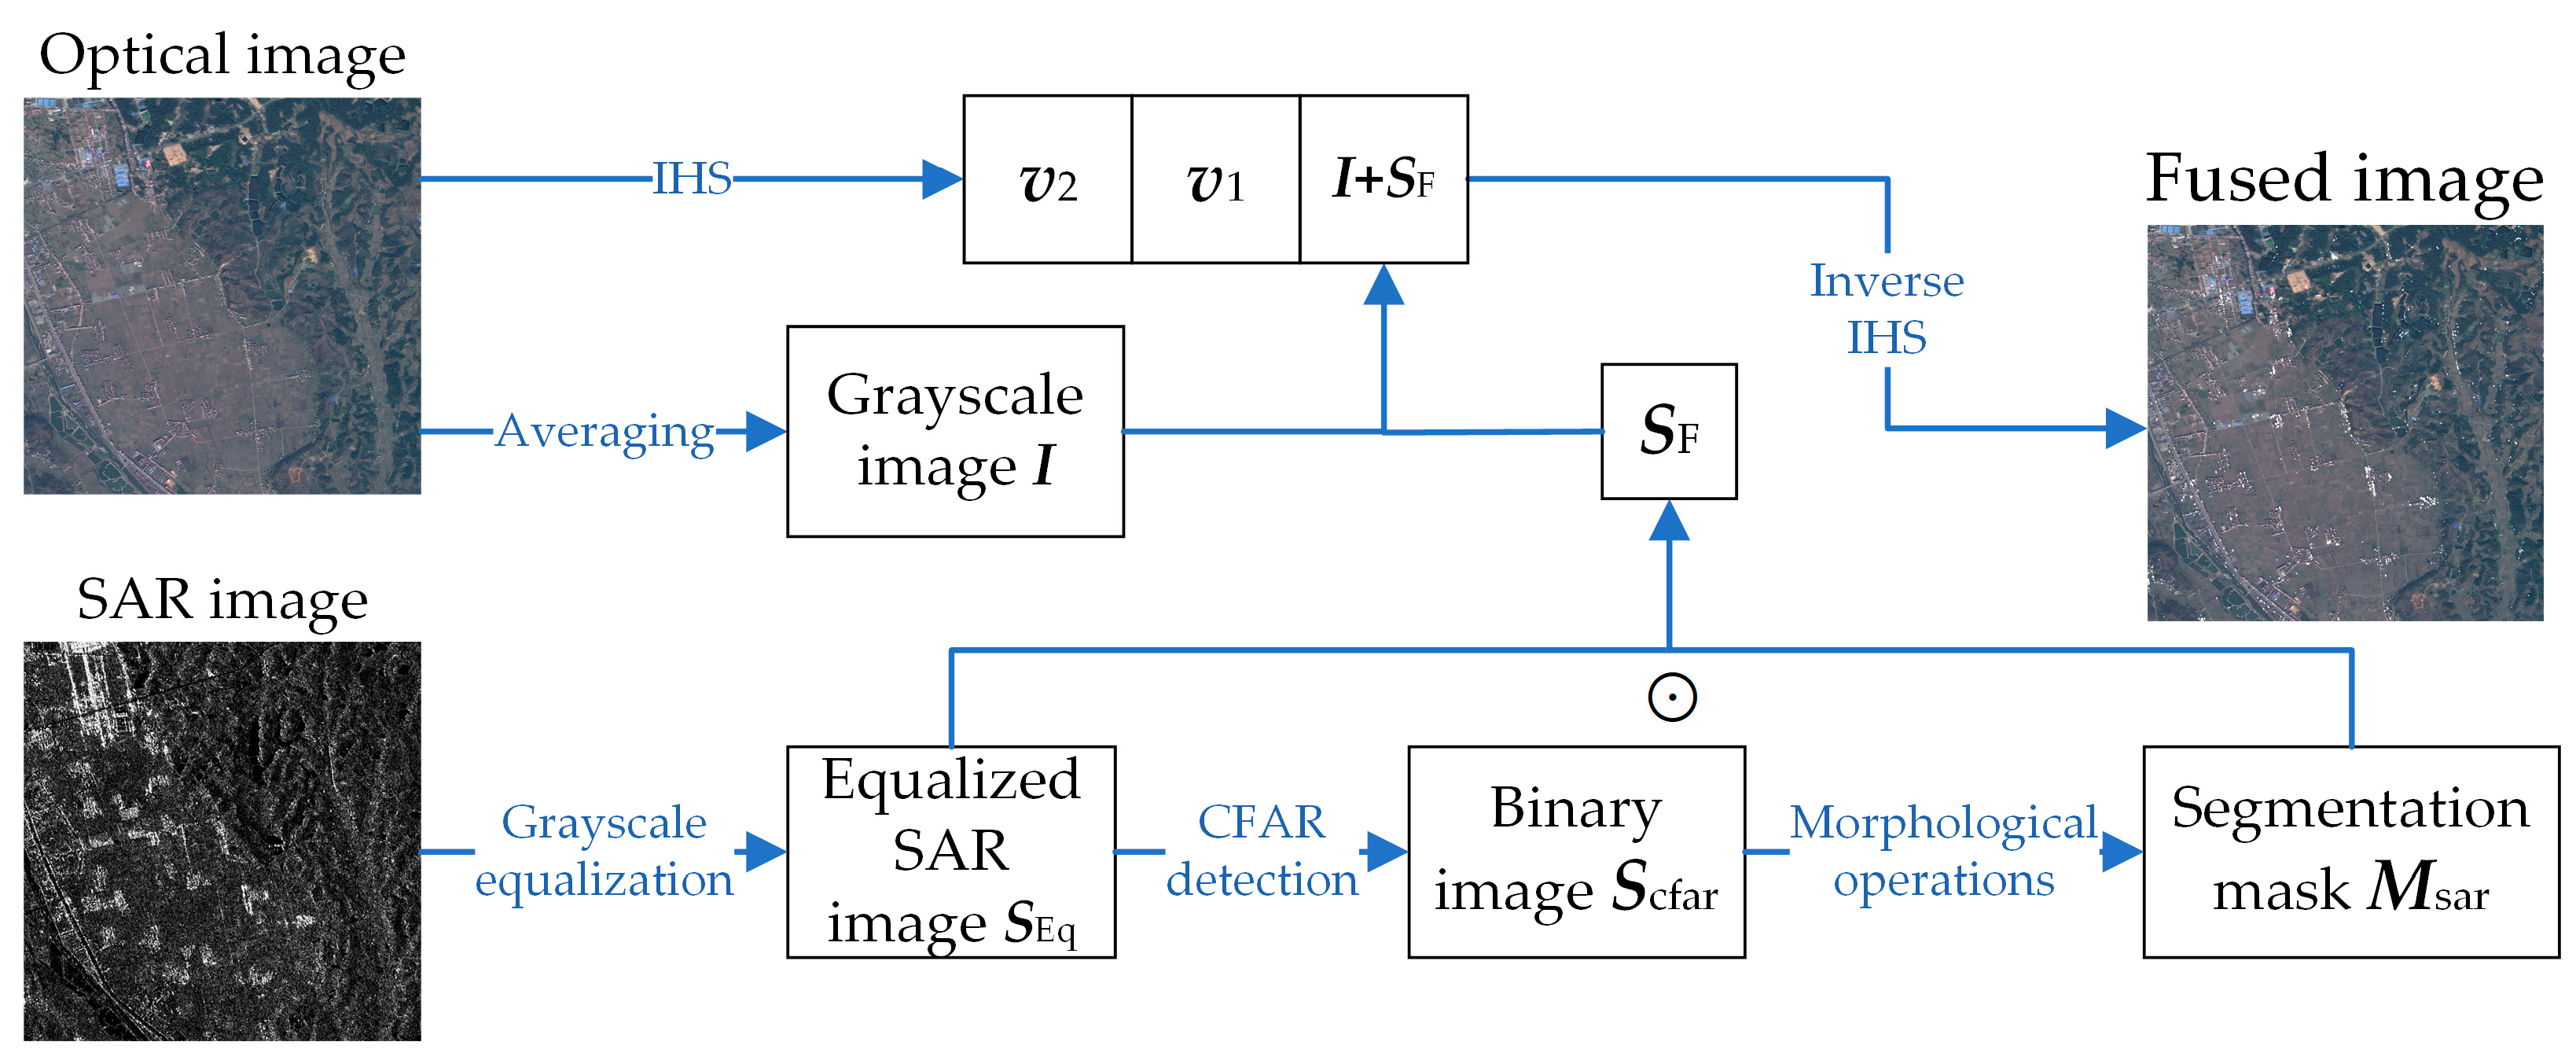
  • The STAF algorithm based on the target detection of SAR images is proposed to extract useful target features of SAR images using CFAR detection and morphological processing to overcome the effect of speckle noise of SAR images. And the SAR and optical images are fused by IHS transform to obtain the microwave vision-enhanced environmental information perception results.
This paper is organized as follows: Section 2 systematically reviews and critically analyzes current research in related domains. Section 3 presents the proposed STAF algorithm, detailing its core architecture and operational workflow. Section 4 describes experimental designs incorporating multi-sensor datasets, followed by comprehensive result analysis validating the method’s efficacy. Section 5 concludes with key findings and future research directions.

2. Related Works

2.1. SAR-Based Navigation Techniques

The application of SAR-based navigation techniques first emerged in missile guidance systems [26,27,28]. A significant development occurred in 2011, when Greco et al. [29,30,31] proposed the SAR-based Augmented Integrity Navigation Architecture (SARINA) system for UAV and missile platforms. This innovative system utilizes 2D SAR and 3D InSAR imaging, correlating them with onboard landmark databases and Digital Elevation Model (DEM) data, respectively, to compensate for airborne platform drift caused by IMU errors and GPS integrity limitations. Subsequent research by Nitti et al. [32] demonstrated the practical viability of SAR-assisted UAV navigation. Their study revealed that medium-altitude long-endurance (MALE) UAVs could achieve position estimation with ±12 m accuracy using this SAR-based backup system. The error correction mechanism for INS through SAR integration requires a sophisticated fusion of navigation parameters. This process combines SAR-derived measurements (distance, angle) and geolocation data from matching algorithms with INS outputs through advanced filtering techniques. Gao et al. [33] developed a robust adaptive filtering method for SINS/SAR integration that dynamically adjusts to both system state noise and observation noise interference. Zhong et al. [34] introduced a novel quaternion-based method and developed an adaptive unscented particle filtering (UPF) algorithm for optimal data fusion in SINS/SAR integrated navigation systems. This was followed by Gao et al. [35]’s random weighting method for estimating the error characteristics of an integrated SINS/GPS/SAR navigation system. Subsequent critical analysis by Chang et al. [36] identified improvement opportunities in the UPF algorithm’s quaternion averaging implementation.
While previous advancements primarily focused on filtering algorithms and error modeling, complementary research streams have explored navigation parameter extraction through advanced image matching techniques. Toss et al. [37] demonstrated a geo-registration method that aligns SAR imagery with 3D terrain maps, enabling the precise estimation of platform position, velocity, and orientation parameters for INS correction. Chinese researchers have made significant contributions to sensor fusion methodologies. Lu et al. [38] developed an INS/SAR deep integration framework by incorporating SAR pseudo-range and pseudo-range rate errors as independent state variables. Their comprehensive analysis using Geometric Dilution of Precision (GDOP) metrics [39] systematically evaluated the impacts of altitude assistance and ground control point distribution on system observability and positioning accuracy. Jiang et al. [40] proposed an InSAR/INS integration system that overcomes three critical limitations of conventional approaches: cross-range resolution constraints, seasonal matching variability, and terrain adaptability issues. Their interferogram matching technique achieved altitude and position inversing with high precision. Warsaw University of Technology’s research team has produced multiple innovations in image-based navigation. Markiewicz et al. [41] introduced a novel sensor-agnostic displacement estimation technique combining Affine Scale-Invariant Feature Transform (ASIFT) with Structure from Motion (SfM) to quantify georeferencing errors. Gambrych et al. [42] further developed a real-time trajectory correction system using their Cumulative Minimum Square Distance Matching (CMSDM) for altitude estimation. Addressing practical implementation challenges, recognizing the fundamental importance of reference data quality, Ren et al. [43] automated SAR reference image generation through polynomial-warped DEM projections. This simulation-to-reality mapping technique significantly enhances scene matching reliability for complex terrain.
Currently, SAR is commonly integrated with Inertial Navigation Systems (INS) as an auxiliary means. However, as a microwave sensor, SAR image information remains underutilized, with limited research reported on its application in visual navigation.

2.2. SAR and Optical Image Fusion

While traditional fusion methods [12,13,14,15,16,17,18,19,20] continue to serve as foundational approaches of SAR and optical image fusion, researchers have conducted substantial research to better exploit complementary feature information of SAR and optical images [21,22,44,45,46,47,48,49,50]. Kong et al. [44] developed a preservation strategy for optical spectral information and SAR texture features through adaptive component fusion. Wu et al. [45] advanced this paradigm by combining SAR-derived texture features with wavelet-transformed optical high-frequency details through hybrid decomposition. Notably, Li et al. [21] enhanced edge utilization through multi-scale morphological gradients in their fusion framework, significantly improving correlation while minimizing spectral distortion. A critical limitation persists across these conventional approaches: their inability to mitigate SAR noise interference in visual perception. Addressing this challenge, Chu et al. [46] implemented NSST-based noise suppression in SAR imagery, significantly enhancing output clarity. To combat spectral–spatial distortions, researchers developed a gain injection strategy [22] that preserves critical multi-scale information through constrained coefficient modification. Subsequently, Fu et al. [47] introduced phase-consistent information alignment, effectively addressing nonlinear radiometric discrepancies between modalities. A paradigm shift emerged from maximal information injection to practical usability optimization. Shao et al. [48] employed saliency detection mechanisms to use a new pixel saliency map (PSM) instead of the SAR image, preserving the spectral and spatial information. Gong et al. [49] designed an adaptive multiscale Gaussian coprocessor filter that simultaneously suppresses texture noise and preserves edge fidelity.
Recent advances in deep learning have demonstrated remarkable potential in addressing application-specific challenges for SAR and optical image fusion, primarily attributed to its superior feature extraction capabilities. Adrian et al. [23] developed a 3D U-Net architecture that integrates optical spectral data with SAR texture features, achieving enhanced classification accuracy for diverse crop types. Similarly, Chen et al. [50] established a self-supervised fusion framework utilizing multi-view contrast loss training at the super-pixel level to optimize land cover mapping precision. In another approach, Duan et al. [24] proposed a feature pyramid network (FPNet) that effectively reconstructs missing optical information through low sampling strategies that preserve critical details while reducing computational complexity. Building upon generative models, Grohnfeldt et al. [51] designed a conditional GAN architecture for reconstructing cloud-free optical imagery using SAR inputs. Gao et al. [52] further advanced this paradigm by synergizing CNN-based image transformation with GAN fusion principles to generate synthetic optical images resilient to cloud and fog interference. Complementing these efforts, Ye et al. [12] developed an unsupervised fusion network incorporating structure–texture decomposition, successfully maintaining textural details while enhancing structural integrity in fused outputs.
However, two critical challenges persist: First, the scarcity of high-quality fused datasets leads to subjective loss function design and inconsistent performance across different data domains [53]. Second, despite these advancements, current SAR–optical fusion methodologies remain inadequate for meeting the stringent requirements of UAV visual navigation systems.

3. Proposed Method

3.1. Microwave Vision-Enhanced Environment Perception Strategy

HALE UAVs relying solely on traditional light vision will face three situations during autonomous flight and mission execution: first, at night or under the influence of cloudy and foggy weather, where optical vision measurements cannot produce effective environmental images; second, during the daytime when there is sufficient light but obstruction from clouds, where optical vision measurements can produce partially missing images; and third, in the case of sufficient light and clear weather, where optical vision measurements can produce ideal images. For the above three cases, the corresponding microwave vision-enhanced environment perception strategy is designed as follows:
(1)
When the image obtained by optical vision measurement cannot effectively characterize the environment and extract useful feature information, the SAR image obtained by microwave vision measurement is used as the result of environment measurement, and the features are extracted from it to be used as the data source for subsequent visual navigation;
(2)
When the image obtained by the optical vision measurement is partially missing due to cloud obscuration, the SAR image obtained by the microwave vision measurement is utilized to reconstruct the missing information of the optical image to generate a complete image without clouds;
(3)
In the case where an ideal image is obtained from the optical vision measurement, microwave vision-enhanced environmental information perception is realized through the fusion processing of SAR and optical images, utilizing the complementary nature of the feature information of the SAR and the optical image.
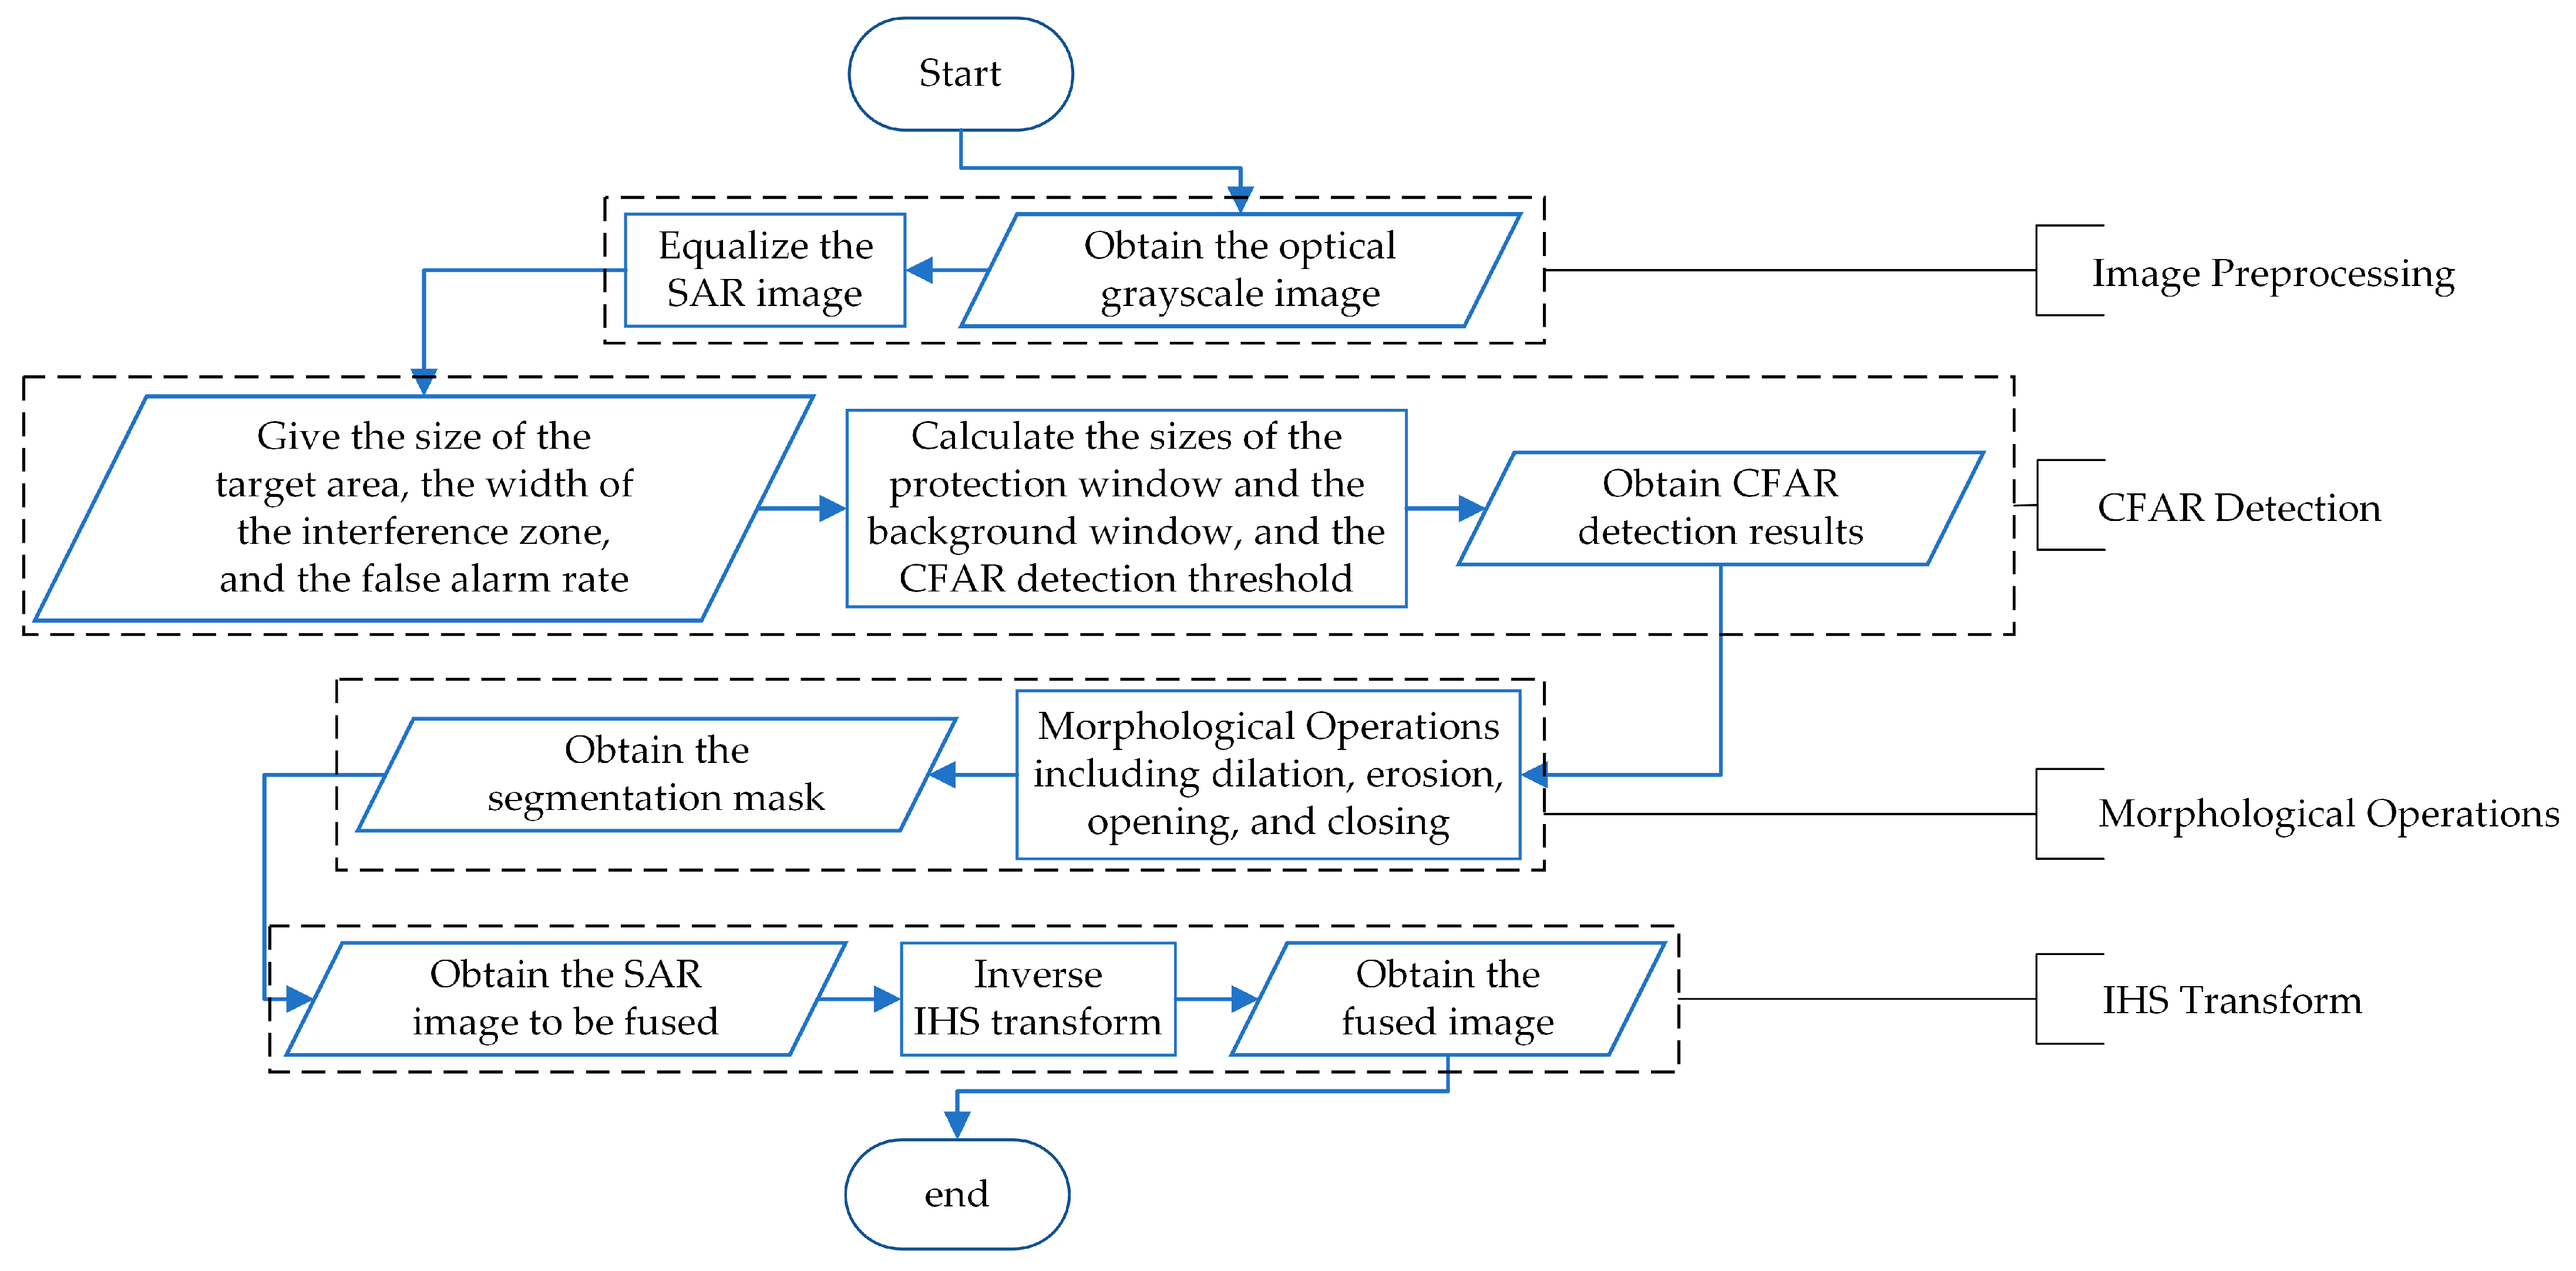
In particular, a new SAR and optical image fusion algorithm, the STAF algorithm, is designed for the third case to further realize microwave vision-enhanced environmental perception. The algorithm can overcome the influence of speckle noise of SAR images and can extract complementary information from SAR images on the basis of retaining the main features of optical images, realizing the enhancement of microwave vision to the environmental information of optical vision measurement. In this section, we provide a detailed description of the proposed STAF algorithm framework, illustrated in Figure 1.

3.2. STAF Algorithm

The STAF algorithm encompasses four primary steps: image preprocessing, CFAR detection, morphological operations, and IHS transform. Here is a detailed breakdown of each step.

3.2.1. Image Preprocessing

The optical image is an RGB color three-channel image, while the SAR image is a single-channel grayscale image. First, the optical image is changed into a single-channel grayscale image using the averaging method, where the average of the three channel components is used as the grayscale value of the image.
Since the spectral grayscale difference between the SAR image and optical image is large, it is necessary to perform grayscale equalization before fusion so that the input image has the same grayscale mean and standard deviation to avoid serious spectral distortion. The SAR image after gray scale equalization can be represented as
S Eq = S μ S σ I σ S + μ I
where μ and σ denote the mean and standard deviation of the image pixel values, S and S Eq are the initial SAR image and the equalized SAR image, respectively, and I is the grayscale-processed optical image. The preprocessed optical images and SAR images are obtained for subsequent processing.

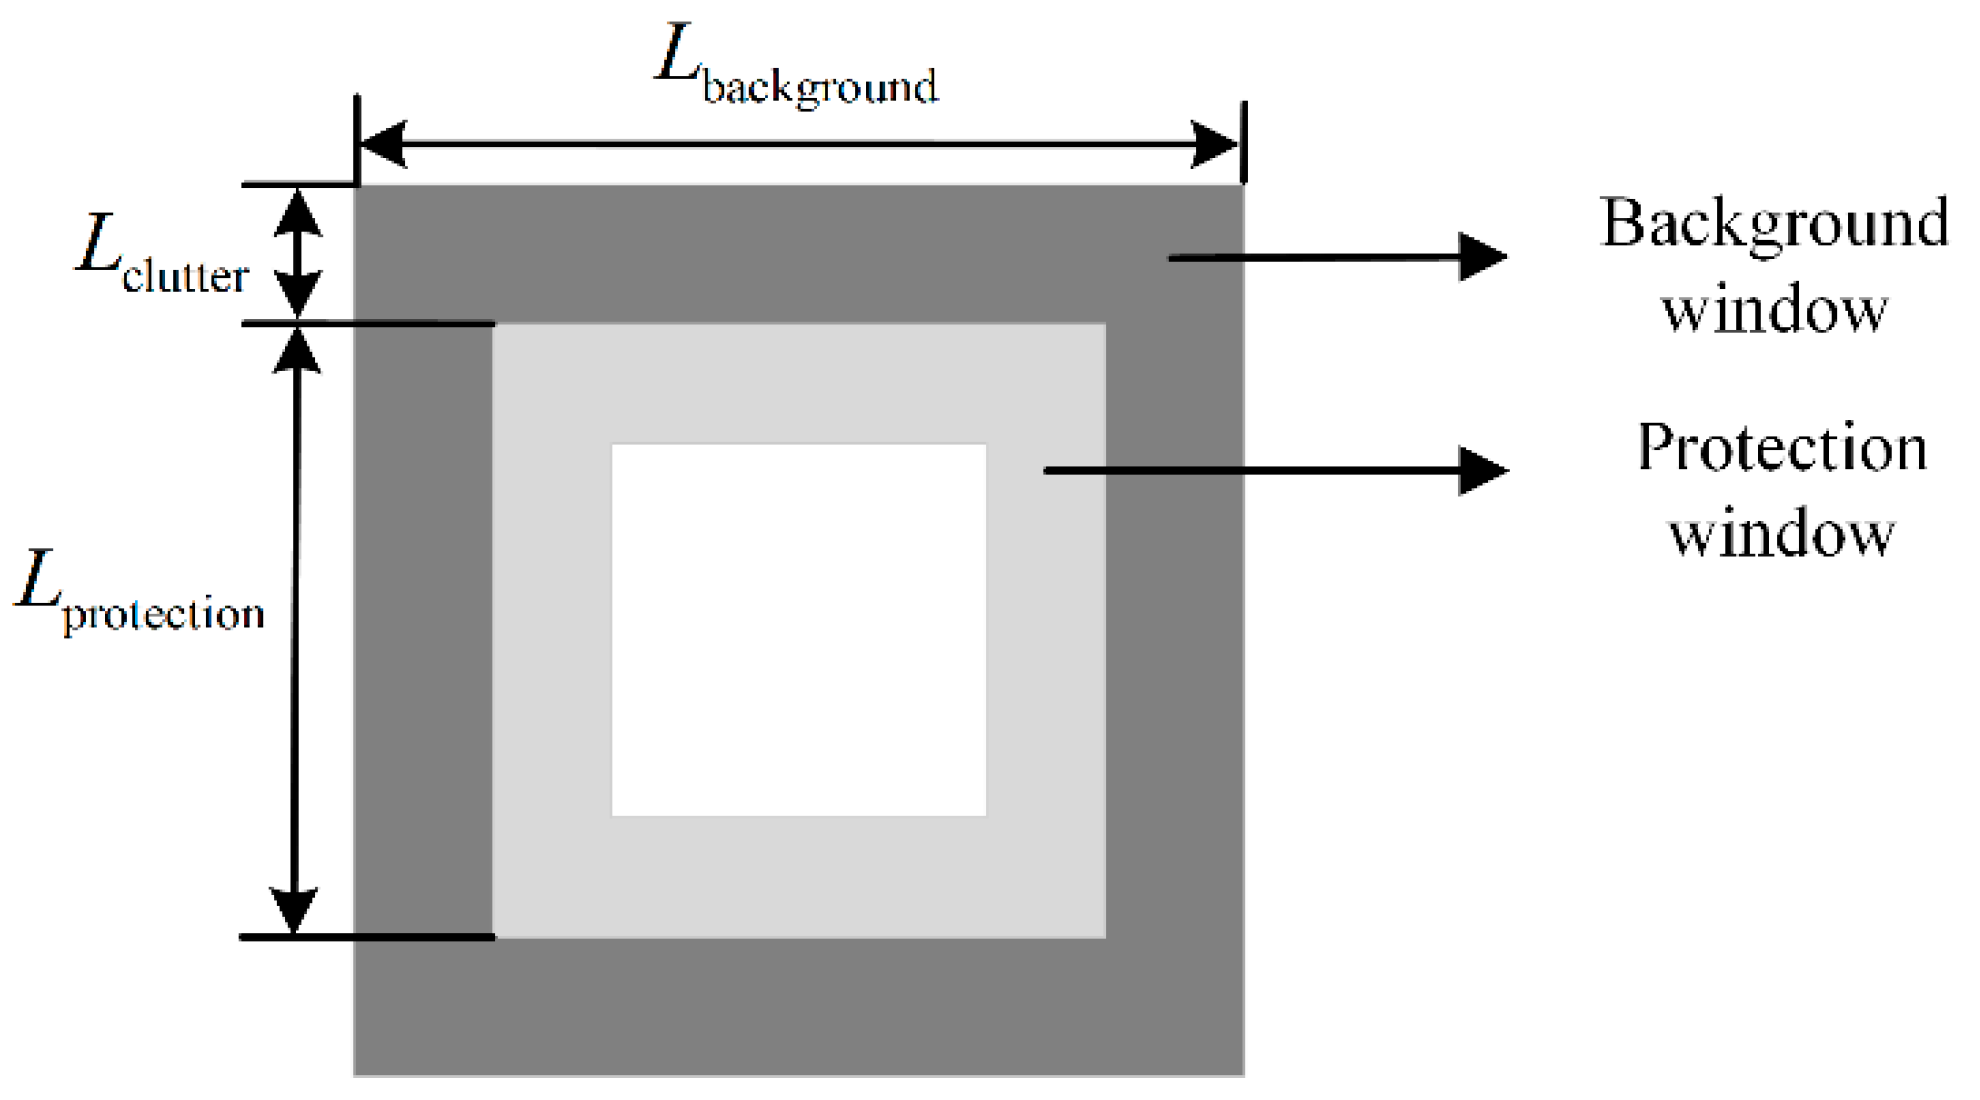
3.2.2. CFAR Detection

CFAR detection [54] is performed on the equalized SAR image. The first step involves designing the CFAR detector and determining its parameters. The CFAR detector systematically traverses all pixels in the SAR image using a sliding window approach. The chosen sliding window is hollow, consisting of two distinct regions—a protection window and a background window, as depicted in Figure 2. The background window is utilized to estimate the background clutter, which is essential for computing the target detection threshold. In contrast, the protection window serves to isolate the target pixels, preventing them from influencing the background clutter count. This separation ensures the accuracy of the background estimation and enhances the reliability of the target detection process.
The sizes of the protection window and the background window are determined by the given size of the target area and the width of the interference area. Assuming that the size of the target area is W × H and the width of the interference zone is L clutter , where W is the width of the target area and H is the height of the target area, then the size of the protection window is L protection , where L protection can be expressed as
L protection = 2 max M , N + 1
The size of the background window is L background , where L background can be expressed as
L background = L protection + 2 L clutter
The CFAR detection threshold is calculated according to the given false alarm rate P fa , and the expression is
ε th = 2 log P fa π 4 π
Assuming that the interference follows a Rayleigh distribution, we can combine the statistical model of Rayleigh distribution to estimate the interference parameters in the area between the protection window and the interference window. This includes calculating both the mean value μ clutter and the standard deviation σ clutter of the interference.
By traversing all the positions of the equalized SAR image with the sliding window method, the interference parameters within the sliding window of the CFAR detector are calculated at any position. Then, the CFAR detection results of the equalized SAR image can be derived according to the following discriminant relationship:
S cfar m , n = 1 S Eq m , n μ clutter m , n σ clutter m , n > ε th 0 S Eq m , n μ clutter m , n σ clutter m , n ε th
where S cfaf m , n and S Eq m , n denote the detection results at the position m , n and the pixel values of the equalized SAR image, respectively, and μ clutter m , n and σ clutter m , n denote the mean and standard deviation of the interference within the sliding window of the CFAR detector at the position m , n , respectively.

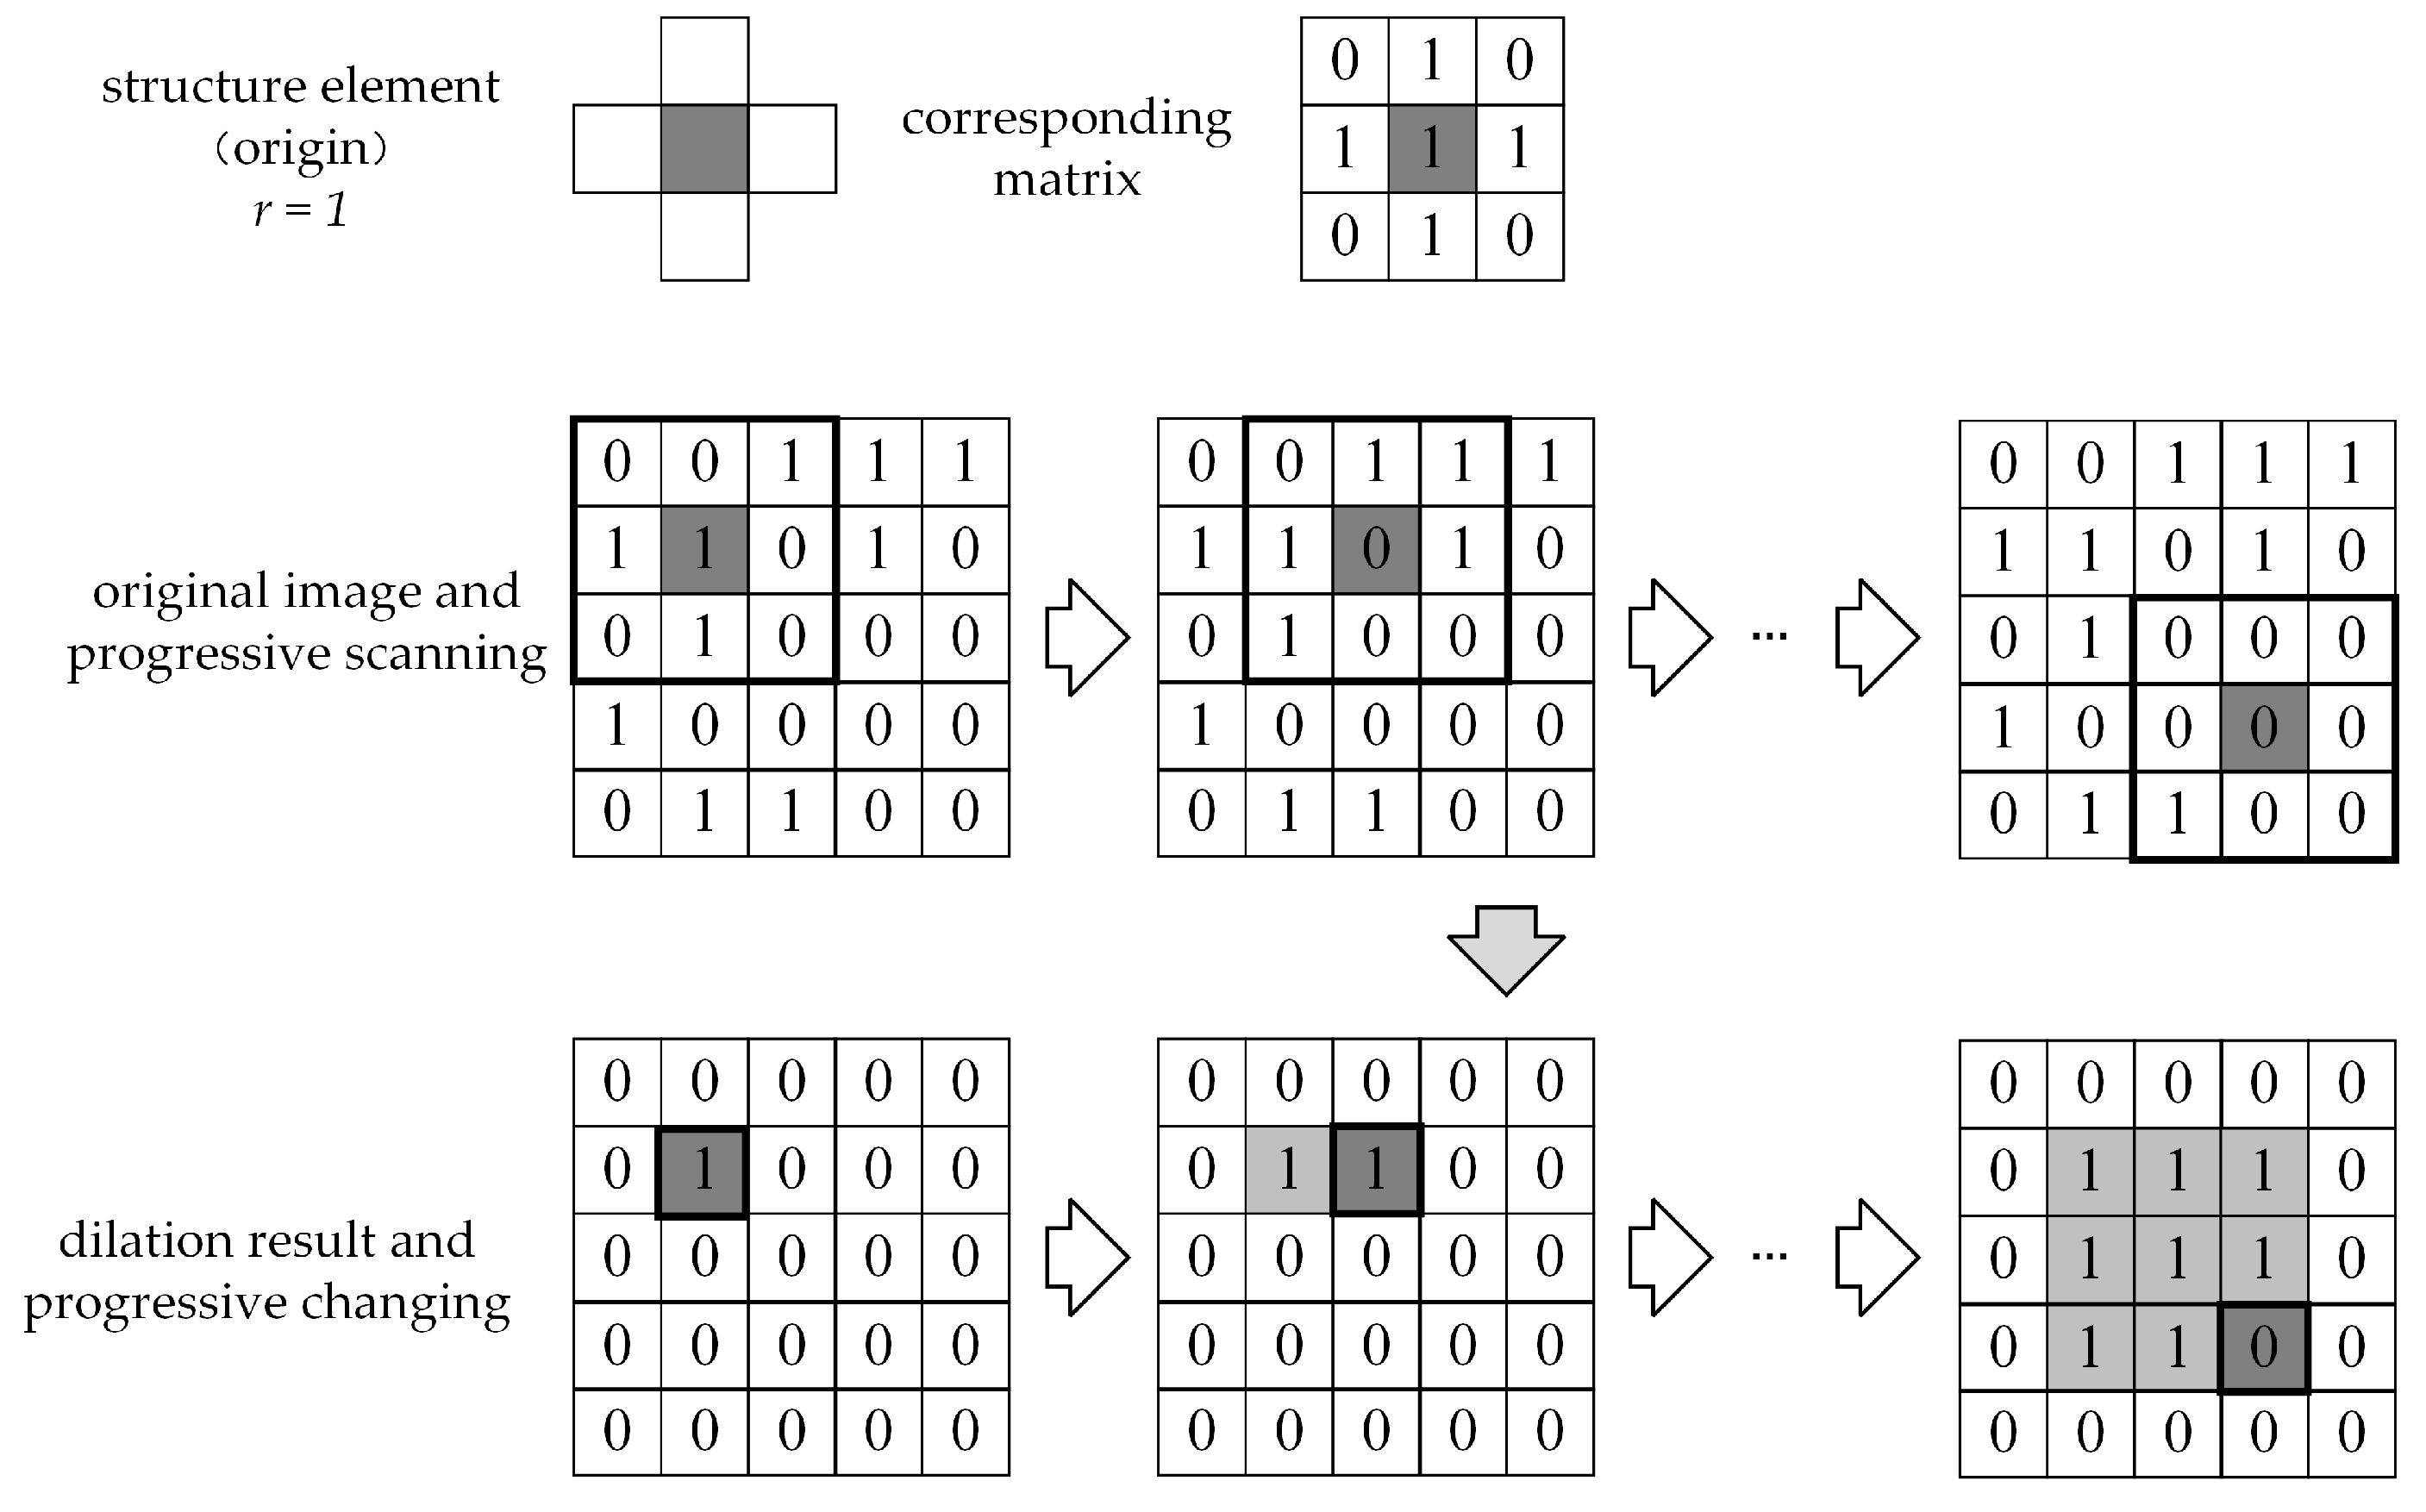
3.2.3. Morphological Operations

Morphological operations are applied to CFAR detection results through the use of structural elements, which help retain large targets in the SAR image while filtering out smaller interferences. Specifically, these operations include dilation, erosion, opening (erosion followed by dilation), and closing (dilation followed by erosion), and are selected based on the shape characteristics of the detected targets and the requirements for subsequent processing.
The dilation operation process involves constructing a circular structural element with a radius of r , the origin of which is the center of the circle; the corresponding matrix is S cir , and its size is 2 r + 1 × 2 r + 1 , and
S cir = 0 0 1 0 0 0 1 1 1 0 1 1 1 1 1 1 1 1 1 0 1 1 1 0 0 0 1 0 0 2 r + 1 × 2 r + 1
The corresponding matrix S cir of the structure element is utilized to perform the dilation operation on the CFAR detection results to fill the black holes caused by the low-value speckle noise in the target region and the missing target pixels. It can be expressed as
S cfaf d = S cfaf S cir = m , n | S cir S cfar m n
where S cfaf d is the dilation result; indicates the dilation operation. When the origin of S cir is translated to the pixel location m , n of S cfaf , if the intersection ( ) of S cir and S cfar m n is not the null set ( ), then the corresponding pixel location m , n of the output image is assigned the value of 1; otherwise, the value is assigned to 0, as depicted in Figure 3.
The process of erosion operation is as follows: the corresponding matrix of the structure element S cir is used for the CFAR detection results. This can be expressed as
S cfaf e = S cfaf S cir = m , n | S cir S cfar m n
where S cfaf e is the erosion result; indicates the erosion operation. When the origin of S cir is translated to the pixel location m , n of S cfaf , if S cir is completely contained ( ) in S cfar m n , then the corresponding pixel location m , n of the output image is assigned the value of 1; otherwise, the value is assigned to 0, as depicted in Figure 4.
The CFAR detection results are processed through morphological operations to generate a binary image S cfaf m , which serves as the segmentation mask for SAR images, denoted as M sar = S cfaf m .

3.2.4. IHS Transform

The IHS transform [55] is utilized to process the optical image and obtain the intensity, hue, and saturation components. The transformation formula is depicted as (9), where R 0 , G 0 , and B 0 represent the R, G, and B components of the optical image, respectively, and I 0 , v 1 , and v 2 are the intensity, hue, and saturation components of the optical image, respectively.
I 0 v 1 v 2 = 1 3 1 3 1 3 2 6 2 6 2 3 1 2 1 2 0 R 0 G 0 B 0
The SAR image to be fused, S F , is extracted from the SAR image with the segmentation mask M sar , and the expression is
S F = S Eq M sar
where denotes the multiplication of S Eq and M sar the corresponding position of the elements.
The SAR image to be fused, S F , is superimposed with the grayscale-processed optical image I to replace the intensity component, and then undergoes the inverse IHS transformation to finally obtain the fused image. The specific expression is
R new G new B new = 1 1 2 1 2 1 1 2 1 2 1 1 2 0 S F + I v 1 v 2 = R 0 + S F G 0 + S F B 0 + S F
In summary, the flowchart of the STAF algorithm is shown in Figure 5.

4. Results

The effectiveness of the microwave vision-enhanced environment perception method proposed in this paper, as well as the superiority of the STAF algorithm, is validated by designing comparative experiments on three datasets: Dataset 1: High-resolution SAR and optical dataset named YYX-OPT-SAR [56]. Dataset 2: Medium-resolution SAR and optical dataset named WHU-OPT-SAR [57]. Dataset 3: Collection of optical and SAR images obtained from UAV aerial photography in an outdoor scene. The experiments were conducted on a computer with an Intel Core i5-12500H CPU and an Intel Iris Xe graphics card. Additionally, this paper aims to facilitate a more thorough experimental verification of algorithms by selecting six state-of-the-art algorithms that are implemented using MATLAB R2023b programming, including Laplacian Pyramid (LP) [58], Dual-Tree Complex Wavelet Transform (DTCWT) [59], Non-Subsampled Contourlet Transform (NSCT) [60], Hybrid Multi-Scale Decomposition (HMSD) [61], Weighted Least Squares (WLS) [62], and Visual Saliency Features Fusion (VSFF) [63], which are publicly accessible for comparative analysis. Notably, the optical and SAR images in these datasets have been aligned with high precision. The image sizes are 512 × 512 pixels for the YYX-OPT-SAR, 1000 × 1000 pixels for the WHU-OPT-SAR, and 512 × 512 pixels for the UAV aerial photography dataset.
In the STAF algorithm proposed in this paper, according to the parameter setting in [54], the false alarm rate for the CFAR detection is set to 0.04, the width of the interference zone is configured to 1, and the chosen morphological operation is the open operation. The radius of the circular structural elements used is set to 1. Depending on the size of the target to be detected in different images, the dimensions of the target area are established as 12 × 12, 100 × 100, and 8 × 8 pixels, respectively.
To evaluate microwave vision-enhanced environment measurement results and the fusion effect of optical and SAR images, this paper tests the aforementioned six algorithms alongside the proposed algorithm on three datasets. The results of the six algorithms and the proposed STAF algorithm are evaluated by visual and statistical evaluations.

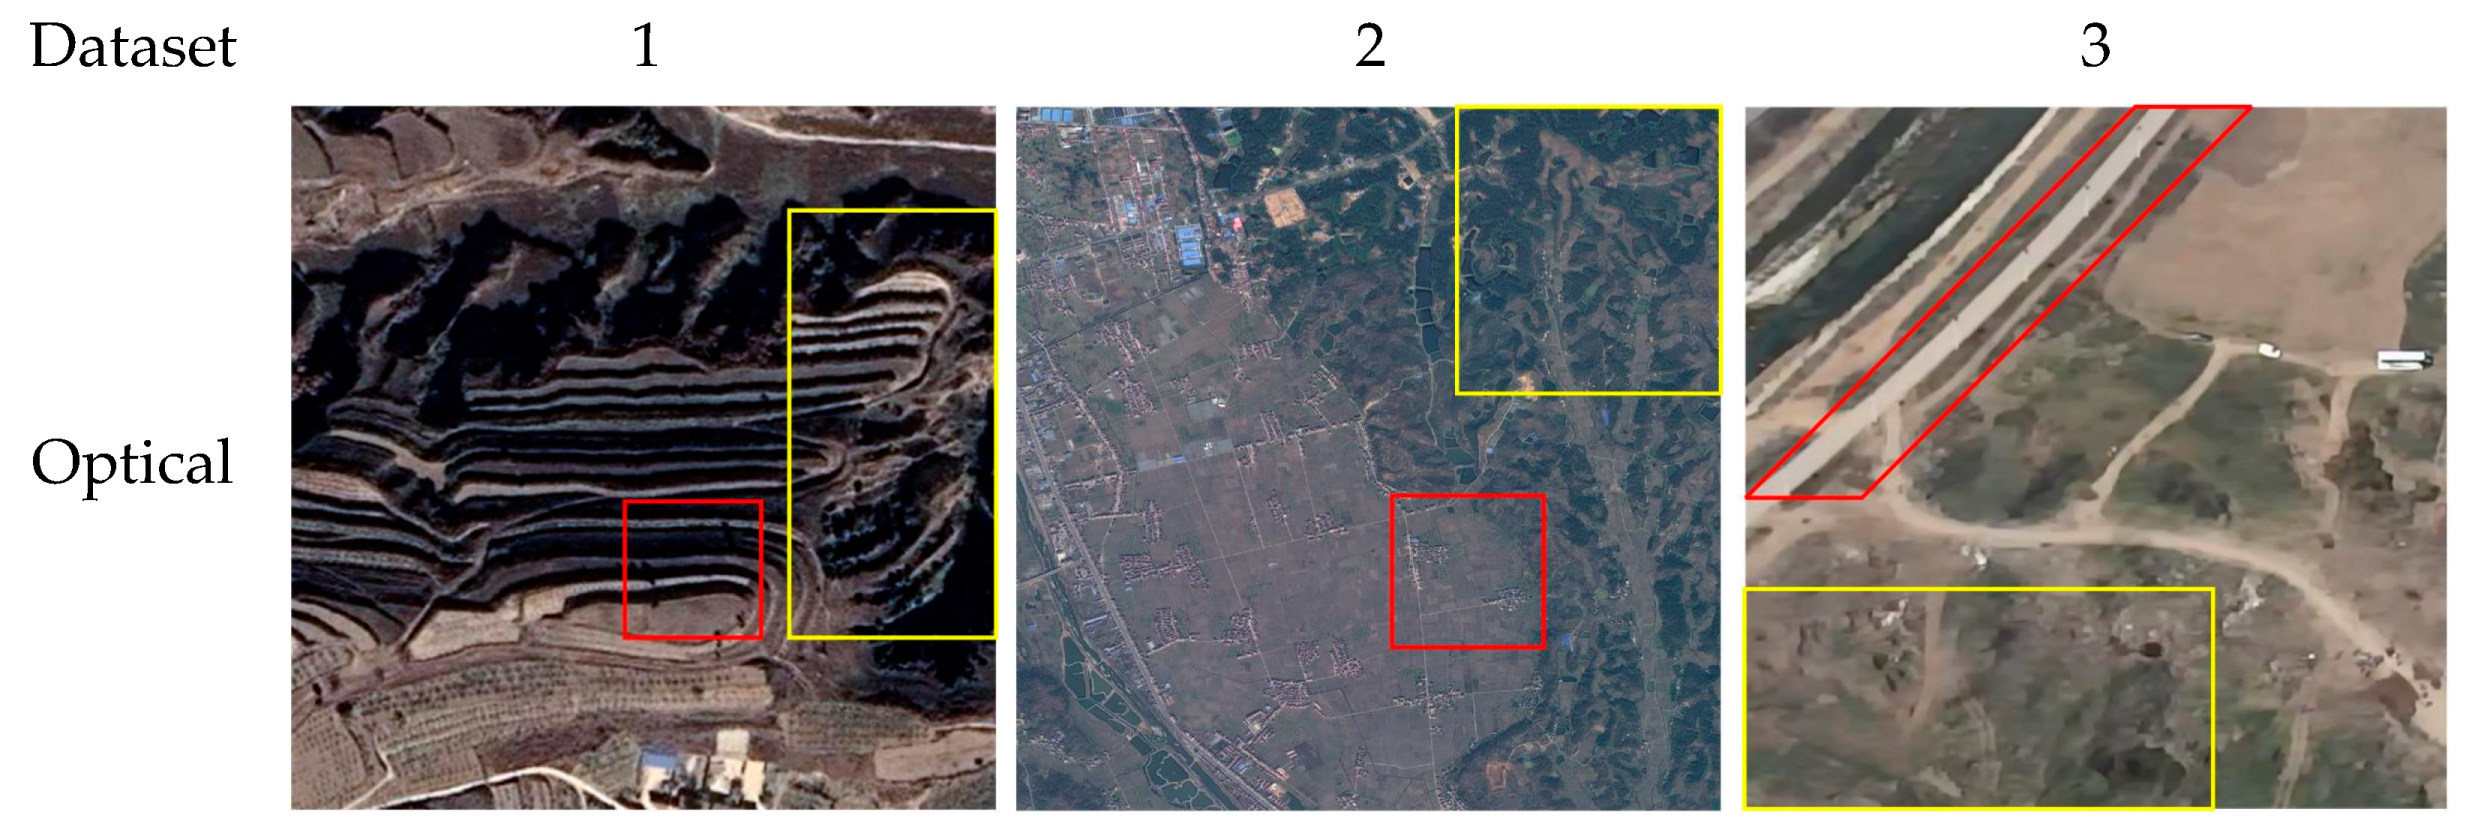
4.1. Visual Evaluation

4.1.1. Microwave Vision-Enhanced Environment Perception Method

Figure 6 illustrates the fusion results obtained by various algorithms. In the region highlighted by the red box, the SAR image effectively emphasizes the target compared to the optical image. As illustrated in the figure, the fusion results obtained by all algorithms include the target information accentuated in the SAR image. This demonstrates that the microwave vision-enhanced environment perception method effectively capitalizes on the complementary advantages of both images to realize the enhancement of microwave vision on the environmental information measured by optical vision.

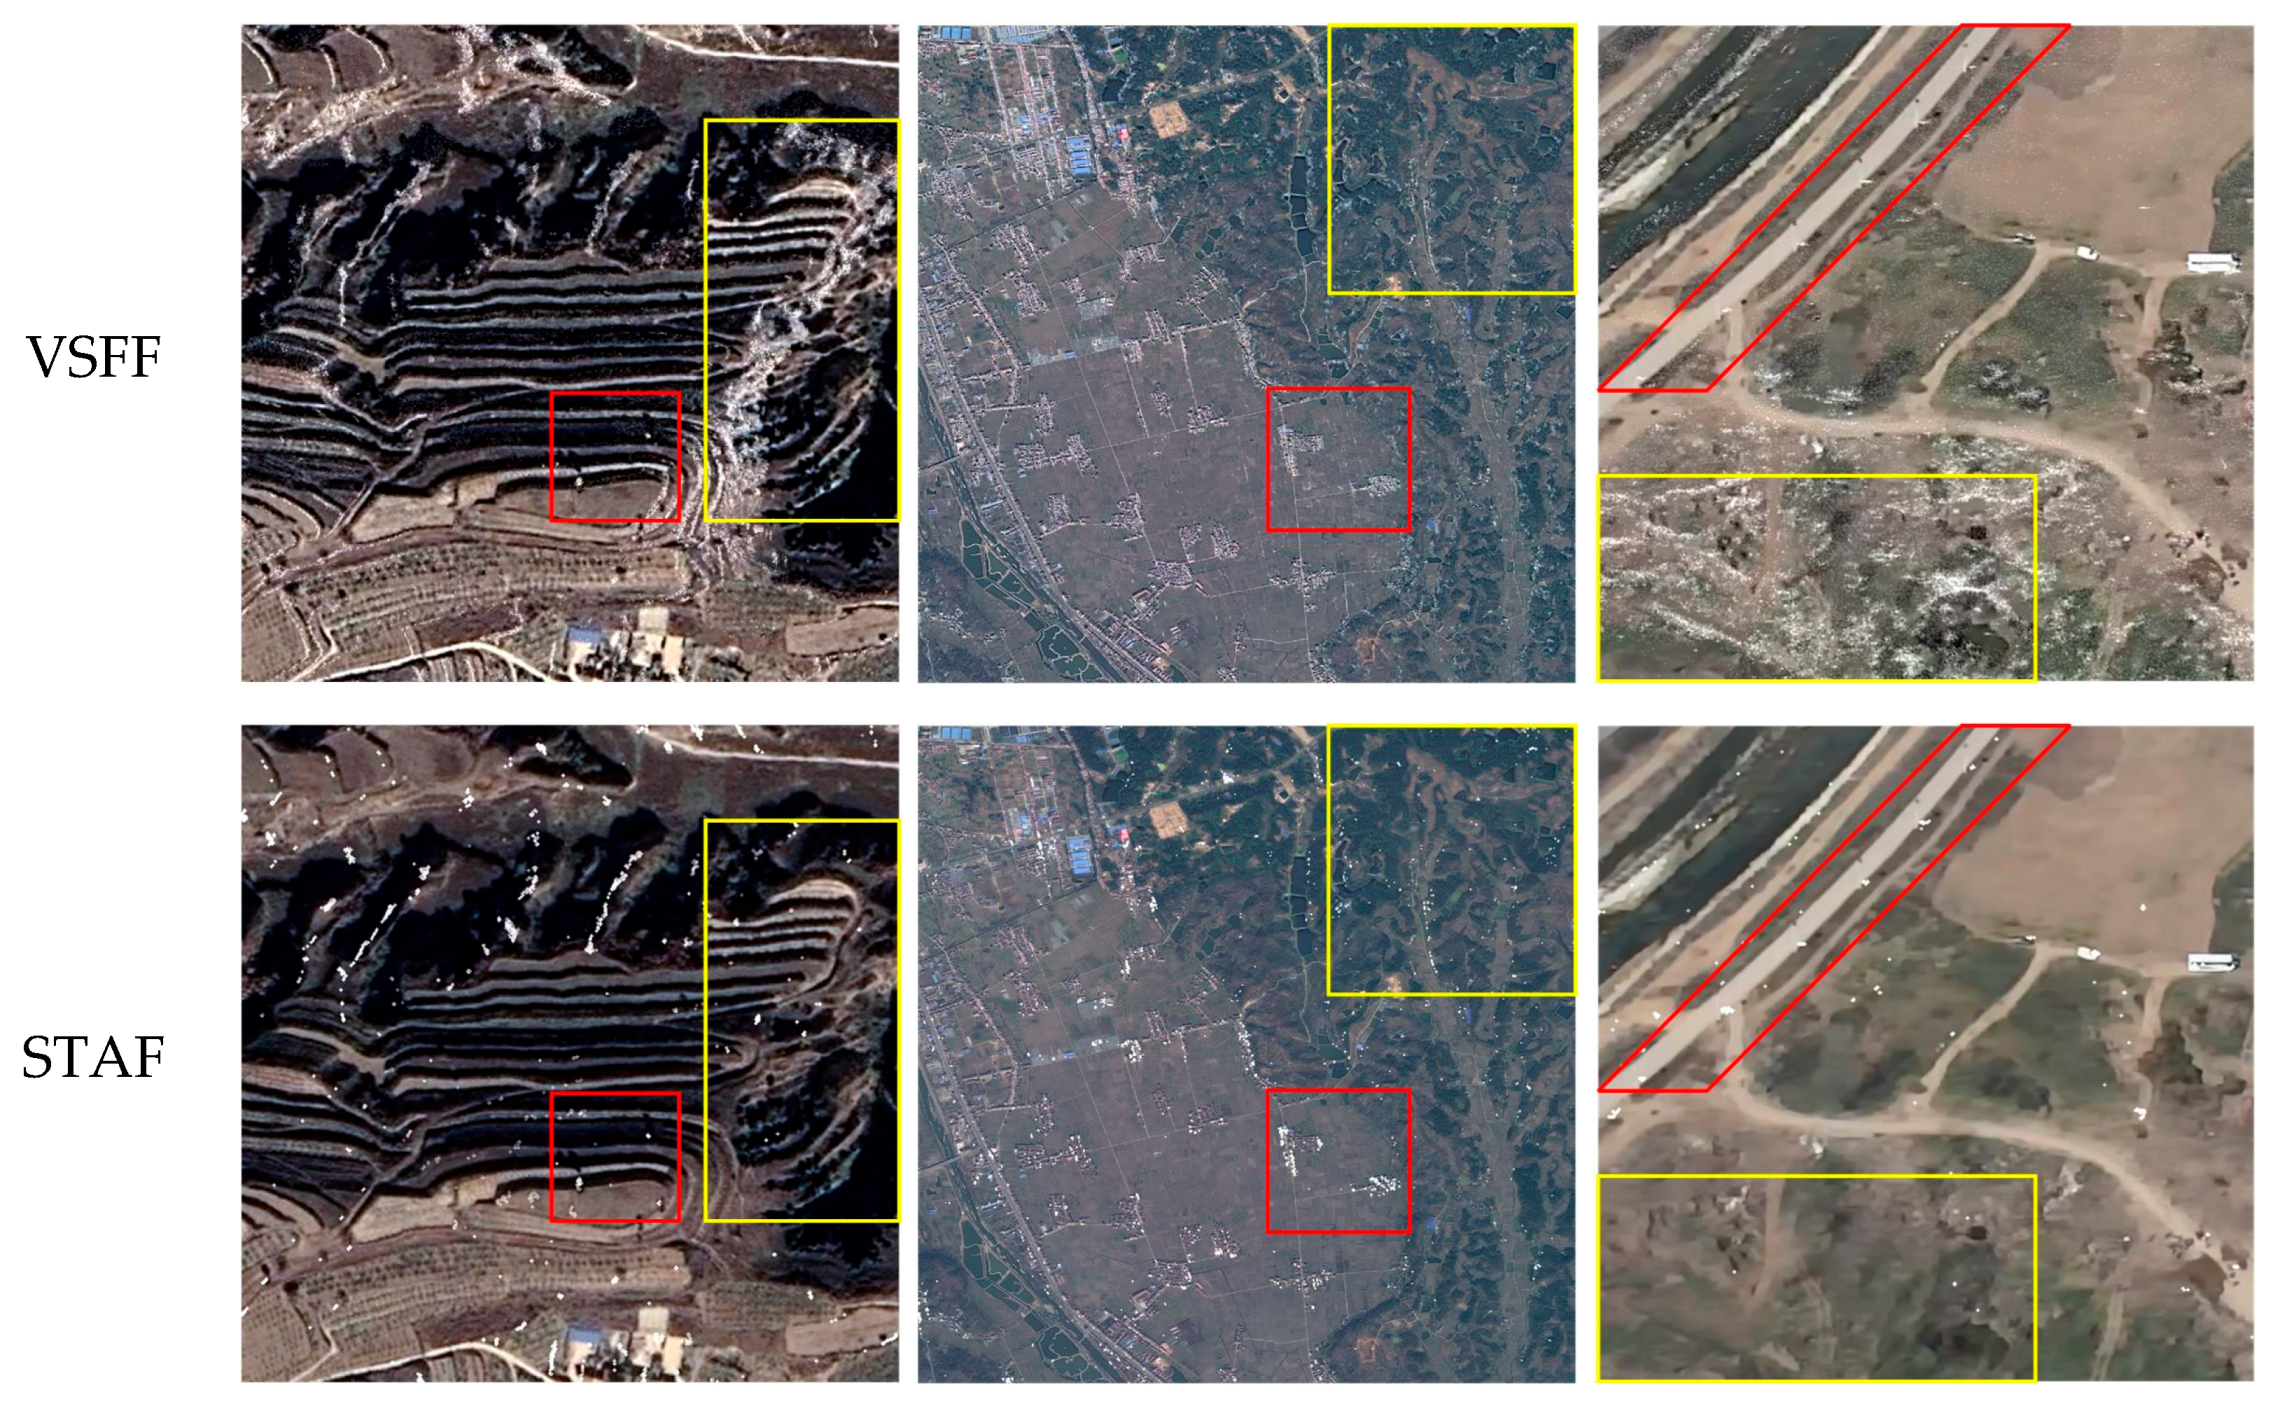
4.1.2. Performance Comparison of Fusion Algorithms

Furthermore, the fusion results from the algorithm proposed in this paper are minimally affected by SAR background noise compared to other algorithms. This is primarily because some of the other algorithms fail to adequately suppress the background noise in SAR images, while others utilize suppression algorithms that yield limited effectiveness. In contrast, the algorithm presented here focuses solely on fusing the results obtained from detection, discarding all other data. This approach significantly reduces the impact of SAR background noise on the fusion results. As indicated by the yellow box in Figure 6, certain regions exhibit a more pronounced effect.
The fusion outcomes from the LP, DTCWT, NSCT, HMSD, and WLS algorithms incorporated excessive SAR image information, including substantial background noise from SAR images. This over-fusion failed to meet the specific requirements for UAV visual navigation applications. In comparison, both the VSFF algorithm and our proposed STAF algorithm demonstrate better performance by selectively extracting and fusing key SAR image features with optical images. However, a comprehensive statistical evaluation remains necessary to thoroughly assess the relative merits of these two approaches.

4.2. Statistical Evaluation

4.2.1. Microwave Vision-Enhanced Environment Perception Method

Information entropy (EN) reflects the amount of information contained in the image. By calculating and comparing the EN of the optical image and the fused image, it can be found that the results of the enhanced environmental perception using microwave vision measurements are able to pass through richer environmental information, as presented in Table 1.

4.2.2. Performance Comparison of Fusion Algorithms

Additionally, statistical evaluations are employed from different aspects through four representative fusion evaluation metrics [56]: information-theory-based metric, named peak signal-to-noise ratio (PSNR); image-feature-based metric, named Qabf; structural-similarity-based metric, named structural similarity index measure (SSIM); and human-perception-inspired metric, named natural image quality evaluator (NIQE). For the first three metrics, larger values indicate better quality, while smaller values are preferred for the last metric.
The fusion results are evaluated for image quality, and the values of four image quality assessment metrics are presented in Table 2. The optimal results are highlighted in bold, while the sub-optimal results are underlined. Observing the data across the three datasets, it can be concluded that, with the exception of the Qabf metric, all other metrics indicate that the method proposed in this paper is the most effective for fusing optical and SAR images. The Qabf metric specifically evaluates the edge information retained in the fused image. Since the STAF algorithm prioritizes target detection, it retains only a limited amount of texture information from the SAR image, leading to a lower Qabf score for its fusion results.
To quantitatively assess whether the fusion results meet the specific requirements of visual navigation, we introduce a mutual information-based metric, termed Fusion Symmetry (FS) [64]. This metric evaluates the extent to which the fused image retains information from each of the source images. It is expressed as
F S = M I O F M I S F 2 M I O F + M I S F
Here, M I O F and M I S F represent the mutual information between the fused image and the optical/SAR images, respectively. The Fusion Symmetry (FS) value ranges within 0.5 , 0.5 .
  • When F S > 0 , the fused image retains more information from the optical image, and as FS approaches 0.5, the optical content dominates.
  • When F S < 0 , the fused image incorporates more SAR image information, and as FS approaches −0.5, the SAR content prevails.
Table 3 presents the FS values of fused images generated by different algorithms across three datasets. The optimal results are highlighted in bold, while the sub-optimal results are underlined. The results show that both the VSFF and STAF methods yield FS > 0, indicating a higher proportion of optical image information in their fusion outputs—consistent with the visual assessments in Section 4.1.2.
Furthermore, since FS value is the maximum and closer to 0.5 for STAF compared to other algorithms, the STAF algorithm effectively preserves the primary features of optical images while selectively extracting complementary information from SAR data. This balance satisfies the specific requirements for visual navigation applications.
Table 4 presents the running times of the various fusion algorithms tested across three datasets, all executed on computers equipped with Intel Core i5-12500H CPUs. Our algorithm demonstrates improved efficiency compared to the NSCT, HMSD, and VSFF. However, it is slower than some of the other algorithms, primarily due to the target detection processing involved in the fusion process. Additionally, our algorithm is implemented in MATLAB R2023b, which may lack sufficient optimization in certain matrix operations, contributing to the increased running time.

5. Conclusions

In this paper, we investigate a novel method for the environmental perception of UAV visual navigation. Our approach utilizes microwave vision to assist optical vision to measure the environment, overcome the influence of light and cloudy weather changes, and enhance the robustness of environmental information. Moreover, the STAF algorithm is proposed to realize microwave vision-enhanced environment perception through SAR and optical image fusion processing under conditions of sufficient light and clear weather. Our algorithm achieves superior performance compared to six other state-of-the-art algorithms. The results demonstrate that the unique information extracted from SAR images effectively enhances the optical images while preserving their primary attributes. However, while our algorithm successfully extracts unique target information from SAR images in most complex scenes, it is limited by the CFAR detection method when faced with overly complex scenes characterized by diverse target types, shapes, and sizes. This limitation can lead to a deterioration in the quality of the fusion results. In our future work, we will aim to improve and optimize the algorithm to ensure its broader applicability to both optical and SAR images under different conditions.

Author Contributions

Conceptualization, R.L.; Methodology, R.L.; Software, C.Z.; Validation, C.Z.; Formal analysis, P.L.; Resources, J.H.; Data curation, R.L.; Writing—original draft, R.L.; Writing—review & editing, D.W. and J.H.; Visualization, J.Z.; Supervision, D.W.; Funding acquisition, P.L. All authors have read and agreed to the published version of the manuscript.

Funding

This research was funded by the Project of General Program of the China Postdoctoral Science Foundation, grant number 2024M764322.

Data Availability Statement

The publicly available medium-resolution SAR and optical dataset WHU-OPT-SAR and high-resolution SAR and optical image fusion dataset YYX-OPT-SAR can be downloaded from these links: https://github.com/AmberHen/WHU-OPT-SAR-dataset (accessed on 3 June 2021) and https://github.com/yeyuanxin110/YYX-OPT-SAR (accessed on 21 January 2023).

Acknowledgments

The authors would like to thank everyone who has contributed datasets and fundamental research models to the public. They also appreciate the editors and anonymous reviewers for their valuable comments, which greatly improved the quality of this article.

Conflicts of Interest

The authors declare no conflicts of interest.

References

  1. Lu, Y.; Xue, Z.; Xia, G.-S.; Zhang, L. A Survey on Vision-Based UAV Navigation. Geo-Spat. Inf. Sci. 2018, 21, 21–32. [Google Scholar] [CrossRef]
  2. Hai, J.; Hao, Y.; Zou, F.; Lin, F.; Han, S. A Visual Navigation System for UAV under Diverse Illumination Conditions. Appl. Artif. Intell. 2021, 35, 1529–1549. [Google Scholar] [CrossRef]
  3. Samma, H.; El-Ferik, S. Autonomous UAV Visual Navigation Using an Improved Deep Reinforcement Learning. IEEE Access 2024, 12, 79967–79977. [Google Scholar] [CrossRef]
  4. Ceron, A.; Mondragon, I.; Prieto, F. Onboard Visual-Based Navigation System for Power Line Following with UAV. Int. J. Adv. Robot. Syst. 2018, 15, 1729881418763452. [Google Scholar] [CrossRef]
  5. Shin, K.; Hwang, H.; Ahn, J. Mission Analysis of Solar UAV for High-Altitude Long-Endurance Flight. J. Aerosp. Eng. 2018, 31, 04018010. [Google Scholar] [CrossRef]
  6. Brown, A.; Anderson, D. Trajectory Optimization for High-Altitude Long-Endurance UAV Maritime Radar Surveillance. IEEE Trans. Aerosp. Electron. Syst. 2020, 56, 2406–2421. [Google Scholar] [CrossRef]
  7. Lindstrom, C.; Christensen, R.; Gunther, J.; Jenkins, S. GPS-Denied Navigation Aided by Synthetic Aperture Radar Using the Range-Doppler Algorithm. Navig. J. Inst. Navig. 2022, 69, navi.533. [Google Scholar] [CrossRef]
  8. Ahmed, M.M.; Shawky, M.A.; Zahran, S.; Moussa, A.; EL-Shimy, N.; Elmahallawy, A.A.; Ansari, S.; Shah, S.T.; Abdellatif, A.G. An Experimental Analysis of Outdoor UAV Localisation through Diverse Estimators and Crowd-Sensed Data Fusion. Phys. Commun. 2024, 66, 102475. [Google Scholar] [CrossRef]
  9. Xu, F.; Jin, Y. From the Emergence of Intelligent Science to the Research of Microwave Vision. Sci. Technol. Rev. 2018, 36, 30–44. [Google Scholar]
  10. Jin, Y. Multimode Remote Sensing Intelligent Information and Target Recognition: Physical Intelligence of Microwave Vision. J. Radars. 2019, 8, 710–716. [Google Scholar] [CrossRef]
  11. Xu, F.; Jin, Y. Microwave Vision and Intelligent Perception of Radar Imagery. J. Radars. 2024, 13, 285–306. [Google Scholar] [CrossRef]
  12. Ye, Y.; Liu, W.; Zhou, L.; Peng, T.; Xu, Q. An Unsupervised SAR and Optical Image Fusion Network Based on Structure-Texture Decomposition. IEEE Geosci. Remote Sens. Lett. 2022, 19, 4017605. [Google Scholar] [CrossRef]
  13. Pal, S.K.; Majumdar, T.J.; Bhattacharya, A.K. ERS-2 SAR and IRS-1C LISS III Data Fusion: A PCA Approach to Improve Remote Sensing Based Geological Interpretation. ISPRS J. Photogramm. Remote Sens. 2007, 61, 281–297. [Google Scholar] [CrossRef]
  14. Chen, C.-M.; Hepner, G.F.; Forster, R.R. Fusion of Hyperspectral and Radar Data Using the IHS Transformation to Enhance Urban Surface Features. ISPRS J. Photogramm. Remote Sens. 2003, 58, 19–30. [Google Scholar] [CrossRef]
  15. Chandrakanth, R.; Saibaba, J.; Varadan, G.; Raj, P.A. Feasibility of High Resolution SAR and Multispectral Data Fusion. In Proceedings of the 2011 IEEE International Geoscience and Remote Sensing Symposium, Vancouver, BC, Canada, 24 July 2011; pp. 356–359. [Google Scholar]
  16. Hong, S.; Moon, W.M.; Paik, H.Y.; Choi, G.H. Data Fusion of Multiple Polarimetric SAR Images Using Discrete Wavelet Transform (DWT). In Proceedings of the IEEE International Geoscience and Remote Sensing Symposium, Toronto, ON, Canada, 24 June 2002; Volume 6, pp. 3323–3325. [Google Scholar]
  17. Lu, Y.; Guo, L.; Li, H.; Li, L. SAR and MS Image Fusion Based on Curvelet Transform and Activity Measure. In Proceedings of the 2011 International Conference on Electric Information and Control Engineering, Wuhan, China, 15 April 2011; pp. 1680–1683. [Google Scholar]
  18. Hong, G.; Zhang, Y.; Mercer, B. A Wavelet and IHS Integration Method to Fuse High Resolution SAR with Moderate Resolution Multispectral Images. Photogramm. Eng. Remote Sens. 2009, 75, 1213–1223. [Google Scholar] [CrossRef]
  19. Xu, J.H.C.; Cheng, X. Comparative Analysis of Different Fusion Rules for SAR and Multi-Spectral Image Fusion Based on NSCT and IHS Transform. In Proceedings of the 2015 International Conference on Computer and Computational Sciences (ICCCS), Greater Noida, India, 27 January 2015; pp. 271–274. [Google Scholar]
  20. Chibani, Y. Additive Integration of SAR Features into Multispectral SPOT Images by Means of the à Trous Wavelet Decomposition. ISPRS J. Photogramm. Remote Sens. 2006, 60, 306–314. [Google Scholar] [CrossRef]
  21. Li, W.; Wu, J.; Liu, Q.; Zhang, Y.; Cui, B.; Jia, Y.; Gui, G. An Effective Multimodel Fusion Method for SAR and Optical Remote Sensing Images. IEEE J. Sel. Top. Appl. Earth Obs. Remote Sens. 2023, 16, 5881–5892. [Google Scholar] [CrossRef]
  22. Fu, Y.; Yang, S.; Yan, H.; Xue, Q.; Shi, Z.; Hu, X. Optical and SAR Image Fusion Method with Coupling Gain Injection and Guided Filtering. J. Appl. Remote Sens. 2022, 16, 046505. [Google Scholar] [CrossRef]
  23. Adrian, J.; Sagan, V.; Maimaitijiang, M. Sentinel SAR-Optical Fusion for Crop Type Mapping Using Deep Learning and Google Earth Engine. ISPRS J. Photogramm. Remote Sens. 2021, 175, 215–235. [Google Scholar] [CrossRef]
  24. Duan, C.; Belgiu, M.; Stein, A. Efficient Cloud Removal Network for Satellite Images Using SAR-Optical Image Fusion. IEEE Geosci. Remote Sens. Lett. 2024, 21, 6008605. [Google Scholar] [CrossRef]
  25. Sun, Y.; Huang, G.; Zhao, Z.; Liu, B. SAR and Multi-spectral Image Fusion Algorithms with Different Filtering Methods. Remote Sens. Inf. 2019, 34, 114–120. [Google Scholar]
  26. Zhang, X.; Zhang, S.; Sun, Z.; Liu, C.; Sun, Y.; Ji, K.; Kuang, G. Cross-Sensor SAR Image Target Detection Based on Dynamic Feature Discrimination and Center-Aware Calibration. IEEE Trans. Geosci. Remote Sens. 2025, 63, 5209417. [Google Scholar] [CrossRef]
  27. Sun, Z.; Leng, X.; Zhang, X.; Zhou, Z.; Xiong, B.; Ji, K.; Kuang, G. Arbitrary-Direction SAR Ship Detection Method for Multi-Scale Imbalance. IEEE Trans. Geosci. Remote Sens. 2025, 63, 5208921. [Google Scholar] [CrossRef]
  28. Chen, M.; He, Y.; Wang, T.; Hu, Y.; Chen, J.; Pan, Z. Scale-Mixing Enhancement and Dual Consistency Guidance for End-to-End Semisupervised Ship Detection in SAR Images. IEEE J. Sel. Top. Appl. Earth Obs. Remote Sens. 2024, 17, 15685–15701. [Google Scholar] [CrossRef]
  29. Greco, M.; Pinelli, G.; Kulpa, K.; Samczynski, P.; Querry, B.; Querry, S. The Study on SAR Images Exploitation for Air Platform Navigation Purposes. In Proceedings of the 2011 12th International Radar Symposium (IRS), Leipzig, Germany, 7–9 September 2011; pp. 347–352. [Google Scholar]
  30. Greco, M.; Kulpa, K.; Pinelli, G.; Samczynski, P. SAR and InSAR Georeferencing Algorithms for Inertial Navigation Systems. In Proceedings of the Photonics Applications in Astronomy, Communications, Industry, and High-Energy Physics Experiments 2011, Wilga, Poland, 7 October 2011; Volume 8008, pp. 499–507. [Google Scholar]
  31. Greco, M.; Querry, S.; Pinelli, G.; Kulpa, K.; Samczynski, P.; Gromek, D.; Gromek, A.; Malanowski, M.; Querry, B.; Bonsignore, A. SAR-Based Augmented Integrity Navigation Architecture. In Proceedings of the 2012 13th International Radar Symposium, Warsaw, Poland, 23–25 May 2012; pp. 225–229. [Google Scholar]
  32. Nitti, D.O.; Bovenga, F.; Chiaradia, M.T.; Greco, M.; Pinelli, G. Feasibility of Using Synthetic Aperture Radar to Aid UAV Navigation. Sensors 2015, 15, 18334–18359. [Google Scholar] [CrossRef] [PubMed]
  33. Gao, S.; Zhong, Y.; Li, W. Robust Adaptive Filtering Method for SINS/SAR Integrated Navigation System. Aerosol Sci. Technol. 2011, 15, 425–430. [Google Scholar] [CrossRef]
  34. Zhong, Y.; Gao, S.; Li, W. A Quaternion-Based Method for SINS/SAR Integrated Navigation System. IEEE Trans. Aerosp. Electron. Syst. 2012, 48, 514–524. [Google Scholar] [CrossRef]
  35. Gao, S.; Xue, L.; Zhong, Y.; Gu, C. Random Weighting Method for Estimation of Error Characteristics in SINS/GPS/SAR Integrated Navigation System. Aerosol Sci. Technol. 2015, 46, 22–29. [Google Scholar] [CrossRef]
  36. Chang, L.; Hu, B.; Chen, S.; Qin, F. Comments on “Quaternion-Based Method for SINS/SAR Integrated Navigation System”. IEEE Trans. Aerosp. Electron. Syst. 2013, 49, 1400–1402. [Google Scholar] [CrossRef]
  37. Toss, T.; Dämmert, P.; Sjanic, Z.; Gustafsson, F. Navigation with SAR and 3D-Map Aiding. In Proceedings of the 2015 18th International Conference on Information Fusion (Fusion), Washington, DC, USA, 6–9 July 2015; pp. 1505–1510. [Google Scholar]
  38. Lu, J.; Ye, L.; Han, S. A Deep Fusion Method Based on INS/SAR Integrated Navigation and SAR Bias Estimation. IEEE Sens. J. 2020, 20, 10057–10070. [Google Scholar] [CrossRef]
  39. Lu, J.; Ye, L.; Han, S. Analysis and Application of Geometric Dilution of Precision Based on Altitude-Assisted INS/SAR Integrated Navigation. IEEE Trans. Instrum. Meas. 2021, 70, 9501010. [Google Scholar] [CrossRef]
  40. Jiang, S.; Wang, B.; Xiang, M.; Fu, X.; Sun, X. Method for InSAR/INS Navigation System Based on Interferogram Matching. IET Radar Sonar Nav. 2018, 12, 938–944. [Google Scholar] [CrossRef]
  41. Markiewicz, J.; Abratkiewicz, K.; Gromek, A.; Ostrowski, W.; Samczyński, P.; Gromek, D. Geometrical Matching of SAR and Optical Images Utilizing ASIFT Features for SAR-Based Navigation Aided Systems. Sensors 2019, 19, 5500. [Google Scholar] [CrossRef] [PubMed]
  42. Gambrych, J.; Gromek, D.; Abratkiewicz, K.; Wielgo, M.; Gromek, A.; Samczyński, P. SAR and Orthophoto Image Registration With Simultaneous SAR-Based Altitude Measurement for Airborne Navigation Systems. IEEE Trans. Geosci. Remote Sens. 2023, 61, 5219714. [Google Scholar] [CrossRef]
  43. Ren, S.; Chang, W.; Jin, T.; Wang, Z. Automated SAR Reference Image Preparation for Navigation. Prog. Electromagn. Res. 2011, 121, 535–555. [Google Scholar] [CrossRef]
  44. Kong, Y.; Hong, F.; Leung, H.; Peng, X. A Fusion Method of Optical Image and SAR Image Based on Dense-UGAN and Gram–Schmidt Transformation. Remote Sens. 2021, 13, 4274. [Google Scholar] [CrossRef]
  45. Wu, K.; Gu, L.; Jiang, M. Research on Fusion of SAR Image and Multispectral Image Using Texture Feature Information. In Proceedings of the Earth Observing Systems XXVI, San Diego, CA, USA, 1 August 2021; Volume 11829, pp. 353–366. [Google Scholar]
  46. Chu, T.; Tan, Y.; Liu, Q.; Bai, B. Novel Fusion Method for SAR and Optical Images Based on Non-Subsampled Shearlet Transform. Int. J. Remote Sens. 2020, 41, 4590–4604. [Google Scholar] [CrossRef]
  47. Fu, Y.; Yang, S.; Li, Y.; Yan, H.; Zheng, Y. A Novel SAR and Optical Image Fusion Algorithm Based on an Improved SPCNN and Phase Congruency Information. Int. J. Remote Sens. 2023, 44, 1328–1347. [Google Scholar] [CrossRef]
  48. Shao, Z.; Wu, W.; Guo, S. IHS-GTF: A Fusion Method for Optical and Synthetic Aperture Radar Data. Remote Sens. 2020, 12, 2796. [Google Scholar] [CrossRef]
  49. Gong, X.; Hou, Z.; Ma, A.; Zhong, Y.; Zhang, M.; Lv, K. An Adaptive Multiscale Gaussian Co-Occurrence Filtering Decomposition Method for Multispectral and SAR Image Fusion. IEEE J. Sel. Top. Appl. Earth Obs. Remote Sens. 2023, 16, 8215–8229. [Google Scholar] [CrossRef]
  50. Chen, Y.; Bruzzone, L. Self-Supervised SAR-Optical Data Fusion of Sentinel-1/-2 Images. IEEE Trans. Geosci. Remote Sens. 2022, 60, 5406011. [Google Scholar] [CrossRef]
  51. Grohnfeldt, C.; Schmitt, M.; Zhu, X. A Conditional Generative Adversarial Network to Fuse Sar And Multispectral Optical Data for Cloud Removal from Sentinel-2 Images. In Proceedings of the IGARSS 2018—2018 IEEE International Geoscience and Remote Sensing Symposium, Valencia, Spain, 22–27 July 2018; pp. 1726–1729. [Google Scholar]
  52. Gao, J.; Yuan, Q.; Li, J.; Zhang, H.; Su, X. Cloud Removal with Fusion of High Resolution Optical and SAR Images Using Generative Adversarial Networks. Remote Sens. 2020, 12, 191. [Google Scholar] [CrossRef]
  53. Huang, D.; Tang, Y.; Wang, Q. An Image Fusion Method of SAR and Multispectral Images Based on Non-Subsampled Shearlet Transform and Activity Measure. Sensors 2022, 22, 7055. [Google Scholar] [CrossRef]
  54. Wu, R. Two-Parameter CFAR Ship Detection Algorithm Based on Rayleigh Distribution in SAR Images. Preprints 2021, 2021120280. [Google Scholar] [CrossRef]
  55. Tu, T.-M.; Huang, P.S.; Hung, C.-L.; Chang, C.-P. A Fast Intensity-Hue-Saturation Fusion Technique with Spectral Adjustment for IKONOS Imagery. IEEE Geosci. Remote Sens. Lett. 2004, 1, 309–312. [Google Scholar] [CrossRef]
  56. Li, J.; Zhang, J.; Yang, C.; Liu, H.; Zhao, Y.; Ye, Y. Comparative Analysis of Pixel-Level Fusion Algorithms and a New High-Resolution Dataset for SAR and Optical Image Fusion. Remote Sens. 2023, 15, 5514. [Google Scholar] [CrossRef]
  57. Li, X.; Zhang, G.; Cui, H.; Hou, S.; Wang, S.; Li, X.; Chen, Y.; Li, Z.; Zhang, L. MCANet: A Joint Semantic Segmentation Framework of Optical and SAR Images for Land Use Classification. Int. J. Appl. Earth Obs. 2022, 106, 102638. [Google Scholar] [CrossRef]
  58. Burt, P.; Adelson, E. The Laplacian Pyramid as a Compact Image Code. IEEE Trans. Commun. 1983, 31, 532–540. [Google Scholar] [CrossRef]
  59. Selesnick, I.W.; Baraniuk, R.G.; Kingsbury, N.C. The Dual-Tree Complex Wavelet Transform. IEEE Signal Process. Mag. 2005, 22, 123–151. [Google Scholar] [CrossRef]
  60. Da Cunha, A.L.; Zhou, J.; Do, M.N. The Nonsubsampled Contourlet Transform: Theory, Design, and Applications. IEEE Trans. Image Process. 2006, 15, 3089–3101. [Google Scholar] [CrossRef]
  61. Zhou, Z.; Wang, B.; Li, S.; Dong, M. Perceptual Fusion of Infrared and Visible Images through a Hybrid Multi-Scale Decomposition with Gaussian and Bilateral Filters. Inf. Fusion 2016, 30, 15–26. [Google Scholar] [CrossRef]
  62. Ma, J.; Zhou, Z.; Wang, B.; Zong, H. Infrared and Visible Image Fusion Based on Visual Saliency Map and Weighted Least Square Optimization. Infrared Phys. Technol. 2017, 82, 8–17. [Google Scholar] [CrossRef]
  63. Ye, Y.; Zhang, J.; Zhou, L.; Li, J.; Ren, X.; Fan, J. Optical and SAR Image Fusion Based on Complementary Feature Decomposition and Visual Saliency Features. IEEE Trans. Geosci. Remote Sens. 2024, 62, 5205315. [Google Scholar] [CrossRef]
  64. Ramesh, C.; Ranjith, T. Fusion Performance Measures and a Lifting Wavelet Transform Based Algorithm for Image Fusion. In Proceedings of the Fifth International Conference on Information Fusion. FUSION 2002. (IEEE Cat.No.02EX5997), Annapolis, MD, USA, 8–11 July 2002; Volume 1, pp. 317–320. [Google Scholar]
Figure 1. The diagram of the STAF algorithm framework.
Remotesensing 17 02107 g001
Figure 2. The sliding window of the CFAR detector.
Remotesensing 17 02107 g002
Figure 3. The schematic diagram of dilation operation.
Remotesensing 17 02107 g003
Figure 4. The schematic diagram of erosion operation.
Remotesensing 17 02107 g004
Figure 5. The flowchart of the STAF algorithm.
Remotesensing 17 02107 g005
Figure 6. Qualitative evaluation of fusion results from three scenarios using seven different algorithms. From left to right are optical and SAR images, LP, DTCWT, NSCT, HMSD, WLS, VSFF, and our STAF results.
Remotesensing 17 02107 g006aRemotesensing 17 02107 g006bRemotesensing 17 02107 g006c
Table 1. Information Entropy (EN) of optical vision and microwave vision-enhanced measurement.
MethodsEN
123
Optical vision6.6796.3396.899
Microwave vision-enhanced 7.2236.3676.910
Table 2. Quantitative evaluation of fusion results. The optimal results are highlighted in bold, while the sub-optimal results are under-lined.
DatasetMethodsPSNRQabfSSIMNIQE
1LP−38.9400.4380.4117.384
DTCWT−38.4080.4070.4246.364
NSCT−38.3690.4440.4266.827
HMSD−37.0410.4800.4857.535
WLS−38.5450.4550.4735.671
VSFF−41.0990.4380.5395.460
STAF−26.8130.4580.5504.845
2LP−40.7530.3680.36412.937
DTCWT−40.7660.3610.35913.086
NSCT−40.7670.3650.36512.535
HMSD−32.6700.5360.44310.100
WLS−38.2650.3960.42910.677
VSFF−41.2390.1810.5104.112
STAF−26.2640.2430.5202.890
3LP−42.3640.2200.24310.018
DTCWT−42.3820.2060.2419.981
NSCT−42.3670.2240.24810.360
HMSD−37.1260.4300.4158.543
WLS−41.7340.2620.30510.624
VSFF−42.5550.4080.5016.465
STAF−22.0580.2780.5444.195
Table 3. Fusion Symmetry (FS) of different fusion algorithms tested on the datasets. The optimal results are highlighted in bold, while the sub-optimal results are under-lined.
MethodsFS
123
LP−0.122−0.358−0.165
DTCWT−0.120−0.356−0.155
NSCT−0.089−0.314−0.122
HMSD0.051−0.371−0.067
WLS−0.125−0.324−0.231
VSFF0.2790.3690.323
STAF0.4640.4950.466
Table 4. Running time (in seconds) of different fusion algorithms tested on the datasets.
MethodsRunning Time (s)
123
LP0.01380.03190.0115
DTCWT0.45980.66330.2994
NSCT3.30558.59992.7529
HMSD4.234213.63054.2150
WLS1.79435.26511.6287
VSFF3.29439.47422.6192
STAF2.44728.37592.5453
Disclaimer/Publisher’s Note: The statements, opinions and data contained in all publications are solely those of the individual author(s) and contributor(s) and not of MDPI and/or the editor(s). MDPI and/or the editor(s) disclaim responsibility for any injury to people or property resulting from any ideas, methods, instructions or products referred to in the content.

