Article

Direct Estimation of Forest Aboveground Biomass from UAV LiDAR and RGB Observations in Forest Stands with Various Tree Densities

1
School of Earth, Environment & Society, McMaster University, Hamilton, ON L8S 4K1, Canada
2
Korotu Technology Inc., Toronto, ON M5S 2R4, Canada
3
Department of Geography and Environmental Management, University of Waterloo, Waterloo, ON N2L 3G1, Canada
4
Ontario Ministry of Natural Resources, Sault Ste. Marie, ON P6A 2E5, Canada
5
Science and Technology Branch, Environment and Climate Change Canada, Gatineau, QC K1A 0H3, Canada
*
Author to whom correspondence should be addressed.
Remote Sens. 2025, 17(12), 2091; https://doi.org/10.3390/rs17122091
Submission received: 17 May 2025 / Revised: 7 June 2025 / Accepted: 17 June 2025 / Published: 18 June 2025

Abstract

:
Canada’s vast forests play a substantial role in the global carbon balance but require laborious and expensive forest inventory campaigns to monitor changes in aboveground biomass (AGB). Light detection and ranging (LiDAR) or reflectance observations onboard airborne or unoccupied aerial vehicles (UAVs) may address scalability limitations associated with traditional forest inventory but require simple forest structures or large sets of manually delineated crowns. Here, we introduce a deep learning approach for crown delineation and AGB estimation reproducible for complex forest structures without relying on hand annotations for training. Firstly, we detect treetops and delineate crowns with a LiDAR point cloud using marker-controlled watershed segmentation (MCWS). Then we train a deep learning model on annotations derived from MCWS to make crown predictions on UAV red, blue, and green (RGB) tiles. Finally, we estimate AGB metrics from tree height- and crown diameter-based allometric equations, all derived from UAV data. We validate our approach using 14 ha mixed forest stands with various experimental tree densities in Southern Ontario, Canada. Our results show that using an unsupervised LiDAR-only algorithm for tree crown delineation alongside a self-supervised RGB deep learning model trained on LiDAR-derived annotations leads to an 18% improvement in AGB estimation accuracy. In unharvested stands, the self-supervised RGB model performs well for height (adjusted R2, Ra2 = 0.79) and AGB (Ra2 = 0.80) estimation. In thinned stands, the performance of both unsupervised and self-supervised methods varied with stand density, crown clumping, canopy height variation, and species diversity. These findings suggest that MCWS can be supplemented with self-supervised deep learning to directly estimate biomass components in complex forest structures as well as atypical forest conditions where stand density and spatial patterns are manipulated.

1. Introduction

Forests are essential to global Earth-system health and carbon (C) cycling through several ecosystem functions, including C sequestration and storage [1]. Forests are critical terrestrial sinks for atmospheric CO2 due to their ability to store large amounts of C in trees and forest soils. Canada has one of the largest contiguous forest ecosystems on Earth, spanning an area of 4 million km2 [2]. Canada’s forests store 20.9 Pg C in their biomass, around 6.5–7.2% of the total C stored in AGB in all forests on Earth [3]. With 2.06 million km2 of Canada’s forests covered under a management plan that includes timber production and conservation, frequent monitoring of changes in tree aboveground biomass (AGB) is necessary for developing climate change mitigation solutions. Traditionally, AGB is estimated from allometric equations that use in situ tree height and diameter at breast height (DBH) measurements. Height- and DBH-based allometric equations are available for 33 common tree species in Canada, adjusted for interspecies variations in biomass compartments such as bark, branches, foliage, and wood [4]. However, traditional national forest inventories target a limited number of commercial species and growing conditions, and obtaining consistent field measurements for forest monitoring is costly and impractical for large spatial extents of forests which have great variety in species mix and growing conditions [5,6].
Advancements in remote sensing enable consistent monitoring of and reporting on forest characteristics through aerial and satellite-based forest inventories [7]. Compared to traditional forest inventory procedures that involve manual ground-based measurements, aerial remote sensing-based forest inventories, collected by unoccupied aerial vehicles (UAVs), can provide relatively better spatial and temporal coverage using red, green, and blue (RGB) imagery or light detection and ranging (LiDAR) data [8]. LiDAR can generate three-dimensional point clouds, which provide location and structural information of tree biomass components [7]. Although RGB and LiDAR data are most commonly and efficiently collected through UAVs or satellites, as of yet, they are unable to provide sufficiently accurate DBH measurements that are typically used to estimate AGB. Thus, traditional allometric equations for AGB estimation are unsuitable for UAV-based inventories and would need to be adapted. Previous studies have proposed methods to approximate DBH from crown diameter for existing allometric equations or have developed equations to estimate AGB directly from crown diameter [9]. Adapting DBH-based allometric equations to crown-based equations offers significant practical benefits since developing new equations from crown measurements to estimate AGB necessitates direct biomass sampling of trees, a method that is both destructive and impractical for large spatial scales [10,11,12].
Small-footprint airborne laser scanning methods are proliferating as an approach for extracting forest inventory data from LiDAR point clouds. The point cloud can be used to generate a canopy height model (CHM), which can subsequently be analyzed to estimate an individual treetop’s location and height (e.g., local maximum filtering, Panagiotidis et al. [13]). Treetop locations can be used as markers in watershed segmentation (e.g., Yun et al. [14]), which is a boundary detection-based technique that has successfully delineated tree crowns (i.e., segments) in a CHM (e.g., Yin and Wang [15]). Marker-controlled watershed segmentation (MCWS) is a variant of the method that uses an inverted CHM to treat treetops as individual catchment basins for a water pouring algorithm. Water is poured until it reaches the highest point of a basin, and the resulting edges delineate the crown profiles [14]. While commonly used to generate forest inventory data, MCWS-based crown delineation is limited in forests with minimal tree height variance and high crown clumping [15]. Yet the impact of forest structural complexity on MCWS crown delineation has not been rigorously assessed, particularly in the context of forests under a management plan with various silvicultural treatments. Region-growing segmentation is an alternative method for crown delineation that uses a decision tree method to grow individual crowns around treetops [10]. Improved tree detection and crown segmentation have been achieved using deep learning and region-growing algorithms, but training datasets are limited to small forests with very-high-point-density LiDAR data (e.g., 1000 points/m2, Wielgosz et al. [16]). Additionally, some models require terrestrial or mobile laser scanning data to separate individual trees in point clouds, which limits reproducibility for larger study areas where only airborne laser scanning may be available [16].
Deep learning neural networks for crown delineation using RGB-band mosaics have been gaining traction in recent years. Current models primarily use either a mask region-based or U-Net convolutional neural network, which require large sets of ground truth information for training [17,18]. Over large study areas, models are trained on manually delineated crowns, with high agreement between hand annotations in the test data and the model predictions. These methods require manual intervention or large sets of hand annotations for individual tree crown analysis in dense forest canopies common in Canadian forests [19,20]. LiDAR crown prediction has been explored as an alternative to manual delineation for training data. Weinstein et al. [21] developed a segmentation model trained on trees generated from unsupervised LiDAR algorithms, with moderate crown precision and recall in simple forest structures. While this self-supervised method enables automated segmentation, there is a limited understanding of its application for predicting forest inventory [21]. Furthermore, the open-source model has yet to be trained on Canadian forests, particularly for sites under silvicultural thinning treatments with variable forest structures [22].
Here, we investigate the accuracy of unsupervised LiDAR and self-supervised RGB forest inventory predictions in a 14 ha northern temperate coniferous forest stand in Canada [23]. We used a combination of UAV LiDAR and RGB data acquired during leaf-on and leaf-off conditions, MCWS, and open-source deep learning models to generate tree height and crown diameter predictions of a forest stand undergoing various thinning treatments. We also developed crown-based allometric equations from existing forest inventory databases to estimate AGB from ground truth data and unsupervised LiDAR and self-supervised RGB predictions. Through this work, we demonstrate a self-supervised method for height and crown estimation that is reproducible for forests of varying structural complexities and help estimate AGB directly from remote sensing data.

2. Materials and Methods

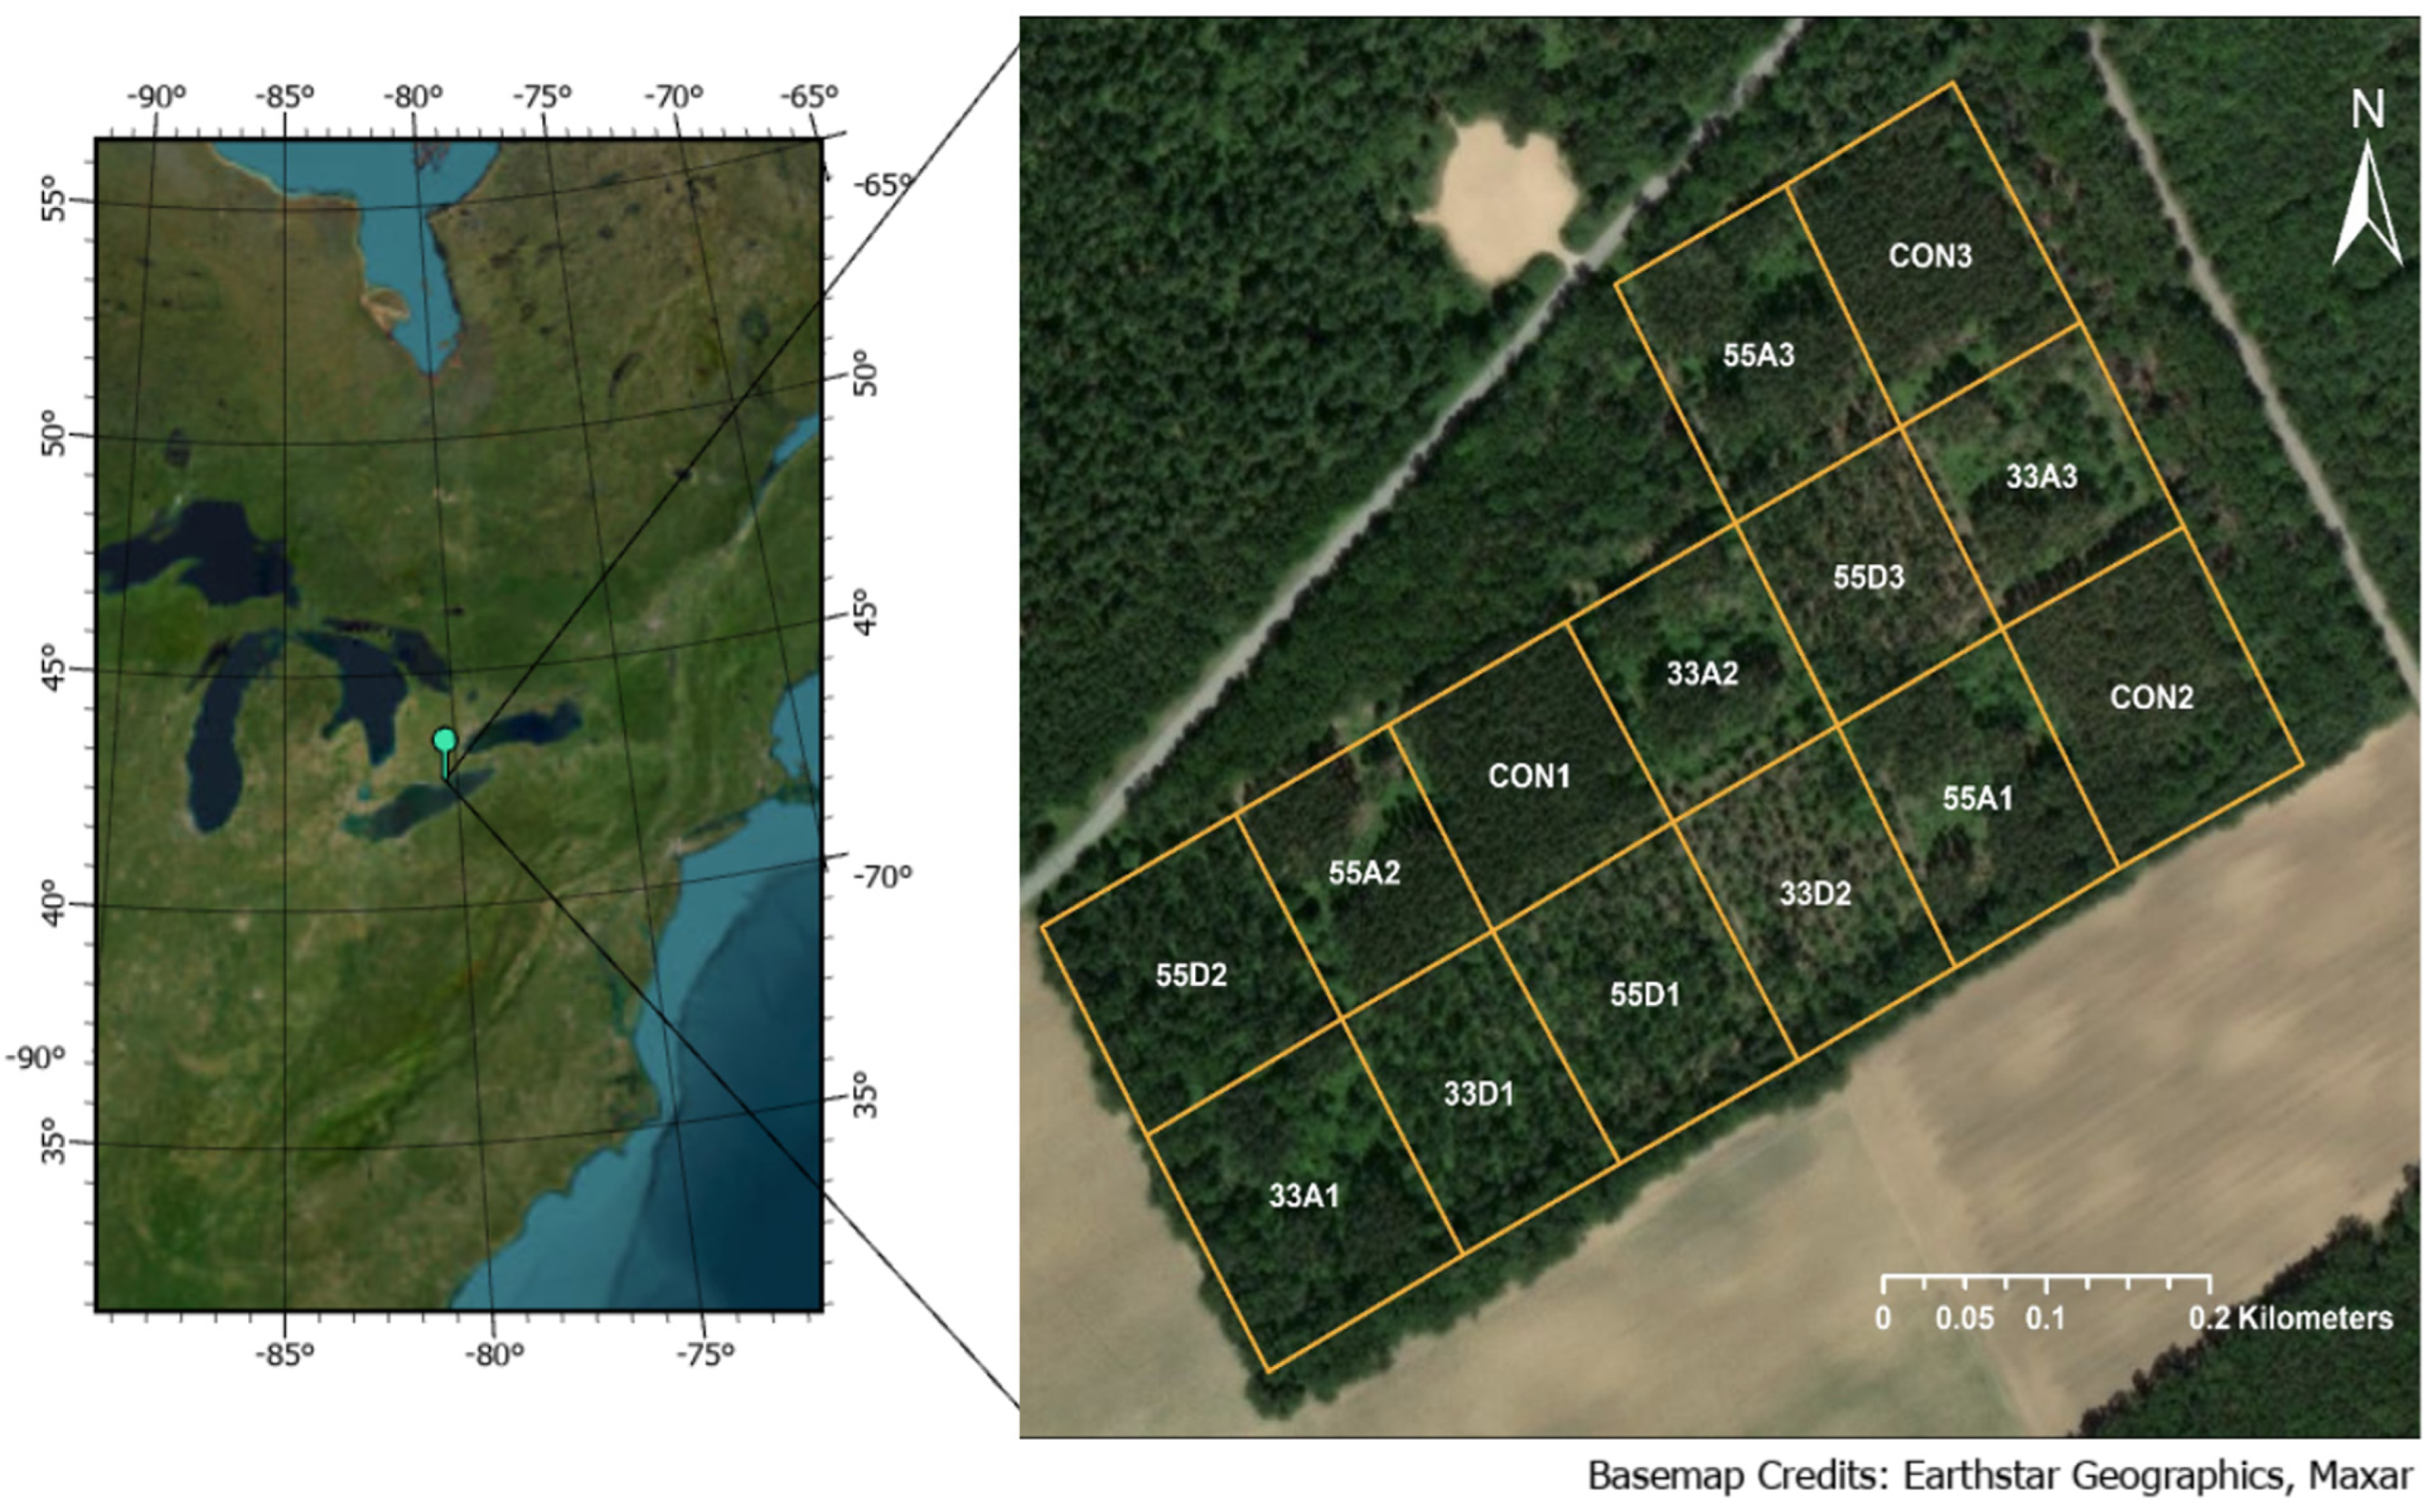
2.1. Site Description

We carried out this study at a 14 ha temperate red pine (Pinus resinosa) plantation stand located in the St. Williams Conservation Reserve (42.704444N, 80.358056W). The study site is located approximately 3 km north of Lake Erie in Southern Ontario and belongs to the larger Turkey Point Observatory [24]. Managed by the Ontario Ministry of Natural Resources, the stand was planted in 1931 with red pine seedlings placed 2 m apart in furrowed rows. The stand density was reduced from ~2500 trees/ha to ~1875 trees/ha in 1960 through forest thinning. In 2014, the ministry divided the study site into 14 1-ha plots and applied one of five variable-retention harvesting (VRH) treatments (unharvested control (CON), 33% aggregated crown retention (33A), 55% aggregated crown retention (55A), 33% dispersed crown retention (33D), 55% dispersed crown retention (55D)) (Figure 1). VRH treatments are silvicultural treatments that manipulate the spatial distribution of residual forest stands into evenly spread (dispersed) or clustered (aggregated) patterns after harvest. The treatments focus on preserving forest structural complexity to enhance stand regeneration and biomass growth rate [23]. Treatment parameters were applied using provincial guidelines on shelterwood system regeneration of red and white pine forests (Table 1). Aggregated retention mimics natural disturbances, such as windthrow or small wildfires, by leaving some forest patches intact. In contrast, dispersed retention simulates low-intensity disturbances, allowing for the sporadic survival of certain trees [25]. Tree clumping is retained at base level in unharvested control and aggregated crown retention treatments but is reduced in dispersed treatments [26] (Figure 1).

2.2. Data

We collected LiDAR data and RGB imagery of the study site in July of 2023 using a DJI Matrice 600 (SZ DJI Technology Co., Ltd., Shenzhen, China) remotely piloted UAV fitted with an integrated Riegl MiniVUX-1 (RIEGL Laser Measurement Systems GmbH, Horn, Austria) LiDAR sensor. The UAV was flown at 60 m above ground level, and LiDAR data was acquired with scan lines separated by 0.1 m and constrained to a 120° field of view. The flight plan used parallel flight lines spaced 22 m apart, resulting in images with 75% sidelap and 80% forward overlap, and a ground sampling distance of 0.01–0.02 m. After preprocessing to filter out erroneous points, the LiDAR data yielded an average point density of 650.7 points/m2. LiDAR data covered all 14 plots of the study site, but RGB imagery in the northern corner and eastern section of the site, including plots 55A2, 55D2, and 33A1, was constrained by orthorectification limitations and was excluded.
We also collected tree height, crown diameter, and DBH field measurements for 72 trees in the study site. Only 57 of these trees were within the extent of the RGB imagery coverage. Crown diameter was derived from the average crown measurements in the north–south and east–west directions (Figure 2). Height was calculated from the average distance and angle measurements taken by a clinometer and a Nikon Forestry Pro II Laser Rangefinder using Equation (1) (Figure 2).
H = D·Tanθ + Hi
where H is the tree height, D is the distance to the tree, θ is the angle between eye level and the treetop, and Hi is the height at eye level.
DBH was determined using measuring tape at 1.3 m above the ground. We also recorded the geographic locations of the sampled trees using GPS. To capture the leaf-off season, LiDAR, RGB, and field data were also collected in December of 2023 using the same sampled trees. Only the leaf-off LiDAR data was used in this study to classify tree species as hardwood and softwood (see details in Section 2.3).

2.3. Individual Tree Detection and Delineation

We constructed a 0.25 m resolution CHM from the LiDAR point cloud and identified tree locations and heights using a local maximum filter with a window size of 2 m. We applied a height threshold between 15 and 40 m, which was determined from previous height surveys of the study area, to filter out point cloud errors and retain mature trees [24]. Through an MCWS algorithm, the treetops were inverted into sinks and stratified into several layers based on a height interval. A pouring algorithm filled layers, starting from the lowest, with water until the sink was completely filled [14]. Tree crowns were delineated using the edge of the water in each pit, yielding crown area, which was used to calculate crown diameter with the assumption that the crown is circular to address hidden coverage due to overlapping (Equation (2)):
C D = 2 C A π
where CD is crown diameter and CA is crown area.
The local maximum filter and MCWS were applied for both leaf-on and leaf-off CHMs. Tree crowns were classified into hardwood or softwood species using a ΔCA threshold calculated from leaf-on and leaf-off CHMs. This threshold was derived from a previous survey of seasonal canopy variation in the study site and differed between VRH treatments [23]. To fully delineate crowns for both hardwood and softwood trees in the study area, we only kept predictions from the leaf-on CHM after classification.
To generate self-supervised predictions from RGB imagery, we used DeepForest, an open-source deep learning neural network developed by Weinstein et al. [21]. The convolutional neural network uses a RetinaNet one-stage detector, which combines object detection and classification into a single network for faster training and decreased sensitivity to the magnitude of bounding box proposals. For classification, the neural network uses a ResNet-50 backbone pretrained on an ImageNet dataset. After training on annotations of trees within aerial RGB images, the model detects and delineates trees for a given image, returning a bounding box for each predicted tree. The original neural network was trained on data from the National Ecological Observatory Network, but we trained the model using the delineated crowns derived from the MCWS algorithm [22]. We divided the RGB images and the predictions from MCWS into spatial subsets for each individual plot in the study site to minimize overfitting between thinning treatments. The RGB images have a spatial resolution of 0.05 m and were split into window sizes of 400 by 400 pixels to provide adequate context for tree detection. To account for the high stand density of the study site, we allowed a window overlap of 25% to capture trees divided among images [21]. For each spatial subset of LiDAR-derived crown polygons, we extracted bounding boxes and used them as annotations for training. Bounding box predictions generated from the model were merged with height and crown perimeter information of polygons generated from the unsupervised LiDAR algorithm based on the intersection-over-union threshold. We applied a weighted logarithmic algorithm based on the perimeter of the crown predictions to define crown diameter and shared boundaries between overlapping predictions [28,29] (Figure 3).

2.4. Tree-Level Aboveground Biomass (AGB) Estimation and Validation

The database Tallo contains nearly 500,000 records of field measurements from over 5000 tree species worldwide. We identified 22 common tree species in Canada and extracted DBH, crown diameter, and biomass information for the species records, both in open- and closed-canopy forests [9]. We conducted a regression analysis between DBH and crown diameter to create crown diameter-based AGB allometric equations for each species found in our study site (Table 2) [30,31].
The crown diameter-based equations were substituted into existing DBH-based allometric equations provided by Lambert et al. [4] (Equation (3)). The parameters a and b are exponents of the weight function of these allometric equations. Species-specific parameter values were derived from archival DBH, crown diameter, and biomass data collected by Jucker et al. [9]:
𝐷𝐵𝐻 = 𝑎∙𝐶𝐷 + 𝑏
The DBH was then used to calculate AGB from estimated model parameters for each species’ respective biomass component (βi) (Equations (4) and (5)):
𝐴𝐺𝐵total = 𝐴𝐺𝐵wood + 𝐴𝐺𝐵bark + 𝐴𝐺𝐵foliage + 𝐴𝐺𝐵branches
𝐴𝐺𝐵i = 𝛽i1∙𝐷𝐵𝐻𝛽i2∙𝐻𝛽i3
where H is the tree height.
We also estimated the AGB change (ΔAGB) in trees using the delineated crowns and previous DBH inventory data before the application of VRH treatments at the study site. We extracted DBH from the crown diameter of delineated crowns using Equation (3) and calculated ΔAGB using a survey of the mean annual DBH change in mature trees at the site after VRH treatment was implemented.
Delineated crowns generated from the unsupervised and self-supervised predictions were matched with ground validation data through a direct intersection between the crown polygon and the ground truth location. We assessed the detection rate as the proportion of ground truth trees matched with the predicted crowns. AGB in the ground validation data was calculated from height and DBH measurements using Equations (4) and (5). We used adjusted R2 (Ra2) and root mean squared error (RMSE) as accuracy metrics to evaluate the performance of the crown diameter, tree height, and AGB predictions with the ground validation data.

3. Results

3.1. Unsupervised and Self-Supervised Methods for Crown, Height, and AGB Estimation

We first analyzed the performance of crown delineation, height, and AGB estimations from UAV LiDAR data. Initial treetop detection and crown delineation using the unsupervised LiDAR-based algorithm identified 5122 trees in the study site with an average height and range of 24.4 m and 15.0–34.0 m, respectively. Stand height is consistent with a pre-harvest forest inventory survey of the site conducted in 2011, which yielded a mean height of 23.8 ± 2.8 m [24]. The estimated mean and range of the crown diameter were 5.0 m and 1.2–15.4 m, respectively. Crowns delineated with the unsupervised LiDAR algorithm matched 67 trees in the ground truth data, with a detection rate of 93.06%. Overall, estimations for height were stronger than those for crown diameter (Figure 4). Amongst the treatments, model performances for crown diameter and height estimations were strongest in the unharvested control plot. AGB estimations in the harvested treatment plots outperformed those in the unharvested control plots (Figure 4c).
Treetop detection and crown delineation using the self-supervised RGB model identified 3482 trees within the spatial extent of the RGB imagery. The trees have height and crown diameter means of 24.01 m and 4.95 m, respectively. Crowns delineated with the self-supervised RGB model matched 43 trees in the ground truth data, with a detection rate of 75.44%. Overall, RGB-based predictions for crown diameter and AGB outperformed their respective LiDAR-based predictions, while height predictions remained even (Figure 4). Amongst the treatments, predictions for height and estimated AGB were strongest in the unharvested control (Figure 4e,f). However, crown diameter predictions in the unharvested control plot were weaker than in the harvested treatment plots, and performed worse than those from fully supervised deep learning approaches [19] (Figure 4d).

3.2. The Impact of Tree Density and Aggregation on Estimating Tree-Level AGB

Amongst harvested treatments, AGB estimation from both LiDAR and RGB data is most accurate when 33% of the basal area is retained (mean across LiDAR 33A and 33D Ra2 = 0.40, mean across LiDAR 33A and 33D p < 0.05, mean across RGB 33A and 33D Ra2 = 0.73, mean across RGB 33A and 33D p < 0.001), which is also the treatment with the lowest stand density. Dispersed treatments with reduced tree clumping perform worse with self-supervised RGB deep learning than aggregated treatments (mean across 33D and 55D Ra2 = 0.43, mean across 33D and 55D p < 0.05, mean across 33A and 55A Ra2 = 0.57, mean across 33A and 55A p < 0.001). For unsupervised LiDAR predictions, aggregated treatments that retain baseline tree clumping perform similarly to dispersed treatments when treatment is severe but perform much weaker in moderate treatments (Table 3) [23,26].

3.3. Estimating AGB Density and Growth

Amongst the delineated crowns generated by the self-supervised RGB model, the total estimated AGB of mature trees in the study site is 1,006,042 kg, with a density of 10.1 kg m−2 across the spatial extent of the RGB imagery. AGB density in the unharvested control (16.5 kg m−2) is consistent with estimates for other unharvested forest stands within the same ecoregion [32]. Amongst harvested treatments, the AGB density is higher with moderate VRH (mean across 55A and 55D = 9.3 kg m−2, mean p < 0.001) compared to severe VRH (mean across 33A and 33D = 7.1 kg m−2, mean p < 0.001) and comparable between aggregated thinning (mean across 33A and 55A = 8.4 kg m−2, mean p < 0.001) and dispersed thinning (mean across 33D and 55D = 8.0 kg m−2, mean p < 0.001) (Figure 5a).
AGB change (ΔAGB) was estimated using delineated crowns and pre-treatment DBH inventory data. Crown diameters estimated using the UAV were converted to DBH (Equation (3)) to calculate post-treatment AGB. Finally, ΔAGB was calculated as the estimated AGB difference between post- and pre-treatment. The mean annual ΔAGB density for the study area is 0.15 kg yr−1 m−2, with the mean annual ΔAGB density being greater in the unharvested control plots (mean = 0.18 kg yr−1 m−2) compared to the harvested treatment plots (mean across harvested treatments = 0.15 kg yr−1 m−2, mean p < 0.001). In harvested treatments, annual ΔAGB density is lower in moderate VRH (mean across 55A and 55D = 0.09 kg yr−1 m−2, mean p < 0.001) compared to severe VRH (mean across 33A and 33D = 0.21 kg yr−1 m−2, mean p < 0.001), while annual ΔAGB density is higher in dispersed thinning (mean across 33D and 55D = 0.17 kg yr−1 m−2, mean p < 0.001) compared to aggregated thinning (mean across 33A and 55A = 0.13 kg yr−1 m−2, mean p < 0.001) (Figure 5b).

4. Discussion and Summary

4.1. LiDAR- and RGB-Based Tree Height Estimation and Crown Delineation

In this study, we demonstrated the feasibility of using UAV LiDAR and RGB data for estimating tree-level canopy height, crown area, and eventually AGB for 14 1-ha forest stands with varying stand density and tree distribution. Our approach combines an unsupervised LiDAR segmentation algorithm and a self-supervised RGB deep learning model to improve forest inventory data collection, particularly under VRH treatments. The unsupervised LiDAR method applied modified MCWS for tree crown delineation, while tree heights were extracted using a local maxima filtering approach. A self-supervised deep learning model was trained on RGB imagery using LiDAR-derived annotations, allowing crown delineation in the absence of extensive ground truth data. This dual approach aimed to assess AGB estimation accuracy across different forest stand structures and management regimes. In comparison with UAV LiDAR-based studies conducted in unharvested forests in other regions across the world, the performance of our unsupervised LiDAR algorithm is consistent with local maximum filtering for height, but weaker with inverse watershed segmentation of tree crowns. Panagiotidis et al. [13] yielded similar height accuracy (Ra2 = 0.72–0.75) and stronger crown delineation (Ra2 = 0.63–0.85) in a smaller, primarily coniferous forest.
There are three major challenges with delineating tree crowns using LiDAR, which are reflected in the unsupervised LiDAR algorithm. First, treetop detection is limited in mixed forests, with omission errors common for smaller crown structures and trees hidden under the canopy [14]. Leaf-off LiDAR aided in the detection and classification of smaller hardwood trees within the study area, but improvement is marginal when mixed with taller softwood trees. Canopy compositions in stands undergoing VRH treatments are less dominated by mature red pine trees, and the improved pulse penetration enables more accurate capture of inventory data [23,33]. Second, the water pouring algorithm in MCWS relies on height variation for region expansion, particularly along crown boundaries, to avoid over-expansion. Height variation is greater in plots with lower stand densities or those undergoing dispersed VRH treatment where mature red pines are more spread apart, improving differentiation between water expansion boundary cells and adjacent treetops [34]. Our approach applies two solutions, using a high-resolution LiDAR point cloud to construct the CHM to help preserve some height variation and masking non-tree areas with a height threshold to allow clearer segmentation along boundaries [15]. Third, tree clumping is particularly prevalent in mixed and deciduous forest stands, with commission error in treetop detection common with regenerating broadleaf trees. Young broadleaf stands such as black oak or red maple (Acer rubrum) fill the harvested gaps left behind by aggregated VRH, and false positives may occur when delineating large canopies due to multi-foliage clumps and lateral branches. We screen out over-segmentation using an angle threshold between height and spatial distance differences, improving delineation in dispersed and unharvested treatments where broadleaf and coniferous species are more evenly mixed [14,35].
These challenges with LiDAR-based tree crown delineation highlight the mixed performances of AGB estimations, especially when applied with our crown diameter-based allometric equations. Training the self-supervised RGB model on LiDAR-derived annotations addresses the lack of training data available for forests undergoing VRH treatment. Incorporating the vertical and colour features of trees into the deep learning approach limited the under- and over-segmentation of crowns observed with unsupervised LiDAR delineation. The self-supervised RGB model is less effective when delineating crowns in more complex canopy conditions such as the unharvested control, and existing models that are pretrained on much larger datasets would be better suited for unmanaged forests. A more complex convolutional neural network that refines bounding box classification using additional features like shadows may aid with crown boundary identification [36]. In previous studies, crown size has been used to develop regression models for tree height in Canadian forests, particularly in stands with uniform species or age. The crown–height relationship is less clear in mixed forests with complex horizontal and vertical structures, and accurate crown-to-height prediction using RGB-based deep learning delineations would require additional species and age labelling from manual annotations [37,38]. For height estimation, crown delineations generated by a self-supervised RGB model are more effective for developing a crown boundary mask to extract tree height from the CHM.

4.2. Tree-Level AGB Estimation

Quantifying AGB in stands depends on accurate relationships between key biomass determinants such as height and crown area. Although growth models often project an inverse relationship between height and crown diameter, MCWS may inaccurately capture the crown ratio, as the full crown of taller trees are segmented and the canopies of smaller trees are partially hidden. The variance in height and crown between in situ measurements and LiDAR methods leads to disagreements in AGB estimates [39]. Inaccurate AGB estimations also occur due to the overestimation of tree height in stands of varying tree apex and branch structures. Integrating height into the weighted analysis of initial crown delineations from the RGB deep learning model helps account for age, structure, and species-specific changes in the crown ratio. Although this approach can lead to crown underestimation in taller trees, incorporating crown recession in AGB estimates reflects in situ observations better than unsupervised algorithms relying solely on airborne laser scanning [40]. Nevertheless, both unsupervised LiDAR and self-supervised RGB approaches are less impacted by canopy obstruction and tree apex variance in stands with smaller densities. Especially in severely managed forests, a smaller density of residual trees allows the accurate capture of the vertical structure and full canopy profile, resulting in more precise sinks for MCWS and subsequently higher-quality annotations for deep learning model training.
Trees in stands undergoing moderate dispersed harvesting are spaced closer together compared to severe dispersed treatment stands, which can make tree classification for species-specific allometric AGB equations more difficult. This is less of an issue for unsupervised LiDAR predictions, where mature softwood and young hardwood trees can be differentiated by height threshold and crown area change between leaf-on and leaf-off seasons. However, species classification using spectral signatures is unreliable in crowded mixed stands of softwood and hardwood trees. Species common in mixed coniferous and deciduous forests have similar spectral reflectance properties in the visible spectrum, which may lead to species misclassification in AGB estimation. A self-supervised deep learning model relying on imagery would need to use near-infrared (NIR) reflectance or additional properties such as texture or seasonal phenology [41]. In moderate aggregated treatment, hardwoods and softwoods are clumped separately into dense homogeneous groups, allowing the self-supervised deep learning model to pick up on minor differences in spectral signatures between species more easily. In contrast, dense clusters of trees with a similar height and crown structure can lead to high overlap between branches and crown boundaries, leading to missed or under-segmented crowns [42]. As a result, delineations for plots with moderate aggregated thinning were more accurate when made with RGB-based deep learning than with LiDAR-based segmentation alone.
The allometric equations used to estimate DBH from height and crown diameter leave room for improvement. While Equation (2) standardizes irregular canopies and aids with automation, AGB estimation requires a more comprehensive approach to geometric differences in crown area [43]. Our allometric equations account for interspecies variation in the crown diameter-to-area relationship but could not also consider VRH treatments due to the lack of available archival DBH, crown diameter, and biomass data for VRH sites in Canada.

4.3. Biomass Growth Response of VRH

The study area is located within the Carolinian zone of Southern Ontario, an ecoregion characterized by high biodiversity and vegetation growth [32]. The rich growth environment enhances biomass regeneration, especially in comparison to other mixed forests undergoing active harvest management [44,45]. Canopy gaps left behind in harvest treatment plots enhance the below-canopy light environment and encourage the advanced regeneration of red pine and other species [46]. However, most broadleaf stands at our site were within the understory layer and too short to be fully delineated by the self-supervised RGB deep learning model, which is trained on mature crowns. Softwood species also contain less biomass across all tree components compared to residual red pines, which contribute the most to mature-tree AGB as reflected in biomass trends between stand densities [47]. Nonetheless, tree biomass growth benefits from gaps within the forest matrix created by VRH treatments, which limits competition for sunlight and nutrients with neighbouring trees. Particularly at higher intensities, thinning treatments like VRH reduce horizontal-spacing competition amongst mature trees, enhancing biomass growth through increased access to resources [48]. The effect is limited in aggregated thinning, where horizontal spacing between trees is minimally changed and excessive clustered gaps within the forest matrix introduce soil drainage problems [49]. Overall, amongst the VRH treatments in our study, biomass growth benefits the most from severe dispersed thinning and the least from moderate aggregated thinning, consistent with previous in situ studies conducted at our site (e.g., Zugic et al. [24]).

4.4. Conclusions and Outlook

While our self-supervised deep learning approach can be reproducible in small forests with local LiDAR and RGB datasets, there are two major limitations when extrapolating height and crown information to other biophysical characteristics. First, allometric DBH and AGB relationships were derived from a database that may be incompatible with certain biomass models. Specifically, biomass components such as foliage or fruit are unavailable, and some trees were excluded due to the lack of crown diameter data. Data availability for common Canadian tree species is limited, so we grouped some missing species into general softwood or hardwood categories for DBH and AGB calculations [9,50]. Databases like Tallo, which compiles individual studies conducted using different growing environments and measurement methods, may also be unreliable for focus areas under specific conditions [9]. We recommend exploring local datasets to supplement the estimation of stand inventory in mixed forests, as the relationship between height and crown diameter, and eventually that with AGB, can vary between forest management regimes, growth environments, species compositions, and other factors. A more recent forest inventory database that includes isolated forests with natural ecosystems and different stand densities can expand the scope and application of our allometric equations. It should also be supplemented with regular UAV data collection to estimate tree height and crown area change for ΔAGB calculations. Second, while delineated crowns from the self-supervised RGB model provide an automated and substantially cheaper alternative to quantifying AGB and ΔAGB, the model does not take into consideration shrubs and young trees in its estimation, only sizeable trees. The height thresholds required for proper delineation of crown boundaries mask understory vegetation and short trees, and the approach might work best for assessing biomass and C uptake changes in forests where the understory is a small contributor [51]. Thus, estimates made by the self-supervised method should be considered additional reference data in guiding forest management pathways rather than a primary indicator for long-term trends in biomass growth and climate mitigation at all levels of an ecosystem. We suggest additional research into self-supervised crown delineation and height estimation in stands dominated by broadleaf species or young saplings.
Although our study was limited to 3482–5122 trees across a 14 ha plot, it provides insight into integrating multi-source remote sensing data and self-supervised algorithms into forest inventory programs on a large scale to improve the efficiency of acquiring information critical to the sustainable management of forests in the face of climate change. Nonetheless, our study is complemented by the varying shape and intensity of experimental thinning, which was expected to have the largest impact on the crown and tree dimension relationship with AGB in the construction of allometric equations. MCWS, when supplemented with self-supervised deep learning, was particularly effective in estimating biomass components in unharvested and severely thinned forests but less effective in moderately thinned forests. This approach is a cheaper and less labour-intensive forest inventory alternative to traditional in situ methods, only dependent on the availability of aerial LiDAR data and RGB imagery. It can be useful for tracking biomass and forest C storage changes across time and management regimes, such as plantations before and after a harvest treatment. To expand the applications of self-supervised deep learning from remote sensing observations, our approach should be tested to evaluate the biomass outcomes of other silvicultural interventions and forest management regimes. We also encourage further research on the application of unsupervised LiDAR-based crown delineations for training other neural network architectures, such as U-Net, that can operate on limited amounts of annotations. As deep learning neural networks are becoming more popular as a method for tree crown delineation and biomass estimation, the accuracy and performance of the predictions must be properly evaluated, particularly in the context of mixed forest stands with complex canopy structures and biodiversity.

Author Contributions

K.S.: Writing—review and editing, Writing—original draft, Methodology, Investigation, Formal analysis, Data curation, Conceptualization. J.C. (Jenny Chau): Writing—review and editing, Data curation. S.R.: Writing—review and editing, Data curation. D.T.R.: Writing—review and editing, Resources, Project administration, Data curation. J.C. (Jiaxin Chen): Writing—review and editing, Resources. D.C.: Writing—review and editing, Project administration, Funding acquisition. A.G.: Writing—review and editing, Writing—original draft, Supervision, Resources, Project administration, Methodology, Investigation, Funding acquisition, Data curation, Conceptualization. All authors have read and agreed to the published version of the manuscript.

Funding

This research was funded by the Natural Sciences and Engineering Research Council of Canada (NSERC) Alliance Grant (RGPIN-2020-05,708), and the Environment and Climate Change Canada (ECCC) Grants and Contributions program (GCXE24S085).

Data Availability Statement

The raw data supporting the conclusions of this article will be made available by the authors on request.

Conflicts of Interest

Author Sean Rudd was employed by the company Korotu Technology Inc. The remaining authors declare that the research was conducted in the absence of any commercial or financial relationships that could be construed as a potential conflict of interest.

References

  1. Martire, S.; Castellani, V.; Sala, S. Carrying capacity assessment of forest resources: Enhancing environmental sustainability in energy production at local scale. Resour. Conserv. Recycl. 2015, 94, 11–20. [Google Scholar] [CrossRef]
  2. Gonsamo, A.; Chen, J.M. Evaluation of the GLC2000 and NALC2005 land cover products for LAI retrieval over Canada. Can. J. Remote Sens. 2011, 37, 302–313. [Google Scholar] [CrossRef]
  3. Sothe, C.; Gonsamo, A.; Arabian, J.; Kurz, W.A.; Finkelstein, S.A.; Snider, J. Large Soil Carbon Storage in Terrestrial Ecosystems of Canada. Glob. Biogeochem. Cycles 2022, 36, e2021GB007213. [Google Scholar] [CrossRef]
  4. Lambert, M.C.; Ung, C.H.; Raulier, F. Canadian national tree aboveground biomass equations. Can. J. For. Res. 2005, 35, 1996–2018. [Google Scholar] [CrossRef]
  5. Iglhaut, J.; Cabo, C.; Puliti, S.; Piermattei, L.; O’Connor, J.; Rosette, J. Structure from Motion Photogrammetry in Forestry: A Review. Curr. For. Rep. 2019, 5, 155–168. [Google Scholar] [CrossRef]
  6. Pappas, C.; Bélanger, N.; Bergeron, Y.; Blarquez, O.; Chen, H.Y.; Comeau, P.G.; De Grandpré, L.; Delagrange, S.; DesRochers, A.; Diochon, A.; et al. Smartforests Canada: A Network of Monitoring Plots for Forest Management Under Environmental Change. In Climate-Smart Forestry in Mountain Regions; Managing Forest Ecosystems; Springer: Cham, Switzerland, 2022; Chapter 16; pp. 521–543. [Google Scholar]
  7. Xu, D.; Wang, H.; Xu, W.; Luan, Z.; Xu, X. LiDAR Applications to Estimate Forest Biomass at Individual Tree Scale: Opportunities, Challenges and Future Perspectives. Forests 2021, 12, 550. [Google Scholar] [CrossRef]
  8. White, J.C.; Coops, N.C.; Wulder, M.A.; Vastaranta, M.; Hilker, T.; Tompalski, P. Remote Sensing Technologies for Enhancing Forest Inventories: A Review. Can. J. Remote Sens. 2016, 42, 619–641. [Google Scholar] [CrossRef]
  9. Jucker, T.; Fischer, F.J.; Chave, J.; Coomes, D.A.; Caspersen, J.; Ali, A.; Loubota Panzou, G.J.; Feldpausch, T.R.; Falster, D.; Usoltsev, V.A.; et al. Tallo: A global tree allometry and crown architecture database. Glob. Chang. Biol. 2022, 28, 5254–5268. [Google Scholar] [CrossRef]
  10. Dalponte, M.; Coomes, D.A. Tree-centric mapping of forest carbon density from airborne laser scanning and hyperspectral data. Methods Ecol. Evol. 2016, 7, 1236–1245. [Google Scholar] [CrossRef]
  11. Kim, S.R.; Kwak, D.A.; Lee, W.K.; Son, Y.; Bae, S.W.; Kim, C.; Yoo, S. Estimation of carbon storage based on individual tree detection in Pinus densiflora stands using a fusion of aerial photography and LiDAR data. Sci. China Life Sci. 2010, 53, 885–897. [Google Scholar] [CrossRef]
  12. Ni-Meister, W.; Lee, S.; Strahler, A.H.; Woodcock, C.E.; Schaaf, C.; Yao, T.; Ranson, K.J.; Sun, G.; Blair, J.B. Assessing general relationships between aboveground biomass and vegetation structure parameters for improved carbon estimate from lidar remote sensing. J. Geophys. Res. Biogeosci. 2010, 115, G00E11. [Google Scholar] [CrossRef]
  13. Panagiotidis, D.; Abdollahnejad, A.; Surový, P.; Chiteculo, V. Determining tree height and crown diameter from high-resolution UAV imagery. Int. J. Remote Sens. 2016, 38, 2392–2410. [Google Scholar] [CrossRef]
  14. Yun, T.; Jiang, K.; Li, G.; Eichhorn, M.P.; Fan, J.; Liu, F.; Chen, B.; An, F.; Cao, L. Individual tree crown segmentation from airborne LiDAR data using a novel Gaussian filter and energy function minimization-based approach. Remote Sens. Environ. 2021, 256, 112307. [Google Scholar] [CrossRef]
  15. Yin, D.; Wang, L. Individual mangrove tree measurement using UAV-based LiDAR data: Possibilities and challenges. Remote Sens. Environ. 2019, 223, 34–49. [Google Scholar] [CrossRef]
  16. Wielgosz, M.; Puliti, S.; Xiang, B.; Schindler, K.; Astrup, R. SegmentAnyTree: A sensor and platform agnostic deep learning model for tree segmentation using laser scanning data. Remote Sens. Environ. 2024, 313, 114367. [Google Scholar] [CrossRef]
  17. Hao, Z.; Lin, L.; Post, C.J.; Mikhailova, E.A.; Li, M.; Chen, Y.; Yu, K.; Liu, J. Automated tree-crown and height detection in a young forest plantation using mask region-based convolutional neural network (Mask R-CNN). ISPRS J. Photogramm. Remote Sens. 2021, 178, 112–123. [Google Scholar] [CrossRef]
  18. Freudenberg, M.; Magdon, P.; Nölke, N. Individual tree crown delineation in high-resolution remote sensing images based on U-Net. Neural Comput. Appl. 2022, 34, 22197–22207. [Google Scholar] [CrossRef]
  19. Brandt, M.; Tucker, C.J.; Kariryaa, A.; Rasmussen, K.; Abel, C.; Small, J.; Chave, J.; Rasmussen, L.V.; Hiernaux, P.; Diouf, A.A.; et al. An unexpectedly large count of trees in the West African Sahara and Sahel. Nature 2020, 587, 78–82. [Google Scholar] [CrossRef]
  20. Leckie, D. Stand delineation and composition estimation using semi-automated individual tree crown analysis. Remote Sens. Environ. 2003, 85, 355–369. [Google Scholar] [CrossRef]
  21. Weinstein, B.G.; Marconi, S.; Bohlman, S.; Zare, A.; White, E. Individual Tree-Crown Detection in RGB Imagery Using Semi-Supervised Deep Learning Neural Networks. Remote Sens. 2019, 11, 1309. [Google Scholar] [CrossRef]
  22. Weinstein, B.G.; Marconi, S.; Aubry-Kientz, M.; Vincent, G.; Senyondo, H.; White, E.P.; Record, S. DeepForest: A Python package for RGB deep learning tree crown delineation. Methods Ecol. Evol. 2020, 11, 1743–1751. [Google Scholar] [CrossRef]
  23. So, K.; Rogers, C.A.; Li, Y.; Arain, M.A.; Gonsamo, A. Retention forestry as a climate solution: Assessing biomass, soil carbon and albedo impacts in a northern temperate coniferous forest. Sci. Total Env. 2024, 947, 174680. [Google Scholar] [CrossRef]
  24. Zugic, J.I.; Pisaric, M.F.J.; McKenzie, S.M.; Parker, W.C.; Elliott, K.A.; Arain, M.A. The Impact of Variable Retention Harvesting on Growth and Carbon Sequestration of a Red Pine (Pinus resinosa Ait.) Plantation Forest in Southern Ontario, Canada. Front. For. Glob. Chang. 2021, 4, 725890. [Google Scholar] [CrossRef]
  25. OMNRF. Forest Management Guide to Silviculture in the Great Lakes-St. Lawrence and Boreal Forests of Ontario; Government of Ontario: Toronto, ON, Cananda; Available online: https://www.ontario.ca/page/forest-management-guide-silviculture-great-lakes-st-lawrence-and-boreal-forests-ontario (accessed on 1 June 2025).
  26. Boyden, S.; Montgomery, R.; Reich, P.B.; Palik, B. Seeing the forest for the heterogeneous trees: Stand-scale resource distributions emerge from tree-scale structure. Ecol. Appl. 2012, 22, 1578–1588. [Google Scholar] [CrossRef]
  27. Bodo, A.V.; Arain, M.A. Effects of variable retention harvesting on canopy transpiration in a red pine plantation forest. Ecol. Process. 2022, 11, 28. [Google Scholar] [CrossRef]
  28. Wu, B.; Yu, B.; Wu, Q.; Huang, Y.; Chen, Z.; Wu, J. Individual tree crown delineation using localized contour tree method and airborne LiDAR data in coniferous forests. Int. J. Appl. Earth Obs. Geoinf. 2016, 52, 82–94. [Google Scholar] [CrossRef]
  29. Hu, B.; Jung, W. Individual Tree Crown Delineation from High Spatial Resolution Imagery Using U-Net. Int. Arch. Photogramm. Remote Sens. Spat. Inf. Sci. 2021, XLIII-B3-2021, 61–66. [Google Scholar] [CrossRef]
  30. Gering, L.R.; May, D.M. The Relationship of Diameter at Breast Height and Crown Diameter for Four Species Groups in Hardin County, Tennessee. South. J. Appl. For. 1995, 19, 177–181. [Google Scholar] [CrossRef]
  31. Hemery, G.E.; Savill, P.S.; Pryor, S.N. Applications of the crown diameter–stem diameter relationship for different species of broadleaved trees. For. Ecol. Manag. 2005, 215, 285–294. [Google Scholar] [CrossRef]
  32. Barakat, R.M. A Comparison of Aboveground Biomass Estimates from Different Allometric Formulas Using Vegetation Sampling Protocol in Rouge National Urban Park. Master’s Thesis, University of Toronto, Toronto, ON, Canada, 2017. [Google Scholar]
  33. Gatziolis, D.; Fried, J.S.; Monleon, V.S. Challenges to Estimating Tree Height via LiDAR in Closed-Canopy Forests: A Parable from Western Oregon. For. Sci. 2010, 56, 139–155. [Google Scholar] [CrossRef]
  34. Lisiewicz, M.; Kaminska, A.; Sterenczak, K. Influence of the correction method of CHM−based Individual Tree Detection results on the estimation of forest stand characteristics. Sylwan 2022, 166, 362–377. [Google Scholar] [CrossRef]
  35. Hu, B.; Li, J.; Jing, L.; Judah, A. Improving the efficiency and accuracy of individual tree crown delineation from high-density LiDAR data. Int. J. Appl. Earth Obs. Geoinf. 2014, 26, 145–155. [Google Scholar] [CrossRef]
  36. Qi, C.R.; Su, H.; Mo, K.; Guibas, L.J. PointNet: Deep Learning on Point Sets for 3D Classification and Segmentation. In Proceedings of the 2017 IEEE Conference on Computer Vision and Pattern Recognition (CVPR), Honolulu, HI, USA, 21–26 July 2017; pp. 77–85. [Google Scholar]
  37. Russell, M.B.; Weiskittel, A.R.; Kershaw, J.A. Comparing strategies for modeling individual-tree height and height-to-crown base increment in mixed-species Acadian forests of northeastern North America. Eur. J. For. Res. 2014, 133, 1121–1135. [Google Scholar] [CrossRef]
  38. Falkowski, M.J.; Smith, A.M.S.; Hudak, A.T.; Gessler, P.E.; Vierling, L.A.; Crookston, N.L. Automated estimation of individual conifer tree height and crown diameter via two-dimensional spatial wavelet analysis of lidar data. Can. J. Remote Sens. 2014, 32, 153–161. [Google Scholar] [CrossRef]
  39. Garber, S.M.; Monserud, R.A.; Maguire, D.A. Crown Recession Patterns in Three Conifer Species of the Northern Rocky Mountains. For. Sci. 2008, 54, 633–646. [Google Scholar] [CrossRef]
  40. Van Deusen, P.C.; Heath, L.S. Weighted analysis methods for mapped plot forest inventory data: Tables, regressions, maps and graphs. For. Ecol. Manag. 2010, 260, 1607–1612. [Google Scholar] [CrossRef]
  41. Martin, M.E.; Newman, S.D.; Aber, J.D.; Congalton, R.G. Determining Forest Species Composition Using High Spectral Resolution Remote Sensing Data. Remote Sens. Environ. 1998, 65, 249–254. [Google Scholar] [CrossRef]
  42. Wan Mohd Jaafar, W.S.; Woodhouse, I.H.; Silva, C.A.; Omar, H.; Abdul Maulud, K.N.; Hudak, A.T.; Klauberg, C.; Cardil, A.; Mohan, M. Improving Individual Tree Crown Delineation and Attributes Estimation of Tropical Forests Using Airborne LiDAR Data. Forests 2018, 9, 759. [Google Scholar] [CrossRef]
  43. Kutchartt, E.; Gayoso, J.; Guerra, J.; Pirotti, F.; Castagneri, D.; Matula, R.; Rojas, Y.; Olson, M.E.; Zwanzig, M. Shrub aboveground biomass estimation considering bulk volume geometry: General and specific models for 14 species in the Mediterranean central Chile. New For. 2024, 56, 13. [Google Scholar] [CrossRef]
  44. Boucher, Y.; Auger, I.; Arseneault, D.; Elzein, T.; Sirois, L. Long-term (1925–2015) forest structure reorganization in an actively managed temperate-boreal forest region of eastern North America. For. Ecol. Manag. 2021, 481, 118744. [Google Scholar] [CrossRef]
  45. Molina, E.; Valeria, O.; De Grandpre, L.; Ramirez, J.A.; Cyr, D.; Boulanger, Y. Projecting future aboveground biomass and productivity of managed eastern Canadian mixedwood boreal forest in response to climate change. For. Ecol. Manag. 2021, 487, 119016. [Google Scholar] [CrossRef]
  46. Nyamai, P.A.; Goebel, P.C.; Gregory Corace, R.; Hix, D.M. Regeneration patterns of key pine species in a mixed-pine forest indicate a positive effect of variable retention harvesting and an increase in recruitment with time. For. Ecosyst. 2020, 7, 50. [Google Scholar] [CrossRef]
  47. Westfall, J.A. A Comparison of Above-Ground Dry-Biomass Estimators for Trees in the Northeastern United States. North. J. Appl. For. 2012, 29, 26–34. [Google Scholar] [CrossRef]
  48. Kim, M.; Lee, W.-K.; Kim, Y.-S.; Lim, C.-H.; Song, C.; Park, T.; Son, Y.; Son, Y.-M. Impact of thinning intensity on the diameter and height growth ofLarix kaempferistands in central Korea. For. Sci. Technol. 2015, 12, 77–87. [Google Scholar] [CrossRef]
  49. Kanninen, M.; Pérez, D.; Montero, M.; Víquez, E. Intensity and timing of the first thinning of Tectona grandis plantations in Costa Rica: Results of a thinning trial. For. Ecol. Manag. 2004, 203, 89–99. [Google Scholar] [CrossRef]
  50. He, Q.; Chen, E.; An, R.; Li, Y. Above-Ground Biomass and Biomass Components Estimation Using LiDAR Data in a Coniferous Forest. Forests 2013, 4, 984–1002. [Google Scholar] [CrossRef]
  51. Bodo, A.V.; Parker, W.C.; Elliott, K.A.; Arain, M.A. Below canopy evapotranspiration in four different variable retention harvesting treatments in a red pine plantation forest. Hydrol. Process. 2023, 37, e14789. [Google Scholar] [CrossRef]
Figure 1. Location of the red pine stand in Southern Ontario, Canada (left). An aerial view of the study site, divided into 14 1-ha plots (right). The three-digit abbreviation of each plot represents the variable-retention harvesting treatment applied (see Table 1), and the last number is the replication number.
Remotesensing 17 02091 g001
Figure 2. Schematic diagram for measuring (a) crown diameter and (b) diameter at breast height (DBH) and the parameters for tree height. Crown diameter was determined from the mean measurements of north–south and east–west widths. The parameters for tree height were measured using a clinometer and a Nikon Forestry Pro II Laser Rangefinder.
Remotesensing 17 02091 g002
Figure 3. Workflow for generating self-supervised red, green, and blue (RGB) delineated crowns. (a) Treetop detection using local maximum filtering and canopy height model from light detection and ranging point cloud, (b) bounding box annotations of crowns delineated by marker-controlled watershed segmentation for training, (c) bounding box predictions by self-supervised RGB deep learning model, and (d) delineated crowns of self-supervised RGB bounding box predictions using intersection-over-union threshold and weighted logarithmic algorithm.
Remotesensing 17 02091 g003
Figure 4. Comparisons of the estimated (a) crown diameter, (b) height, and (c) AGB calculated using allometric equations developed from unsupervised light detection and ranging data against ground measurements. n = 67. Comparisons are also provided for the estimated (d) crown diameter, (e) height, and (f) AGB calculated using allometric equations developed from self-supervised red, green, and blue deep learning predictions against ground measurements. n = 43. The equations for the line of best fit and the adjusted R2 (Ra2) values for the unharvested control and for all variable-retention harvesting treatments are displayed. The p values for Ra2 are displayed in parentheses. The black line indicates the regression fit line while grey shading shows the 95% confidence intervals of mean prediction for the regression line. The green line is the 1:1 line.
Remotesensing 17 02091 g004
Figure 5. Comparisons of the estimated (a) AGB and (b) the annual AGB change (ΔAGB) in density calculated using allometric equations developed from self-supervised red, green, and blue deep learning predictions against ground measurements. ΔAGB was calculated using height and crown area predictions, and the growth in annual diameter at breast height from a previous inventory survey of the study area.
Remotesensing 17 02091 g005
Table 1. Characteristics of the variable-retention harvesting (VRH) treatments in the red pine stand. The canopy is primarily composed of red pine (Pinus resinosa), accompanied with a few other tree species, including white pine (Pinus strobus) and black oak (Quercus velutina). According to a pre-harvest survey in 2011, the mean height of red pine was 23.8 ± 2.8 m [24]. The mean diameter at breast height and age of trees in the study site are 28.3 cm and 93 years old, respectively [27]. The stand density represents the average density post-VRH treatment [23].
Plot AbbreviationBasal Area Retained Post-VRH Treatment (%)Pattern of ThinningStand Density (Trees Plot−1)
CON100No thinning432
33A33Aggregated178
33D33Dispersed118
55A55Aggregated213
55D55Dispersed235
Table 2. Parameters derived for allometric equations were used to predict the diameter at breast height (DBH, cm) from crown diameter (m) for common tree species found at the study site. The relationship between DBH and crown diameter was significant for all species. The parameters a and b are exponents of the weight function of the equations provided by Lambert et al. [4]. The values for the parameters were derived from a regression analysis of archival DBH, crown diameter, and biomass data collected by Jucker et al. [9]. n represents the number of data records used for each species.
Speciesabp ValueRa2n
Red Maple2.813.50<2.2∙10−160.44745
Sugar Maple3.91−0.53<2.2∙10−160.574840
Eastern White Pine5.171.02<2.2∙10−160.66328
Red Oak3.643.61<2.2∙10−160.68477
Black Cherry4.28−0.478.76∙10−150.5379
Red Pine5.504.34<2.2∙10−160.6778
Black Oak3.544.12<2.2∙10−160.68105
Table 3. Summary statistics for performance of AGB estimation based on tree height and crown diameter derived from unsupervised light detection and ranging data and self-supervised red, green, and blue deep learning model. AGB adjusted R2 (Ra2) is provided for each control (unharvested) and variable-retention harvesting (VRH) treatment that was applied at the study site and include average stand density and basal area retained post-VRH treatment [23]. The p values for Ra2 are displayed in parentheses.
Thinning
Treatment
Basal Area Retained (%)Stand Density (Trees plot−1)Ra2 LiDAR
(n = 67)
Ra2 RGB
(n = 43)
Control1004320.21 (0.06)0.80 (<0.001)
Aggregated331780.40 (<0.01)0.79 (<0.001)
Aggregated552130.04 (0.24)0.34 (0.13)
Dispersed331180.39 (0.11)0.66 (<0.05)
Dispersed552350.31 (<0.05)0.19 (0.18)
Overall2230.29 (<0.001)0.47 (<0.001)
Disclaimer/Publisher’s Note: The statements, opinions and data contained in all publications are solely those of the individual author(s) and contributor(s) and not of MDPI and/or the editor(s). MDPI and/or the editor(s) disclaim responsibility for any injury to people or property resulting from any ideas, methods, instructions or products referred to in the content.

