
Assessing the Influence of Environmental Factors on Landslide Frequency and Intensity in Northwestern Sichuan, SW China, Using Multi-Temporal Satellite Imagery
 ,
,  , ,
, , 
Abstract

1. Introduction
- (1)
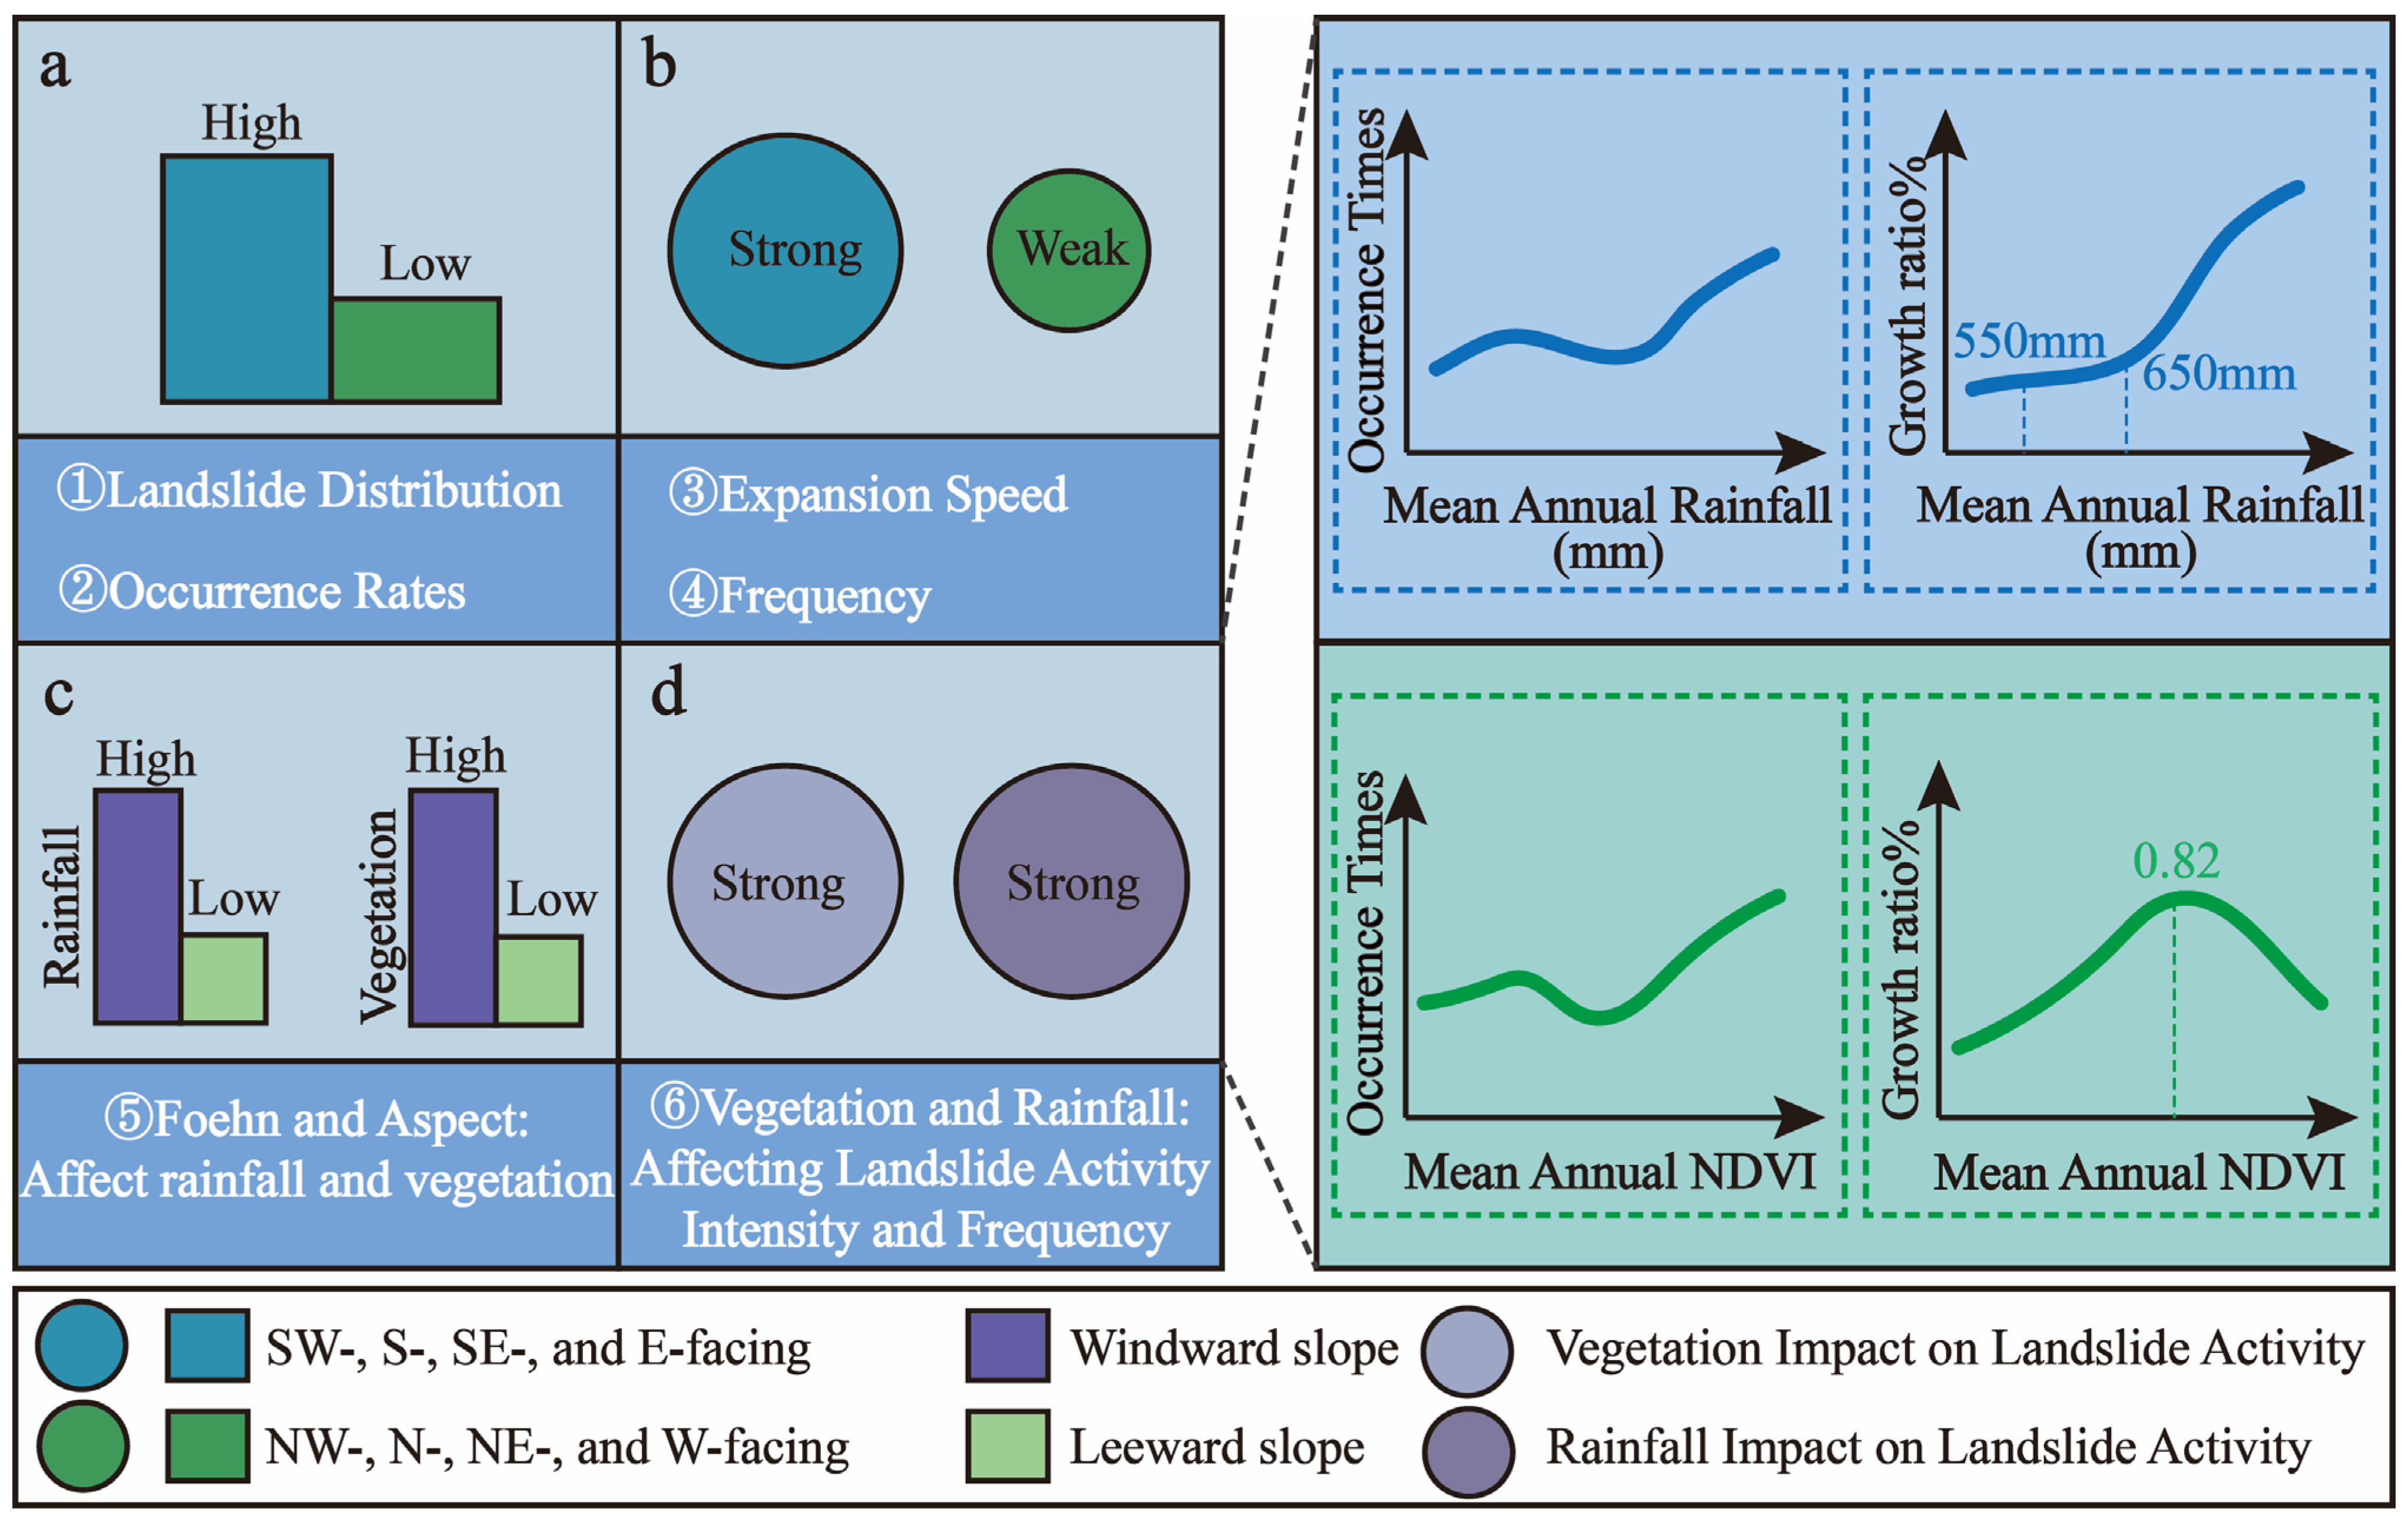
- Landslide distribution strongly correlates with slope aspect due to the Föhn effect.
- (2)
- East- and south-facing slopes show higher landslide frequency and greater area change.
- (3)
- Landslide area change is low (<550 mm rainfall) and high (>650 mm rainfall).
- (4)
- Landslide evolution positively correlates with the NDVI but reverses when the NDVI > 0.82.
- (5)
- A threshold model for landslide occurrence times based on the NDVI and rainfall is established.
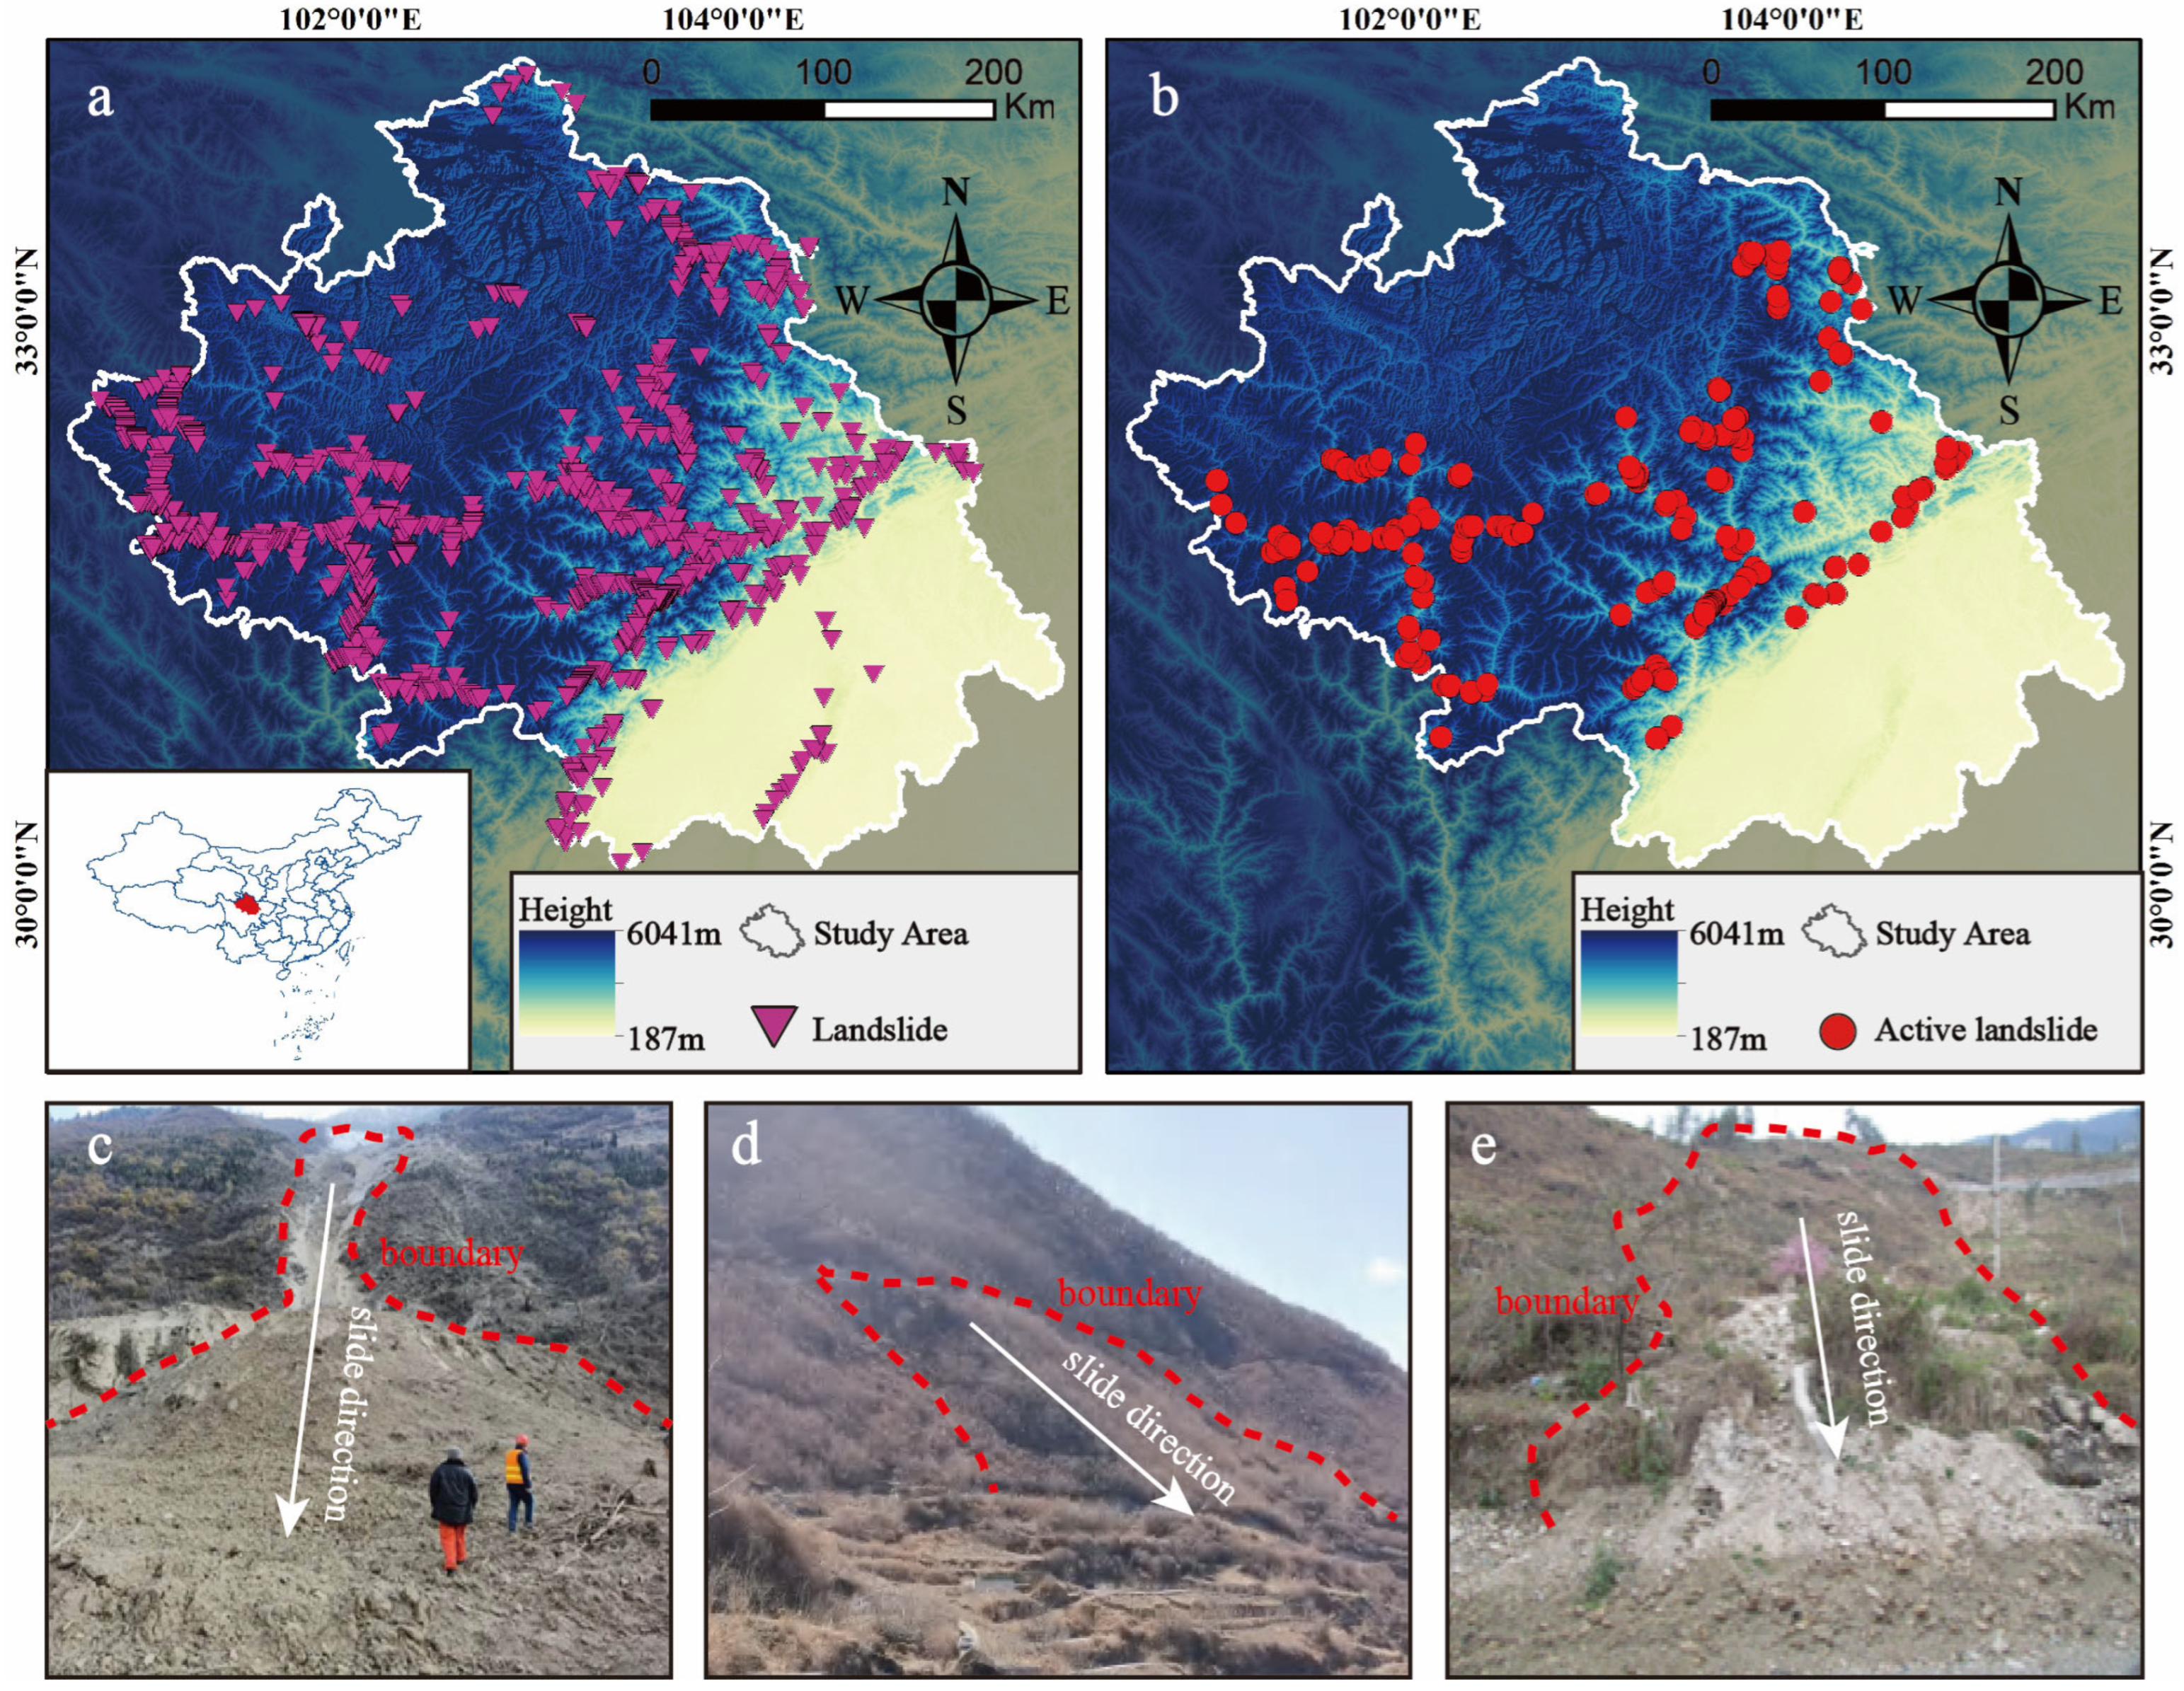
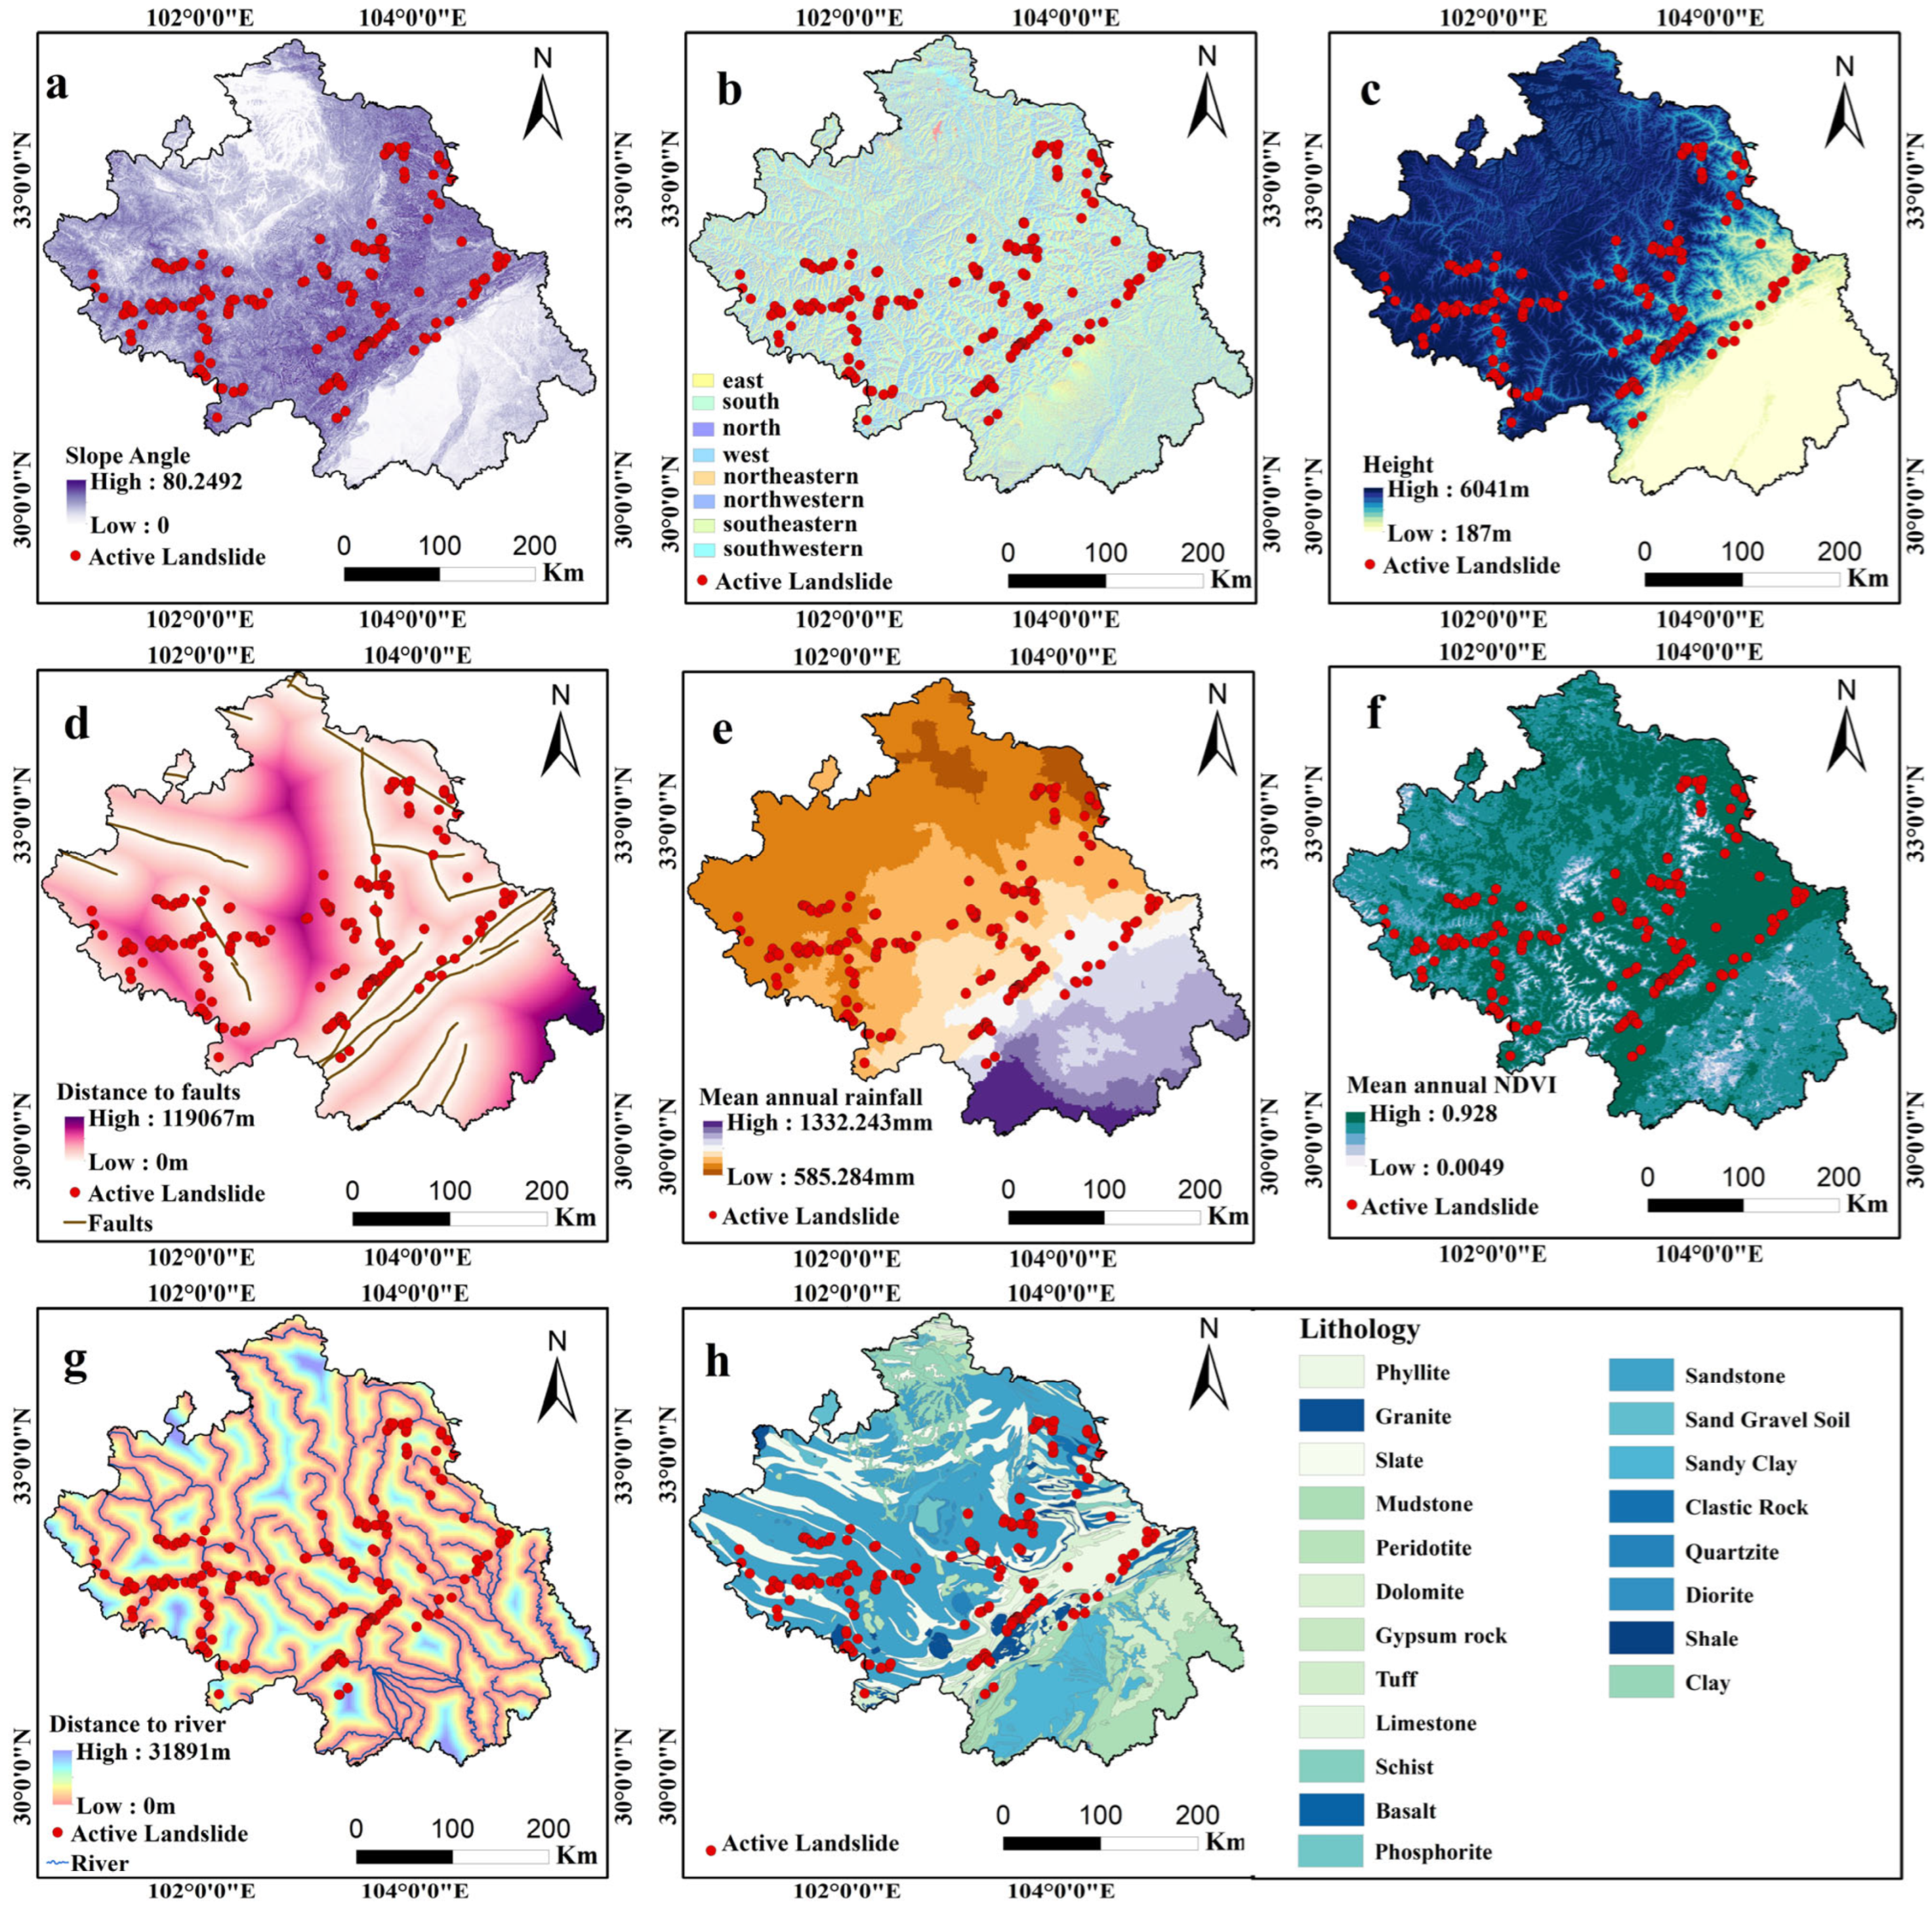
2. Data Sources and Methodology
2.1. Data Sources
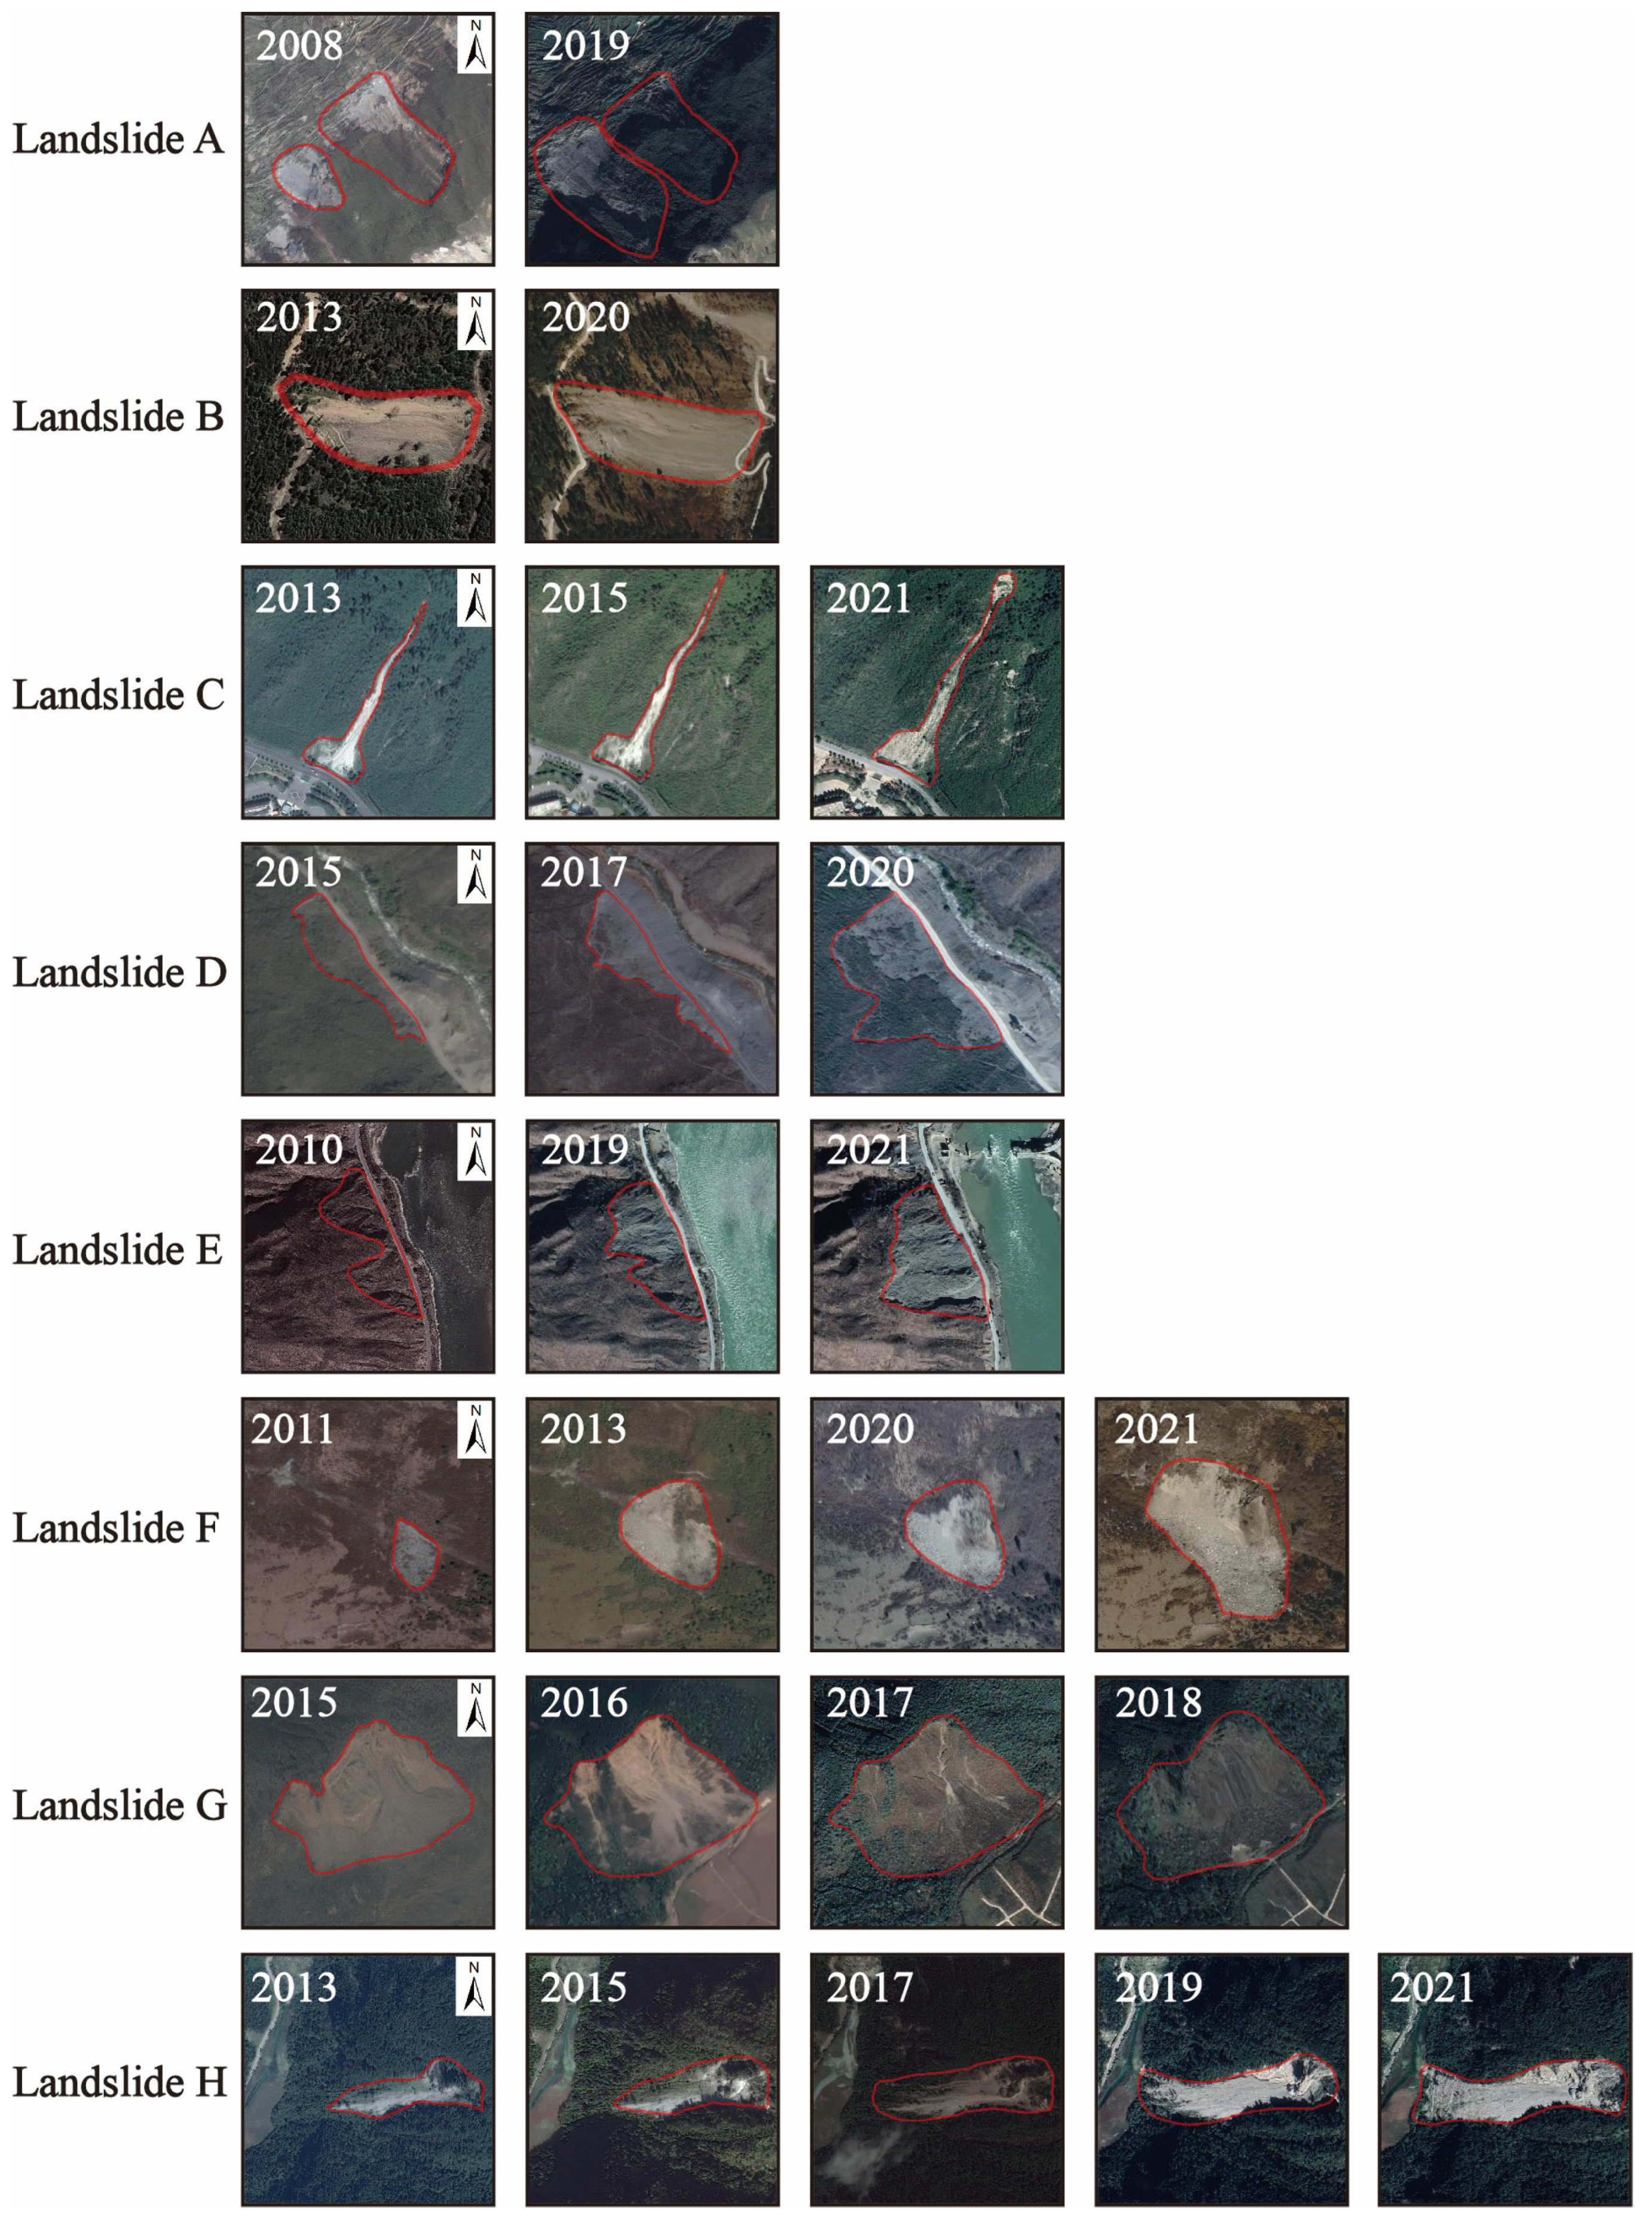
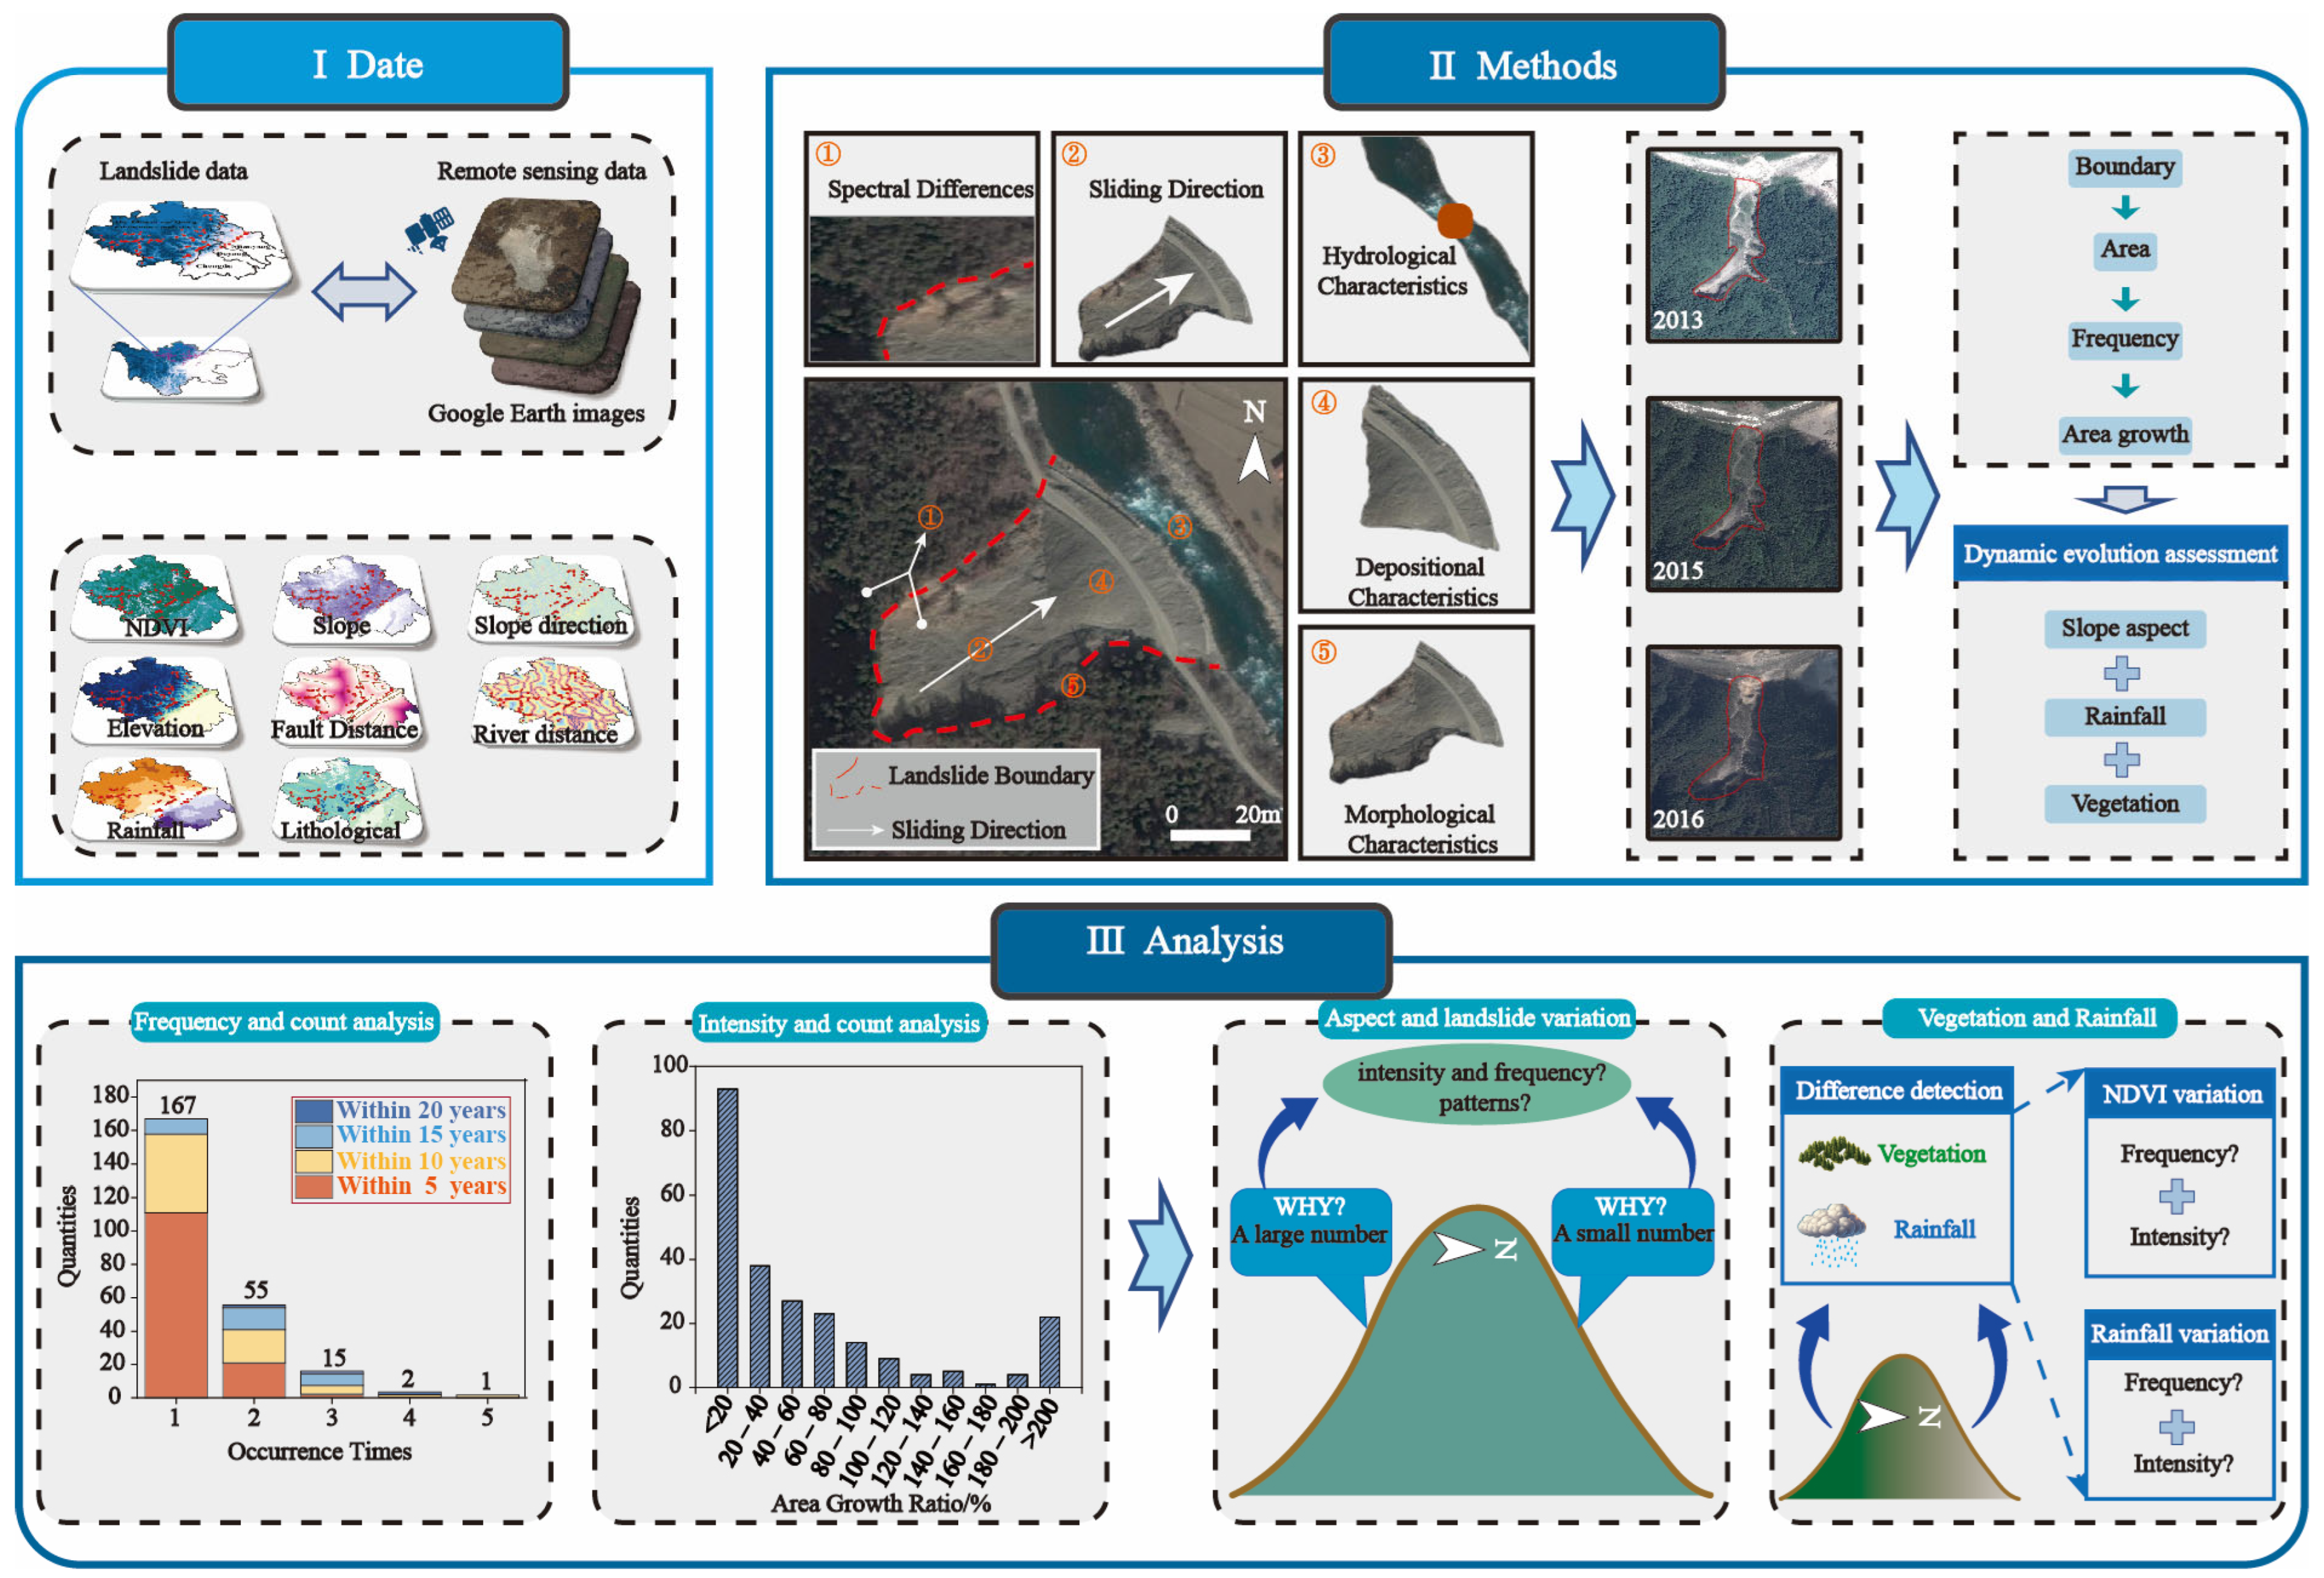
2.2. Methodology
- (1)
- Spectral Characteristics: Landslides exhibit marked spectral differences compared to surrounding vegetation or undisturbed soil due to the exposure of bare soil and rock. These differences in reflectance enable the identification of landslide-affected areas in high-resolution imagery. Through the analysis of these spectral signatures, regions impacted by landslides can be highlighted for further analysis.
- (2)
- Morphological Features: Landslides typically present distinct geometric shapes, such as tongue-shaped, elliptical, or horseshoe-like patterns, visible in remote sensing imagery. These shapes are essential for recognizing potential landslide zones. Cracks and terrain disruptions, indicative of slope instability, also serve as critical indicators of landslide occurrence. These morphological features were utilized to classify and delineate landslides through visual inspection of the satellite images.
- (3)
- Hydrological Indicators: In regions where landslides occur along riverbanks or watercourses, the morphology of the river itself can provide significant clues. Unusual bends or sudden narrowing of river channels may signal landslide activity in the surrounding areas. This hydrological feature was carefully examined to identify landslides affecting river systems.
- (4)
- Geomorphological Characteristics: Landslides are commonly observed on steep slopes, with displaced materials typically accumulating below the landslide sites. These deposits often form irregular shapes, easily distinguishable from the natural terrain. Through the assessment of the geomorphological features of the landscape, areas prone to landslides were identified and mapped.
3. Results
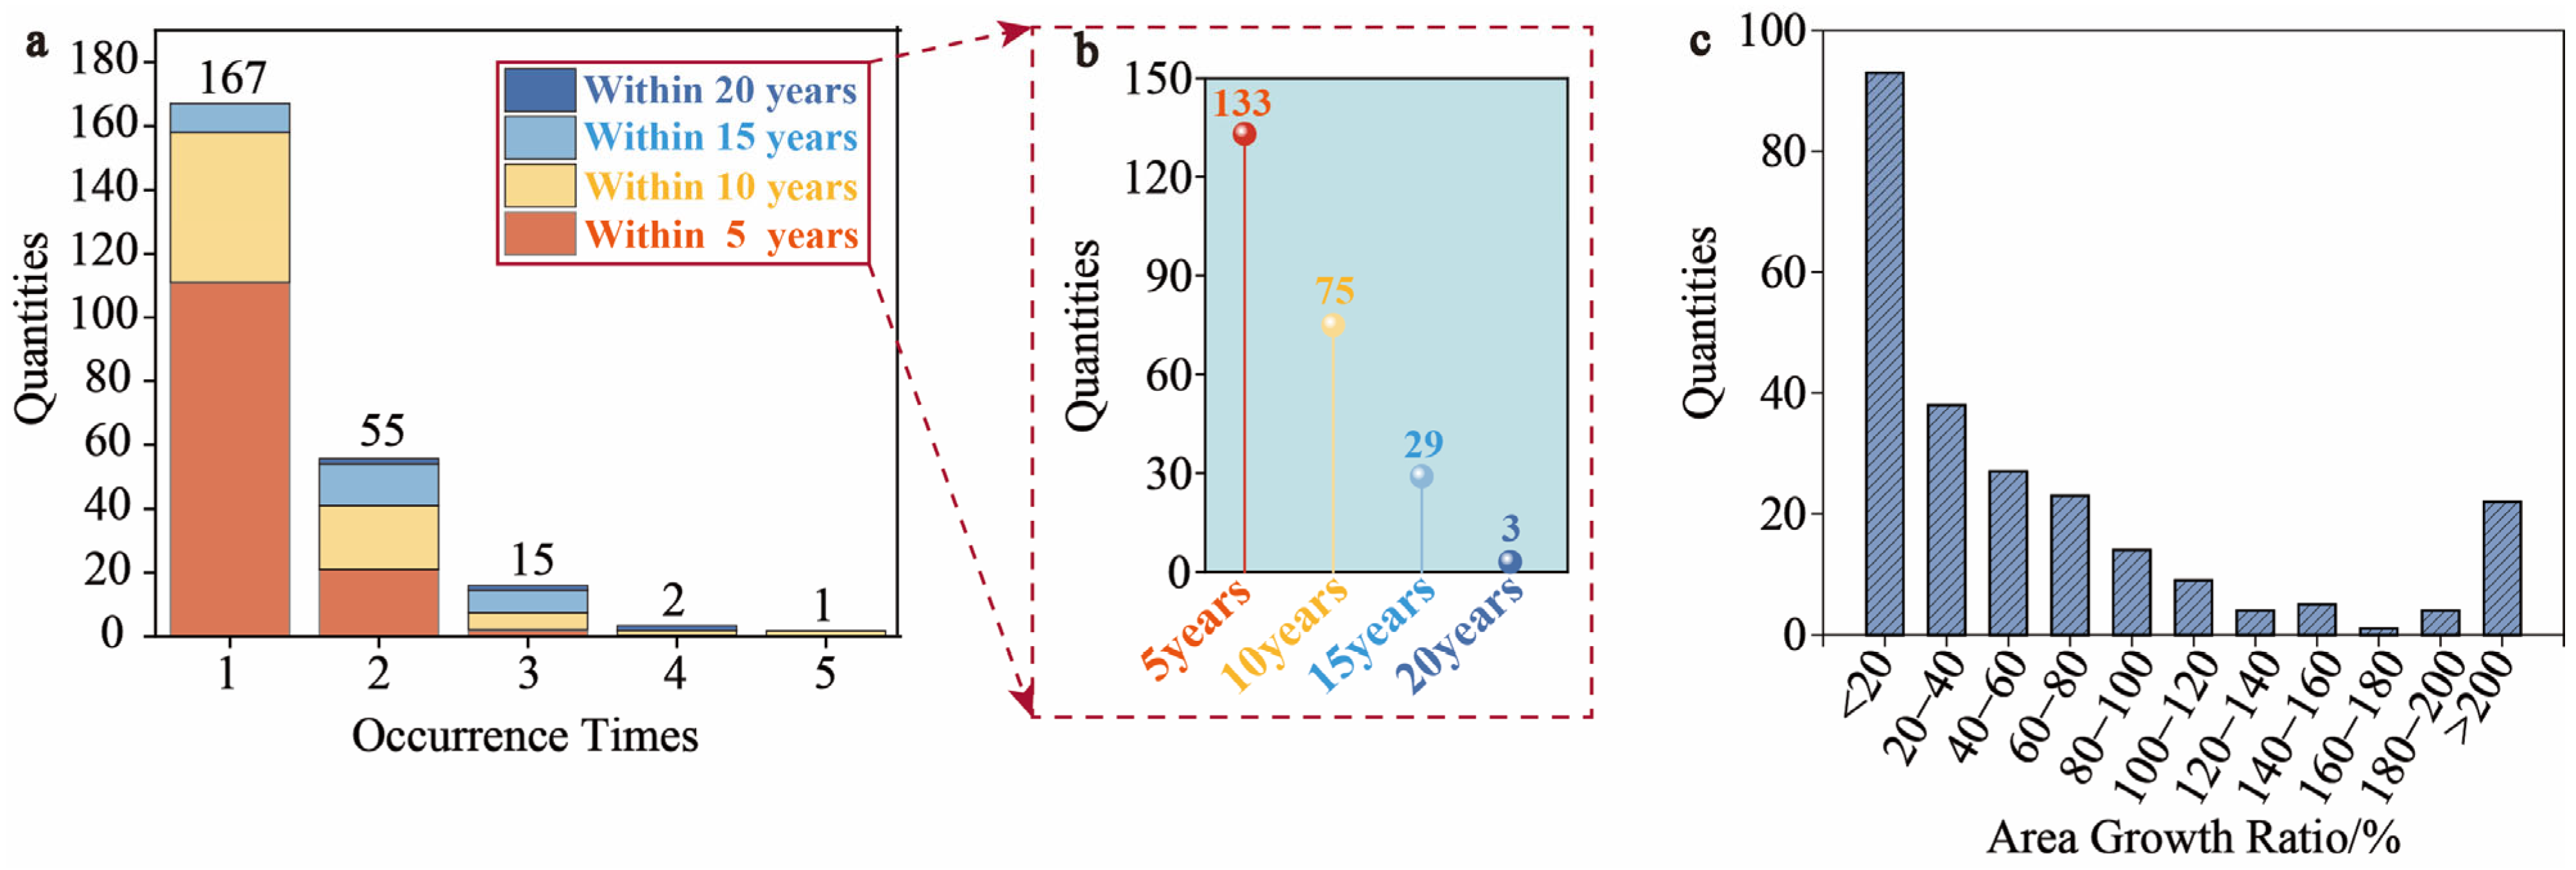
3.1. Landslide Activity Characteristics: Frequency and Area Growth
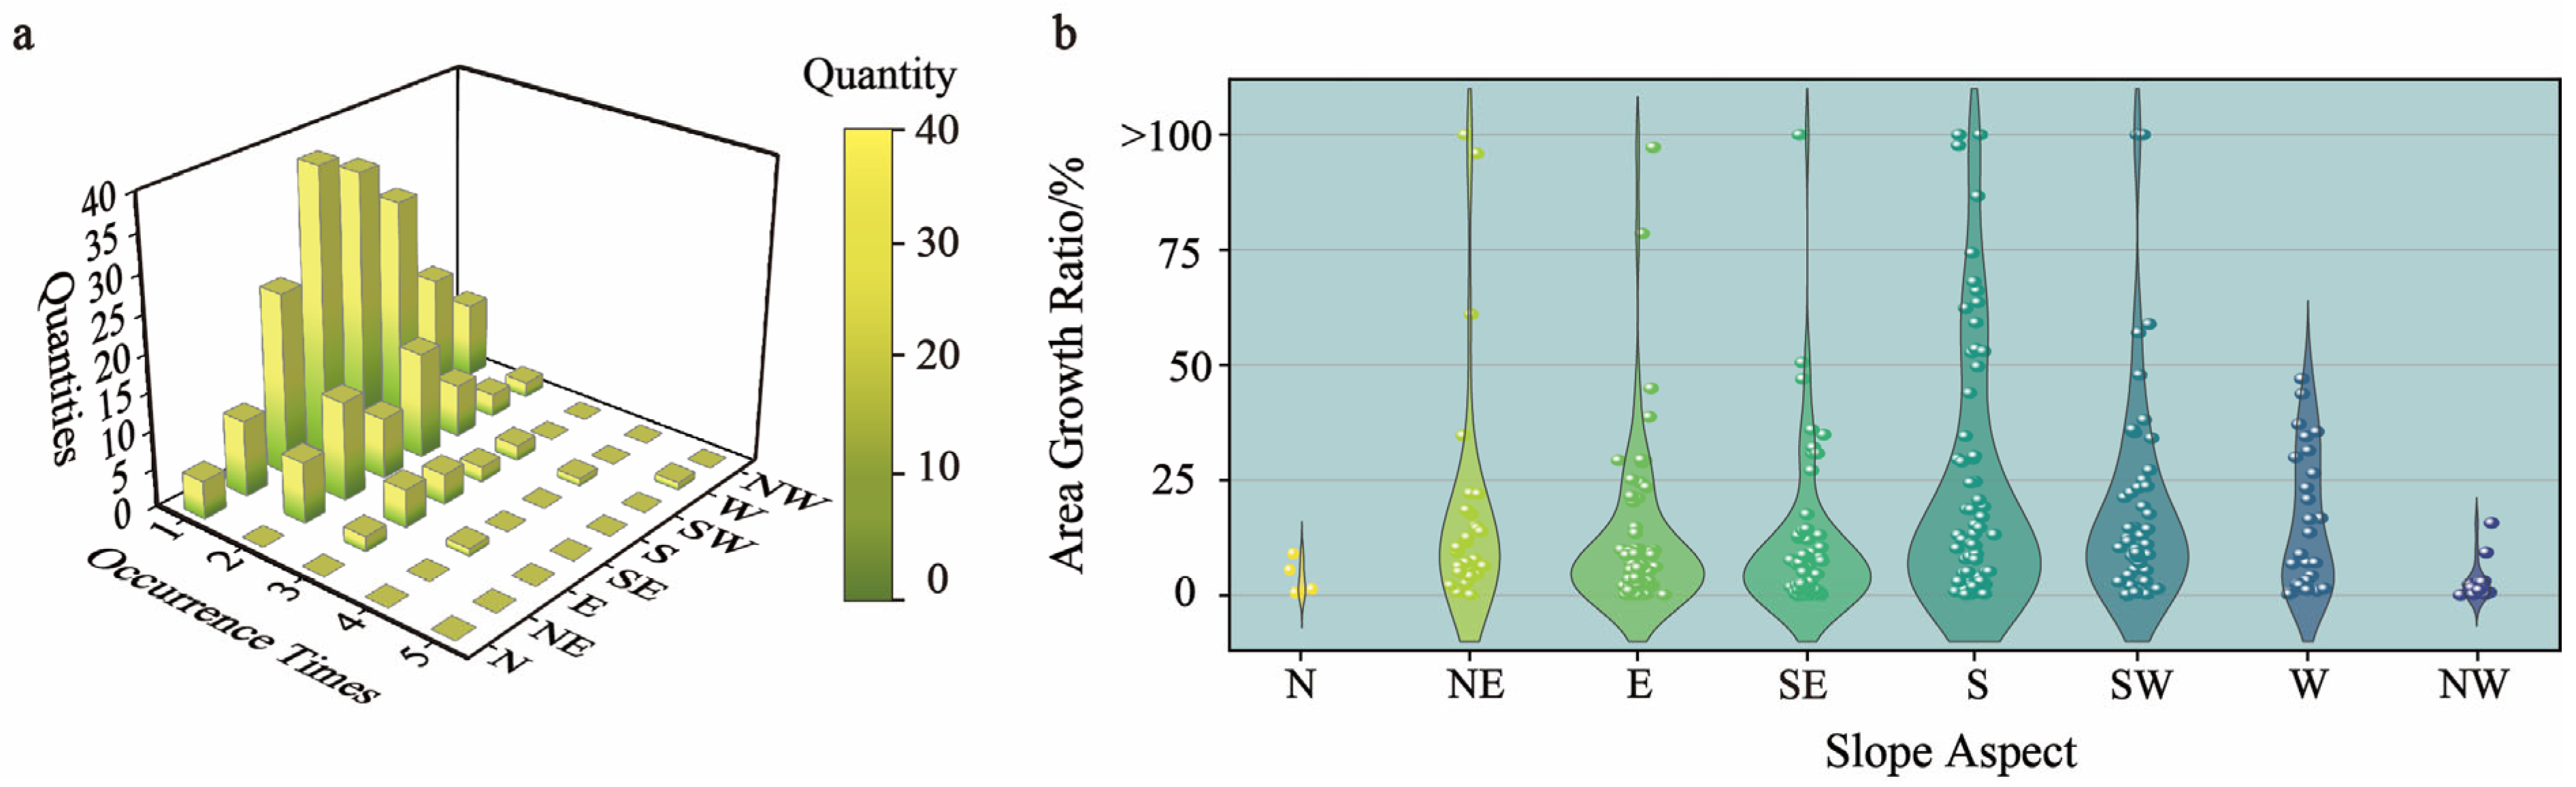
3.2. Influence of Slope Aspect on Landslide Activity: Frequency and Area Growth
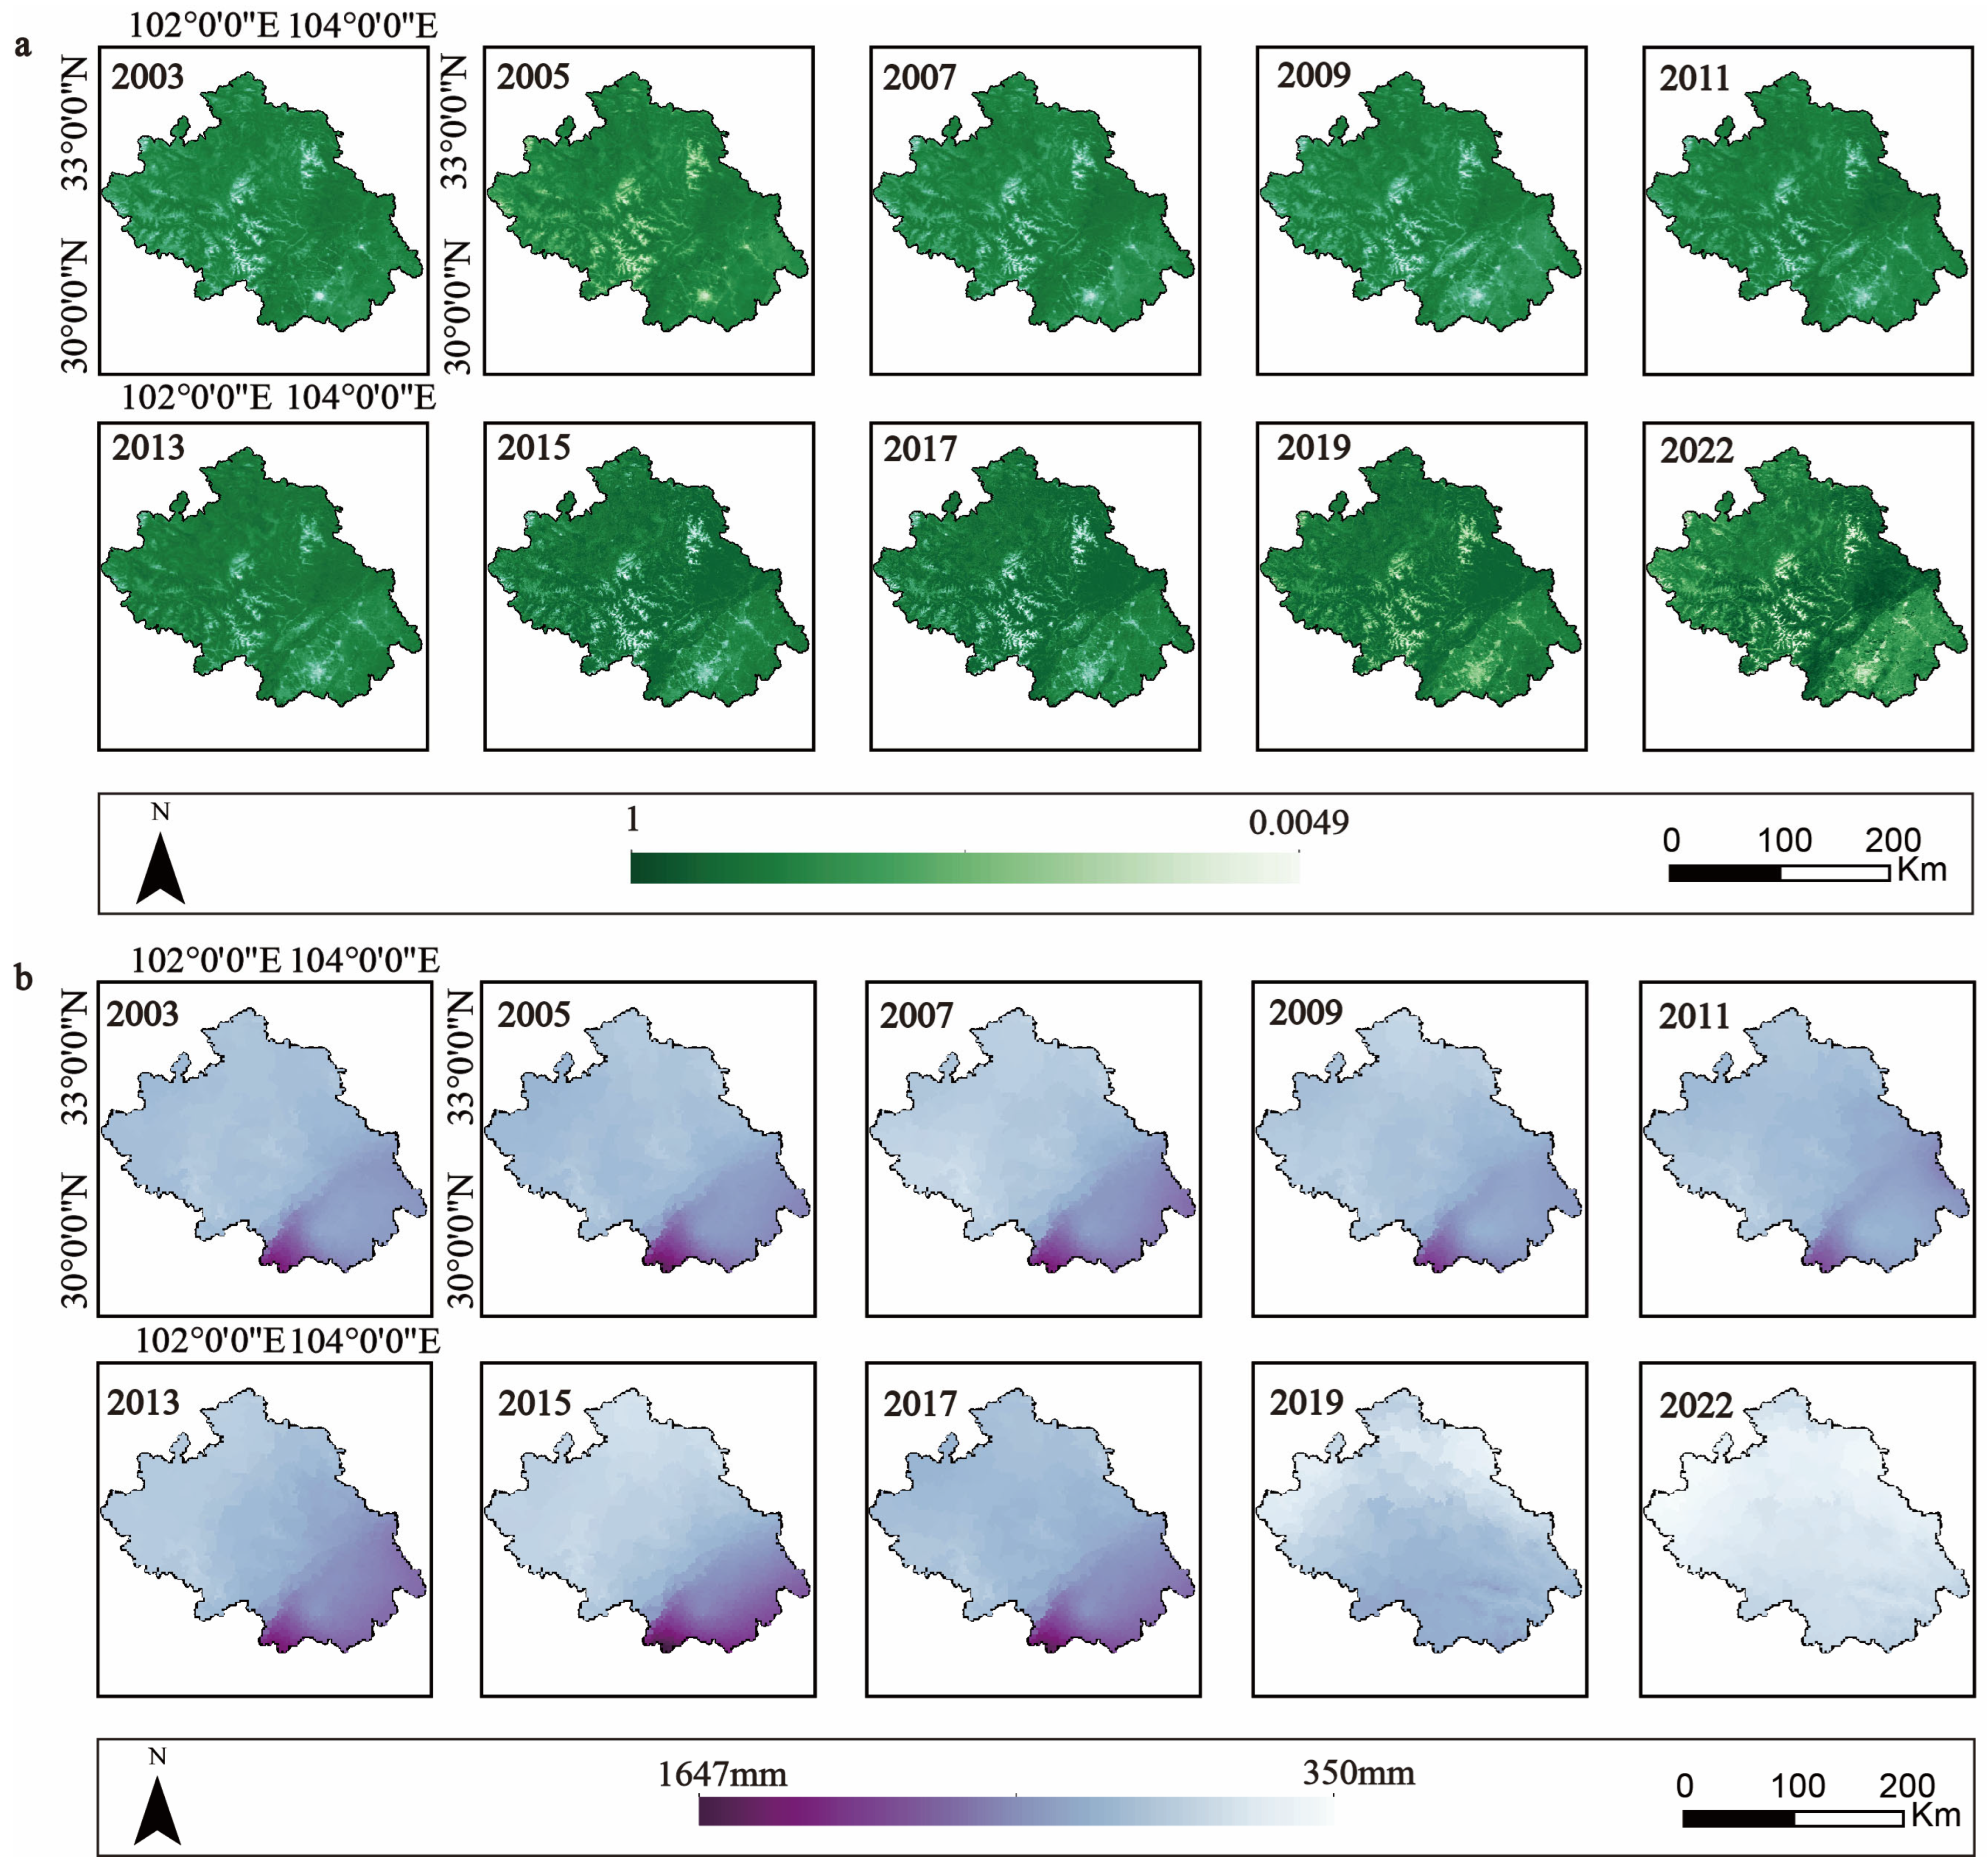
3.3. Climatic and Environmental Drivers of Landslide Activity: The Role of Slope Aspect and the Föhn Effect
4. Discussion
4.1. The Influence of Slope Aspect on Landslides
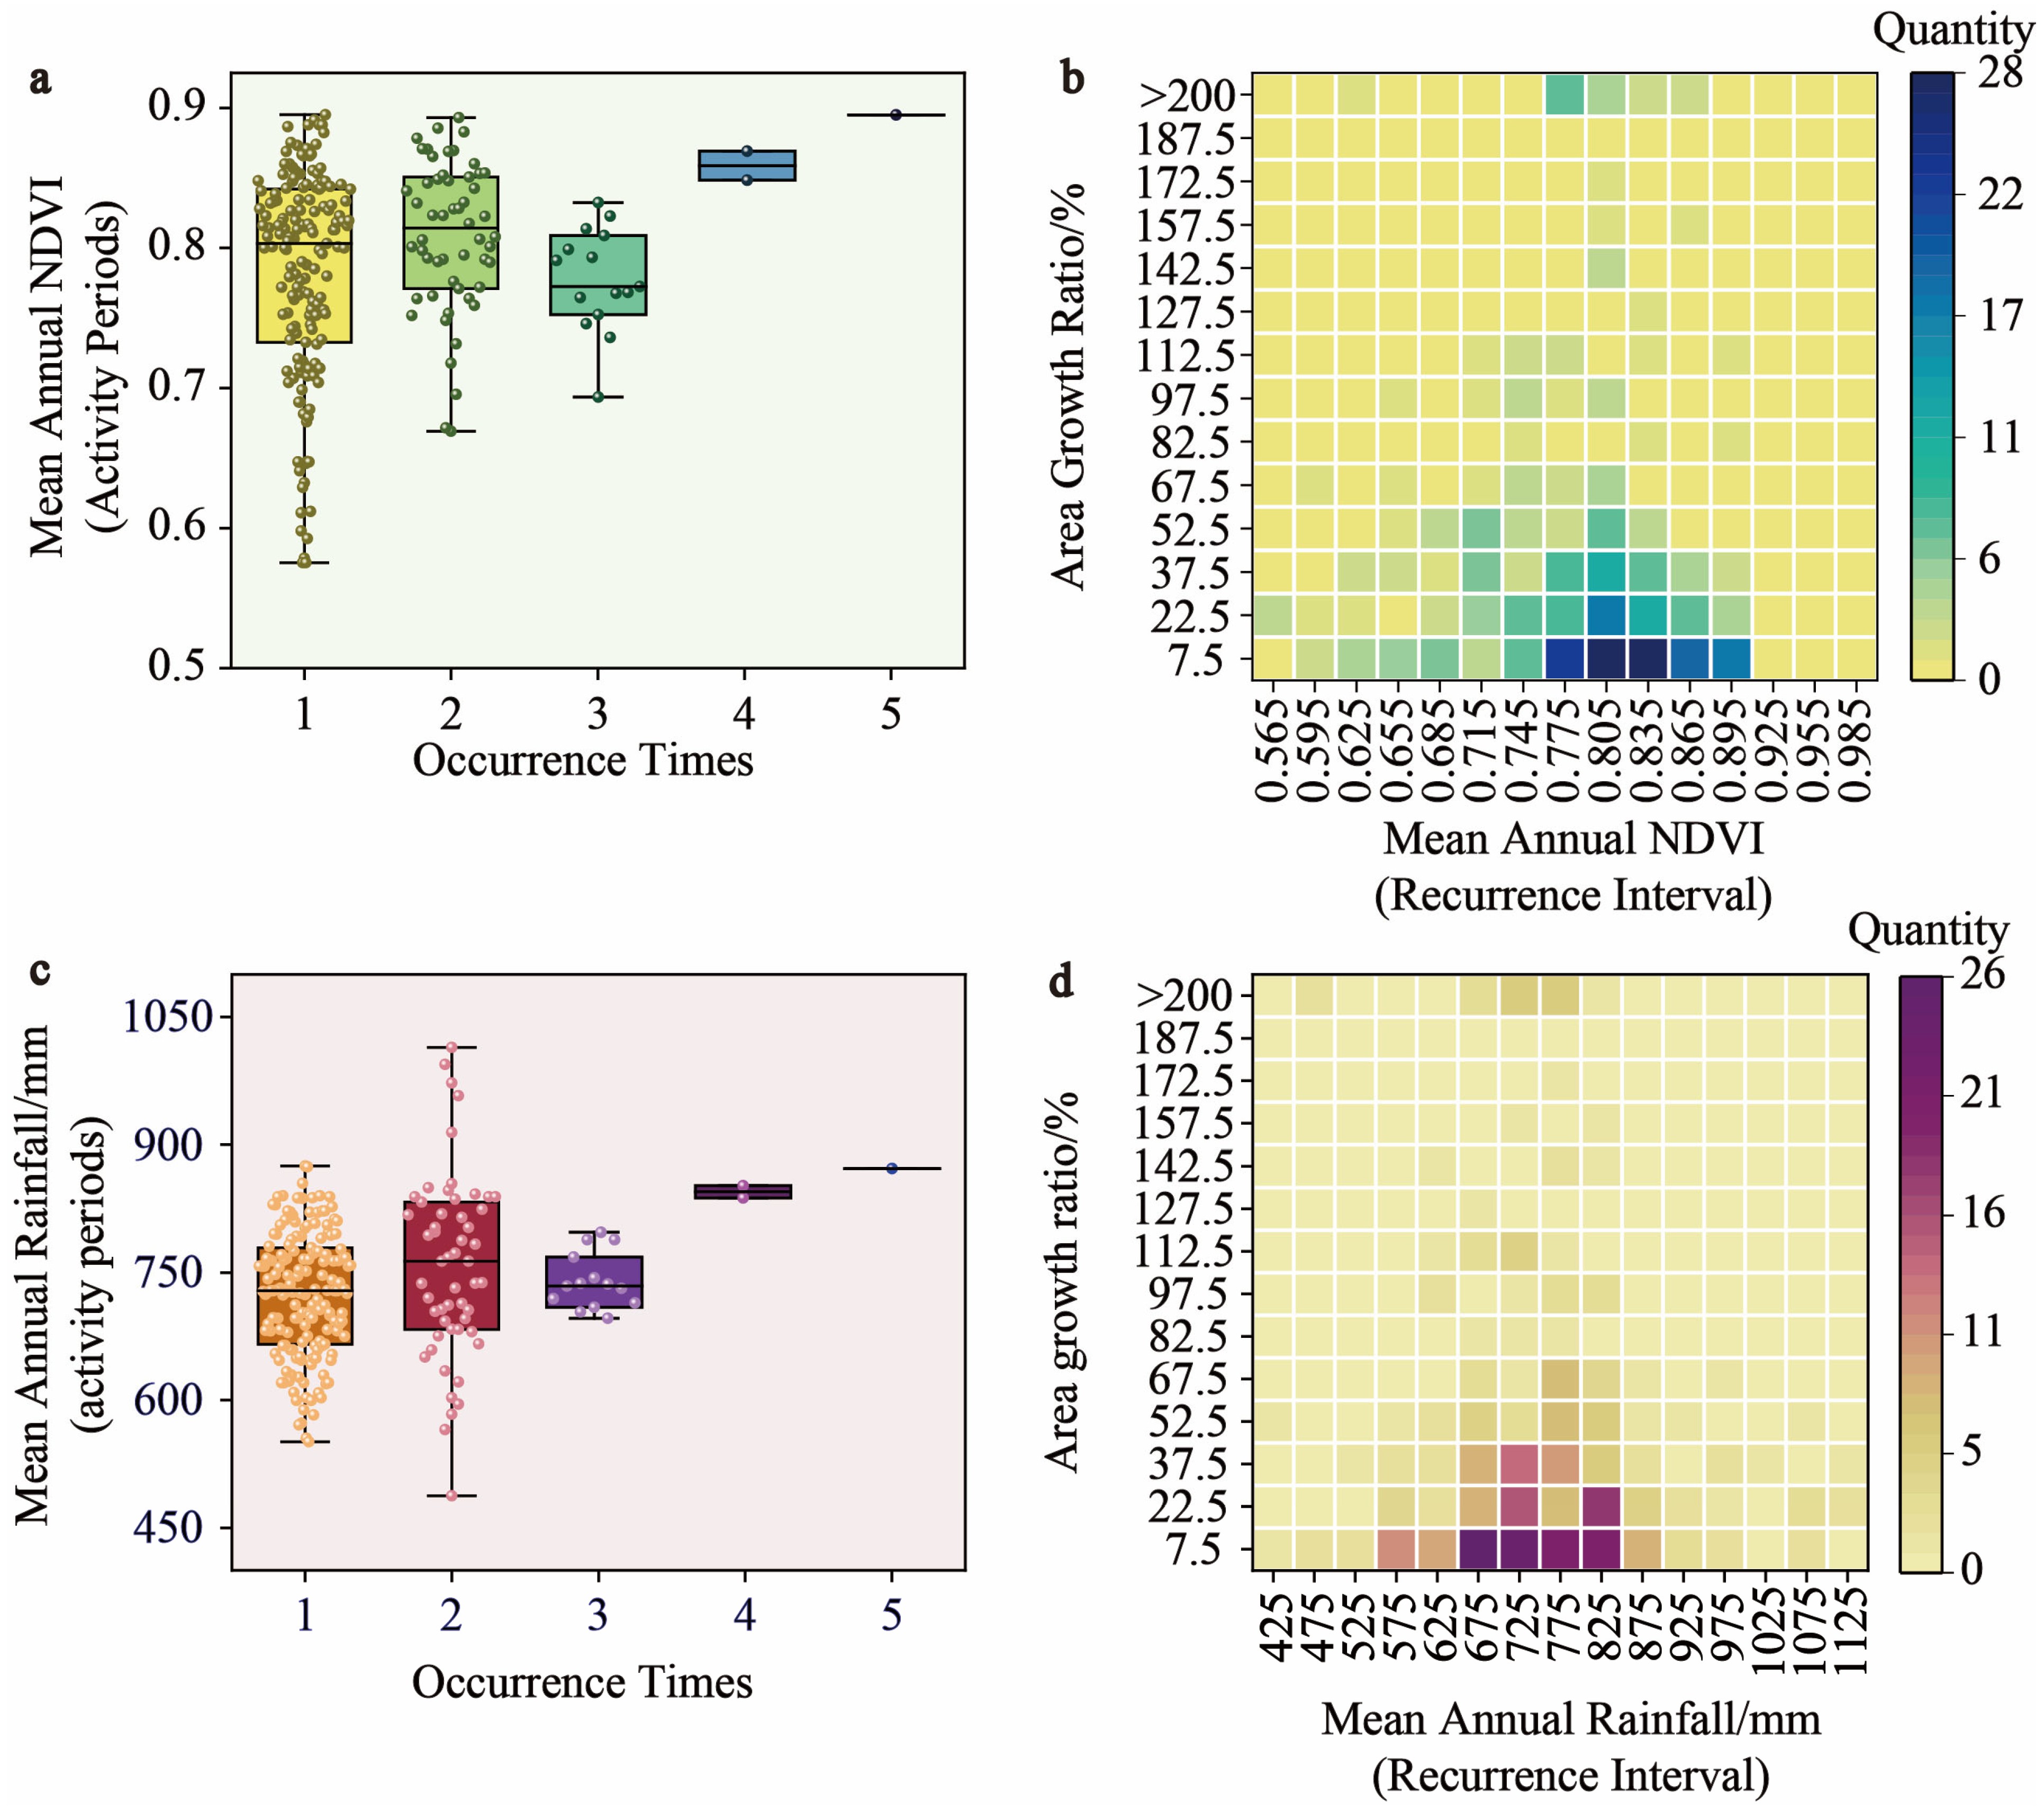
4.2. Rainfall and NDVI Thresholds for High-Frequency Landslide Activity
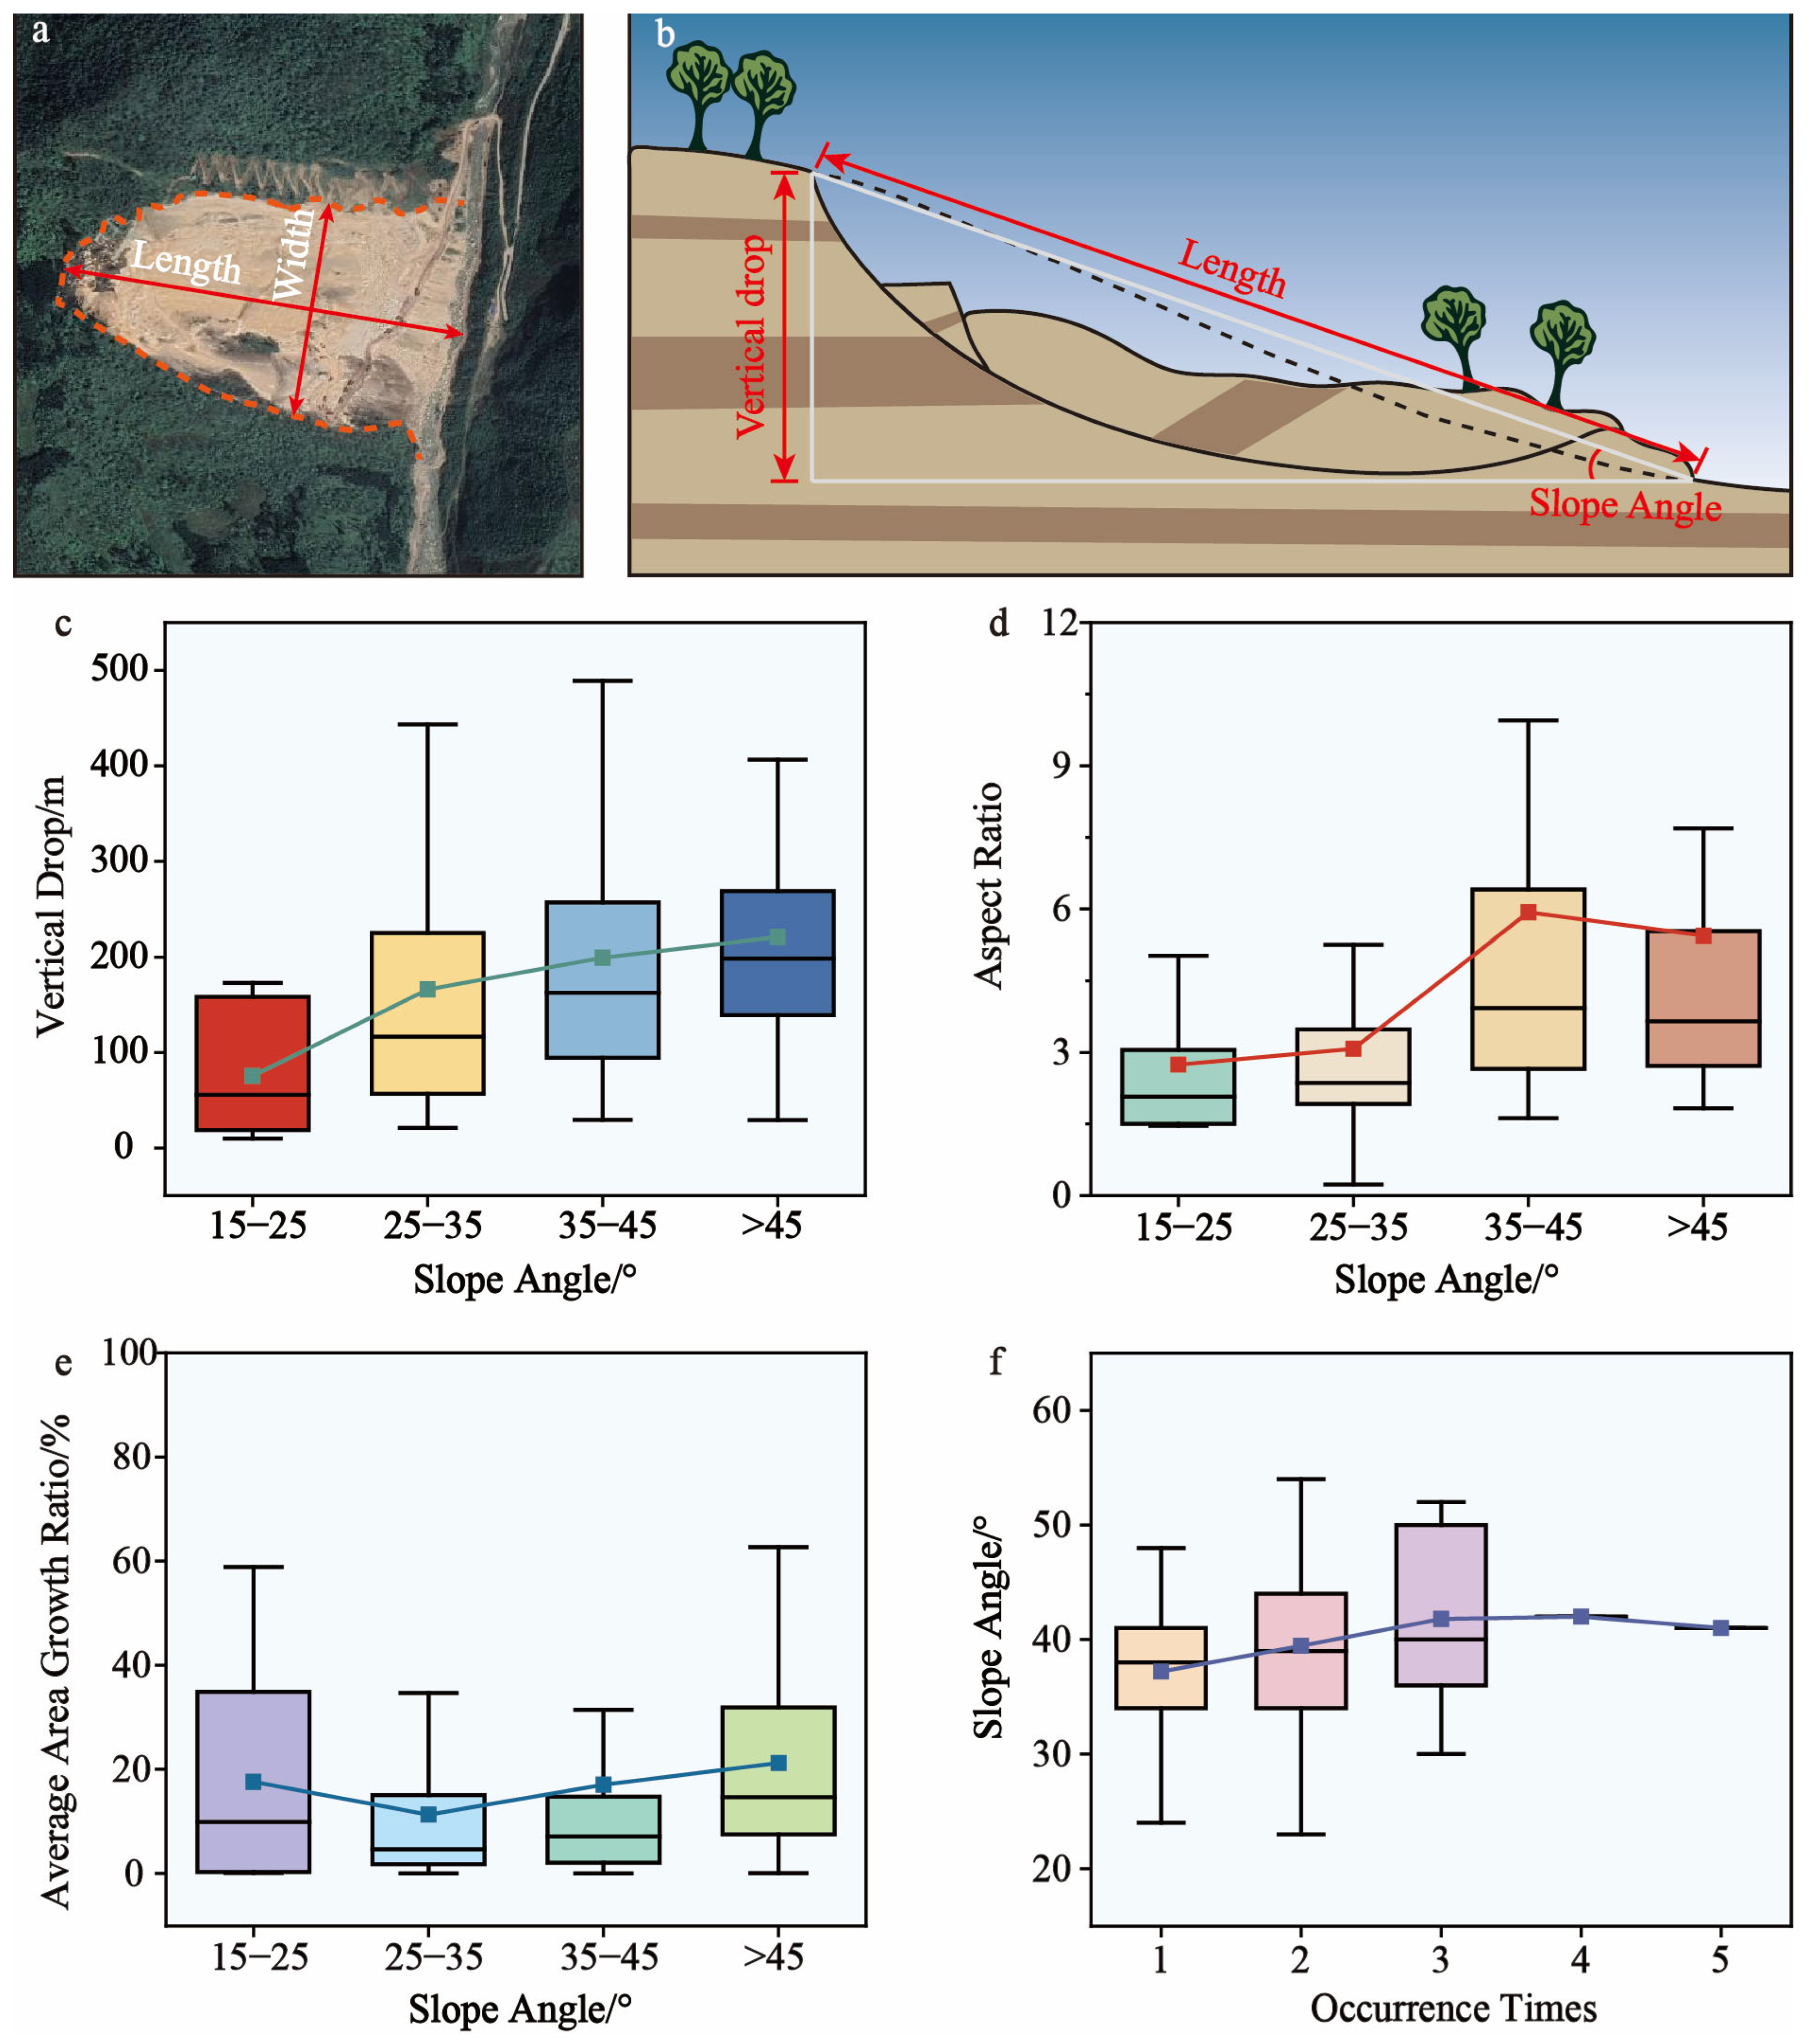
4.3. The Impact of Topography on Landslide Evolution
5. Conclusions
Author Contributions
Funding
Data Availability Statement
Conflicts of Interest
References
- Metternicht, G.; Hurni, L.; Gogu, R. Remote sensing of landslides: An analysis of the potential contribution to geo-spatial systems for hazard assessment in mountainous environments. Remote Sens. Environ. 2005, 98, 284–303. [Google Scholar] [CrossRef]
- Geertsema, M.; Highland, L.; Vaugeouis, L. Environmental Impact of Landslides. In Landslides–Disaster Risk Reduction; Sassa, K., Canuti, P., Eds.; Springer: Berlin/Heidelberg, Germany, 2009; pp. 589–607. [Google Scholar]
- Li, C.; Adu, B.; Wu, J.; Qin, G.; Li, H.; Han, Y. Spatial and temporal variations of drought in Sichuan Province from 2001 to 2020 based on modified temperature vegetation dryness index (TVDI). Ecol. Indic. 2022, 139, 108883. [Google Scholar] [CrossRef]
- Ponziani, F.; Ciuffi, P.; Bayer, B.; Berni, N.; Franceschini, S.; Simoni, A. Regional-scale InSAR investigation and landslide early warning thresholds in Umbria, Italy. Eng. Geol. 2023, 327, 107352. [Google Scholar] [CrossRef]
- Lacasse, S.; Nadim, F.; Lacasse, S.; Nadim, F. Landslide Risk Assessment and Mitigation Strategy. In Landslides–Disaster Risk Reduction; Sassa, K., Canuti, P., Eds.; Springer: Berlin/Heidelberg, Germany, 2009; pp. 31–61. [Google Scholar]
- Almeida, S.; Holcombe, E.A.; Pianosi, F.; Wagener, T. Dealing with deep uncertainties in landslide modelling for disaster risk reduction under climate change. Nat. Hazards Earth Syst. Sci. 2017, 17, 225–241. [Google Scholar] [CrossRef]
- Dai, F.C.; Lee, C.F.; Ngai, Y.Y. Landslide risk assessment and management: An overview. Eng. Geol. 2002, 64, 65–87. [Google Scholar] [CrossRef]
- Pachauri, A.K.; Pant, M. Landslide hazard mapping based on geological attributes. Eng. Geol. 1992, 32, 81–100. [Google Scholar] [CrossRef]
- Valagussa, A.; Marc, O.; Frattini, P.; Crosta, G.B. Seismic and geological controls on earthquake-induced landslide size. Earth Planet. Sci. Lett. 2019, 506, 268–281. [Google Scholar] [CrossRef]
- Richner, H.; Hächler, P. Understanding and Forecasting Alpine Foehn. In Mountain Weather Research and Forecasting: Recent Progress and Current Challenges; Chow, F.K., De Wekker, S.F.J., Snyder, B.J., Eds.; Springer: Dordrecht, The Netherlands, 2013; pp. 219–260. [Google Scholar]
- Shestakova, A.A.; Chechin, D.G.; Lüpkes, C.; Hartmann, J.; Maturilli, M. The foehn effect during easterly flow over Svalbard. Atmos. Chem. Phys. 2022, 22, 1529–1548. [Google Scholar] [CrossRef]
- Dai, F.C.; Lee, C.F.; Wang, S.J. Characterization of rainfall-induced landslides. Int. J. Remote Sens. 2003, 24, 4817–4834. [Google Scholar] [CrossRef]
- Wang, H.; Jiang, Z.; Xu, W.; Wang, R.; Xie, W. Physical model test on deformation and failure mechanism of deposit landslide under gradient rainfall. Bull. Eng. Geol. Environ. 2022, 81, 66. [Google Scholar] [CrossRef]
- Bathurst, J.C.; Bovolo, C.I.; Cisneros, F. Modelling the effect of forest cover on shallow landslides at the river basin scale. Ecol. Eng. 2010, 36, 317–327. [Google Scholar] [CrossRef]
- Bellanova, J.; Calamita, G.; Giocoli, A.; Luongo, R.; Macchiato, M.; Perrone, A.; Uhlemann, S.; Piscitelli, S. Electrical resistivity imaging for the characterization of the Montaguto landslide (southern Italy). Eng. Geol. 2018, 243, 272–281. [Google Scholar] [CrossRef]
- Gao, W.-W.; Gao, W.; Hu, R.-L.; Xu, P.-F.; Xia, J.-G. Microtremor survey and stability analysis of a soil-rock mixture landslide: A case study in Baidian town, China. Landslides 2018, 15, 1951–1961. [Google Scholar] [CrossRef]
- Yu, X.; Zhang, K.; Song, Y.; Jiang, W.; Zhou, J. Study on landslide susceptibility mapping based on rock–soil characteristic factors. Sci. Rep. 2021, 11, 15476. [Google Scholar] [CrossRef]
- Zhan, J.; Wang, Q.; Zhang, W.; Shangguan, Y.; Song, S.; Chen, J. Soil-engineering properties and failure mechanisms of shallow landslides in soft-rock materials. Catena 2019, 181, 104093. [Google Scholar] [CrossRef]
- Regmi, A.D.; Yoshida, K.; Dhital, M.R.; Pradhan, B. Weathering and mineralogical variation in gneissic rocks and their effect in Sangrumba Landslide, East Nepal. Environ. Earth Sci. 2014, 71, 2711–2727. [Google Scholar] [CrossRef]
- Gariano, S.L.; Guzzetti, F. Landslides in a changing climate. Earth-Sci. Rev. 2016, 162, 227–252. [Google Scholar] [CrossRef]
- Li, C.; Ma, T.; Zhu, X.; Li, W. The power–law relationship between landslide occurrence and rainfall level. Geomorphology 2011, 130, 221–229. [Google Scholar] [CrossRef]
- Soto, J.; Palenzuela, J.A.; Galve, J.P.; Luque, J.A.; Azañón, J.M.; Tamay, J.; Irigaray, C. Estimation of empirical rainfall thresholds for landslide triggering using partial duration series and their relation with climatic cycles. An application in southern Ecuador. Bull. Eng. Geol. Environ. 2019, 78, 1971–1987. [Google Scholar] [CrossRef]
- Xia, M.; Ren, G.M.; Ma, X.L. Deformation and mechanism of landslide influenced by the effects of reservoir water and rainfall, Three Gorges, China. Nat. Hazards 2013, 68, 467–482. [Google Scholar] [CrossRef]
- Huo, A.; Yang, L.; Peng, J.; Cheng, Y.; Jiang, C. Spatial characteristics of the rainfall induced landslides in the Chinese Loess Plateau. Hum. Ecol. Risk Assess. Int. J. 2020, 26, 2462–2477. [Google Scholar] [CrossRef]
- Finlay, P.J.; Fell, R.; Maguire, P.K. The relationship between the probability of landslide occurrence and rainfall. Can. Geotech. J. 1997, 34, 811–824. [Google Scholar] [CrossRef]
- Lann, T.; Bao, H.; Lan, H.; Zheng, H.; Yan, C.; Peng, J. Hydro-mechanical effects of vegetation on slope stability: A review. Sci. Total Environ. 2024, 926, 171691. [Google Scholar] [CrossRef] [PubMed]
- Zhang, J.; Qiu, H.; Tang, B.; Yang, D.; Liu, Y.; Liu, Z.; Ye, B.; Zhou, W.; Zhu, Y. Accelerating Effect of Vegetation on the Instability of Rainfall-Induced Shallow Landslides. Remote Sens. 2022, 14, 5743. [Google Scholar] [CrossRef]
- Deng, J.; Ma, C.; Zhang, Y. Shallow landslide characteristics and its response to vegetation by example of July 2013, extreme rainstorm, Central Loess Plateau, China. Bull. Eng. Geol. Environ. 2022, 81, 100. [Google Scholar] [CrossRef]
- Guo, W.-Z.; Chen, Z.-X.; Wang, W.-L.; Gao, W.-W.; Guo, M.-M.; Kang, H.-L.; Li, P.-F.; Wang, W.-X.; Zhao, M. Telling a different story: The promote role of vegetation in the initiation of shallow landslides during rainfall on the Chinese Loess Plateau. Geomorphology 2020, 350, 106879. [Google Scholar] [CrossRef]
- Reis, S.; Yalcin, A.; Atasoy, M.; Nisanci, R.; Bayrak, T.; Erduran, M.; Sancar, C.; Ekercin, S. Remote sensing and GIS-based landslide susceptibility mapping using frequency ratio and analytical hierarchy methods in Rize province (NE Turkey). Environ. Earth Sci. 2012, 66, 2063–2073. [Google Scholar] [CrossRef]
- Panahi, M.; Rahmati, O.; Rezaie, F.; Lee, S.; Mohammadi, F.; Conoscenti, C. Application of the group method of data handling (GMDH) approach for landslide susceptibility zonation using readily available spatial covariates. Catena 2022, 208, 105779. [Google Scholar] [CrossRef]
- Wang, Y.; Fang, Z.; Wang, M.; Peng, L.; Hong, H. Comparative study of landslide susceptibility mapping with different recurrent neural networks. Comput. Geosci. 2020, 138, 104445. [Google Scholar] [CrossRef]
- Huang, W.; Ding, M.; Li, Z.; Zhuang, J.; Yang, J.; Li, X.; Meng, L.e.; Zhang, H.; Dong, Y. An Efficient User-Friendly Integration Tool for Landslide Susceptibility Mapping Based on Support Vector Machines: SVM-LSM Toolbox. Remote Sens. 2022, 14, 3408. [Google Scholar] [CrossRef]
- Tien Bui, D.; Pradhan, B.; Lofman, O.; Revhaug, I.; Dick, O.B. Landslide susceptibility mapping at Hoa Binh province (Vietnam) using an adaptive neuro-fuzzy inference system and GIS. Comput. Geosci. 2012, 45, 199–211. [Google Scholar] [CrossRef]
- Qiu, H.; Regmi, A.D.; Cui, P.; Hu, S.; Wang, Y.; He, Y. Slope aspect effects of loess slides and its spatial differentiation in different geomorphologic types. Arab. J. Geosci. 2017, 10, 344. [Google Scholar] [CrossRef]
- Huang, W.; Ding, M.; Li, Z.; Yu, J.; Ge, D.; Liu, Q.; Yang, J. Landslide susceptibility mapping and dynamic response along the Sichuan-Tibet transportation corridor using deep learning algorithms. Catena 2023, 222, 106866. [Google Scholar] [CrossRef]
- Demir, G.; Aytekin, M.; Akgün, A.; İkizler, S.B.; Tatar, O. A comparison of landslide susceptibility mapping of the eastern part of the North Anatolian Fault Zone (Turkey) by likelihood-frequency ratio and analytic hierarchy process methods. Nat. Hazards 2013, 65, 1481–1506. [Google Scholar] [CrossRef]
- Ramesh, V.; Anbazhagan, S. Landslide susceptibility mapping along Kolli hills Ghat road section (India) using frequency ratio, relative effect and fuzzy logic models. Environ. Earth Sci. 2015, 73, 8009–8021. [Google Scholar] [CrossRef]
- Yang, Z.; Pang, B.; Dong, W.; Li, D. Spatial Pattern and Intensity Mapping of Coseismic Landslides Triggered by the 2022 Luding Earthquake in China. Remote Sens. 2023, 15, 1323. [Google Scholar] [CrossRef]
- Li, W.; Xiang, M.; Duan, L.; Liu, Y.; Yang, X.; Mei, H.; Wei, Y.; Zhang, J.; Deng, L. Simulation of land utilization change and ecosystem service value evolution in Tibetan area of Sichuan Province. Alex. Eng. J. 2023, 70, 13–23. [Google Scholar] [CrossRef]
- Lin, Y.; Deng, H.; Du, K.; Rafay, L.; Zhang, G.-s.; Li, J.; Chen, C.; Wu, C.; Lin, H.; Yu, W.; et al. Combined effects of climate, restoration measures and slope position in change in soil chemical properties and nutrient loss across lands affected by the Wenchuan Earthquake in China. Sci. Total Environ. 2017, 596–597, 274–283. [Google Scholar] [CrossRef]
- Zheng, H.; Ding, M. Spatiotemporal changes of landslide susceptibility in response to rainfall and its future prediction — A case study of Sichuan Province, China. Ecol. Inform. 2024, 84, 102862. [Google Scholar] [CrossRef]
- Hengl, T. Finding the right pixel size. Comput. Geosci. 2006, 32, 1283–1298. [Google Scholar] [CrossRef]
- Rigol-Sanchez, J.P.; Stuart, N.; Pulido-Bosch, A. ArcGeomorphometry: A toolbox for geomorphometric characterisation of DEMs in the ArcGIS environment. Comput. Geosci. 2015, 85, 155–163. [Google Scholar] [CrossRef]
- Mallick, J.; Almesfer, M.K.; Alsubih, M.; Talukdar, S.; Ahmed, M.; Ben Kahla, N. Developing a new method for future groundwater potentiality mapping under climate change in Bisha watershed, Saudi Arabia. Geocarto Int. 2022, 37, 14495–14527. [Google Scholar] [CrossRef]
- Śliwiński, D.; Konieczna, A.; Roman, K. Geostatistical Resampling of LiDAR-Derived DEM in Wide Resolution Range for Modelling in SWAT: A Case Study of Zgłowiączka River (Poland). Remote Sens. 2022, 14, 1281. [Google Scholar] [CrossRef]
- Ye, C.; Li, Y.; Cui, P.; Liang, L.; Pirasteh, S.; Marcato, J.; Gonçalves, W.N.; Li, J. Landslide Detection of Hyperspectral Remote Sensing Data Based on Deep Learning with Constrains. IEEE J. Sel. Top. Appl. Earth Obs. Remote Sens. 2019, 12, 5047–5060. [Google Scholar] [CrossRef]
- Li, H.; He, Y.; Xu, Q.; Deng, J.; Li, W.; Wei, Y.; Zhou, J. Sematic segmentation of loess landslides with STAPLE mask and fully connected conditional random field. Landslides 2023, 20, 367–380. [Google Scholar] [CrossRef]
- Lan, H.; Liu, X.; Li, L.; Li, Q.; Tian, N.; Peng, J. Remote Sensing Precursors Analysis for Giant Landslides. Remote Sens. 2022, 14, 4399. [Google Scholar] [CrossRef]
- Zhang, X.; Xu, C.; Li, L.; Feng, L.; Yang, W. Inventory of Landslides in the Northern Half of the Taihang Mountain Range, China. Geosciences 2024, 14, 74. [Google Scholar] [CrossRef]
- Pałubicki, W.; Makowski, M.; Gajda, W.; Hädrich, T.; Michels, D.L.; Pirk, S. Ecoclimates: Climate-response modeling of vegetation. ACM Trans. Graph. 2022, 41, 1–19. [Google Scholar] [CrossRef]
- Pausas, J.G.; Keeley, J.E. Wildfires and global change. Front. Ecol. Environ. 2021, 19, 387–395. [Google Scholar] [CrossRef]
- Liu, C.; Yang, C.; Yang, Q.; Wang, J. Spatiotemporal drought analysis by the standardized precipitation index (SPI) and standardized precipitation evapotranspiration index (SPEI) in Sichuan Province, China. Sci. Rep. 2021, 11, 1280. [Google Scholar] [CrossRef]
- Li, X.; Xia, X.a.; Wang, L.; Cai, R.; Zhao, L.; Feng, Z.; Ren, Q.; Zhao, K. The role of foehn in the formation of heavy air pollution events in Urumqi, China. J. Geophys. Res. Atmos. 2015, 120, 5371–5384. [Google Scholar] [CrossRef]
- Sun, Y.; Wang, Y.; Yang, W.; Sun, Z.; Zhao, J. Variation in soil hydrological properties on shady and sunny slopes in the permafrost region, Qinghai–Tibetan Plateau. Environ. Earth Sci. 2019, 78, 100. [Google Scholar] [CrossRef]
- Han, J.; Yin, H.; Xue, J.; Zhang, Z.; Xing, Z.; Wang, S.; Chang, J.; Chen, X.; Yu, B. Vertical distribution differences of the understory herbs and their driving factors on shady and sunny slopes in high altitude mountainous areas. Front. For. Glob. Change 2023, 6, 1138317. [Google Scholar] [CrossRef]
- Huang, J.; Sun, S.; Xue, Y.; Li, J.; Zhang, J. Spatial and Temporal Variability of Precipitation and Dryness/Wetness During 1961–2008 in Sichuan Province, West China. Water Resour. Manag. 2014, 28, 1655–1670. [Google Scholar] [CrossRef]
- Cui, P.; Lin, Y.-m.; Chen, C. Destruction of vegetation due to geo-hazards and its environmental impacts in the Wenchuan earthquake areas. Ecol. Eng. 2012, 44, 61–69. [Google Scholar] [CrossRef]


| No. | Date | Source | Time | Resolution (m) and Scale |
|---|---|---|---|---|
| 1 | Image | Google Earth | 2003~2022 | 0.5 |
| 2 | Rainfall | National Tibetan Plateau Scientific Data Center https://data.tpdc.ac.cn/ (accessed on 7 January 2024) | 1901~2022 | 1000 |
| 3 | DEM | European Space Agency Copernicus Global Digital Elevation Model https://portal.opentopography.org/datasetMetadata?otCollectionID=OT.032021.4326.1 (accessed on 15 April 2024) | 2022 | 30 |
| 4 | NDVI | Earth Resources Data Cloud http://gis5g.com/ (accessed on 15 April 2024) | 2003~2022 | 250 |
| 5 | Fault | Seismic Active Fault Survey Data Center https://www.activefault-datacenter.cn/ (accessed on 8 May 2024) | 2022 | 1:4 million |
| 6 | River | Geographic Science and Natural Resources Research, Chinese Academy of Sciences https://www.resdc.cn/ (accessed on 8 May 2024) | 2022 | / |
| 7 | Stratigraphical lithology | Geological Cloud of China Geological Survey https://www.cgs.gov.cn/ (accessed on 8 May 2024) | / | 1:2.5 million |
| Frequency | Intensity | Quantity | Mean Annual NDVI | Mean Annual Rainfall (mm) |
|---|---|---|---|---|
| 1 | Area Change: <50% | 125 | 0.77 | 722 |
| Area Change: 50~100% | 21 | 0.8 | 731 | |
| Area Change: >100% | 21 | 0.78 | 725 | |
| 2 | Area Change: <50% | 18 | 0.78 | 766 |
| Area Change: 50~100% | 19 | 0.8 | 719 | |
| Area Change: >100% | 18 | 0.83 | 774 | |
| 3 | Area Change: <50% | 4 | 0.79 | 749 |
| Area Change: 50~100% | 7 | 0.78 | 739 | |
| Area Change: >100% | 4 | 0.73 | 677 | |
| 4 | Area Change: <50% | 0 | 0 | 0 |
| Area Change: 50~100% | 1 | 0.84 | 847 | |
| Area Change: >100% | 1 | 0.86 | 863 | |
| 5 | Area Change: <50% | 0 | 0 | 0 |
| Area Change: 50~100% | 0 | 0 | 0 | |
| Area Change: >100% | 1 | 0.89 | 887 |
| No. | Time | Reactivation Times | Mean Annual Rainfall | Mean Annual NDVI |
|---|---|---|---|---|
| 1 | 2003–2021 | 3 | 800 | 0.82 |
| 2 | 2013–2021 | 3 | 790 | 0.8 |
| 3 | 2013–2021 | 3 | 790 | 0.81 |
| 4 | 2010–2022 | 3 | 766 | 0.8 |
| 5 | 2013–2021 | 3 | 738 | 0.78 |
| 6 | 2013–2021 | 3 | 731 | 0.74 |
| 7 | 2013–2018 | 3 | 730 | 0.76 |
| 8 | 2008–2019 | 3 | 727 | 0.75 |
| 9 | 2004–2021 | 3 | 724 | 0.76 |
| 10 | 2006–2021 | 3 | 710 | 0.73 |
| 11 | 2006–2021 | 3 | 704 | 0.79 |
| 12 | 2008–2020 | 3 | 698 | 0.76 |
| 13 | 2010–2016 | 3 | 692 | 0.78 |
| 14 | 2013–2019 | 3 | 683 | 0.72 |
| 15 | 2010–2021 | 3 | 590 | 0.68 |
| 16 | 2005–2021 | 4 | 863 | 0.86 |
| 17 | 2013–2020 | 4 | 847 | 0.84 |
| 18 | 2011–2021 | 5 | 887 | 0.89 |
Disclaimer/Publisher’s Note: The statements, opinions and data contained in all publications are solely those of the individual author(s) and contributor(s) and not of MDPI and/or the editor(s). MDPI and/or the editor(s) disclaim responsibility for any injury to people or property resulting from any ideas, methods, instructions or products referred to in the content. |
© 2025 by the authors. Licensee MDPI, Basel, Switzerland. This article is an open access article distributed under the terms and conditions of the Creative Commons Attribution (CC BY) license (https://creativecommons.org/licenses/by/4.0/).
Share and Cite
Zhu, Y.; Li, H.; Tang, R.; Fan, Z.; Mao, L.; Lu, Y.; Pu, C.; He, Y. Assessing the Influence of Environmental Factors on Landslide Frequency and Intensity in Northwestern Sichuan, SW China, Using Multi-Temporal Satellite Imagery. Remote Sens. 2025, 17, 2083. https://doi.org/10.3390/rs17122083
Zhu Y, Li H, Tang R, Fan Z, Mao L, Lu Y, Pu C, He Y. Assessing the Influence of Environmental Factors on Landslide Frequency and Intensity in Northwestern Sichuan, SW China, Using Multi-Temporal Satellite Imagery. Remote Sensing. 2025; 17(12):2083. https://doi.org/10.3390/rs17122083
Chicago/Turabian StyleZhu, Yu, Huajin Li, Ran Tang, Zhanfeng Fan, Lixuan Mao, Yifei Lu, Chuanhao Pu, and Yusen He. 2025. "Assessing the Influence of Environmental Factors on Landslide Frequency and Intensity in Northwestern Sichuan, SW China, Using Multi-Temporal Satellite Imagery" Remote Sensing 17, no. 12: 2083. https://doi.org/10.3390/rs17122083
APA StyleZhu, Y., Li, H., Tang, R., Fan, Z., Mao, L., Lu, Y., Pu, C., & He, Y. (2025). Assessing the Influence of Environmental Factors on Landslide Frequency and Intensity in Northwestern Sichuan, SW China, Using Multi-Temporal Satellite Imagery. Remote Sensing, 17(12), 2083. https://doi.org/10.3390/rs17122083