
Assessing the Spatial Benefits of Green Roofs to Mitigate Urban Heat Island Effects in a Semi-Arid City: A Case Study in Granada, Spain

 , , and
Abstract

1. Introduction
- Which built-up LCZs are more impacted by higher LST in Granada?
- Is the city suitable for implementing GRs to minimize heat temperatures?
- What is the impact on LST of implementing extensive GRs?
2. Materials and Methods
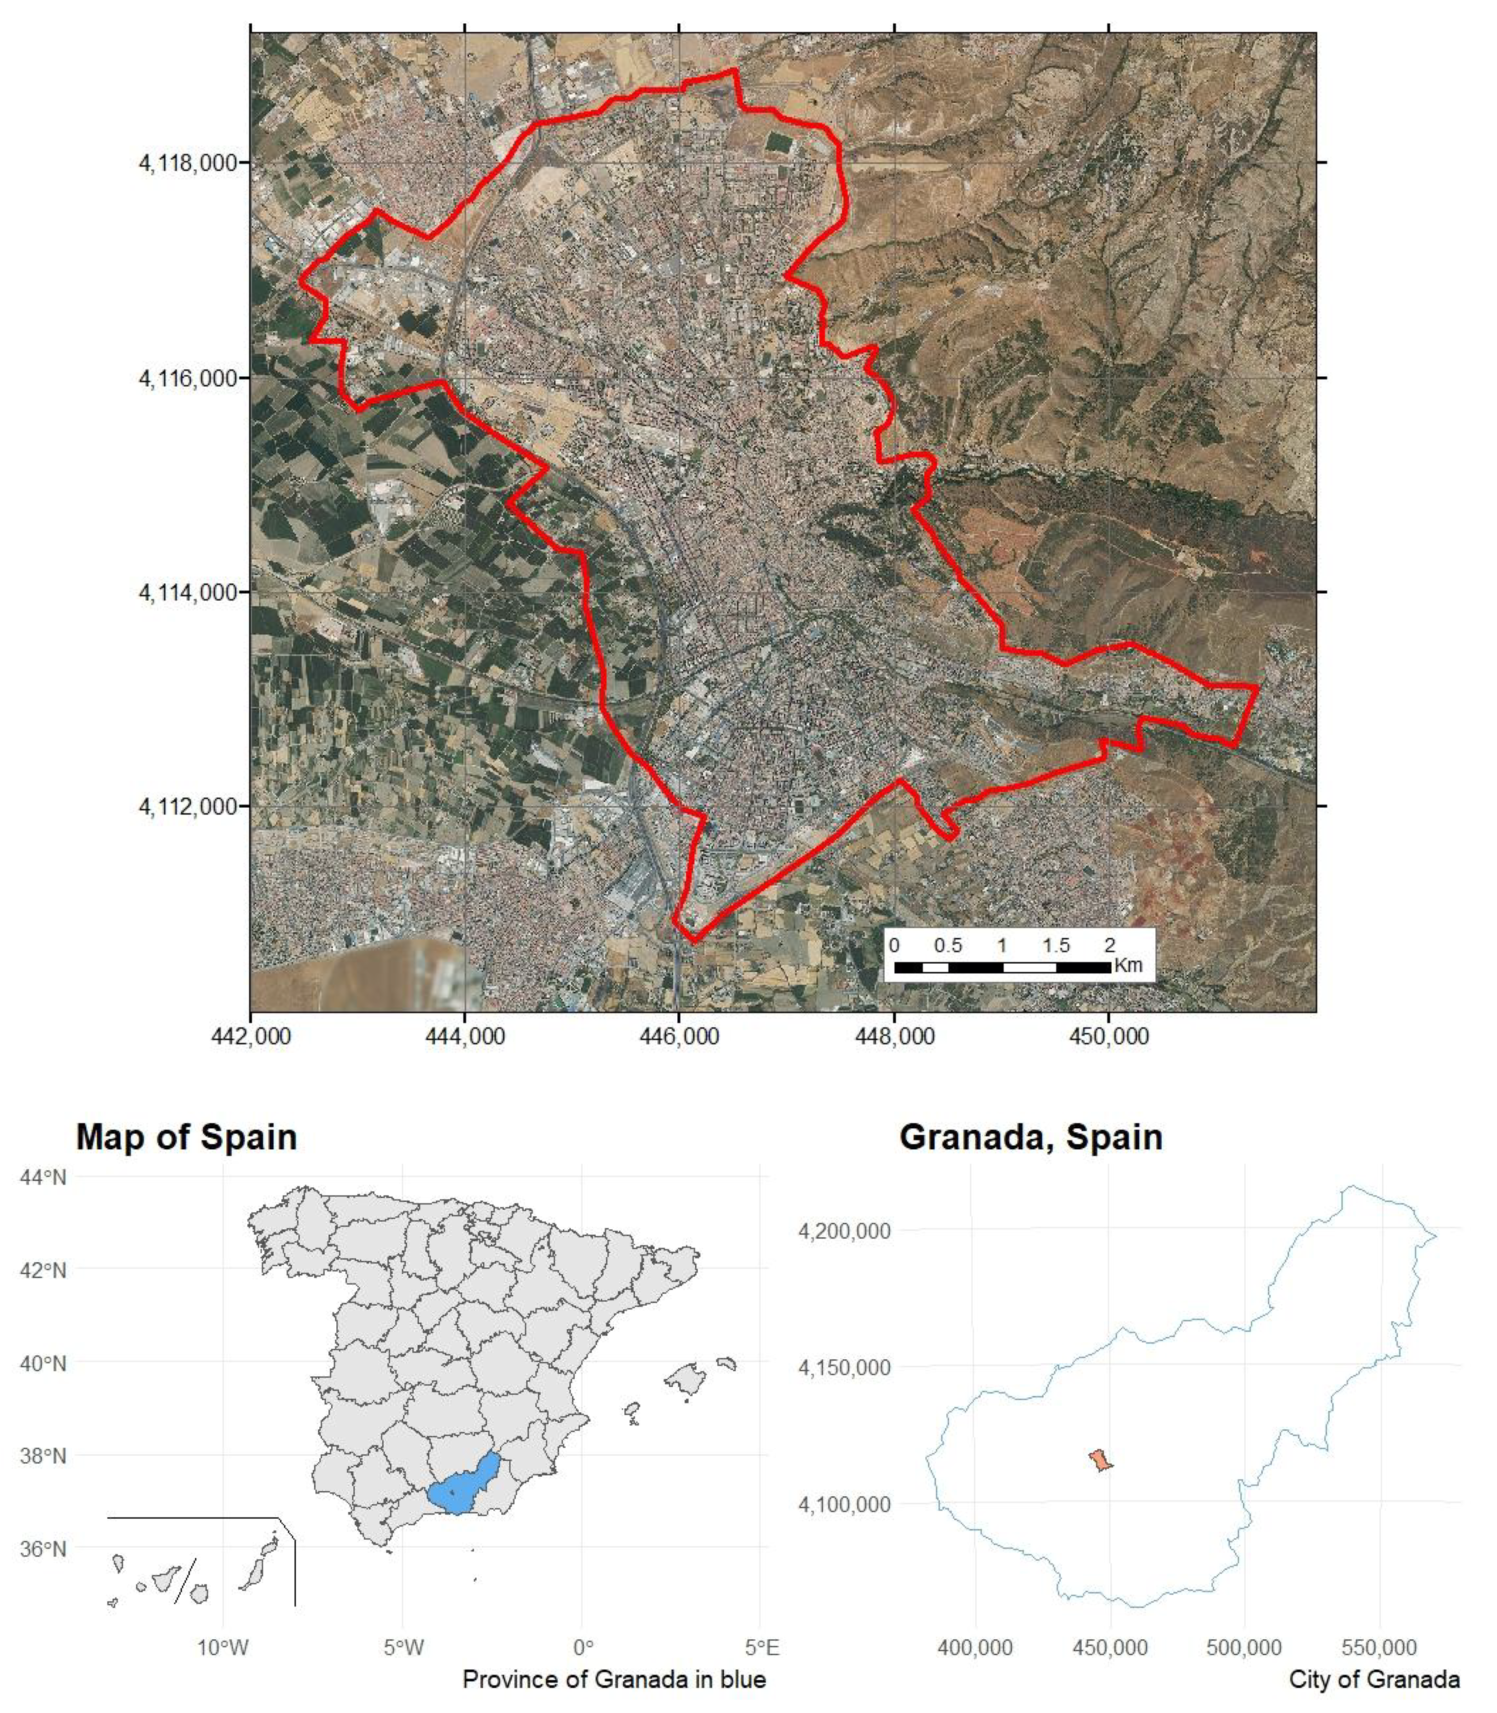
2.1. Study Area
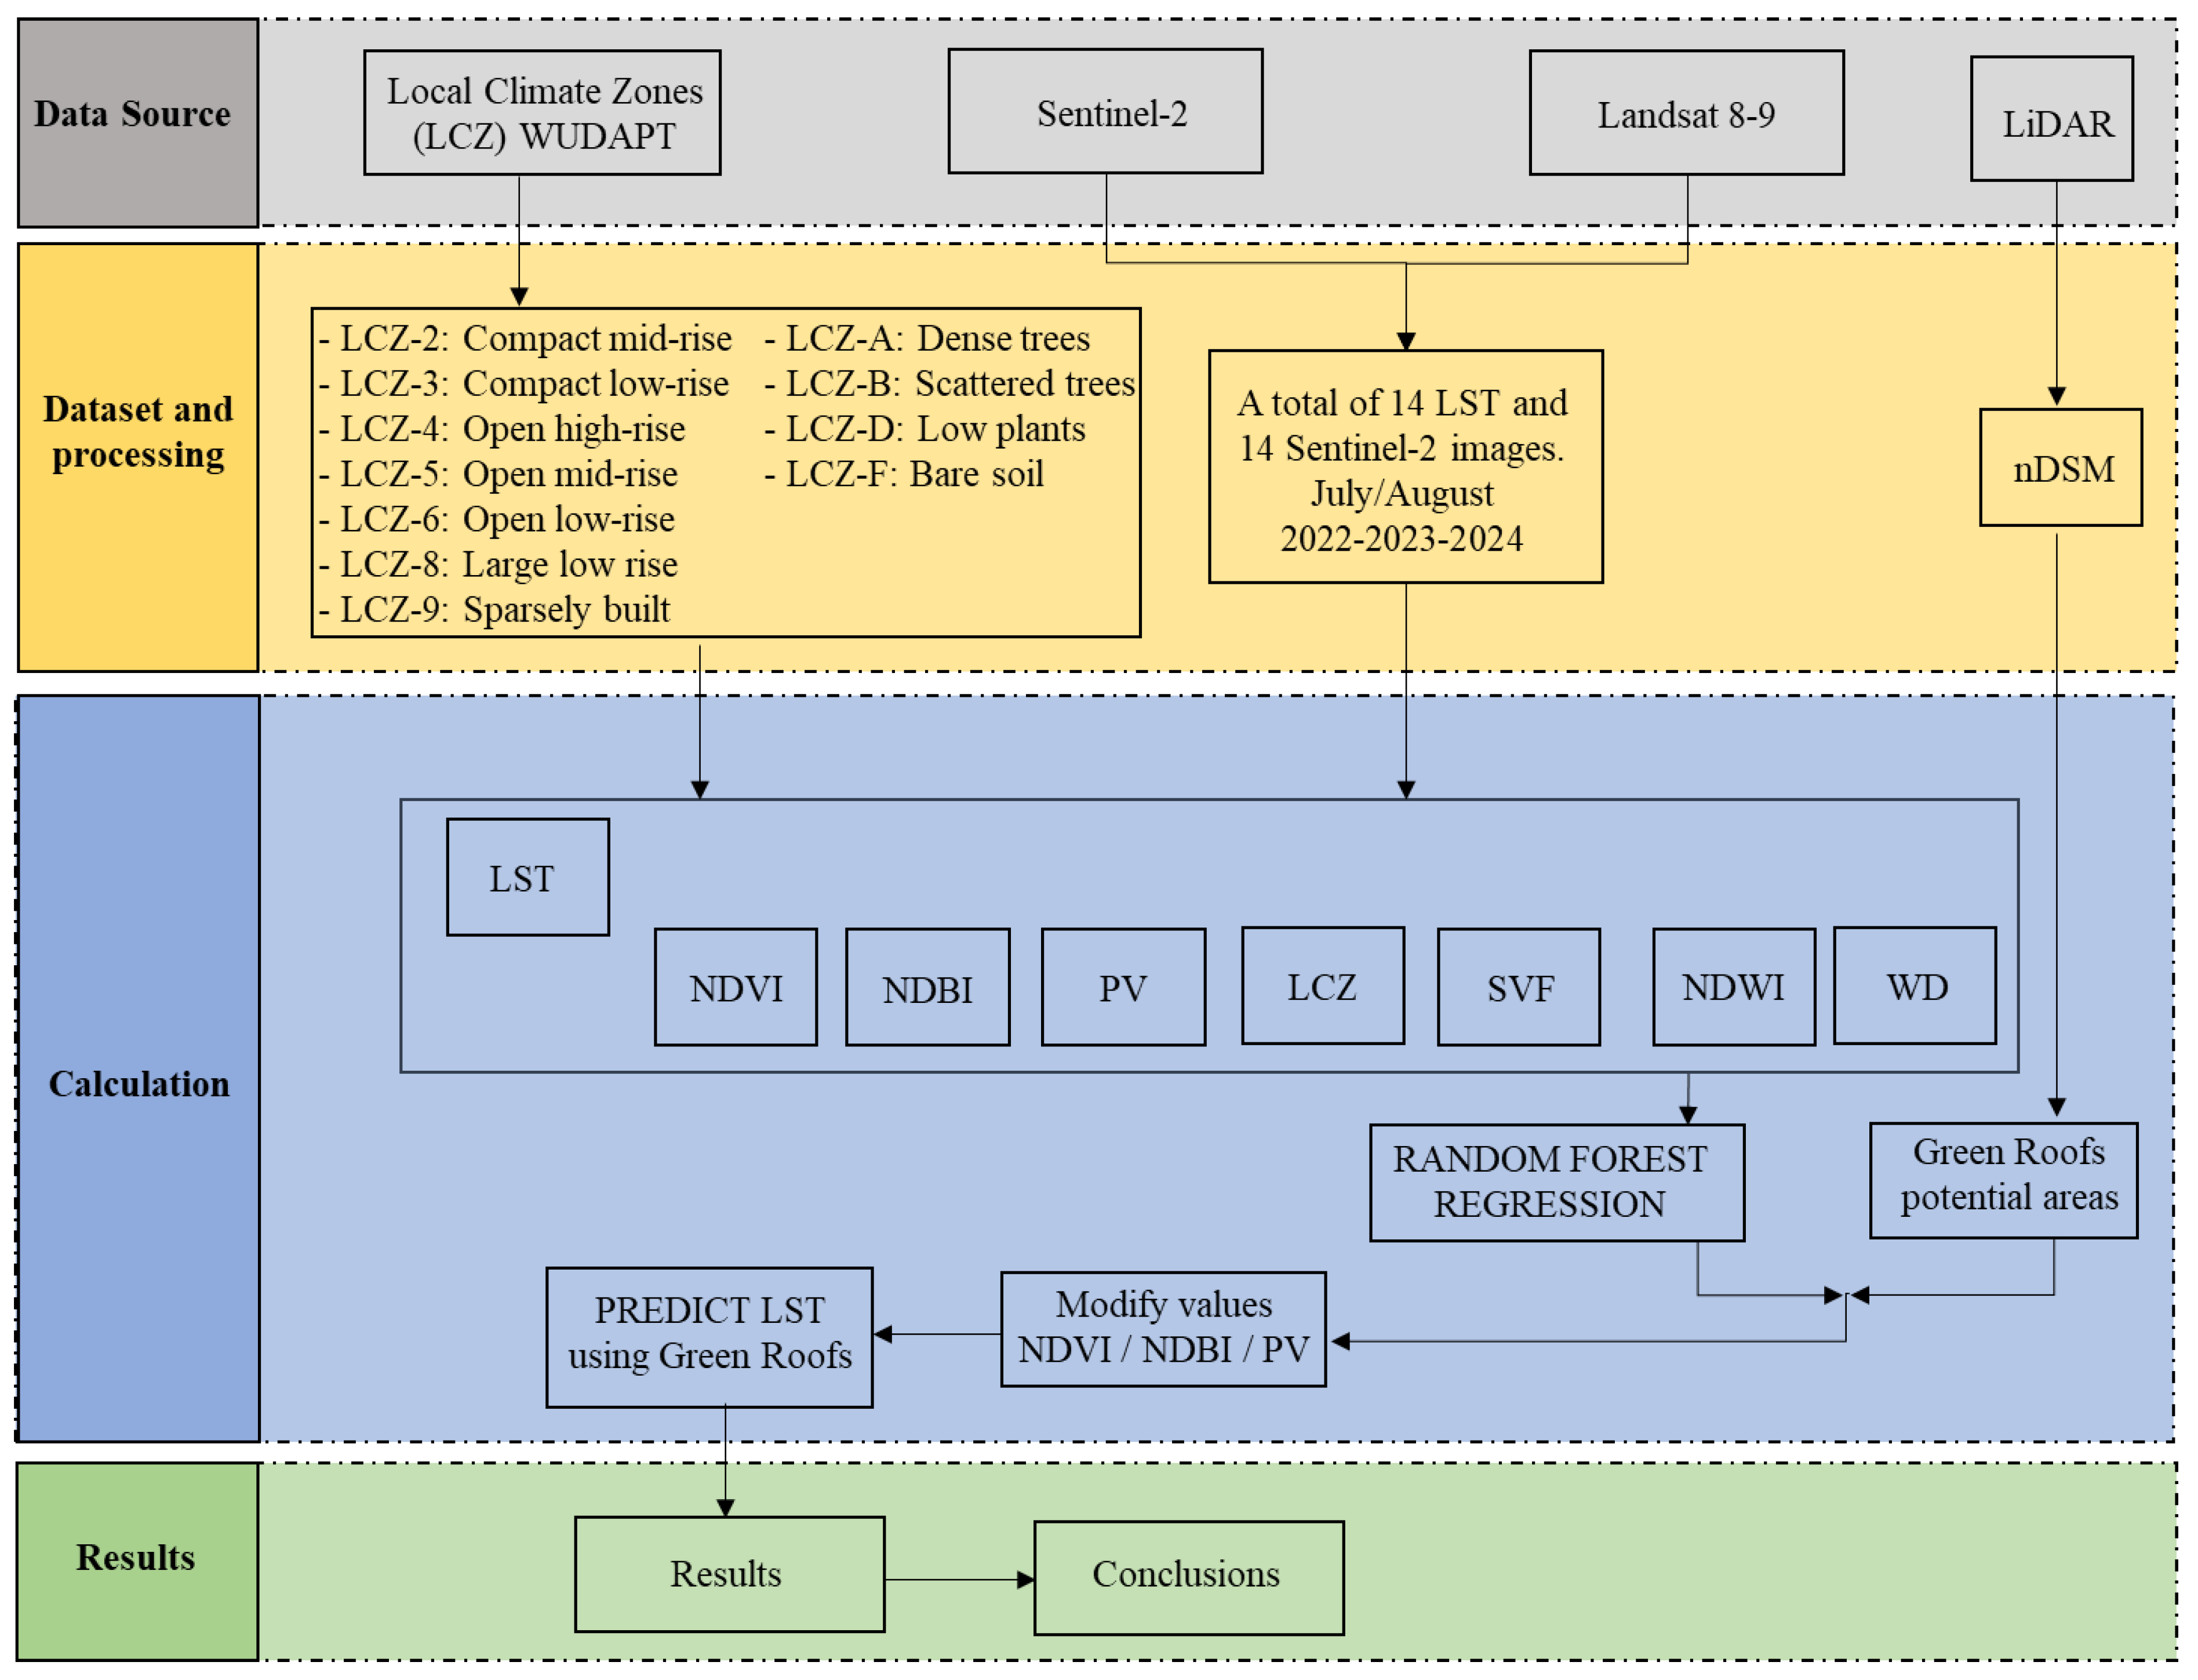
2.2. Methodology
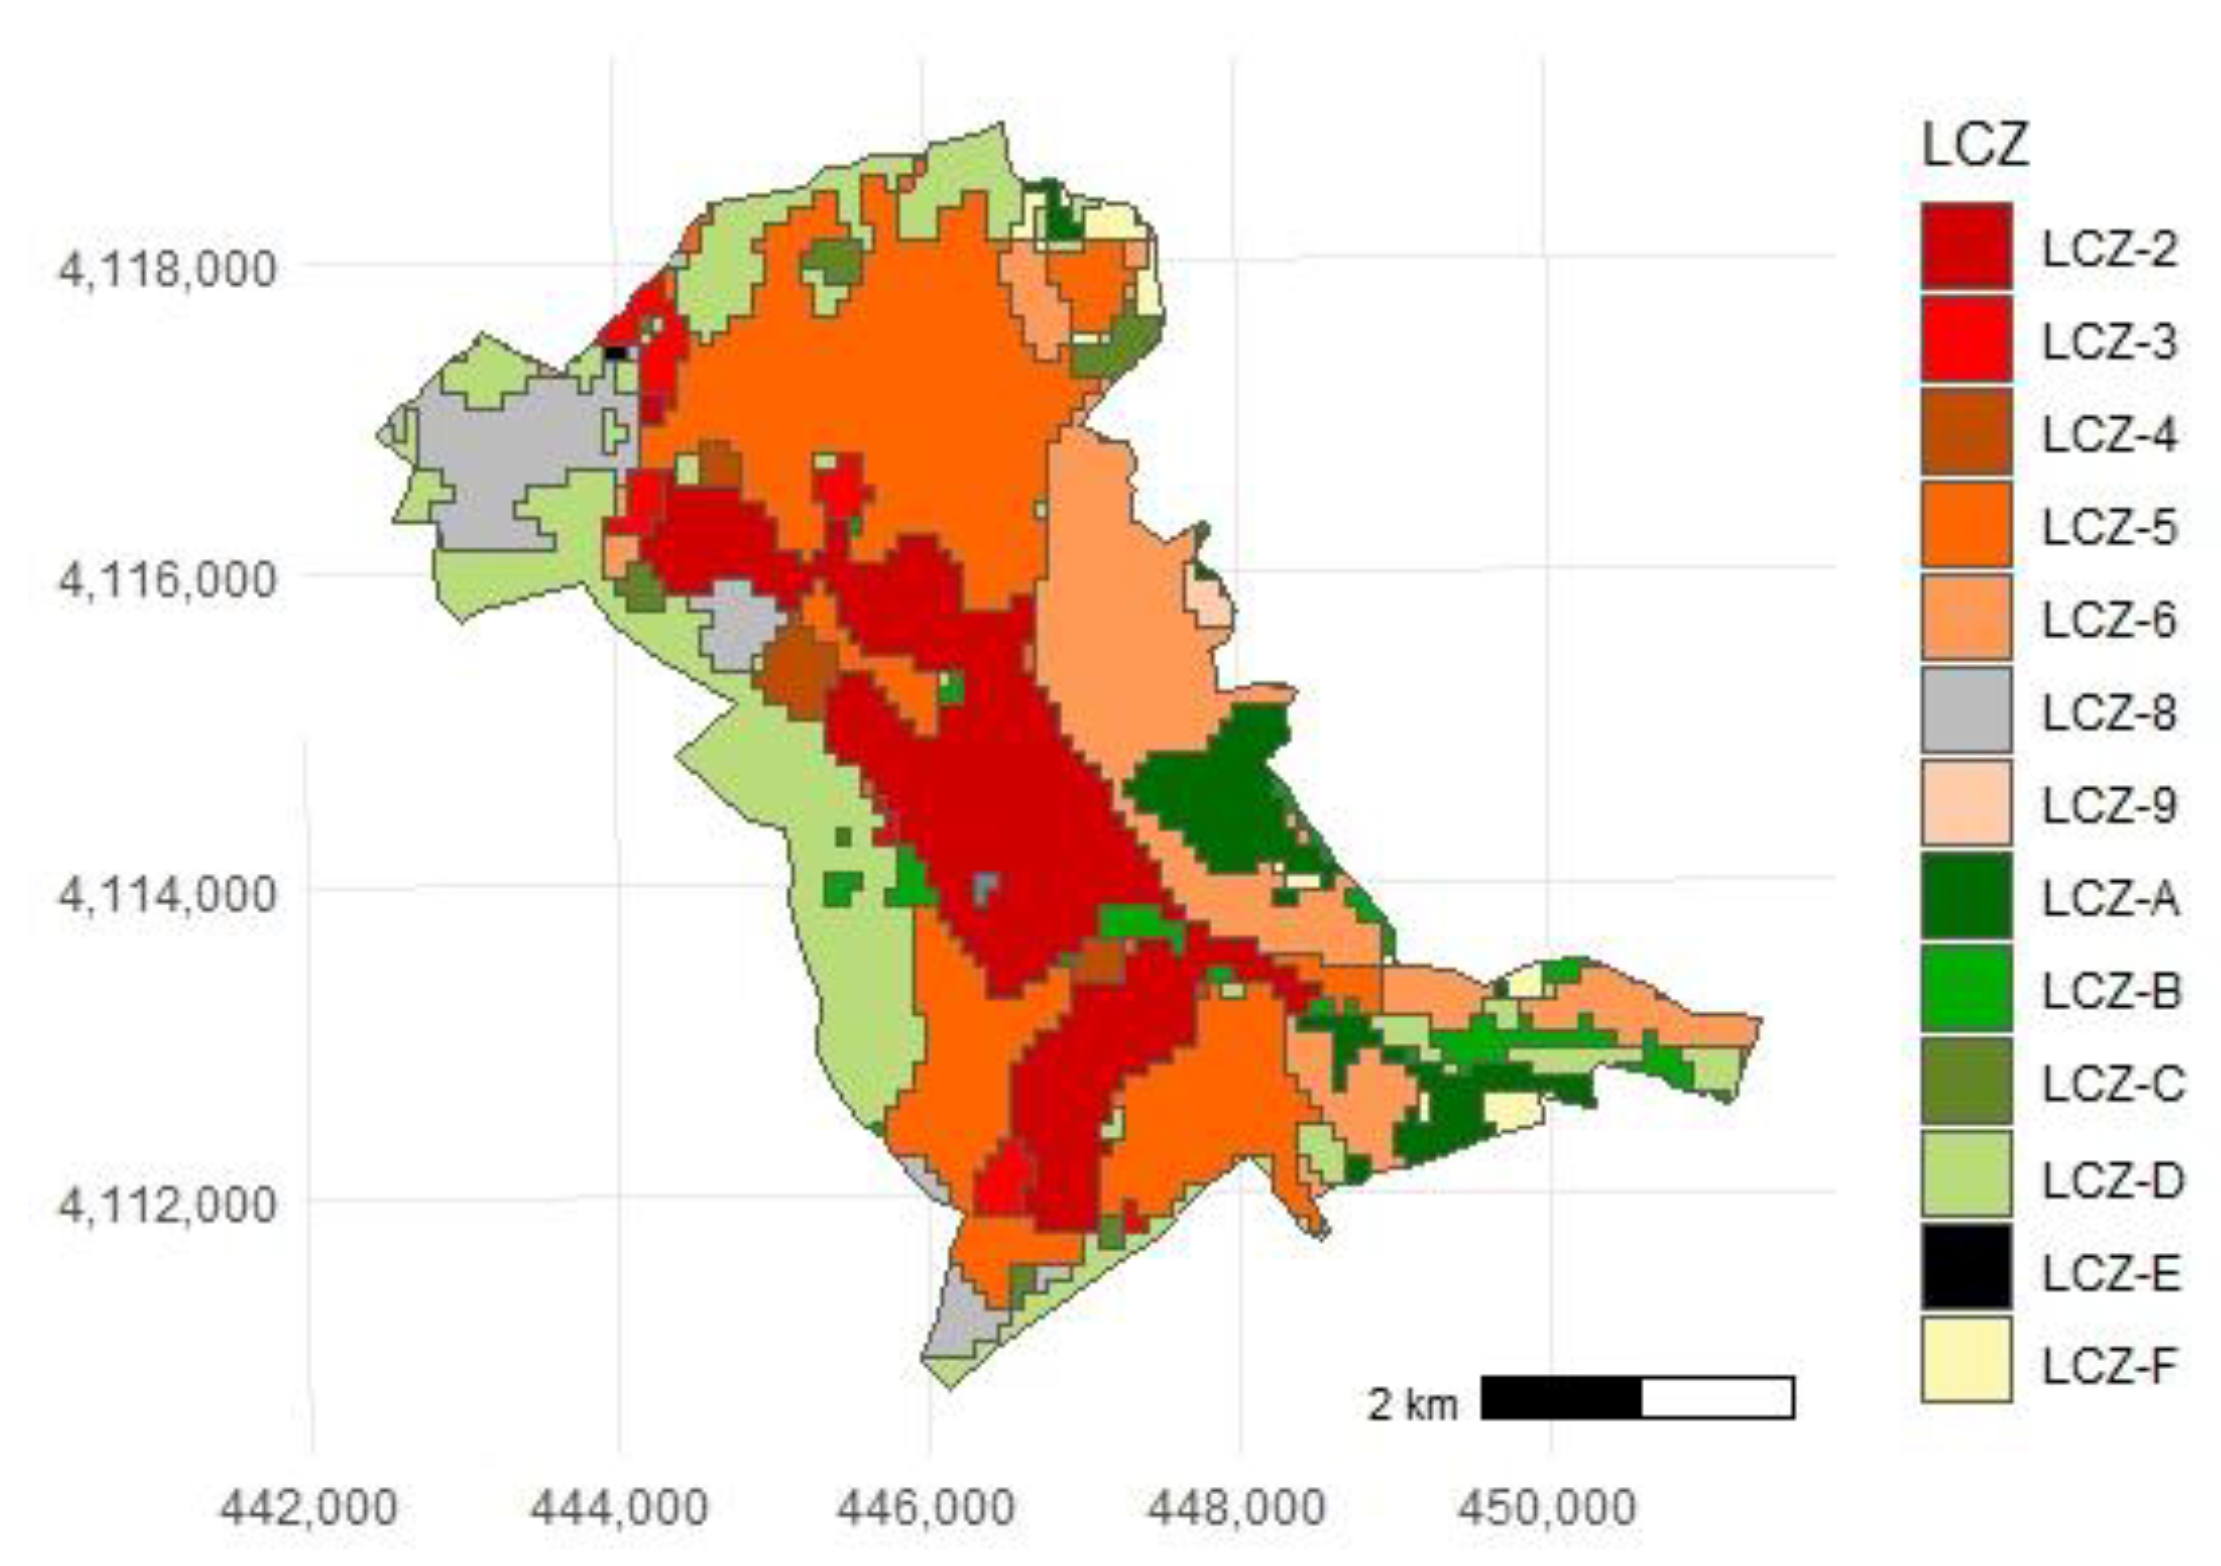
2.3. Map and LCZ Classification
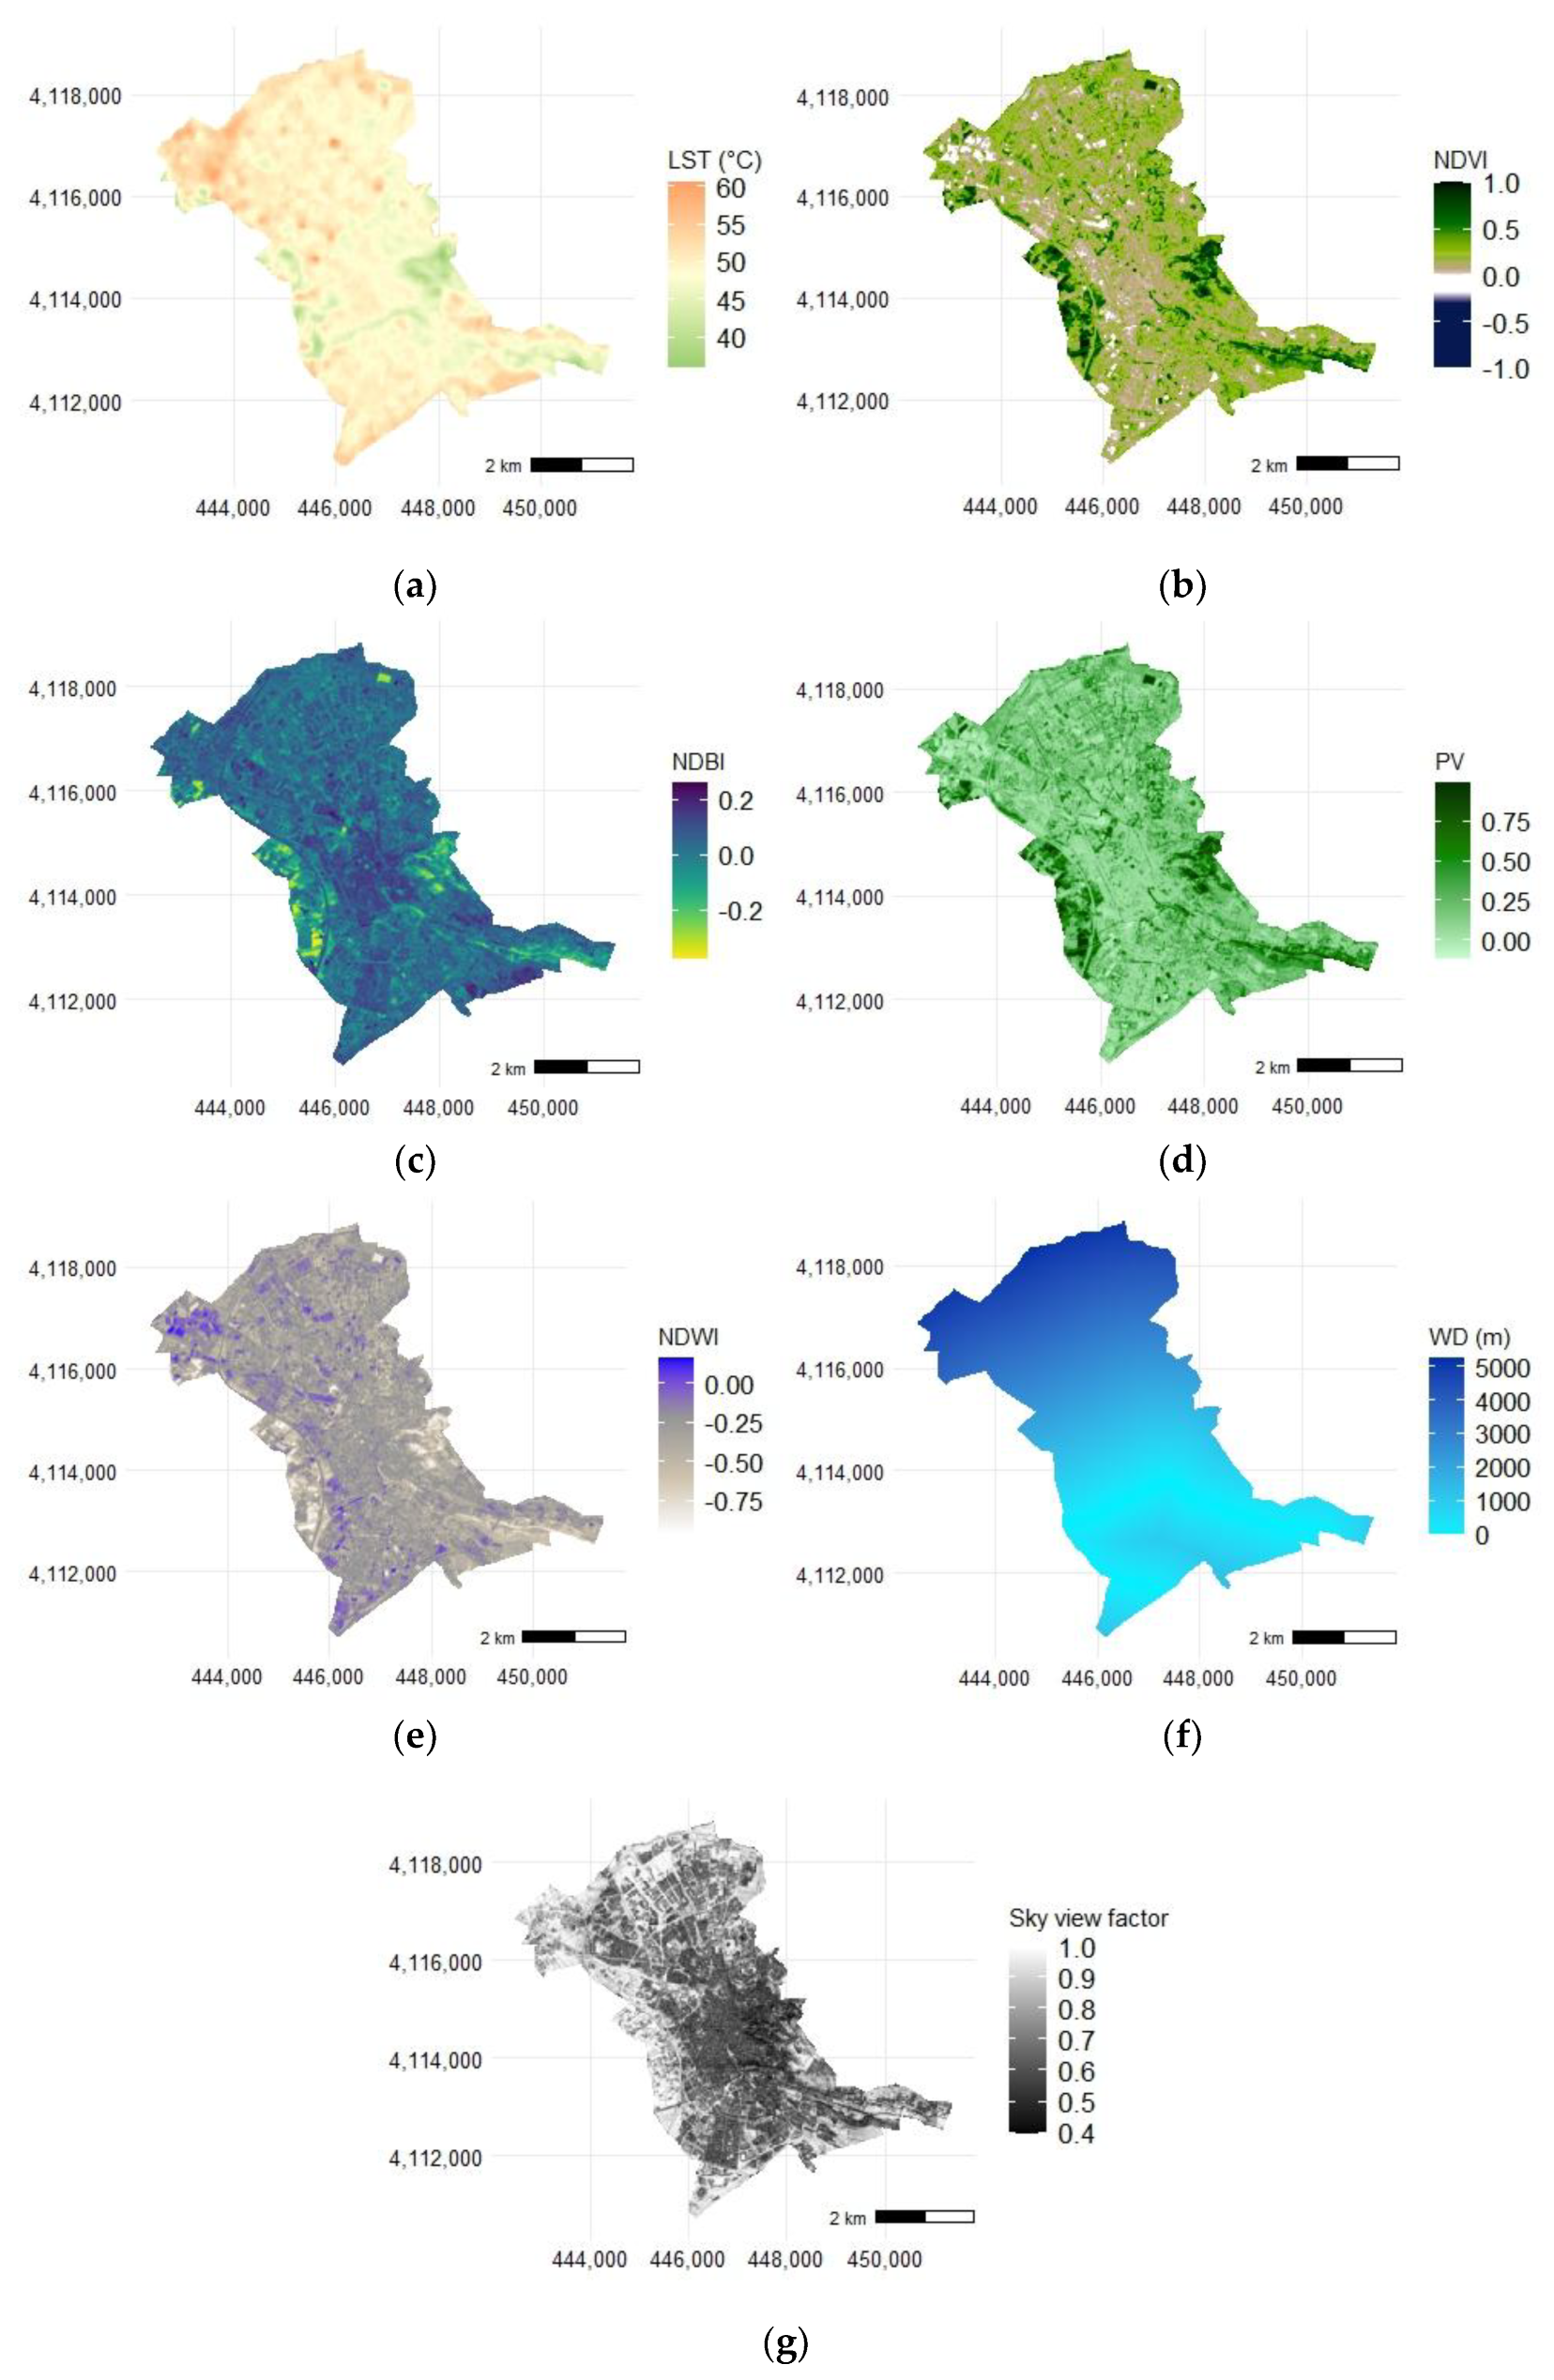
2.4. Landsat 8–9 LST Retrieval
2.5. Sentinel-2 Images and Spectral Indices Used
2.6. Estimation of Parameters Sky View Factor and Water Distance
2.7. Surface Temperature Mitigation
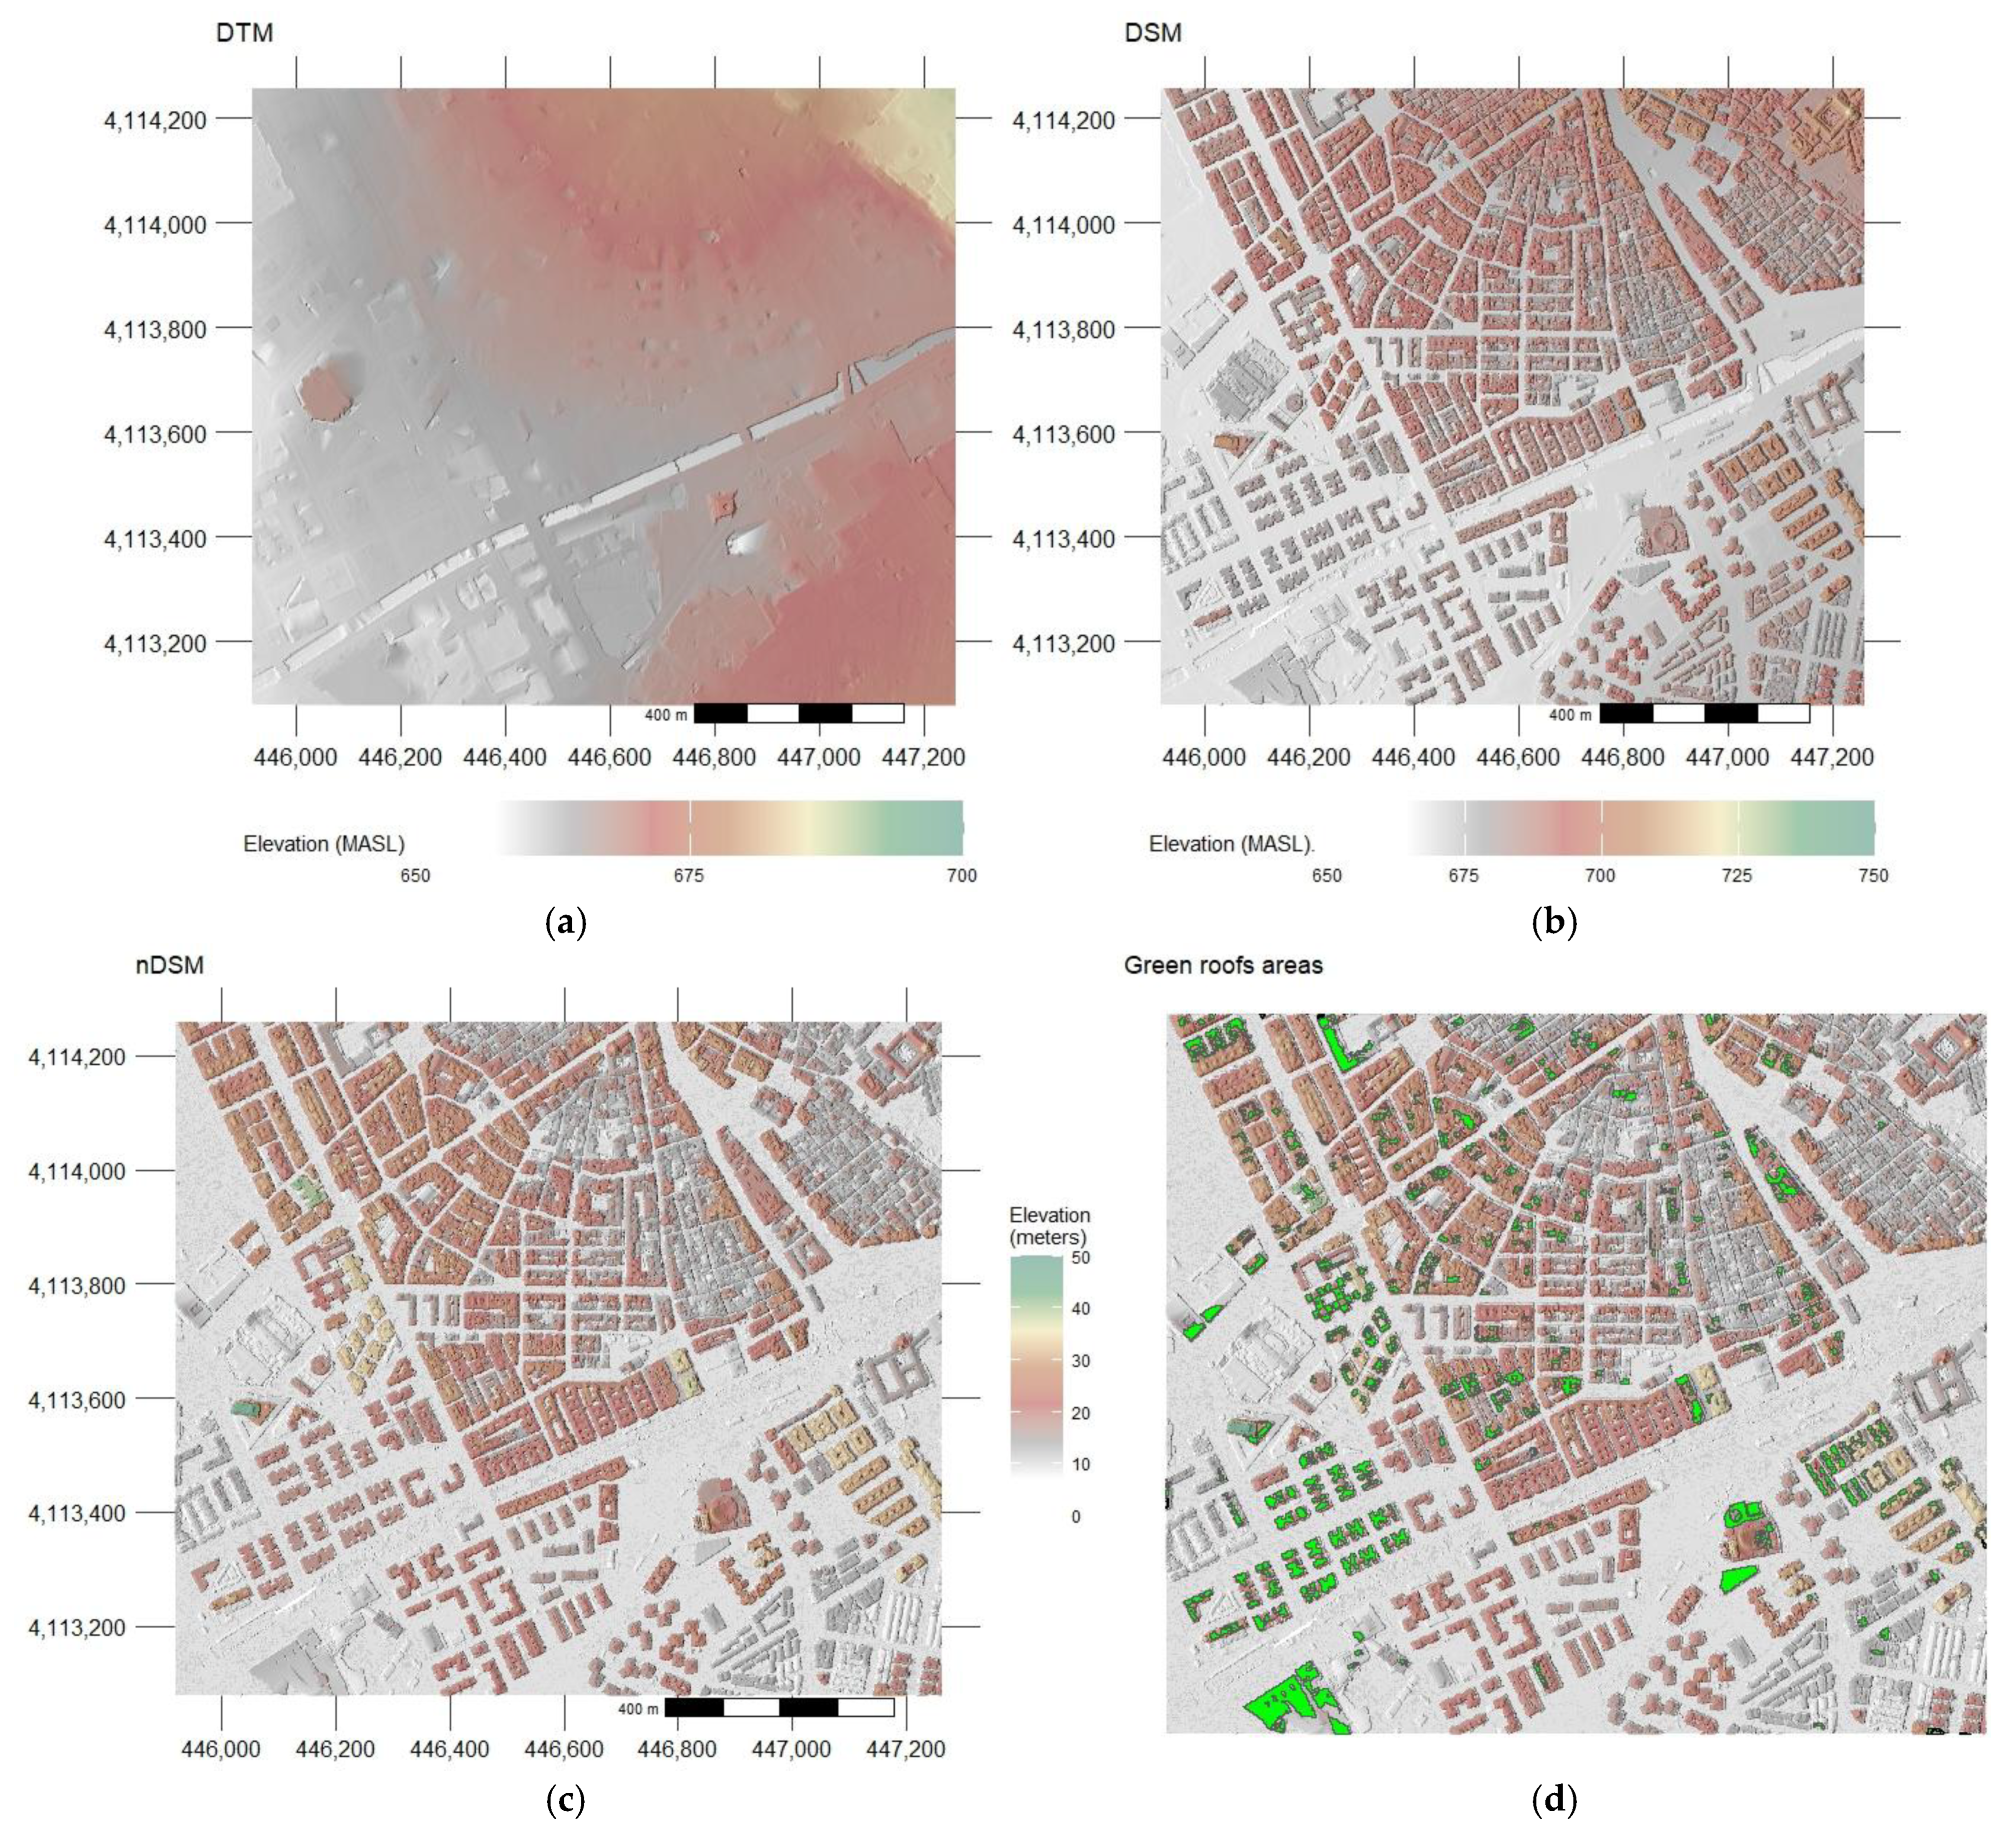
2.8. Green Roof Areas Selection Criteria
- Firstly, the slope is obtained in QGIS from the nDSM raster.
- Secondly, only pixels with a slope below 15% are considered from the slope raster. This threshold was chosen for practical reasons, such as stormwater management. Slope is an important factor because lower slopes enhance the GR stormwater retention and detention capacity [75,76], avoid drying out faster, and reduce erosion problems. Additionally, lower slopes allow for the installation of photovoltaic panels, which have gained popularity recently for their ability to provide combined benefits [77].
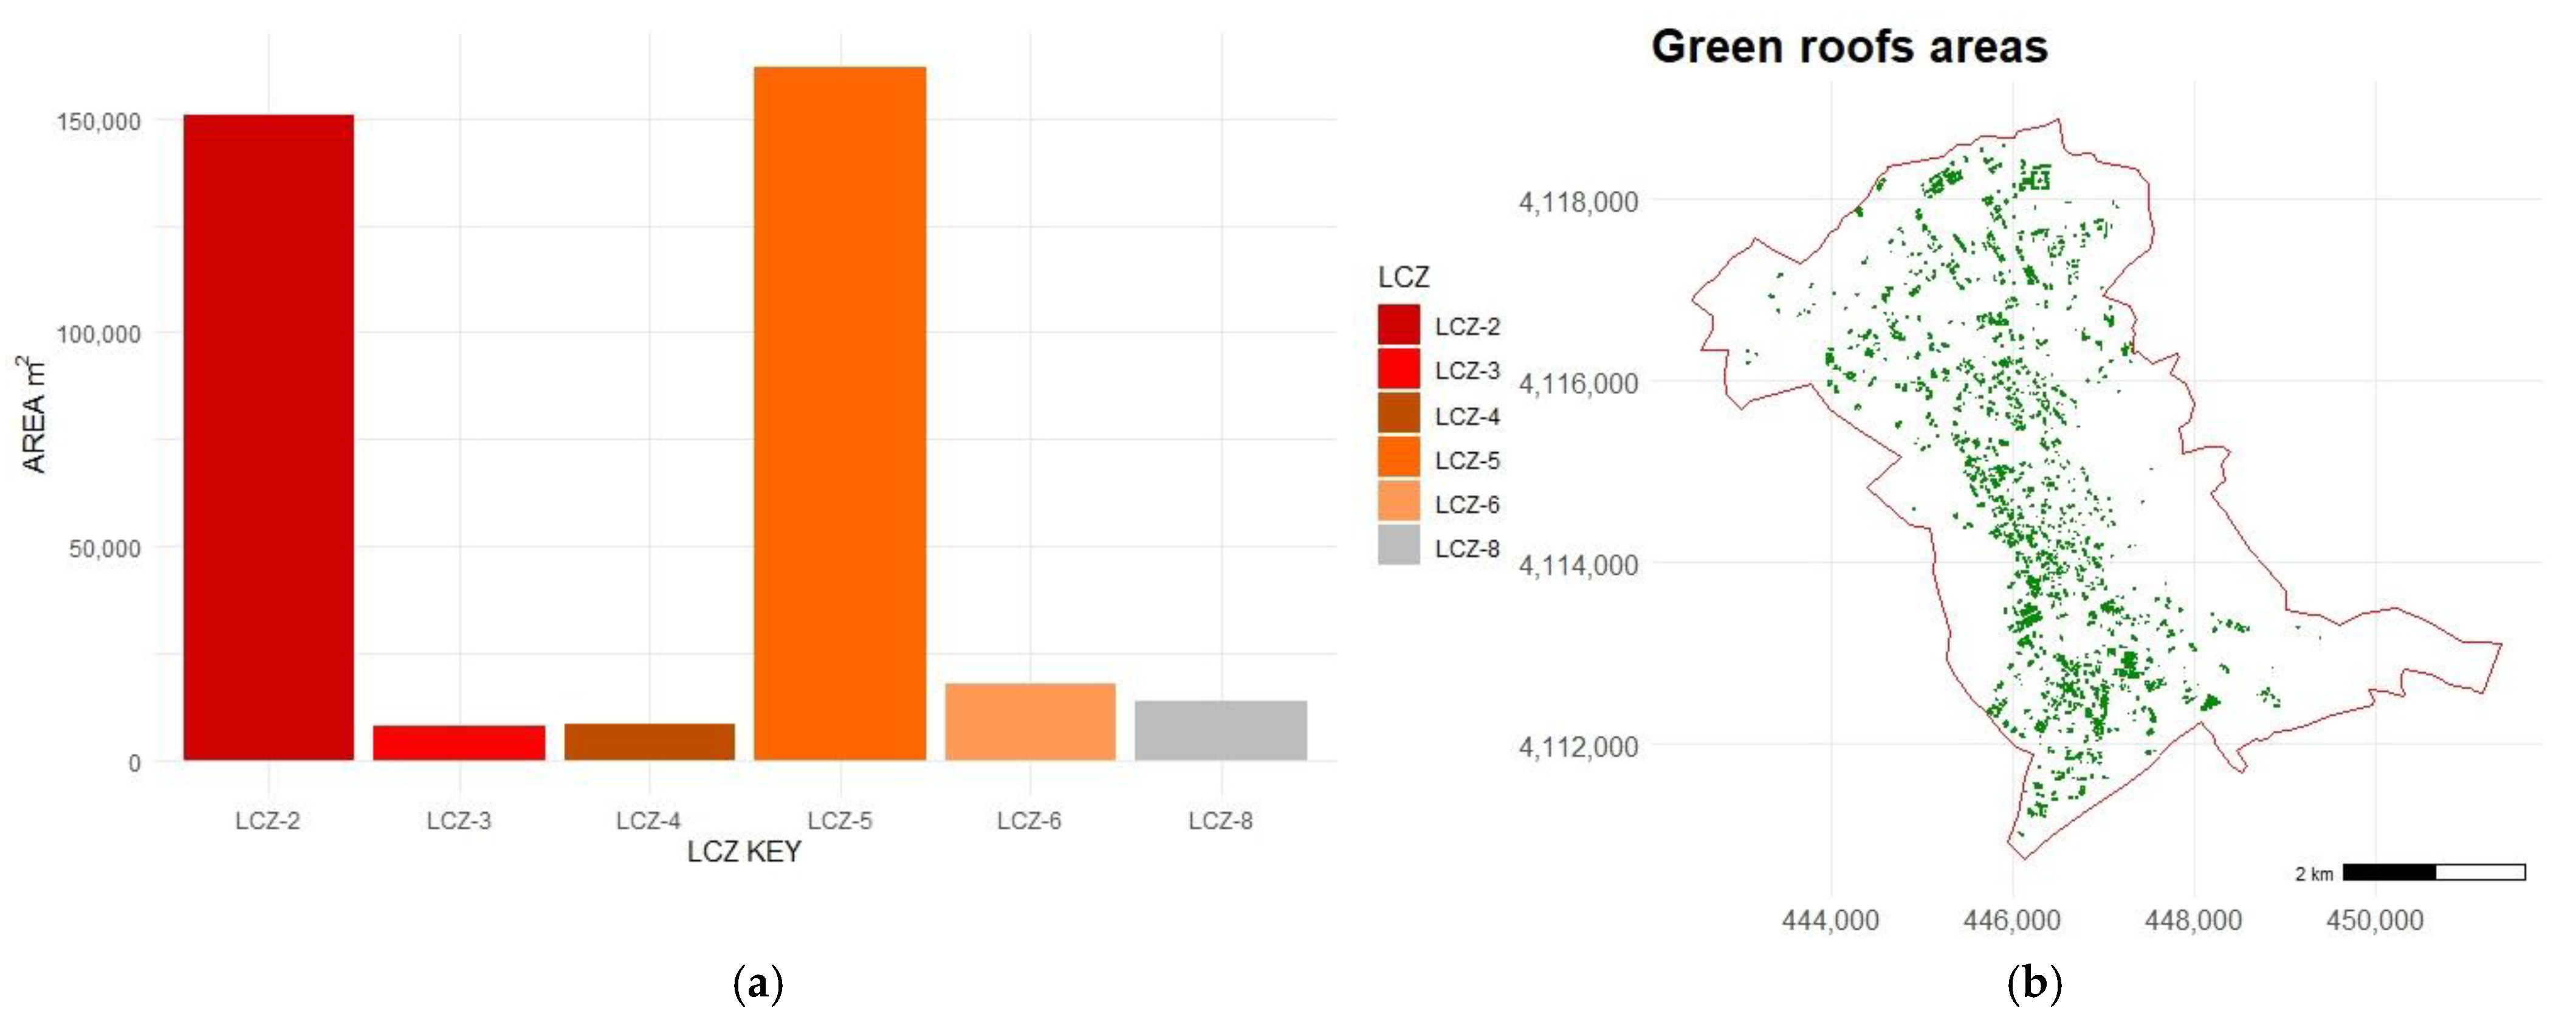
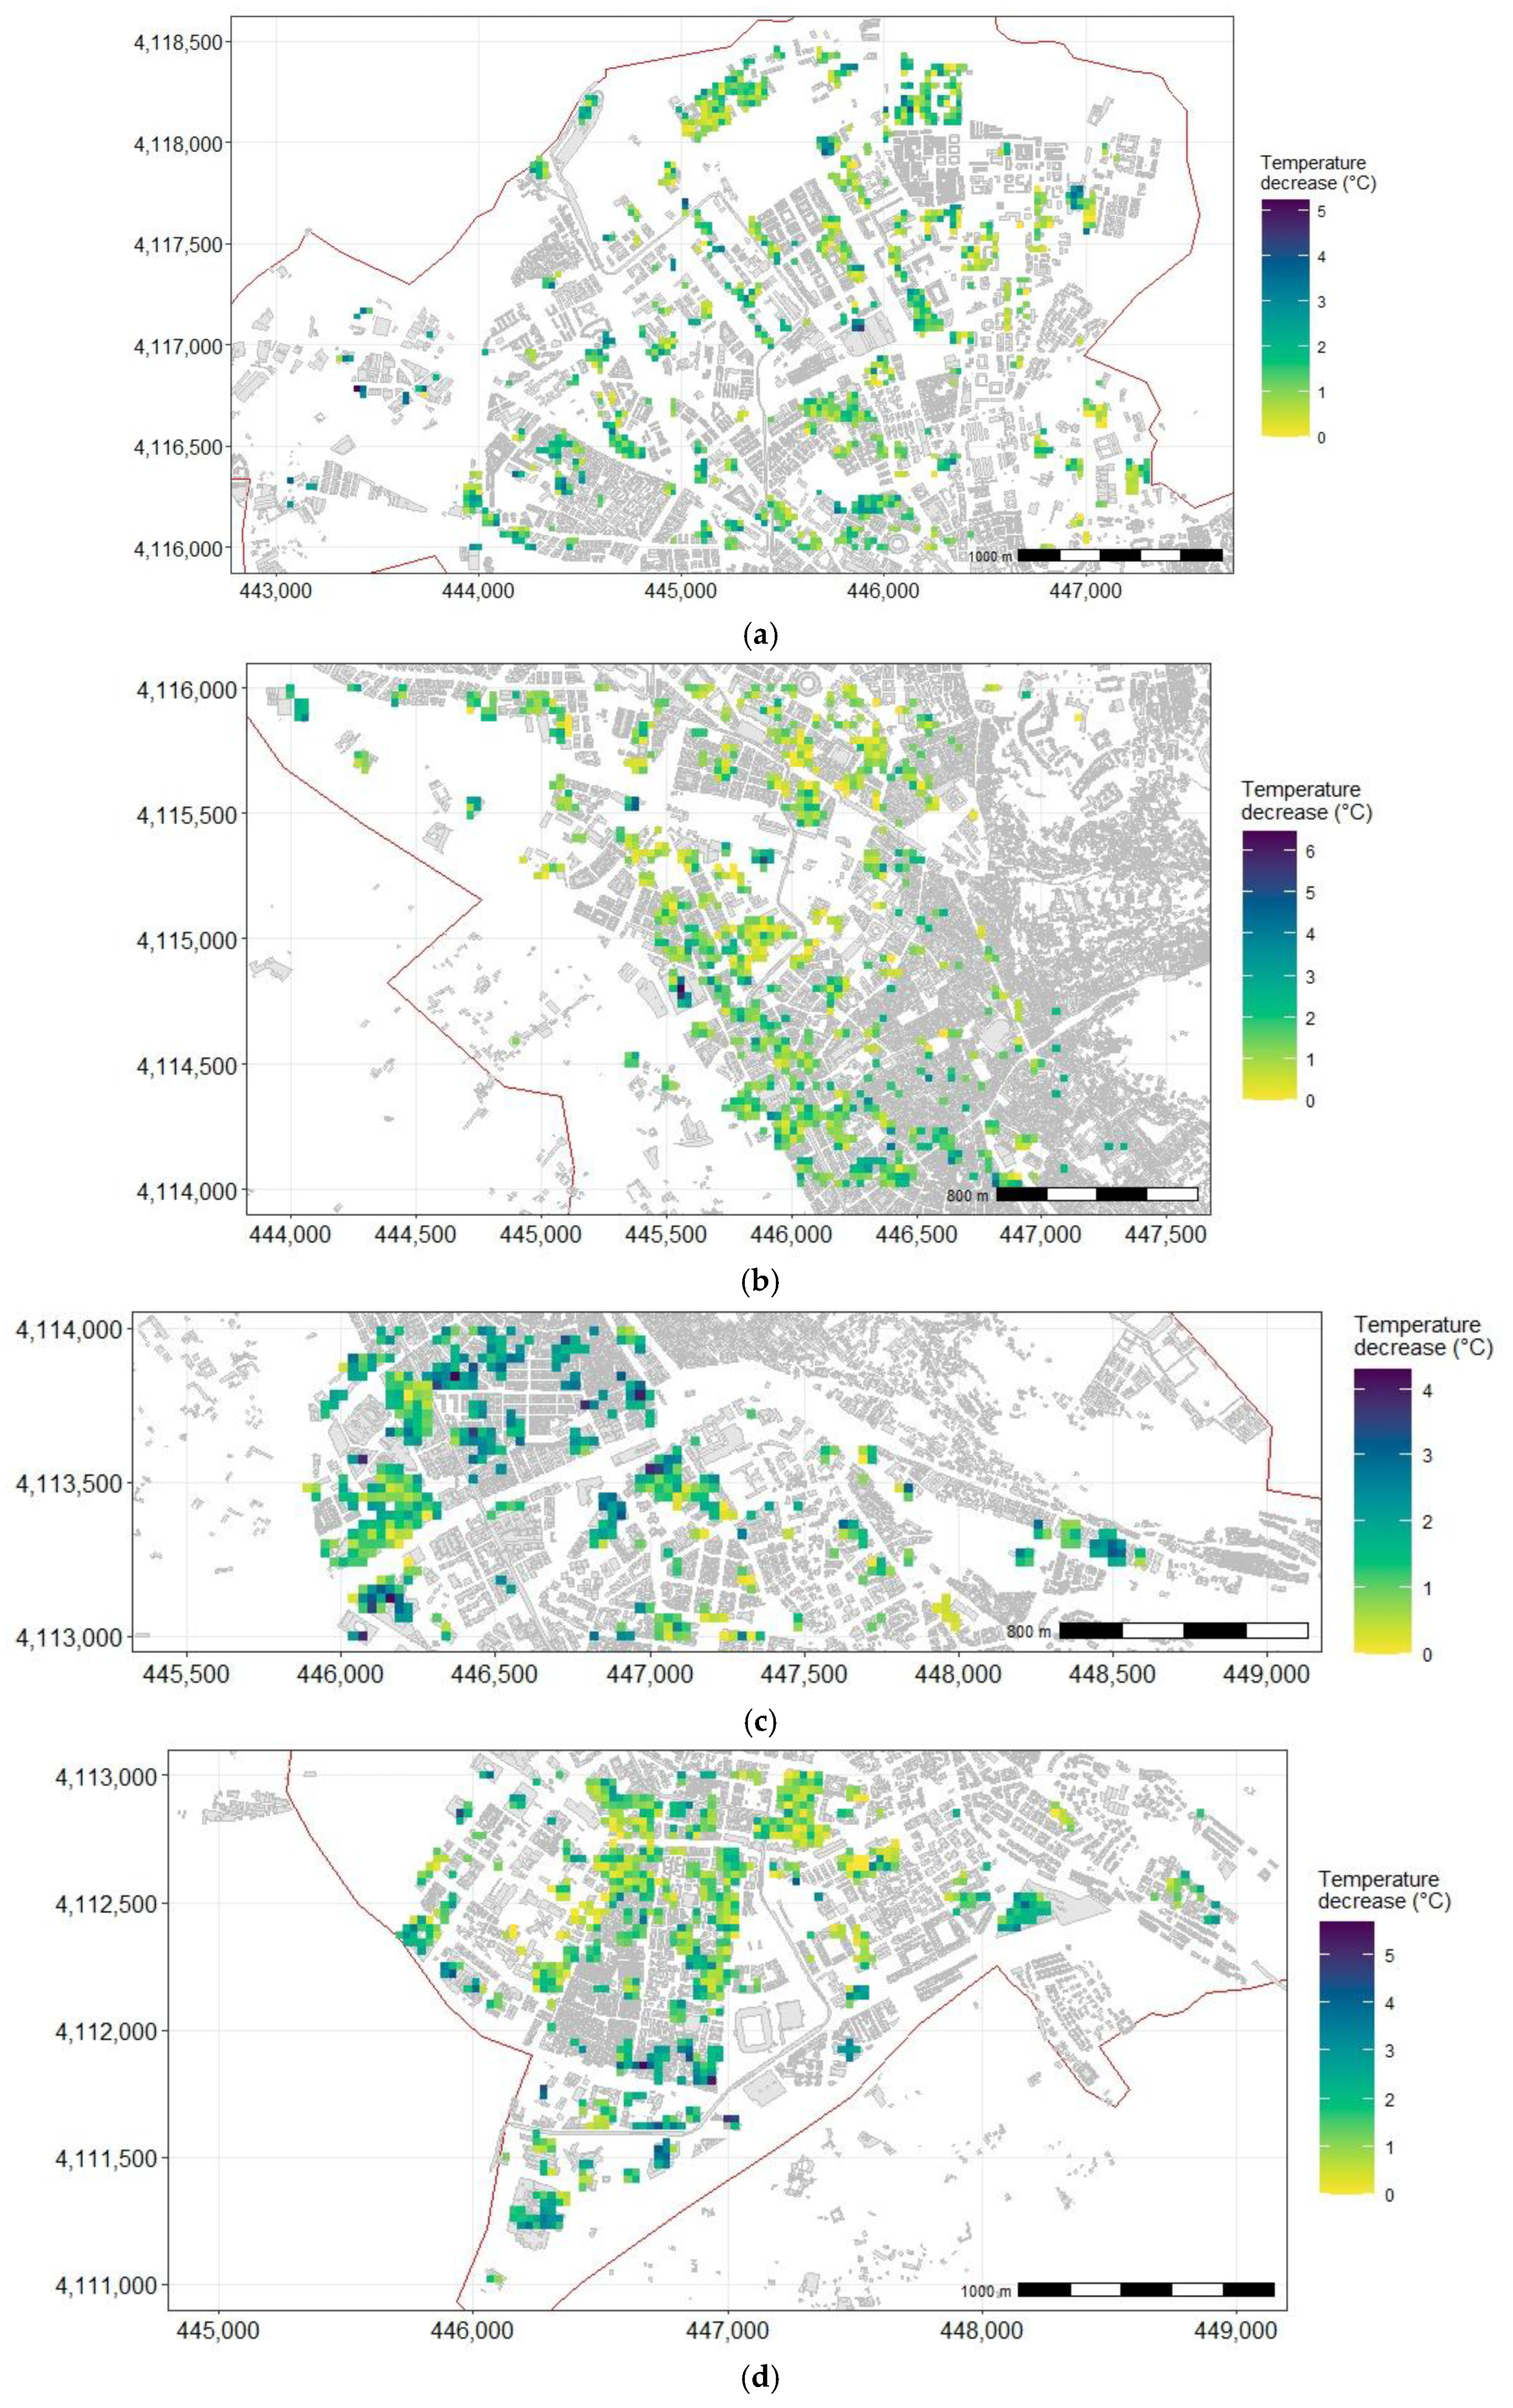
- Thirdly, these pixels were joined and converted to shapefiles. Areas smaller than 50 m2 were excluded, as they were deemed too small to have a significant impact. The selected areas are depicted in Figure 8d and represent actual roof areas suitable for roof greening.
2.9. Random Forest
2.10. Error Metrics
2.11. Green Roofs Simulation Approach
3. Results and Discussion
3.1. Green Roofs Potential Suitable Areas in Different LCZs
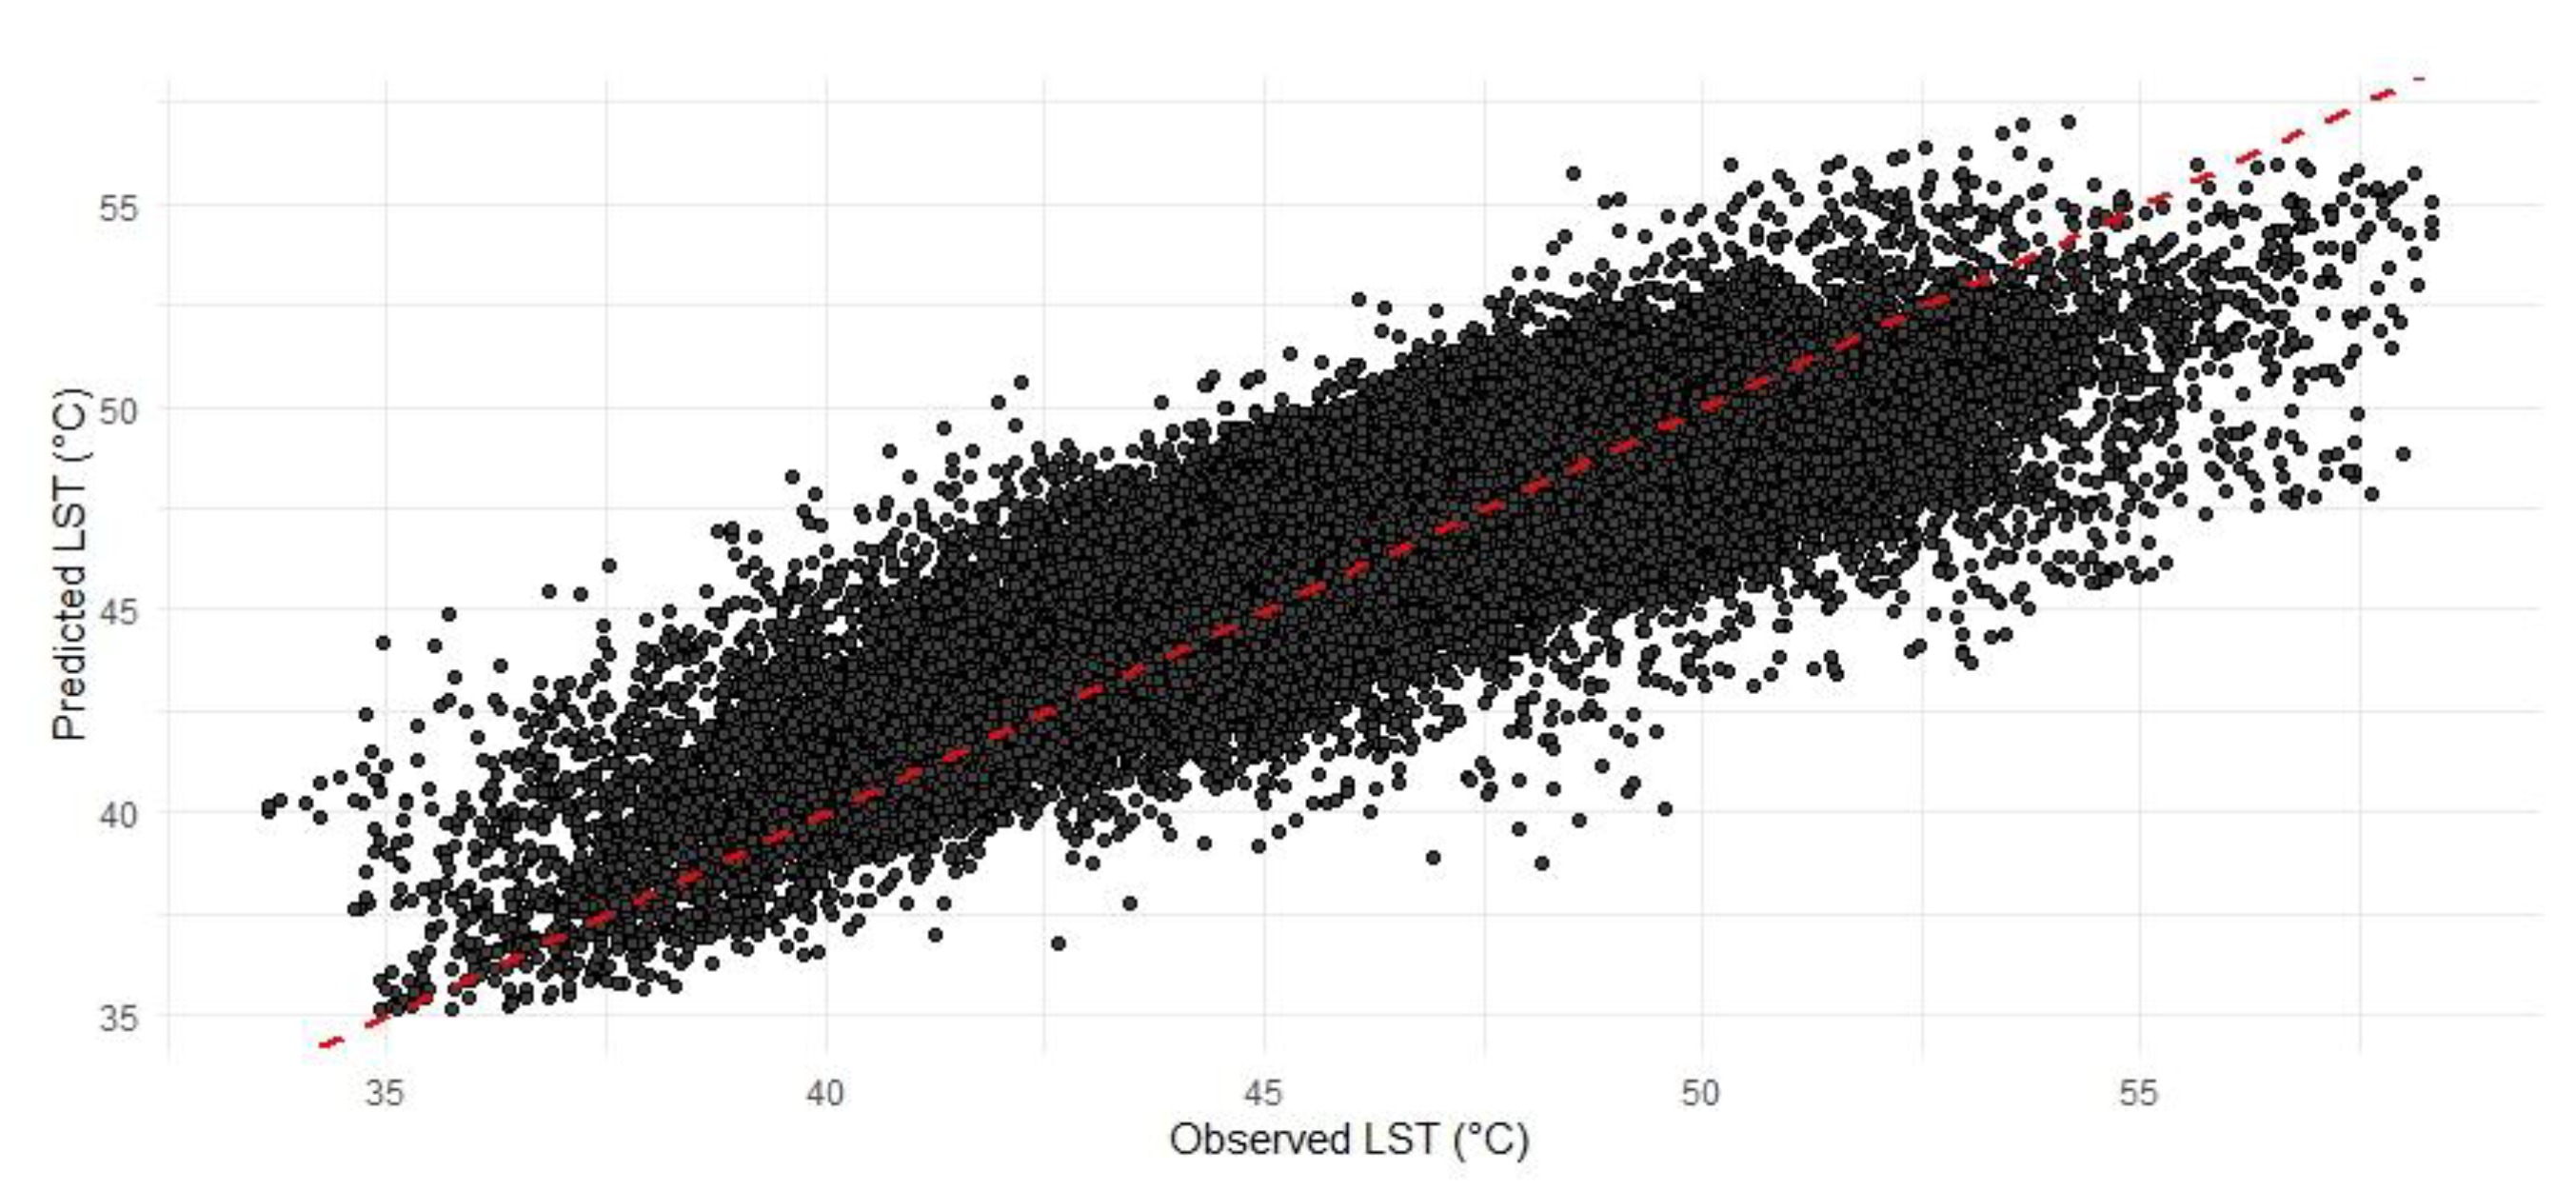
3.2. Random Forest Regression Model Results
3.3. Results on Temperature Mitigation Using Green Roofs
3.4. Comparative Analysis and Discussion
3.5. Limitations and Recommendations
4. Conclusions
- The proposed model predicts an average LST reduction of 1.45 °C during the hot months in summer, indicating that the potential of extensive green roofs in the city to mitigate high LST is moderate.
- The selection process to identify areas suitable for retrofitting GRs with the help of LiDAR points identified fewer suitable areas for green roofs than the total number of existing roofs available. Three criteria were considered for selecting these areas: slopes lower than 15% to enhance stormwater retention, lower slopes to prevent erosion issues, and the exclusion of small areas that might not have significant influence, leading to a more realistic assessment of potential retrofitting opportunities. Thus, the effects of GRs alone might be neglectable to mitigate high LST.
- The results indicate different LSTs between built-up areas and landscape zones. However, the difference in temperature between urban built-up areas is small, suggesting that all urban LCZs are equally a priority for greening.
- In Granada, LCZ-2 and 5 present more available areas suitable for retrofitting GRs, while LCZ 8, with a high land surface temperature, does not have enough space for green roofs, requiring urgent intervention with different planning to lower the temperature.
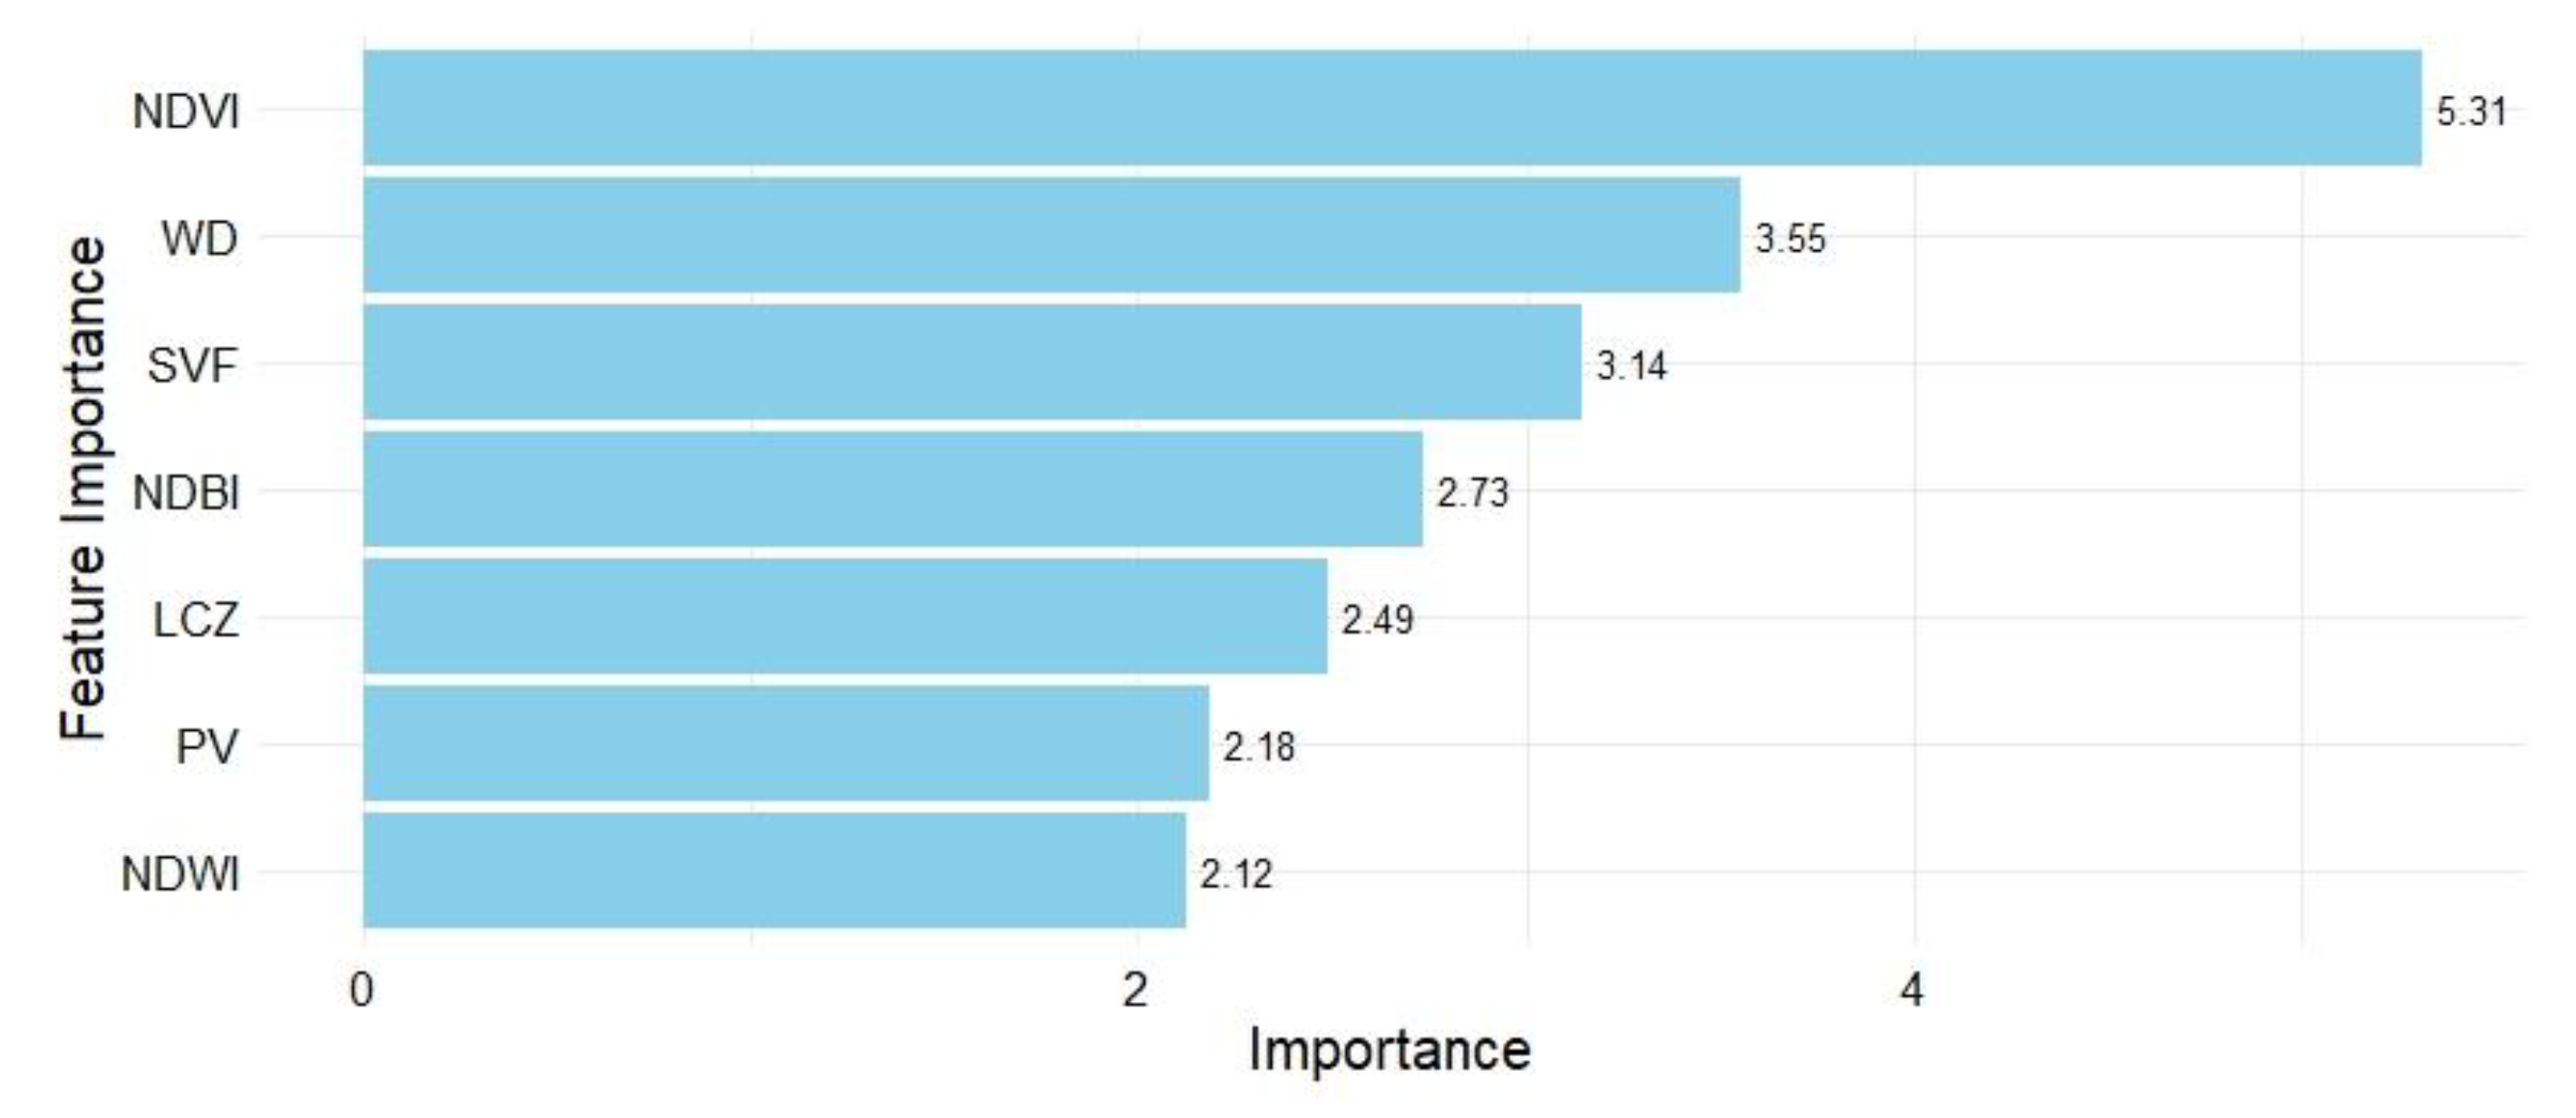
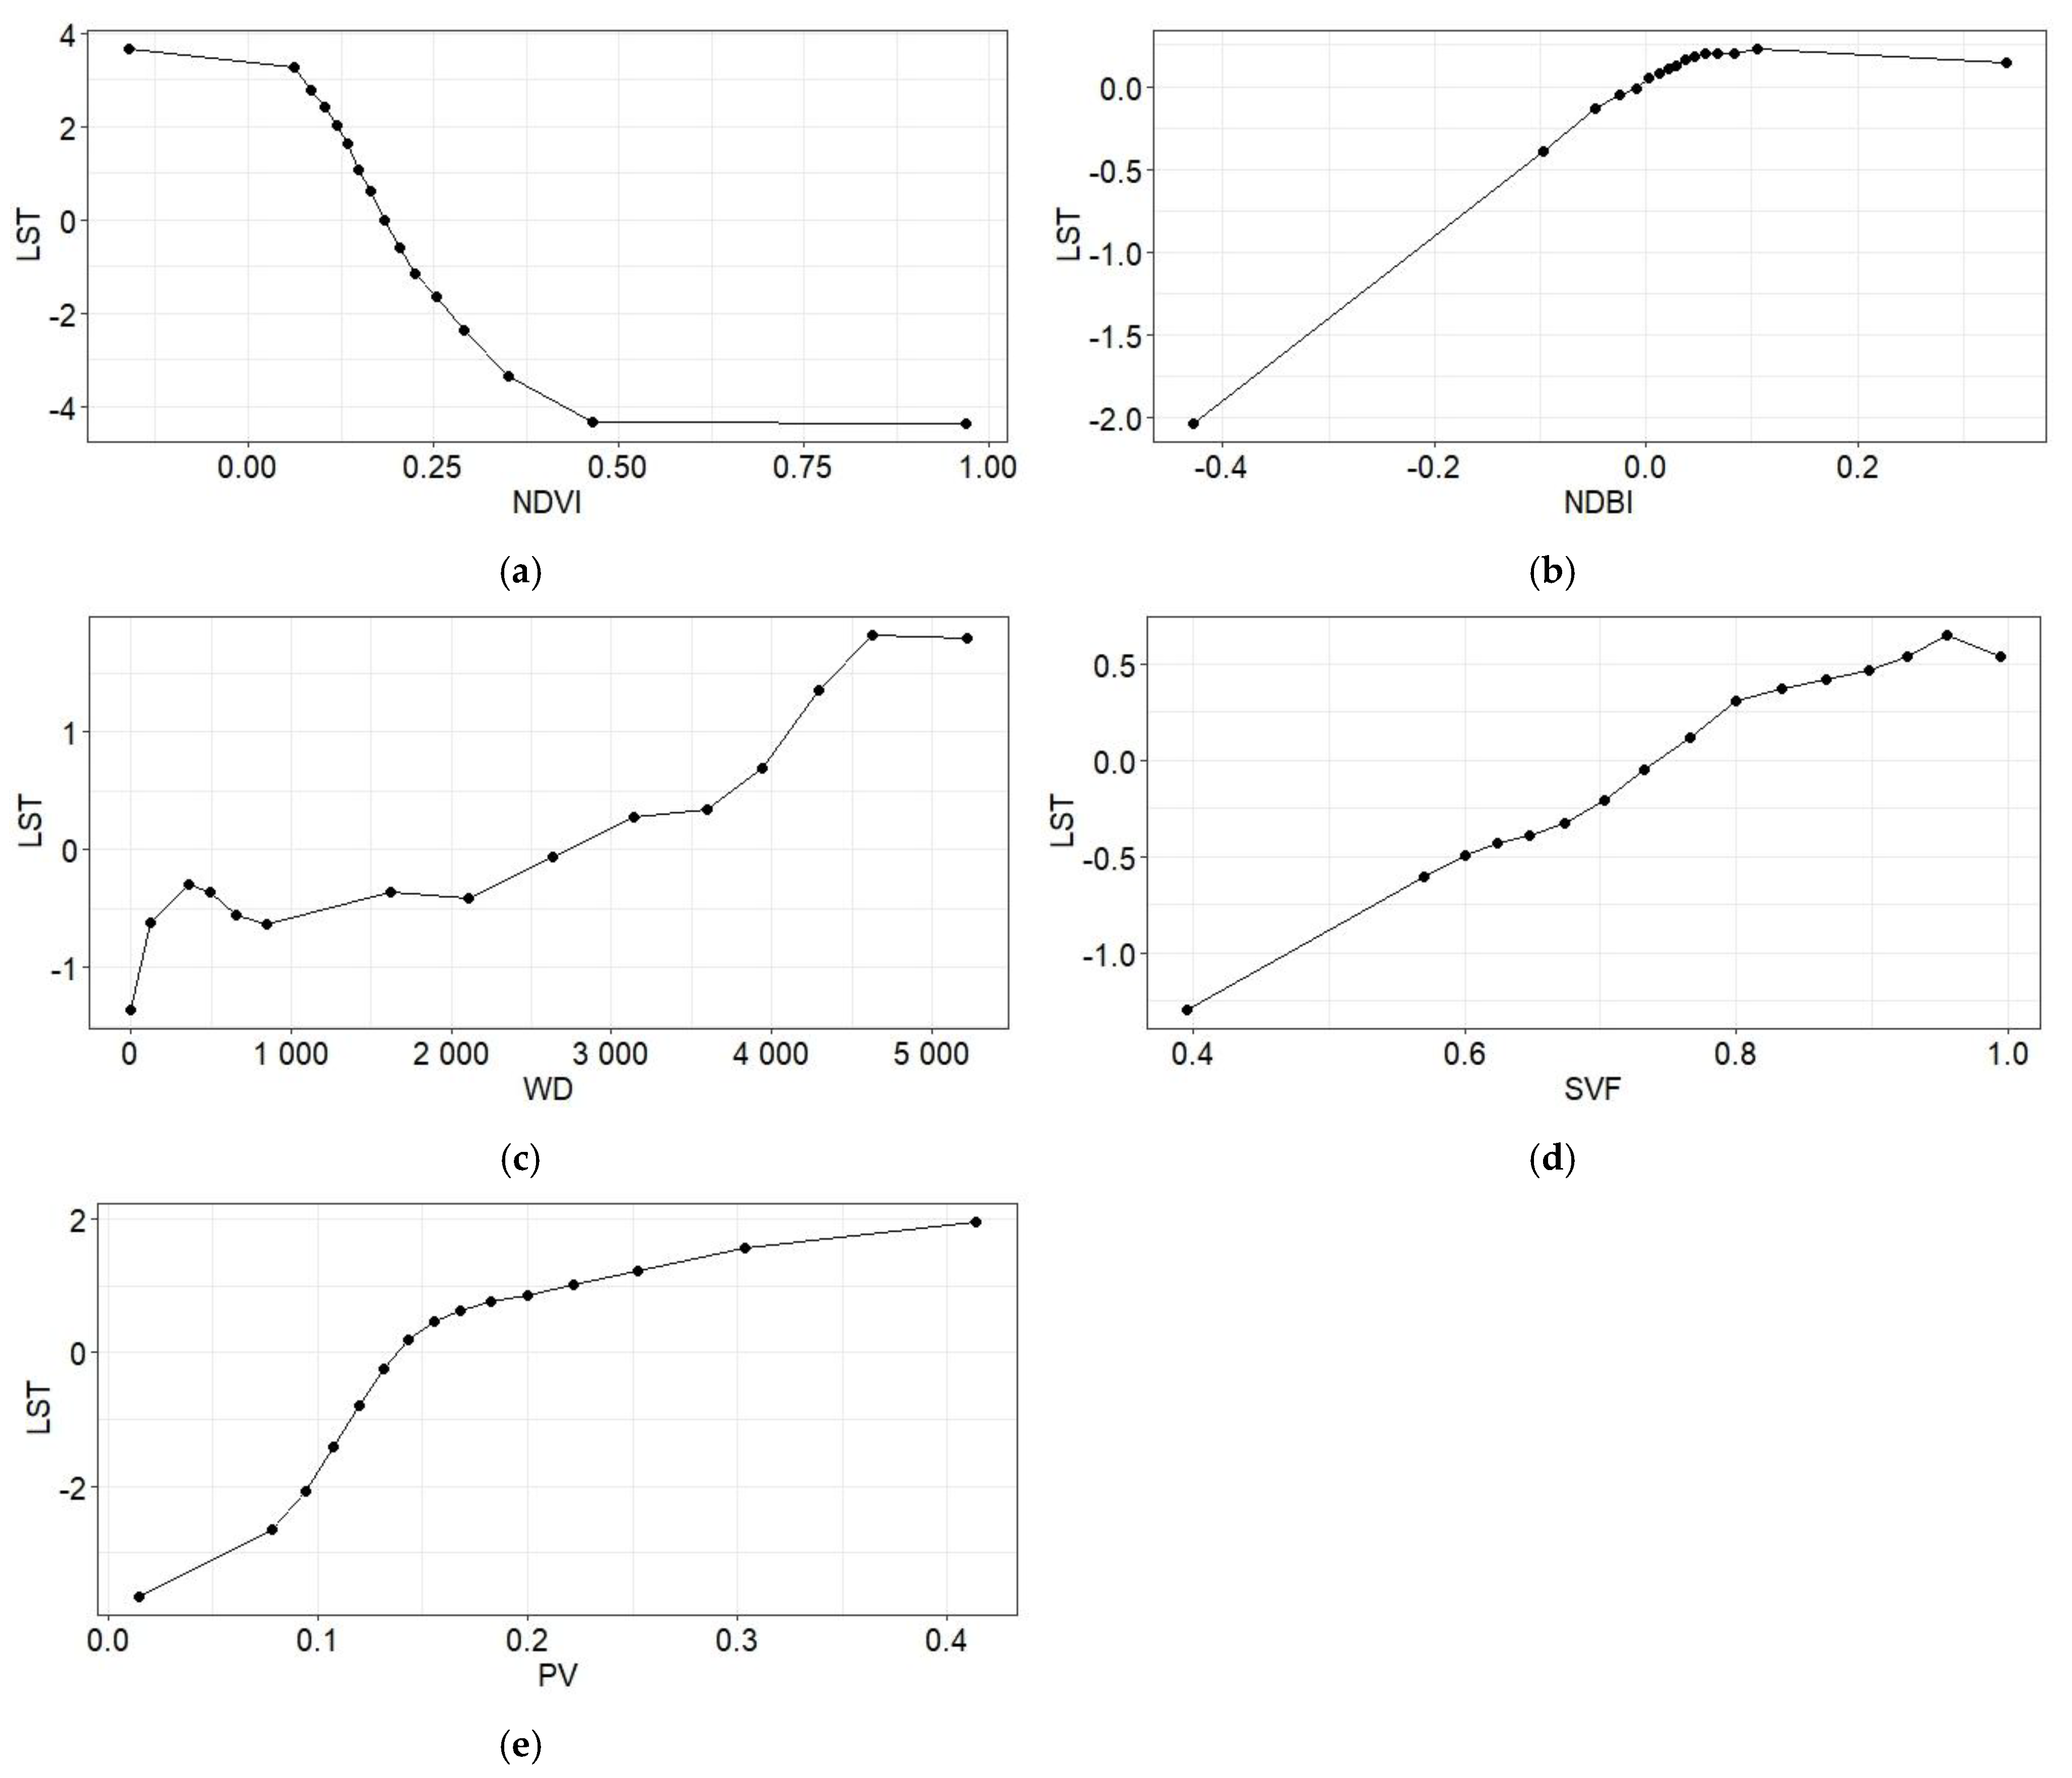
- Permutation feature importance highlights the crucial role of the NDVI in interacting with LST. And the ALE plot shows the marginal correlation of the NDVI and LST to be important.
- The model is able to predict not only extensive green roofs, but it could also be modified for using intensive green roofs, characterized by higher and denser vegetation and therefore higher NDVI values. Additionally, the model can simulate the placing of larger green spaces such as parks and predict LST reduction.
Author Contributions
Funding
Data Availability Statement
Conflicts of Interest
Appendix A


| mtry | ntree | RMSE |
|---|---|---|
| 3 | 400 | 1.841685 |
| 3 | 500 | 1.841322 |
| 3 | 400 | 1.841685 |
| 3 | 500 | 1.841322 |
| 3 | 600 | 1.841658 |
| 3 | 700 | 1.841122 |
| 3 | 800 | 1.840762 |
| 4 | 400 | 1.837626 |
| 4 | 500 | 1.837586 |
| 4 | 600 | 1.837157 |
| 4 | 700 | 1.837165 |
| 4 | 800 | 1.836764 |
| 5 | 400 | 1.841444 |
| 5 | 500 | 1.840638 |
| 5 | 600 | 1.840351 |
| 5 | 700 | 1.839835 |
| 5 | 800 | 1.839432 |
| 6 | 400 | 1.847772 |
| 6 | 500 | 1.846869 |
| 6 | 600 | 1.846509 |
| 6 | 700 | 1.845937 |
| 6 | 800 | 1.846129 |
| 7 | 400 | 1.856779 |
| 7 | 500 | 1.857391 |
| 7 | 600 | 1.857304 |
| 7 | 700 | 1.856979 |
| 7 | 800 | 1.856862 |
References
- Rama, H.O.; Roberts, D.; Tignor, M.; Poloczanska, E.S.; Mintenbeck, K.; Alegría, A.; Craig, M.; Langsdorf, S.; Löschke, S.; Möller, V.; et al. Climate Change 2022: Impacts, Adaptation and Vulnerability Working Group II Contribution to the Sixth Assessment Report of the Intergovernmental Panel on Climate Change; IPCC: Geneva, Switzerland, 2022. [Google Scholar]
- Tuel, A.; Eltahir, E.A.B. Why Is the Mediterranean a Climate Change Hot Spot? J. Clim. 2020, 33, 5829–5843. [Google Scholar] [CrossRef]
- Ribas, A.; Olcina, J.; Sauri, D. More exposed but also more vulnerable? Climate change, high intensity precipitation events and flooding in Mediterranean Spain. Disaster Prev. Manag. Int. J. 2020, 29, 229–248. [Google Scholar] [CrossRef]
- Mora, C.; Dousset, B.; Caldwell, I.R.; Powell, F.E.; Geronimo, R.C.; Bielecki, C.R.; Counsell, C.W.W.; Dietrich, B.S.; Johnston, E.T.; Louis, L.V.; et al. Global risk of deadly heat. Nat. Clim. Change 2017, 7, 501–506. [Google Scholar] [CrossRef]
- Aflaki, A.; Mirnezhad, M.; Ghaffarianhoseini, A.; Ghaffarianhoseini, A.; Omrany, H.; Wang, Z.-H.; Akbari, H. Urban heat island mitigation strategies: A state-of-the-art review on Kuala Lumpur, Singapore and Hong Kong. Cities 2017, 62, 131–145. [Google Scholar] [CrossRef]
- Zhao, Y.; Sen, S.; Susca, T.; Iaria, J.; Kubilay, A.; Gunawardena, K.; Zhou, X.; Takane, Y.; Park, Y.; Wang, X.; et al. Beating urban heat: Multimeasure-centric solution sets and a complementary framework for decision-making. Renew. Sustain. Energy Rev. 2023, 186, 113668. [Google Scholar] [CrossRef]
- Hidalgo García, D.; Arco Díaz, J.; Martín Martín, A.; Gómez Cobos, E. Spatiotemporal Analysis of Urban Thermal Effects Caused by Heat Waves through Remote Sensing. Sustainability 2022, 14, 12262. [Google Scholar] [CrossRef]
- Degirmenci, K.; Desouza, K.C.; Fieuw, W.; Watson, R.T.; Yigitcanlar, T. Understanding policy and technology responses in mitigating urban heat islands: A literature review and directions for future research. Sustain. Cities Soc. 2021, 70, 102873. [Google Scholar] [CrossRef]
- Susca, T.; Pomponi, F. Heat island effects in urban life cycle assessment: Novel insights to include the effects of the urban heat island and UHI-mitigation measures in LCA for effective policy making. J. Ind. Ecol. 2020, 24, 410–423. [Google Scholar] [CrossRef]
- Yang, J.; Hu, L.; Wang, C. Population dynamics modify urban residents’ exposure to extreme temperatures across the United States. Sci. Adv. 2019, 5, eaay3452. [Google Scholar] [CrossRef]
- Pena Acosta, M.; Vahdatikhaki, F.; Santos, J.; Hammad, A.; Dorée, A.G. How to bring UHI to the urban planning table? A data-driven modeling approach. Sustain. Cities Soc. 2021, 71, 102948. [Google Scholar] [CrossRef]
- Fleck, R.; Gill, R.L.; Saadeh, S.; Pettit, T.; Wooster, E.; Torpy, F.; Irga, P. Urban green roofs to manage rooftop microclimates: A case study from Sydney, Australia. Build. Environ. 2022, 209, 108673. [Google Scholar] [CrossRef]
- Xiang, Y.; Yuan, C.; Cen, Q.; Huang, C.; Wu, C.; Teng, M.; Zhou, Z. Heat risk assessment and response to green infrastructure based on local climate zones. Build. Environ. 2024, 248, 111040. [Google Scholar] [CrossRef]
- Lemus-Canovas, M.; Martin-Vide, J.; Moreno-Garcia, M.C.; Lopez-Bustins, J.A. Estimating Barcelona’s metropolitan daytime hot and cold poles using Landsat-8 Land Surface Temperature. Sci. Total Environ. 2020, 699, 134307. [Google Scholar] [CrossRef] [PubMed]
- Ward, K.; Lauf, S.; Kleinschmit, B.; Endlicher, W. Heat waves and urban heat islands in Europe: A review of relevant drivers. Sci. Total Environ. 2016, 569–570, 527–539. [Google Scholar] [CrossRef]
- He, B.-J.; Wang, J.; Liu, H.; Ulpiani, G. Localized synergies between heat waves and urban heat islands: Implications on human thermal comfort and urban heat management. Environ. Res. 2021, 193, 110584. [Google Scholar] [CrossRef]
- Campbell, S.; Remenyi, T.A.; White, C.J.; Johnston, F.H. Heatwave and health impact research: A global review. Health Place 2018, 53, 210–218. [Google Scholar] [CrossRef] [PubMed]
- An, N.; Dou, J.; González-Cruz, J.E.; Bornstein, R.D.; Miao, S.; Li, L. An Observational Case Study of Synergies between an Intense Heat Wave and the Urban Heat Island in Beijing. J. Appl. Meteorol. Climatol. 2020, 59, 605–620. [Google Scholar] [CrossRef]
- Hidalgo-García, D.; Arco-Díaz, J. Modeling the Surface Urban Heat Island (SUHI) to study of its relationship with variations in the thermal field and with the indices of land use in the metropolitan area of Granada (Spain). Sustain. Cities Soc. 2022, 87, 104166. [Google Scholar] [CrossRef]
- Song, J.; Chen, W.; Zhang, J.; Huang, K.; Hou, B.; Prishchepov, A.V. Effects of building density on land surface temperature in China: Spatial patterns and determinants. Landsc. Urban Plan. 2020, 198, 103794. [Google Scholar] [CrossRef]
- Zhang, R.; Corte-Real, J.; Moreira, M.; Kilsby, C.; Burton, A.; Fowler, H.J.; Blenkinsop, S.; Birkinshaw, S.; Forsythe, N.; Nunes, J.P. Downscaling climate change of mean climatology and extremes of precipitation and temperature: Application to a Mediterranean climate basin. Int. J. Climatol. 2019, 39, 4985–5005. [Google Scholar] [CrossRef]
- Serrano-Notivoli, R.; Lemus-Canovas, M.; Barrao, S.; Sarricolea, P.; Meseguer-Ruiz, O.; Tejedor, E. Heat and cold waves in mainland Spain: Origins, characteristics, and trends. Weather Clim. Extrem. 2022, 37, 100471. [Google Scholar] [CrossRef]
- Santamouris, M. Recent progress on urban overheating and heat island research. Integrated assessment of the energy, environmental, vulnerability and health impact. Synergies with the global climate change. Energy Build. 2020, 207, 109482. [Google Scholar] [CrossRef]
- Amani-Beni, M.; Chen, Y.; Vasileva, M.; Zhang, B.; Xie, G.-D. Quantitative-spatial relationships between air and surface temperature, a proxy for microclimate studies in fine-scale intra-urban areas? Sustain. Cities Soc. 2022, 77, 103584. [Google Scholar] [CrossRef]
- Berardi, U.; Jandaghian, Z.; Graham, J. Effects of greenery enhancements for the resilience to heat waves: A comparison of analysis performed through mesoscale (WRF) and microscale (Envi-met) modeling. Sci. Total Environ. 2020, 747, 141300. [Google Scholar] [CrossRef]
- Kappou, S.; Souliotis, M.; Papaefthimiou, S.; Panaras, G.; Paravantis, J.A.; Michalena, E.; Hills, J.M.; Vouros, A.P.; Ntymenou, A.; Mihalakakou, G. Cool Pavements: State of the Art and New Technologies. Sustainability 2022, 14, 5159. [Google Scholar] [CrossRef]
- Mourou, C.; Zamorano, M.; Ruiz, D.P.; Martín-Morales, M. Cool Surface Strategies with an Emphasis on the Materials Dimension: A Review. Appl. Sci. 2022, 12, 1893. [Google Scholar] [CrossRef]
- He, Q.; Tapia, F.; Reith, A. Quantifying the influence of nature-based solutions on building cooling and heating energy demand: A climate specific review. Renew. Sustain. Energy Rev. 2023, 186, 113660. [Google Scholar] [CrossRef]
- Susca, T. Nature-based solutions applied to the built environment to alleviate climate change: Benefits, co-benefits, and trade-offs in a geographical multi-scale perspective. In Handbook of Climate Change Mitigation and Adaptation; Springer: Berlin/Heidelberg, Germany, 2022; pp. 2117–2167. [Google Scholar]
- Leite, F.R.; Antunes, M.L.P. Green roof recent designs to runoff control: A review of building materials and plant species used in studies. Ecol. Eng. 2023, 189, 106924. [Google Scholar] [CrossRef]
- Cascone, S. Green roof design: State of the art on technology and materials. Sustainability 2019, 11, 3020. [Google Scholar] [CrossRef]
- Susca, T.; Zanghirella, F.; Colasuonno, L.; Del Fatto, V. Effect of green wall installation on urban heat island and building energy use: A climate-informed systematic literature review. Renew. Sustain. Energy Rev. 2022, 159, 112100. [Google Scholar] [CrossRef]
- Bevilacqua, P. The effectiveness of green roofs in reducing building energy consumptions across different climates. A Summ. Lit. Results Renew. Sustain. Energy Rev. 2021, 151, 111523. [Google Scholar] [CrossRef]
- Solecki, W.D.; Rosenzweig, C.; Parshall, L.; Pope, G.; Clark, M.; Cox, J.; Wiencke, M. Mitigation of the heat island effect in urban New Jersey. Glob. Environ. Change Part B Environ. Hazards 2005, 6, 39–49. [Google Scholar] [CrossRef]
- Sharma, A.; Conry, P.; Fernando, H.; Hamlet, A.F.; Hellmann, J.; Chen, F. Green and cool roofs to mitigate urban heat island effects in the Chicago metropolitan area: Evaluation with a regional climate model. Environ. Res. Lett. 2016, 11, 064004. [Google Scholar] [CrossRef]
- Wong, N.H.; Tan, C.L.; Kolokotsa, D.D.; Takebayashi, H. Greenery as a mitigation and adaptation strategy to urban heat. Nat. Rev. Earth Environ. 2021, 2, 166–181. [Google Scholar] [CrossRef]
- Decina, S.M.; Templer, P.H.; Hutyra, L.R. Atmospheric inputs of nitrogen, carbon, and phosphorus across an urban area: Unaccounted fluxes and canopy influences. Earth’s Future 2018, 6, 134–148. [Google Scholar] [CrossRef]
- Kavehei, E.; Jenkins, G.A.; Adame, M.F.; Lemckert, C. Carbon sequestration potential for mitigating the carbon footprint of green stormwater infrastructure. Renew. Sustain. Energy Rev. 2018, 94, 1179–1191. [Google Scholar] [CrossRef]
- Ondoño, S.; Martínez-Sánchez, J.J.; Moreno, J.L. Chapter 7—Carbon and Nitrogen Sequestration Potential of Mediterranean Green Roofs Prototypes. In Soil Management and Climate Change; Muñoz, M.Á., Zornoza, R., Eds.; Academic Press: Cambridge, MA, USA, 2018; pp. 85–102. [Google Scholar]
- Prigioniero, A.; Zuzolo, D.; Niinemets, Ü.; Guarino, C. Nature-based solutions as tools for air phytoremediation: A review of the current knowledge and gaps. Environ. Pollut. 2021, 277, 116817. [Google Scholar] [CrossRef]
- Shafique, M.; Xue, X.; Luo, X. An overview of carbon sequestration of green roofs in urban areas. Urban For. Urban Green. 2020, 47, 126515. [Google Scholar] [CrossRef]
- Arbid, Y.; Richard, C.; Sleiman, M. Towards an experimental approach for measuring the removal of urban air pollutants by green roofs. Build. Environ. 2021, 205, 108286. [Google Scholar] [CrossRef]
- Hewitt, C.N.; Ashworth, K.; MacKenzie, A.R. Using green infrastructure to improve urban air quality (GI4AQ). Ambio 2020, 49, 62–73. [Google Scholar] [CrossRef]
- Di Sabatino, S.; Barbano, F.; Brattich, E.; Pulvirenti, B. The Multiple-Scale Nature of Urban Heat Island and Its Footprint on Air Quality in Real Urban Environment. Atmosphere 2020, 11, 1186. [Google Scholar] [CrossRef]
- Porcaro, M.; Ruiz de Adana, M.; Comino, F.; Peña, A.; Martín-Consuegra, E.; Vanwalleghem, T. Long term experimental analysis of thermal performance of extensive green roofs with different substrates in Mediterranean climate. Energy Build. 2019, 197, 18–33. [Google Scholar] [CrossRef]
- Vilar, M.L.; Tello, L.; Hidalgo, A.; Bedoya, C. An energy balance model of heterogeneous extensive green roofs. Energy Build. 2021, 250, 111265. [Google Scholar] [CrossRef]
- He, Y.; Yu, H.; Dong, N.; Ye, H. Thermal and energy performance assessment of extensive green roof in summer: A case study of a lightweight building in Shanghai. Energy Build. 2016, 127, 762–773. [Google Scholar] [CrossRef]
- Detommaso, M.; Costanzo, V.; Nocera, F.; Evola, G. Evaluation of the cooling potential of a vertical greenery system coupled to a building through an experimentally validated transient model. Build. Environ. 2023, 244, 110769. [Google Scholar] [CrossRef]
- Wooster, E.I.F.; Fleck, R.; Torpy, F.; Ramp, D.; Irga, P.J. Urban green roofs promote metropolitan biodiversity: A comparative case study. Build. Environ. 2022, 207, 108458. [Google Scholar] [CrossRef]
- Li, M.; Remme, R.P.; van Bodegom, P.M.; van Oudenhoven, A.P.E. Solution to what? Global assessment of nature-based solutions, urban challenges, and outcomes. Landsc. Urban Plan. 2025, 256, 105294. [Google Scholar] [CrossRef]
- Jato-Espino, D.; Manchado, C.; Roldán-Valcarce, A.; Moscardó, V. ArcUHI: A GIS add-in for automated modelling of the Urban Heat Island effect through machine learning. Urban Clim. 2022, 44, 101203. [Google Scholar] [CrossRef]
- Balany, F.; Ng, A.W.; Muttil, N.; Muthukumaran, S.; Wong, M.S. Green Infrastructure as an Urban Heat Island Mitigation Strategy—A Review. Water 2020, 12, 3577. [Google Scholar] [CrossRef]
- Nastran, M.; Kobal, M.; Eler, K. Urban heat islands in relation to green land use in European cities. Urban For. Urban Green. 2019, 37, 33–41. [Google Scholar] [CrossRef]
- Marando, F.; Heris, M.P.; Zulian, G.; Udías, A.; Mentaschi, L.; Chrysoulakis, N.; Parastatidis, D.; Maes, J. Urban heat island mitigation by green infrastructure in European Functional Urban Areas. Sustain. Cities Soc. 2022, 77, 103564. [Google Scholar] [CrossRef]
- Chen, D.; Zhang, F.; Zhang, M.; Meng, Q.; Jim, C.Y.; Shi, J.; Tan, M.L.; Ma, X. Landscape and vegetation traits of urban green space can predict local surface temperature. Sci. Total Environ. 2022, 825, 154006. [Google Scholar] [CrossRef] [PubMed]
- Gao, Y.; Zhao, J.; Han, L. Quantifying the nonlinear relationship between block morphology and the surrounding thermal environment using random forest method. Sustain. Cities Soc. 2023, 91, 104443. [Google Scholar] [CrossRef]
- Wang, Q.; Wang, X.; Meng, Y.; Zhou, Y.; Wang, H. Exploring the impact of urban features on the spatial variation of land surface temperature within the diurnal cycle. Sustain. Cities Soc. 2023, 91, 104432. [Google Scholar] [CrossRef]
- Li, J. Evaluating the Correlation Between Impacting Factors and Land Surface Temperature via Spatial Regression Model and Random Forest. Prof. Geogr. 2024, 76, 740–755. [Google Scholar] [CrossRef]
- Kottek, M.; Grieser, J.; Beck, C.; Rudolf, B.; Rubel, F. World map of the Köppen-Geiger climate classification updated. Meteorol. Z. 2006, 15, 259–263. [Google Scholar] [CrossRef]
- Huang, F.; Jiang, S.; Zhan, W.; Bechtel, B.; Liu, Z.; Demuzere, M.; Huang, Y.; Xu, Y.; Ma, L.; Xia, W.; et al. Mapping local climate zones for cities: A large review. Remote Sens. Environ. 2023, 292, 113573. [Google Scholar] [CrossRef]
- Stewart, I.D.; Oke, T.R. Local climate zones for urban temperature studies. Bull. Am. Meteorol. Soc. 2012, 93, 1879–1900. [Google Scholar] [CrossRef]
- Zhou, L.; Yuan, B.; Hu, F.; Wei, C.; Dang, X.; Sun, D. Understanding the effects of 2D/3D urban morphology on land surface temperature based on local climate zones. Build. Environ. 2022, 208, 108578. [Google Scholar] [CrossRef]
- Anjos, M.; Targino, A.C.; Krecl, P.; Oukawa, G.Y.; Braga, R.F. Analysis of the urban heat island under different synoptic patterns using local climate zones. Build. Environ. 2020, 185, 107268. [Google Scholar] [CrossRef]
- Demuzere, M.; Kittner, J.; Bechtel, B. LCZ Generator: A web application to create Local Climate Zone maps. Front. Environ. Sci. 2021, 9, 637455. [Google Scholar] [CrossRef]
- Landsat Mission Management Officer. Landsat 8-9 Operational Land Imager (OLI)-Thermal Infrared Sensor (TIRS) Collection 2 Level 2 (L2) Data Format Control Book (DFCB); United States Geological Survey: Reston, VA, USA, 2020; 78p.
- Yu, X.; Guo, X.; Wu, Z. Land Surface Temperature Retrieval from Landsat 8 TIRS—Comparison between Radiative Transfer Equation-Based Method, Split Window Algorithm and Single Channel Method. Remote Sens. 2014, 6, 9829–9852. [Google Scholar] [CrossRef]
- Zha, Y.; Gao, J.; Ni, S. Use of normalized difference built-up index in automatically mapping urban areas from TM imagery. Int. J. Remote Sens. 2003, 24, 583–594. [Google Scholar] [CrossRef]
- McFeeters, S.K. The use of the Normalized Difference Water Index (NDWI) in the delineation of open water features. Int. J. Remote Sens. 1996, 17, 1425–1432. [Google Scholar] [CrossRef]
- Lindberg, F.; Grimmond, C.S.B.; Gabey, A.; Huang, B.; Kent, C.W.; Sun, T.; Theeuwes, N.E.; Järvi, L.; Ward, H.C.; Capel-Timms, I. Urban Multi-scale Environmental Predictor (UMEP): An integrated tool for city-based climate services. Environ. Model. Softw. 2018, 99, 70–87. [Google Scholar] [CrossRef]
- Tabares-Velasco, P.C.; Srebric, J. A heat transfer model for assessment of plant based roofing systems in summer conditions. Build. Environ. 2012, 49, 310–323. [Google Scholar] [CrossRef]
- Zhao, M.; Tabares-Velasco, P.C.; Srebric, J.; Komarneni, S.; Berghage, R. Effects of plant and substrate selection on thermal performance of green roofs during the summer. Build. Environ. 2014, 78, 199–211. [Google Scholar] [CrossRef]
- Braun, A.; Warth, G.; Bachofer, F.; Schultz, M.; Hochschild, V. Mapping Urban Structure Types Based on Remote Sensing Data—A Universal and Adaptable Framework for Spatial Analyses of Cities. Land 2023, 12, 1885. [Google Scholar] [CrossRef]
- Roussel, J.-R.; Auty, D.; Coops, N.C.; Tompalski, P.; Goodbody, T.R.; Meador, A.S.; Bourdon, J.-F.; De Boissieu, F.; Achim, A. lidR: An R package for analysis of Airborne Laser Scanning (ALS) data. Remote Sens. Environ. 2020, 251, 112061. [Google Scholar] [CrossRef]
- Asadi, A.; Arefi, H.; Fathipoor, H. Simulation of green roofs and their potential mitigating effects on the urban heat island using an artificial neural network: A case study in Austin, Texas. Adv. Space Res. 2020, 66, 1846–1862. [Google Scholar] [CrossRef]
- Abdalla, E.M.H.; Alfredsen, K.; Muthanna, T.M. Impacts of slope and length on the hydrological performance of green roof drainage mats. J. Hydrol. 2024, 632, 130974. [Google Scholar] [CrossRef]
- Getter, K.L.; Rowe, D.B.; Andresen, J.A. Quantifying the effect of slope on extensive green roof stormwater retention. Ecol. Eng. 2007, 31, 225–231. [Google Scholar] [CrossRef]
- Slootweg, M.; Hu, M.; Vega, S.H.; ‘t Zelfde, M.v.; Leeuwen, E.v.; Tukker, A. Identifying the geographical potential of rooftop systems: Space competition and synergy. Urban For. Urban Green. 2023, 79, 127816. [Google Scholar] [CrossRef]
- Breiman, L. Random Forests. Mach. Learn. 2001, 45, 5–32. [Google Scholar] [CrossRef]
- López-Chacón, S.R.; Salazar, F.; Bladé, E. Hybrid physically based and machine learning model to enhance high streamflow prediction. Hydrol. Sci. J. 2025, 70, 311–333. [Google Scholar] [CrossRef]
- Wright, M.N.; Ziegler, A. ranger: A Fast Implementation of Random Forests for High Dimensional Data in C++ and R. J. Stat. Softw. 2017, 77, 1–17. [Google Scholar] [CrossRef]
- Altmann, A.; Toloşi, L.; Sander, O.; Lengauer, T. Permutation importance: A corrected feature importance measure. Bioinformatics 2010, 26, 1340–1347. [Google Scholar] [CrossRef]
- Molnar, C. Interpretable Machine Learning; Lulu.com. 2020. Available online: https://christophm.github.io/interpretable-ml-book/ (accessed on 31 March 2025).
- Apley, D.W.; Zhu, J. Visualizing the Effects of Predictor Variables in Black Box Supervised Learning Models. J. R. Stat. Soc. Ser. B Stat. Methodol. 2020, 82, 1059–1086. [Google Scholar] [CrossRef]
- Chicco, D.; Warrens, M.J.; Jurman, G. The coefficient of determination R-squared is more informative than SMAPE, MAE, MAPE, MSE and RMSE in regression analysis evaluation. PeerJ Comput. Sci. 2021, 7, e623. [Google Scholar] [CrossRef]
- Kafy, A.A.; Crews, K.A.; Thompson, A.E. Exploring the cooling potential of green roofs for mitigating diurnal heat island intensity by utilizing Lidar and Artificial Neural Network. Sustain. Cities Soc. 2024, 116, 105893. [Google Scholar] [CrossRef]
- Joshi, M.Y.; Aliaga, D.G.; Teller, J.; Goodspeed, R. Predicting Urban Heat Island Mitigation with Random Forest Regression in Belgian Cities; Goodspeed, R., Sengupta, R., Kyttä, M., Pettit, C., Eds.; The Urban Book Series; Springer: Cham, Switzerland, 2023; pp. 305–323. [Google Scholar]
- Bechtel, B.; Demuzere, M.; Mills, G.; Zhan, W.; Sismanidis, P.; Small, C.; Voogt, J. SUHI analysis using Local Climate Zones—A comparison of 50 cities. Urban Clim. 2019, 28, 100451. [Google Scholar] [CrossRef]
- Ritter, A.; Muñoz-Carpena, R. Performance evaluation of hydrological models: Statistical significance for reducing subjectivity in goodness-of-fit assessments. J. Hydrol. 2013, 480, 33–45. [Google Scholar] [CrossRef]
- Kikon, N.; Kumar, D.; Ahmed, S.A. Quantitative assessment of land surface temperature and vegetation indices on a kilometer grid scale. Environ. Sci. Pollut. Res. 2023, 30, 107236–107258. [Google Scholar] [CrossRef]
- He, J.; Shi, Y.; Xu, L.; Lu, Z.; Feng, M.; Tang, J.; Guo, X. Exploring the scale effect of urban thermal environment through XGBoost model. Sustain. Cities Soc. 2024, 114, 105763. [Google Scholar] [CrossRef]
- Cai, Z.; Han, G.; Chen, M. Do water bodies play an important role in the relationship between urban form and land surface temperature? Sustain. Cities Soc. 2018, 39, 487–498. [Google Scholar] [CrossRef]
- Marzban, F.; Sodoudi, S.; Preusker, R. The influence of land-cover type on the relationship between NDVI–LST and LST-Tair. Int. J. Remote Sens. 2018, 39, 1377–1398. [Google Scholar] [CrossRef]
- Zhang, H.; Kang, M.-Y.; Guan, Z.-R.; Zhou, R.; Zhao, A.-L.; Wu, W.-J.; Yang, H.-R. Assessing the role of urban green infrastructure in mitigating summertime Urban Heat Island (UHI) effect in metropolitan Shanghai, China. Sustain. Cities Soc. 2024, 112, 105605. [Google Scholar] [CrossRef]
- Hidalgo García, D. Spatio-temporal analysis of the urban green infrastructure of the city of Granada (Spain) as a heat mitigation measure using high-resolution images Sentinel 3. Urban For. Urban Green. 2023, 87, 128061. [Google Scholar] [CrossRef]
- Han, D.; An, H.; Cai, H.; Wang, F.; Xu, X.; Qiao, Z.; Jia, K.; Sun, Z.; An, Y. How do 2D/3D urban landscapes impact diurnal land surface temperature: Insights from block scale and machine learning algorithms. Sustain. Cities Soc. 2023, 99, 104933. [Google Scholar] [CrossRef]
- Luo, P.; Yu, B.; Li, P.; Liang, P.; Zhang, Q.; Yang, L. Understanding the relationship between 2D/3D variables and land surface temperature in plain and mountainous cities: Relative importance and interaction effects. Build. Environ. 2023, 245, 110959. [Google Scholar] [CrossRef]
- Sezer, N.; Yoonus, H.; Zhan, D.; Wang, L.; Hassan, I.G.; Rahman, M.A. Urban microclimate and building energy models: A review of the latest progress in coupling strategies. Renew. Sustain. Energy Rev. 2023, 184, 113577. [Google Scholar] [CrossRef]
- Tsoka, S.; Tsikaloudaki, A.; Theodosiou, T. Analyzing the ENVI-met microclimate model’s performance and assessing cool materials and urban vegetation applications–A review. Sustain. Cities Soc. 2018, 43, 55–76. [Google Scholar] [CrossRef]
- Susca, T.; Zanghirella, F.; Del Fatto, V. Building integrated vegetation effect on micro-climate conditions for urban heat island adaptation. Lesson learned from Turin and Rome case studies. Energy Build. 2023, 295, 113233. [Google Scholar] [CrossRef]
- Cristiano, E.; Deidda, R.; Viola, F. Awareness and willingness to pay for green roofs in Mediterranean areas. J. Environ. Manag. 2023, 344, 118419. [Google Scholar] [CrossRef]
- De Oliveira Santos, T.D.; Pacheco, F.A.L.; Fernandes, L.F.S. A systematic analysis on the efficiency and sustainability of green facades and roofs. Sci. Total Environ. 2024, 932, 173107. [Google Scholar] [CrossRef] [PubMed]
- Senent-Aparicio, J.; López-Ballesteros, A.; Jimeno-Sáez, P.; Pérez-Sánchez, J. Recent precipitation trends in Peninsular Spain and implications for water infrastructure design. J. Hydrol. Reg. Stud. 2023, 45, 101308. [Google Scholar] [CrossRef]
- Jia, S.; Weng, Q.; Yoo, C.; Xiao, H.; Zhong, Q. Building energy savings by green roofs and cool roofs in current and future climates. npj Urban Sustain. 2024, 4, 23. [Google Scholar] [CrossRef]
- Rahman, M.A.; Arndt, S.; Bravo, F.; Cheung, P.K.; van Doorn, N.; Franceschi, E.; del Río, M.; Livesley, S.J.; Moser-Reischl, A.; Pattnaik, N.; et al. More than a canopy cover metric: Influence of canopy quality, water-use strategies and site climate on urban forest cooling potential. Landsc. Urban Plan. 2024, 248, 105089. [Google Scholar] [CrossRef]
- Ibsen, P.C.; Crawford, B.R.; Corro, L.M.; Bagstad, K.J.; McNellis, B.E.; Jenerette, G.D.; Diffendorfer, J.E. Urban tree cover provides consistent mitigation of extreme heat in arid but not humid cities. Sustain. Cities Soc. 2024, 113, 105677. [Google Scholar] [CrossRef]
- Sen, S.; Khazanovich, L. Limited application of reflective surfaces can mitigate urban heat pollution. Nat. Commun. 2021, 12, 3491. [Google Scholar] [CrossRef]


| Index | Equation | Number | Reference |
|---|---|---|---|
| NDVI | (1) | [19] | |
| PV | (2) | [66] | |
| NDBI | (3) | [67] | |
| NDWI | (4) | [68] |
| LST | Landsat ID | LST Date | Sentinel ID | Sentinel Date |
|---|---|---|---|---|
| 1 | LC09 | 11 July 2022 | S2A | 12 July 2022 |
| 2 | LC08 | 19 July 2022 | S2A | 22 July 2022 |
| 3 | LC09 | 27 July 2022 | S2B | 27 July 2022 |
| 4 | LC08 | 4 August 2022 | S2B | 6 August 2022 |
| 5 | LC09 | 28 August 2022 | S2B | 26 August 2022 |
| 6 | LC09 | 30 July 2023 | S2A | 27 July 2023 |
| 7 | LC08 | 7 August 2023 | S2A | 6 August 2023 |
| 8 | LC08 | 23 August 2023 | S2B | 21 August 2023 |
| 9 | LC08 | 8 July 2024 | S2A | 11 July 2024 |
| 10 | LC09 | 16 July 2024 | S2B | 16 July 2024 |
| 11 | LC09 | 1 August 2024 | S2A | 5 August 2024 |
| 12 | LC08 | 9 August 2024 | S2A | 10 August 2024 |
| 13 | LC09 | 17 August 2024 | S2A | 20 August 2024 |
| 14 | LC08 | 25 August 2024 | S2B | 25 August 2024 |
| LCZ2 | LCZ3 | LCZ4 | LCZ5 | LCZ6 | LCZ8 | LCZ9 | LCZA | LCZB | LCZC | LCZD | LCZE | LCZF |
|---|---|---|---|---|---|---|---|---|---|---|---|---|
| 45.9 | 47.1 | 45.8 | 46.1 | 44.9 | 49.8 | 43.4 | 41.5 | 42.8 | 46.3 | 45.7 | 48.7 | 49.4 |
| RMSE (°C) | MAPE (%) | R2 | |
|---|---|---|---|
| Training | 0.791 | 1.371 | 0.95 |
| Validation | 1.836 | 3.319 | 0.69 |
| Testing | 1.599 | 2.639 | 0.68 |
Disclaimer/Publisher’s Note: The statements, opinions and data contained in all publications are solely those of the individual author(s) and contributor(s) and not of MDPI and/or the editor(s). MDPI and/or the editor(s) disclaim responsibility for any injury to people or property resulting from any ideas, methods, instructions or products referred to in the content. |
© 2025 by the authors. Licensee MDPI, Basel, Switzerland. This article is an open access article distributed under the terms and conditions of the Creative Commons Attribution (CC BY) license (https://creativecommons.org/licenses/by/4.0/).
Share and Cite
Sánchez-Cordero, F.; Nanía, L.; Hidalgo-García, D.; López-Chacón, S.R. Assessing the Spatial Benefits of Green Roofs to Mitigate Urban Heat Island Effects in a Semi-Arid City: A Case Study in Granada, Spain. Remote Sens. 2025, 17, 2073. https://doi.org/10.3390/rs17122073
Sánchez-Cordero F, Nanía L, Hidalgo-García D, López-Chacón SR. Assessing the Spatial Benefits of Green Roofs to Mitigate Urban Heat Island Effects in a Semi-Arid City: A Case Study in Granada, Spain. Remote Sensing. 2025; 17(12):2073. https://doi.org/10.3390/rs17122073
Chicago/Turabian StyleSánchez-Cordero, Francisco, Leonardo Nanía, David Hidalgo-García, and Sergio Ricardo López-Chacón. 2025. "Assessing the Spatial Benefits of Green Roofs to Mitigate Urban Heat Island Effects in a Semi-Arid City: A Case Study in Granada, Spain" Remote Sensing 17, no. 12: 2073. https://doi.org/10.3390/rs17122073
APA StyleSánchez-Cordero, F., Nanía, L., Hidalgo-García, D., & López-Chacón, S. R. (2025). Assessing the Spatial Benefits of Green Roofs to Mitigate Urban Heat Island Effects in a Semi-Arid City: A Case Study in Granada, Spain. Remote Sensing, 17(12), 2073. https://doi.org/10.3390/rs17122073