Article

Impact of All-Sky Assimilation of Multichannel Observations from Fengyun-3F MWHS-II on Typhoon Forecasting

1
School of Remote Sensing and Geomatics Engineering, Nanjing University of Information Science and Technology, Nanjing 210044, China
2
State Key Laboratory of Severe Weather Meteorological Science and Technology, Chinese Academy of Meteorological Sciences (CAMS), Beijing 100081, China
3
Key Laboratory of Cloud-Precipitation Physics and Severe Storms (LACS), Institute of Atmospheric Physics, Chinese Academy of Sciences, Beijing 100029, China
4
Institute of Water Sciences, Zhejiang University of Water Resources and Electric Power, Hangzhou 310018, China
*
Author to whom correspondence should be addressed.
Remote Sens. 2025, 17(12), 2056; https://doi.org/10.3390/rs17122056
Submission received: 8 May 2025 / Revised: 10 June 2025 / Accepted: 12 June 2025 / Published: 14 June 2025

Abstract

:
All-sky radiance assimilation can increase the utilization of satellite observations in cloudy regions and improve typhoon forecasts. This study focuses on the newly launched FengYun-3F satellite equipped with the Microwave Humidity Sounder II (MWHS-II) and develops an all-sky assimilation capability for its radiance data. A series of assimilation experiments were conducted to evaluate their impacts on the forecast of Typhoon Yagi (2024), demonstrating that all-sky assimilation leads to reductions in track error (23.14%) and improvements in precipitation forecasts (Equitable Threat Score increase of 16.92%) compared to clear-sky assimilation. Furthermore, a detailed comparison of assimilation experiments shows that using only the 183 GHz humidity channels yields limited improvement in tropospheric humidity, whereas assimilating the 118 GHz temperature channels significantly enhances temperature and wind forecasts. Combined assimilation of both frequency bands synergistically maintains accurate track and intensity predictions while further improving precipitation prediction. These findings demonstrate the value of multichannel all-sky assimilation and inform future satellite data assimilation strategies.

1. Introduction

The Microwave Humidity Sounder is highly sensitive to cloud ice and water vapor and plays a vital role in acquiring information on hydrometeors, precipitation, and wind [1]. Meteorological satellites equipped with microwave instruments provide effective observational supplements over oceanic regions where conventional observations are sparse. However, fewer than 30% of the available satellite observations are effectively assimilated into numerical weather prediction systems [2]. These discarded observations are typically contaminated by cloud and precipitation signals. Clouds and precipitation are discontinuous in time and space and are formed by complex, nonlinear physical processes [3]. As a result, many studies adopt clear-sky assimilation strategies, which discard observations affected by clouds and assimilate only those from cloud-free regions to maintain the reliability of the analysis [4,5,6,7,8]. Although this approach has demonstrated notable improvements in numerical weather prediction accuracy, it inevitably results in the exclusion of substantial cloud-related observational information. To retain these observations that are closely related to weather structures such as typhoons and heavy rainfall, all-sky assimilation has been progressively developed [8,9], which incorporates satellite observations under all sky conditions (including those affected by clouds and precipitation) into the numerical weather prediction system. Compared to clear-sky assimilation, the all-sky assimilation simulates a more complete radiative transfer process and retains more cloud-related information. This advantage enables the model to better simulate the formation of clouds and precipitation. Consequently, all-sky assimilation improves the analysis of temperature, humidity, and cloud distributions, thereby enhancing the forecasts of typhoon intensity and precipitation [10,11,12,13,14].
A primary challenge in conducting all-sky assimilation is reducing the impact of various error sources on the assimilation process. Due to the limited accuracy of the numerical model and radiative transfer calculations in cloud-covered areas [15], there is often a low consistency between the background fields and satellite observations in identifying cloudy regions. These representativeness errors are treated as part of the observation error, which affects the Gaussianity of the observation error distribution [16]. If the observation errors are not properly specified, the quality of the analysis fields can be degraded. To address this, Geer and Bauer [10] proposed a symmetric observation error model that dynamically allocates observation errors based on cloud amount. This model offers a robust threshold for quality control and enables the estimation of observation error magnitudes in all-sky assimilation, thereby reducing the non-Gaussian characteristics of observation-minus-background (O−B) departures. Its performance can be further enhanced by refining cloud indicators and adjusting the size of the statistical sample [17,18].
Another critical issue in all-sky assimilation is the construction of the observation operator. The radiative transfer models are typically employed as part of the observation operator to provide the required forward, tangent-linear, and adjoint models [19]. Initially, some radiative transfer models were limited to clear-sky, non-scattering conditions. However, as assimilation techniques have evolved towards all-sky conditions, these models have gradually been extended to incorporate fast scattering solvers [20,21]. At present, the most widely adopted radiative transfer models include RTTOV (Radiative Transfer for TIROS Operational Vertical Sounder), developed by EUMETSAT, and CRTM (Community Radiative Transfer Model), developed by the Joint Center for Satellite Data Assimilation in the United States. RTTOV has been progressively enhanced to support microwave radiance simulations under cloudy and rainy conditions through the RTTOV-SCATT module. This module employs the delta-Eddington approximation to account for the scattering effects of hydrometeors on microwave radiation and has proven to be an effective tool for simulating brightness temperatures to reveal typhoon structures [22]. With the aid of the advanced radiative transfer model, the European Centre for Medium-Range Weather Forecasts (ECMWF) has begun to incorporate radiance observations from multiple satellites over cloudy regions into its assimilation system. Correspondingly, the number of satellites included in operational all-sky data assimilation has increased more than threefold from 2007 to 2020 [23].
In addition, the channel sensitivity of microwave instruments is another key factor influencing the performance of the data assimilation. Some channels display strong sensitivity to lower tropospheric humidity and are, therefore, designed to detect information on tropospheric water vapor. However, this sensitivity also makes them vulnerable to surface emissivity interference. As a result, some operational centers have to discard land-based observations or improve surface emissivity models in order to reduce contamination from surface radiation [24]. Recognizing the limitations of conventional humidity-sensitive channels, satellite microwave instruments have been equipped with more diverse channels to compensate for these deficiencies and to enhance both the coverage and the diversity of atmospheric information acquired. The Microwave Humidity Sounder (MWHS) onboard the FengYun (FY) satellites, for instance, innovatively includes 118 GHz oxygen absorption channels. Assimilating the observations at this frequency has been shown to improve numerical weather prediction and to serve as a complement to traditional humidity channels [25,26,27,28]. However, the sensitivity characteristics of these channels during assimilation and their performance in simulating large-scale weather structures under all-sky conditions remain unclear.
This study focuses on the channel sensitivity in all-sky microwave assimilation and aims to better understand how the sensitivity influences numerical forecasts, particularly for typhoons. The findings are expected to provide helpful information for optimizing multichannel joint assimilation strategies in typhoon forecasting and to enhance the utilization of satellite observations under cloudy conditions for tropical cyclone warnings.
The structure of this paper is as follows. Section 2 introduces the observational data and assimilation methods used in the study. Section 3 provides an overview of Typhoon Yagi (2024) and describes the experimental design for data assimilation and numerical forecasting. Section 4 analyzes the impact of all-sky assimilation of FY-3F MWHS-II radiance data on typhoon forecasting and discusses the differences caused by various channel selection strategies. Finally, Section 5 and Section 6 present the overall discussion and conclusions of the study.

2. Materials and Methods

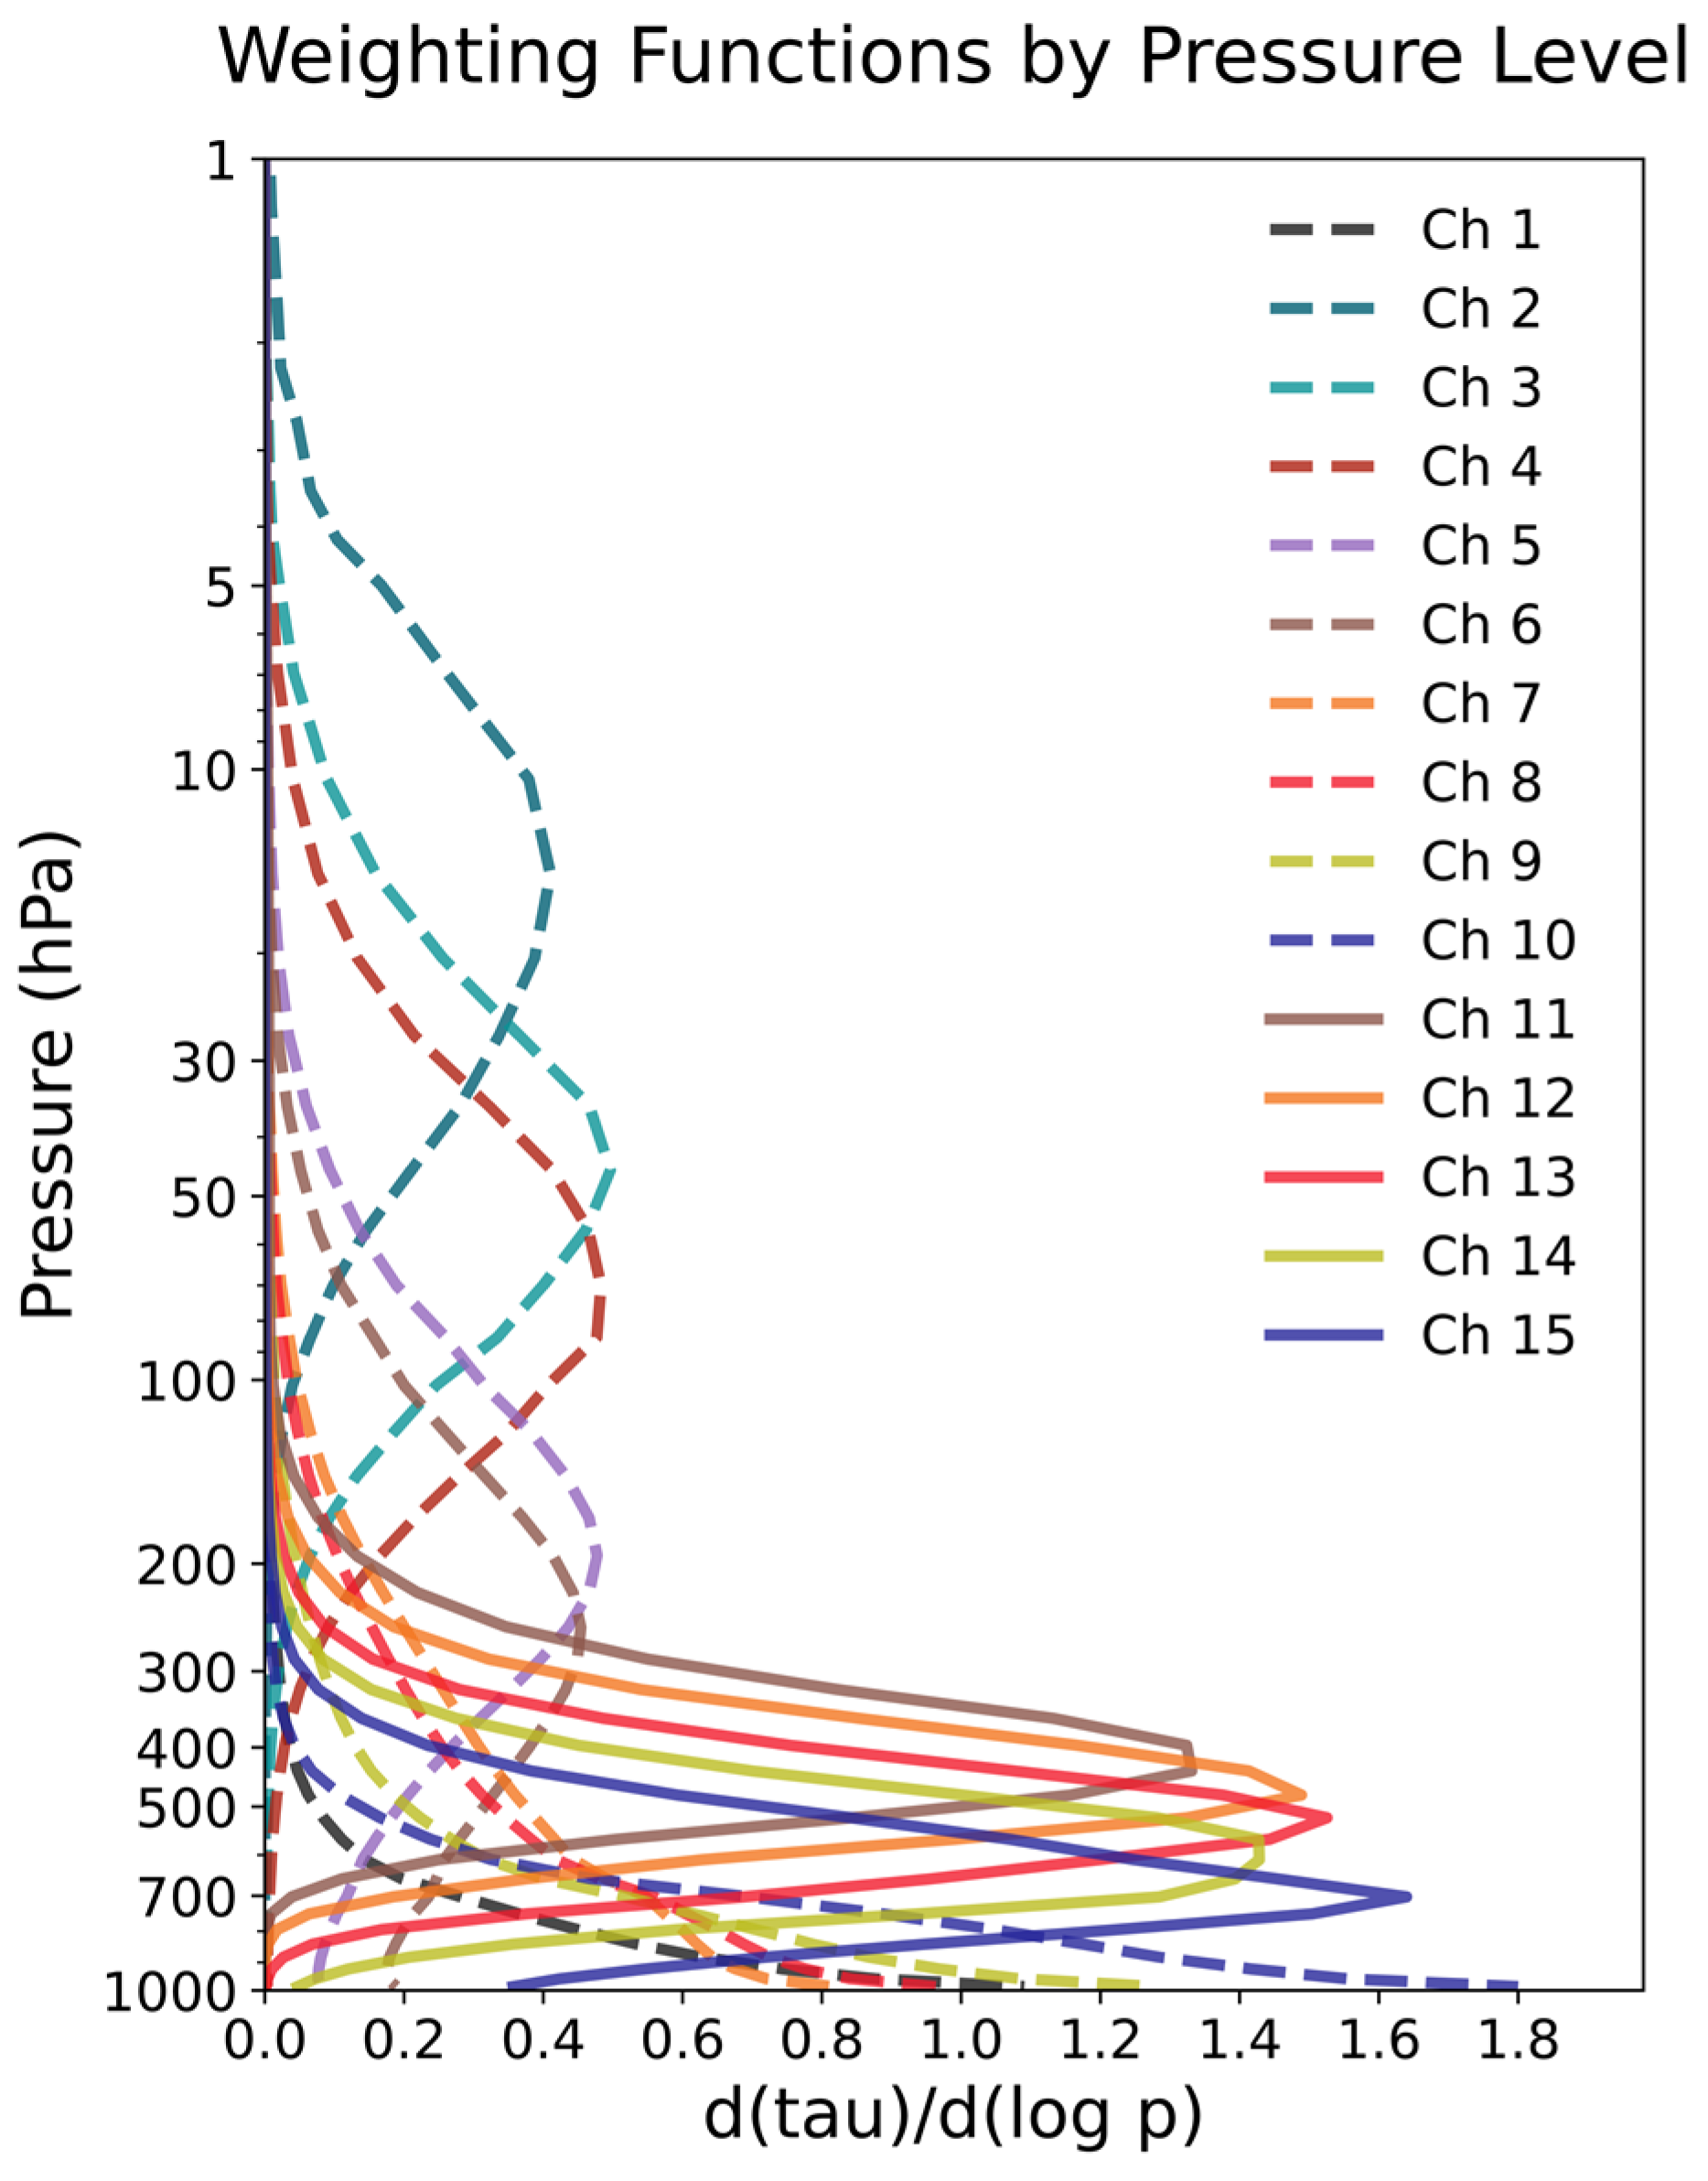
2.1. MWHS-II Radiance Data

As the successor to FY-3C, the MWHS-II instrument onboard FY-3F features improved detection accuracy and sensitivity [29] and provides both descending and ascending track observations. The instrument consists of 15 channels, with their basic parameters listed in Table 1. The MWHS-II includes five humidity-sounding channels centered around the 183.31 GHz water vapor absorption line, designed to provide detailed vertical profiles of atmospheric moisture. In addition, the instrument is equipped with eight oxygen absorption channels near 118.75 GHz, primarily used for atmospheric temperature sounding. These channels are unique to MWHS-II and are not available on other similar microwave humidity sounders such as MHS or ATMS. Although primarily intended for temperature retrieval, these channels are also affected by clouds and precipitation due to liquid water absorption/emission and scattering by ice particles [30]. The instrument includes window channels at 89 GHz and 116 GHz, which are generally used for surface emissivity sensing and precipitation detection.
Figure 1 shows the distribution of weighting functions for MWHS-II channels, which were simulated using the RTTOV forward model based on transmittance calculations from the U.S. Standard Atmosphere profile [31]. As illustrated in Figure 1, channels 1, 10, and 7–9 have weighting function peaks close to the surface, while channels 2–4 peak in the upper troposphere or even the stratosphere. The remaining channels have weighting function peaks mainly within the troposphere. In this study, Level-1 MWHS-II data are used, and the assimilated channels include channels 4–7 and 11–15. Channels 8 and 9 are excluded from assimilation due to their peak sensitivity being too close to the surface, which could introduce greater uncertainty into the analysis.

2.2. All-Sky Data Assimilation Method

All experiments in this study are conducted by the Weather Research and Forecasting (WRF V4.6.0) model and its data assimilation system (WRFDA), both developed by the National Center for Atmospheric Research (NCAR). WRFDA provides various modern data assimilation techniques, including three-dimensional variational (3D-Var), four-dimensional variational (4D-Var), and ensemble Kalman filter (EnKF) methods. In this study, the 3D-Var method is primarily used, which obtains the optimal analysis field by minimizing a cost function as follows:
J x , x b = 1 2 x x b T B 1 x x b + 1 2 y H x T R 1 y H x
In the 3D-Var framework, x is the atmospheric state vector, and x b is the background field, which typically provides either the output of WPS/REAL (cold start) or the forecast results from WRF (warm start). H is the nonlinear observation operator that delivers model variables to observation space. In satellite radiance assimilation, this operator is typically implemented via a radiative transfer model. y is the observation vector, B and R represent the background error covariance matrix and the observation error covariance matrix, respectively. The default control variable option (CV5) is applied in all experiments. CV5 utilizes stream function (Ψ), unbalanced velocity potential (Χu), unbalanced temperature (Tu), pseudo relative humidity (RHs), and unbalanced surface pressure (Ps,u). The pseudo relative humidity is defined as Q/Qb,s, where Qb,s is the saturated specific humidity from the background field. The flow-dependent background error covariance matrix is computed using the National Meteorological Center (NMC) method [32] based on the differences between 24 h and 12 h forecasts over the entire month of September 2024.
RTTOV-SCATT (the scattering module of Radiative Transfer for TOVS) version 12.1 serves as the radiative transfer model to simulate MWHS-2 brightness temperature observations. RTTOV-SCATT is a radiative transfer module developed by ECMWF for simulating microwave brightness temperatures in cloudy and precipitating conditions. The simulated brightness temperatures from RTTOV-SCATT are a combination of observations from both clear-sky and cloudy/rainy conditions [33]:
L B T o t a l = 1 C L B C l e a r + C L B R a i n y
where C is the effective cloud reflection, and L is the simulated bright temperature. RTTOV-SCATT internally calls RTTOV’s clear sky mode to obtain the bright temperature ( L B C l e a r ) and the vertical distribution of the clear sky transmittance, then finds the Mie scattering lookup table to compute the bright temperature ( L B R a i n y ) for the cloud or rainy conditions based on the clear sky transmittance. The final result ( L B T o t a l ) is obtained by linearly combining the simulated bright temperatures for both clear sky and cloud cover. At present, WRFDA cannot support RTTOV-SCATT as a radiative transfer model directly. Therefore, the WRFDA system is extended by developing a new coupling module between the radiative transfer mode and the assimilation system. Additional hydrometeor profiles required for RTTOV-SCATT are also computed, enabling the assimilation system to use both the forward, tangent linear, and adjoint operators of RTTOV-SCATT.

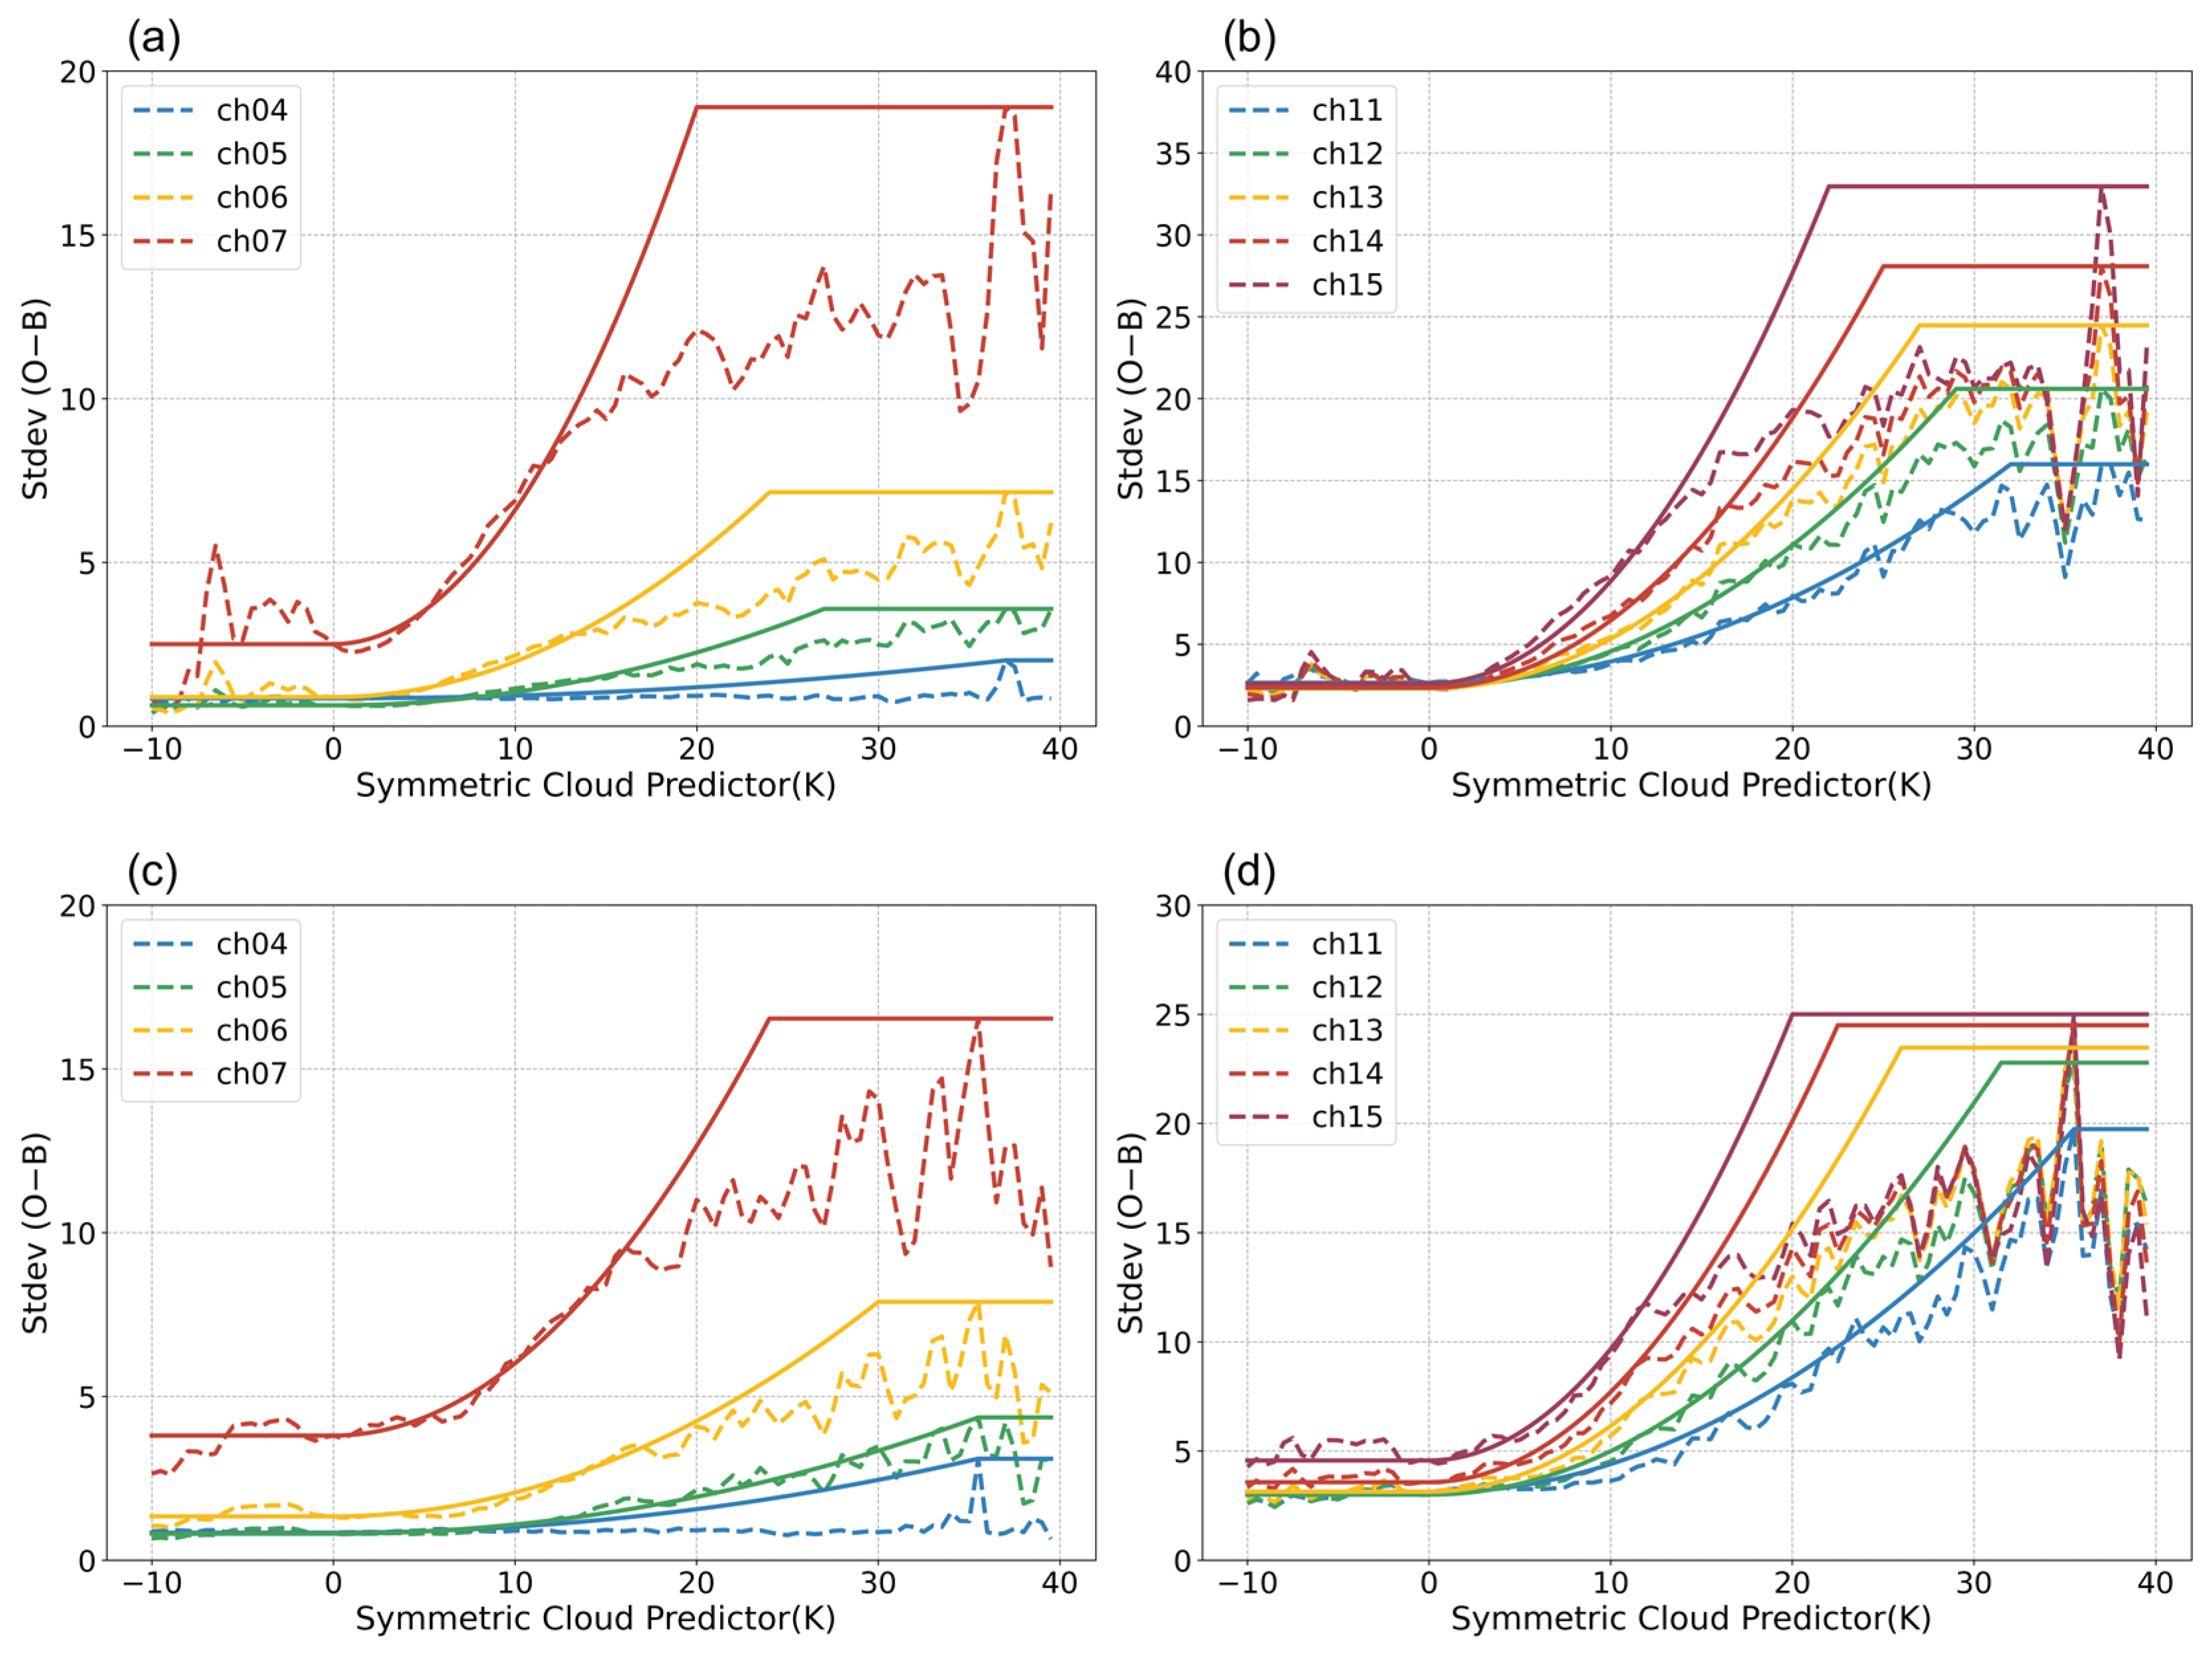
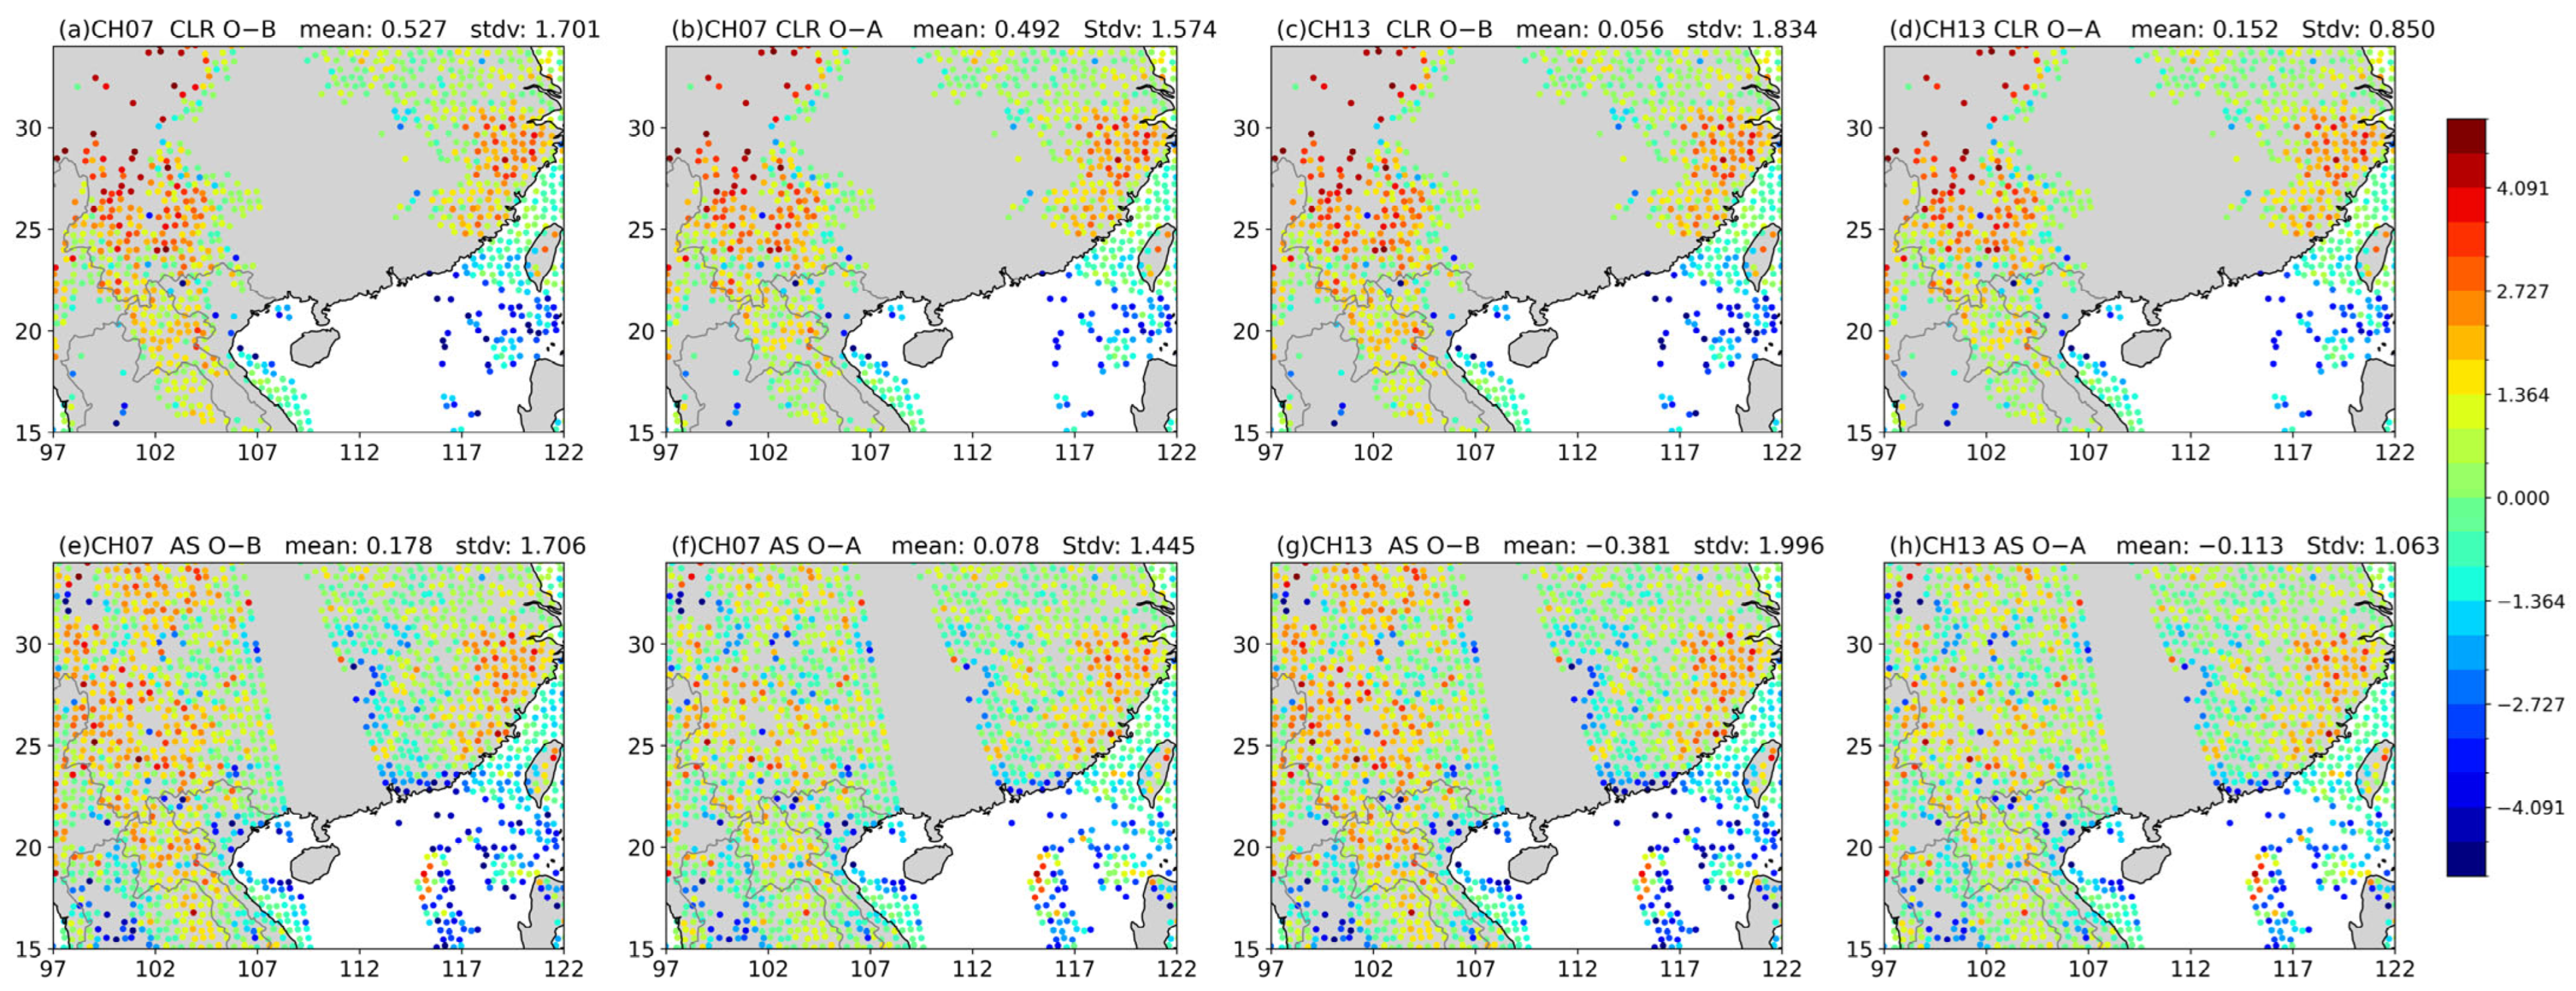
2.3. Symmetric Observation Error Model

A major challenge in all-sky assimilation is the inaccuracy of both forecasts and brightness temperature simulations in cloud-covered regions. These issues lead to inconsistencies between observations and the background field when identifying cloud-covered areas. Geer and Bauer proposed a symmetric observation error model that dynamically distributes the observation error through a function of symmetric cloud amount [10]. The model adopts a symmetric cloud factor C s y m as a criterion to assess the consistency between the simulated and observed brightness temperatures in cloud-covered areas:
C s y m = S I f g + S I o b 2
The scattering indices S I f g and S I o b are, respectively, calculated from the simulated brightness temperature of the background field and the observed brightness temperature. For MWHS-II, the scattering index is derived by taking the difference between two window channels. A larger value of the symmetric cloud factor ( C s y m ) indicates better agreement between the model and the observations in cloud-covered areas. When both the observation and the model are under clear-sky conditions, C s y m is equal to zero. Finally, observation errors over ocean and land can be determined as follows:
g C s y m = g c l r           C s y m < C c l r g c l r + g c l d g c l r g c l d         C s y m > C c l d C s y m C c l r C c l d C c l r C c l r   C s y m C c l d
where g c l r represents the observation error assigned to clear sky conditions, g c l d is the observation error assigned to cloudy conditions and C c l r , C c l d are the thresholds of the symmetric cloud factors under the two weather conditions. A total of 148,952 observations (77,828 over land and 71,124 over ocean) collected over a two-week period were used to calculate the standard deviation of O−B (observation minus background) as a function of symmetric cloud amount. The statistical domain covered southern China, adjacent regions, and the South China Sea/western Pacific to align with Typhoon Yagi’s activity range. Given FY-3F daily overpasses at 03:00 and 15:00, we included observations within ±3 h of these times. Land and ocean observations were separated using the surface type code embedded in the satellite data so that statistics for land and ocean regions were computed separately. The simulated brightness temperatures were generated by RTTOV-SCATT using 15 h forecasts based on NCEP FNL (Final) Operational Global Analysis data as the first guess. Figure 2 shows the all-sky standard deviations over ocean and land for each frequency channel (118 GHz and 183 GHz) as dashed lines, along with the corresponding observation error functions as solid lines.
As shown in Figure 2, both the standard deviations and normalized observation errors over land are generally larger than those over the ocean. Channels 4–6 show smaller standard deviations compared to other channels, likely because they observe higher atmospheric layers, with channel 4 peaking even above the tropopause. This pattern is also evident in the weighting functions shown in Figure 1, where higher peaking channels are less affected by clouds and precipitation, resulting in smaller standard deviations.

3. Experimental Designs

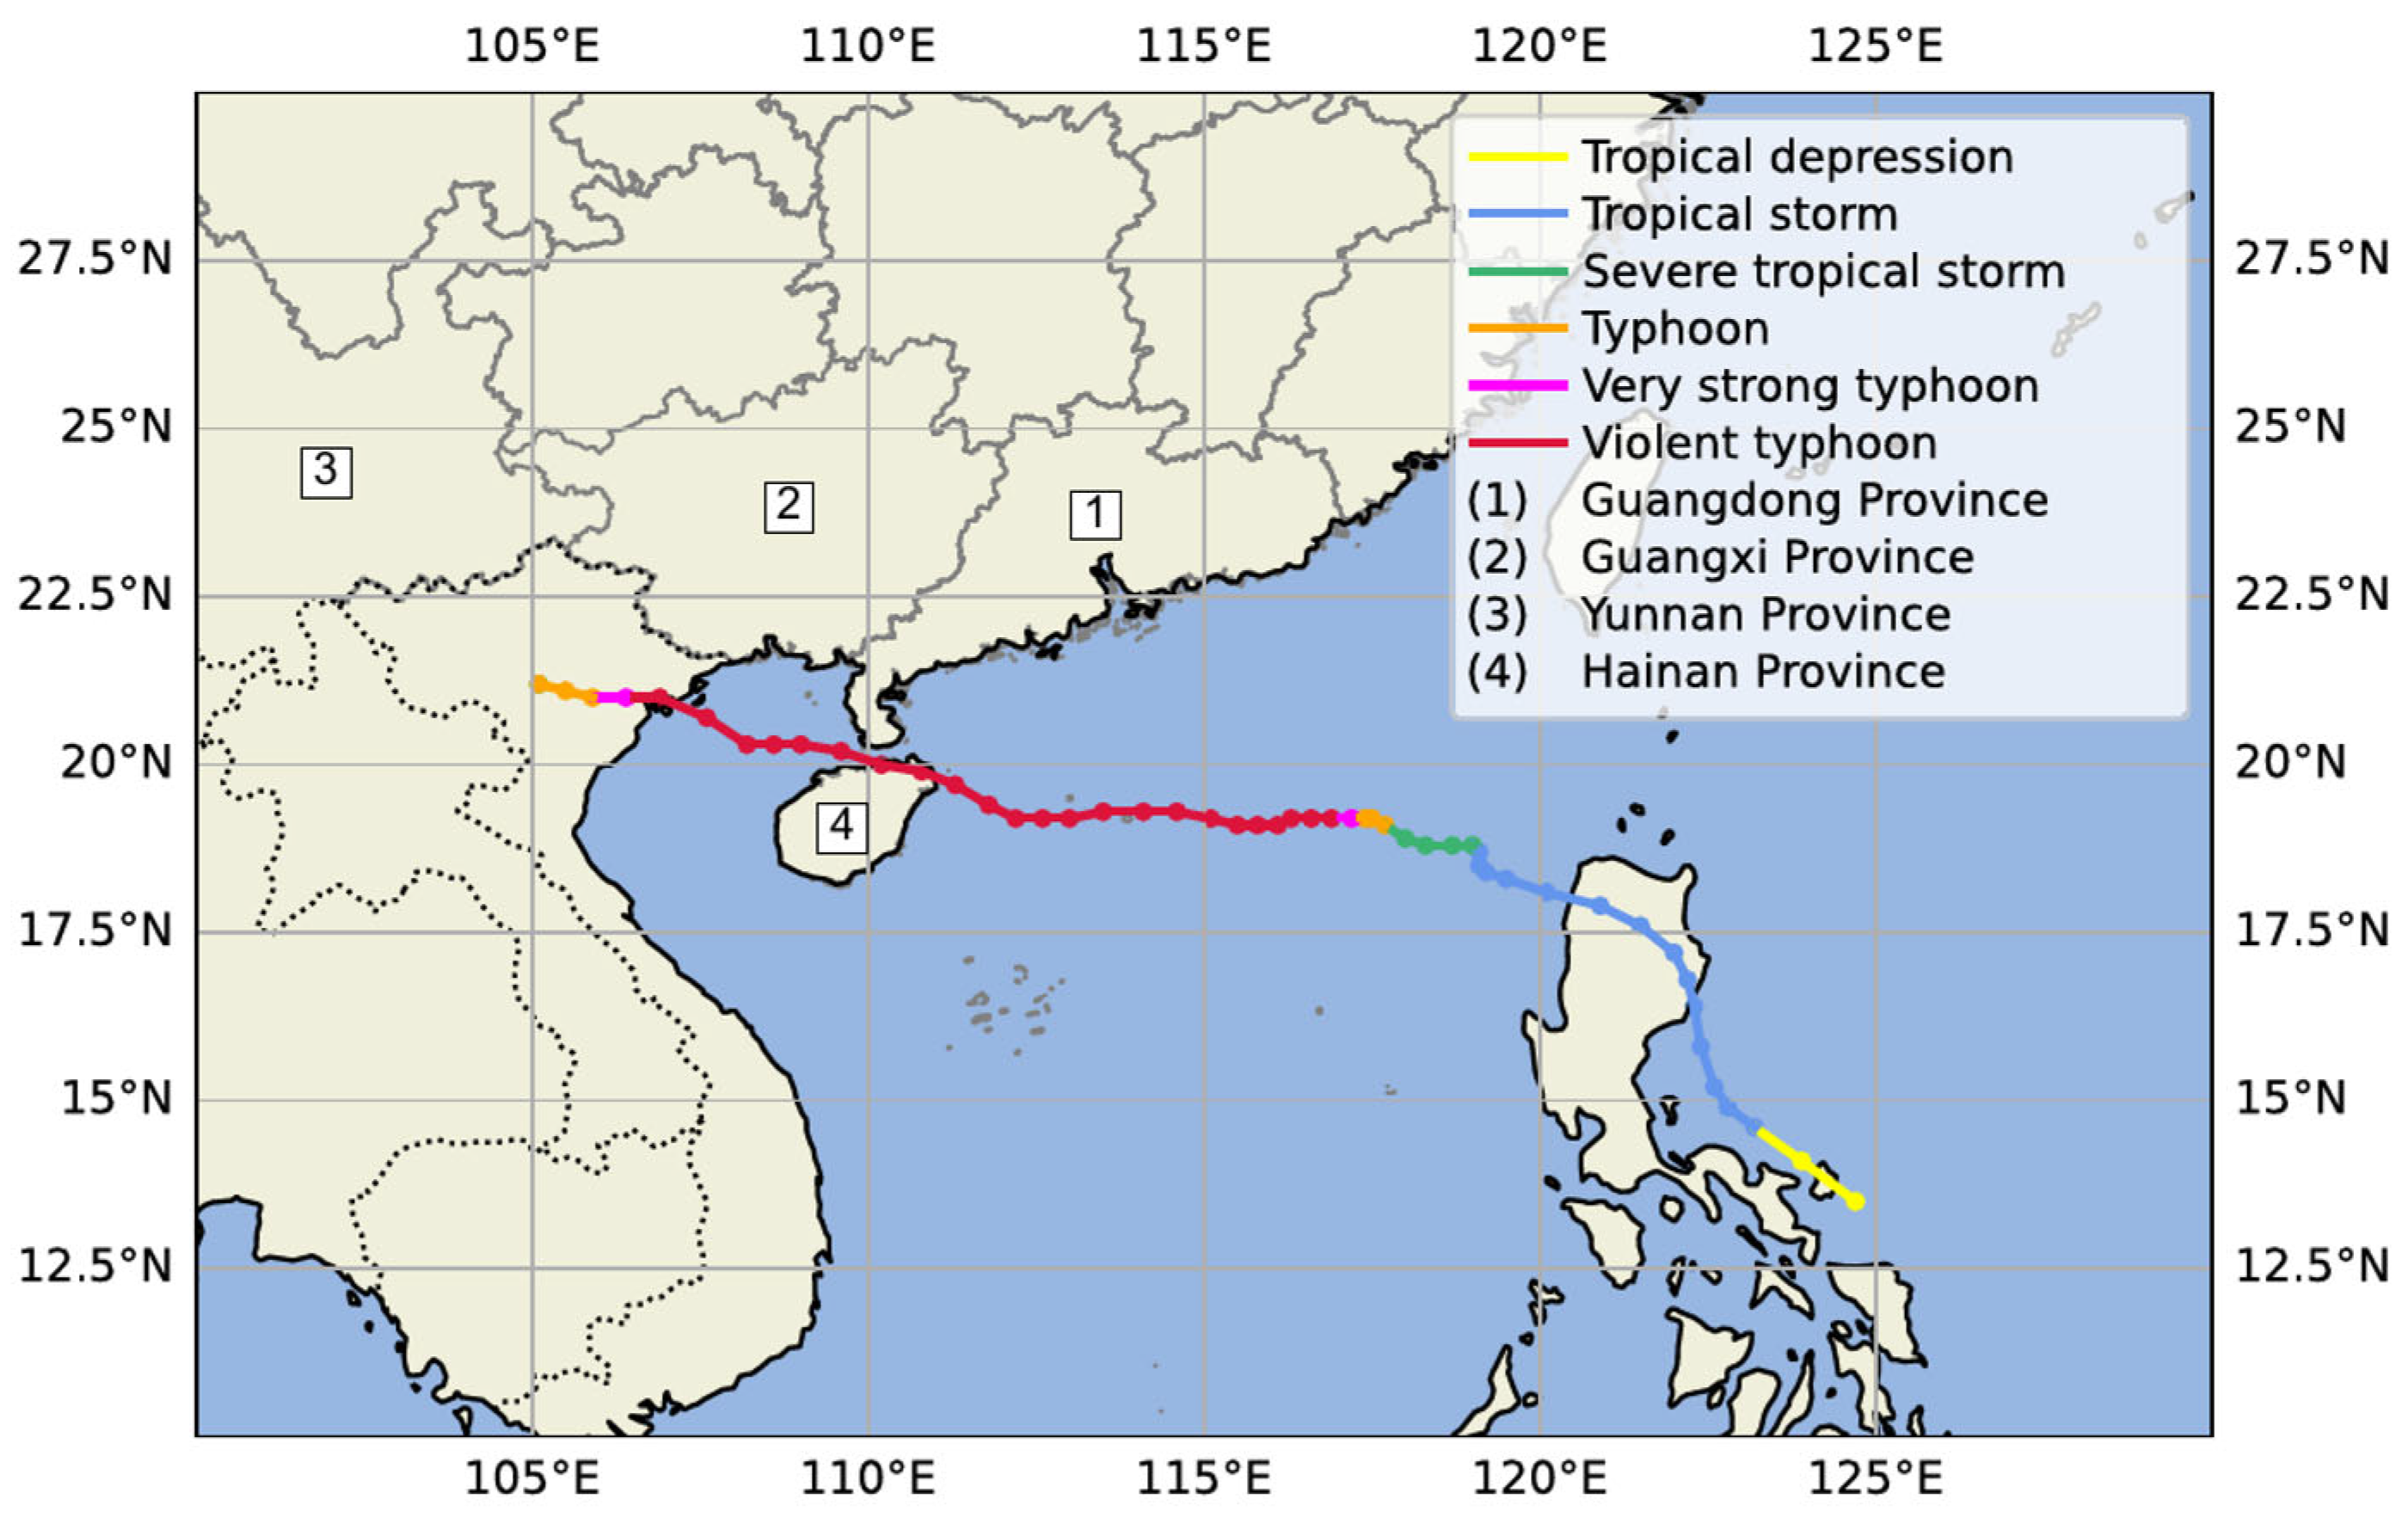
3.1. Overview of Typhoon Case

Typhoon Yagi (2024) was selected as the simulation case for the assimilation experiments using FY-3F data. The best track of the typhoon is illustrated in Figure 3. Typhoon Yagi formed as a tropical storm east of the Philippines at 1200 UTC on 1 September 2024 and intensified into a typhoon by approximately 2300 UTC on 3 September. It continued to strengthen and reached its peak intensity at 0000 UTC on 5 September, with a maximum wind speed of 65.85 m/s and a minimum central pressure of 922 hPa. At 1600 UTC on 6 September, the typhoon made landfall in Wenchang, Hainan Province, with a maximum wind speed of 62 m/s (region 4 in Figure 3). After a brief weakening, the typhoon rapidly intensified again at around 1800 UTC on the same day, increasing from 52 m/s to 60 m/s in a short period. This was the fastest of three intensification phases during its lifecycle and was identified as an “explosive” intensification [34]. After the intensification, Typhoon Yagi made its second landfall in Xuwen, Guangdong Province (region 1 in Figure 3), at 2200 UTC on 6 September, with a maximum wind speed of 58 m/s. It still maintained a wind speed of 58 m/s when it made the final landfall in northern Vietnam at around 1500 UTC on 7 September. Typhoon Yagi caused severe precipitation in Guangdong, Guangxi, and Hainan provinces and was the strongest autumn storm at landfall in China since records began in 1949. The typhoon completed two intensity upgrades (Very strong typhoon, Violent typhoon) within 15 h, and the extremely fast rate of intensification caused difficulties for numerical weather forecasting.

3.2. Experimental Settings

The Advanced Research WRF (ARW) version 4.6.0 was employed to conduct the experiments in this study. The model configuration included 241 × 301 grids, with a horizontal resolution of 9 km, 38 eta levels in the vertical direction, and a model top level at 50 hPa. The model employed the following parameterization: the Purdue Lin microphysics scheme [37], the Kain–Fritsch cumulus parameterization scheme [38], the Dudhia shortwave radiation scheme [39], the RRTM longwave radiation scheme [40], the Yonsei University (YSU) planetary boundary layer scheme [41], and the Unified Noah land surface scheme. The study set up a total of seven experiments to analyze the impact of all-sky assimilation of FY-3F MWHS-II data on typhoon forecasting. The configuration of each experiment is listed in Table 2:
The experiments 118_183_CLR and 118_183_AS are hereafter referred to as the CLR and AS experiments in Section 4.1 to evaluate the impact of all-sky assimilation based on the FY-3F MWHS-II data. In Section 4.2 a detailed comparison was conducted among all-sky and clear-sky assimilation experiments (118_CLR, 183_CLR, 118_183_CLR, 118_AS, 183_AS, and 118_183_AS) to investigate the channel sensitivity, especially how different channels under all-sky conditions influenced the analysis fields and forecasts. The model integration time was from 0000 UTC on 5 September to 0000 UTC on 8 September 2024. The control experiment involved no data assimilation, while all the assimilation experiments used a background field generated by a 15 h spin-up simulation starting from 0000 UTC on 5 September, initialized with FNL analysis data. The assimilation analysis time was set to 1500 UTC on 5 September, with a 6 h assimilation window. The atmospheric variables listed in Table 3 are converted into brightness temperatures through the radiative transfer model and involved in the assimilation process.
After minimizing the three-dimensional variational cost function, the analysis increments are propagated back to the background field via the adjoint model of the assimilation system, thereby updating the background state. The resulting analysis fields from each assimilation experiment were then used to update the lateral boundary conditions and to serve as the first guess for a 57 h forecast, ending at 0000 UTC on 8 September 2024.

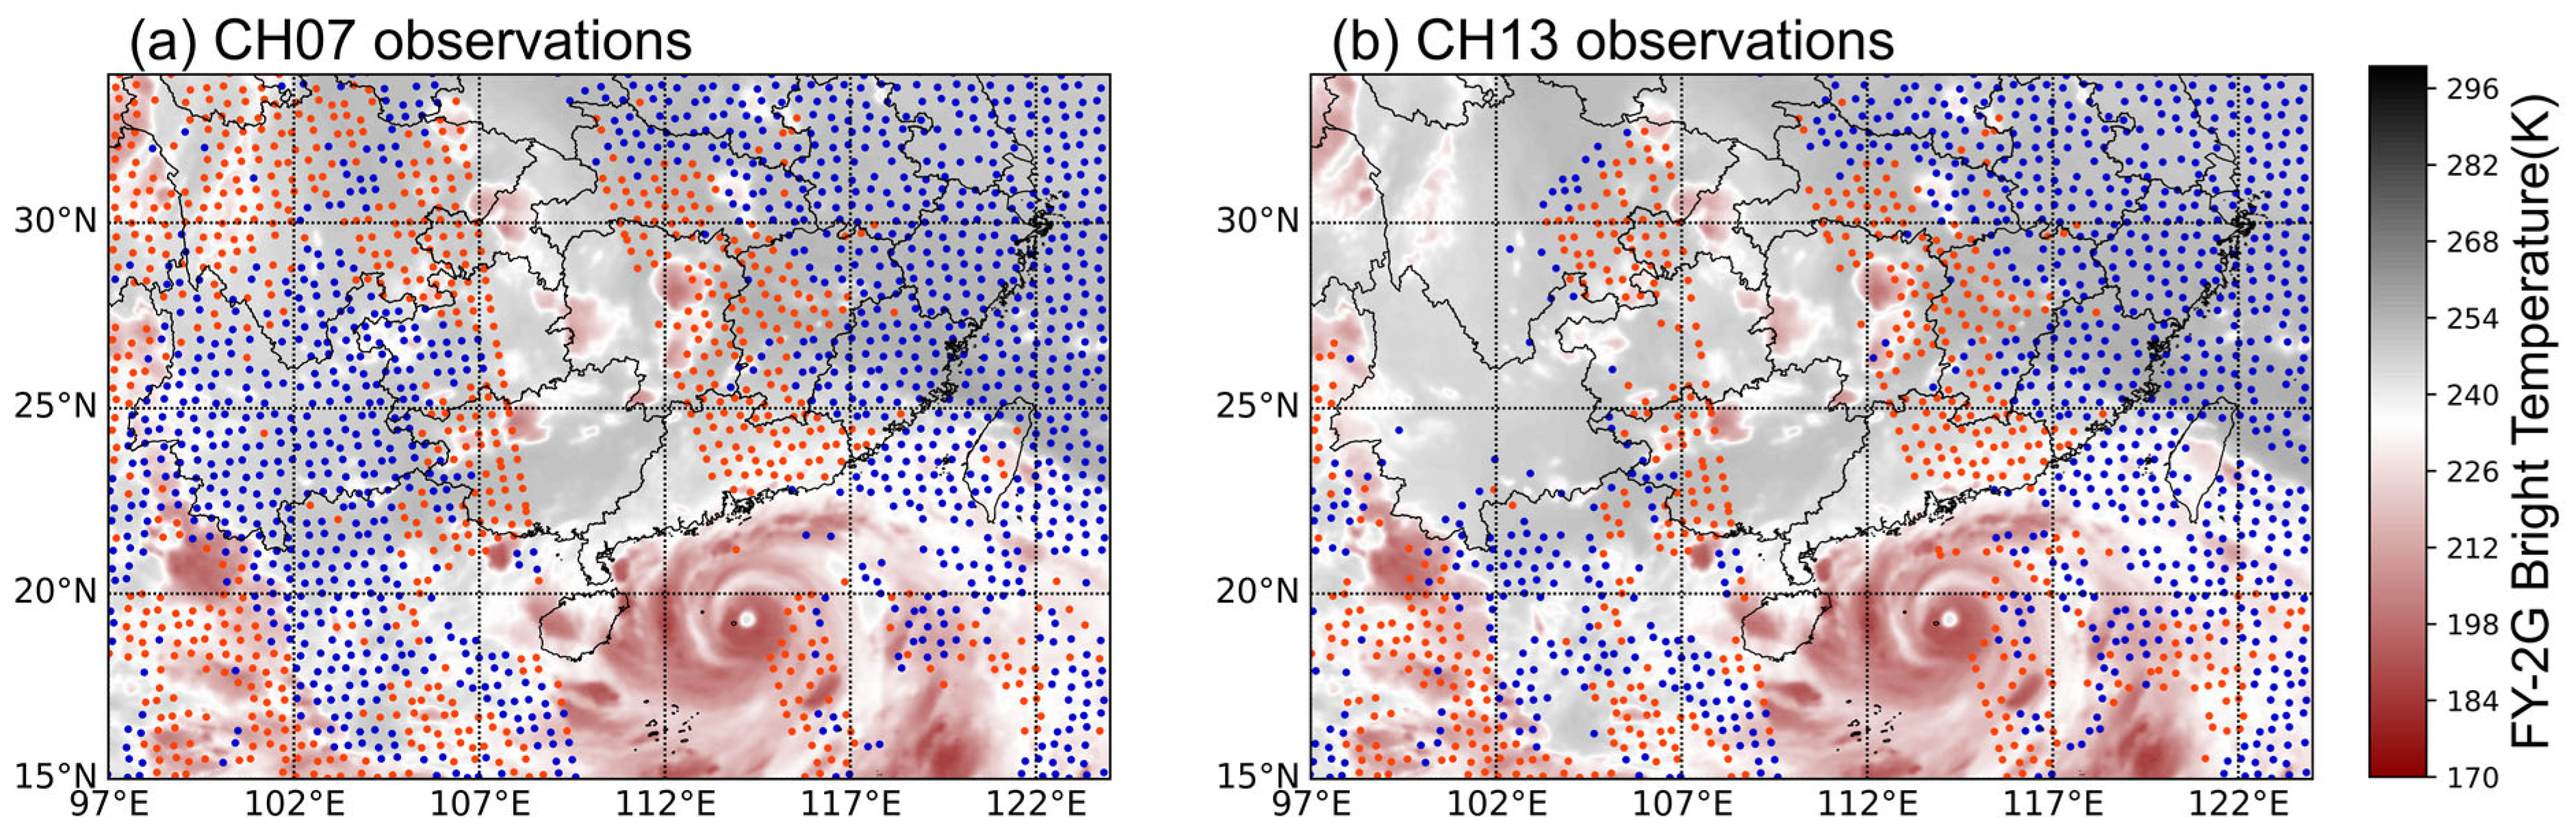
3.3. Quality Control

For both clear-sky and all-sky assimilations, the same general radiance quality control procedures are applied to the MWHS-2 data: (1) radiance data located over mixed surface types is rejected, (2) radiance data within five scan positions of each swath edge is removed [30], (3) radiance with O−B departures exceeding 3σ is rejected, where σ represents the specified standard deviation of the observation errors, (4) all radiance data are thinned to a minimum spacing of 45 km, (5) data exceeding the channel-specific altitude thresholds is rejected (Channel 11: 1500 m; Channels 12–13: 1000 m; Channels 14–15: 800 m). In addition, for clear-sky assimilation experiments, a cloud detection procedure is used to eliminate cloud-contaminated observations: (1) radiance data with an absolute brightness temperature difference between Channels 1 and 10 greater than 10 K is removed, (2) radiance with a liquid cloud water path exceeding 0.2 g·m−2 is removed. For all-sky assimilation, a symmetric observation error model is applied to observations influenced by clouds and precipitation. Bias correction is implemented using the variational bias correction (VarBC) method, which estimates observation system biases dynamically within a Bayesian framework [42]. This approach allows the O−B departures to better conform to the assumption of Gaussian error distributions, thereby improving assimilation performance.

4. Results from FY-3F MWHS-2 Experiments

Figure 4 displays the distribution of assimilated observations from two representative channels (CH 7 and CH 13) under different sky conditions. Quality-controlled observations increased from 1291 (CH 7) and 954 (CH 13) in clear-sky assimilation to 2142 and 1584, respectively, in all-sky assimilation. All-sky assimilation increased the utilization rate of observations, with the newly assimilated data distributed not only around the typhoon eye but also within the spiral rainbands and other regions covered by thick clouds. However, the number of additional observations within the typhoon core remains relatively limited compared to other cloud-covered areas. This may be owing to larger discrepancies between the simulated typhoon structure in the background field and the observations, leading to higher observation-minus-background (O−B) errors and, consequently, more rejections during quality control. Nevertheless, the additional observations in surrounding regions still have the potential to influence the regions near the typhoon, contributing to improvements in the forecast accuracy.
Figure 5 illustrates the spatial distribution of observation-minus-background (O−B) and observation-minus-analysis (O−A) differences at the analysis time (1500 UTC on 5 September 2024). In both the clear-sky and all-sky assimilation experiments, the O−A values are noticeably smaller than the corresponding O−B values, indicating that the analysis fields are closer to the observations than the background fields. Although the AS experiment shows slightly larger mean O−B values compared to the CLR experiment, it achieves smaller mean O−A values, suggesting better overall performance in reducing analysis errors. For Channel 14, the standard deviation of O−A in the AS experiment is slightly higher than that in the CLR experiment (Figure 5f,h). However, this discrepancy can be attributed to the larger sample size used in the all-sky assimilation, which results in greater sample-based variability. Given this context, the difference in standard deviation is considered acceptable.

4.1. Forecast Verification

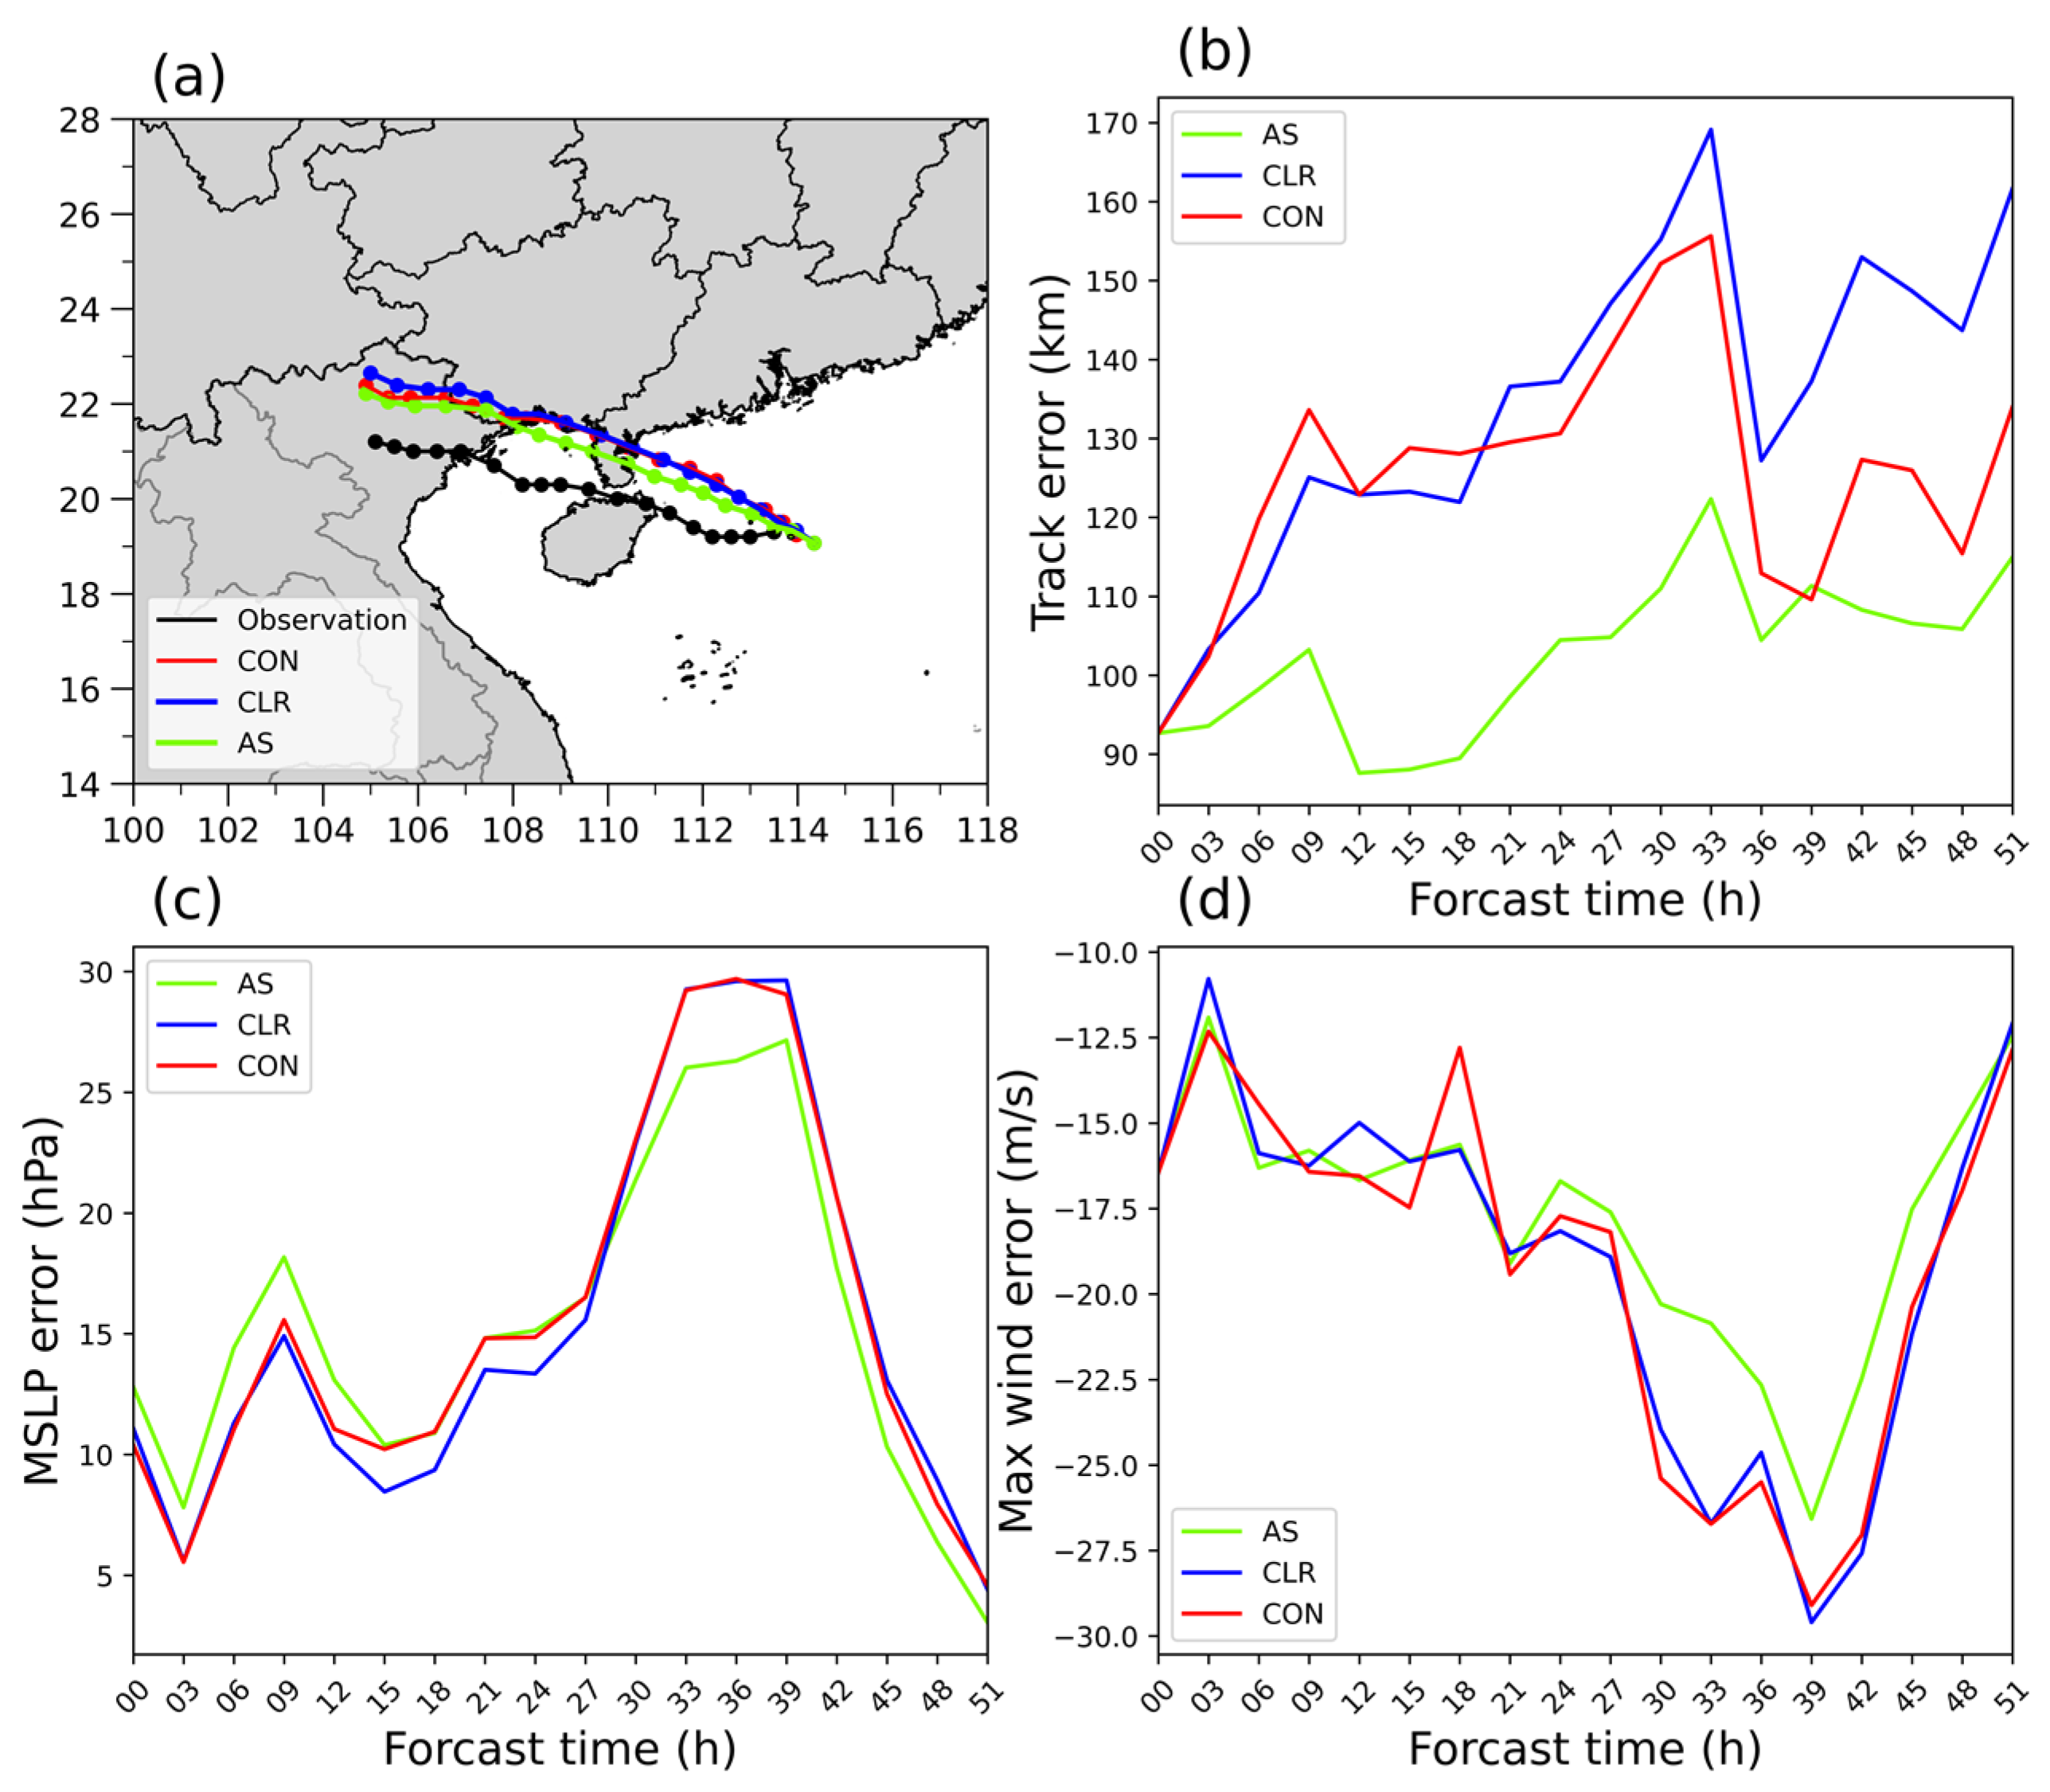
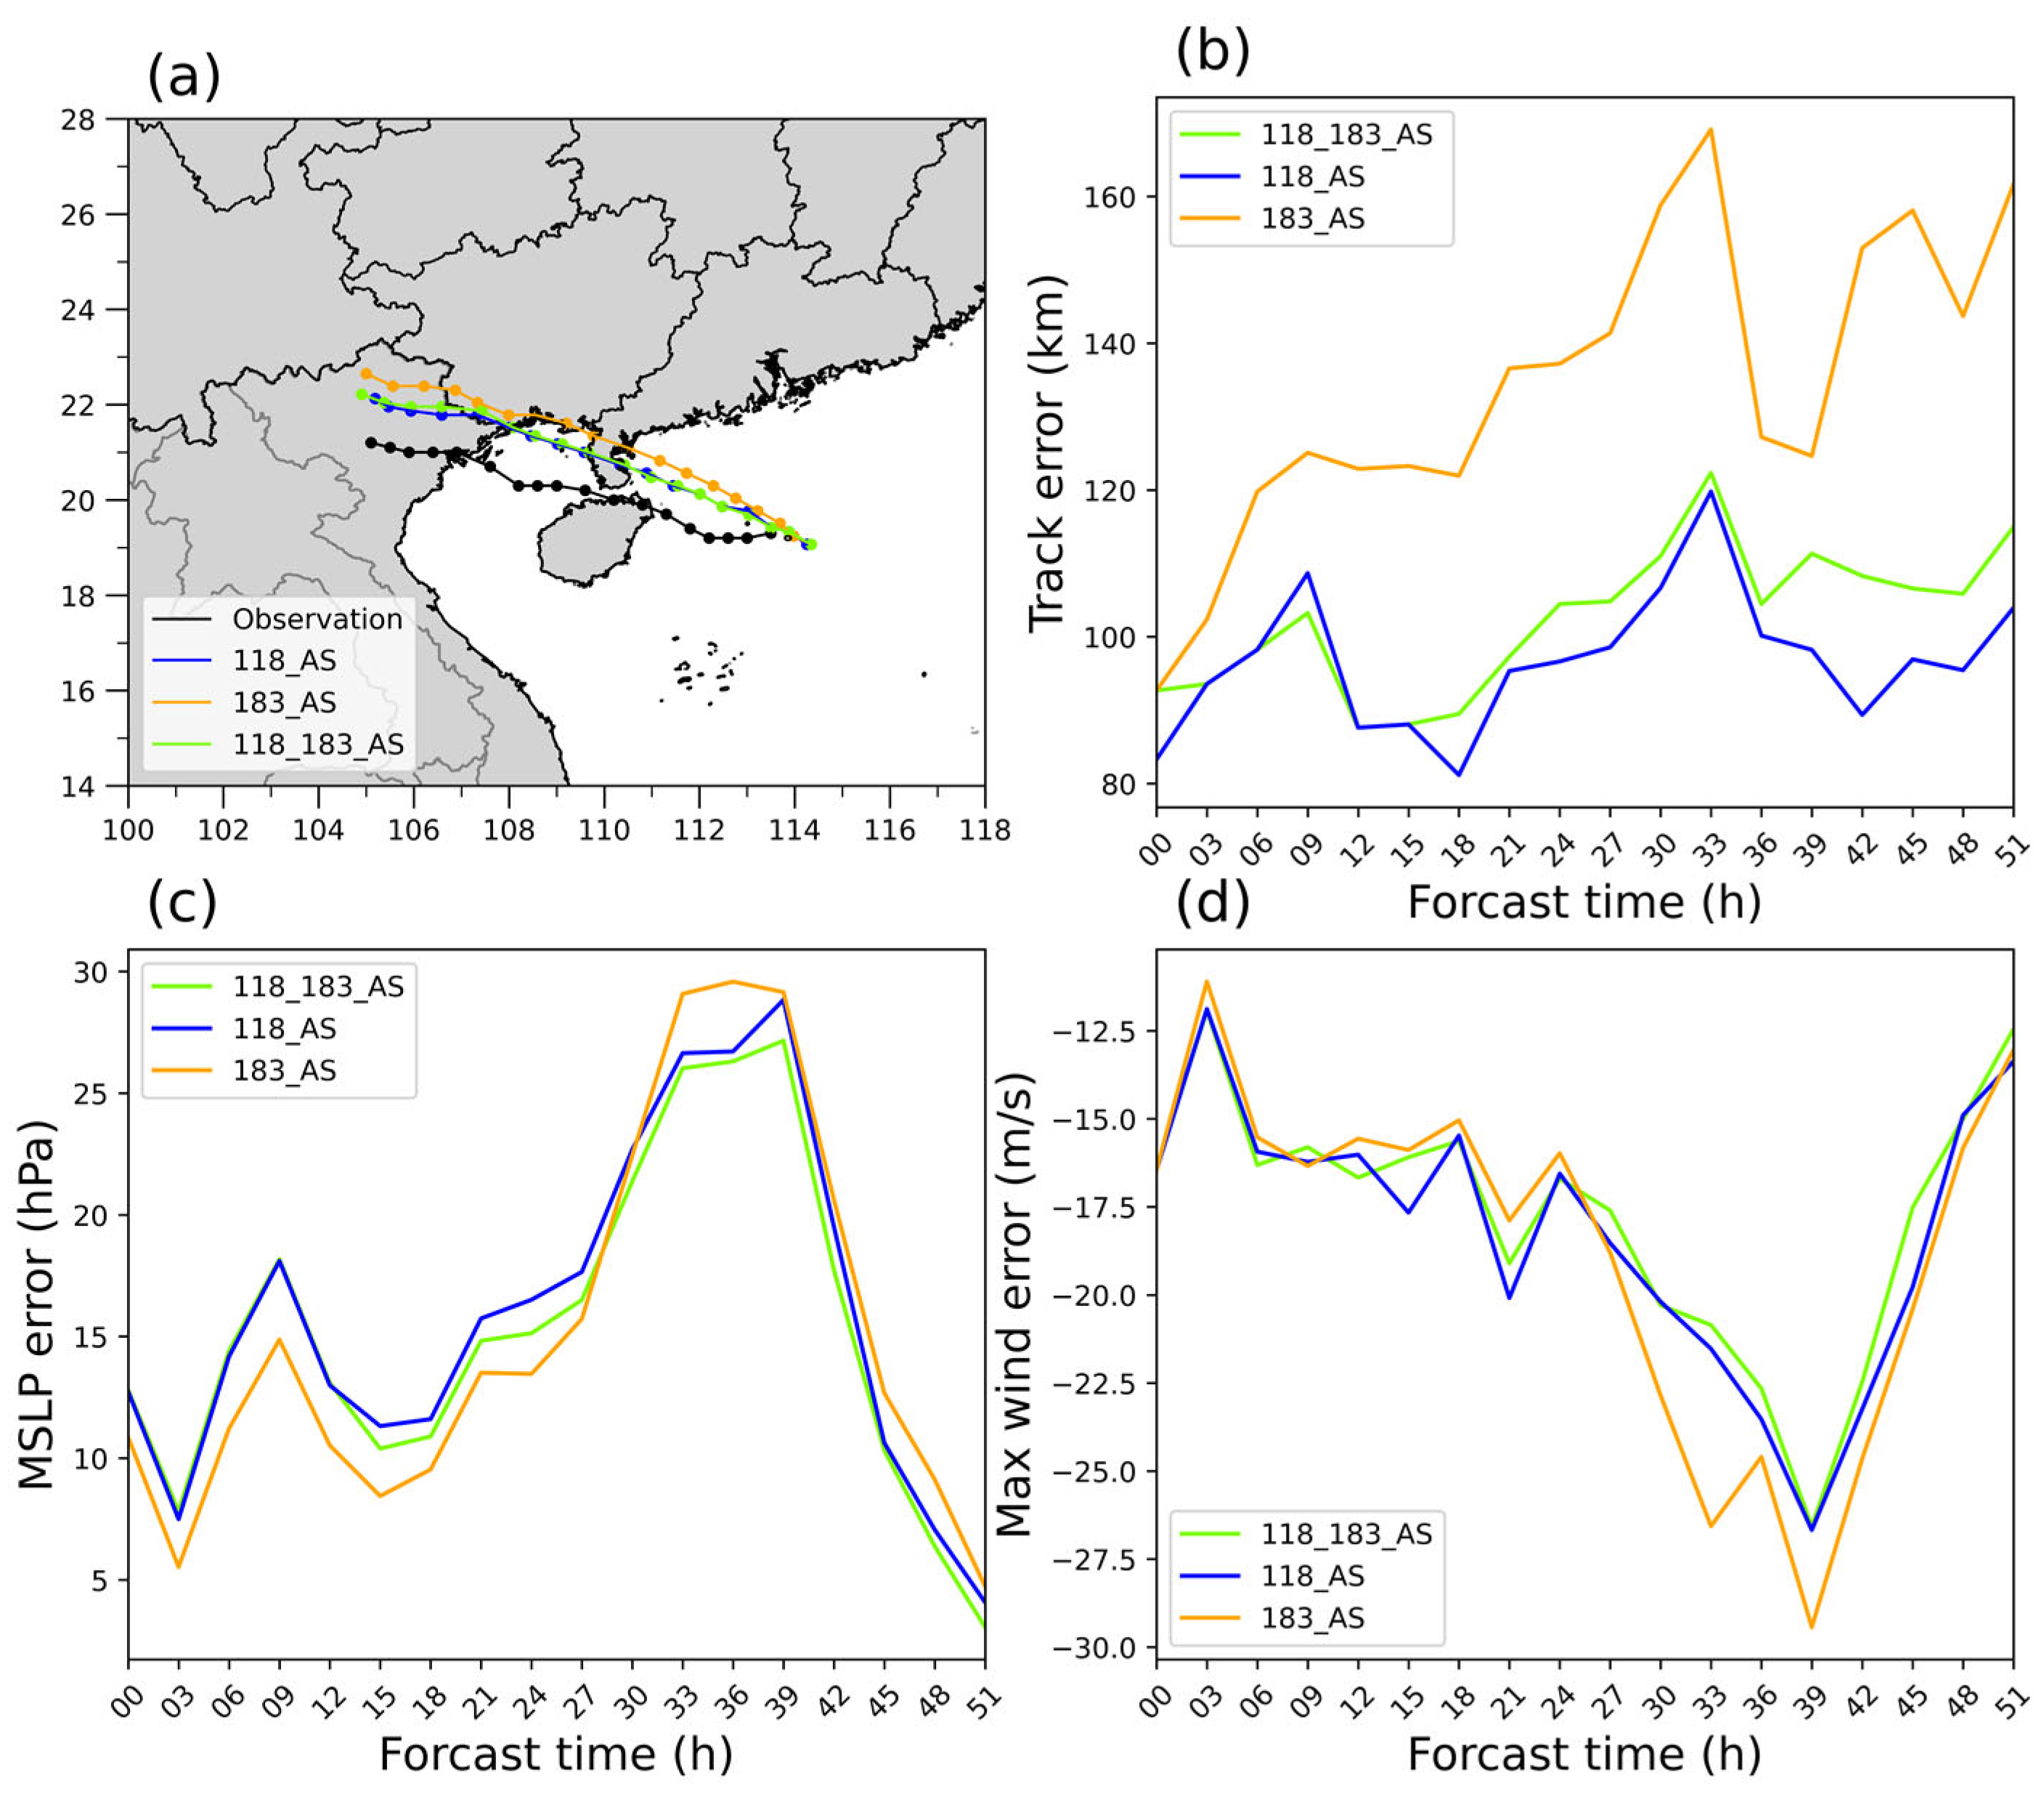
4.1.1. Typhoon Track and Intensity Forecasts

The International Best Track Archive for Climate Stewardship (IBTrACS) is used as the best track dataset to verify the typhoon forecast performance of the control, clear-sky, and all-sky experiments. Figure 6 presents the differences between the forecasts and the best track in terms of multiple evaluation metrics. The typhoon track in the CON experiment exhibits a northward deviation over time (Figure 6a). Although the CLR experiment shows smaller track errors than the CON experiment within approximately 18 h after assimilation (Figure 6b), the average improvement remains within 10 km. After 0900 UTC on 6 September 2024, its track error even exceeds that of the CON experiment. In contrast, the AS assimilation effectively suppresses this deviation and maintains track errors below 120 km throughout the forecast period. On average, the AS experiment reduces track error by 23.2 km compared to the CON and by 31.8 km compared to the CLR experiment. For the near-surface maximum horizontal wind speed (Figure 6d), there is little difference among the three experiments during the first 27 h. However, a notable negative bias emerges after 1800 UTC on 6 September 2024, coinciding with a rapid intensification phase of Typhoon Yagi [34]. Neither the CON nor the CLR experiments capture this intensification trend, resulting in underestimated wind speeds and large negative biases. The AS experiment, however, captures the intensification process, leading to much smaller wind speed errors (Figure 6d). The maximum wind speed error in the AS experiment is reduced by an average of 1.33 m/s compared to the other two experiments, with the maximum improvement reaching 6.0 m/s. In terms of the minimum sea level pressure (Figure 6c), the AS experiment also maintains relatively lower errors during the intensification period of Typhoon Yagi, and this improvement is more consistent over time. Compared to the CON and CLR experiments, the maximum reduction in MSLP error reaches 3.30 hPa and 3.29 hPa, respectively. Based on these evaluations, it is concluded that the all-sky assimilation exhibits a clear advantage in capturing the rapid intensification of the typhoon, and the improvement it brings is both substantial and persistent.

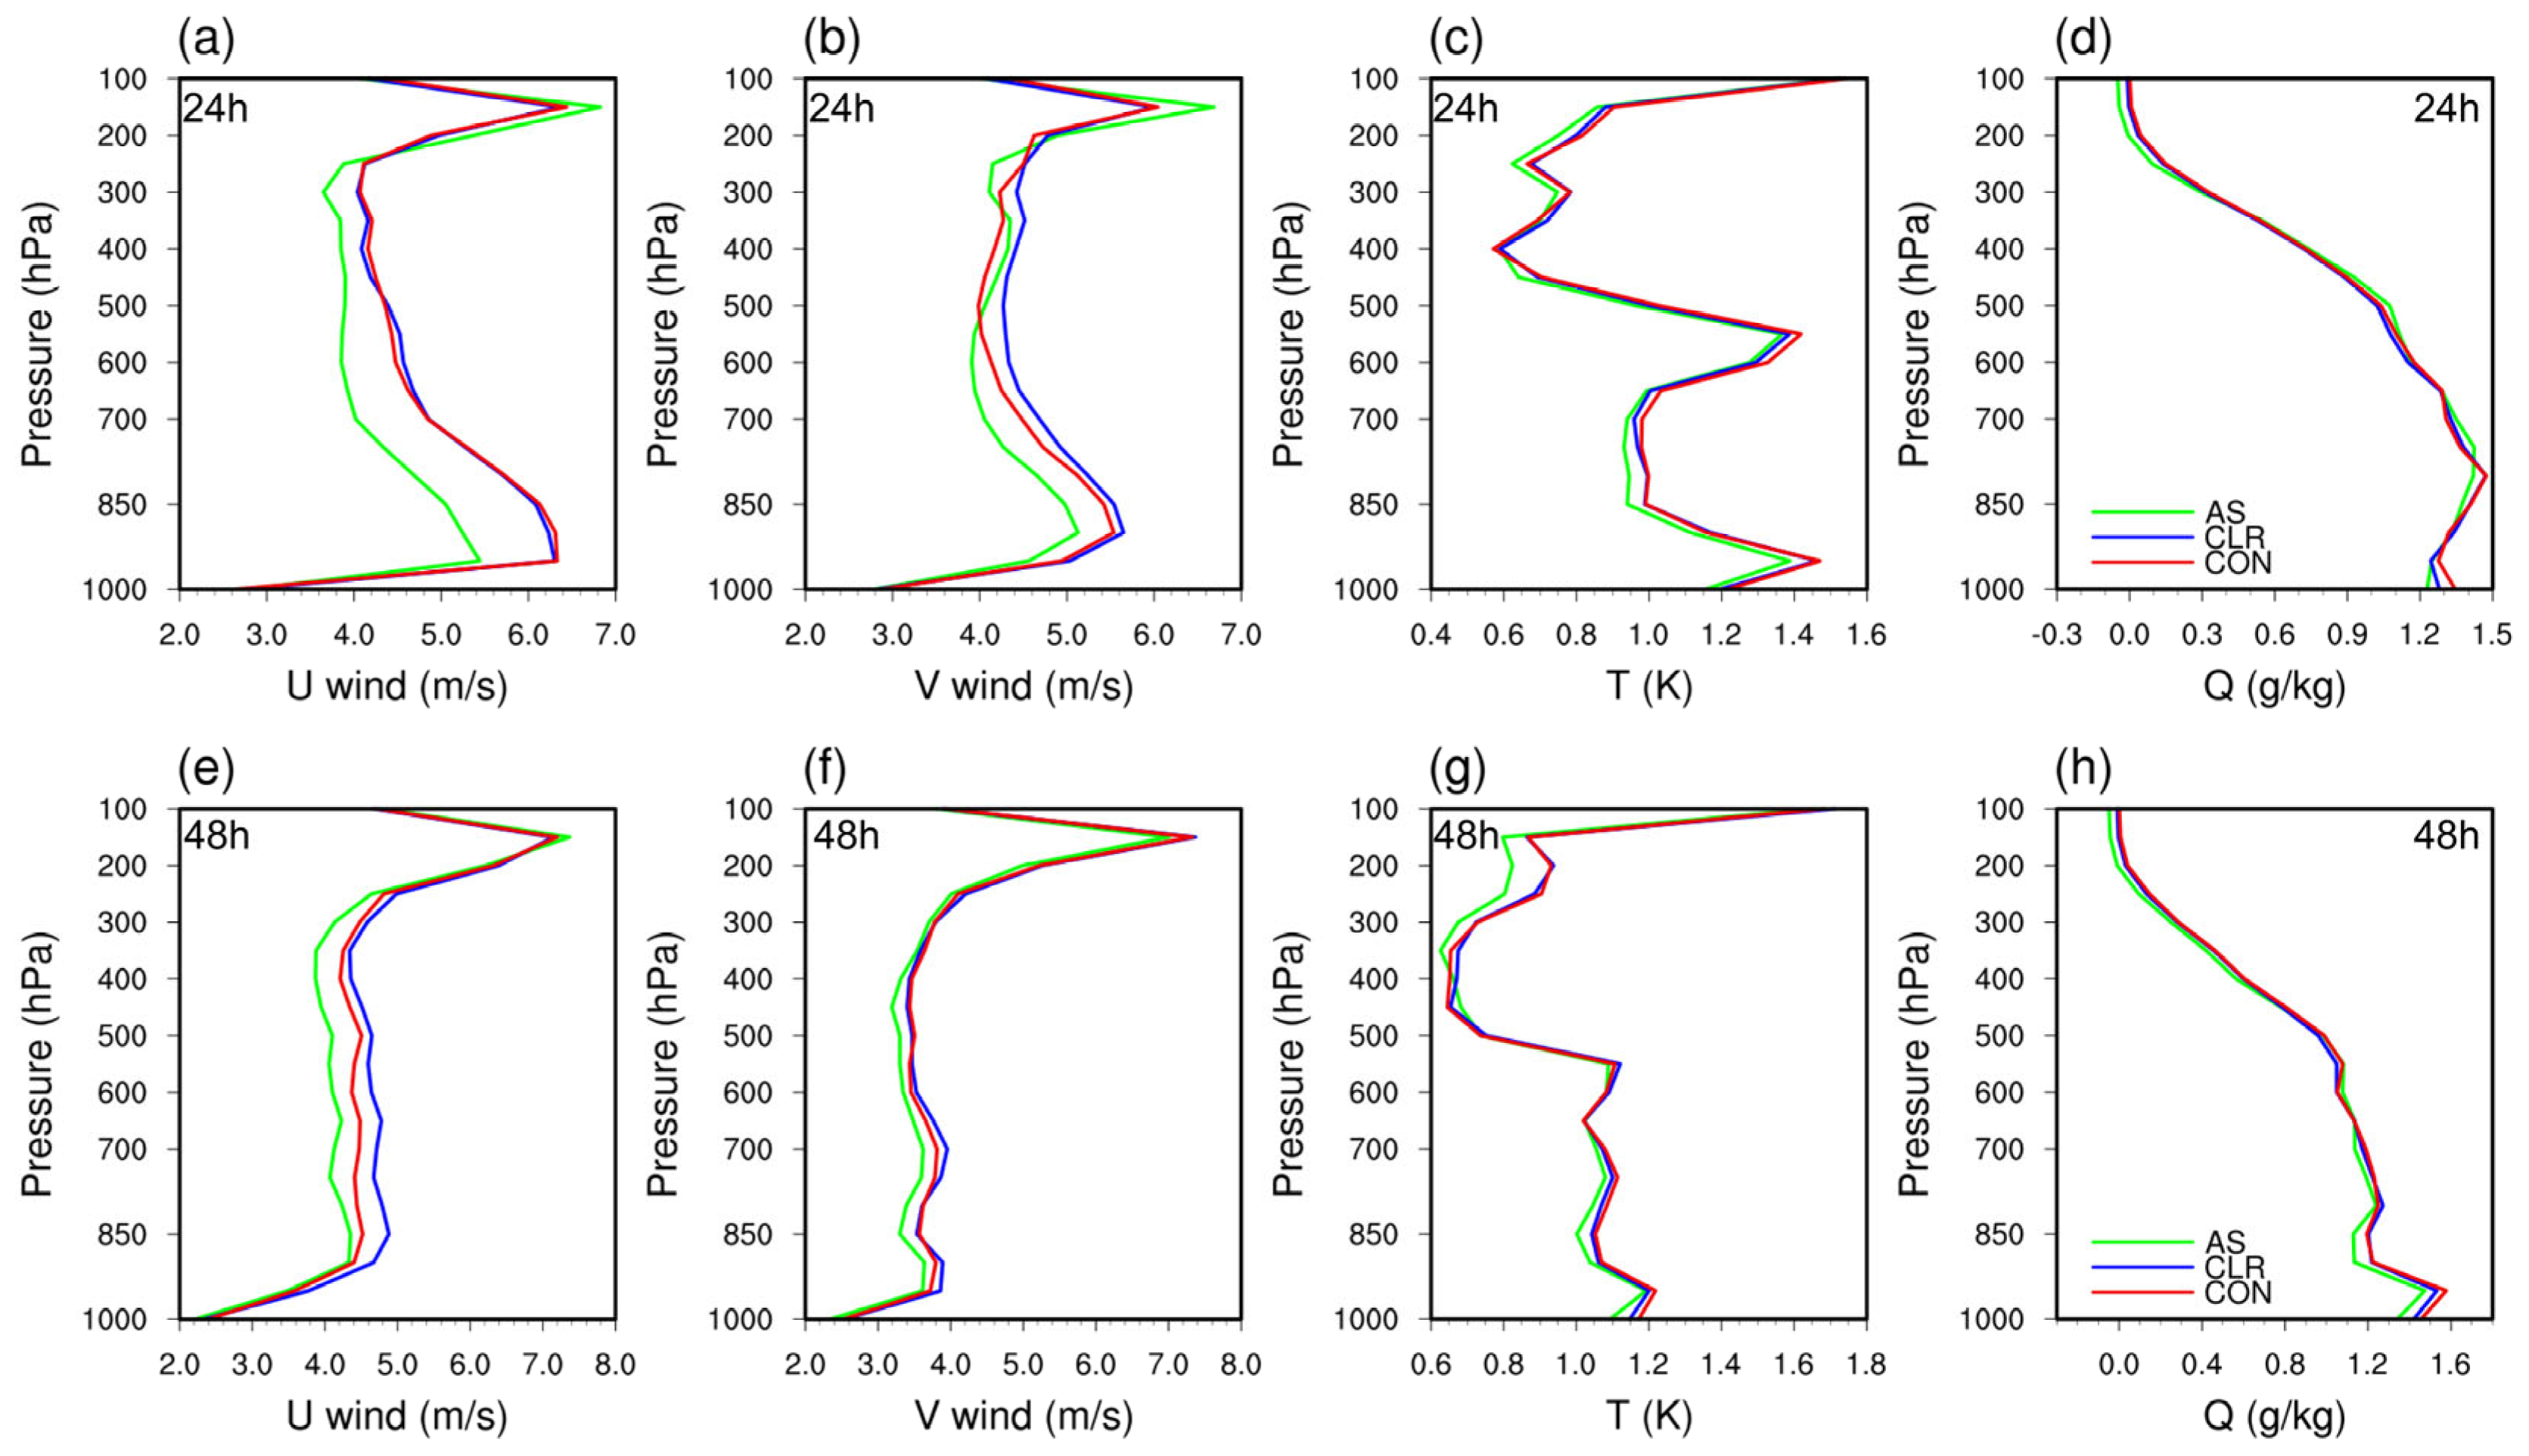
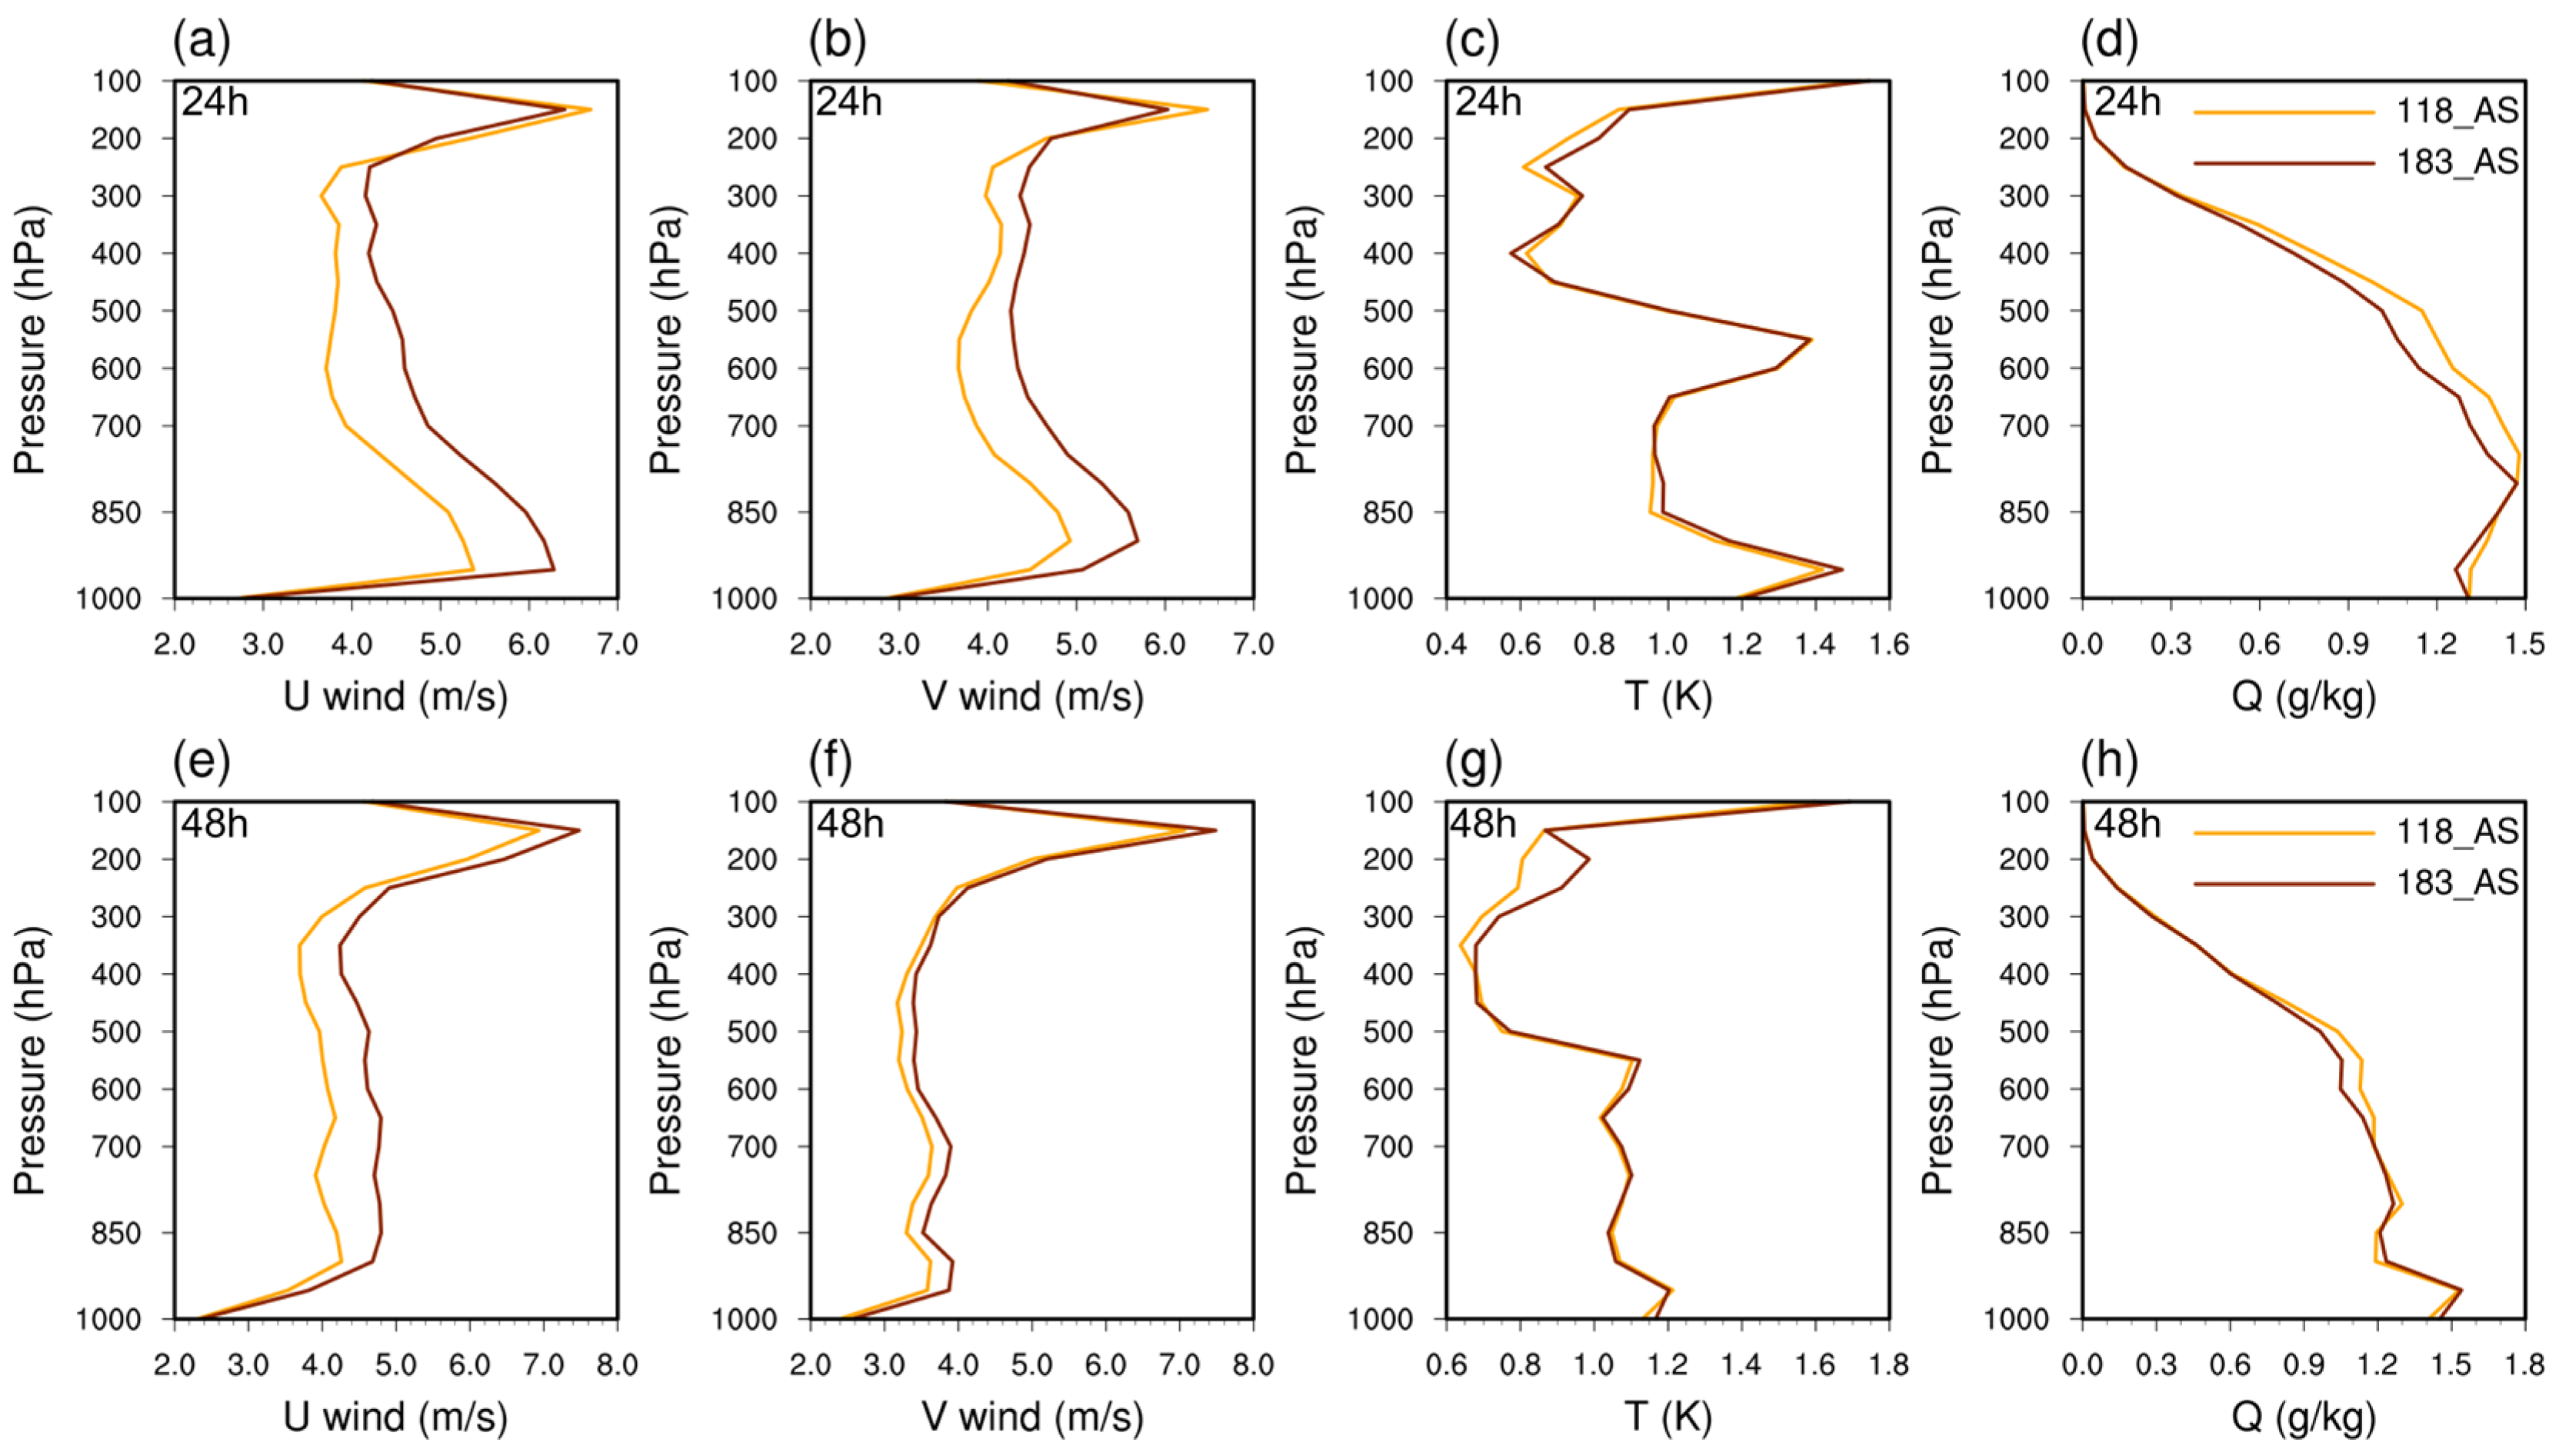
4.1.2. Thermodynamic and Dynamic Structure

Figure 7 shows the vertical root mean square error (RMSE) profiles of vector winds, temperature, and specific humidity over the entire simulation domain at 24 h (1500 UTC on 6 September 2024) and 48 h (1500 UTC on 7 September 2024) forecast lead times, using ECMWF reanalysis as the reference to assess the impact of assimilation. The CLR assimilation experiment provides only limited improvements, with reductions mainly in temperature and humidity within the troposphere (Figure 7c,d,g,h). In comparison, the AS experiment displays more evident benefits, especially for vector winds (Figure 7a,b,e,f), where improvements extend from 200 hPa to the surface, the RMSEs of both zonal wind (U) and meridional wind (V) are reduced by an average of 0.59 m/s and 0.37 m/s, respectively, compared to the CLR experiment. The enhanced wind performance may contribute to better typhoon forecasts. Additionally, the AS experiment produces lower RMSE in temperature than the CLR case, both above 400 hPa and below 700 hPa, with mean reductions of 0.027 K and 0.046 K, respectively (Figure 7c,g). The advantage in the upper levels becomes more distinct at longer forecast ranges, reaching a maximum reduction of 0.069 K. For specific humidity (Figure 7d,h), the two experiments show similar performance in the early forecast period, while the AS experiment gradually demonstrates clearer advantages later on, with a vertical pattern similar to that of temperature. Although the RMSE is averaged across the full simulation domain, the overall enhancements in wind and temperature with all-sky assimilation remain noticeable and may help explain its superior performance in typhoon forecasts.

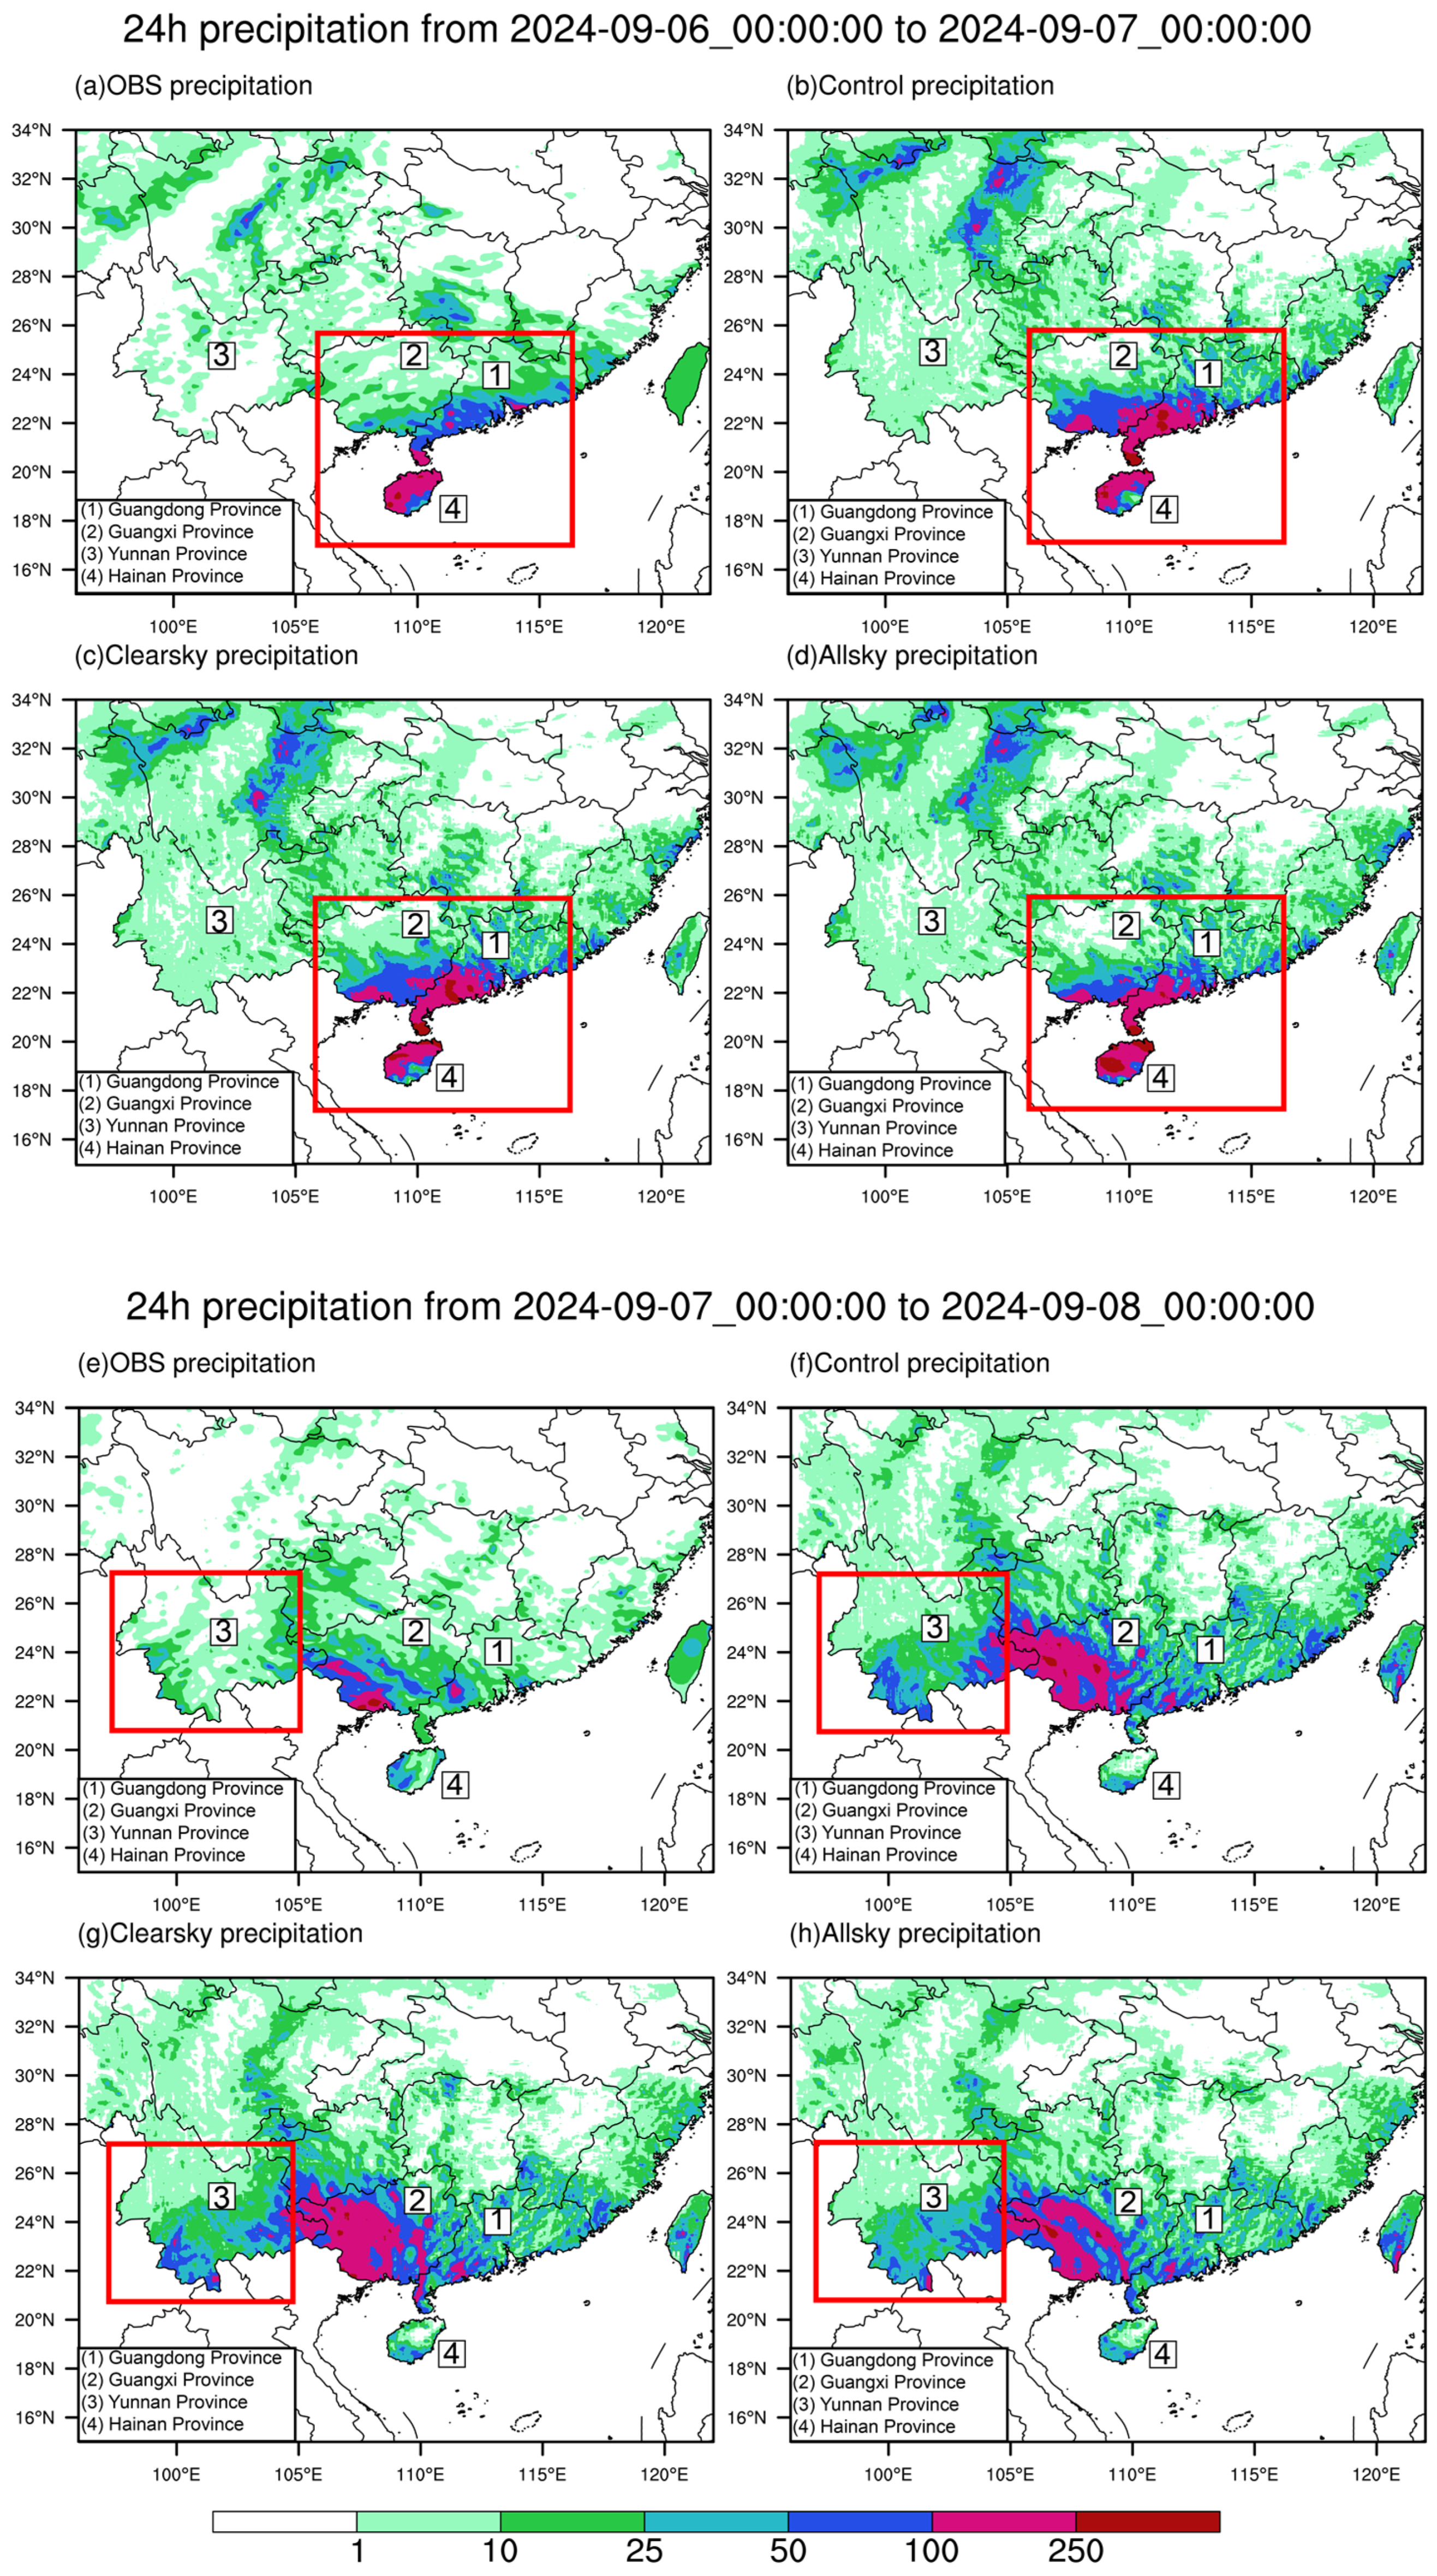
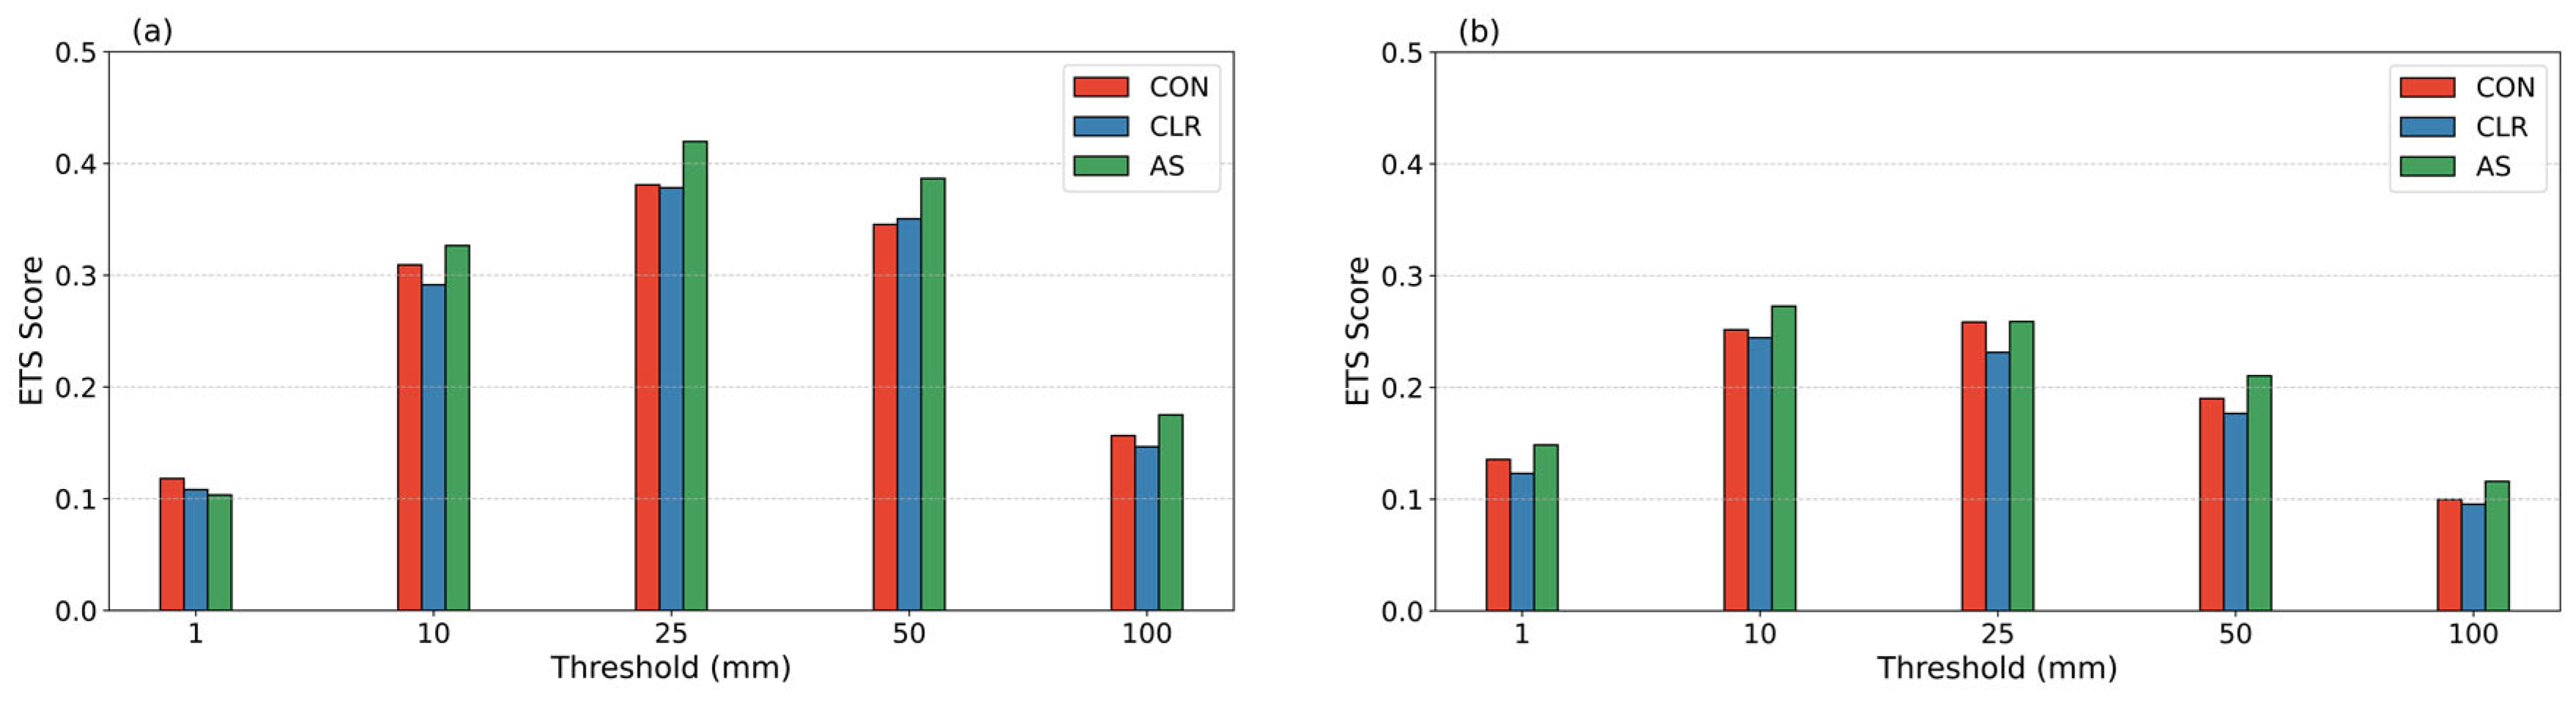
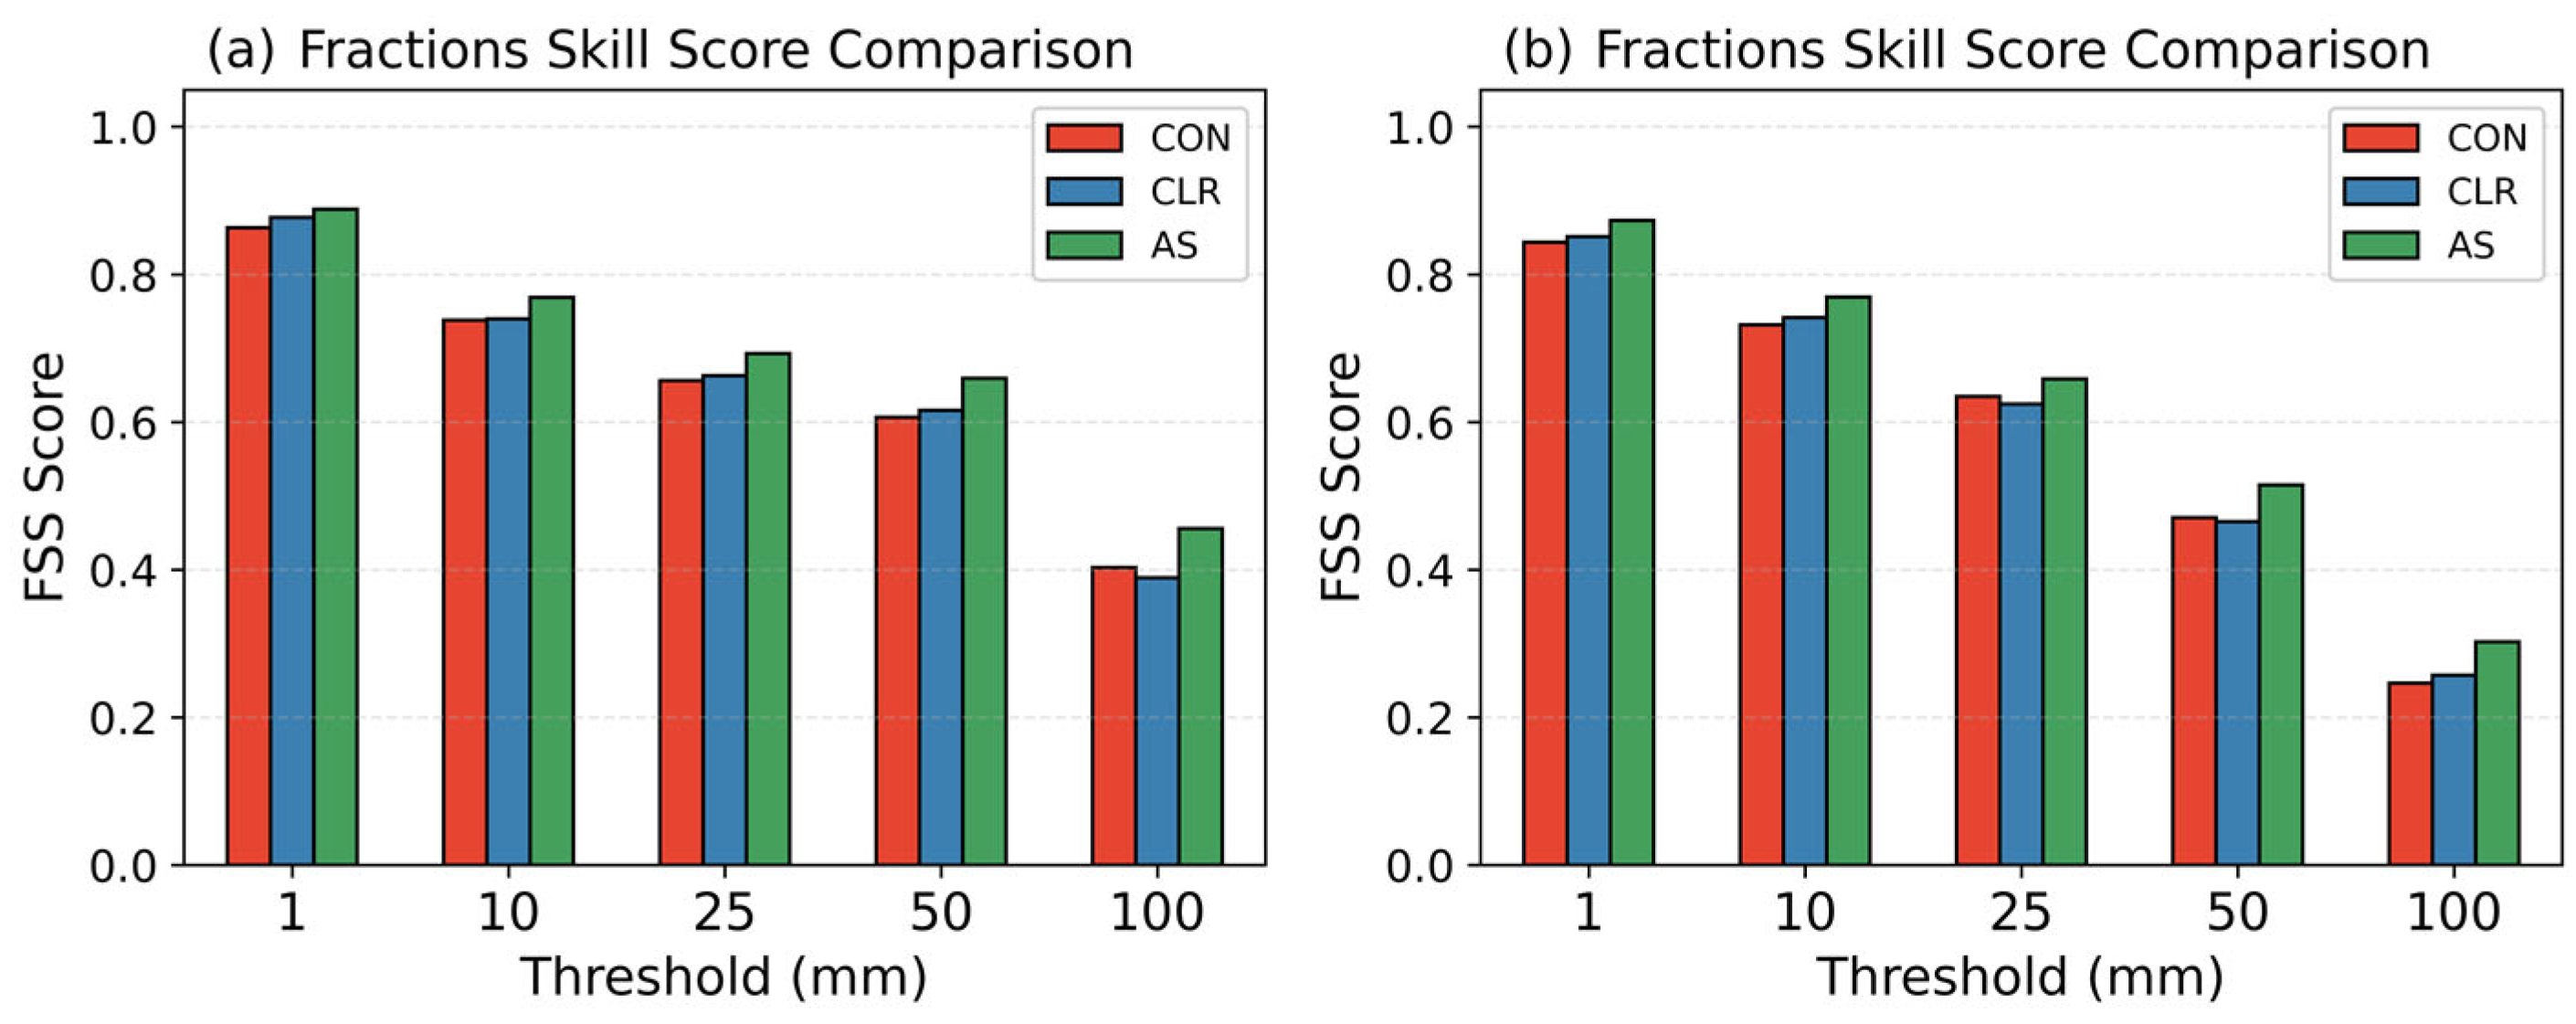
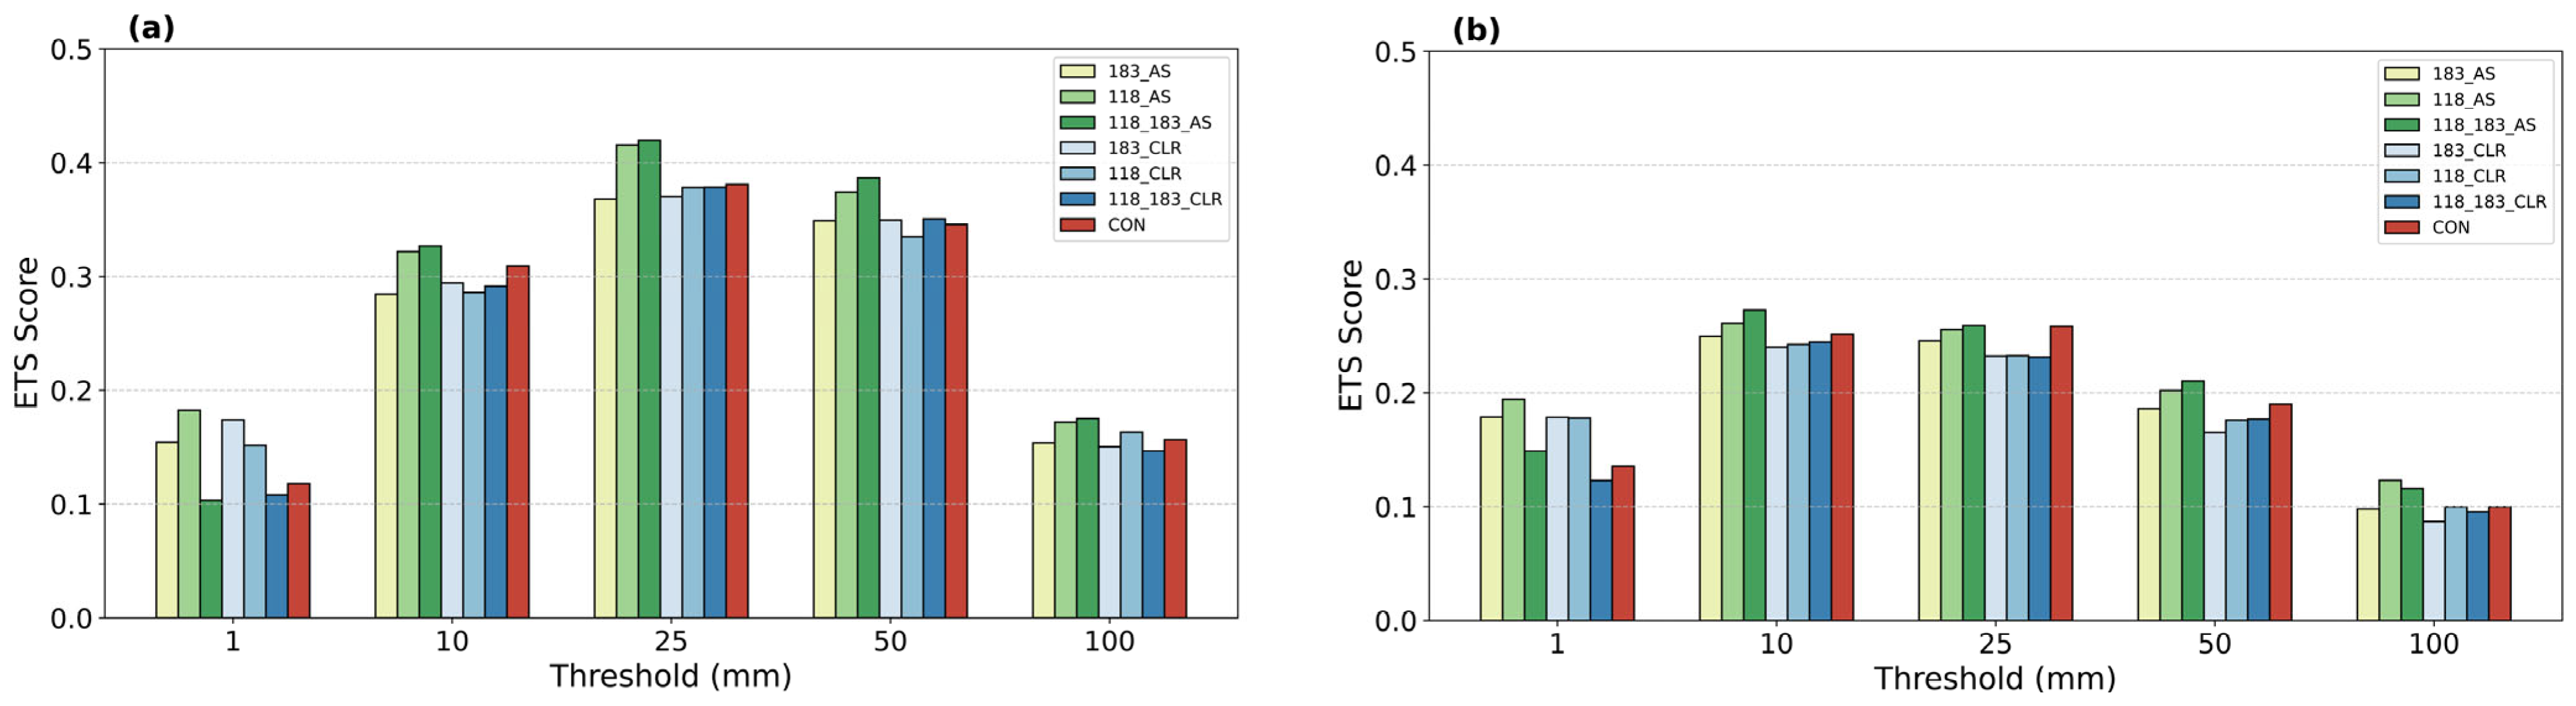
4.1.3. Precipitation Forecast

From 0000 UTC on 5 September to 0000 UTC on 8 September 2024, Typhoon Yagi brought accumulated precipitation amounts of 300 to 500 mm to parts of Hainan, Guangdong, and Guangxi provinces in China (region 1, 2, 4 in Figure 8). Figure 8 shows the spatial distribution of 24 h accumulated precipitation from 0000 UTC on 6 September to 0000 UTC on 8 September 2024. During this period, the model demonstrates visible overestimations in precipitation forecasts. In the 24 h accumulation from 0000 UTC on 6 September to 0000 UTC on 7 September, the CLR experiment shows a precipitation distribution similar to the CON experiment (Figure 8b,c). Compared to the CLR experiment, the AS assimilation experiment (Figure 8d), due to a smaller northward displacement of the predicted typhoon center, results in a narrower coverage of the spiral rainbands over Guangdong and Guangxi provinces, with rainfall locations more consistent with observations. In the subsequent 24 h period from 0000 UTC on 7 September to 0000 UTC on 8 September, the CON experiment still exhibits clear overestimations (Figure 8f). Although the CLR experiment (Figure 8g) reduces overestimation in Guangdong and Guangxi, it intensifies the overestimation in Yunnan Province (region 3 in Figure 8). Meanwhile, the AS experiment (Figure 8h) further reduces excessive precipitation in Guangdong and Guangxi and does not exhibit overestimation in Yunnan Province, indicating that the all-sky assimilation produces more accurate forecasts in both rainfall magnitude and spatial distribution.
To quantify this improvement, the Equitable Threat Score (ETS) is calculated for all three experiments. ETS is a widely used metric for evaluating binary precipitation forecasts by measuring improvement over random forecasts. Figure 9 shows that the performance advantage of the AS experiment is evident. Compared to the CLR experiment, the AS experiment consistently yields higher ETSs for thresholds greater than 10 mm. Moreover, as the accumulated precipitation threshold increases, the ETS of the AS experiment exceeds that of the CLR experiment by approximately 10% to 20%, indicating that all-sky assimilation offers a more pronounced advantage in forecasting extreme precipitation. Between 0000 UTC 6 September and 0000 UTC 7 September (Figure 9a), the ETS of the AS experiment exceeds that of the CLR experiment by at least 10.29% (0.036), and this advantage further increases with higher thresholds, reaching a maximum of 19.47% (0.029). On the following day (0000 UTC 7 September to 0000 UTC 8 September 2024, Figure 9b), the AS experiment still maintains an improvement of at least 11.53% (0.028) over the CLR experiment, with the maximum reaching 21.33% (0.020). This improvement may result from better adjustments to temperature and moisture fields, which correspond to lower RMSE in the forecasts of temperature and specific humidity in the AS experiment (Figure 7c,d,g,h).
The study also found that during the period from 0000 UTC on 7 September to 0000 UTC on 8 September 2024, the ETS of the CLR experiment was lower than that of the CON experiment. To avoid the potential bias introduced by the inherent limitations of ETS (high sensitivity to spatial displacement), the Fraction Skill Score (FSS) was used as an objective alternative for evaluation. The FSS is defined as [43]:
F S S = 1 1 N i = 1 N ( P f i P o i ) 2 1 n [ i = 1 N P f i 2 + i = 1 N P o i 2 ]
P f i and P o i represent the forecasted and observed probabilities at the i -th grid point exceeding a given threshold, and N is the total number of grid points in the verification region. The F S S ranges from 0 (no overlap) to 1 (perfect overlap) between forecasted and observed precipitation areas. Figure 10 shows the FSSs for all experiments. Under this more balanced verification metric, the CLR experiment demonstrated better forecast performance than the CON experiment across most precipitation thresholds. The superior performance of the AS experiment is still evident.

4.2. Channel Sensitivity

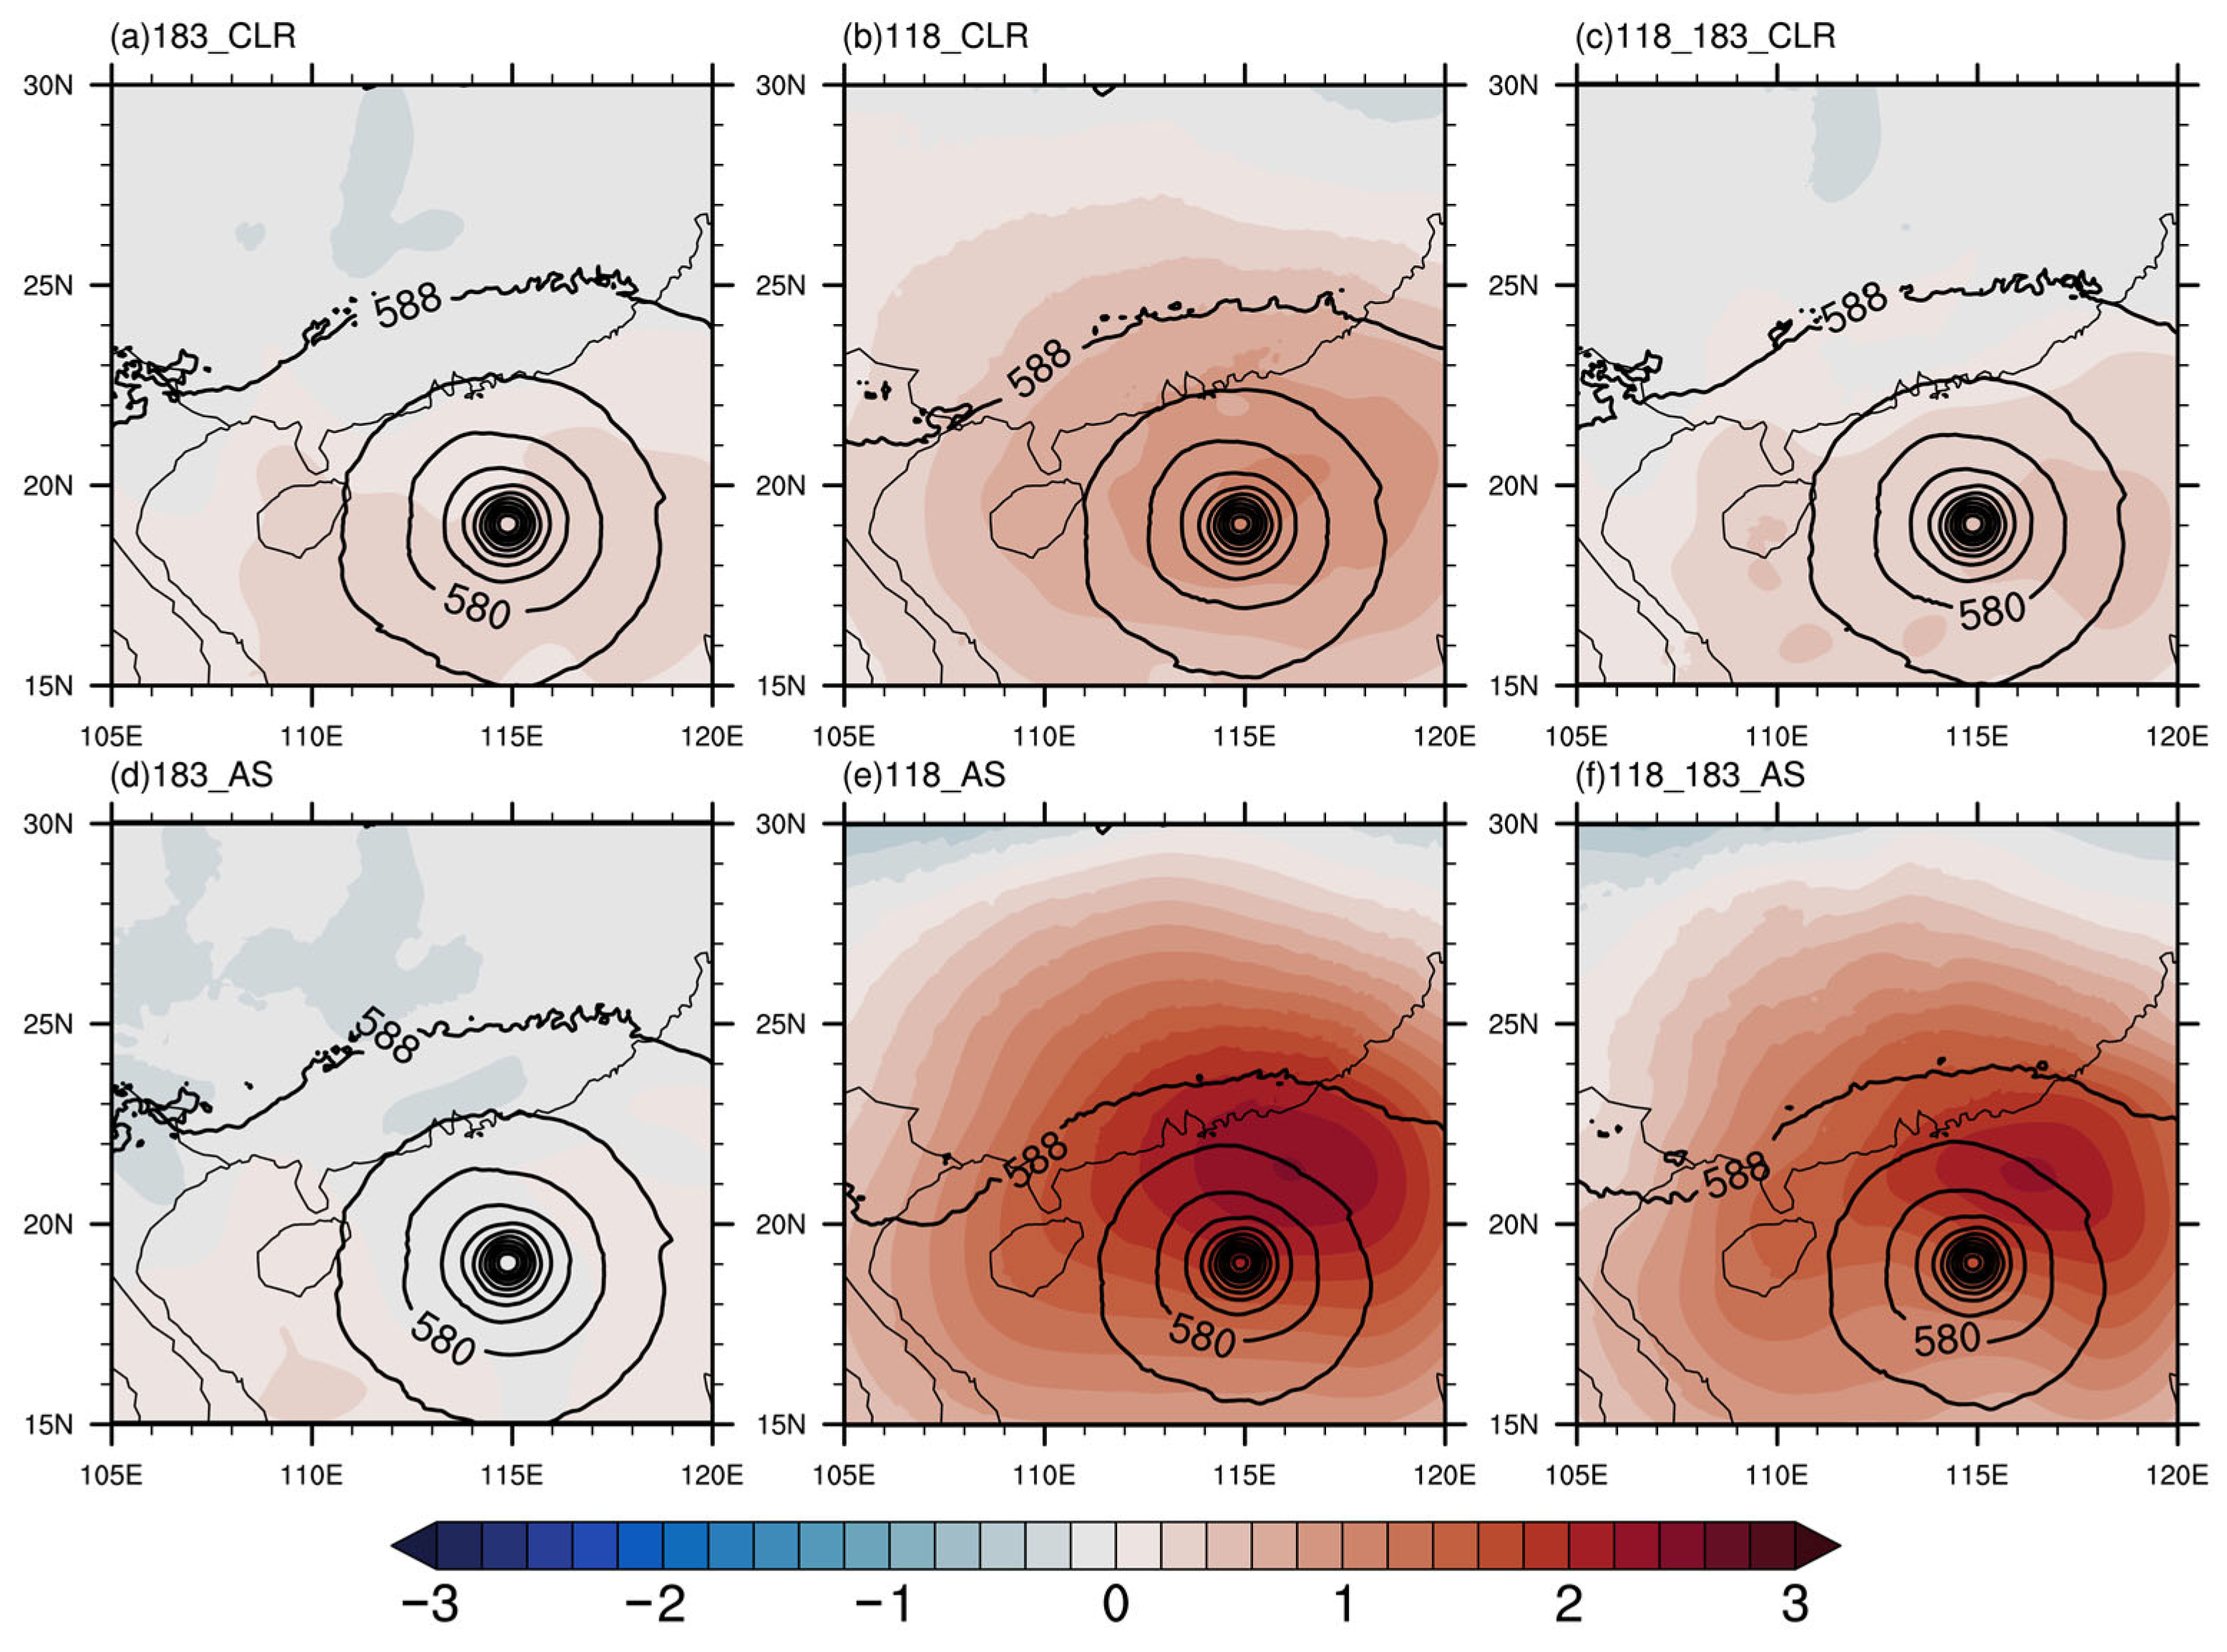
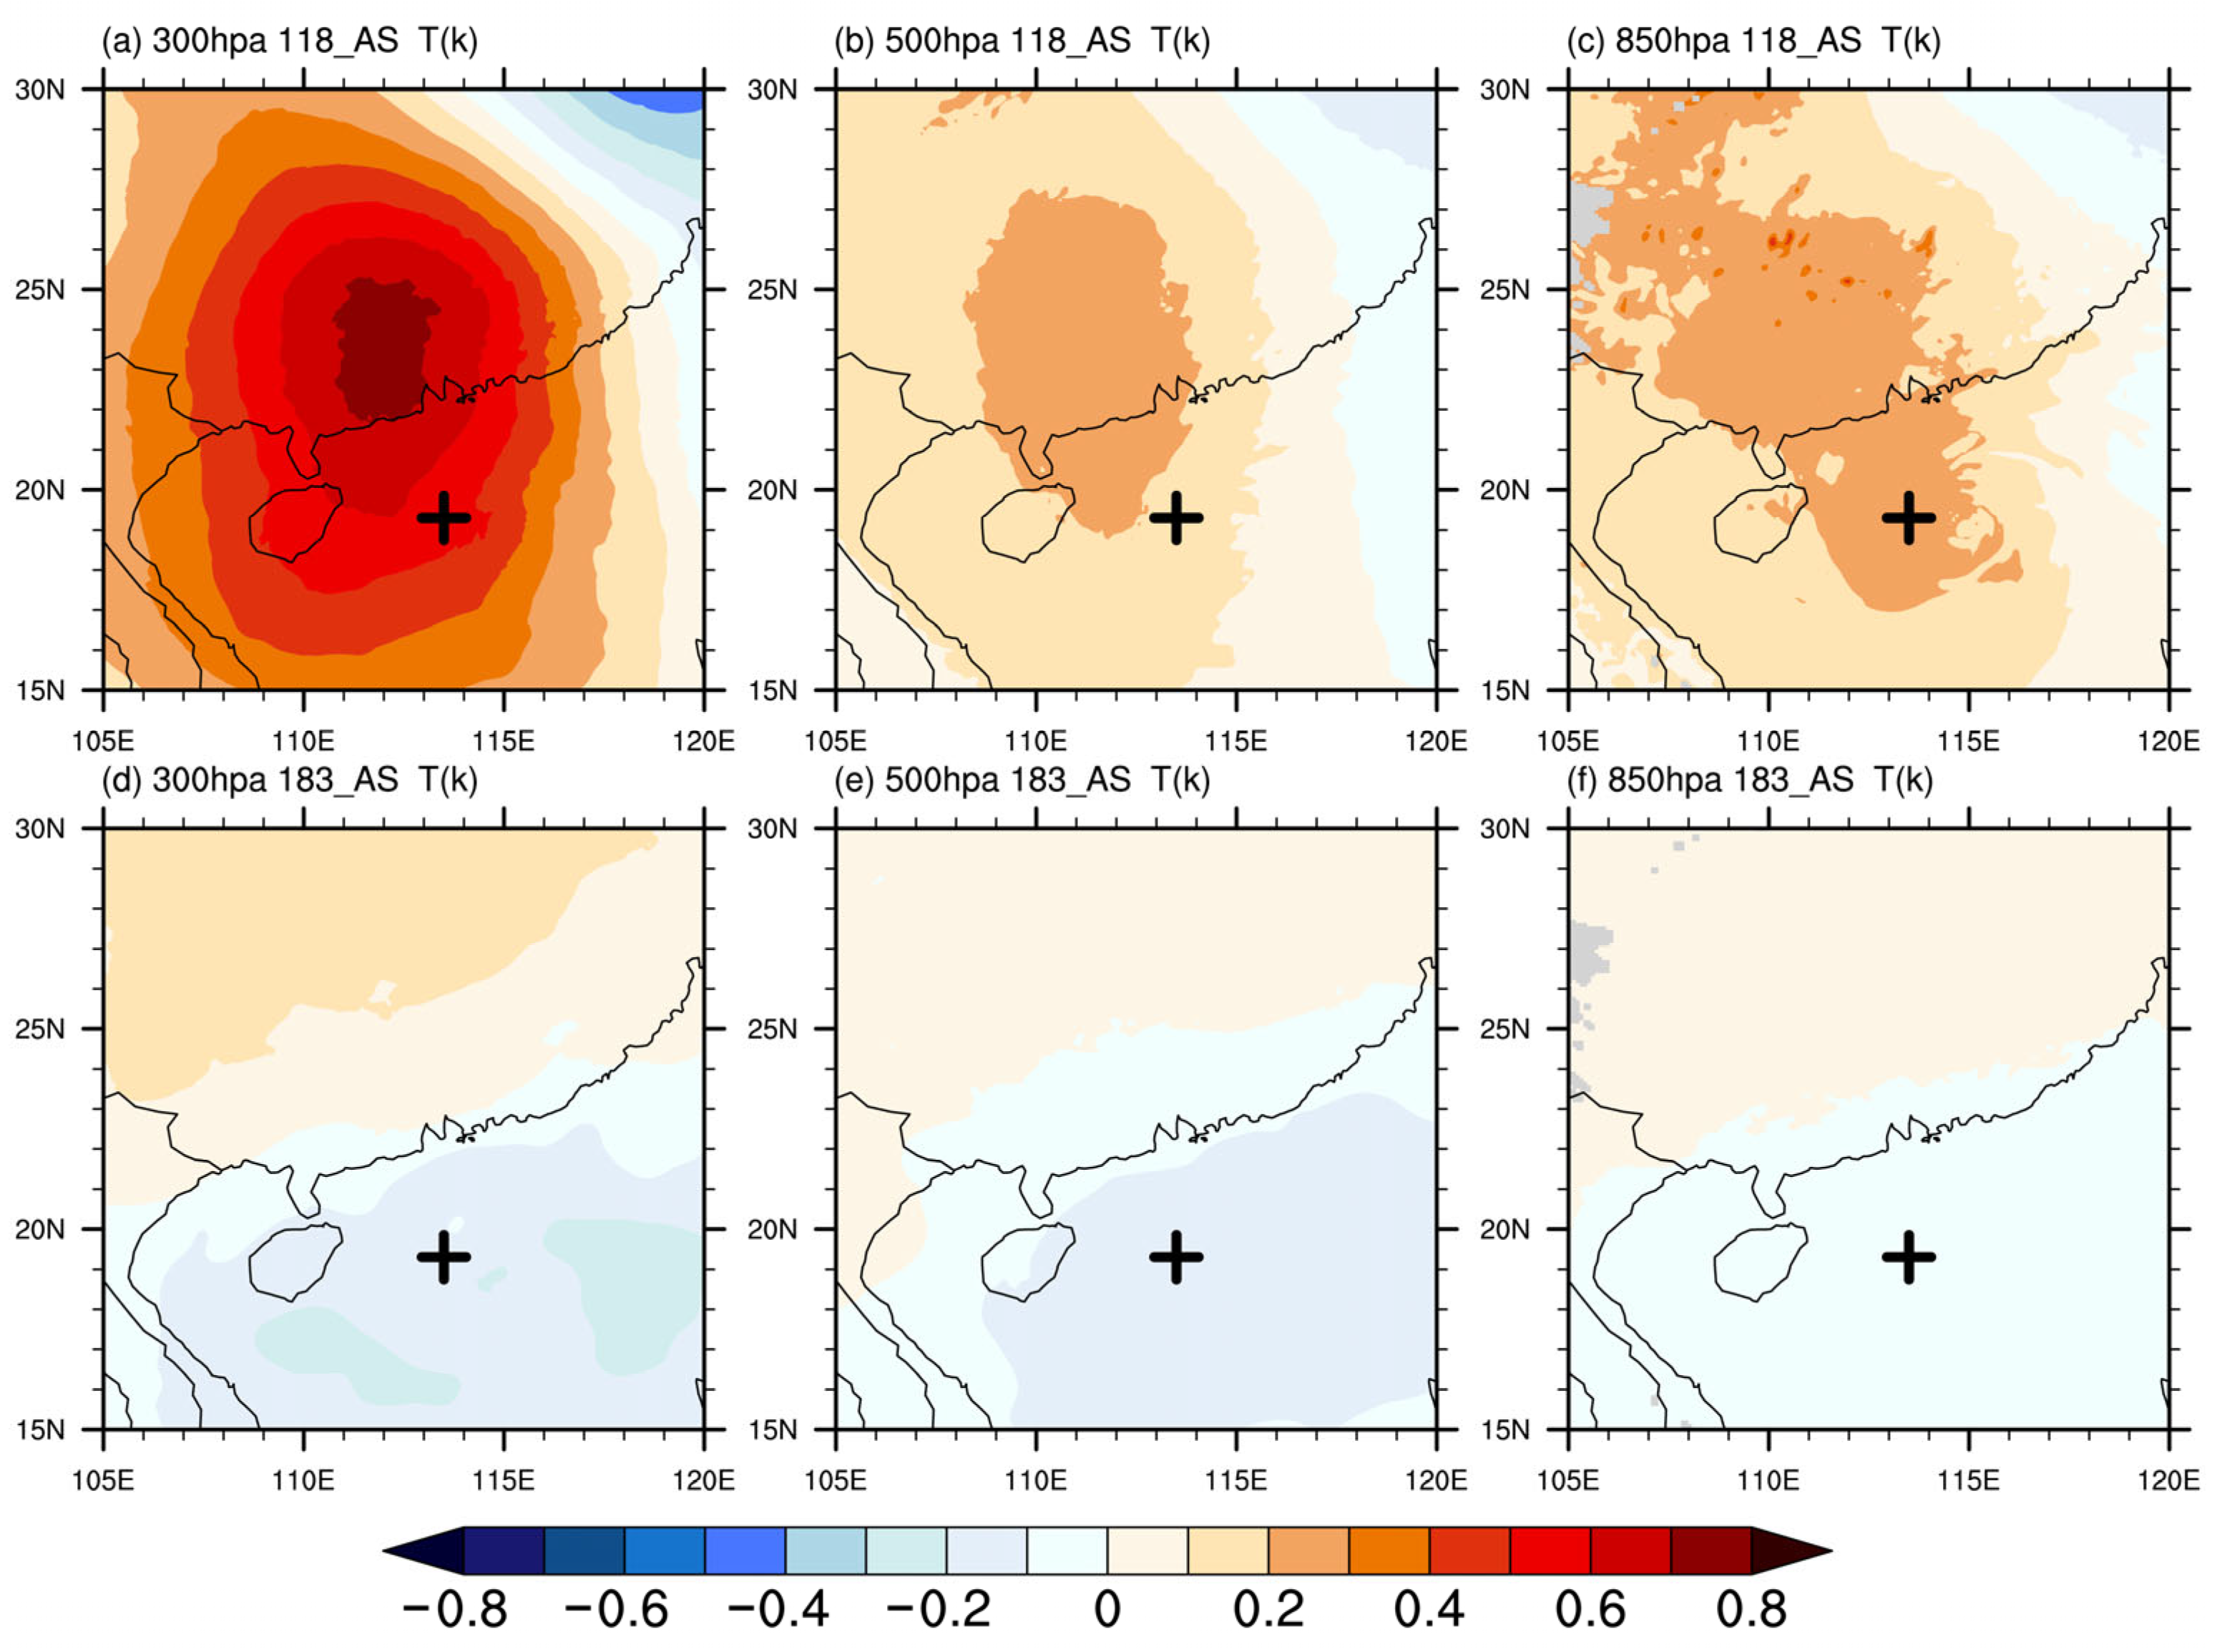
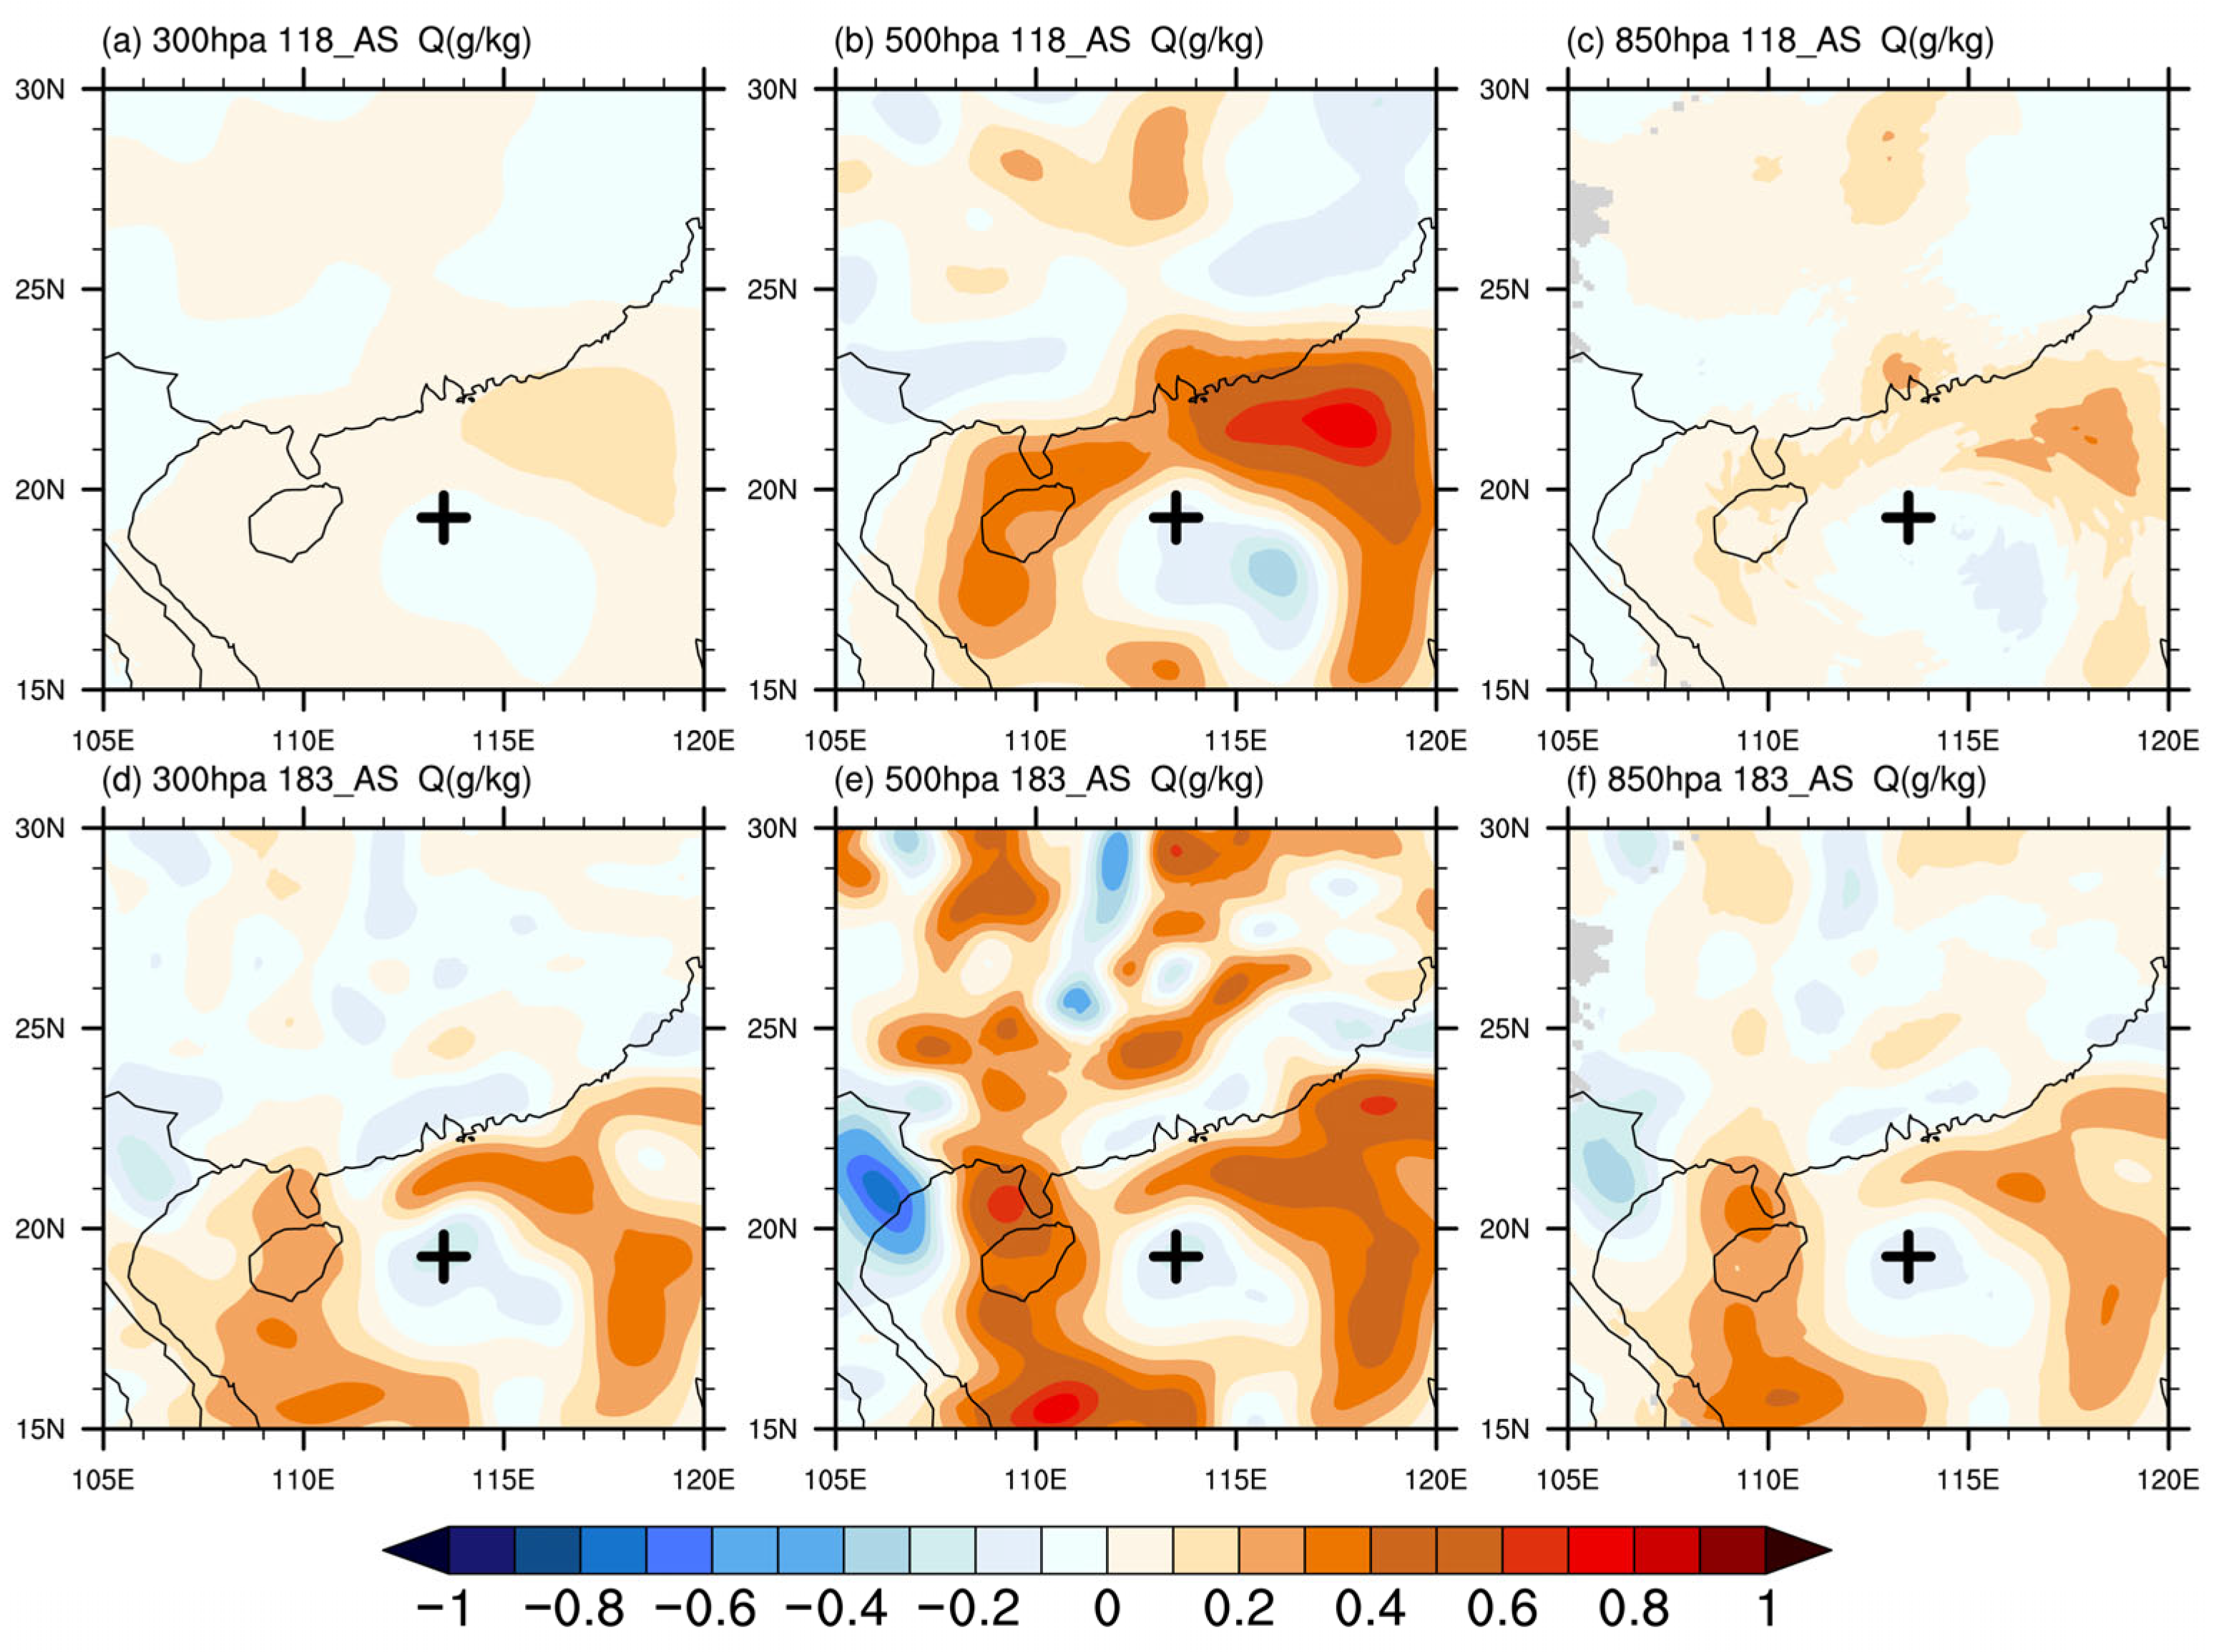
4.2.1. Comparison of Analysis Increments

The 118 GHz channels of FY-3F MWHS-II, designed for oxygen absorption, are highly sensitive to atmospheric temperature, whereas the 183 GHz channels, targeting water vapor absorption, are more responsive to clouds and precipitation. To compare the impact of all-sky assimilation from these two types of channels on typhoon forecasts, additional sensitivity experiments were conducted. Figure 11 illustrates the geopotential height increments from six assimilation experiments—three under clear-sky conditions (118_CLR, 183_CLR, 118_183_CLR) and three with all-sky assimilation (118_AS, 183_AS, 118_183_AS). Under clear-sky assimilation, the 118_CLR experiment (Figure 11b) produces a positive increment northeast of the typhoon center, which is not present in the other two clear-sky experiments. This positive increment becomes more pronounced in the all-sky assimilation experiments using 118 GHz (118_AS) and 118_183 GHz (118_183_AS) channels (Figure 11e,f). The enhancement of positive increments in the northeastern part of Typhoon Yagi contributes to the southward shift in the subtropical high, effectively limiting the northward deviation of the typhoon and correcting its track forecast. From the perspective of geostrophic adjustment theory, the positive impact of assimilating the observations from the 118 GHz temperature-sensitive channels can be further explained. In synoptic-scale motion, the wind field tends to adjust to the pressure field, and based on the hydrostatic balance and the ideal gas law, the distribution of pressure is closely related to the temperature field. Therefore, assimilating temperature channel observations can directly optimize the configuration of the pressure field, enhancing the simulation of large-scale atmospheric motions. Previous studies have also shown that temperature features have a more significant influence on synoptic-scale systems compared to moisture [44,45].
Temperature and moisture play critical roles by shaping the typhoon’s warm-core structure through latent heat release, thereby affecting intensity forecasts. The 118 GHz and 183 GHz channels are specifically designed to detect temperature and moisture, and their distinct sensitivities to atmospheric state variables and vertical levels may lead to different assimilation effects. To compare their impact, additional sensitivity experiments are conducted. Figure 12 and Figure 13 present the temperature and moisture analysis increments at various pressure levels from two all-sky assimilation experiments (118_AS and 183_AS), following the numerical ordering of the figure labels. The 118 GHz channel, mainly designed for temperature sensing, produces temperature analysis increments at all three examined levels, with the largest increment appearing at 300 hPa (Figure 12a), matching the peak levels of the weighting functions for channels 5 and 6. These results reflect the vertical sensitivity of the channel to temperature and are consistent with the weighting function profiles of the MWHS-II instrument. The temperature increments in the 118_AS experiment help bring the mid-to-upper tropospheric temperatures closer to observations, contributing to a better representation of the typhoon’s warm-core structure.
The 183 GHz channel, as a traditional water vapor absorption band, exhibits high sensitivity to humidity, which is evident in the moisture analysis increments across different levels in the 183_AS experiment (Figure 13). The increment is most pronounced in the mid-troposphere around 500 hPa (Figure 13e), corresponding to the peak of the weighting function for the 183 GHz frequency, as shown earlier in Figure 1. Although primarily designed to detect humidity, the 183 GHz channel also shows some sensitivity to temperature, especially under hydrometeor scattering conditions, resulting in slight temperature increments in the lower to mid-troposphere (Figure 12f). However, these increments are of small magnitude and may have a limited impact on forecasts. Meanwhile, mid-tropospheric water vapor serves as a key energy source for typhoon development. Through condensation into hydrometeors, especially cloud water, latent heat is released, thereby promoting storm intensification [46,47]. This sequence of physical processes highlights how moisture-sensitive channels, such as the 183 GHz band, enhance microphysical processes and provide favorable conditions for intensifying typhoons.

4.2.2. Forecasts Comparison

Figure 14a–d present the typhoon forecast results from three all-sky assimilation experiments: 118_AS, 183_AS, and 118_183_AS. As shown in Figure 14a,b, the 183_AS experiment produces the largest track errors, generally exceeding 120 km. The 118_AS experiment yields the smallest errors, and the 118_183_AS experiment falls in between. For both the 118_AS and 183_AS experiments, the track errors mostly remain below 120 km, with the 118_AS experiment achieving an additional average reduction of approximately 5 km compared to the 183_AS experiment. This comparison further supports the conclusion that the observations from the 118 GHz channel play a primary role in improving typhoon track forecasts by adjusting the dynamical structure in the initial field and reducing the northward deviation of the storm. In terms of intensity, the 118_183_AS experiment provides the best overall improvement in minimum sea level pressure and maximum wind speed forecasts (Figure 14c,d). This enhancement becomes more apparent during the rapid intensification of Typhoon Yagi around 1800 UTC on 6 September 2024. The mean SLP error in the 118_183_AS experiment is reduced by 0.13 hPa compared to 183_AS and by 0.67 hPa compared to 118_AS. For maximum wind speed, the mean error is reduced by 1.28 m/s compared to 183_AS and by 0.44 m/s relative to 118_AS. The combined assimilation observations from both channels increase the volume of assimilated observations and enhance the representation of water vapor and temperature structures in the initial field. This leads to improved simulation of thermodynamic and dynamic processes associated with the typhoon. Such improvement is particularly notable during the rapid intensification stage, where the joint assimilation further supports the formation of the warm-core structure and surrounding circulation, contributing to more accurate intensity forecasts.
Figure 15a,b presents the ETSs of 24 h accumulated precipitation forecasts from all channel assimilation experiments for the period from 0000 UTC 6 September to 0000 UTC 8 September 2024. The results show that the 183_AS experiment provides limited improvement over the 183_CLR experiment on 6–7 September and only begins to show some advantage on 7–8 September. Based on the analysis increments of specific humidity and the precipitation forecast results, the study concludes that although the 183 GHz all-sky assimilation improves the humidity field and contributes to better precipitation intensity prediction, this improvement cannot fully correct the displacement in rainfall caused by inaccurate typhoon track forecasts. As a result, the ETSs remain low. In contrast, the 118_AS experiment effectively improves the typhoon track forecast, leading to a more accurate simulation of rainfall distribution around the storm, which helps reduce the spatial error in precipitation and results in ETSs that are 8.7% (0.016) higher than those of the 183_AS experiment for precipitation thresholds above 10 mm. In the 118_183_AS experiment, the observations from 118 GHz channels ensure relatively accurate positioning of rainfall, while the added contribution of the 183 GHz channel helps refine the moisture field, enabling the model to improve the accuracy of precipitation intensity on top of the spatial accuracy. Under the combined influence of these two factors, the 118_183_AS experiment ultimately achieves the highest ETSs among all assimilation experiments, with higher ETS of 13.12% (0.024) over the 183_AS experiment and 4.10% (0.008) over the 118_AS experiment for precipitation thresholds above 10 mm. These findings demonstrate that the joint assimilation of the observations from both channels successfully leverages their respective strengths. The complementary, vertical sensitivities of the two channels enhance the representation of key atmospheric variables such as moisture and temperature in the initial conditions, which not only improves typhoon forecast accuracy but also strengthens the model’s ability to predict precipitation.
To further examine whether the temperature and humidity increments in the analysis field influenced the subsequent forecasts, the study also presents the RMSE profiles of wind, temperature, and specific humidity over the simulation domain at 24 h (Figure 16a–d) and 48 h (Figure 16e–h) forecast lead times after all-sky assimilation. As shown in Figure 16c,g, the forecast temperature RMSE of the 118_AS experiment is, respectively, 0.042 K and 0.079 K lower than that of the 183_AS experiment above 400 hPa, which is consistent with the earlier comparison of their respective analysis increments. Channels 5–6 of the 118 GHz band are sensitive to the middle and upper troposphere (Figure 1), and this is reflected in the strong positive temperature increments at high altitudes in the analysis field (Figure 12a), allowing the forecasts based on the 118_AS experiment analysis to remain closer to real atmospheric conditions. In addition, the 118_AS experiment yields zonal and meridional wind RMSE values that are 0.54 m/s and 0.46 m/s smaller than those of the 183_AS experiment at 24 h forecast and 0.52 m/s and 0.19 m/s at 48 h forecast (Figure 16a,b,e,f). These results indicate that the improved wind forecasts in all-sky assimilation are primarily driven by the assimilation of the observations from the 118 GHz channel. This channel not only improves the wind field but also effectively corrects the mid-to-upper level temperature field, thereby enhancing the representation of the typhoon’s thermal and dynamical structure and enabling the forecast to better capture the rapid intensification process. On the other hand, as a water vapor sounding channel, the 183_AS experiment shows superior performance in specific humidity forecasts, with RMSE values approximately 0.14 g/kg (24 h) and 0.08 g/kg (48 h) lower than those of the 118_AS case (Figure 16d,h), particularly in the lower and middle troposphere. This pattern is consistent with the moisture increments observed in the analysis fields (Figure 13e,f). The difference in forecast performance between the two channels is largely attributed to their distinct vertical sensitivities and the specific atmospheric variables they detect. These characteristics have a persistent impact on forecast outcomes. The observations from the 118 GHz channel excel in improving mid-to-upper pressure level temperature and wind fields, thus enhancing the simulation of the typhoon’s thermodynamic and dynamic structure, while the observations from the 183 GHz channel provide stronger constraints on low-level moisture, improving thermal conditions and contributing to typhoon intensification and rainfall prediction. The joint assimilation of the observations from both channels takes full advantage of their respective strengths: the observations from the 118 GHz channel enhance track prediction and warm-core structure through temperature and wind optimization in the upper layers, while the observations from the 183 GHz channel enhance moisture transport and latent heat release through improved humidity fields in the lower atmosphere. As a result, the combined assimilation strategy leads to coordinated improvements in both typhoon intensity changes and rainfall forecasts, effectively enhancing the overall forecast skill.

5. Discussion

As an exploratory study evaluating the all-sky assimilation of MWHS-II radiance from the FengYun-3F satellite for typhoon forecasting, we successfully demonstrated its potential capability in improving three track and intensity forecasts of the typhoon and revealed the influence of channel sensitivity on assimilation performance. However, some limitations remain in this study.
Firstly, the early forecasts after all-sky assimilation showed suboptimal performance in certain individual metrics. For instance, the early-period prediction of the minimum sea level pressure during typhoon development was not satisfactory. This may be explained from two aspects. On the one hand, surface emissivity has been demonstrated to interfere with the simulation of brightness temperatures, resulting in negative impacts on the assimilation of surface-related variables [48,49]. Given that all-sky assimilation incorporates a larger volume of observations, the impact of surface emissivity becomes more pronounced. On the other hand, imbalances introduced by the assimilation process may cause the model to take longer to stabilize, during which the forecasts can be highly unstable. This issue is becoming more evident in rapid-cycling assimilation systems [50].
Secondly, the all-sky symmetric observation error model for all-sky assimilation requires further improvement. The application of the all-sky symmetric observation error model helps to reduce the impact of representativeness errors and ensures the quality of data. However, the current all-sky symmetric observation error model still has room for further investigation and improvement. Factors such as the terrain characteristics, weather conditions, and the choice of the symmetric cloud factor may all influence the construction of the model. As a result, further developments of the all-sky symmetric observation error model are needed to meet the high-quality data requirements of all-sky assimilation.
Additionally, future work will focus on applying advanced assimilation algorithms, such as four-dimensional variational (4D-Var) assimilation, to the all-sky framework. By incorporating a time window, 4D-Var dynamically aligns observations with the background field, providing a better fit over time. Its ability to capture error growth through model dynamics makes it well-suited for evolving weather systems. The use of an advanced assimilation algorithm is expected to further enhance the effectiveness of all-sky assimilation.

6. Conclusions

This study developed the all-sky assimilation capacity for FengYun-3F MWHS-II radiance based on the WRFDA system. The impact of FY-3F MWHS-II all-sky assimilation on typhoon forecasts was systematically evaluated, with particular attention to the response characteristics of different channels to vertical layers and atmospheric state variables, as well as the forecasting implications of channel selection. The main findings are summarized as follows.
  • Model forecasts based on the all-sky assimilation analysis of FY-3F MWHS-II radiance provided a more realistic simulation of Typhoon Yagi (2024) in closer agreement with observations. The all-sky assimilation experiment demonstrated a more robust performance compared to the clear-sky assimilation. The average errors in track, minimum sea level pressure, and max wind speed were substantially lower (31.8 km, 0.18 hPa, and 1.33 m/s), and the ETSs for the typhoon precipitation were 10–20% higher at thresholds above 10 mm. These results indicate that assimilating satellite radiance from cloud-covered regions improves forecast stability and accuracy.
  • All-sky assimilation experiments using observations from different channels show varying impacts on forecasting the typhoon’s dynamic and thermal structures. Observations from the temperature-sensitive 118 GHz channel primarily improve the dynamical structure by adjusting the geopotential height field and suppressing the typhoon’s northward displacement. In contrast, the 183 GHz channel regulates moisture in the initial field, enhancing latent heat release and thermodynamic energy, which supports stronger intensity forecasts and increased rainfall.
  • Joint all-sky assimilation of 118 GHz and 183 GHz channel observations leverages their complementary strengths, providing stronger constraints on atmospheric dynamics and moisture and improving initial analysis and forecast accuracy. Compared to the assimilation of individual channels, the joint all-sky assimilation reduced the minimum sea level pressure error by up to 0.67 hPa and the max wind speed error by up to 1.28 m/s. For precipitation thresholds above 10 mm, ETSs increased by 13.12% relative to the 183 GHz experiment and 4.10% relative to the 118 GHz experiment.

Author Contributions

All authors contributed significantly to the completion of this study and are sincerely acknowledged. T.W. was responsible for technical development, formal analysis, visualization, and writing. W.S. responsible for was responsible for reviewing and editing. F.P. was responsible for supervising. All authors have read and agreed to the published version of the manuscript.

Funding

This research was funded by the National Key Research and Development Program of China (2023YFC3007700, 2023YFC3007504), the National Natural Science Foundation of China (Grant No. 42475013) and the Sichuan Science and Technology Program (2024YFFK0110).

Data Availability Statement

The FY-3F MWHS-2 data and FY-2G brightness temperature product can be obtained freely from the official website of the National Satellite Meteorological Center (NSMC) (https://data.nsmc.org.cn/DataPortal/cn/data/structure.html, accessed on 27 April 2025). The ECMWF analysis and the NCEP reanalysis data can be downloaded from official websites (https://cds.climate.copernicus.eu/datasets/derived-era5-pressure-levels-daily-statistics?tab=overview, accessed on 27 April 2025) and (https://rda.ucar.edu/datasets/d083002/, accessed on 27 April 2025), respectively. CLDAS near real-time products can be downloaded from the Meteorological Science Data Sharing Center of the China Meteorological Administration (CMA) (https://data.cma.cn/, accessed on 27 April 2025).

Acknowledgments

We thank the technical support of the National Large Scientific and Technological Infrastructure” Earth System Numerical Simulation Facility” (https://cstr.cn/31134.02.EL, accessed on 27 April 2025).

Conflicts of Interest

The authors declare no conflicts of interest.

References

  1. Bennartz, R.; Bauer, P. Sensitivity of microwave radiances at 85–183 GHz to precipitating ice particles. Radio Sci. 2003, 38, 8075. [Google Scholar] [CrossRef]
  2. Wylie, D.P.; Menzel, W.P. Eight years of high cloud statistics using HIRS. J. Clim. 1999, 12, 170–184. [Google Scholar] [CrossRef]
  3. Ohring, G.; Bauer, P. The use of cloud and precipitation observations in data assimilation (CPDA). Q. J. R. Meteorol. Soc. 2011, 137, 1933. [Google Scholar] [CrossRef]
  4. Liu, Z.; Schwartz, C.S.; Snyder, C.; Ha, S. Impact of assimilating AMSU-A radiances on forecasts of 2008 Atlantic tropical cyclones initialized with a limited-area ensemble Kalman filter. Mon. Weather Rev. 2012, 140, 4017–4034. [Google Scholar] [CrossRef]
  5. Bao, Y.; Xu, J.; Powell, A.M., Jr.; Shao, M.; Min, J.; Pan, Y. Impacts of AMSU-A, MHS and IASI data assimilation on temperature and humidity forecasts with GSI–WRF over the western United States. Atmos. Meas. Tech. 2015, 8, 4231–4242. [Google Scholar] [CrossRef]
  6. Newman, K.M.; Schwartz, C.S.; Liu, Z.; Shao, H.; Huang, X. Evaluating forecast impact of assimilating Microwave Humidity Sounder (MHS) radiances with a regional ensemble Kalman filter data assimilation system. Weather Forecast. 2015, 30, 964–983. [Google Scholar] [CrossRef]
  7. Shu, A.; Xu, D.; Zhang, S.; Shen, F.; Zhang, X.; Song, L. Impacts of multi-source microwave satellite radiance data assimilation on the forecast of Typhoon Ampil. Atmosphere 2022, 13, 1427. [Google Scholar] [CrossRef]
  8. Fang, D.; Chen, G.; Xu, X.; Zhao, Y.; Wang, Z. Evaluating clear-sky assimilation of FengYun-3E microwave radiance data in predicting multiple tropical cyclones over the Western North Pacific. Atmos. Res. 2025, 320, 108025. [Google Scholar] [CrossRef]
  9. Bauer, P.; Geer, A.J.; Lopez, P.; Salmond, D. Direct 4D-Var assimilation of all-sky radiances. Part I: Implementation. Q. J. R. Meteorol. Soc. 2010, 136, 1868–1885. [Google Scholar] [CrossRef]
  10. Geer, A.J.; Bauer, P. Observation errors in all-sky data assimilation. Q. J. R. Meteorol. Soc. 2011, 137, 2024–2037. [Google Scholar] [CrossRef]
  11. Zhang, M.; Zupanski, M.; Kim, M.; Knaff, J.A. Assimilating AMSU-A radiances in the TC core area with NOAA operational HWRF (2011) and a hybrid data assimilation system: Danielle (2010). Mon. Weather Rev. 2013, 141, 3889–3907. [Google Scholar] [CrossRef]
  12. Yang, C.; Liu, Z.; Bresch, J.; Rizvi, S.R.H.; Huang, X.-Y.; Min, J. AMSR2 all-sky radiance assimilation and its impact on the analysis and forecast of Hurricane Sandy with a limited-area data assimilation system. Tellus A Dyn. Meteorol. Oceanogr. 2016, 68, 30917. [Google Scholar] [CrossRef]
  13. Xian, Z.; Chen, K.; Zhu, J. All-sky assimilation of the MWHS-2 observations and evaluation of the impacts on the analyses and forecasts of binary typhoons. J. Geophys. Res. Atmos. 2019, 124, 6359–6378. [Google Scholar] [CrossRef]
  14. Wang, J.; Zhang, L.; Guan, J.; Zhang, M. Comparison of assimilating all-sky and clear-sky satellite radiance for Typhoon Chan-Hom and Nangka forecasts. Atmosphere 2020, 11, 599. [Google Scholar] [CrossRef]
  15. Fabry, F.; Sun, J. For how long should what data be assimilated for the mesoscale forecasting of convection and why? Part I: On the propagation of initial condition errors and their implications for data assimilation. Mon. Weather Rev. 2010, 138, 242–255. [Google Scholar] [CrossRef]
  16. Geer, A.J.; Bormann, N.; English, S. All-Sky Assimilation of Microwave Humidity Sounders; ECMWF Technical Memoranda; European Centre for Medium-Range Weather Forecasts: Reading, UK, 2014; p. 741. Available online: https://www.ecmwf.int/en/elibrary/74553-all-sky-assimilation-microwave-humidity-sounders (accessed on 25 April 2025).
  17. Zhu, Y.; Liu, E.; Mahajan, R.; Thomas, C.; Groff, D.; Van Delst, P.; Collard, A.; Kleist, D.; Treadon, R.; Derber, J.C. All-sky microwave radiance assimilation in NCEP’s GSI analysis system. Mon. Weather Rev. 2016, 144, 4709–4735. [Google Scholar] [CrossRef]
  18. Xu, D.; Huang, L.; Min, J.; Jiang, L.; Shen, F.; Lei, Y. Impacts of the all-sky assimilation of FY-3D and FY-3E MWHS-2 radiances on analyses and forecasts of Typhoon Muifa (2022). Atmos. Res. 2024, 310, 107646. [Google Scholar] [CrossRef]
  19. Weng, F. Advances in radiative transfer modeling in support of satellite data assimilation. J. Atmos. Sci. 2007, 64, 3799–3807. [Google Scholar] [CrossRef]
  20. Weng, F.; Liu, Q. Satellite data assimilation in numerical weather prediction models. Part I: Forward radiative transfer and Jacobian modeling in cloudy atmospheres. J. Atmos. Sci. 2003, 60, 2633–2646. [Google Scholar] [CrossRef]
  21. Bauer, P.; Moreau, E.; Chevallier, F.; O’Keeffe, U. Multiple-scattering microwave radiative transfer for data assimilation applications. Q. J. R. Meteorol. Soc. 2006, 132, 1259–1281. [Google Scholar] [CrossRef]
  22. Bi, M.; Zou, X. Comparison of cloud/rain band structures of Typhoon Muifa (2022) revealed in FY-3E MWHS-2 observations with all-sky simulations. J. Geophys. Res. Atmos. 2023, 128, e2023JD039410. [Google Scholar] [CrossRef]
  23. Eyre, J.R. Assimilation of satellite data in numerical weather prediction. Part II: Recent years. Q. J. R. Meteorol. Soc. 2021, 148, 521–556. [Google Scholar] [CrossRef]
  24. Xiao, H.; Li, J.; Liu, G.; Wang, L.; Bai, Y. Assimilation of AMSU-A surface-sensitive channels in CMA_GFS 4D-Var system over land. Weather Forecast. 2023, 38, 1777–1790. [Google Scholar] [CrossRef]
  25. Carminati, F.; Migliorini, S. All-sky Data Assimilation of MWTS-2 and MWHS-2 in the Met Office Global NWP System. Adv. Atmos. Sci. 2021, 38, 1682–1694. [Google Scholar] [CrossRef]
  26. Sun, W.; Xu, Y. Assimilation of FY-3D MWHS-2 radiances with WRF Hybrid-3DVAR system for the forecast of heavy rainfall evolution associated with Typhoon Ampil. Mon. Weather Rev. 2021, 149, 1419–1437. [Google Scholar] [CrossRef]
  27. Chen, K.; Chen, Z.; Xian, Z.; Li, G. Impacts of the all-sky assimilation of FY-3C and FY-3D MWHS-2 radiances on analyses and forecasts of Typhoon Hagupit. Remote Sens. 2023, 15, 2279. [Google Scholar] [CrossRef]
  28. Xiao, H.; Han, W.; Zhang, P.; Bai, Y. Assimilation of data from the MWHS-II onboard the first early morning satellite FY-3E into the CMA global 4D-Var system. Meteorol. Appl. 2023, 30, e2133. [Google Scholar] [CrossRef]
  29. Xie, X.; Guo, Y.; He, J.; Yu, X.; Hu, A.; Gu, S. Calibration of Microwave Humidity Sounder-II onboard FengYun-3F in pre/postlaunch phases. IEEE Trans. Geosci. Remote Sens. 2024, 62, 5302009. [Google Scholar] [CrossRef]
  30. Lawrence, H.; Bormann, N.; Lu, Q.; Geer, A.; English, S. An Evaluation of FY-3C MWHS-2 at ECMWF. EUMETSAT/ECMWF Fellowship Programme Research Report No. 37; ECMWF: Reading, UK, 2015; Available online: https://www.ecmwf.int/en/elibrary/75346-evaluation-fy-3c-mwhs-2-ecmwf (accessed on 25 April 2025).
  31. Hocking, J.; Rayer, P.; Rundle, D.; Saunders, R. RTTOV v12 Users Guide, NWPSAF-MO-UD-037, NWP SAF; EUMETSAT: Darmstadt, Germany, 2019. [Google Scholar]
  32. Parrish, D.F.; Derber, J.C. The National Meteorological Center’s spectral statistical-interpolation analysis system. Mon. Weather Rev. 1992, 120, 1747–1763. [Google Scholar] [CrossRef]
  33. Geer, A.J.; Bauer, P.; O’Dell, C.W. A revised cloud overlap scheme for fast microwave radiative transfer in rain and cloud. J. Appl. Meteorol. Climatol. 2009, 48, 2257–2270. [Google Scholar] [CrossRef]
  34. Zhan, R.; Feng, J. Causes and predictability of the “explosive” intensification of Super Typhoon Yagi after entering the South China Sea in 2024. Sci. China Earth Sci. 2025, 68, 1298–1302. [Google Scholar] [CrossRef]
  35. Knapp, K.R.; Kruk, M.C.; Levinson, D.H.; Diamond, H.J.; Neumann, C.J. The International Best Track Archive for Climate Stewardship (IBTrACS): Unifying tropical cyclone best track data. Bull. Am. Meteorol. Soc. 2010, 91, 363–376. [Google Scholar] [CrossRef]
  36. Gahtan, J.; Knapp, K.R.; Schreck, C.J.; Diamond, H.J.; Kossin, J.P.; Kruk, M.C. International Best Track Archive for Climate Stewardship (IBTrACS) Project, Version 4r01; NOAA National Centers for Environmental Information: Asheville, NC, USA, 2024; [ALL]. [CrossRef]
  37. Lin, Y.; Farley, R.D.; Orville, H.D. Bulk parameterization of the snow field in a cloud model. J. Appl. Meteorol. Climatol. 1983, 22, 1065–1092. [Google Scholar] [CrossRef]
  38. Kain, J.S. The Kain–Fritsch convective parameterization: An update. J. Appl. Meteorol. 2004, 43, 170–181. [Google Scholar] [CrossRef]
  39. Dudhia, J. Numerical study of convection observed during the winter monsoon experiment using a mesoscale two-dimensional model. J. Atmos. Sci. 1989, 46, 3077–3107. [Google Scholar] [CrossRef]
  40. Mlawer, E.J.; Taubman, S.J.; Brown, P.D.; Iacono, M.J.; Clough, S.A. Radiative transfer for inhomogeneous atmospheres: RRTM, a validated correlated-k model for the longwave. J. Geophys. Res. Atmos. 1997, 102, 16663–16682. [Google Scholar] [CrossRef]
  41. Hu, X.-M.; Klein, P.M.; Xue, M. Evaluation of the updated YSU planetary boundary layer scheme within WRF for wind resource and air quality assessments. J. Geophys. Res. Atmos. 2013, 118, 10490–10505. [Google Scholar] [CrossRef]
  42. Auligné, T.; McNally, A.P.; Dee, D.P. Adaptive bias correction for satellite data in a numerical weather prediction system. Q. J. R. Meteorol. Soc. 2007, 133, 631–642. [Google Scholar] [CrossRef]
  43. Roberts, N.M.; Lean, H.W. Scale-Selective Verification of Rainfall Accumulations from High-Resolution Forecasts of Convective Events. Mon. Weather. Rev. 2008, 136, 78–97. [Google Scholar] [CrossRef]
  44. Sun, W.; Yu, R.; Li, J.; Yuan, W. Three-dimensional circulation structure of summer heavy rainfall in central North China. Weather Forecast. 2015, 30, 238–250. [Google Scholar] [CrossRef]
  45. Sun, W.; Li, J.; Yu, R.; Yuan, W. Circulation structures leading to propagating and non-propagating heavy summer rainfall in central North China. Clim. Dyn. 2018, 51, 3447–3465. [Google Scholar] [CrossRef]
  46. Li, J.; Wang, G.; Lin, W.; He, Q.; Feng, Y.; Mao, J. Cloud-scale simulation study of Typhoon Hagupit (2008) Part II: Impact of cloud microphysical latent heat processes on typhoon intensity. Atmos. Res. 2013, 120–121, 202–215. [Google Scholar] [CrossRef]
  47. Zhao, D.; Yu, Y.; Yin, J.; Wang, W.; Chen, X. Effects of microphysical latent heating on the rapid intensification of Typhoon Hato (2017). J. Meteorol. Res. 2020, 34, 368–386. [Google Scholar] [CrossRef]
  48. Wu, Y.; Qin, Z.; Li, J.; Bai, X. Primary Impact Evaluation of Surface Temperature Observations for Microwave Temperature Sounding Data Assimilation over Land. Remote Sens. 2024, 16, 395. [Google Scholar] [CrossRef]
  49. He, W.; Liu, Z.; Chen, H. Influence of surface temperature and emissivity on AMSU-A assimilation over land. Acta Meteorol. Sin. 2011, 25, 545–557. [Google Scholar] [CrossRef]
  50. Chen, M.; Huang, X.; Wang, W. The WRF-Based Incremental Analysis Updates and Its Implementation in an Hourly Cycling Data Assimilation System. Weather Forecast. 2023, 38, 1063–1078. [Google Scholar] [CrossRef]
Figure 1. Weighting Functions of MWHS-II Channels. The functions were derived using 148,952 observations (77,828 over land and 71,124 over ocean) collected over two weeks in regions affected by Typhoon Yagi (2024). Observations were selected within ±3 h of FY-3F’s daily overpass times and were categorized by surface type.
Remotesensing 17 02056 g001
Figure 2. Standard deviations (dashed lines) and observation errors (solid lines) as a function of symmetric cloud amount for 118 GHz channels 4–7 (blue, green, yellow, red) and 183 GHz channels 11–15 (blue, green, yellow, red, purple); land regions in panels (a,b), ocean regions in panels (c,d).
Remotesensing 17 02056 g002
Figure 3. Track of Typhoon Yagi (2024) from genesis to dissipation (30 August–9 September 2024). Best track data is from the International Best Track Archive for Climate Stewardship (IBTrACS) [35,36].
Remotesensing 17 02056 g003
Figure 4. Spatial distribution of the FY-3F/MWHS-2 observations for Channel 7 (a) and Channel 14 (b) in the clear-sky and all-sky assimilation experiments. The blue points represent observations assimilated in both clear-sky and all-sky experiments. The red points represent additional observations assimilated only in the all-sky experiment. The background shows the brightness temperature product from the FY-2G satellite, derived from the Stretched Visible and Infrared Spin Scan Radiometer-2 (VISSR-2) at 1200 UTC on 5 September 2024.
Remotesensing 17 02056 g004
Figure 5. Spatial distribution of O−B (a,c,e,g) and O−A (b,d,f,h) for Channel 07 (a,b,e,f) and Channel 13 (c,d,g,h) at 1500 UTC on 5 September 2025.
Remotesensing 17 02056 g005
Figure 6. Forecasts for Typhoon Yagi (2024): (a) typhoon tracks, (b) typhoon track errors (km), (c) minimum sea level pressure (MSLP) errors (hPa), and (d) maximum wind speed errors (m/s). The forecast tracks and track errors shown in (a,b) are calculated based on the typhoon center positions.
Remotesensing 17 02056 g006
Figure 7. Vertical RMSE profiles at 24 h (1500 UTC on 6 September 2024; ad) and 48 h (1500 UTC on 7 September 2024; eh) forecast for zonal wind U (a,e), meridional wind V (b,f), temperature T (c,g), and specific humidity Q (d,h), using ERA5 reanalysis as the reference.
Remotesensing 17 02056 g007
Figure 8. Spatial distribution of 24 h accumulated precipitation (mm) during (a) 0000 UTC on 6 September to 0000 UTC on 7 September 2024 (ad), and 0000 UTC on 7 September to 0000 UTC on 8 September 2024 (eh). (1–4), respectively, represent the provinces mainly affected by Typhoon Yagi’s precipitation, namely Guangdong, Guangxi, Yunnan, and Hainan Province. Red boxes highlight the local areas with notable differences among the experiments. The observational data are from the near-real-time CLDAS product provided by the China Meteorological Administration (CMA).
Remotesensing 17 02056 g008
Figure 9. ETSs for 24 h accumulated precipitation during (a) 0000 UTC 6 September to 0000 UTC 7 September 2024, and (b) 0000 UTC 7 September to 0000 UTC 8 September 2024.
Remotesensing 17 02056 g009
Figure 10. FSSs of 24 h accumulated precipitation during (a) 0000 UTC 6 September to 0000 UTC 7 September 2024 and (b) 0000 UTC 7 September to 0000 UTC 8 September 2024.
Remotesensing 17 02056 g010
Figure 11. Geopotential height analysis increments from different channel assimilation experiments: 183 GHz (a,d), 118 GHz (b,e), and 118_183 GHz (c,f). Geopotential height is represented by black contour lines.
Remotesensing 17 02056 g011
Figure 12. Temperature analysis increments at different vertical levels from all-sky assimilation experiments using the 118 GHz (ac) and 183 GHz (df) channels. The black “+” indicates the typhoon center position at the analysis time (1500 UTC on 5 September 2024) based on the best track data.
Remotesensing 17 02056 g012
Figure 13. Specific humidity analysis increments at different vertical levels from all-sky assimilation experiments using the 118 GHz (ac) and 183 GHz (df) channels. The black “+” indicates the typhoon center position at the analysis time (1500 UTC on 5 September 2024) based on the best track data.
Remotesensing 17 02056 g013
Figure 14. Forecasts based on all-sky assimilation experiment using the 118 GHz, 183 GHz, and 118_183 GHz channels: (a) typhoon tracks, (b) typhoon track errors, (c) minimum sea level pressure (MSLP) errors, and (d) maximum wind speed errors. The forecast tracks and track errors shown in Figure 5a,b are calculated based on the typhoon center positions.
Remotesensing 17 02056 g014
Figure 15. Twenty-four hour accumulated precipitation forecasts from all assimilation experiments during (a) 0000 UTC 6 September to 0000 UTC 7 September 2024, and (b) 0000 UTC 7 September to 0000 UTC 8 September 2024.
Remotesensing 17 02056 g015
Figure 16. Vertical RMSE profiles of (a,e) zonal wind (U), (b,f) meridional wind (V), (c,g) temperature (T), and (d,h) specific humidity (Q) at 24 h (ad) and 48 h (cf) forecasts after all-sky assimilation using the 118 GHz and 183 GHz channels.
Remotesensing 17 02056 g016
Table 1. Basic parameters of MWHS-II channels. Central Frequency: The dominant or nominal frequency of a spectral band or signal. Field of View (FOV): The spatial extent observable by a sensor during a single measurement. For MWHS-II, each cross-track scan acquires 98 discrete views. Resolution: The minimum distinguishable feature size detectable by the instrument. Bandwidth: The spectral range covered by a channel.
Channel NumberCentral Frequency (GHz)Field of View (FOV)Resolution (km)Bandwidth (MHz)
189.0 (V)98301500
2118.75 ± 0.08 (H)983020
3118.75 ± 0.2 (H)9830100
4118.75 ± 0.3 (H)9830165
5118.75 ± 0.8 (H)9830200
6118.75 ± 1.1 (H)9830200
7118.75 ± 2.5 (H)9830200
8118.75 ± 3.0 (H)98301000
9118.75 ± 5.0 (H)98302000
10166.0 (V)98151500
11183.31 ± 1 (H)9815500
12183.31 ± 1.8 (H)9815700
13183.31 ± 3 (H)98151000
14183.31 ± 3 (H)98152000
15183.31 ± 7 (H)98152000
Table 2. Assimilation experiment configurations.
Experiment NameExperiment Configuration
CONNo data assimilation
118_183_CLR (CLR)MWHS-II 118 GHz + 183 GHz clear-sky data
118_CLRMWHS-II 118 GHz clear-sky data
183_CLRMWHS-II 183 GHz clear-sky data
118_183_AS (AS)MWHS-II 118 GHz + 183 GHz all-sky data
118_ASMWHS-II 118 GHz all-sky data
183_ASMWHS-II 183 GHz all-sky data
Table 3. All atmospheric variables involved in the assimilation process.
Atmospheric Variable NameUnit
TemperatureK
Water vapor mixing ratiog/kg
PressurehPa
Zonal wind component (u) and Meridional wind component (v)m/s
2 m temperatureK
2 m water vapor mixing ratiog/kg
10 m Zonal wind component (u) and Meridional wind component (v)m/s
Surface pressurehPa
Disclaimer/Publisher’s Note: The statements, opinions and data contained in all publications are solely those of the individual author(s) and contributor(s) and not of MDPI and/or the editor(s). MDPI and/or the editor(s) disclaim responsibility for any injury to people or property resulting from any ideas, methods, instructions or products referred to in the content.

