Article

Comparison and Evaluation of Rain Gauge, CMORPH, TRMM PR and GPM DPR KuPR Precipitation Products over South China

1
Key Laboratory for Semi-Arid Climate Change of the Ministry of Education, College of Atmospheric Sciences, Lanzhou University, Lanzhou 730000, China
2
School of Atmospheric Sciences, Key Laboratory of Mesoscale Severe Weather, MOE, and Frontiers Science Center for Critical Earth Material Cycling, Nanjing University, Nanjing 210023, China
3
Key Laboratory of Radar Meteorology and State Key Laboratory of Severe Weather, China Meteorology Administration, Beijing 100044, China
4
Key Laboratory of Resource Environment and Sustainable Development of Oasis, Gansu Province, College of Geography and Environmental Science, Northwest Normal University, Lanzhou 730000, China
*
Author to whom correspondence should be addressed.
Remote Sens. 2025, 17(12), 2040; https://doi.org/10.3390/rs17122040
Submission received: 30 May 2025 / Accepted: 10 June 2025 / Published: 13 June 2025

Abstract

Remote sensing precipitation products are essential for the systematic analysis of precipitation characteristics and changes. This study conducts a comparative evaluation of precipitation products from rain gauge stations, Climate Prediction Center morphing technique (CMORPH), Tropical Rainfall Measuring Mission precipitation radar (TRMM PR) version 7 and Global Precipitation Measurement (GPM) Dual-Frequency Precipitation Radar Ku band (DPR KuPR) version 6 orbital observations during the common observational period (April–September 2014) across South China. The spatial patterns and probability density function of rain rates from four precipitation products show similar features. However, average rain rates from CMORPH (0.2–2.6 mm/h) tend to be smaller than those from rain gauge (0.1–4.4 mm/h) in temporal and spatial distribution. Conversely, average rain rates from TRMM PR and GPM KuPR (0.4–10.0 mm/h) are generally larger and exhibit more pronounced monthly changes. Despite notable differences in the number of detection samples, TRMM and GPM exhibit comparable spatiotemporal distributions and vertical structures, including rain-rate profiles, storm top heights and liquid (ice) water path. This confirms the consistency of space-borne precipitation radars and provides a foundation for analyzing long-term precipitation trends. Further analysis reveals that light rain rates from CMORPH have relatively small deviations, while rain rates generally tend to underestimate the rain rate compared to rain gauge. In contrast, TRMM PR and GPM KuPR tend to generally overestimate rain rates. Meanwhile, CMORPH (1.5–6.0 mm/h) shows larger deviations from rain gauge than TRMM and GPM, and the bias progressively increases as rain rates rise, as indicated by root mean square error results. Several statistical metrics suggest that although the missing detection rates of TRMM and GPM are higher than those of CMORPH (probability of detection 10–60%), their false detection rates are spatially lower (false alert ratio 10–30%) in Middle-East China. This study aims to provide valuable insights for enhancing precipitation retrieval algorithms and improving the applicability of remote sensing precipitation products.

1. Introduction

Precipitation is one of the most challenging atmospheric elements to forecast and is the crucial factor. Accurate precipitation prediction is essential for protecting human life and property, understanding climate change and comprehending the global water cycle. The challenges in predicting precipitation are from the sudden, complex and random nature, the influence of terrain and the limitations of current detection methods and numerical models. Moreover, extreme precipitation events have become more frequent in recent years due to global warming [1,2,3,4,5].
In term of precipitation detection, ground-based observations (such as from rain gauge stations) are traditional methods that offer high accuracy, real-time monitoring and stability [6,7,8]. Wu et al. [9] analyzed the spatial variation of precipitation across China using data from surface stations and reanalysis data, which is crucial for understanding climate change. Zhang et al. [10] utilized bias-corrected rain gauge data to examine precipitation trends across mainland China from 1961 to 2016, revealing a decreasing precipitation trend after bias adjustment. However, the spatial coverage of ground-based observation stations is constrained by their sparse distribution and environmental conditions. Particularly in complicated mountainous terrain, meteorological data are often absent, making it difficult to obtain precipitation information over large areas. With the advancement of satellite remote sensing technology, precipitation can now be observed through various means. For instance, the Tropical Rainfall Measuring Mission (TRMM), Global Precipitation Measurement (GPM) and Fengyun-3G (FY-3G) have been launched to monitor precipitation structures using instruments like visible/infrared, radar and microwave imagers [11,12,13,14]. In addition, merged precipitation data from remote sensing satellites, such as Climate Prediction Center morphing technique (CMORPH) and Global Precipitation Climatology Project (GPCP) data, are also available. These satellites typically offer high spatial–temporal resolution as well as extensive coverage, helping to overcome the limitations of ground-based precipitation observations [15,16,17,18]. Different satellites employ distinct algorithms and have varying resolutions for retrieving precipitation data. Therefore, the accuracy and adaptability of retrieving results need to be systematically evaluated. Precipitation products derived from satellites are often compared and calibrated by ground-based observations [19,20,21]. Furthermore, precipitation exhibits significant spatial variation, and uncertainties and errors are inherent in the measurements of different remote sensing techniques [22,23]. Consequently, understanding the accuracy and bias of precipitation products requires a comprehensive comparison of precipitation data from various observations, providing valuable insights for optimizing precipitation observation results.
Numerous studies have focused on precipitation detection using remote sensing. Nesbitt and Zipser [24] investigated the diurnal cycle of mesoscale convective systems (MCSs) using TRMM precipitation radar (PR) and microwave imagers over tropical regions. They found that the diurnal cycles of MCSs over oceans exhibit small amplitudes, with peaks occurring in the early morning, whereas those over land regions have larger fluctuations, with maximum rainfall intensities occurring in the afternoon. Fu et al. [25] classified rain types over the Tibet Plateau by applying new thresholds derived from GPM Dual-Frequency Precipitation Radar (DPR). They distinguished strong convective precipitation, weak convective precipitation and weak precipitation using maximum radar reflectivity thresholds of 30 dBZ and 18 dBZ. In addition, precipitation derived from remote sensing satellites requires retrieval and accuracy verification. Thus, many studies have focused on evaluating and validating precipitation products, particularly over China. Zhou et al. [26] compared TRMM 3B42 products, rain gauge data and Precipitation Estimation from Remotely Sensed Information using Artificial Neural Networks (PERSIANN) in mainland China. They found that precipitation from TRMM 3B42 is closer to rain gauge data than that from PERSIANN, though TRMM 3B42 tended to overestimate precipitation frequency and underestimate its intensity. Chen et al. [27] assessed the performance of TRMM 3B42 and Integrated Multi-satellitE Retrievals for GPM (IMERG) products at multiple temporal scales in Huaihe River basin. Both precipitation products showed a high correlation with rain gauge data, whereas GPM IMERG products outperformed TRMM 3B42, offering better spatial–temporal resolution. Xu et al. [28] conducted a comprehensive analysis of meteorological stations data, GPM IMERG and TRMM 3B42 daily products over Huang-Huai-Hai Plain in China. While both GPM and TRMM level-3 grid data captured the main spatial features of annual and seasonal precipitation, they both overestimated precipitation levels. Nevertheless, most comparative studies of precipitation products have focused on the level-3 grid data, which is generated by interpolating level-2 orbital data and merging with other datasets. In contrast, level-2 orbital precipitation data from space-borne radar contain more detailed information from the original remote sensing measurements. Although several previous studies have validated and analyzed the discrepancies between the level-2 products from TRMM (or GPM) and ground-based data [29,30,31], there persists a gap regarding the comparison of level-2 products from TRMM, GPM and rain gauge observations, particularly within mainland China.
In this work, precipitation products from rain gauge stations, CMORPH, TRMM PR and GPM DPR KuPR are collected for the period of April–September 2014 over South China (18.125°N–36.125°N, 72.125°E–128.125°E). The study area in South China represents the northernmost region within TRMM’s detection capability, encompassing three major sub-regions: Southwest China, the Middle and Lower Yangtze River Basins and Southeast China. Precipitation in this region significantly affected by the comprehensive influence of the East (South) Asian summer monsoon and the West Pacific Subtropical High is frequent and intense. Notably, extreme precipitation has become more frequent in recent years [32,33,34]. Assessing the accuracies and discrepancies of different precipitation products in South China is essential for improving the real-time monitoring of precipitation (especially for extreme events) and study the changing trend of precipitation climate. This will also provide the reference for the reliability and application of precipitation products from remote sensing. The differences among these products are quantitatively analyzed, and their accuracies are objectively evaluated by using statistical methods and metrics. Data and methodology are outlined in Section 2. Section 3 presents a comparison and evaluation of the results from rain gauge stations, CMORPH, TRMM PR and GPM DPR KuPR orbit data. Section 4 shows the conclusions.

2. Materials and Methods

2.1. Materials

The hourly precipitation data obtained from the rain gauge stations of the China Meteorological Administration (CMA) are used to evaluate remote sensing precipitation products over South China during May–September 2014. The rain gauge data are processed with quality control, and the minimum threshold of 0.1 mm/h is applied. Moreover, the CMORPH is a global precipitation product with high spatial–temporal resolution, developed by the Climate Prediction Center (CPC) of the National Oceanic and Atmospheric Administration (NOAA). CMORPH integrates passive microwave (PMW) imager and geostationary (GEO) satellite infrared (IR), merging and interpolating various precipitation estimates from different satellites [35,36]. The CMORPH data are provided in grid format, making them suitable for studying precipitation distribution and inter-annual variations. In this study, CMORPH hourly precipitation data with a horizontal resolution of 0.25° × 0.25° are employed.
TRMM was jointly designed by the National Aeronautics and Space Administration (NASA) and the National Space Development Agency (NASDA) of Japan, which was launched on 27 November 1997 and ended service in 2015 [37,38]. TRMM carried several instruments, including the Visible and Infrared Scanner (VIRS), the first space-borne PR, TRMM Microwave Imager (TMI) and Lightning Imaging Sensor (LIS), to capture three-dimensional precipitation information. The TRMM PR plays a key role in observing precipitation in tropical–subtropical regions (38°S~38°N) and operates 15~16 orbits per day. The radar operates at a frequency of 13.8 GHz, corresponding to a minimum threshold radar reflectivity of 17 dBZ (rain rate of 0.4 mm/h). The horizontal resolution of TRMM PR is 5 km, with a vertical resolution of 250 m [39]. The retrieval algorithm of TRMM PR is based on the hybrid of the Hitschfeld–Bordan method and a surface reference method. Because of the influence of surface echo, the rain rate at the lowest point is estimated by the near-surface rain rate [40]. The TRMM PR 2A25 version 7 products for the period of April–September 2014 over South China are used, which includes near-surface rain rate, precipitation radar reflectivity profile, liquid water path (LWP) and ice water path (IWP).
Launched on 28 February 2014, GPM builds upon the observational capabilities of TRMM and is equipped with DPR, which includes Ka-band (KaPR) and Ku-band (KuPR) radars. GPM offers improved detection of weak, medium and heavy precipitation. Besides, GPM extends its observational coverage to the middle-high latitudes (68°S~68°N). It features three scan patterns (high-sensitivity scan, matched scan and normal scan) and three kinds of algorithms (KaPR algorithm, KuPR algorithm and dual-frequency algorithm) for DPR [41]. The scan pattern and retrieval algorithm of GPM KuPR (normal scan and KuPR algorithm) are similar to TRMM PR, making it suitable for moderate-heavy precipitation. The KuPR operates at a frequency of 13.6 GHz, with a minimum radar reflectivity of 18 dBZ (0.5 mm/h), a horizontal resolution of 5 km and a vertical resolution of 125 m [42,43]. A detailed comparison of the main parameters of TRMM PR and GPM KuPR is presented in Table 1, illustrating their close similarities. Except for the extension of detection range, the evolution from TRMM PR to the first space-borne DPR has improved the retrieval of microphysical parameters and sensitivity to light/solid precipitation. GPM IMERG performs better than TRMM Multi-satellite Precipitation Analysis (TMPA) in most regions, due to higher frequency microwave channels and upgraded algorithm for GPM [44]. However, IMERG shows insignificant improvement compared to TMPA in the Hexi region [45]. Furthermore, DPR offers superior detection capabilities for shallow precipitation and anvil compared to TRMM PR [16].
We use GPM KuPR 2A version 6 products, with precipitation data and study periods aligning with those from TRMM PR. To ensure consistency of TRMM PR and GPM KuPR in the study time, the overlapping period of observation in April–September 2014 is chosen. The relatively short duration of the study does present some objective limitations. However, focusing on evaluation of precipitation products during this study period allows us to understand the performance at different stages and to highlight the strengths and weaknesses of the remote sensing algorithms at that time [46]. Meanwhile, the error assessment could be directly applied to the current observation of GPM and the algorithm improvements. Future work will combine TRMM PR historical data and recent GPM KuPR data to analyze the characteristics of precipitation climate changes.

2.2. Methods

The spatial distribution of rain gauge stations is variable, and the precipitation data from TRMM PR (GPM KuPR) are obtained from orbit-based observations. Therefore, interpolation and gridding of these precipitation products are necessary to enable matching and evaluation. Based on the resolution of CMORPH, the locations of rain gauge stations and TRMM PR (GPM KuPR) pixels are interpolated onto a 0.25° × 0.25° grid over South China. Due to the non-uniform detections from rain gauge, TRMM PR and GPM KuPR, the interpolation method is adopted by the nearest distance method proposed by [47,48,49]. The rain rate for each 0.25° grid is calculated as the average value of the total rain rates from the nearest rain gauge station or nearest TRMM (GPM) pixel divided by the number of detection samples at each grid point. Temporal matching of different grid data is then carried out after the spatial interpolation. As a result, precipitation data from rain gauge stations, CMORPH, TRMM PR and GPM KuPR are processed into spatiotemporally synchronized grid datasets, which can be compared and analyzed.
To quantitatively analyze the spatial–temporal characteristics and differences among the four precipitation datasets, we statistically calculate the sample, frequency, average near surface rain, LWP, IWP and storm top height (STH) for each grid. The frequency is defined as the ratio of valid precipitation samples to the total detected samples at each grid. The average near-surface rain rate for each grid is computed by dividing the total precipitation by the number of precipitation samples in the corresponding grid. Similarly, the distributions of LWP, IWP and STH can be obtained. The STH is the maximum height of precipitation particle within the precipitation cloud that can be detected by TRMM PR or GPM DPR and is defined as the first height where the radar reflectivity exceeds 20 dBZ [50,51].
In addition, several statistical metrics, including mean error (ME), root mean square error (RMSE), probability of detection (POD), false alert ratio (FAR), bias (BIAS) and critical success index (CSI), are used to quantitatively assess the accuracy and deviation of different precipitation products. The specific calculation methods are listed in Table 2. The ME represents the ratio of the sum differences between precipitation values from rain rates from remote sensing observation (CMORPH, TRMM PR and GPM KuPR) and rain gauge observation, divided by the number of samples. ME helps to assess the systematic deviation between remote sensing and rain gauge observation. RMSE offers a comprehensive measure of deviation, ensuring that the overall error is not underestimated due to the cancellation of positive and negative errors. It is defined as the square root of the average squared differences between remote sensing and rain gauge observation. Smaller values of ME and RMSE indicate that remote sensing observations are closer to the rain gauge observation. Furthermore, POD reflects the probability of accurate observation by remote sensing, while FAR denotes the ratio of instances where no precipitation is present but is falsely detected by remote sensing. BIAS quantifies the degree of deviation between remote sensing observation and rain gauge observation. CSI represents the total ratio of correctly detected precipitation by remote sensing observation. When POD, BIAS and CSI approach 100% or 1, and FAR approaches 0, the remote sensing observations are closer to the rain gauge measurement, indicating better performance.

3. Results

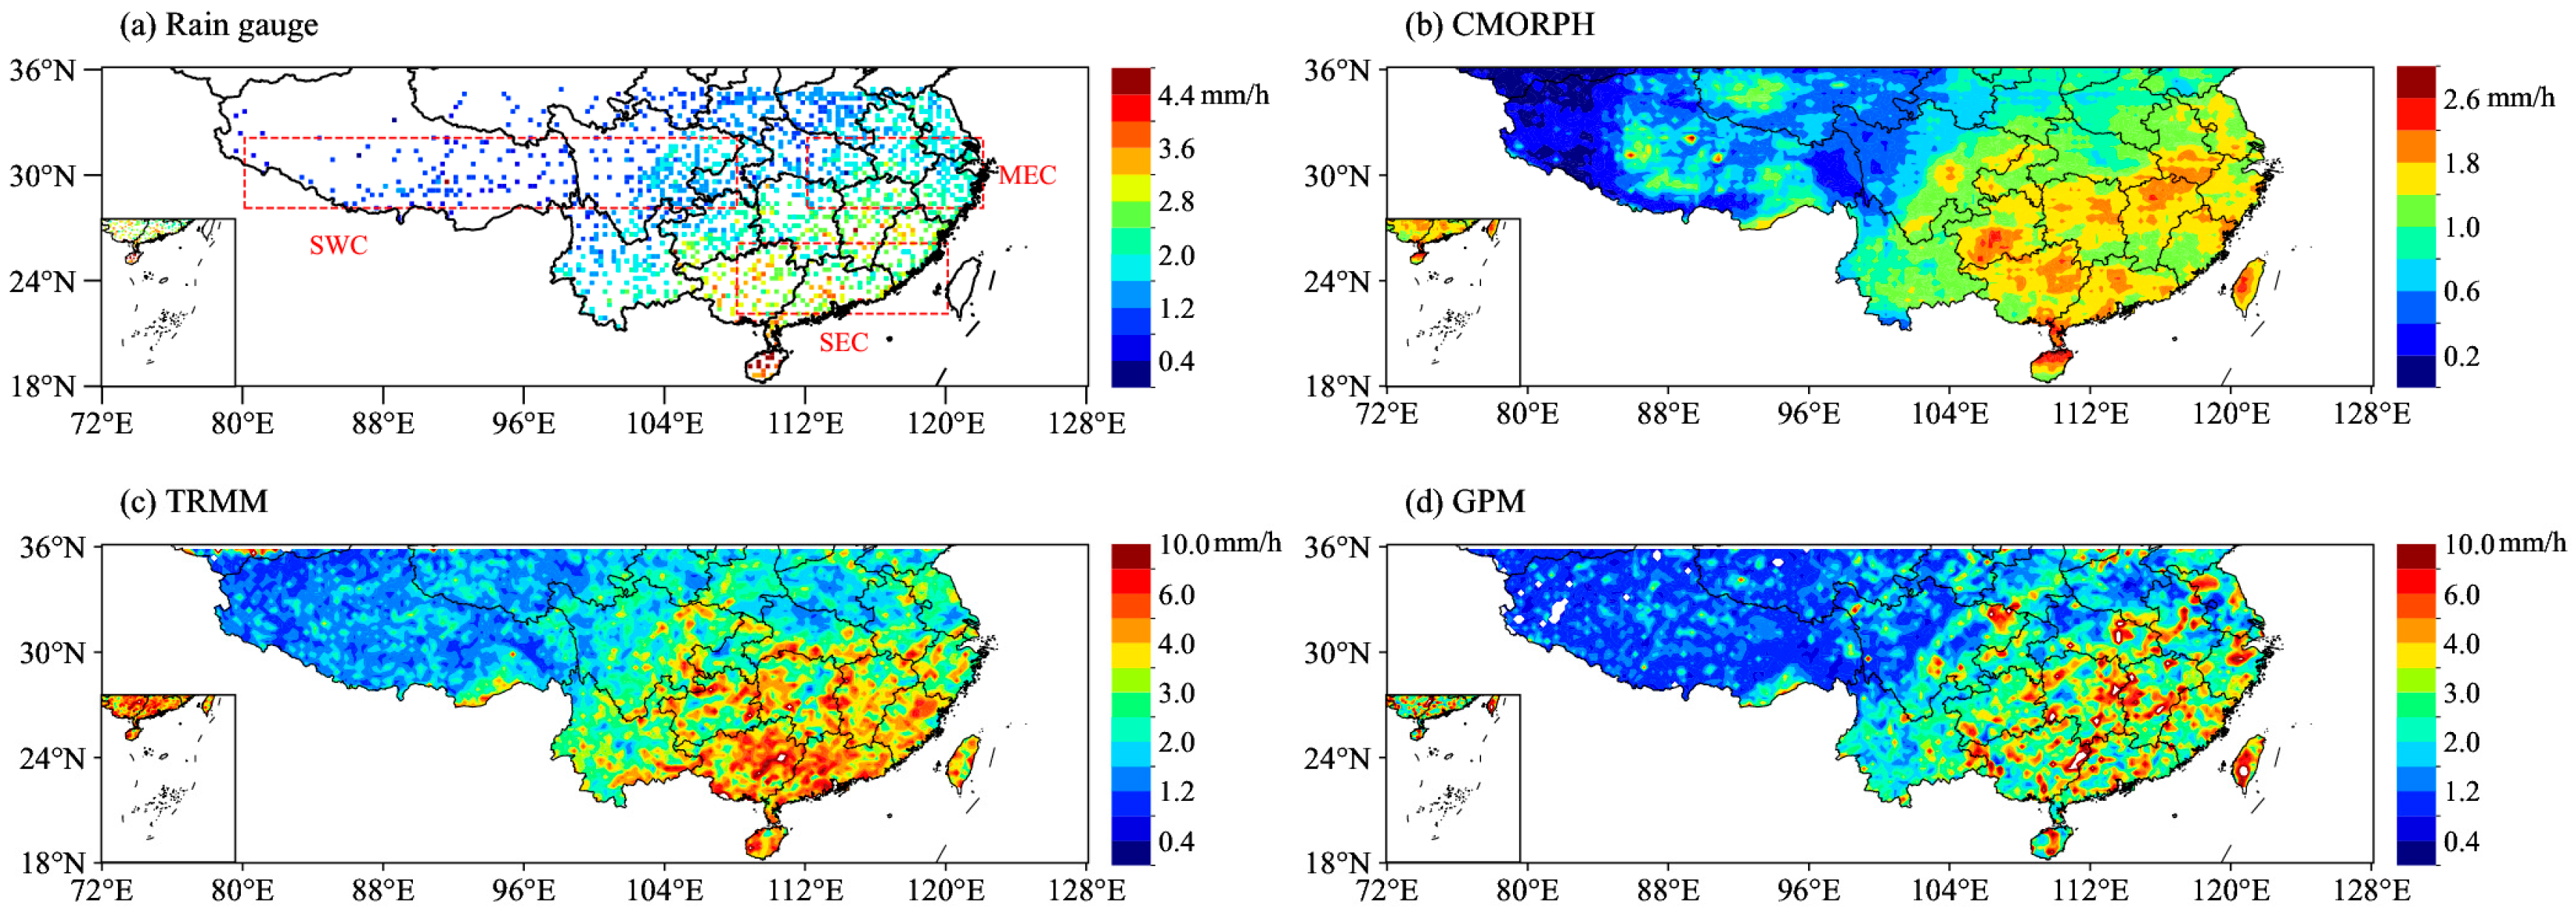
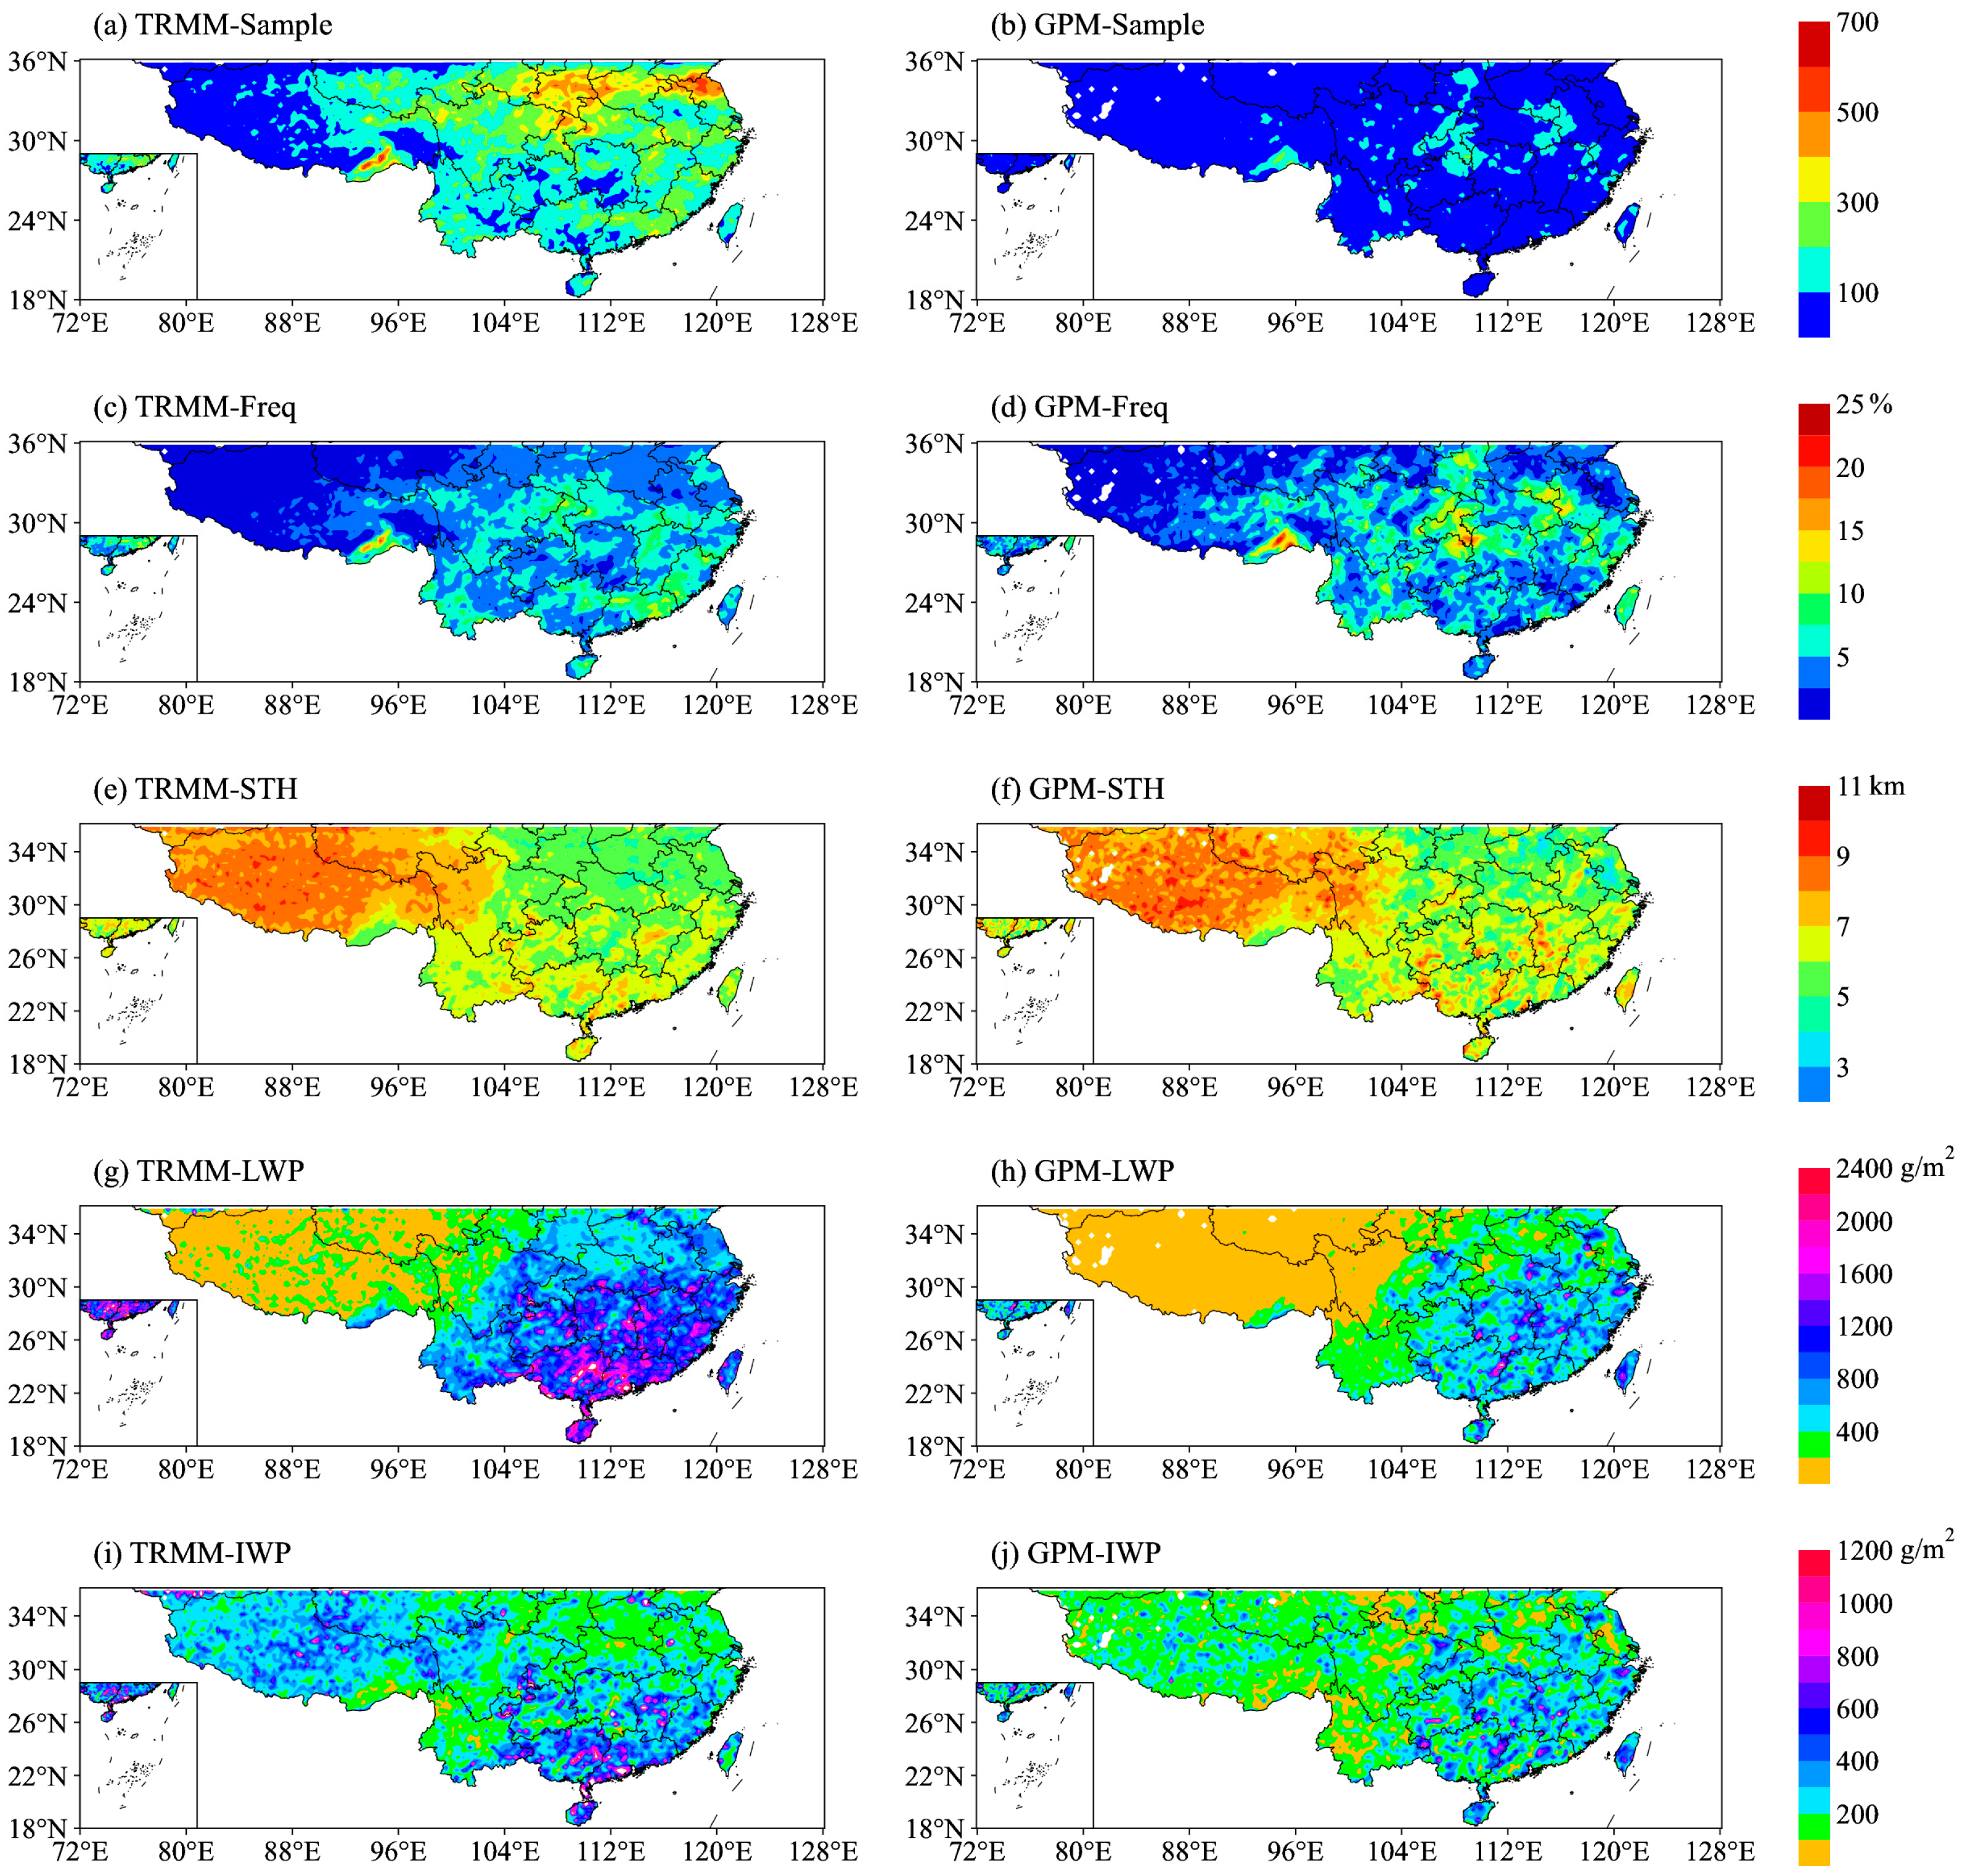
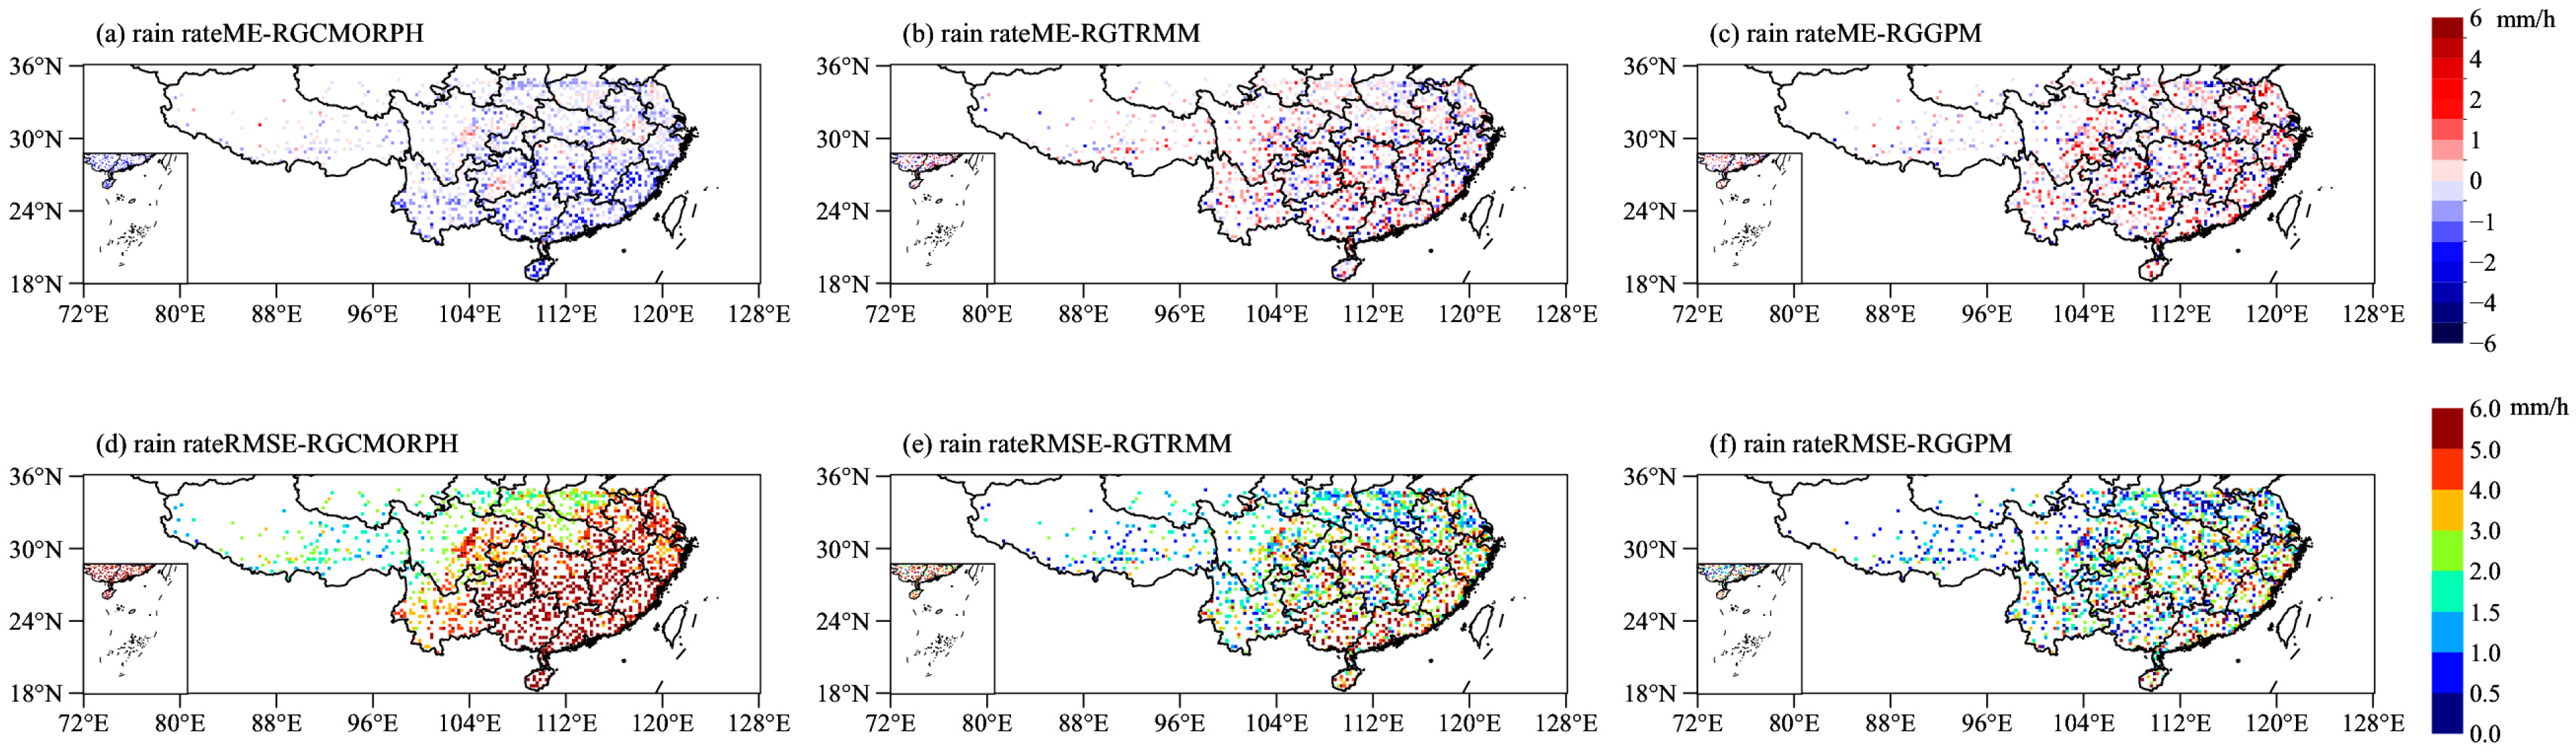
3.1. Spatial Distribution Characteristics of Precipitation from Rain Gauge, CMORPH, TRMM PR and GPM KuPR

Figure 1 illustrates the spatial distribution of rain rate from rain gauge, CMORPH, TRMM PR and GPM KuPR observations. Overall, the spatial patterns of rain rates from different precipitation products are quite similar. The rain rates generally decrease from Southeast to Northwest China, which is in concordance with the previous results [52,53], with the highest rain rate values concentrated south of 30°N and the lowest observed on the Tibetan Plateau. Nonetheless, there are some discrepancies in detail between rain gauge and remote sensing observations. Due to uneven spatial distribution of rain gauge stations, rain rates from rain gauge observation are less densely distributed compared to the other three products. Besides, rain rates from rain gauge approximately range from 0.1 to 4.4 mm/h, and those from CMORPH range from 0.2 to 2.6 mm/h. Notably, the rain rates from TRMM PR and GPM KuPR are obviously higher than those from rain gauge and CMORPH, ranging from 0.4 to 10 mm/h. Furthermore, the rain rates from TRMM PR are even higher than those from GPM in Southeast China (Guangxi and Guangdong provinces). In summary, the rain rates from TRMM PR are spatially the largest, followed by those from GPM KuPR and rain gauge, with CMORPH exhibiting the smallest values.
Since both TRMM PR and GPM KuPR are space-borne precipitation radars designed to detect and retrieve precipitation, their spatial resolution at nadir and scanning width are generally consistent (Table 1). Thus, other precipitation parameters retrieved by the two radars are further compared. Figure 2 shows the features of sample, frequency, STH, LWP and IWP from TRMM PR and GPM KuPR over South China. It is clear that the number of samples detected by TRMM PR is significantly larger than that detected by GPM KuPR (Figure 2a,b), which aligns with previous study [54]. The samples range from 0 to 700 for TRMM PR, whereas the corresponding range for GPM is roughly 0–100. The fewest samples are found over the western Tibetan Plateau, and the largest in central China and the southeastern Tibetan Plateau. This discrepancy may be attributed to the fact that TRMM has a smaller orbital inclination and has been operated for more than 16 years, while GPM has only been in operation for a few months since 2014 during the study period and its system still need to stabilize, leading to fewer samples being detected [55]. The patterns of frequencies from TRMM and GPM are similar to those of samples (Figure 2c,d), with the highest frequency occurring near 30°N (exceeding 10%). The main difference is that the frequency from TRMM is slightly higher than that from GPM in Southeast China.
The distribution of STH from TRMM largely agrees with that from GPM (Figure 2e,f). The STHs reach altitudes greater than 8 km over western China due to the unique topography. In contrast, the STHs range from approximately 4 to 8 km in Middle-East China and from 5 to 9 km in Southeast China. The patterns of LWP (Figure 2g,h) and IWP (Figure 2i,j) from TRMM PR and GPM KuPR are similar and show distinct characteristics, although there are differences in the magnitudes of LWP and IWP. Overall, the values of LWP and IWP presented by TRMM PR are larger than those from GPM KuPR over South China. Over the Tibetan Plateau, the IWP values (200–600 g/m2) are larger than those of LWP (less than 400 g/m2). However, the LWP values dominate and are larger than the IWP values in the region east of 105°E. In particular, the LWP values are evidently exceed 1200 g/m2 in the Southeast China, whereas the IWP values are greater than 600 g/m2.

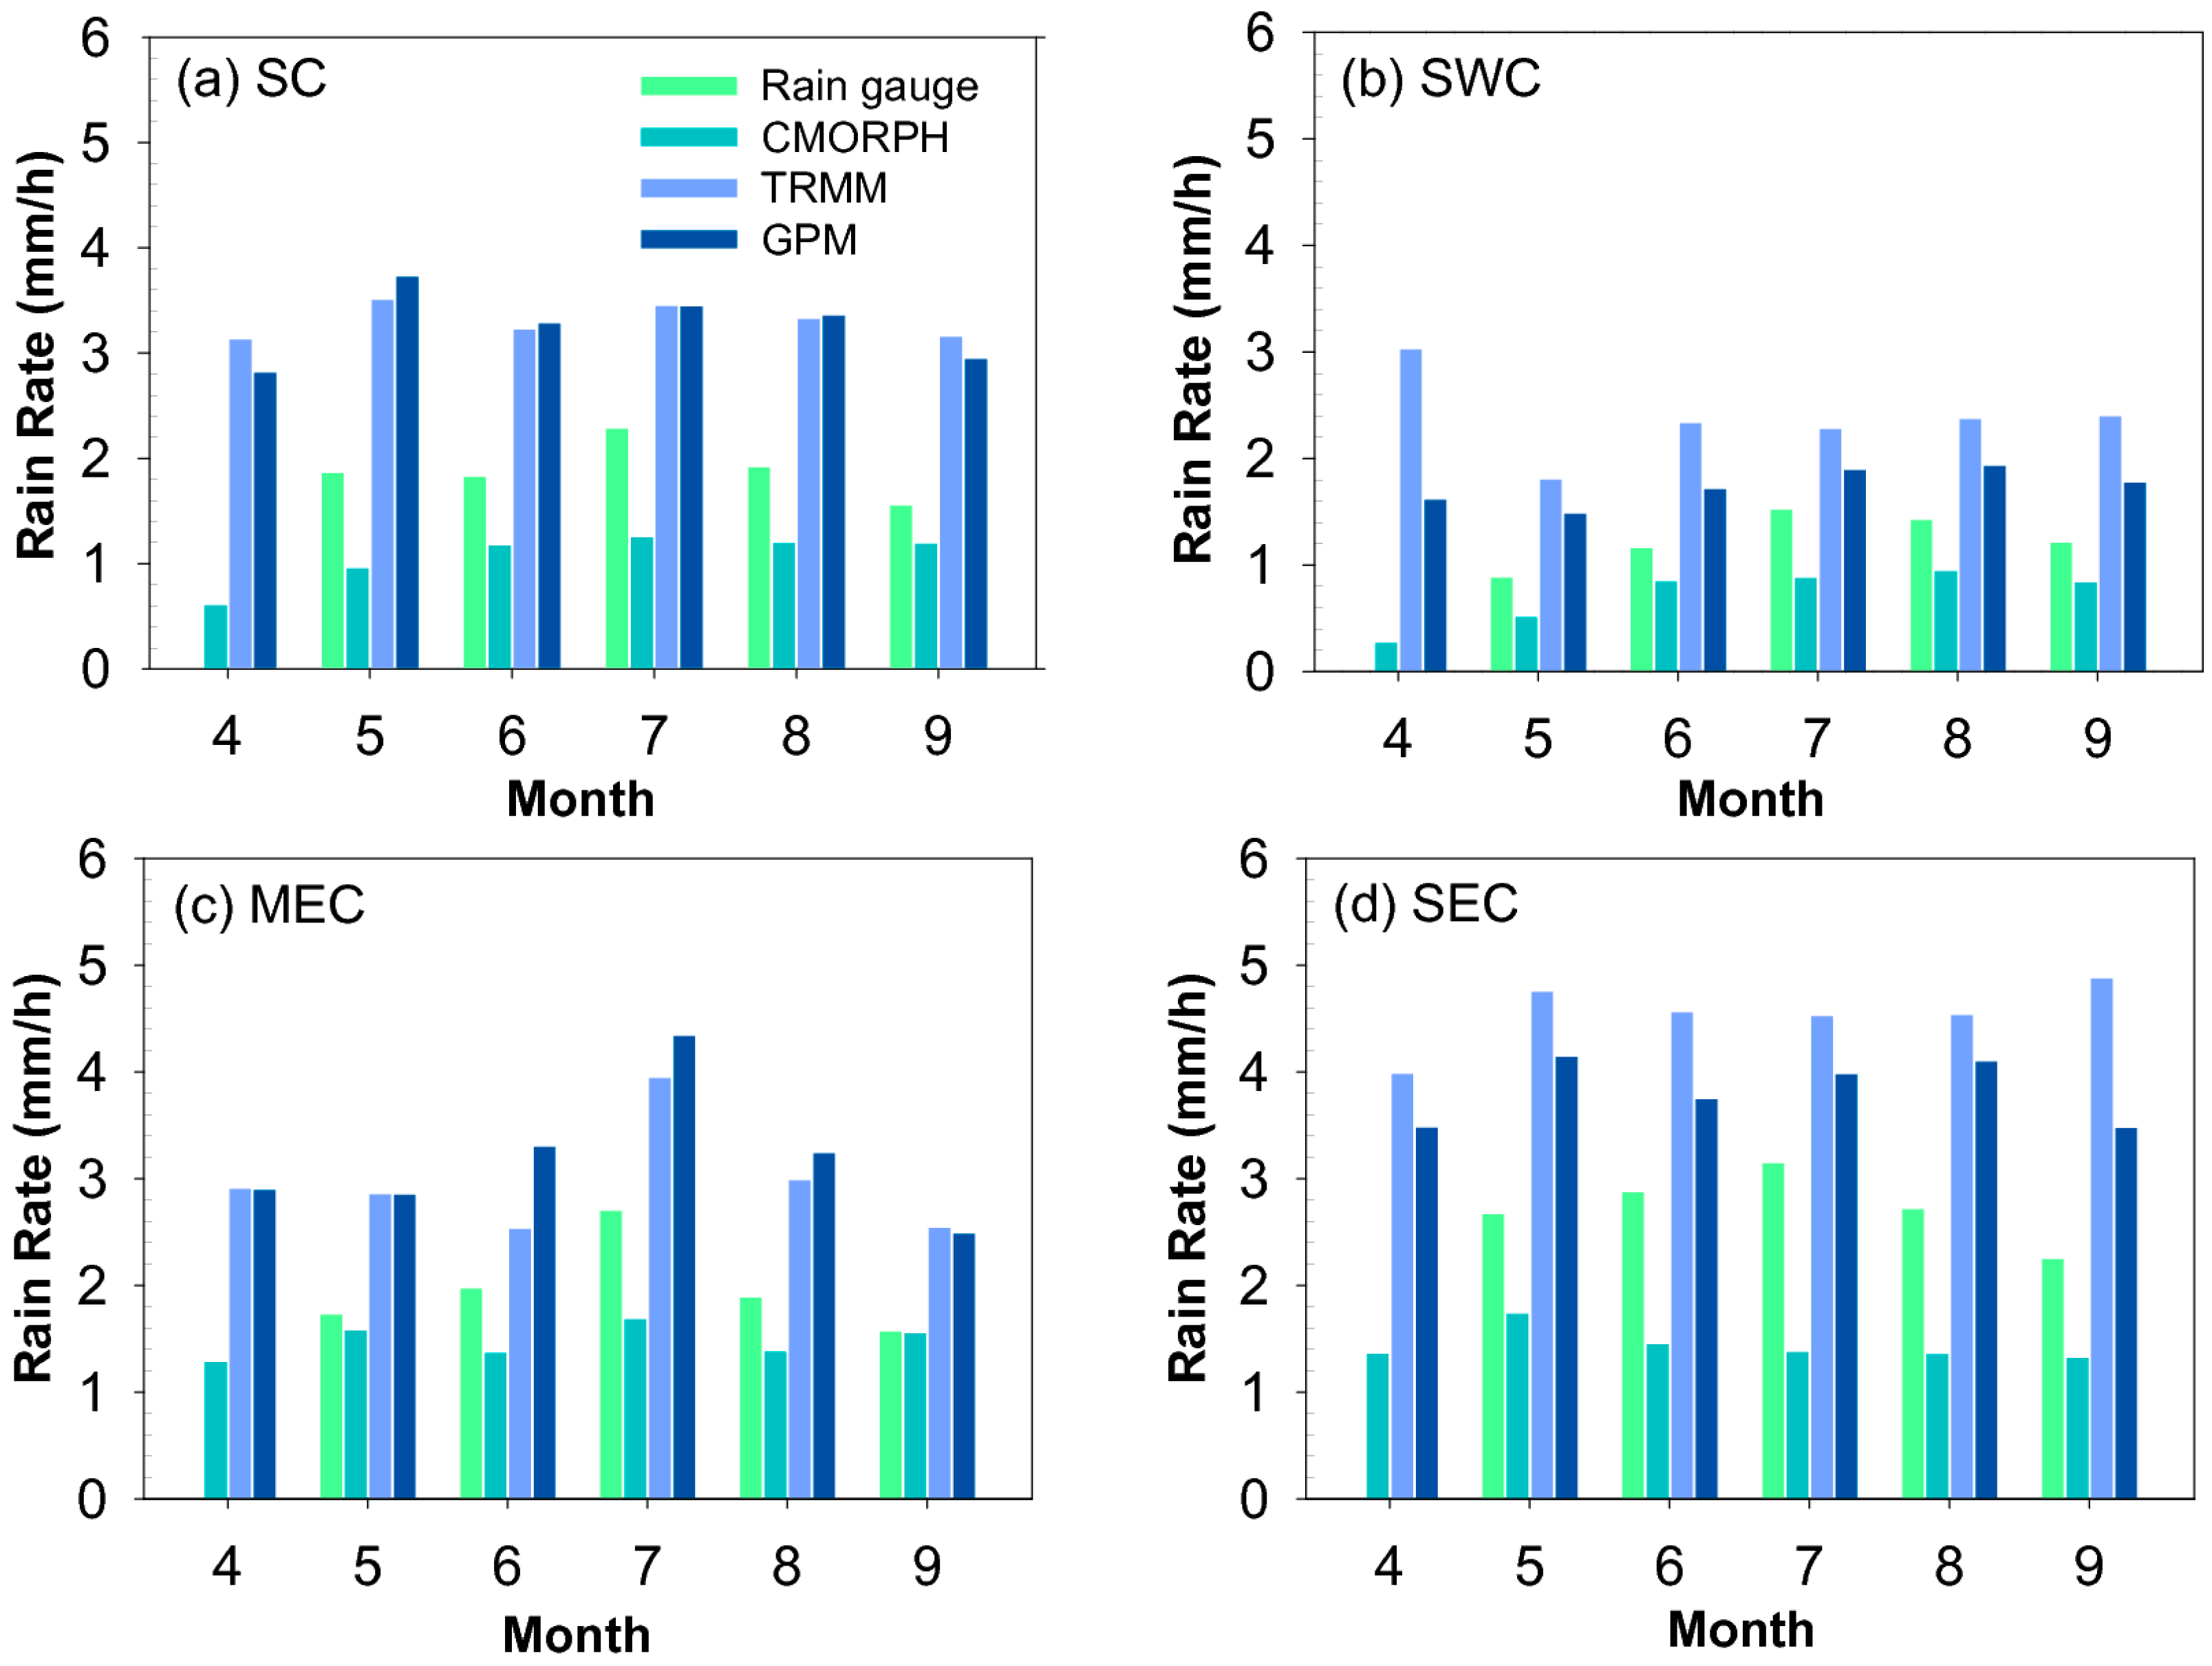
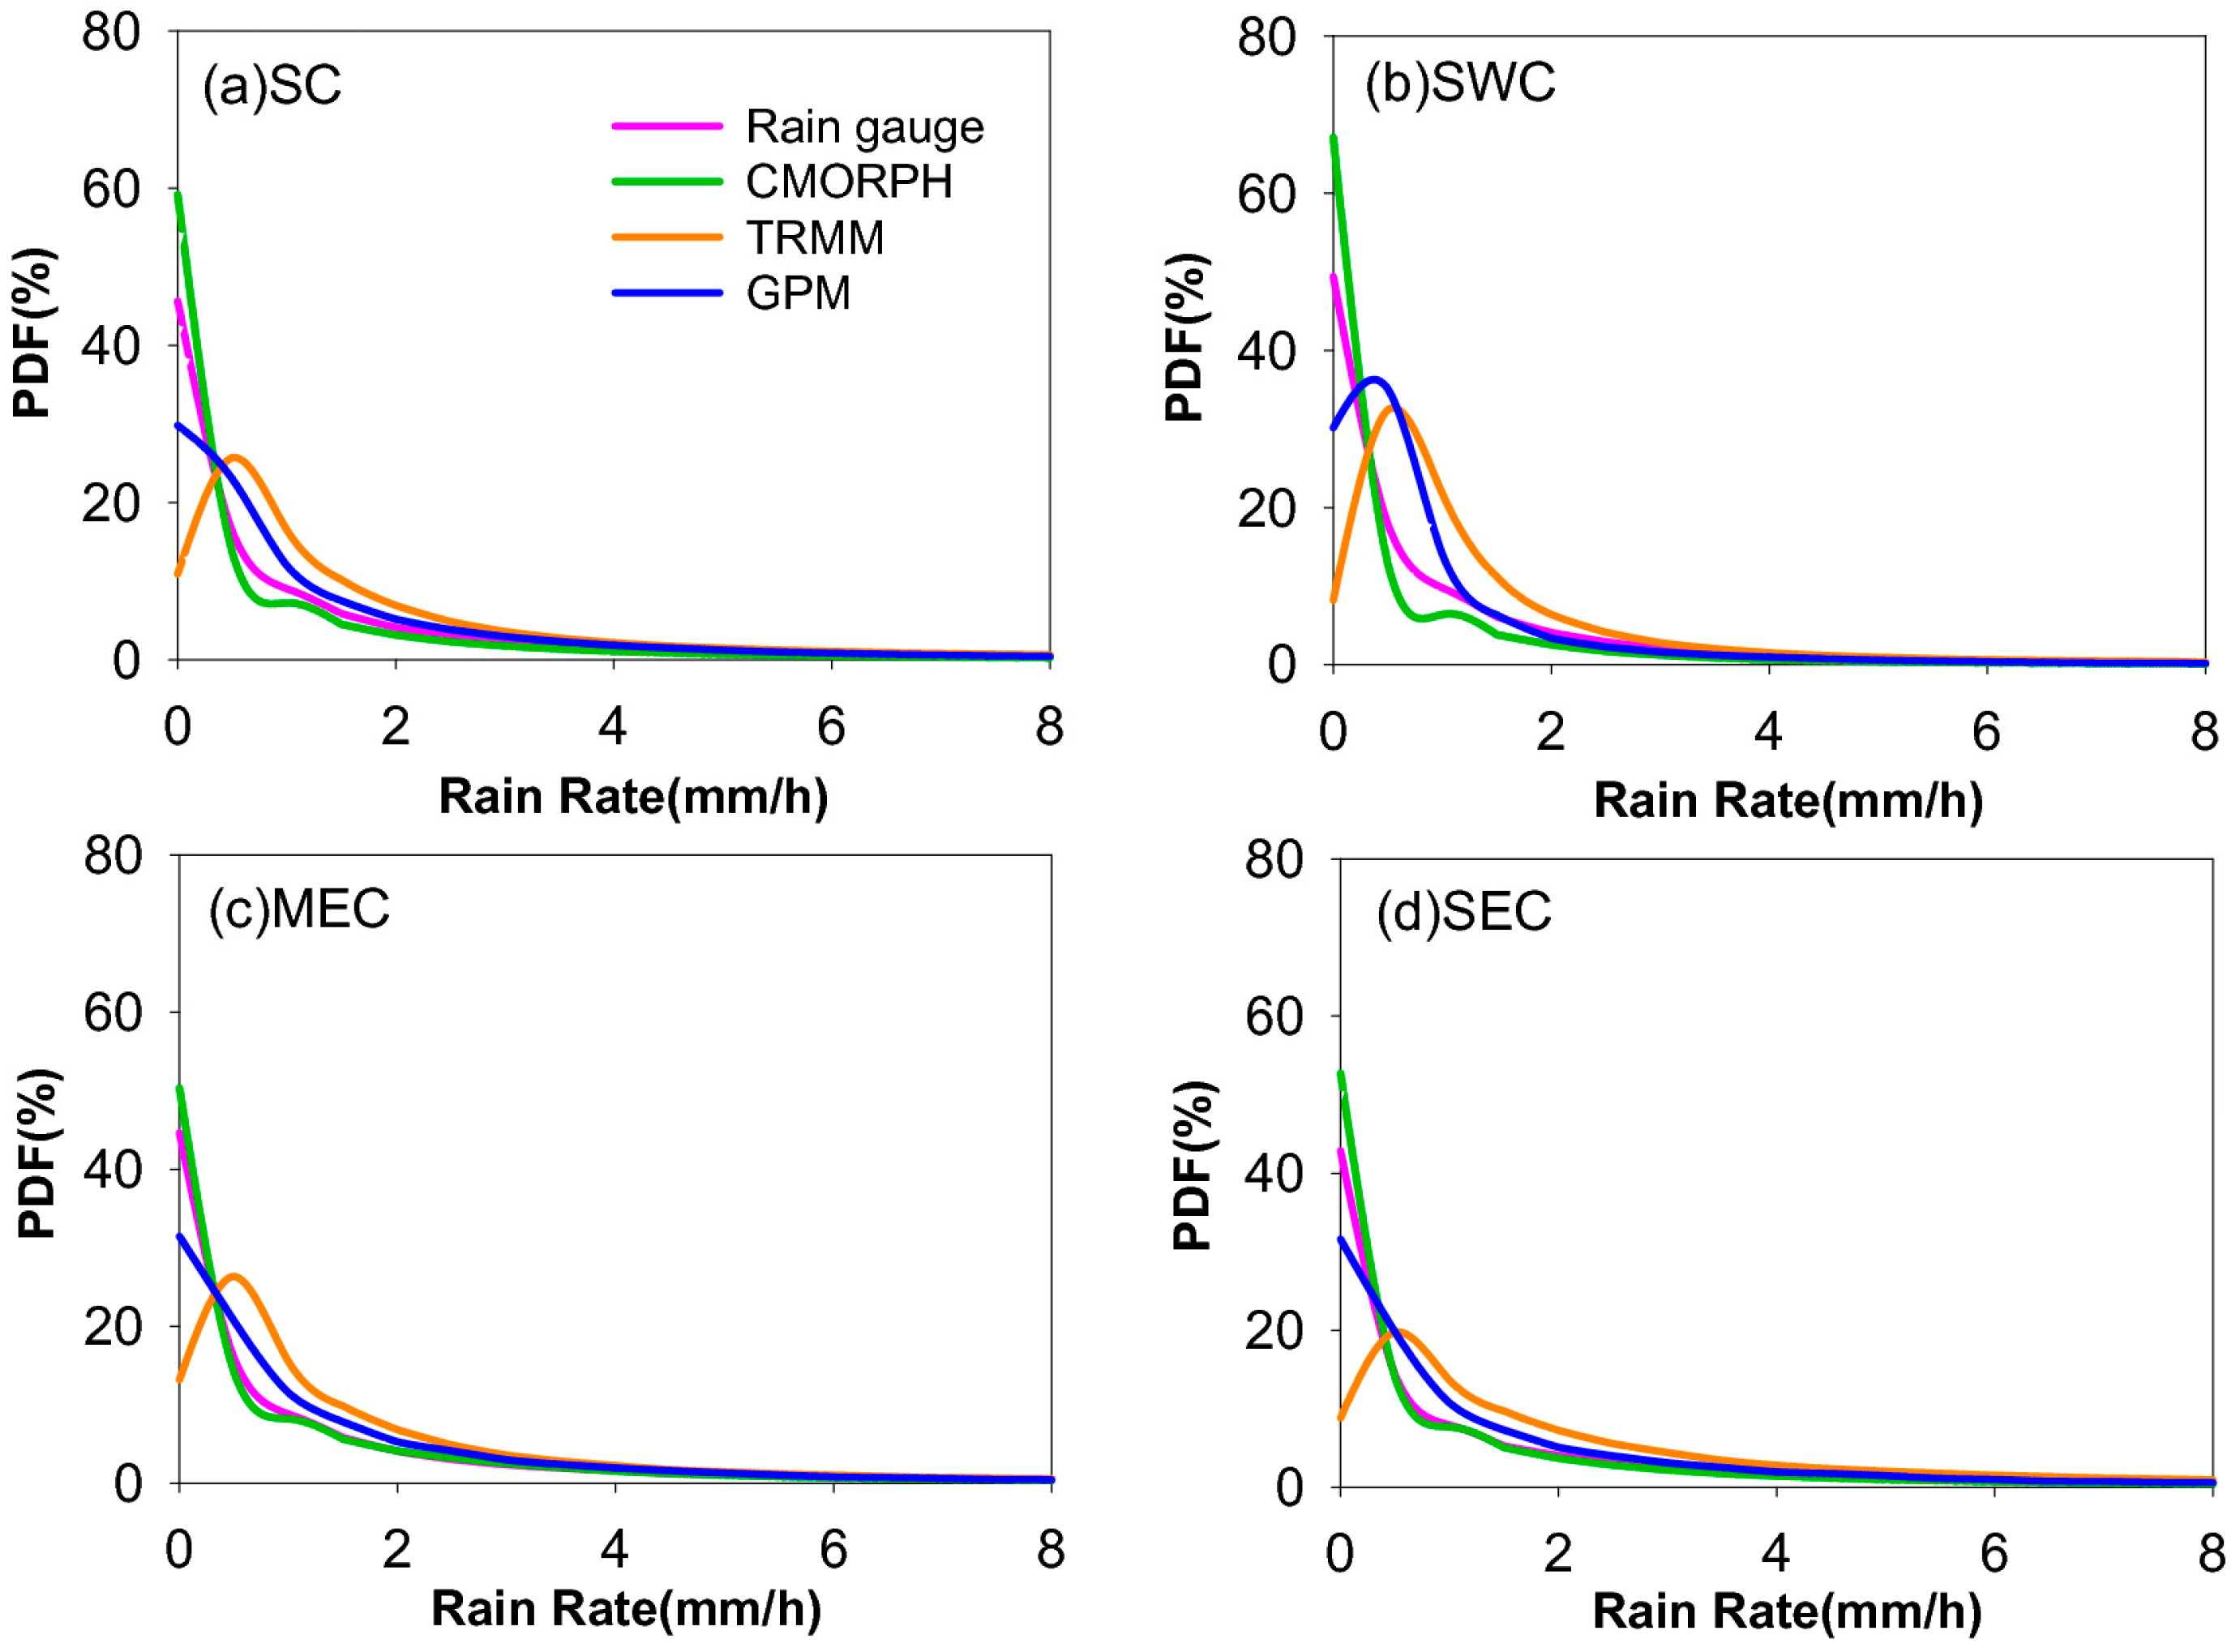
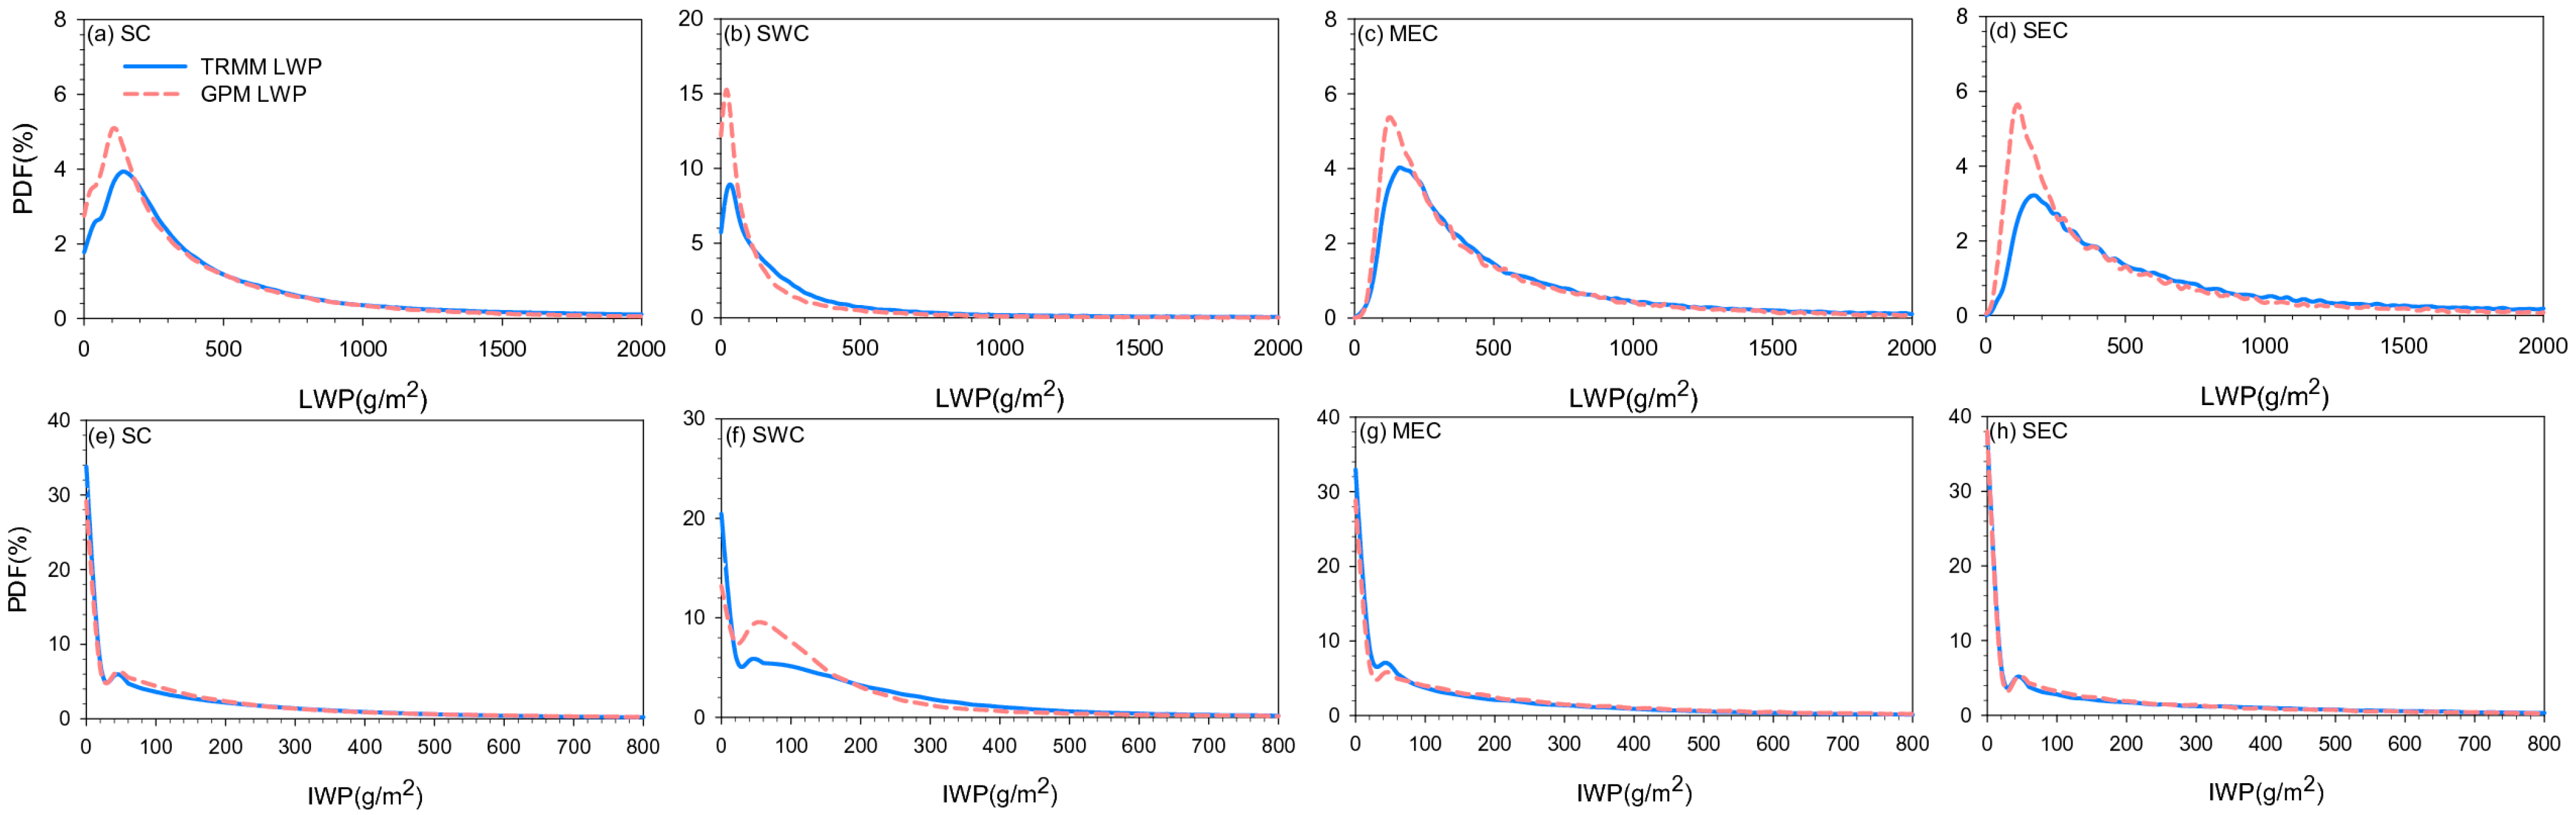
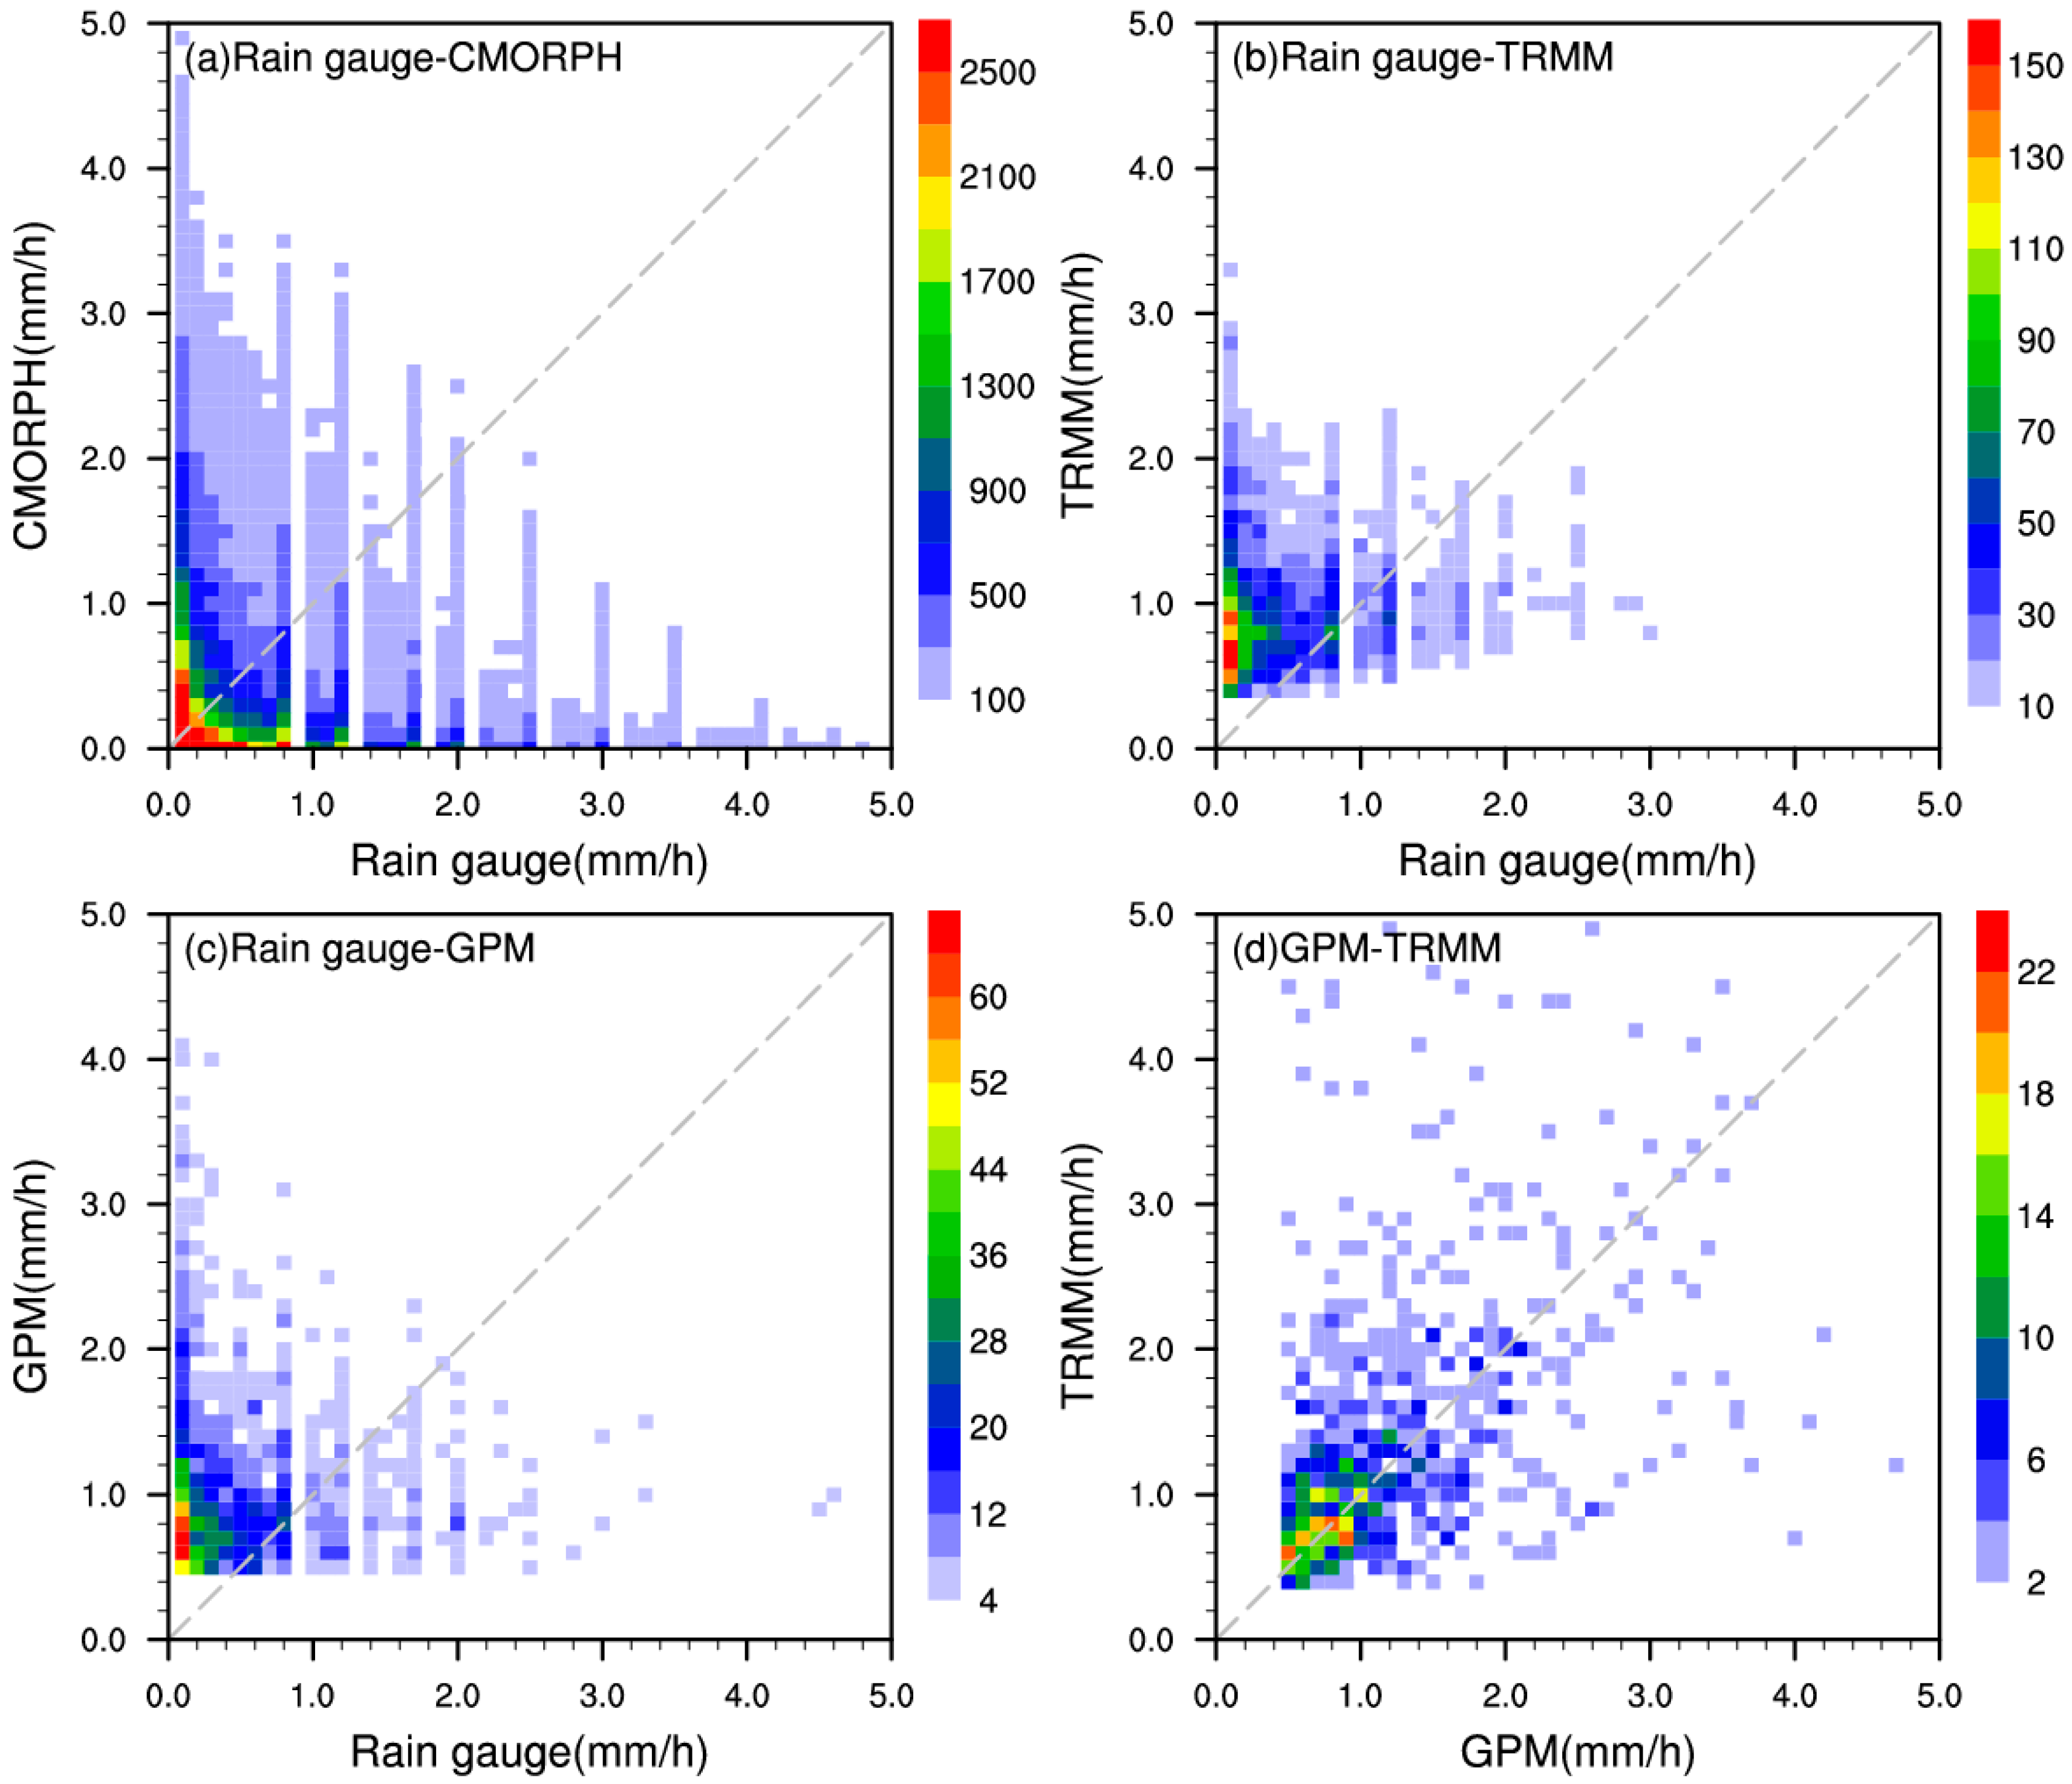
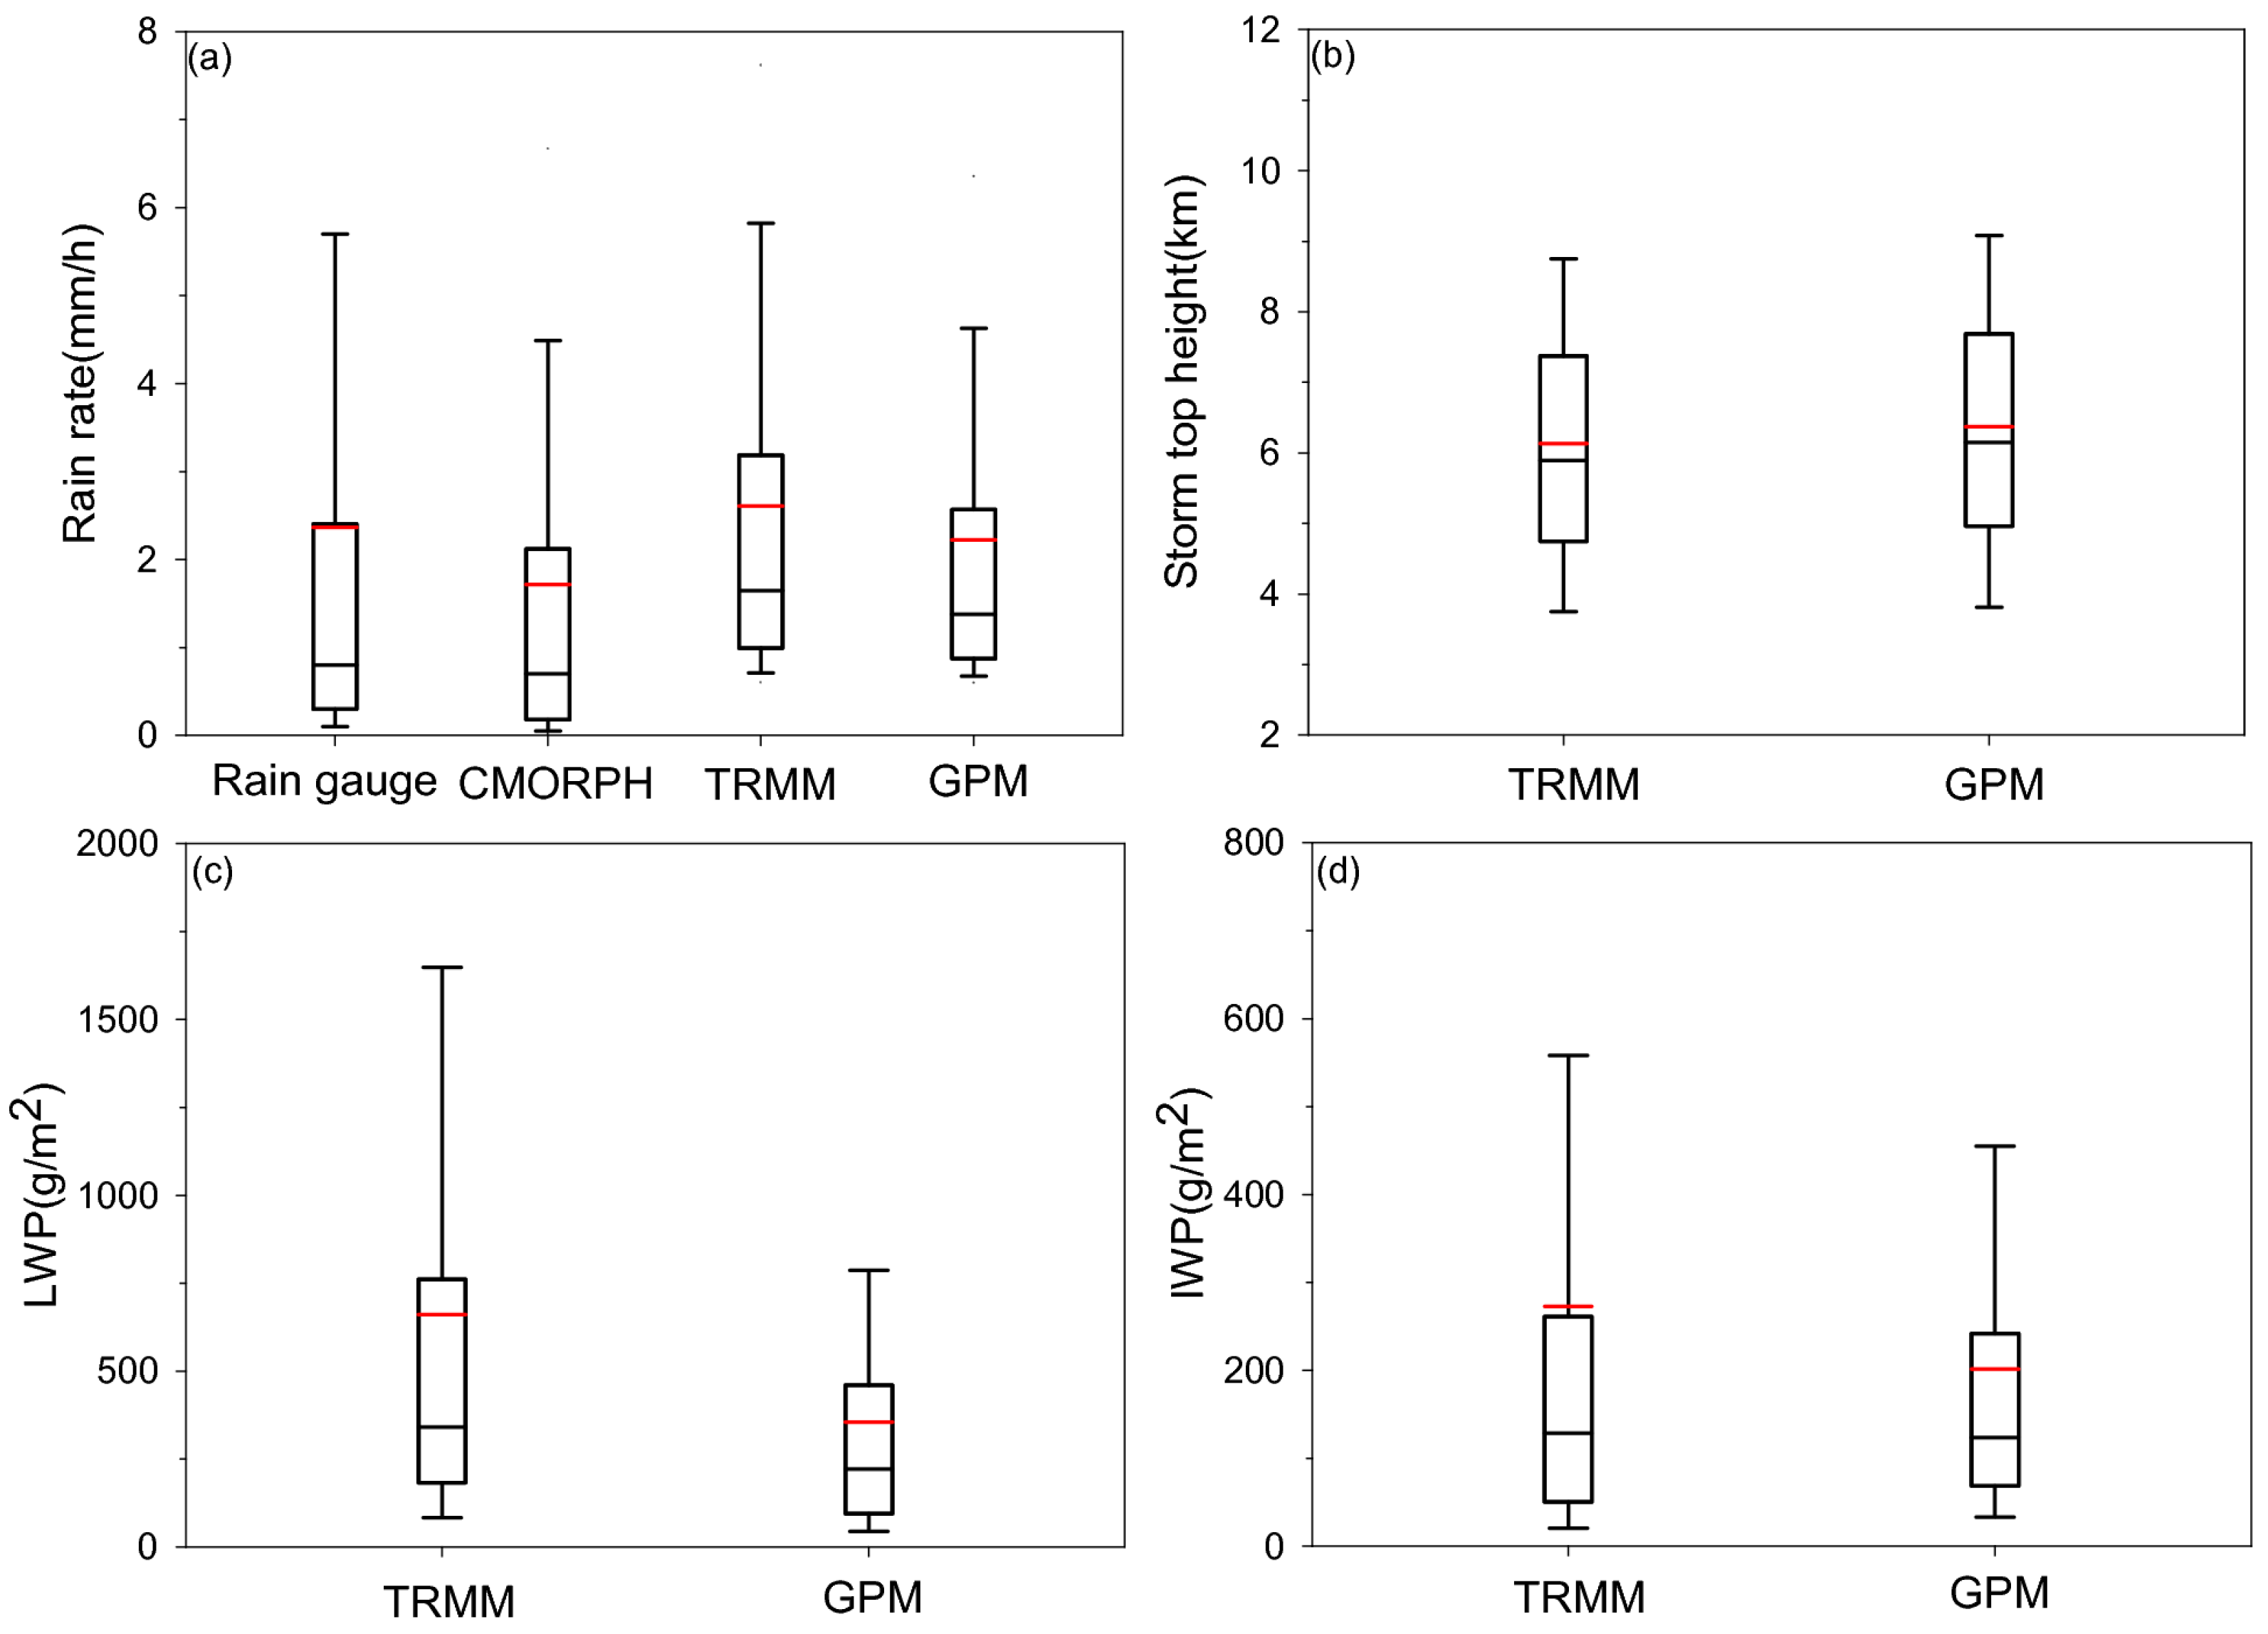
3.2. Monthly Average Rain Rate, Probability Density Function (PDF) and Vertical Structure of Precipitation from Rain Gauge, CMORPH, TRMM PR and GPM KuPR

To better analyze regional details, three sub-regions—Southwest China (SWC), Middle-East China (MEC) and Southeast China (SEC)—are defined, as shown in Figure 1. The monthly average rain rates from rain gauge, CMORPH, TRMM PR and GPM KuPR over South China (SC) and the three sub-regions are presented in Figure 3. Overall, the monthly rain rates from CMORPH are the smallest compared to the other three precipitation products. The monthly rain rates from rain gauge fall between those from CMORPH and TRMM (GPM). Moreover, the monthly rain rates show slightly variation across different regions. It is evident that the intensities of monthly rain rates are the lowest (0–3 mm/h) in Southwest China (Figure 3b) and the highest (0–5 mm/h) in Southeast China (Figure 3d). In Middle-East China (Figure 3c) during summer (June–August), the monthly rain rates from GPM are slightly higher than those from TRMM. However, in general, the monthly rain rates from TRMM are apparently the highest in Southwest and Southeast China. In contrast, the changes of monthly rain rates from CMORPH are relatively uniform, whereas the variation amplitudes of monthly rain rates from rain gauge, TRMM and GPM exhibit more pronounced seasonal characteristics.
Figure 4 displays the PDFs of rain rates from rain gauge, CMORPH, TRMM PR and GPM KuPR over South China and its three sub-regions, respectively. The PDF patterns of rain rates from four precipitation products are similar both for South China as a whole and each sub-region. Specifically, most of the rain rates are concentrated within 4 mm/h and correspond to the average rain rates of the spatial distribution (Figure 1), whereas the proportion of rain rates larger than 4 mm/h is small. Besides, rain rates from rain gauge and CMORPH are more heavily concentrated in the lower range (less than 1 mm/h), with PDF peaks exceeding 40%. Although the peaks of PDFs from TRMM and GPM are relatively smaller, the distributions of rain rates are broader, indicating that the rain rates of TRMM and GPM are generally higher than those of rain gauge and CMORPH.
In addition, the PDFs of LWP and IWP derived from TRMM PR and GPM KuPR show quite similar ranges and distributions over South China (Figure 5a,e). The LWP values are primarily concentrated within the range of 0–2000 g/m2, whereas the ranges of IWP are roughly 0–800 g/m2. Specifically, the LWP peaks (Figure 5b) are more heavily concentrated within 100 g/m2 in Southwest China compared to the other sub-regions (Figure 5c,d). It is evident that the PDF of LWP in Southwest China approaches 0% for values greater than 500 g/m2, whereas LWP values exceeding 500 g/m2 in Middle-East China and Southeast China still represent a noticeable proportion. In contrast, the percentage of IWP values above 100 g/m2 is slightly higher in Southwest China than that in Middle-East China and Southeast China (Figure 5f), likely due to the influence of high-altitude terrain on the west side of Southwest China. Moreover, LWP and IWP values between TRMM and GPM in Middle-East China and Southeast China exhibit minimal differences, with their distribution patterns almost overlapping except for the magnitude of the peak values (Figure 5c,d,g,h).
Figure 6 displays the contoured frequency with altitude diagram (CFAD) of radar reflectivity from TRMM PR and GPM KuPR over South China (Figure 6a,e) and its three sub-regions (Figure 6b–d,f–h). In general, the shapes of CFADs for TRMM and GPM are similar, with the radar reflectivity approximately increasing as height decreases, though it remains relatively unchanged below 5 km, which agrees with the previous study [56]. The storm top heights in Southwest (Figure 6b,f) and Southeast China (Figure 6d,h) are slightly higher than those in Middle-East China (Figure 6c,g), and the radar reflectivity near the surface exceeds 40 dBZ, except in Southwest China. It is noted that the frequencies at 3–9 km differ significantly between TRMM and GPM, with TRMM showing higher frequencies due to its larger number of detection samples. Moreover, the frequencies of radar reflectivity reflect the number of samples at corresponding height, which also suggests that TRMM captured more precipitation samples in the vertical structure than GPM during the study period. Therefore, the CFADs of radar reflectivity from both TRMM PR and GPM KuPR are largely consistent, with the primary difference lying in the samples of vertical structure.

4. Discussion

To clearly compare the differences and deviations of rain rates between rain gauge observation and other precipitation products from remote sensing, Figure 7 illustrates the scatter plots of rain rates from CMORPH, TRMM PR and GPM KuPR grid data, matched with rain gauge grid data over South China. The number of matching rain rate samples between rain gauge and CMORPH is large in each grid, with most grid points having over 500 samples (Figure 7a). However, the matched rain rates between rain gauge and CMORPH are more concentrated around 1 mm/h, and the large rain rates (greater than 2.0 mm/h) are sparsely distributed. This suggests that rain rates from CMORPH are closer to the results of rain gauge observation when the rain rates are light.
Combined with Figure 2a,b, it can be observed that the number of detection samples from TRMM PR exceeds that from GPM KuPR during the study period. Additionally, the rain rate samples in each matched grid between rain gauge and TRMM are larger than those between rain gauge and GPM (Figure 7b,c). Most of the rain rate scatter grids tend to be distributed on the TRMM and GPM side, indicating that the rain rates from TRMM and GPM are generally higher than those from rain gauge observation, which is consistent with the spatial distribution results (Figure 1a,c,d). Figure 7d shows the scatter distribution of rain rates from TRMM and corresponding values from GPM. Although there are fewer matched samples in each grid, the rain rate values of the two are relatively close, especially within 2 mm/h. As the rain rates exceed 3 mm/h, the matched rain rate samples generally decrease and the scatter pattern become more dispersed, suggesting that the deviation between TRMM and GPM increases with increasing rain rate. This is likely due to the Hitschfeld–Bordan method in the TRMM PR and GPM KuPR algorithms performing well when the rain attenuation is weak, whereas the result of retrieval becomes unstable when the rain attenuation is strong [57]. Meanwhile, radio wave signal attenuation is significantly related to precipitation (particle), and attenuation is strong for heavy precipitation [58,59]. Thus, it could be concluded that the deviation of TRMM and GPM become larger with the rain rate increasing.
Furthermore, box plots of rain rates, storm top heights, LWP and IWP from rain gauge, CMORPH, TRMM PR and GPM KuPR are shown in Figure 8. It is obvious that the range between maximum and minimum rain rates from rain gauge exhibits the largest variation (Figure 8a), indicating a significant dispersion in rain rate values due to the uneven distribution of stations. In contrast, the dispersion of rain rate values from GPM is the smallest. Moreover, the median, the first quartile (the 25th percentile) and the third quartile (the 75th percentile) of rain rates from TRMM and GPM are generally higher than those from rain gauge and CMORPH, implying a slight overestimation of rain rate by TRMM PR and GPM KuPR relative to rain gauge observation. It is noted that the average rain rate from TRMM is the largest (2.61 mm/h), while the rain rate from GPM (2.22 mm/h) is the closest to that from rain gauge (2.37 mm/h). The median, average and interquartile ranges of STH (approximately 4.7–7.7 km) and IWP (approximately 53–270 g/m2) from TRMM and GPM are similar (Figure 8b,d). However, the median, average and interquartile ranges of LWP from TRMM (181–764 g/m2) are notably larger than those from GPM (97–459 g/m2) (Figure 8c), which corresponds to the spatial distribution patterns observed in Figure 2g,h, particularly over the Tibetan Plateau and Southeast China.
ME and RMSE provide an intuitive indication of the deviation between remote sensing observations (CMORPH, TRMM PR and GPM KuPR) and rain gauge observation. Therefore, the spatial patterns of ME and RMSE of rain rates over South China are shown in Figure 9, with the calculation formulas detailed in Section 2.2. It is clear that the ME values are negative across most parts of South China for CMORPH (Figure 9a), with ME values dropping below −1.0 mm/h in the south of 30°N region. In contrast, the ME values are predominantly positive for TRMM and GPM (Figure 9b,c). This pattern, along with Figure 7 and Figure 8a, confirms that the rain rate values from CMORPH are generally underestimated, while rain rates from TRMM PR and GPM KuPR are overestimated.
Precipitation estimation of CMORPH is based on instantaneous PMW and GEO IR; thus, the source of error for CMORPH depends on poor detection of PMW signals and limited capability of the retrievals [60,61]. It may also miss short-duration heavy rainfall events measured by PMW, resulting in low rain rates. Furthermore, systematic errors between rain gauge observation and TRMM PR (GPM KuPR) are inevitable, as the former measures hourly accumulated precipitation (including evaporation), whereas the latter captures instantaneous measurement. The gridding process of TRMM and GPM orbital data may also introduce errors. Another primary source of uncertainty of TRMM and GPM precipitation estimates comes from the conversion of radar reflectivity into rain rate, which is significantly influenced by complex topography, seasonal variability and precipitation types [41]. Despite the topography classification, some echoes captured by antennas at high surface echoes are misinterpreted as rain echoes. Some sidelobe clutters are removed but not all of them in algorithm [62].
Because of the KuPR detection threshold (about 13 GHz) limitation of TRMM and GPM, rain rates below 0.5 mm/h (such as drizzle) may be omitted. Moreover, the detection ability of TRMM for light rain diminishes after orbital boost [63], which could result in larger discrepancies and RMSE in observational results for light rain compared to rain gauge and CMORPH. The attenuation signal of the light rain rate is weak and may be contaminated by noise signals from the surface, making it challenging to distinguish and leading to errors. Beyond that, the retrieval of TRMM and GPM rely on Rayleigh scattering, which is highly dependent on the shape and size of precipitation particles [62]. Consequently, inhomogeneity in precipitation particles may introduce minor biases in the estimation results. On the other hand, the RMSE values (1.5–6.0 mm/h) of rain rates for CMORPH are significantly large across South China (Figure 9d). In contrast, the RMSE values of rain rates for TRMM and GPM are relatively smaller (Figure 9e,f), though larger RMSE values are typically observed in low-latitude regions due to algorithm instability, especially when retrieving heavy rain rates in these areas. Meanwhile, it can be found that RMSE values for GPM KuPR are slightly smaller than those for TRMM PR, especially in Southeast China, indicating that the deviations of rain rates between GPM and rain gauge are lower.
Four statistical metrics—POD, FAR, BIAS and CSI—are selected to further evaluate the deviation between remote sensing measurements (CMORPH, TRMM PR and GPM KuPR) and rain gauge observations over South China (Figure 10). The POD (10–60%), BIAS (0.25–2.0) and CSI (0–0.4) values for CMORPH (Figure 10a,g,j) are relatively higher than those for TRMM and GPM, with values closer to the ideal (100% or 1). It is worth noting that the FAR (30–70%) for CMORPH (Figure 10d) does not perform as well as POD, particularly in Southwest and Southeast China. CMORPH is a precipitation product generated by the multiple remote sensing data sources using retrieval algorithms, resulting in fewer missing rain-rate values and better POD performance. However, the relatively large FAR for CMORPH reflects that the proportion of false detections still affects the rain rate results. Besides, the POD, BIAS and CSI for TRMM (Figure 10b,h,k) are higher than those of GPM (Figure 10e,i,l), primarily due to fewer detection samples from GPM during study period. This result is consistent with the previous result of level-3 high-resolution precipitation product from GPM and TRMM [64,65]. Nevertheless, the FAR patterns for GPM and TRMM (Figure 10e,f) are similar and obviously lower than those for CMORPH in Middle-East China (FAR 10–30%). This suggests that although GPM KuPR detects relatively fewer precipitation samples, its detection error rate is low, and it can detect characteristics of rain rate similarly to TRMM PR.
Beyond the deviations discussed above, topography is a crucial factor in satellite retrieval. Both TRMM and GPM algorithms classify land surface types (land, ocean, inland water and coast) but are unable to account for all surface categories. Precipitation estimation by TRMM and GPM is affected by high surface echo, potential beam blockage and signal attenuation in complex terrain, with the noise echo from the terrain unable to be fully eliminated in the algorithm. Moreover, the retrieved rain rates exhibit strong dependence on local topography, and the retrieval result in flat topography is better than that in mountains [31,41,65]. Meanwhile, the 17.0 dBZ detection threshold for TRMM PR potentially misses light rain in higher terrain [66], and a similar limitation may exist in GPM KuPR with its 18.0 dBZ threshold. The rain rates decrease with increasing elevation, especially due to the compression effect over the Tibetan Plateau [3], and both TRMM PR and GPM DPR may misjudge the bright band. Thus, the precipitation should be reclassified according to the specific algorithm [25]. Future work will include a more detailed examination of space-borne radar detection performance for different surface types and its effects on precipitation intensity retrievals across mainland China.

5. Conclusions

This study compares and evaluates the performances of different precipitation products spatially and temporally by using rain gauge stations, CMORPH hourly data, TRMM PR v07 and GPM DPR KuPR v06 observations from April to September 2014 over South China. The main conclusions are summarized as follows:
The spatial patterns of rain rates from rain gauge, CMORPH, TRMM PR and GPM KuPR are similar, with the rain rates gradually increasing from the North to South. The rain rates from CMORPH are generally lower than those from rain gauge observation, while TRMM and GPM tend to slightly overestimate rain rates relative to rain gauge, particularly in Southeast China. Despite TRMM PR having a significantly larger number of detection samples than GPM KuPR, the high frequency in Middle-East China, as well as the storm tops, are largely consistent. In contrast, the distributions of LWP and IWP values show discrepancies, with the LWP and IWP values from TRMM being larger than those from GPM in the south of 30°N.
The monthly rain rates from rain gauge, CMORPH, TRMM and GPM exhibit similar seasonal variations over South China and the three sub-regions (SWC, MEC and SEC). The monthly rain rates from CMORPH are generally the smallest and show less pronounced variations, while rain rates from the other three precipitation products present significant seasonal characteristics. Besides, the monthly rain rates from TRMM in SWC and SEC are typically higher than those from GPM, which is in good agreement with the spatial distribution. The PDF changes of rain rates from four precipitation products are broadly consistent over South China and the three sub-regions, although the peak values of PDFs are different. The variations in the PDFs of LWP, IWP and the CFADs of radar reflectivity from TRMM PR and GPM KuPR show minimal differences over South China, suggesting that TRMM PR and GPM KuPR exhibit strong consistency in retrieving the three-dimensional structure of precipitation and related information. This consistency also paves the way for long-term series characteristics and precipitation trends based on TRMM and GPM remote sensing.
Moreover, several statistical methods and metrics are employed to further analyze the bias in rain rates among rain gauge, CMORPH, TRMM PR and GPM KuPR over South China. The rain rates from CMORPH are closer to those from rain gauge when the rain rates are below 1 mm/h. However, the deviations between CMORPH and rain gauge gradually increase as the rain rates rise, particularly when exceeding 2 mm/h. Overall, the rain rates from TRMM and GPM are higher than those from rain gauge, which is consistent with the spatial distribution result. The patterns of ME values further confirm that the rain rates from CMORPH are spatially smaller than those from rain gauge, whereas the rain rates from TRMM and GPM tend to be larger in most southern regions. Moreover, the RMSE values indicate that the deviations between rain rates from CMORPH, TRMM PR and GPM KuPR compared to those from rain gauge observations increase due to the instability of the retrieval results of intense precipitation. Furthermore, the POD, FAR, BIAS and CSI are used to assess the quality of these precipitation products. The satellite orbital detection mode leads to fewer precipitation samples, resulting in smaller POD and CSI values from TRMM and GPM compared to those from CMORPH. Nonetheless, TRMM PR and GPM KuPR tend to overestimate the rain rates, their false detection rates of TRMM and GPM are generally lower, and the FAR results for TRMM and GPM are generally superior to those for CMORPH (particularly in Middle-East China), indicating that the error rates of detection by TRMM and GPM are relatively small. In summary, CMORPH demonstrates higher accuracy in light rain, while TRMM PR and GPM KuPR exhibit progressively larger deviations as precipitation intensity increases.

Author Contributions

Conceptualization, R.W. and H.H.; methodology, R.W.; software, H.L.; validation, H.L. and L.L.; formal analysis, R.W.; investigation, H.L.; resources, R.W. and H.H.; data curation, H.H.; writing—original draft preparation, R.W.; writing—review and editing, R.W. and H.L.; visualization, H.L.; supervision, R.W.; project administration, R.W. and H.H.; funding acquisition, R.W. and H.H. All authors have read and agreed to the published version of the manuscript.

Funding

This study is supported by the National Natural Science Foundation of China (grants 42394124, 42475076, 42175088 and 42405002). Dr. Hao Huang is supported by the Cemac “GeoX” Interdisciplinary Program (Grant No. 020714380210) and the Open Research Program of the State Key Laboratory of Severe Weather (Grant No. 2023LASW-A01).

Data Availability Statement

CMORPH precipitation products are available at https://www.ncei.noaa.gov/data/cmorph-high-resolution-global-precipitation-estimates/access/ (accessed on 28 May 2024). TRMM data are available at https://gpm.nasa.gov/data/ (accessed on 8 January 2024). GPM data are available at https://gpm.nasa.gov/data/ (accessed on 12 July 2024).

Acknowledgments

We would like to share our appreciation for NOAA, NASA and NASDA for providing available precipitation products.

Conflicts of Interest

The authors declare no conflicts of interest.

References

  1. Dai, A.; Rasmussen, R.M.; Liu, C.; Ikeda, K.; Prein, A.F. A new mechanism for warm-season precipitation response to global warming based on convection-permitting simulations. Clim. Dyn. 2020, 55, 343–368. [Google Scholar] [CrossRef]
  2. Hardwick Jones, R.; Westra, S.; Sharma, A. Observed relationships between extreme sub-daily precipitation, surface temperature, and relative humidity. Geophys. Res. Lett. 2010, 37, L22805. [Google Scholar] [CrossRef]
  3. Fu, Y.F.; Pan, X.; Xian, T.; Liu, G.S.; Zhong, L.; Liu, Q.; Li, R.; Wang, Y.; Ma, M. Precipitation characteristics over the steep slope of the Himalayas in rainy season observed by TRMM PR and VIRS. Clim. Dyn. 2018, 51, 1971–1989. [Google Scholar] [CrossRef]
  4. Zhou, T.J.; Ren, L.W.; Zhang, W.X. Anthropogenic influence on extreme Meiyu rainfall in 2020 and its future risk. Sci. China Earth Sci. 2021, 64, 1633–1644. [Google Scholar] [CrossRef]
  5. Espeholt, L.; Agrawal, S.; Sønderby, C.; Kumar, M.; Heek, J.; Bromberg, C.; Gazen, C.; Carver, R.; Andrychowicz, M.; Hickey, J.; et al. Deep learning for twelve hour precipitation forecasts. Nat. Commun. 2022, 13, 1–10. [Google Scholar] [CrossRef]
  6. Ding, Z.M.; Zhai, P.M.; Wu, R.G. Recent change in summer rainfall over the Tibetan Plateau: Roles of anthropogenic forcing and internal variability. Clim. Dyn. 2023, 61, 1887–1902. [Google Scholar] [CrossRef]
  7. Yu, R.C.; Xu, Y.P.; Zhou, T.J.; Li, J. Relation between rainfall duration and diurnal variation in the warm season precipitation over central eastern China. Geophys. Res. Lett. 2007, 34, L13703. [Google Scholar] [CrossRef]
  8. Shen, Y.; Zhao, P.; Pan, Y.; Yu, J.J. A high spatiotemporal gauge-satellite merged precipitation analysis over China. J. Geophys. Res. Atmos. 2014, 119, 3063–3075. [Google Scholar] [CrossRef]
  9. Wu, G.C.; Li, Y.; Qin, S.; Mao, Y.N.; Wang, K.C. Precipitation unevenness in gauge observations and eight reanalyses from 1979 to 2018 over China. J. Clim. 2021, 34, 9797–9810. [Google Scholar] [CrossRef]
  10. Zhang, Y.X.; Ren, Y.Y.; Ren, G.Y.; Wang, G.F. Precipitation trends over mainland China from 1961–2016 after removal of measurement biases. J. Geophys. Res. Atmos. 2020, 125, e2019JD031728. [Google Scholar] [CrossRef]
  11. Fu, Y.F.; Chen, F.J.; Liu, G.S.; Yang, Y.J.; Yuan, R.M.; Li, R.; Liu, Q.; Wang, Y.; Zhong, L.; Sun, L. Recent trends of summer convective and stratiform precipitation in mid-eastern China. Sci. Rep. 2016, 6, 33044. [Google Scholar] [CrossRef] [PubMed]
  12. Zhou, Y.P.; Nelson, K.; Mohr, K.I.; Huffman, G.J.; Levy, R.; Grecu, M. A spatial-temporal extreme precipitation database from GPM IMERG. J. Geophys. Res. Atmos. 2019, 124, 10344–10363. [Google Scholar] [CrossRef]
  13. Gu, S.Y.; Zhang, P.; Chen, L.; Shang, J.; Zhang, H.W.; Lin, M.Y.; Zhu, A.J.; Jia, S.Z.; Yin, H.G.; Sun, F.L.; et al. Overview and prospect of the detection capability of China’s first precipitation measurement satellite FY-3G. Torrential Rain Disasters 2023, 42, 489–498. (In Chinese) [Google Scholar]
  14. Wu, Y.; Li, P.; Chen, H. The characteristic and seasonal variation of mesoscale convective systems’ precipitation over North China. Q. J. R. Meteorol. Soc. 2023, 149, 2348–2366. [Google Scholar] [CrossRef]
  15. Schumacher, C.; Houze, R.A. The TRMM precipitation radar’s view of shallow, isolated rain. J. Appl. Meteorol. Climatol. 2003, 42, 1519–1524. [Google Scholar] [CrossRef]
  16. Hamada, A.; Takayabu, Y.N. Improvements in detection of light precipitation with the Global Precipitation Measurement dual-frequency precipitation radar (GPM DPR). J. Atmos. Ocean. Technol. 2016, 33, 653–667. [Google Scholar] [CrossRef]
  17. Behrangi, A.; Song, Y.; Huffman, G.J.; Adler, R.F. Comparative analysis of the latest global oceanic precipitation estimates from GPM V07 and GPCP V3. 2 products. J. Hydrometeorol. 2024, 25, 293–309. [Google Scholar] [CrossRef]
  18. Li, Z.; Chen, H.N.; Cifelli, R.; Xie, P.P.; Chen, X.D. Characterizing the uncertainty of CMORPH products for estimating orographic precipitation over Northern California. J. Hydrol. 2024, 643, 131921. [Google Scholar] [CrossRef]
  19. Peng, F.C.; Zhao, S.H.; Chen, C.; Cong, D.M.; Wang, Y.M.; Ouyang, H.D. Evaluation and comparison of the precipitation detection ability of multiple satellite products in a typical agriculture area of China. Atmos. Res. 2020, 236, 104814. [Google Scholar] [CrossRef]
  20. Sohn, B.J.; Han, H.J.; Seo, E.K. Validation of satellite-based high-resolution rainfall products over the Korean Peninsula using data from a dense rain gauge network. J. Appl. Meteorol. Climatol. 2010, 49, 701–714. [Google Scholar] [CrossRef]
  21. Gao, Y.C.; Liu, M.F. Evaluation of high-resolution satellite precipitation products using rain gauge observations over the Tibetan Plateau. Hydrol. Earth Syst. Sci. 2013, 17, 837–849. [Google Scholar] [CrossRef]
  22. Liu, P.; Fu, Y.F.; Feng, S.; Cao, A.Q.; Yang, Y.J.; Li, T.Y.; Zi, Y. A comparison of the precipitation from rain gauge observations with from TRMM PR measurements in the southern China. Acta Meteorol. Sin. 2010, 68, 822–835. (In Chinese) [Google Scholar]
  23. Chen, H.Q.; Yong, B.; Qi, W.Q.; Wu, H. Investigating the evaluation uncertainty for satellite precipitation estimates based on two different ground precipitation observation products. J. Hydrometeorol. 2020, 21, 2595–2606. [Google Scholar] [CrossRef]
  24. Nesbitt, S.W.; Zipser, E.J. The diurnal cycle of rainfall and convective intensity according to three years of TRMM measurements. J. Clim. 2003, 16, 1456–1475. [Google Scholar] [CrossRef]
  25. Fu, Y.F.; Yang, L.; Wu, Z.H.; Zhang, P.; Gu, S.Y.; Chen, L.; Nan, S. A New Algorithm of Rain Type Classification for GPM Dual-Frequency Precipitation Radar in Summer Tibetan Plateau. Adv. Atmos. Sci. 2024, 41, 2093–2111. [Google Scholar] [CrossRef]
  26. Zhou, T.J.; Yu, R.C.; Chen, H.M.; Dai, A.G.; Pan, Y. Summer precipitation frequency, intensity, and diurnal cycle over China: A comparison of satellite data with rain gauge observations. J. Clim. 2008, 21, 3997–4010. [Google Scholar] [CrossRef]
  27. Chen, C.; Chen, Q.W.; Duan, Z.; Zhang, J.Y.; Mo, K.L.; Li, Z.; Tang, G.Q. Multiscale comparative evaluation of the GPM IMERG v5 and TRMM 3B42 v7 precipitation products from 2015 to 2017 over a climate transition area of China. Remote Sens. 2018, 10, 944. [Google Scholar] [CrossRef]
  28. Xu, F.L.; Guo, B.; Ye, B.; Ye, Q.; Chen, H.N.; Ju, X.H.; Guo, J.Y.; Wang, Z.L. Systematical evaluation of GPM IMERG and TRMM 3B42V7 precipitation products in the Huang-Huai-Hai Plain, China. Remote Sens. 2019, 11, 697. [Google Scholar] [CrossRef]
  29. Deo, A.; Munchak, S.J.; Walsh, K.J.E. Cross Validation of Rainfall Characteristics Estimated from the TRMM PR, a Combined PR–TMI Algorithm, and a C-POL Ground Radar during the Passage of Tropical Cyclone and Nontropical Cyclone Events over Darwin, Australia. J. Atmos. Ocean. Technol. 2018, 35, 2339–2358. [Google Scholar] [CrossRef]
  30. Chen, H.N.; Chandrasekar, V.; Tan, H.M.; Cifelli, R. Rainfall estimation from ground radar and TRMM precipitation radar using hybrid deep neural networks. Geophys. Res. Lett. 2019, 46, 10669–10678. [Google Scholar] [CrossRef]
  31. Lasser, M.; O, S.; Foelsche, U. Evaluation of GPM-DPR precipitation estimates with WegenerNet gauge data. Atmos. Meas. Tech. 2019, 12, 5055–5070. [Google Scholar] [CrossRef]
  32. Deng, K.Q.; Yang, S.; Gu, D.J.; Lin, A.L.; Li, C.H. Record-breaking heat wave in southern China and delayed onset of South China Sea summer monsoon driven by the Pacific subtropical high. Clim. Dyn. 2020, 54, 3751–3764. [Google Scholar] [CrossRef]
  33. Zhang, W.X.; Zhou, T.J. Increasing impacts from extreme precipitation on population over China with global warming. Sci. Bull. 2020, 65, 243–252. [Google Scholar] [CrossRef]
  34. Chen, G.X.; Du, Y.; Wen, Z.P. Seasonal, interannual, and interdecadal variations of the East Asian summer monsoon: A diurnal-cycle perspective. J. Clim. 2021, 34, 4403–4421. [Google Scholar] [CrossRef]
  35. Joyce, R.J.; Janowiak, J.E.; Arkin, P.A.; Xie, P.P. CMORPH: A method that produces global precipitation estimates from passive microwave and infrared data at high spatial and temporal resolution. J. Hydrometeorol. 2004, 5, 487–503. [Google Scholar] [CrossRef]
  36. Habib, E.; Haile, A.T.; Tian, Y.D.; Joyce, R. Evaluation of the high-resolution CMORPH satellite rainfall product using dense rain gauge observations and radar-based estimates. J. Hydrometeorol. 2012, 13, 1784–1798. [Google Scholar] [CrossRef]
  37. Kummerow, C.; Barnes, W.; Kozu, T.; Shiue, J. The tropical rainfall measuring mission (TRMM) sensor package. J. Atmos. Ocean. Technol. 1998, 15, 809–817. [Google Scholar] [CrossRef]
  38. Liu, Z.; Ostrenga, D.; Teng, W.; Kempler, S.J. Tropical Rainfall Measuring Mission (TRMM) precipitation data and services for research and applications. Bull. Am. Meteorol. Soc. 2012, 93, 1317–1325. [Google Scholar] [CrossRef]
  39. Schumacher, C.; Houze, R.A., Jr.; Kraucunas, I. The tropical dynamical response to latent heating estimates derived from the TRMM precipitation radar. J. Atmos. Sci. 2004, 61, 1341–1358. [Google Scholar] [CrossRef]
  40. Kubota, T.; Yoshida, N.; Urita, S.; Iguchi, T.; Seto, S.; Meneghini, R. Evaluation of precipitation estimates by at-launch codes of GPM/DPR algorithms using synthetic data from TRMM/PR observations. IEEE J. Sel. Top. Appl. Earth Obs. Remote Sens. 2014, 7, 3931–3944. [Google Scholar] [CrossRef]
  41. Iguchi, T.; Seto, S.; Meneghini, R.; Yoshida, N.; Awaka, J.; Le, M.; Chandrasekar, V.; Brodzik, S.; Kubota, T. GPM/DPR Level-2 Algorithm Theoretical Basis Document; NASA Goddard Space Flight Center: Greenbelt, MD, USA, 2010.
  42. Hou, A.Y.; Kakar, R.K.; Neeck, S.; Azarbarzin, A.A.; Kummerow, C.D.; Kojima, M.; Oki, R.; Nakamura, K.; Iguchi, T. The global precipitation measurement mission. Bull. Am. Meteorol. Soc. 2014, 95, 701–722. [Google Scholar] [CrossRef]
  43. Skofronick-Jackson, G.; Petersen, W.A.; Berg, W.; Kidd, C.; Stocker, E.F.; Kirschbaum, D.B.; Kakar, R.; Braun, S.A.; Huffman, G.J.; Iguchi, T.; et al. The Global Precipitation Measurement (GPM) mission for science and society. Bull. Am. Meteorol. Soc. 2017, 98, 1679–1695. [Google Scholar] [CrossRef] [PubMed]
  44. Shen, Z.H.; Yong, B.; Yi, L.; Wu, H.; Xu, H. From TRMM to GPM, how do improvements of post/near-real-time satellite precipitation estimates manifest? Atmos. Res. 2022, 268, 106029. [Google Scholar] [CrossRef]
  45. Wang, X.N.; Ding, Y.J.; Zhao, C.C.; Wang, J. Similarities and improvements of GPM IMERG upon TRMM 3B42 precipitation product under complex topographic and climatic conditions over Hexi region, Northeastern Tibetan Plateau. Atmos. Res. 2019, 218, 347–363. [Google Scholar] [CrossRef]
  46. Tang, G.Q.; Wen, Y.X.; Gao, J.Y.; Long, D.; Ma, Y.Z.; Wan, W.; Hong, Y. Similarities and differences between three coexisting spaceborne radars in global rainfall and snowfall estimation. Water Resour. Res. 2017, 53, 3835–3853. [Google Scholar] [CrossRef]
  47. Fu, Y.F.; Zhang, A.M.; Liu, Y.; Zheng, Y.Y.; Hu, Y.F.; Feng, S.; Cao, A.Q. Characteristics of seasonal scale convective and stratiform precipitation in Asia based on measurements by TRMM Precipitation Radar. Acta Meteorol. Sin. 2008, 66, 730–746. (In Chinese) [Google Scholar]
  48. Wang, R.; Tian, W.S.; Chen, F.J.; Wei, D.; Luo, J.L.; Tian, H.Y.; Zhang, J.K. Analysis of convective and stratiform precipitation characteristics in the summers of 2014–2019 over Northwest China based on GPM observations. Atmos. Res. 2021, 262, 105762. [Google Scholar] [CrossRef]
  49. Chen, F.J.; Wang, R.; Liu, P.; Yu, L.; Feng, Y.; Zheng, X.Y.; Gao, J.L. Evaluation of GPM IMERG and error sources for tropical cyclone precipitation over eastern China. J. Hydrol. 2023, 627, 130384. [Google Scholar] [CrossRef]
  50. Qie, X.S.; Wu, X.K.; Yuan, T.; Bian, J.C.; Lü, D. Comprehensive pattern of deep convective systems over the Tibetan Plateau–South Asian monsoon region based on TRMM data. J. Clim. 2014, 27, 6612–6626. [Google Scholar] [CrossRef]
  51. Liu, C.; Zipser, E.J. The global distribution of largest, deepest, and most intense precipitation systems. Geophys. Res. Lett. 2015, 42, 3591–3595. [Google Scholar] [CrossRef]
  52. Chen, S.; Hong, Y.; Cao, Q.; Gourley, J.J.; Kirstetter, P.E.; Yong, B.; Tian, Y.; Zhang, Z.; Shen, Y.; Hu, J. Similarity and difference of the two successive V6 and V7 TRMM multisatellite precipitation analysis performance over China. J. Geophys. Res. Atmos. 2013, 118, 13060–13074. [Google Scholar] [CrossRef]
  53. Zeng, Q.L.; Wang, Y.Q.; Chen, L.F.; Wang, Z.F.; Zhu, H.; Li, B. Inter-comparison and evaluation of remote sensing precipitation products over China from 2005 to 2013. Remote Sens. 2018, 10, 168. [Google Scholar] [CrossRef]
  54. Wang, T.C.; Tang, G.Q. Spatial variability and linkage between extreme convections and extreme precipitation revealed by 22-year space-borne precipitation radar data. Geophys. Res. Lett. 2020, 47, e2020GL088437. [Google Scholar] [CrossRef]
  55. Gao, J.Y.; Tang, G.Q.; Hong, Y. Similarities and improvements of GPM dual-frequency precipitation radar (DPR) upon TRMM precipitation radar (PR) in global precipitation rate estimation, type classification and vertical profiling. Remote Sens. 2017, 9, 1142. [Google Scholar] [CrossRef]
  56. Wang, R.; Jiang, Z.S.; Chen, F.J.; Tian, W.S.; Li, L.L.; Tian, H.Y.; Luo, J.L. Comprehensive properties of non-penetrating and penetrating deep convection precipitation in summer over the Tibetan Plateau derived from GPM observations. Atmos. Res. 2023, 295, 107000. [Google Scholar] [CrossRef]
  57. Nakamura, K. Progress from TRMM to GPM. J. Meteorol. Soc. Japan. Ser. II 2021, 99, 697–729. [Google Scholar] [CrossRef]
  58. Iguchi, T.; Kozu, T.; Meneghini, R.; Awaka, J.; Okamoto, K. Rain-profiling algorithm for the TRMM precipitation radar. J. Appl. Meteorol. 2000, 39, 2038–2052. [Google Scholar] [CrossRef]
  59. Seto, S.; Iguchi, T.; Oki, T. The basic performance of a precipitation retrieval algorithm for the global precipitation measurement mission’s single/dual-frequency radar measurements. IEEE Trans. Geosci. Remote Sens. 2013, 51, 5239–5251. [Google Scholar] [CrossRef]
  60. Haile, A.T.; Habib, E.; Rientjes, T. Evaluation of the climate prediction center (CPC) morphing technique (CMORPH) rainfall product on hourly time scales over the source of the Blue Nile River. Hydrol. Process. 2013, 27, 1829–1839. [Google Scholar] [CrossRef]
  61. Xie, P.P.; Joyce, R.; Wu, S.R.; Yoo, S.H.; Yarosh, Y.; Sun, F.Y.; Lin, R. Reprocessed, bias-corrected CMORPH global high-resolution precipitation estimates from 1998. J. Hydrometeorol. 2017, 18, 1617–1641. [Google Scholar] [CrossRef]
  62. Manual, I. Tropical Rainfall Measuring Mission (TRMM) Precipitation Radar Algorithm. 2005. Available online: https://www.eorc.jaxa.jp/TRMM/documents/PR_algorithm_product_information/pr_manual/PR_Instruction_Manual_V7_L1.pdf (accessed on 20 July 2011).
  63. Lau, K.M.; Wu, H.T. Climatology and changes in tropical oceanic rainfall characteristics inferred from Tropical Rainfall Measuring Mission (TRMM) data (1998–2009). J. Geophys. Res. Atmos. 2011, 116, D17111. [Google Scholar] [CrossRef]
  64. Ma, Y.Z.; Tang, G.Q.; Long, D.; Yong, B.; Zhong, L.Z.; Wan, W.; Hong, Y. Similarity and error intercomparison of the GPM and its predecessor-TRMM multisatellite precipitation analysis using the best available hourly gauge network over the Tibetan Plateau. Remote Sens. 2016, 8, 569. [Google Scholar] [CrossRef]
  65. Xu, R.; Tian, F.Q.; Yang, L.; Hu, H.C.; Lu, H.; Hou, A.Z. Ground validation of GPM IMERG and TRMM 3B42V7 rainfall products over southern Tibetan Plateau based on a high-density rain gauge network. J. Geophys. Res. Atmos. 2017, 122, 910–924. [Google Scholar] [CrossRef]
  66. Tang, G.Q.; Long, D.; Hong, Y.; Gao, J.Y.; Wan, W. Documentation of multifactorial relationships between precipitation and topography of the Tibetan Plateau using spaceborne precipitation radars. Remote Sens. Environ. 2018, 208, 82–96. [Google Scholar] [CrossRef]
Figure 1. Spatial distributions of average rain rates derived from (a) rain gauge, (b) CMORPH, (c) TRMM PR, (d) GPM KuPR over South China (SWC denotes the Southwest China, MEC denotes Middle-East China and SEC denotes Southeast China).
Remotesensing 17 02040 g001
Figure 2. Spatial distributions of (a,b) samples, (c,d) frequencies, (e,f) STHs, (g,h) LWP and (i,j) IWP of TRMM PR and GPM KuPR over South China.
Remotesensing 17 02040 g002
Figure 3. The variations of monthly rain rates derived from rain gauge, CMORPH, TRMM PR and GPM KuPR over (a) South China, (b) Southwest China, (c) Middle-East China and (d) Southeast China.
Remotesensing 17 02040 g003
Figure 4. The PDFs of rain rates derived from rain gauge, CMORPH, TRMM PR and GPM KuPR over (a) South China, (b) Southwest China, (c) Middle-East China and (d) Southeast China.
Remotesensing 17 02040 g004
Figure 5. The PDFs of LWP and IWP derived from TRMM PR and GPM KuPR over (a,e) South China, (b,f) Southwest China, (c,g) Middle-East China and (d,h) Southeast China.
Remotesensing 17 02040 g005
Figure 6. The CFADs of radar reflectivity derived from TRMM PR (top row) and GPM KuPR (bottom row) over (a,e) South China, (b,f) Southwest China, (c,g) Middle-East China and (d,h) Southeast China.
Remotesensing 17 02040 g006
Figure 7. Scatter plots of rain rates among rain gauge and CMORPH, TRMM PR, GPM KuPR over South China, respectively (The color bar denotes samples at each grid from the rain gauge observation and corresponding remote sensing observation).
Remotesensing 17 02040 g007
Figure 8. Box plots of (a) rain rates, (b) STHs, (c) LWP and (d) IWP derived from rain gauge, CMORPH, TRMM PR and GPM KuPR over South China (the black solid line in the box denotes the median and the red solid line denotes the average value, the whisker denotes the range of the value).
Remotesensing 17 02040 g008
Figure 9. Spatial distributions of ME (top row) and RMSE (bottom row) of rain rates over South China.
Remotesensing 17 02040 g009
Figure 10. Spatial distributions of (ac) POD, (df) FAR, (gi) BIAS and (jl) CSI over South China.
Remotesensing 17 02040 g010
Table 1. Comparison of main parameters of TRMM PR and GPM KuPR.
ParametersTRMM PRGPM KuPR
Launch time27 November 199728 February 2014
Swath width247 km245 km
Orbit inclination angle35°65°
Global coverage38°S~38°N68°S~68°N
Horizontal resolution~5 km~5 km
Vertical resolution250 m125 m
Maximum altitude20 km22 km
Band frequency13.8 GHz13.6 GHz
Detection threshold0.4 mm/h (17.0 dBZ)0.5 mm/h (18.0 dBZ)
Orbit data version2A25 V072A V06
Table 2. Statistical metrics, including ME, RMSE, POD, FAR, BIAS and CSI.
Statistical MetricsComputational FormulaPerfect Value
Mean Error (ME) i = 1 i = N ( R S i R G i ) N 0
Root Mean Square Error (RMSE) i = 1 i = N ( R S i R G i ) 2 N 0
Probability of Detection (POD) P O D = H H + M × 100 % 100%
False Alert Ratio (FAR) F A R = F H + F × 100 % 0%
Bias (BIAS) B I A S = H + F H + M 1
Critical Success Index (CSI) C S I = H H + F + M 1
RSi is rain rate from remote sensing observation (CMORPH, TRMM PR and GPM KuPR); RGi is rain rate from rain gauge observation. H refers to the number of samples correctly observed by both remote sensing observation and rain gauge observation. F denotes the number of samples falsely observed by remote sensing observation. M represents the number of samples that are not detected by either remote sensing or rain gauge observation.
Disclaimer/Publisher’s Note: The statements, opinions and data contained in all publications are solely those of the individual author(s) and contributor(s) and not of MDPI and/or the editor(s). MDPI and/or the editor(s) disclaim responsibility for any injury to people or property resulting from any ideas, methods, instructions or products referred to in the content.

