Abstract
The Northeastern China Gravity Monitoring Network (NCGMN; 40–50°N), a pioneering time-variable gravity monitoring system in high-latitude cold-temperate environments, serves as a critical infrastructure for geodynamic investigations of the Songliao Basin, Changbai Mountain volcanic zone, and northern Tan-Lu Fault Zone. To address the data reliability challenges posed by nonlinear dynamic drifts in spring-type relative gravimeters during mobile surveys, this study quantifies—for the first time—the non-smooth normal distribution characteristics of such drifts using the inaugural 2015 dataset from two CG-5 instruments. Results demonstrate a 7–15% reduction in mean dynamic drift rates compared to static conditions, with spatiotemporal variability governed by multi-physics field coupling (terrain undulation, thermal fluctuation, and barometric perturbation). A comprehensive correction framework—integrating a gravimetric line drift rate computation, multi-model validation, and absolute datum cross-validation—reveals gravity value discrepancies up to ±10 μGal across models. The innovative hybrid scheme combines local drift preprocessing (initial-point modeling, line fitting, variance-sum optimization) with global adjustment optimization, achieving the significant suppression of nonlinear drift errors. The variance-sum optimal and Bayesian adjustment hybrid synergizes local variance minimization and global temporal correlation priors, delivering the following: (1) 34% and 29% reductions in segment self-difference standard deviations versus classical and Bayesian adjustments; (2) 24% and 14% decreases in segment residual standard deviations; (3) 12% and 6% improvements in absolute datum cross-validation precision. This study establishes a foundation for the reliable extraction of μGal-level gravity signals, advancing high-precision gravity monitoring of seismicity, volcanic unrest, and fault zone deformation in complex terrains. By harmonizing local-scale accuracy with network-wide consistency, the framework sets a new benchmark for time-variable gravity studies in challenging environments.
1. Introduction
The terrestrial mobile gravity network in mainland China serves as a critical infrastructure for monitoring crustal deformation and seismic precursors. It employs a hybrid observation mode that integrates relative and absolute gravity measurements [1,2,3,4]. Among these instruments, spring-type relative gravimeters—exemplified by the Scintrex CG-5—are responsible for over 95% of dynamic data acquisition in mobile surveys due to their superior portability and high sampling rates. However, the synergistic effects of transportation-induced vibrations and environmental perturbations generate time-varying nonlinear dynamic drifts. These drifts constitute a primary technical barrier to achieving a μGal-level measurement precision [5] (1 μGal = 10−3 mGal). These nonlinear drifts not only obscure the μGal-scale gravity signals associated with tectonic deformation but also impede robust alignment between mobile survey data and absolute gravity reference frames [6,7].
The mobile gravity observation network is constructed through geometric linkages and physical constraints of gravimetric survey lines, establishing regional measurement systems. Its primary aim is to achieve dynamic monitoring and error control of regional gravity fields via cross-line geometric redundancies, closed-loop constraints, and absolute datum integration. Compared to static observations, mobile surveys face compounded challenges: frequent instrument relocation, abrupt environmental parameter shifts (e.g., temperature, pressure), and terrain-induced attitude perturbations. The complex interaction between the instrument response and multiple factors, termed multi-physics coupling effects, induces drift with pronounced nonlinear and time-varying characteristics [5,8,9]. These effects lead to spectral aliasing between the drift signal and genuine gravity variations, presenting a primary technical obstacle to extracting geophysically meaningful signals from observational data. Hence, developing a comprehensive understanding of these multi-physics coupling effects and implementing effective suppression strategies are essential prerequisites for achieving µGal-level precision in gravity measurement applications.
Traditional correction frameworks employ globally linear drift models [10,11], which assume spatiotemporally invariant drift rates. While suitable for stable instruments with minor drifts, these models exhibit pronounced limitations in resolving highly dynamic nonlinear drifts [6,12]. Bayesian adjustment methodologies address this by incorporating temporally smooth drift rate priors, enhancing both the correction efficiency and precision [1,7]. However, their reliance on smoothness assumptions conflicts with observed extreme nonlinear drift regimes in complex field environments, highlighting the necessity for advanced models capable of reconciling local heterogeneities with global constraints [13].
The Northeastern China Gravity Monitoring Network (NCGMN; 40°N–50°N) spans tectonically active regions, including the Songliao Basin, the northern segment of the Tan-Lu Fault Zone, and the Changbai Mountain volcanic zone. Its high-latitude cold-temperate environment exacerbates the complexity of instrument drift dynamics. Our research team finalized the network’s site selection and deployment in 2015, conducting its inaugural survey using a symmetric out-and-back survey protocol.
This study systematically delineates the network’s configuration parameters and data processing methodology. Utilizing the inaugural dataset, static and dynamic observational time series were analyzed to quantitatively characterize the spatiotemporal distribution of drift rates. Subsequently, a comprehensive correction framework was developed, integrating three core components: line-specific drift rate computation, multi-model comparative analysis, absolute datum constraints. This framework achieves the robust correction of nonlinear dynamic drifts in mobile gravity data. Finally, an optimized processing scheme is proposed, providing a high-precision technical foundation for reconstructing terrestrial time-variable gravity fields and advancing geodynamic investigations in active tectonic regions.
2. Data and Methods
2.1. Gravity Network
Tectonic activity in this region is dominantly governed by Pacific Plate subduction beneath the Eurasian Plate, driving the formation of Cenozoic intraplate volcanic clusters—notably the Changbai Mountain, Wudalianchi, and Jingpo Lake volcanic systems [14]. Seismicity is concentrated along three major fault systems: the Yilan-Yitong Fault, Mishan-Dunhua Fault, and Northern segment of the Tan-Lu Fault Zone. These systems exhibit frequent moderate-to-strong earthquakes (M ≥ 5.0), with the most significant recorded event being the 1975 Haicheng M7.3 earthquake, which was a milestone in seismic precursor studies.
From August to October 2015, our team completed the inaugural survey of the NCGMN over a 48-day campaign (Figure 1a). The network configuration comprises 8 absolute gravity reference stations, 130 relative gravity observation points, and 152 gravimetric survey segments, organized into 22 closed-loop circuits with error propagation constraints (maximum segment count per loop: 14) and 12 branch survey lines. The key closed-loop parameters are summarized in Table 1, including a mean loop area of 21,485 km2 (σ = 11,368 km2), mean perimeter of 613 km (σ = 172 km), and mean closure time of 12 days (σ = 10 days). The statistical analysis of network parameters reveals elevation ranges of 8–795 m (μ = 235 m, Figure 1b), segment spacing of 0–170 km (μ = 79 km, Figure 1c), and gravity segment differences of 0–137 mGal (μ = 38 mGal, Figure 1d). It is acknowledged that with a mean segment spacing of approximately 79 km, some degree of sampling error could be present, potentially contributing a minor component to overall network discrepancies, such as closed-loop misfits [15].
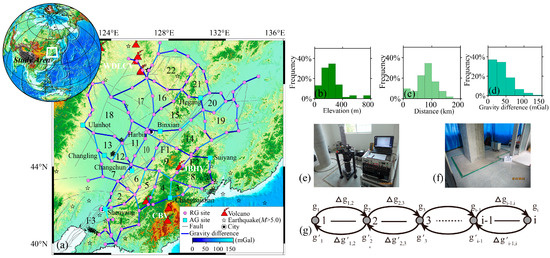
Figure 1.
(a) Tectonic background of the study area and distribution of the gravity-monitoring network. CBV: Changbaishan volcano group; JBHV: Jingpo Lake volcano group; WDLCV: Wudalianchi volcano group; F1: Yilan-Yitong fault; F2: Mishan-Dunhua fault; F3: Northern segment of the Tan-Lu fault zone. (b) Gravity survey point elevation distribution. (c) Gravity segment distance distribution. (d) Gravity segment difference distribution. (e) Schematic diagram of absolute gravity measurements. (f) Schematic diagram of relative gravity measurements. (g) Schematic diagram of symmetric out-and-back survey protocol.

Table 1.
Closed-loop parameters of the gravity monitoring network.
2.1.1. Absolute Gravity Measurements
Absolute gravity measurements were performed using an FG-5 absolute gravimeter (Figure 1e). Each measurement station underwent ≥25 h of continuous observation, generating 25 validated datasets (100 free-fall drops per dataset). Post-processing corrections were implemented to account for solid Earth tides, ocean tidal loading, atmospheric pressure variations, polar motion, and vertical gravity gradients, using the g9 software suite [16]. The single-point measurement precision achieved a standard deviation of σ < 5 μGal, with vertical gradient (VG) determination errors constrained to <0.03 μGal/cm [17].
2.1.2. Relative Gravity Measurements
Relative gravity measurements were conducted using two Scintrex CG-5 gravimeters (Serial #1229 and #1235; Figure 1f) following a symmetric out-and-back survey protocol (observation path: 1 → 2 → 3…i − 1 → i → i − 1… → 3 → 2 → 1; Figure 1g). Segment closure was constrained to ≤72 h, with 76% of segments achieving intraday closure (≤24 h). Local noise sources—including instrument tilt and microseismic vibrations—were suppressed via integrated tilt sensors and adaptive noise-filtering algorithms [18]. Each measurement station was continuously observed for ≥10 min, with 40 s sliding averages computed to mitigate high-frequency noise. Triplicate readings with mutual deviations < 5 μGal were averaged to derive the final gravity value, ensuring rigorous data quality control.
2.2. Relative Gravity Data Processing
The preprocessing of relative gravity data necessitates a series of corrections to mitigate environmental perturbations and instrumental systematic errors, as systematically outlined in the following sections:
- 1.
- Solid Earth Tide Correction
Solid Earth tides generate μGal-level gravity variations arising from periodic crustal deformation driven by lunar–solar gravitational forcing. The tidal correction term is formulated as follows [19]:
where denotes the gravimetric tidal factor, represents the permanent tidal direct effect, and and correspond to the geodetic latitude and geocentric latitude of the measurement station, respectively.
- 2.
- Barometric Correction
Atmospheric pressure variations perturb gravity fields via surface loading effects. The barometric correction term is formulated as follows [20]:
where denotes the measured atmospheric pressure value, represents the standard atmospheric pressure, and corresponds to the elevation of the measurement station.
- 3.
- Instrument Height Correction
Errors in gravity measurements are introduced by sensor height variations due to the VG of the gravitational field. The height correction term , which reduces observations to the reference pillar datum, is formulated as follows:
where denotes the vertical height of the relative gravimeter sensor platform. It should be noted that the use of a standard VG of −0.3086 mGal/m is an approximation. In areas with significant topographic relief, such as parts of the NCGMN, the actual local VG can deviate from this standard value. For typical instrument height variations h (usually within 1 cm), the resulting error due to using the normal VG instead of the true local VG is generally expected to be sub-µGal. However, this remains a potential minor error source, and future campaigns would benefit from local VG measurements, where feasible, particularly at stations with significant setup height variability or in highly rugged terrains.
- 4.
- Drift Correction
Dynamic drift correction constitutes a critical procedure in mobile gravity survey data processing. The drift correction term , which compensates for time-dependent instrument drift, is formulated as follows:
where denotes the segment observation duration, and represents the time-dependent dynamic drift rate. Static drift corrections are prioritized if segments are not closed within a day or contain static observation intervals.
2.3. Dynamic Drift Rate Processing
2.3.1. Classical Adjustment Model
The observation equation is expressed as follows:
where denotes the gravity observation design matrix, represents the temporal configuration matrix, corresponds to gravity values at measurement stations, is the time-invariant drift rate, and signifies the observation noise vector.
The gravity values and instrument drift rate are estimated using the least squares method [1]:
2.3.2. Bayesian Adjustment Model
Assuming that the dynamic drift rate is a temporally smooth function, it is decomposed into a parameter vector , regularized through a second-order temporal difference matrix to enforce smoothness:
where the hyperparameter governs the regularization strength of the temporal smoothness constraint on the drift rate .
The hyperparameters (noise variance) and (drift smoothness regularization parameter) are optimized via Akaike’s Bayesian Information Criterion (ABIC) [1,7,21] to balance model fidelity and complexity:
where denotes the number of hyperparameters, and represents the marginal likelihood function.
Following hyperparameter optimization, the gravity values and drift rates are estimated [7]:
2.3.3. Symmetric Observation Model for Gravimetric Lines
The local drift rates associated with individual gravimetric survey lines can be systematically estimated through out-and-back gravity observations and synchronized time series datasets.
- 1.
- Initial-Point Model
The instrument drift rate is determined via repeated gravity observations at the starting and returning phases of the gravimetric survey line’s initial station, expressed as follows:
where and are the gravity values measured at the initial station during the outbound and return surveys, respectively, and and denote the corresponding observation times.
- 2.
- Line-Fitting Model
The gravimetric line-fitting model estimates the drift rate by incorporating all measurement points along the survey line. The optimal drift rate is derived using the least squares method, minimizing the sum of squared residuals between outbound and return gravity observations. The mathematical formulation is expressed as follows:
where and denote the gravity values at the i-th measurement point during the outbound and return surveys, respectively, and and represent the corresponding observation times.
- 3.
- Piecewise Linear Model
The piecewise linear drift model permits abrupt drift rate variations between adjacent segments, enabling localized drift correction. For the segment spanning from point to , the drift rate is computed as follows:
where and denote the gravity values at the (i − 1)-th measurement point during the outbound and return surveys, respectively, and and represent the corresponding observation times. This model guarantees zero variance in out-and-back segment differences post-correction, achieved by enforcing strict consistency between forward and reverse observations.
- 4.
- Variance-Sum Optimal Model
When the instrument drift rate exhibits stability, the variance-sum optimal model identifies the optimal drift rate by minimizing the total variance of discrepancies between outbound and return segment differences. The optimization problem is expressed as follows:
where denotes the deviation between observed and averaged segment differences, and represents the number of segments. This model employs variance minimization to derive the drift rate that optimally reconciles discrepancies between forward and reverse observations, ensuring statistical robustness in dynamic survey environments.
2.4. Quality Assessment
2.4.1. Primary Quality Metric (Segment Self-Difference)
The segment self-difference measures the disagreement between gravity differences obtained during outbound and return surveys for the i-th segment. It is calculated as follows:
where and denote the gravity differences for the i-th segment during outbound and return surveys. To ensure data quality, a threshold of is enforced. Observations exceeding this threshold are flagged for re-evaluation.
2.4.2. Secondary Quality Metric (Closed-Loop Misfit)
The closed-loop misfit , a key quality-control parameter, is evaluated across 22 closed loops (maximum perimeter: 963 km) to assess systematic errors in the gravity network. It is formulated as follows:
where denotes the mean gravity difference of the i-th segment, and represents the number of segments within the closed loop (4 ≤ n ≤ 14).
2.4.3. Tertiary Quality Metric (Adjustment Validation)
To ensure the reliability of adjustment results, two independent validation metrics are employed: segment residual analysis and absolute datum cross-validation.
- 1.
- Segment Residuals Analysis
The segment residual quantifies the discrepancy between the observed gravity difference for a segment and the corresponding gravity difference derived from the adjusted station gravity values after network optimization. It is defined as follows:
where denotes the observed gravity difference for a segment, and represents the adjusted gravity difference after network optimization. This residual is analogous to the observation corrections in a least-squares adjustment, indicating how much the original observations deviate from the optimized network solution.
- 2.
- Absolute Datum Cross-Validation
The cross-validation residual evaluates the alignment between adjusted gravity values and absolute gravity benchmarks:
where denotes the adjusted gravity value at a station, and represents the FG-5 absolute gravimeter measurement at the same station.
3. Results
3.1. Static Drift Test
The drift characteristics of two Scintrex CG-5 relative gravimeters (Serial #1229 and #1235) were evaluated through 12 h static observations at the Changbai Mountain Volcano Monitoring Station, Jilin Province, China, during 18–19 September 2015. Results (Figure 2) reveal the following: Instruments #1229 and #1235 exhibited linear drift trends of 0.0973 mGal/h and 0.0688 mGal/h, respectively; 99.6% of residuals satisfied ∣Δgres∣ < 5 μGal (Figure 2b), with residual standard deviations of 1.29 μGal (#1229) and 1.16 μGal (#1235). These results demonstrate that these two CG-5 gravimeters exhibit good stability and repeatability during long-term observations, making them suitable for high-precision crustal deformation and gravity change monitoring tasks.
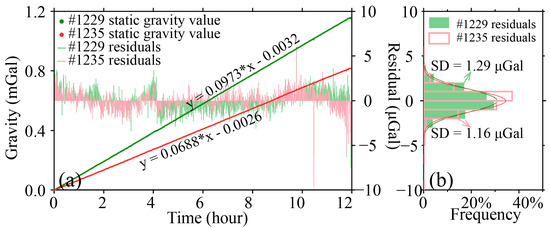
Figure 2.
(a) Static drift characterization of CG-5 gravimeters. (b) Statistical results of the drift residuals.
3.2. Dynamic Drift Test
Based on continuous stable observational data (≥10 min per station), this study investigated drift characteristics under mobile survey conditions. At the Shenyang site (ID: 10112500) on 2 October 2015 (Figure 3), dynamic drift rates of 0.0896 mGal/h (#1229) and 0.0532 mGal/h (#1235) were observed. Linear regression analysis yielded high correlation coefficients (r = 0.997 for #1229; r = 0.980 for #1235), with residual standard deviations of 1.8 μGal and 2.7 μGal, respectively, confirming robust reliability of the drift models.
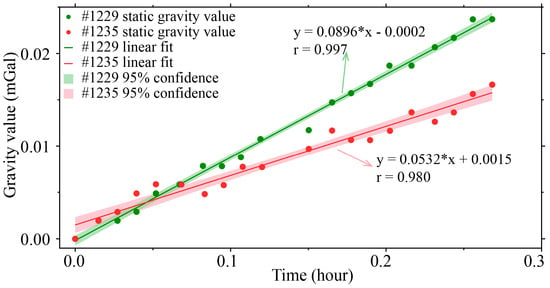
Figure 3.
Results of the dynamic drift test at the Shenyang site.
Extending this methodology to 48-day network-wide data, drift rates were filtered using thresholds of r > 0.9 and σ < 5 μGal (Figure 4). Key findings include the following: (1) dynamic drift time series exhibited pronounced spatiotemporal variability, with nonlinear oscillation amplitudes reaching Δk = 0.1064 mGal/h (#1229) and Δk = 0.1256 mGal/h (#1235), while smooth temporal trends remained negligible; (2) a statistical analysis revealed that dynamic drift rates for both instruments followed normal distributions—N(0.0902,0.01872) for #1229 and N(0.0586,0.01992) for #1235; (3) mean dynamic drift rates decreased by 7% (#1229) and 15% (#1235) compared to static conditions.
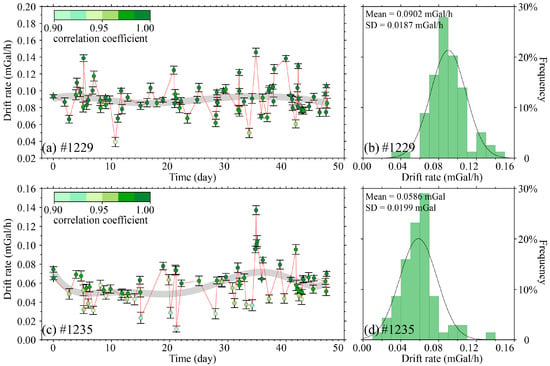
Figure 4.
(a) Dynamic drift rate of #1229. (b) Statistical of the dynamic drift rate of #1229. (c) Dynamic drift rate of #1235. (d) Statistical of the dynamic drift rate of #1235.
3.3. Dynamic Drift Computation
This study compared drift rate estimations from the classical adjustment (CLS) and Bayesian adjustment (BAY) models (Figure 5). The CLS model determined linear drift rates of 0.0957 mGal/h (#1229) and 0.0677 mGal/h (#1235). In contrast, the BAY model resolved time-dependent drift variability. For example, for #1229, drift rates oscillated between 0.091 and 0.098 mGal/h (mean = 0.0953 mGal/h), while #1235 exhibited variations within 0.063–0.071 mGal/h (mean = 0.0673 mGal/h). The mean discrepancy between models was negligible (0.4%), with both showing a 2.1% reduction in drift rates compared to static conditions.
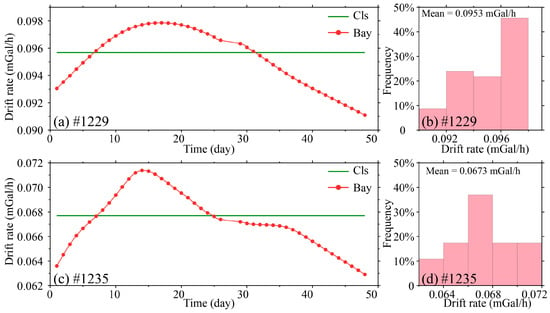
Figure 5.
Drift rate estimations from the classic adjustment model and the Bayesian adjustment model. (a) Drift rate estimations of #1229. (b) Statistical results of the drift rate estimated using the Bayesian model for #1229. (c) Drift rate estimations of #1235. (d) Statistical results of the drift rate estimated using the Bayesian model for #1235.
Figure 6 illustrates drift rate distributions across gravimetric line models. Under single-segment conditions, all models produced consistent estimates. For multi-segment configurations, the maximum mean drift rate differences between the initial-point (1st), line-fitting (Fit), and variance-sum optimal (Opt) models were 0.0016 mGal/h (#1229) and 0.0014 mGal/h (#1235). The piecewise linear model (Pie) displayed the highest dispersion, with drift rate ranges spanning 0.0714–0.1079 mGal/h (#1229) and 0.0422–0.0869 mGal/h (#1235), reflecting its sensitivity to localized environmental noise.
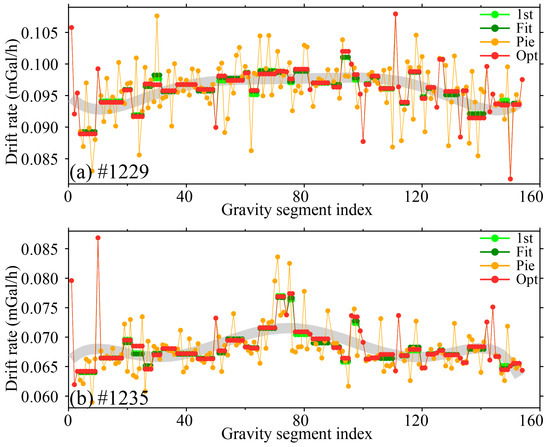
Figure 6.
Comparative analysis of the symmetric observation model for gravimetric lines.
The two CG-5 gravimeters exhibited distinct responses to identical environmental perturbations (Figure 7). For #1229, drift rates correlated prominently with temperature variations (ΔT; r = 0.69) but weakly with barometric fluctuations (ΔP; r = −0.13). Conversely, #1235 showed a weaker temperature correlation (r = 0.30) but stronger anti-correlation with pressure (r = −0.54). Figure 8 further delineates the geospatial distribution of drift variability, highlighting amplified oscillations in regions of significant topographic relief. This spatial pattern implies synergistic interactions between terrain-induced vibrational modulation and sensor posture disturbances, which collectively drive nonlinear drift evolution in mobile surveys.
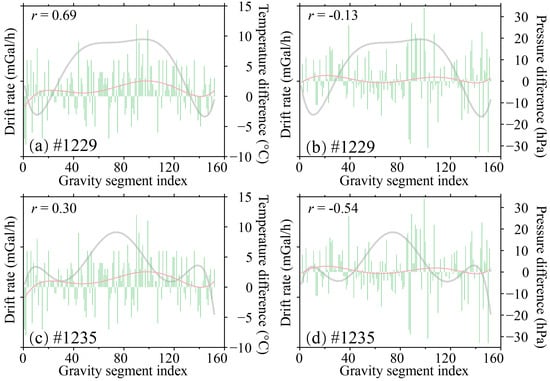
Figure 7.
Correlation between dynamic drift rate variations and temperature/pressure fluctuations. (a) Correlation between the drift rate variation of #1229 and temperature fluctuations. (b) Correlation between the drift rate variation of #1229 and pressure fluctuations. (c) Correlation between the drift rate variation of #1235 and temperature fluctuations. (d) Correlation between the drift rate variation of #1235 and pressure fluctuations. The gray solid line represents the fitted results of the drift rate variation, while the red solid line represents the fitted results of temperature/pressure fluctuation.
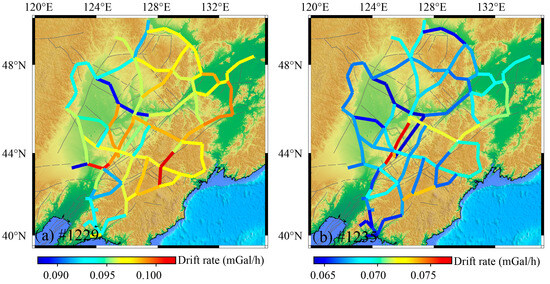
Figure 8.
Geospatial distribution characteristics of dynamic drift rates.
3.4. Drift Correction Performance Evaluation
3.4.1. Segment Self-Difference Analysis
The performance of drift correction models was evaluated using segment self-differences (Δs). For segment self-differences (Figure 9), classical adjustment (CLS) and Bayesian adjustment (BAY) models exhibited residual systematic biases in spatial distributions linked to unresolved nonlinear drifts, with exceedance rates (|Δs| > 30 μGal) of 8% (CLS) and 4% (BAY), corresponding to standard deviations of 15.02 μGal and 14.04 μGal, respectively. The BAY model improved the correction accuracy over CLS by incorporating temporal correlation priors, whereas symmetric observation models demonstrated superior stability, showing random spatial distributions of self-differences (|Δs| ≤ 30 μGal). Among symmetric models, the variance-sum optimal model achieved the lowest standard deviation (9.97 μGal), outperforming the initial-point (10.07 μGal) and line-fitting (10.06 μGal) models, with reductions of 34% (vs. CLS) and 29% (vs. BAY) in residual variability, validating its efficacy in suppressing localized errors.
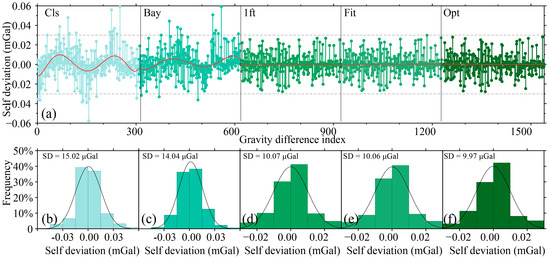
Figure 9.
Self-difference distribution between the adjustment model and the symmetric observation model of gravimetric lines. (a) Self-difference distribution. (b) Self-difference statistical results of the Cls model. (c) Self-difference statistical results of the Bay model. (d) Self-difference statistical results of the 1ft model. (e) Self-difference statistical results of the Fit model. (f) Self-difference statistical results of the Opt model.
3.4.2. Closed-Loop Misfit Validation
The performance of drift correction models was evaluated using closed-loop misfits (w). Closed-loop misfit analysis across 22 loops (Figure 10) revealed maximum misfits of |w| = 28 μGal (Loops 12–13), while all others exhibited |w| < 18 μGal, with standard deviations ranging from 10.86–10.90 μGal. Adjustment models slightly outperformed symmetric observation models in misfit reduction due to their global optimization of systematic errors. The BAY model achieved the lowest misfit standard deviation (10.54 μGal), reflecting a 1.2% improvement over CLS. The piecewise linear model performed the worst (σ = 10.90 μGal) due to its sensitivity to localized environmental noise, while the initial-point and variance-sum optimal symmetric models yielded comparable precision (σ = 10.86 μGal). These results underscore the trade-off between local error suppression (favored by symmetric models) and global systematic error mitigation (enhanced by adjustment frameworks) in nonlinear drift correction. These closed-loop misfits predominantly reflect the accumulated effect of uncorrected instrumental drifts and observational errors along the loop, though a minor contribution from spatial sampling error cannot be entirely excluded given the network’s station density [15].
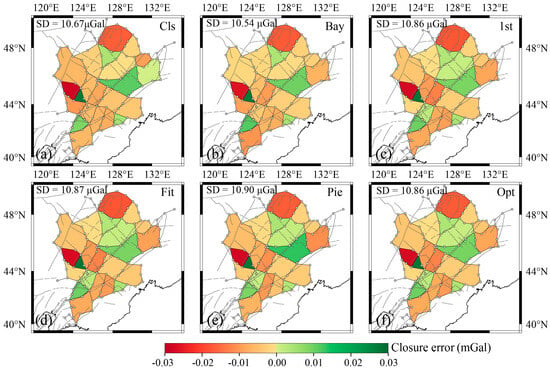
Figure 10.
Closed-loop difference distribution for the adjustment model and the symmetric observation model of gravimetric lines. (a) Closed-loop difference distribution of the Cls model. (b) Closed-loop difference distribution of the Bay model. (c) Closed-loop difference distribution of the 1st model. (d) Closed-loop difference distribution of the Fit model. (e) Closed-loop difference distribution of the Pie model. (f) Closed-loop difference distribution of the Opt model.
3.5. Gravity Network Adjustment Validation
This study evaluated the reliability of drift rate correction models through gravity network adjustment validation, employing dual metrics: segment residual analysis and absolute gravity datum cross-validation. The comparison group included standalone results from classical (CLS) and Bayesian (BAY) adjustment models, as well as hybrid schemes integrating classical/Bayesian adjustments with preprocessing via symmetric observation models.
3.5.1. Segment Residual Analysis
Figure 11 illustrates the segment residual distribution of the classical adjustment model. Raw residuals from the standalone CLS model (Figure 11a, panels I–V) exhibited significant systematic biases linked to nonlinear drifts, yielding a residual standard deviation of 9.02 μGal. Preprocessing with symmetric observation models reduced residuals to 5.37–7.07 μGal, showing spatially random distributions. The piecewise linear model achieved the lowest residual standard deviation (σ = 5.37 μGal), followed by the variance-sum optimal model (σ = 7.03 μGal). The Bayesian adjustment model (Figure 12) outperformed the classical method, achieving a standalone residual standard deviation of 7.97 μGal (12% reduction). Hybrid schemes further enhanced the performance: the piecewise linear-Bayesian combination yielded the lowest residuals (σ = 4.88 μGal), while the variance-sum optimal-Bayesian hybrid ranked second (σ = 6.89 μGal).
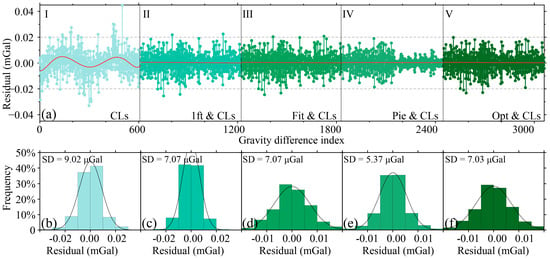
Figure 11.
Residuals of segment differences from the classic adjustment model and their comparison with the combined symmetric observation model. (a) Residuals of segment differences. (b) Residual statistical results of the Cls model. (c) Residual statistical results of the 1ft&Cls combination model. (d) Residual statistical results of the Fit&Cls combination model. (e) Residual statistical results of the Pie&Cls combination model. (f) Residual statistical results of the Opt&Cls combination model.
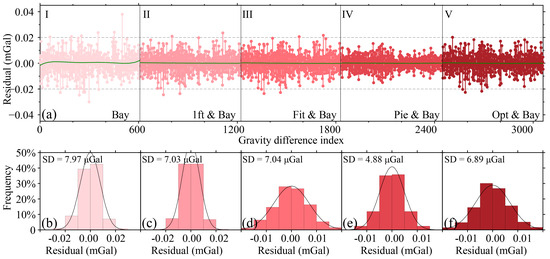
Figure 12.
Residuals of segment differences from the Bayesian adjustment model and their comparison with the combined symmetric observation model. (a) Residuals of segment differences. (b) Residual statistical results of the Bay model. (c) Residual statistical results of the 1ft&Bay combination model. (d) Residual statistical results of the Fit&Bay combination model. (e) Residual statistical results of the Pie&Bay combination model. (f) Residual statistical results of the Opt&Bay combination model.
3.5.2. Absolute Datum Cross-Validation
Figure 13 presents cross-validation results using an absolute gravity datum (stations A1–A8: Changchun, Binxian, Changling, Ulanhot, Suiyang, Changbai Mountain, Shenyang, Hegang). The classical adjustment exhibited a maximum deviation of Δmax = 23.62 μGal, whereas the Bayesian adjustment achieved Δmax = 21.51 μGal. Despite superior segment residual performance, the piecewise linear model showed the largest absolute datum cross-validation standard deviations (σ = 12.89 μGal for CLS, σ = 12.13 μGal for BAY), attributed to error misallocation—erroneously treating observational noise () as drift () in the decomposition . In contrast, the figure demonstrates that hybrid schemes combining symmetric observation models (initial-point, line-fitting, and variance-sum optimal) with adjustment methods (CLS or BAY) consistently yield lower cross-validation standard deviations (indicated by SD values in each panel) compared to standalone adjustment models, with the variance-sum optimal-Bayesian hybrid (Figure 13j) showing the most significant improvements in aligning with absolute gravity datums. The variance-sum optimal-Bayesian hybrid model synergized two mechanisms: local variance minimization to suppress segment-scale drift errors, and global Bayesian optimization to refine network-wide residuals via temporal correlation priors. This combined approach achieved 12% and 6% reductions in absolute datum cross-validation standard deviations compared to the standalone CLS and BAY models, respectively. This dual-scale correction framework validates its unparalleled precision for μGal-level gravity signal extraction in dynamic field environments.
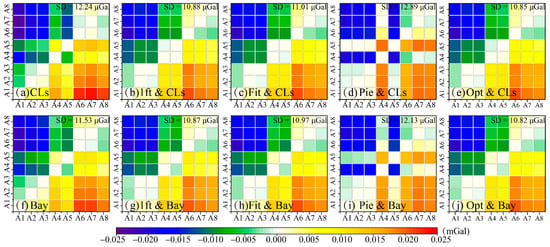
Figure 13.
Cross-validation results of absolute gravity datum values.
4. Discussion
4.1. Network Construction and Significance
The NCGMN (40–50°N), established in this study, addresses a critical observational gap in high-latitude cold-temperate regions under complex environmental conditions. This integrated multi-scale system comprises 152 gravimetric segments, 22 closed-loop circuits, and 12 branch lines, providing comprehensive coverage of key tectonic units, including the Songliao Basin, Changbai Mountain volcanic zone, and the northern Tan-Lu Fault Zone. The network’s configuration—featuring 8 absolute gravity datum stations and 130 relative gravity points—enables the robust constraint of time-variable gravity signals, with multi-method data processing confirming μGal-level precision for monitoring crustal deformation, volcanic unrest, and fault zone dynamics.
4.2. Dynamic Drift Quantification and Mechanisms
Existing studies have shown that the nonlinear dynamic drifts in spring-type relative gravimeters are governed by the multi-physical field coupling effects, where the mechanical creep in spring systems dominates long-term drift [6]. Extreme transport conditions (e.g., snowmobile vibrations) exacerbate transient behaviors and drift anomalies in mechanical sensors, as observed in CG-3 gravimeters [8]. Furthermore, environmental thermal and barometric fluctuations induce differential expansion/contraction in sensor components, with quartz-spring instruments exhibiting 20–30% higher drift sensitivity than metal-spring counterparts [5]. Minor posture disturbances during transport further amplify the observational offsets in CG-5 gravimeters [9].
For the first time, this work quantifies the nonlinear drift characteristics of CG-5 gravimeters in mobile surveys. Dynamic drift rates follow non-smooth normal distributions, with mean values 7–15% lower than static rates. Temperature variations (ΔT) and barometric perturbations (ΔP) exert coupled control on drift variability, showing instrument-specific correlations: #1229 exhibited strong thermal coupling (r = 0.69) and a weak barometric anti-correlation (r = −0.13), while #1235 displayed moderate thermal (r = 0.30) and stronger barometric (r = −0.54) responses. These results reveal that residual environmental noise—despite multi-layer compensation—induces nonlinear drifts through sensor sensitivity heterogeneities.
A geospatial analysis further identifies enhanced drift oscillations in regions of significant topographic relief, implicating synergistic interactions between terrain-induced vibrational modulation and sensor posture disturbances as drivers of nonlinear drift evolution. This mechanistic insight underscores the necessity of environment-aware correction frameworks for high-precision mobile gravity surveys.
4.3. Drift Correction Model Evaluation
This study developed a comprehensive correction framework integrating a line-specific drift rate computation, multi-model comparative analysis, and absolute datum cross-validation to address nonlinear dynamic drifts in mobile gravity surveys. The classical adjustment (CLS) model, relying on global linear drift assumptions, introduced systematic biases in segment self-differences and residuals, yielding an absolute datum cross-validation standard deviation of 12.24 μGal and an exceedance rate (|Δs|>30 μGal) of 8%, highlighting its inadequacy in resolving spatiotemporally heterogeneous nonlinear drifts.
The Bayesian adjustment (BAY) model enhanced adaptability by incorporating temporal covariance matrices, reducing standard deviations for segment self-differences, segment residuals, and absolute datum cross-validation by 7%, 12%, and 6%, respectively, compared to CLS. However, its assumption of temporally smooth drift rates conflicted with observed abrupt nonlinear variations, limiting the efficacy in extreme field scenarios.
In contrast, hybrid schemes combining symmetric observation models (initial-point, line-fitting, variance-sum optimal) with adjustment methods demonstrated superior performance. The variance-sum optimal model achieved the lowest self-difference standard deviations, reducing residuals by 34% (vs. CLS) and 29% (vs. BAY). When integrated with Bayesian adjustment, the hybrid model further decreased segment residual standard deviations by 24% (vs. CLS) and 14% (vs. BAY) and absolute datum cross-validation deviations by 12% and 6%, respectively. This hybrid framework synergizes two complementary mechanisms: (1) local error suppression via variance-sum optimization to minimize segment-scale drift variances, and (2) global residual refinement through Bayesian priors that leverage temporal correlations to reconcile network-wide drifts.
The practical impact of this synergy on the final gravity values is illustrated in Figure 14, which highlights the gravity value deviations at each station when comparing the hybrid variance-sum optimal-Bayesian model against the standalone classical (CLS) and Bayesian (BAY) adjustment models. These comparisons reveal discrepancies of approximately ±10 µGal (vs. CLS) and ±5 µGal (vs. BAY). These results underscore the hybrid model’s critical role in ensuring the reliable extraction of µGal-level gravity signals for crustal deformation monitoring, seismic precursor identification, and geodynamic investigations. By harmonizing local precision with global consistency, this dual-scale approach establishes a new benchmark for high-precision mobile gravity data processing in complex environments.
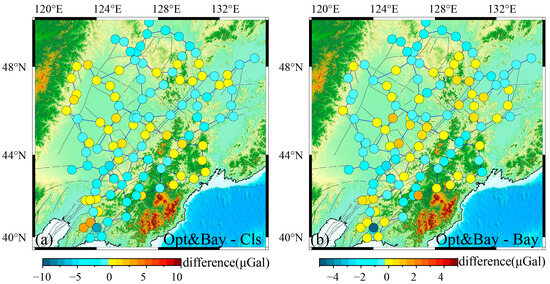
Figure 14.
Gravity value deviations between the optimal Bayesian-combined adjustment model and the classic/Bayesian adjustment models. (a) Gravity value deviations between the Opt&Bay combined model and the Cls model. (b) Gravity value deviations between the Opt&Bay combined model and the Bay model.
5. Conclusions
Through a multi-model comparative validation framework, this study systematically evaluates the applicability of dynamic drift correction methods for the NCGMN, yielding significant insights into nonlinear drift dynamics. The Scintrex CG-5 relative gravimeter exhibits non-smooth normal distribution characteristics in dynamic nonlinear drifts during mobile surveys, with mean drift rates reduced by 7–15% compared to static conditions. These drifts are governed by multi-physics coupling effects, where terrain undulations, temperature fluctuations, and barometric perturbations synergistically drive nonlinear evolution through posture disturbances, vibrational modulation, and abrupt environmental shifts.
Preprocessing local drifts via the initial-point, line-fitting, and variance-sum optimal models, followed by global optimization through adjustment processes, suppresses nonlinear drift errors more effectively than standalone classical or Bayesian adjustments. Gravity value discrepancies among models reach ±10 μGal, critically compromising the reliability of μGal-level signals in studies of crustal deformation, seismic precursors, and geodynamic processes. The hybrid variance-sum optimal and Bayesian adjustment model synergizes local variance minimization (segment-scale error suppression) with global temporal correlation priors (network-wide residual refinement), achieving the following: (1) 34% and 29% reductions in segment self-difference standard deviations versus classical and Bayesian adjustments; (2) 24% and 14% decreases in segment residual standard deviations; (3) 12% and 6% improvements in absolute datum cross-validation precision.
This framework robustly addresses complex nonlinear drifts in mobile measurement environments, enabling the reliable extraction of μGal-level gravity signals under challenging field conditions. By harmonizing local precision with global consistency, it elevates data quality for monitoring seismicity, volcanic unrest, and fault zone deformation, establishing a new benchmark for high-precision geodynamic studies.
Author Contributions
Conceptualization, Z.C., and J.L.; methodology, Z.C.; software, Z.C.; validation, Z.C. and J.L.; analysis, Z.C. and J.L.; investigation, Z.C. and J.L.; resources, Z.C. and J.L.; data curation, Z.C.; writing—original draft preparation, Z.C.; writing—review and editing, Z.C.; visualization, Z.C.; project administration, Z.C.; funding acquisition, Z.C. All authors have read and agreed to the published version of the manuscript.
Funding
This work is supported by National Natural Science Foundation of China (42204093), National Science & Technology Fundamental Resources Investigation Program (2024FY101104), and China Earthquake Administration Project (2024020204).
Data Availability Statement
Data will be made available on request.
Acknowledgments
This study utilized the geoist package (https://gitee.com/cea2020/geoist) for adjustments and GMT [22] for graphics. We thank the National Gravity Network Center for gravity datum support.
Conflicts of Interest
The authors declare no conflicts of interest.
References
- Chen, S.; Zhuang, J.; Li, X.; Lu, H.; Xu, W. Bayesian approach for network adjustment for gravity survey campaign: Methodology and model test. J. Geod. 2019, 93, 681–700. [Google Scholar] [CrossRef]
- Zhu, Y.; Zhang, Y.; Zhang, G.; Liu, F.; Zhao, Y. Gravity variations preceding the large earthquakes in the Qinghai-Tibet Plateau from 21st century. Chin. Sci. Bull. 2020, 65, 622–632. [Google Scholar] [CrossRef]
- Hu, M.; Hao, H.; Han, Y.; Zhao, Y.; Liu, J.; Zheng, B.; Zhang, X.; Zhang, Y.; Li, Z.; Wang, J.; et al. Gravity flexural isostasy background of the 2021 Madoi (Qinghai) Ms7.4 earthquake and gravity change before the earthquake. Chin. J. Geophys. 2021, 64, 3231–3245. [Google Scholar]
- Zhao, Y.; Zhu, Y.; Wei, S.; Liu, F.; Liang, W.; Sun, H. Dynamic gravity changes before the Menyuan, Qinghai Ms6.9 earthquake on January 8, 2022. Chin. J. Geophys. 2023, 66, 2337–2351. [Google Scholar]
- Crossley, D.; Hinderer, J.; Riccardi, U. The measurement of surface gravity. Rep. Prog. Phys. 2013, 76, 046101. [Google Scholar] [CrossRef] [PubMed]
- Van Camp, M.; de Viron, O.; Watlet, A.; Meurers, B.; Francis, O.; Caudron, C. Geophysics From Terrestrial Time-Variable Gravity Measurements. Rev. Geophys. 2017, 55, 938–992. [Google Scholar] [CrossRef]
- Wang, L.; Chen, S.; Zhuang, J.; Xu, W. Simultaneous calibration of instrument scale factor and drift rate in network adjustment for continental-scale gravity survey campaign. Geophys. J. Int. 2021, 228, 1541–1555. [Google Scholar] [CrossRef]
- Ferguson, J.F.; Chen, T.; Brady, J.; Aiken, C.L.V.; Seibert, J. The 4D microgravity method for waterflood surveillance: Part II—Gravity measurements for the Prudhoe Bay reservoir, Alaska. Geophysics 2007, 72, I33–I43. [Google Scholar] [CrossRef]
- Reudink, R.; Klees, R.; Francis, O.; Kusche, J.; Schlesinger, R.; Shabanloui, A.; Sneeuw, N.; Timmen, L. High tilt susceptibility of the Scintrex CG-5 relative gravimeters. J. Geod. 2014, 88, 617–622. [Google Scholar] [CrossRef]
- Hwang, C.; Wang, C.-G.; Lee, L.-H. Adjustment of relative gravity measurements using weighted and datum-free constraints. Comput. Geosci. 2002, 28, 1005–1015. [Google Scholar] [CrossRef]
- Kennedy, J.R.; Ferré, T.P.A. Accounting for time- and space-varying changes in the gravity field to improve the network adjustment of relative-gravity data. Geophys. J. Int. 2015, 204, 892–906. [Google Scholar] [CrossRef][Green Version]
- Chen, Z.; Chen, S.; Zhang, B.; Wang, L.; Shi, L.; Lu, H.; Liu, J.; Xu, W. Uncertainty Quantification and Field Source Inversion for the Continental-Scale Time-Varying Gravity Dataset: A Case Study in SE Tibet, China. Pure Appl. Geophys. 2023, 180, 683–702. [Google Scholar] [CrossRef]
- Wu, Q.; Liu, S.; Wang, B.; Zhong, L.; Zhao, L.; Zhang, S.; Li, H. Data Processing of Gravity Base Network in Plateau Area: The Case of Qinghai Province, China. Remote Sens. 2022, 14, 1142. [Google Scholar] [CrossRef]
- Gao, L.; Zhang, H.; Myhill, R.; Gao, J.; Leng, W. Local slab penetration into lower mantle controls deep-focus seismicity and Changbaishan volcanism in northeast China. Nat. Commun. 2025, 16, 2782. [Google Scholar] [CrossRef] [PubMed]
- Földváry, L. Sampling Error of Continuous Periodic Data and Its Application for Geodesy. Math. Meth. Appl. Sci. 2021, 44, 11738–11752. [Google Scholar] [CrossRef]
- Micro-g LaCoste Inc. g-Software Absolute Gravity Data Acquisition and Processing Software version 9 User’s Manual; Micro-g LaCoste Inc.: Lafayette, CO, USA, 2013. [Google Scholar]
- Xing, L.; Wang, L.; Hu, M. Determination of mantle upwelling rate beneath Taiyuan basin by using absolute gravity, GPS, groundwater and GLDAS data. J. Appl. Geophys. 2017, 138, 179–184. [Google Scholar] [CrossRef]
- Scintrex Ltd. CG-5 Scintrex Autograv System Operation Manual, Part I # 867700 Revision 8; Scintrex Ltd.: Toronto, ON, Canada, 2012. [Google Scholar]
- Melchior, P. The Tides of the Planet Earth; Pergamon Press: Oxford, UK, 1983. [Google Scholar]
- Merriam, J.B. Atmospheric pressure and gravity. Geophys. J. Int. 1992, 109, 488–500. [Google Scholar] [CrossRef]
- Akaike, H. Likelihood and the Bayes procedure. Trab. Estad. Y Investigacion Operativa 1980, 31, 143–166. [Google Scholar] [CrossRef]
- Wessel, P.; Smith, W.H.F.; Scharroo, R.; Luis, J.; Wobbe, F. Generic Mapping Tools: Improved Version Released. Eos Trans. Am. Geophys. Union 2013, 94, 409–410. [Google Scholar] [CrossRef]
Disclaimer/Publisher’s Note: The statements, opinions and data contained in all publications are solely those of the individual author(s) and contributor(s) and not of MDPI and/or the editor(s). MDPI and/or the editor(s) disclaim responsibility for any injury to people or property resulting from any ideas, methods, instructions or products referred to in the content. |
© 2025 by the authors. Licensee MDPI, Basel, Switzerland. This article is an open access article distributed under the terms and conditions of the Creative Commons Attribution (CC BY) license (https://creativecommons.org/licenses/by/4.0/).