Article

A Region-Growing Segmentation Approach to Delineating Timberline from Satellite-Derived Tree Fractional Cover Products

by
Tianqi Zhang
1,2,3,
Jitendra Kumar
1,
Forrest M. Hoffman
4,5,
Valeriy Ivanov
6,
Jingfeng Wang
7,
Aleksey Y. Sheshukov
8,
Wenbo Zhou
6,
Paul Montesano
9 and
Desheng Liu
2,3,*
1
Environmental Sciences Division, Oak Ridge National Laboratory, Oak Ridge, TN 37830, USA
2
Department of Geography, The Ohio State University, 1036 Derby Hall, 154 North Oval Mall, Columbus, OH 43210, USA
3
Environmental Sciences Graduate Program, The Ohio State University, Columbus, OH 43210, USA
4
Computational Sciences & Engineering Division, Oak Ridge National Laboratory, Oak Ridge, TN 37830, USA
5
Climate Change Science Institute, Oak Ridge National Laboratory, Oak Ridge, TN 37830, USA
6
Department of Civil and Environmental Engineering, University of Michigan, Ann Arbor, MI 48109, USA
7
School of Civil and Environmental Engineering, Georgia Institute of Technology, Atlanta, GA 30332, USA
8
Department of Biological and Agricultural Engineering, Kansas State University, Manhattan, KS 66506, USA
9
Computational & Information Sciences and Technology Office, NASA Goddard Space Flight Center, Greenbelt, MD 20771, USA
*
Author to whom correspondence should be addressed.
Remote Sens. 2025, 17(12), 2002; https://doi.org/10.3390/rs17122002
Submission received: 28 April 2025 / Revised: 4 June 2025 / Accepted: 6 June 2025 / Published: 10 June 2025

Abstract

Timberline marks the transitions from continuous forests to sparse forests and tundra landscapes. As the spatial distribution and dynamics of timberline are closely associated with regional energy and carbon balance, mapping timberline is important to a wide range of environmental and ecological studies. However, current timberline delineation approaches remain under-developed. We proposed an automatic timberline delineation method based on a seeded region-growing segmentation technique and satellite-derived products of tree fractional cover. We applied our approach to the West Siberian Plain and Alaska treeline regions as defined by the Circumpolar Arctic Vegetation Map. The results demonstrate the effectiveness of the proposed method for the accurate delineation of the timberlines that spatially align well with very-high-resolution satellite images. Based on the delineated timberlines, we find regional-scale tree encroachment to be not as substantial as previously reported. The proposed approach can be applied to understanding climate-induced forest responses and inform forest management practices.

Graphical Abstract

1. Introduction

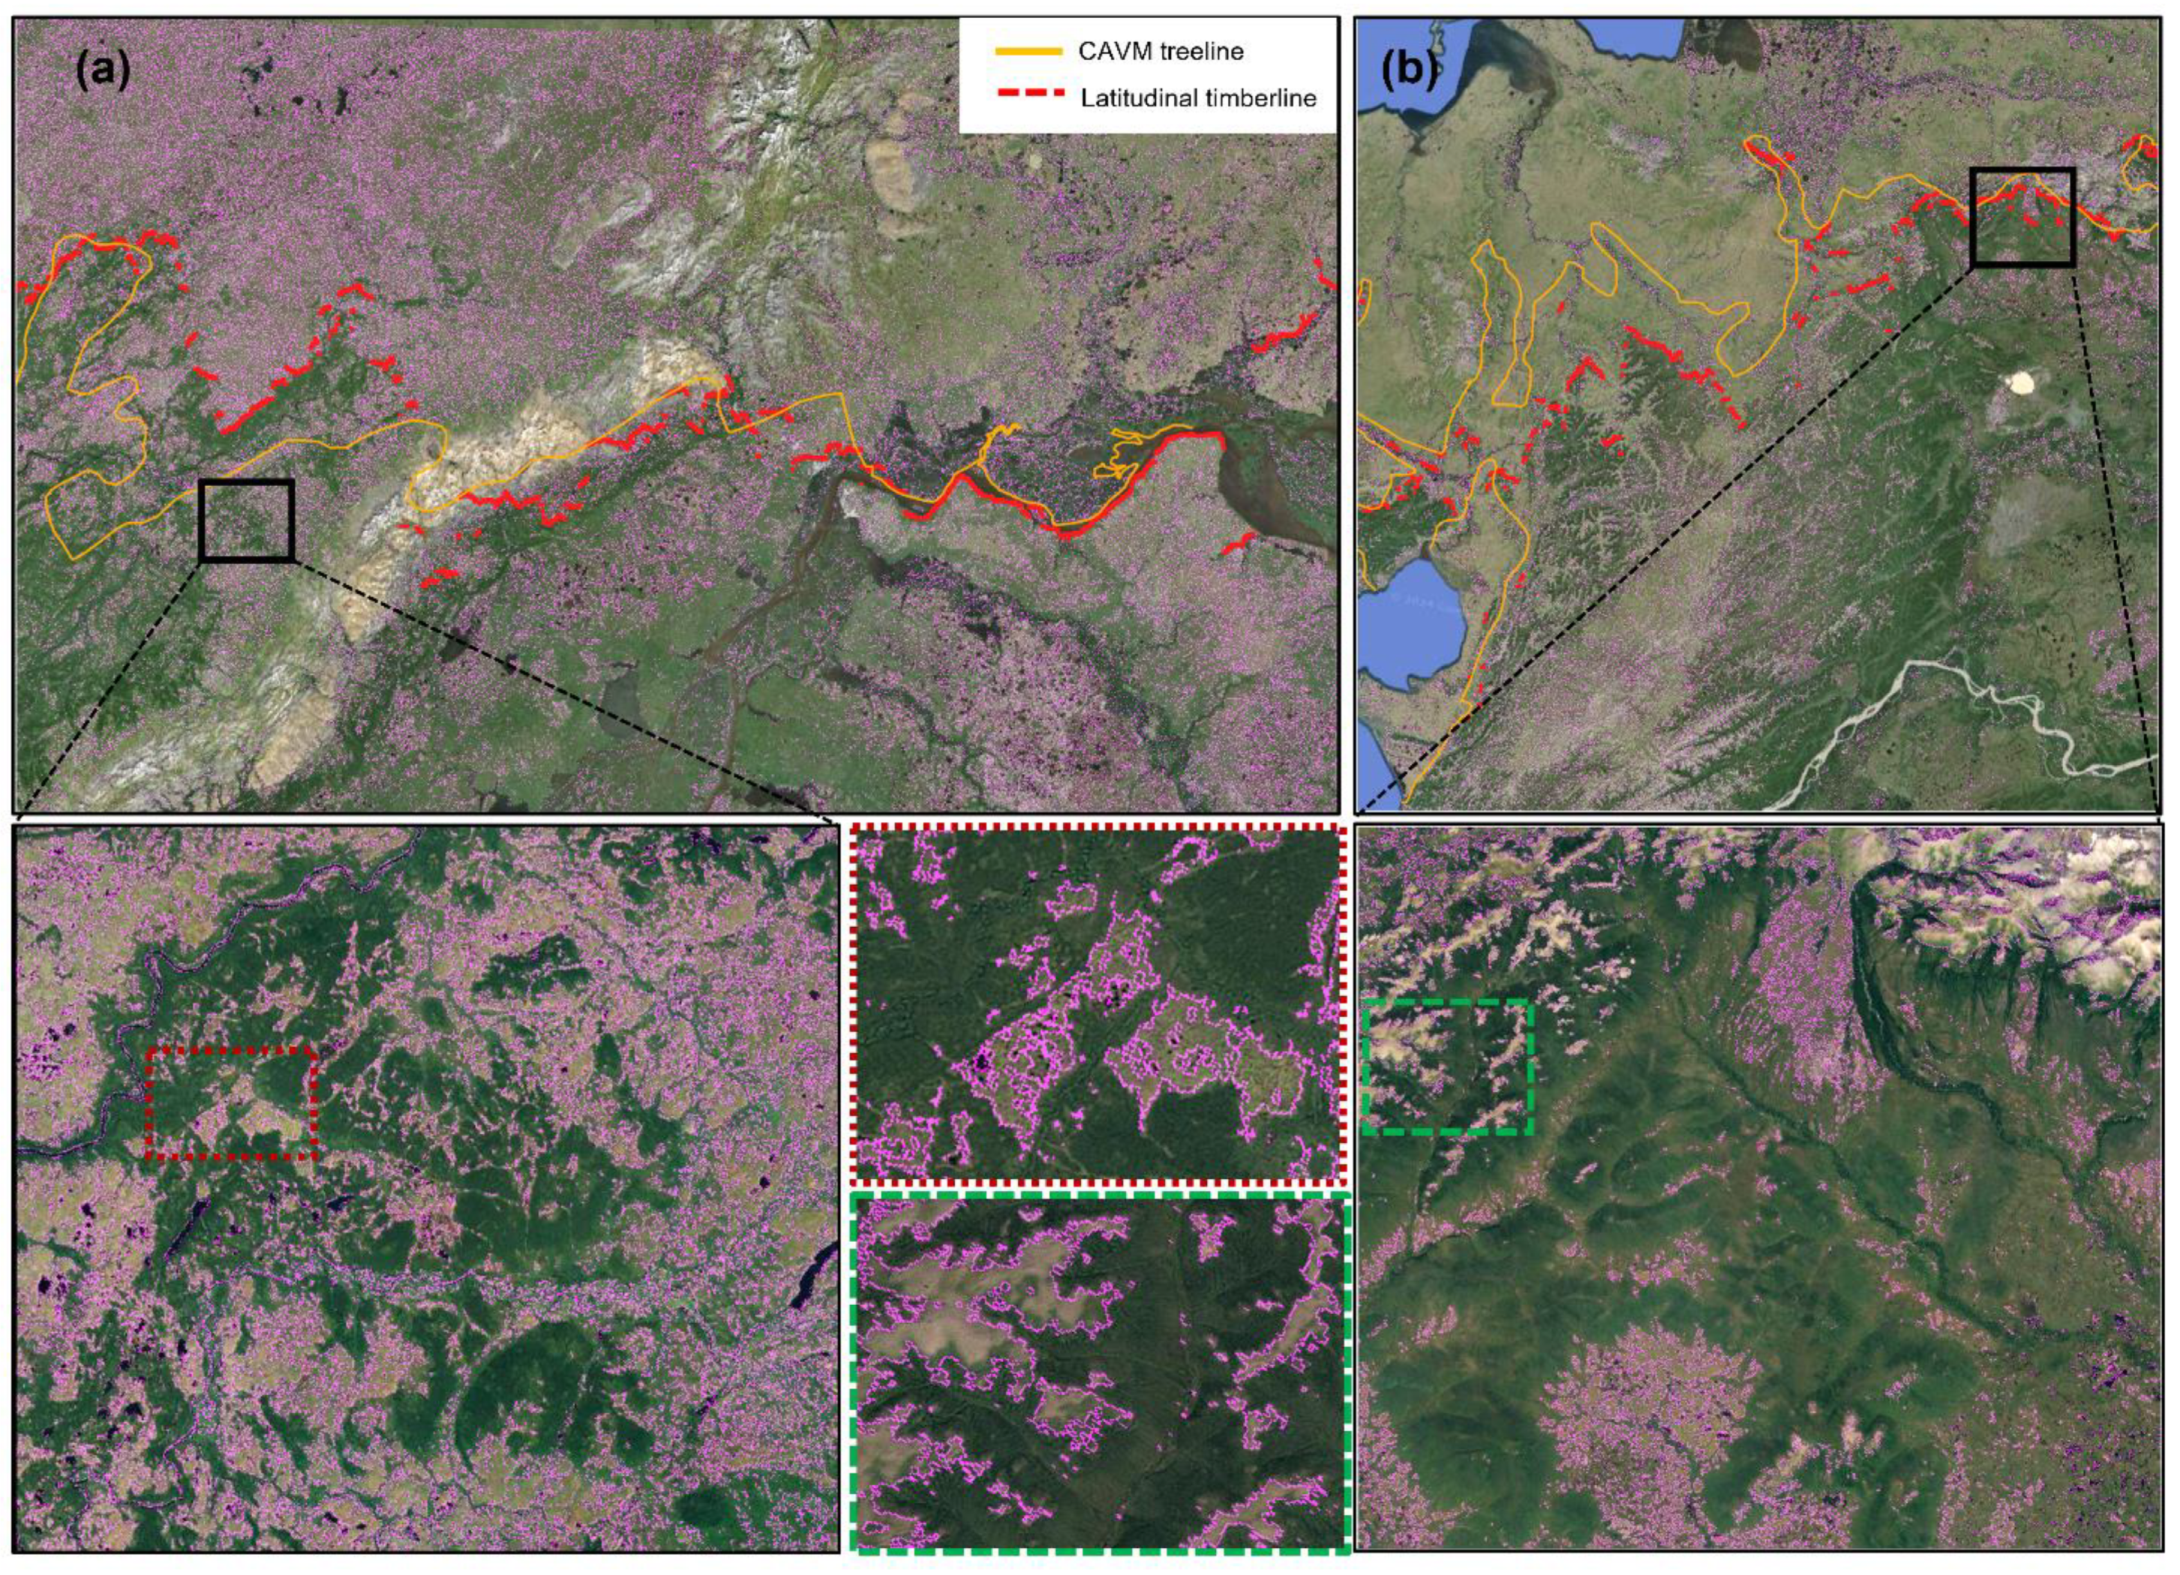
Delineating timberline, which marks the transitions from continuous forests to sparse forests and tundra landscapes, provides critical insights into understanding the regional-scale impacts of global warming and changing climatic conditions on plant distribution and ecosystems [1,2,3,4,5]. It also aids in assessing the impacts of land use and forest management policies such as deforestation or forest recovery [6,7]. Timberline is closely associated and sometimes interchangeable with two terms, namely treeline and taiga–tundra ecotone (TTE) [8,9]. To better understand timberline, it is essential to clarify their differences first. Specifically, treeline is defined as the upper altitudinal (Alpine treeline) or northern latitudinal limit (Arctic/Latitudinal treeline) of forests reaching a 2–3 m height or marked by the presence of krummholz trees (stunted, deformed trees encountered in the subarctic and subalpine treeline landscapes, shaped by continual exposure to fierce, freezing winds [1]). TTE refers to the transition between continuous boreal forest (i.e., taiga) and northern typical tundra [9,10,11,12] at northern high latitudes, which has been identified as the earth’s longest vegetation transitional zone. By definition, treeline, timberline, and TTE are intrinsically connected in that the TTE is bounded by timberline and treeline at the south and north, respectively, in the Arctic region (Figure 1). Unlike treeline, which identifies individual trees and requires more effort to map from high-resolution images [13], timberline is visually identifiable from moderate-resolution satellite imagery (e.g., Landsat), making it trackable at regional scales. The location of timberline may be inferred from existing TTE products [11,12] given their close association (Figure 1).
Previous studies, albeit limited in number, specifically focused on direct timberline delineation by manually interpreting very-high-resolution (0.5–5.8 m) multispectral satellite images (LISS IV and Digital Globe [8]). While accurate, manual interpretation is time-consuming and limited to small areas. A scalable approach to delineate timberline involves the isolines of satellite-based vegetation indices, such as the normalized difference vegetation index (NDVI) (adjusted with manual digitalization [14]) or fractional tree cover (tree fCover, e.g., the 0.3 tree fCover adopted in Van Bogaert et al. [15]). Compared to the NDVI, tree fCover is more reliable, as the NDVI can be influenced by other biotic and abiotic factors besides tree growth [16]. Nevertheless, the tree fCover-based timberline mapping by Van Bogaert et al. [15] was primarily carried out at plot scales utilizing 0.3 m resolution aerial photos. Timberline mapping at regional scales remains limited in the Arctic region.
Various global satellite-derived products provide estimates of tree fCover, each employing different definitions, algorithms, and spatial resolutions. Key datasets include the MODIS Vegetation Continuous Fields (VCF; MOD44B) at a 500 m resolution, which estimates percent cover of woody vegetation taller than 5 m using regression tree models [17]; the Landsat Global Forest Cover and Change (GFCC) dataset, which provides annual tree cover and forest loss/gain at 30 m resolution, where trees are also defined as vegetation > 5 m in height [18,19]; the recently released GLOBMAP Fractional Tree Cover (FTC), which uses a neural network trained on over 465 million samples generated from high-resolution land cover products to estimate tree cover at a 250 m resolution from MODIS data [20]; and the Copernicus Global Land Service (CGLS) land cover product, which provides 100 m global tree cover fractions using PROBA-V data [21]. Additionally, tree fCover can be aggregated from categorical land cover products such as Dynamic World, which outputs 10 m class probabilities for land cover classes, including “trees”, defined as tall woody vegetation, though it does not offer continuous fractional estimates [22].
While the terms tree cover and forest are sometimes used interchangeably, they differ in concept and application. Tree fractional cover refers to the proportion of a pixel occupied by tree canopies taller than a minimum threshold (commonly >5 m), making it suitable for delineating structural forest boundaries such as the timberline. In contrast, forest cover often implies a land use or categorical class based on tree fractional cover thresholds (e.g., >10%, Food and Agriculture Organization of the United Nations (FAO); Ranson et al. [12]) and may include low-stature woody vegetation or mixed-use areas. This distinction is particularly critical in transition zones—such as alpine and Arctic regions—where shrubs or stunted trees may meet forest classification thresholds but do not satisfy structural definitions of continuous tree canopy. In this study, we adopt a conservative biophysical definition based on continuous tree fractional cover to delineate the timberline, focusing on the emergence of tall, continuous tree structures.
This study developed an automatic approach for delineating timberline from satellite imagery at regional scales. The timberline delineation method uses the seeded region-growing segmentation technique [23] to reduce the variability in the mapped timberlines using tree fCover and thresholding-based approaches [15]. The evaluation of the mapped timberline was conducted from two perspectives. First, we calculated the mean distance between the timberlines mapped using the proposed approach and timberlines manually delineated from very-high-resolution satellite images to quantify the mapping accuracy. Second, we compared our delineated timberline results with those of three existing products, including the gold-standard treeline provided by the Circumpolar Arctic Vegetation Map (CAVM) mapped by an ensemble effort from global experts [13] and TTE products mapped by Ranson et al. [12] and Montesano et al. [11]. The time frames of our mapped products and the CAVM treeline enable an understanding of the tree encroachment status in the West Siberian Plain and Alaska treeline regions over the past two decades. To our knowledge, this study makes the first attempt to undertake a direct comparison of the timberline mapping against sub-meter-resolution imagery at regional scales. Although designed for Arctic timberline mapping, our timberline delineation approach using freely available satellite products is applicable to other forested regions with ecotone transitions.

2. Method

2.1. Study Materials

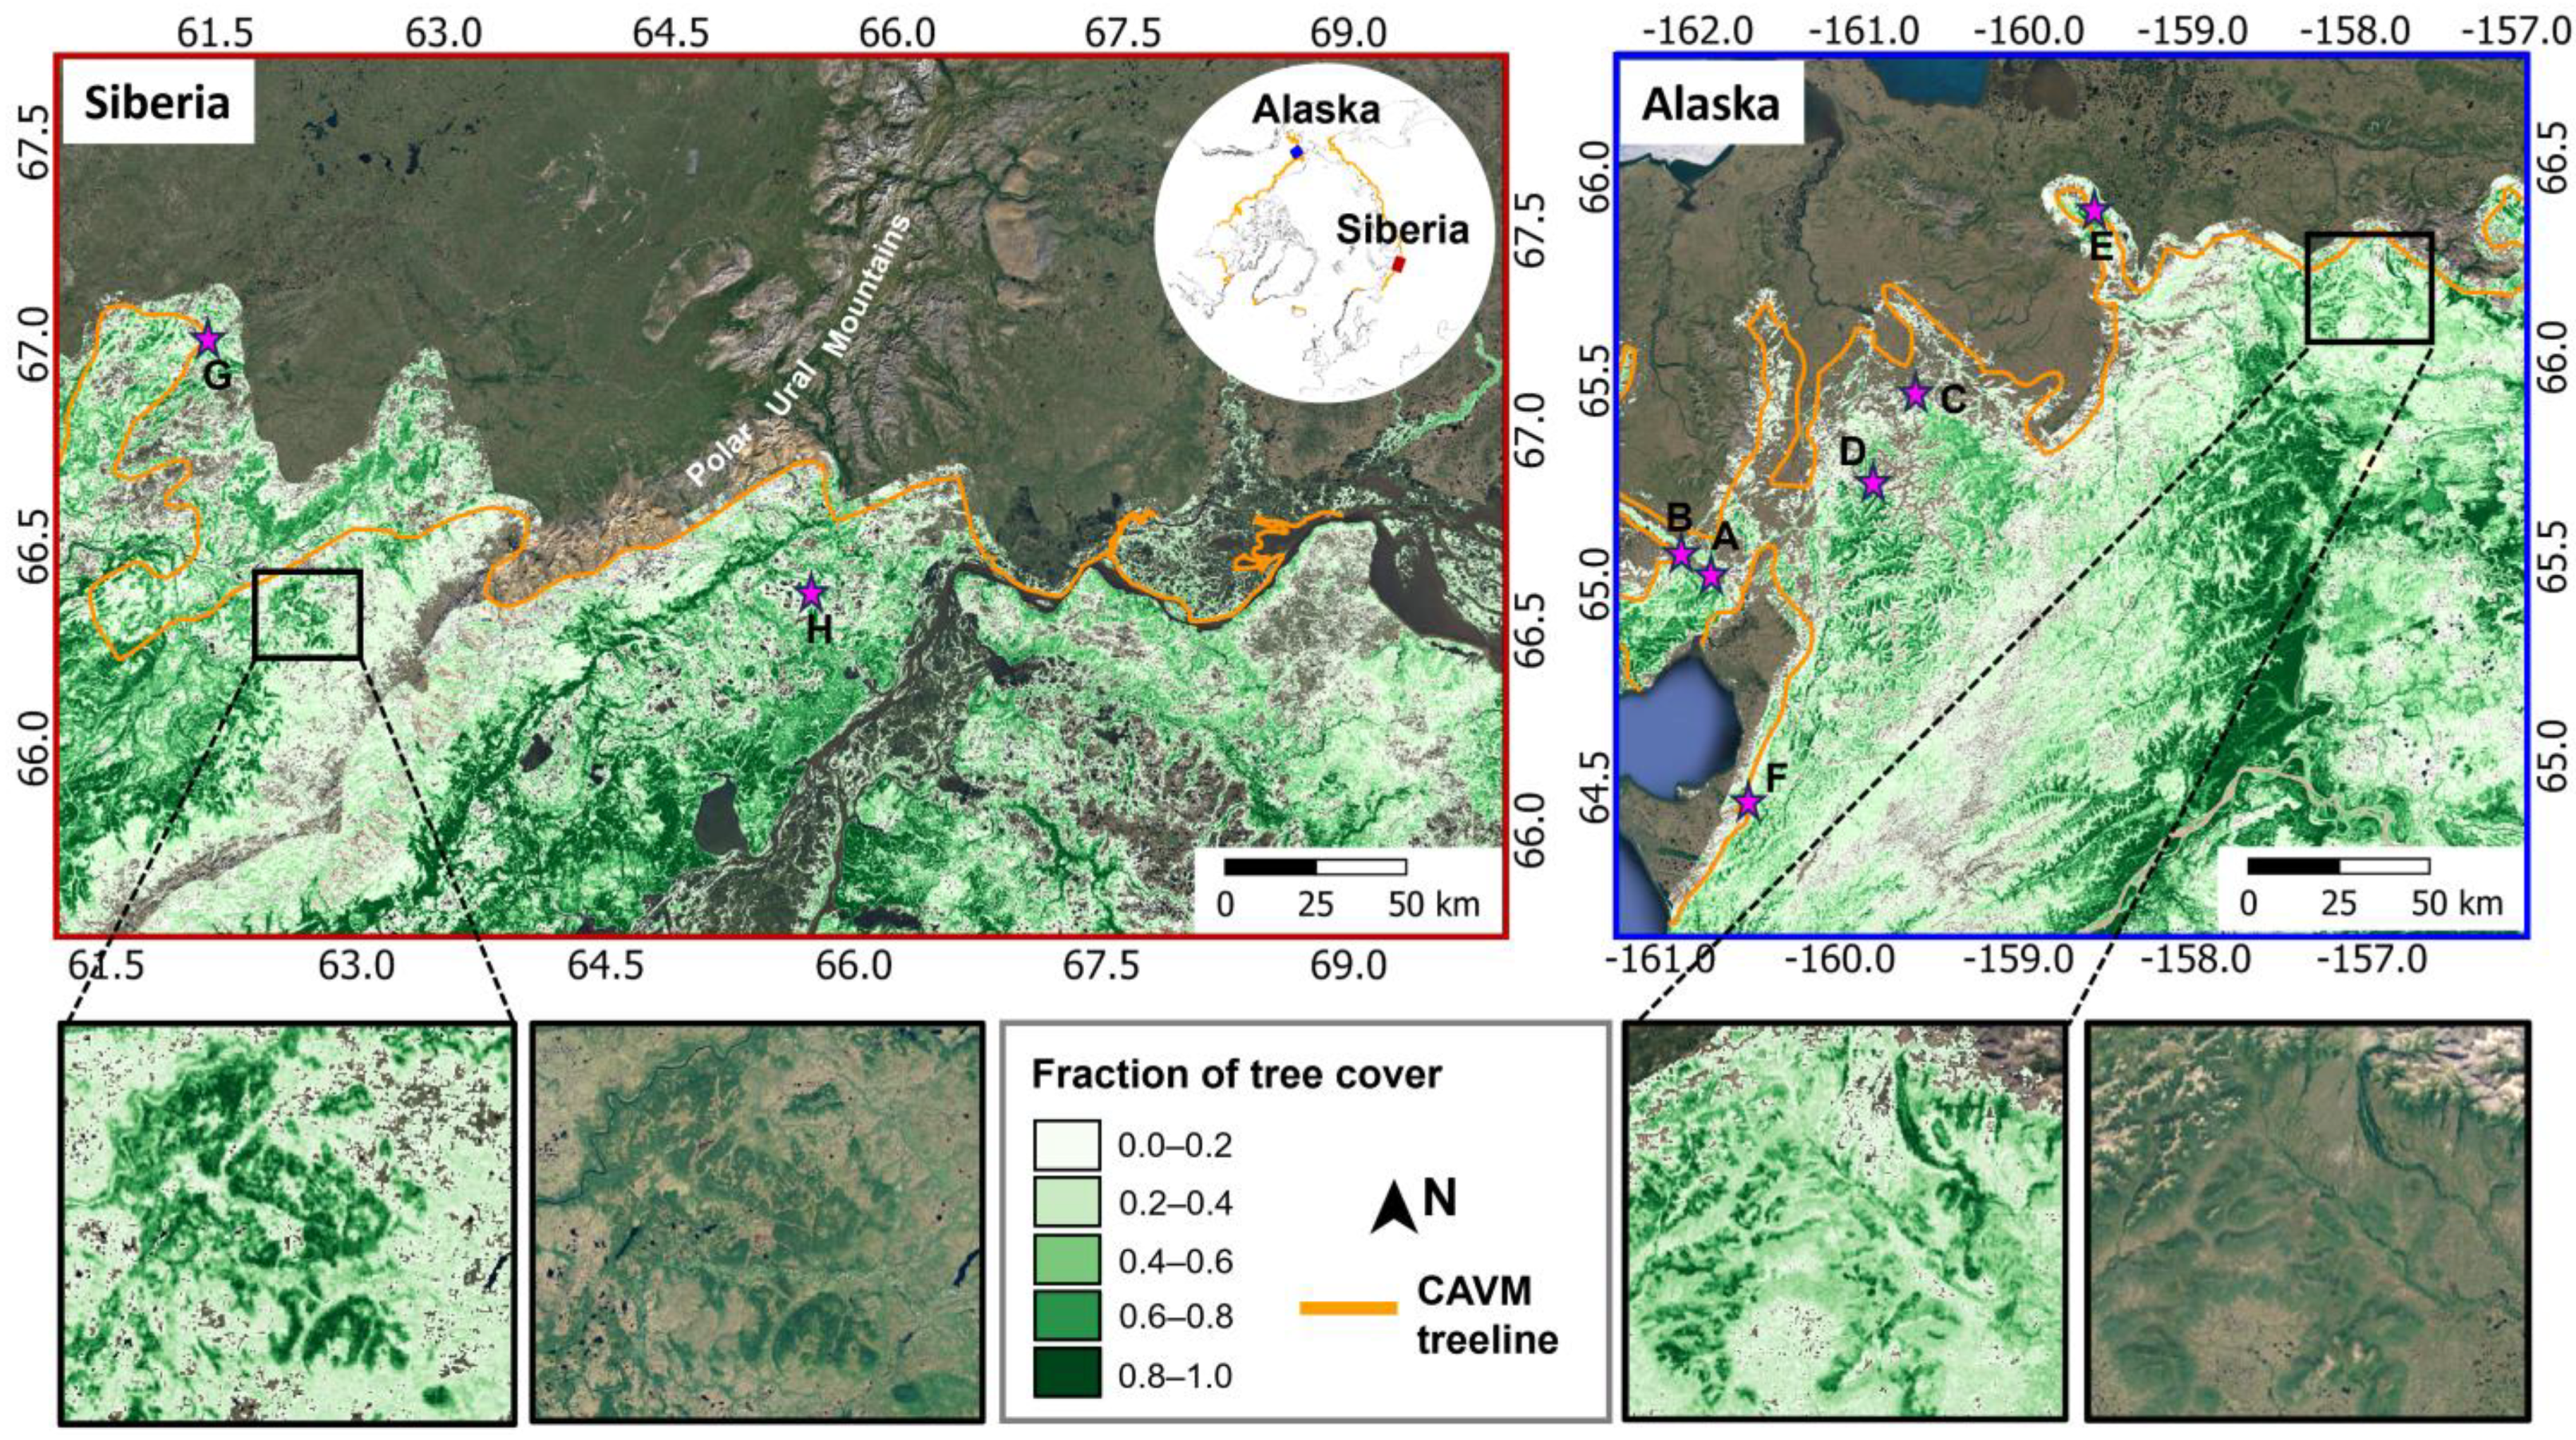
Our study areas are located at two TTE zones in the north of the West Siberian Plain and northwest Alaska (Figure 2). Both areas are characterized by the gradually changing land cover from the continuous taiga (boreal forest) to sparse forests or tundra. The two study areas also have distinct topographic conditions. Specifically, the entire Siberia site is characterized by gentle topography split by the Polar Ural Mountains (northeast–southwest oriented) into two parts. The southeast part of the Alaska site is a mountainous region with gradual transition to flatter topography towards the northwest. These distinct landscapes provide a great testbed for evaluating the generalizability of our proposed timberline delineation approach.
In this study, we tested an existing product of tree fCover used for timberline delineation, i.e., the “tree-coverfraction” variable in the CGLS [21] product from 2019. The CGLS product provides annual land cover between 2015 and 2019 and the corresponding fCover of 100 m resolution covering the region from 56°S to 75°N. The CGLS product was developed based on the PROBA-V time series and the random forest method using high-quality samples manually created by examining Google Earth and Bing imagery, which achieves an overall 80% classification accuracy [21,24].
The CAVM treeline (the orange line in Figure 2) marks the northern limits of the boreal forest [13]. All areas further north of bioclimate Subzone E in the CAVM product [13] were assumed not to be covered by boreal forests when defining the domain of the CGLS product [21], with tree fCover marked as “no data” in CGLS. Overall, the spatial patterns of the estimated tree fCover, the transitions between the continuous and sparse forests, and isolated forest clusters are satisfactorily captured by the CGLS tree fCover product (shown in the zoomed-in plots, Figure 2).

2.2. Timberline Delineation

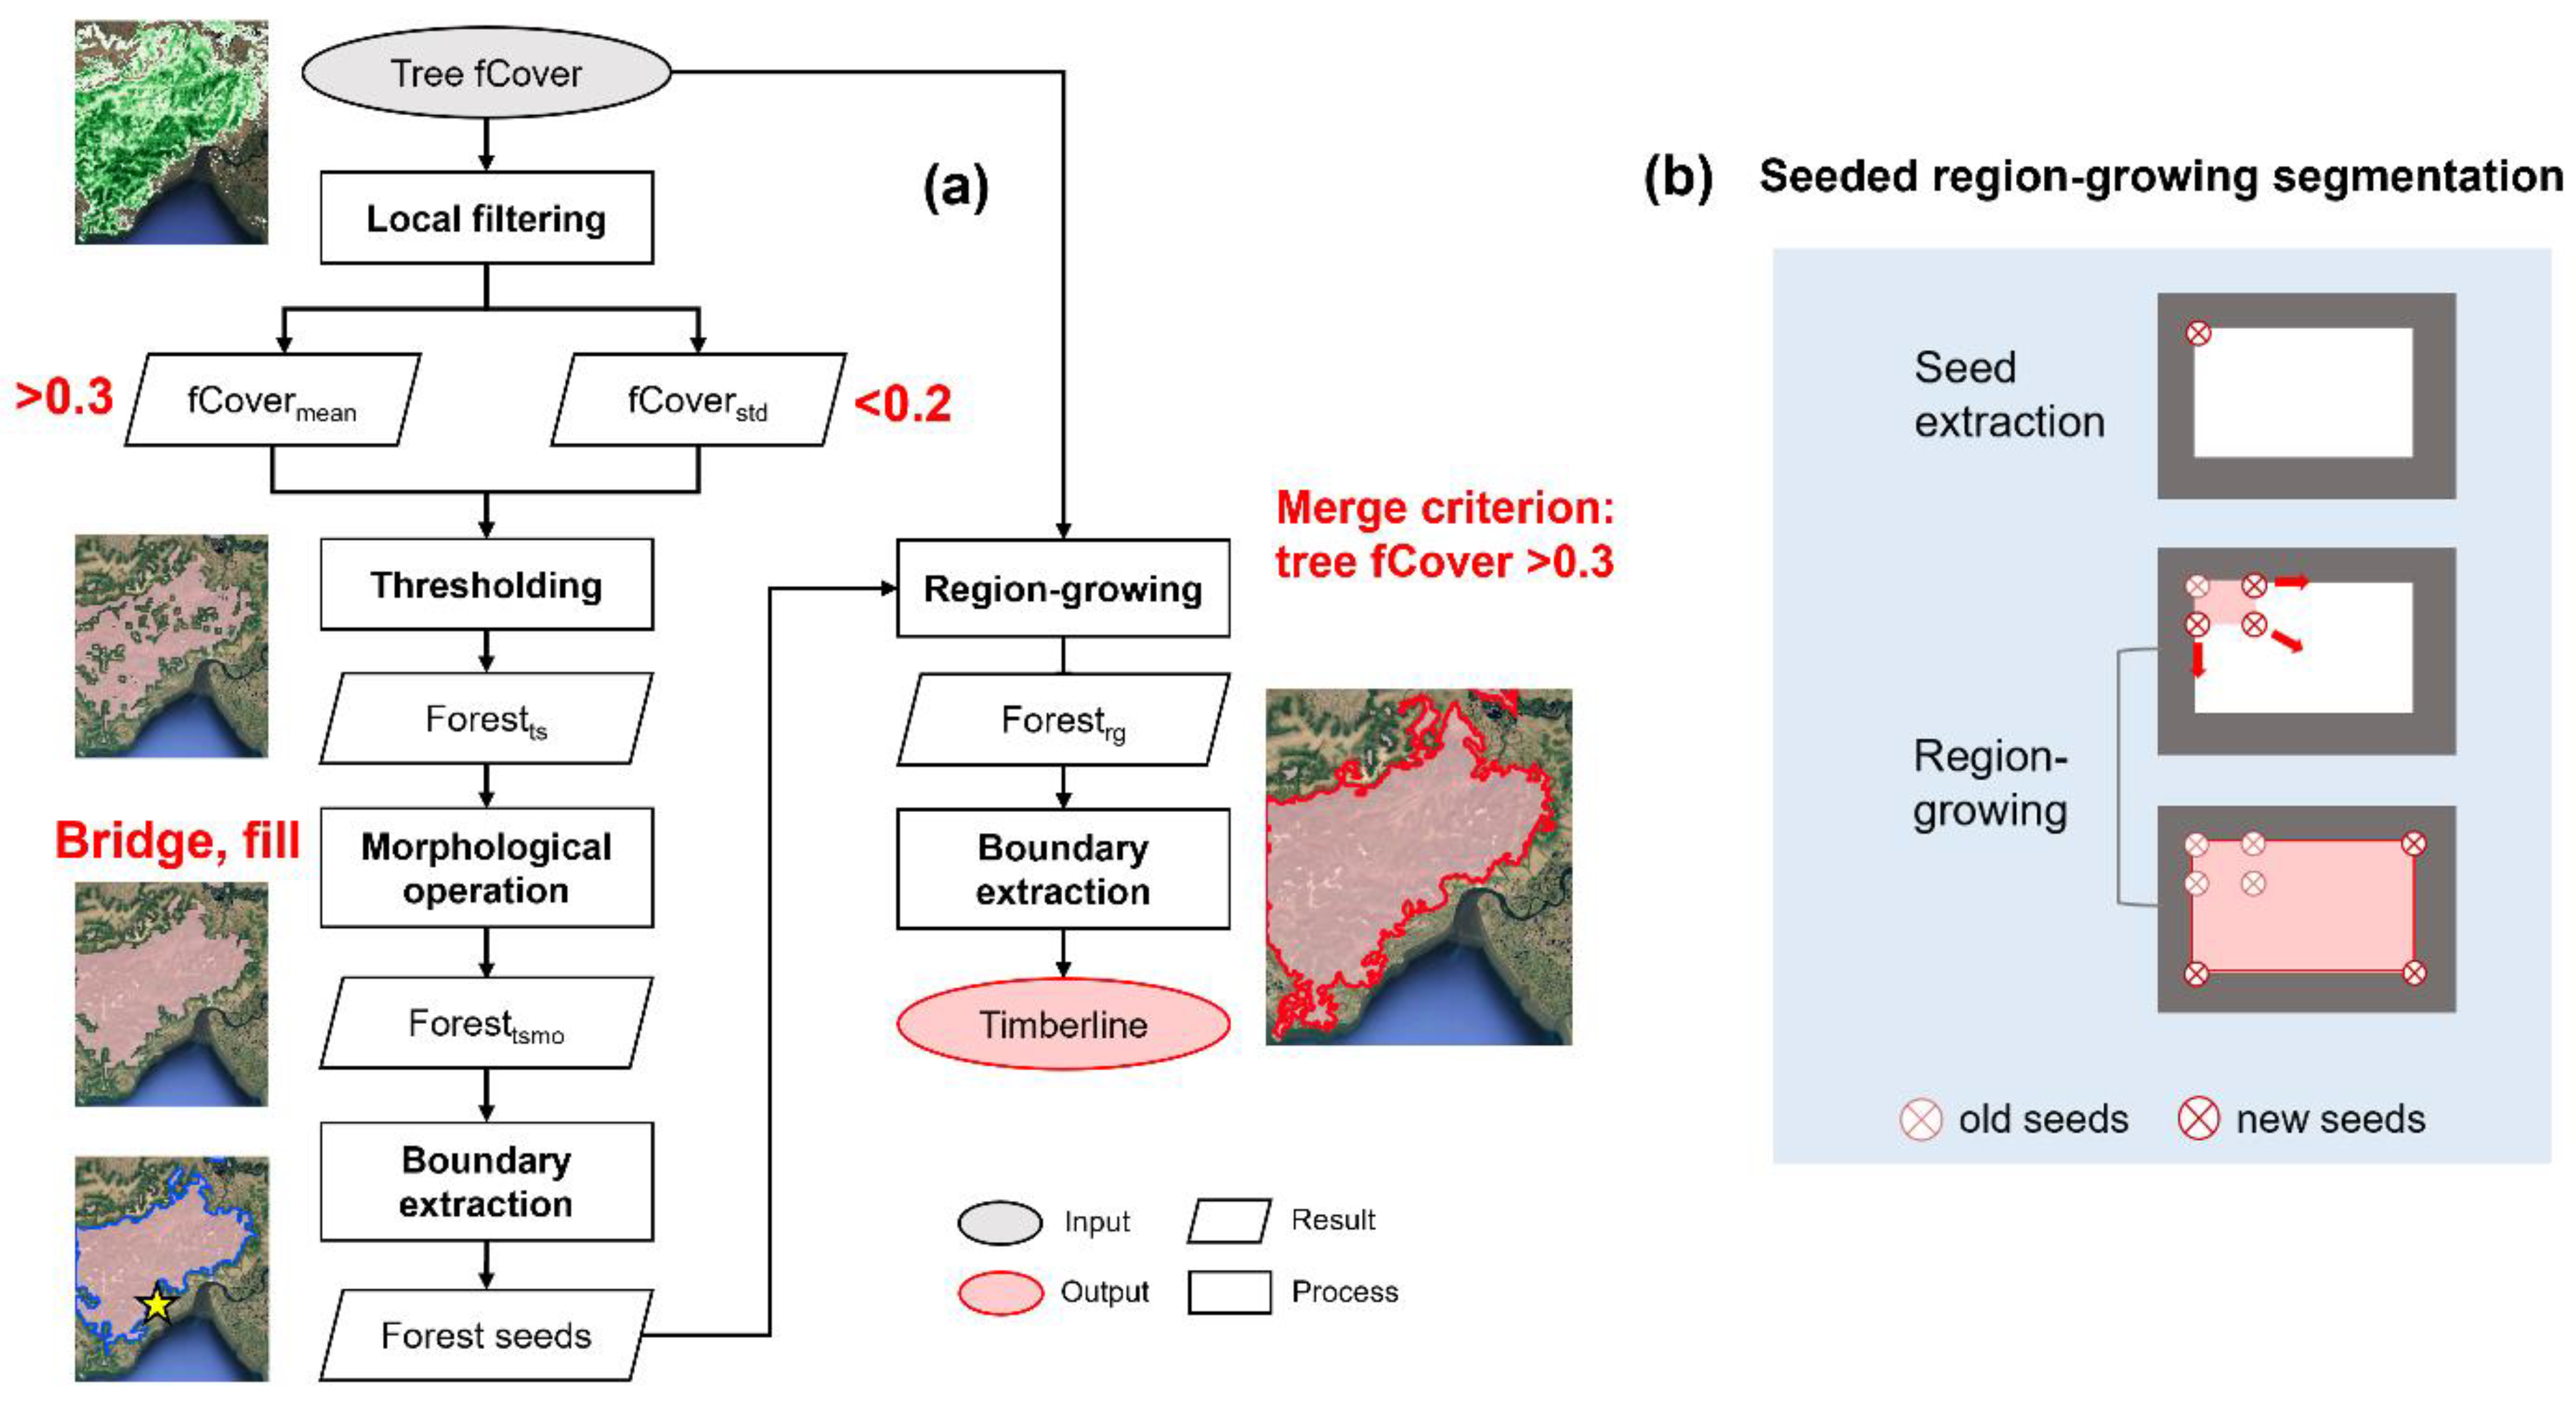
Our timberline delineation approach (Figure 3a) took inspiration from the seeded region-growing segmentation technique [23] (Figure 3b), which includes three main steps: (1) extracting the forest seeds representative of each continuous forest patch (large spatially connected forest patches) where forest seeds can be forests located at the boundary of a forest patch or with the densest forest cover; (2) segmenting all major continuous forests through region growing at the forest seeds to capture all connected forest pixels; and (3) extracting the exterior boundary of each continuous forest patch as the timberline. One advantage of seeded region-growing segmentation is that it can effectively group all similar pixels into one segment, while minimizing the overall variability in the spatial pattern of the segmented objects. The seed extraction and region-growing steps are elaborated on in the following subsections.

2.2.1. Seed Extraction from Continuous Forests

In seeded region-growing segmentation, the seeds are often selected from spatially homogeneous areas [23] or from the edges outlining the target objects [25]. Given that the objective of this study is to segment all major continuous forests, we need a representative forest seed from each continuous forest patch, such as the pixel with the densest tree fCover or one located at the boundary of the forest patch. Unlike buildings or other concrete surfaces in urban areas, a number of issues need to be addressed for the effective mapping of the continuous forested area.
First, satellite images contain “salt-and-pepper” noises [26,27]. To enhance the spatial continuity of the tree fCover for mapping continuous forests, a local filter (window size: 1 km × 1 km) was used to smooth the original tree fCover map [28,29]. Both the mean (fCovermean) and standard deviation (fCoverstd) of tree fCover within the 1 km × 1 km local window were calculated to determine the areas covered by the continuous forests.
Second, small-sized forest patches spatially isolated from the main forest body should be excluded from the timberline delineation to ensure a focus on structurally continuous forests. To achieve this, we defined continuous forests as areas where the long-term mean tree fCover (fCovermean) exceeds 0.3 and the interannual standard deviation (fCoverstd) is below 0.2. The fCovermean > 0.3 threshold represents a conservative estimate for identifying forests and is supported by prior studies on forest distribution and treeline/TTE mapping (e.g., [11,15,29]; see also Table 1). This threshold minimizes the inclusion of sparsely vegetated or transitional zones that may contain scattered or low-stature trees. The fCoverstd < 0.2 criterion was introduced to filter out fragmented, noisy, or seasonally variable vegetation and to ensure temporal stability in forest cover across years. These values were empirically determined by testing a range of candidate thresholds (e.g., fCovermean from 0.2 to 0.4, fCoverstd from 0.1 to 0.3) across selected reference areas and visually comparing the resulting forest masks to high-resolution imagery. The continuous forest mapped based on these two thresholds was referred to as forestts (Figure 3a).
Third, unlike regular-shaped, non-ground objects (e.g., building roofs) in urban scenarios, there can be many gaps in the forest canopy surface that increase the spatial variability of the mapped continuous forests (forestts) and complicate the timberline delineation. To simplify the subsequent timberline mapping, we conducted two morphological operations to minimize the spatial variability of the mapped forestts. We applied a single-pass bridge operation to connect spatially adjacent but unconnected continuous forest patches in forestts and then filled the canopy gaps for connected forest patches. Specifically, the “bridge” operation changes non-forested pixels to forests if their 8 connected neighbors contain at least two forested pixels ([30], using the “bwmorph” function in image processing toolbox, MATLAB R2023a). The “fill” operation changes all canopy gaps to forests where canopy gaps are non-forested pixels that cannot be reached from the image edges ([31], using the “imfill” function in image processing toolbox, MATLAB R2023a). The updated continuous forest map was referred to as foresttsmo (Figure 3a). Note that these morphological operations were intentionally limited to a single iteration each as repeated bridging (≥2 iterations) can alter the shape and extent of delineated forest boundaries, particularly in transitional zones, leading to possible over-connection of sparse patches.
The mapped foresttsmo accurately captures the core areas of continuous forests, while reducing the variability of the spatial patterns and gaps of the forest canopies. Yet, the smoothing of the original tree fCover and a low fCoverstd threshold for the continuous forest mapping fail to capture the forested pixels at its boundaries. In this regard, a region-growing segmentation technique can be used to connect all nearby pixels with characteristics similar to those of the target objects (Figure 3b). To simplify the delineated timberline, small-sized forest patches with a perimeter < 50 km from the seed extraction analysis were removed. For forest seed identification, given that canopy gaps within forest patches were filled during the morphological operations, the internal structure of each continuous forest patch in foresttsmo became spatially uniform in terms of connectivity. As a result, we selected the pixel with the highest tree fCover value along the outer boundary of each patch as its representative seed. This boundary-based selection is functionally equivalent to using a centrally located dense pixel, because the gap-filling step ensures no internal interruptions or structural discontinuities arise that would otherwise affect the region-growing process. In practice, the use of boundary seeds simplifies implementation while maintaining the robustness of forest expansion during segmentation.

2.2.2. Region-Growing Segmentation

With the representative forest seeds identified, the region-growing segmentation starts by traversing all unallocated neighbors of existing seeds in the source tree fCover map attached to the seed pool (i.e., marked as “true”) if they satisfy a user-defined criterion (Figure 3b). The label “unallocated” means that they have not been traversed yet. A new run of the merging process starts from the “unallocated” neighbors of the newly added “seeds” until there are no more neighbors that could be appended to the pool (Figure 3b).
The merging criterion for continuous forest segmentation was set to be tree fCover ≥ 0.3 (i.e., the definition of forests). To simplify the region-growing process on foresttsmo, we increased the tree fCover to 0.3 for all non-forested pixels captured by the foresttsmo. This ensures a continuous segmentation that may be interrupted during the region-growing process if there are canopy gaps or rivers with a low tree fCover in the original tree fCover. Once the region-growing process stopped, we filled all canopy gaps within the closed-boundary continuous forests. The updated continuous forest map after the region-growing segmentation (or forestrg) merges all edge forests into foresttsmo and refines the mapped continuous forests. The exterior boundaries of the continuous forests detected by forestrg were then extracted as our timberline (Figure 3a).

2.3. Evaluation and Comparison of the Mapped Timberline

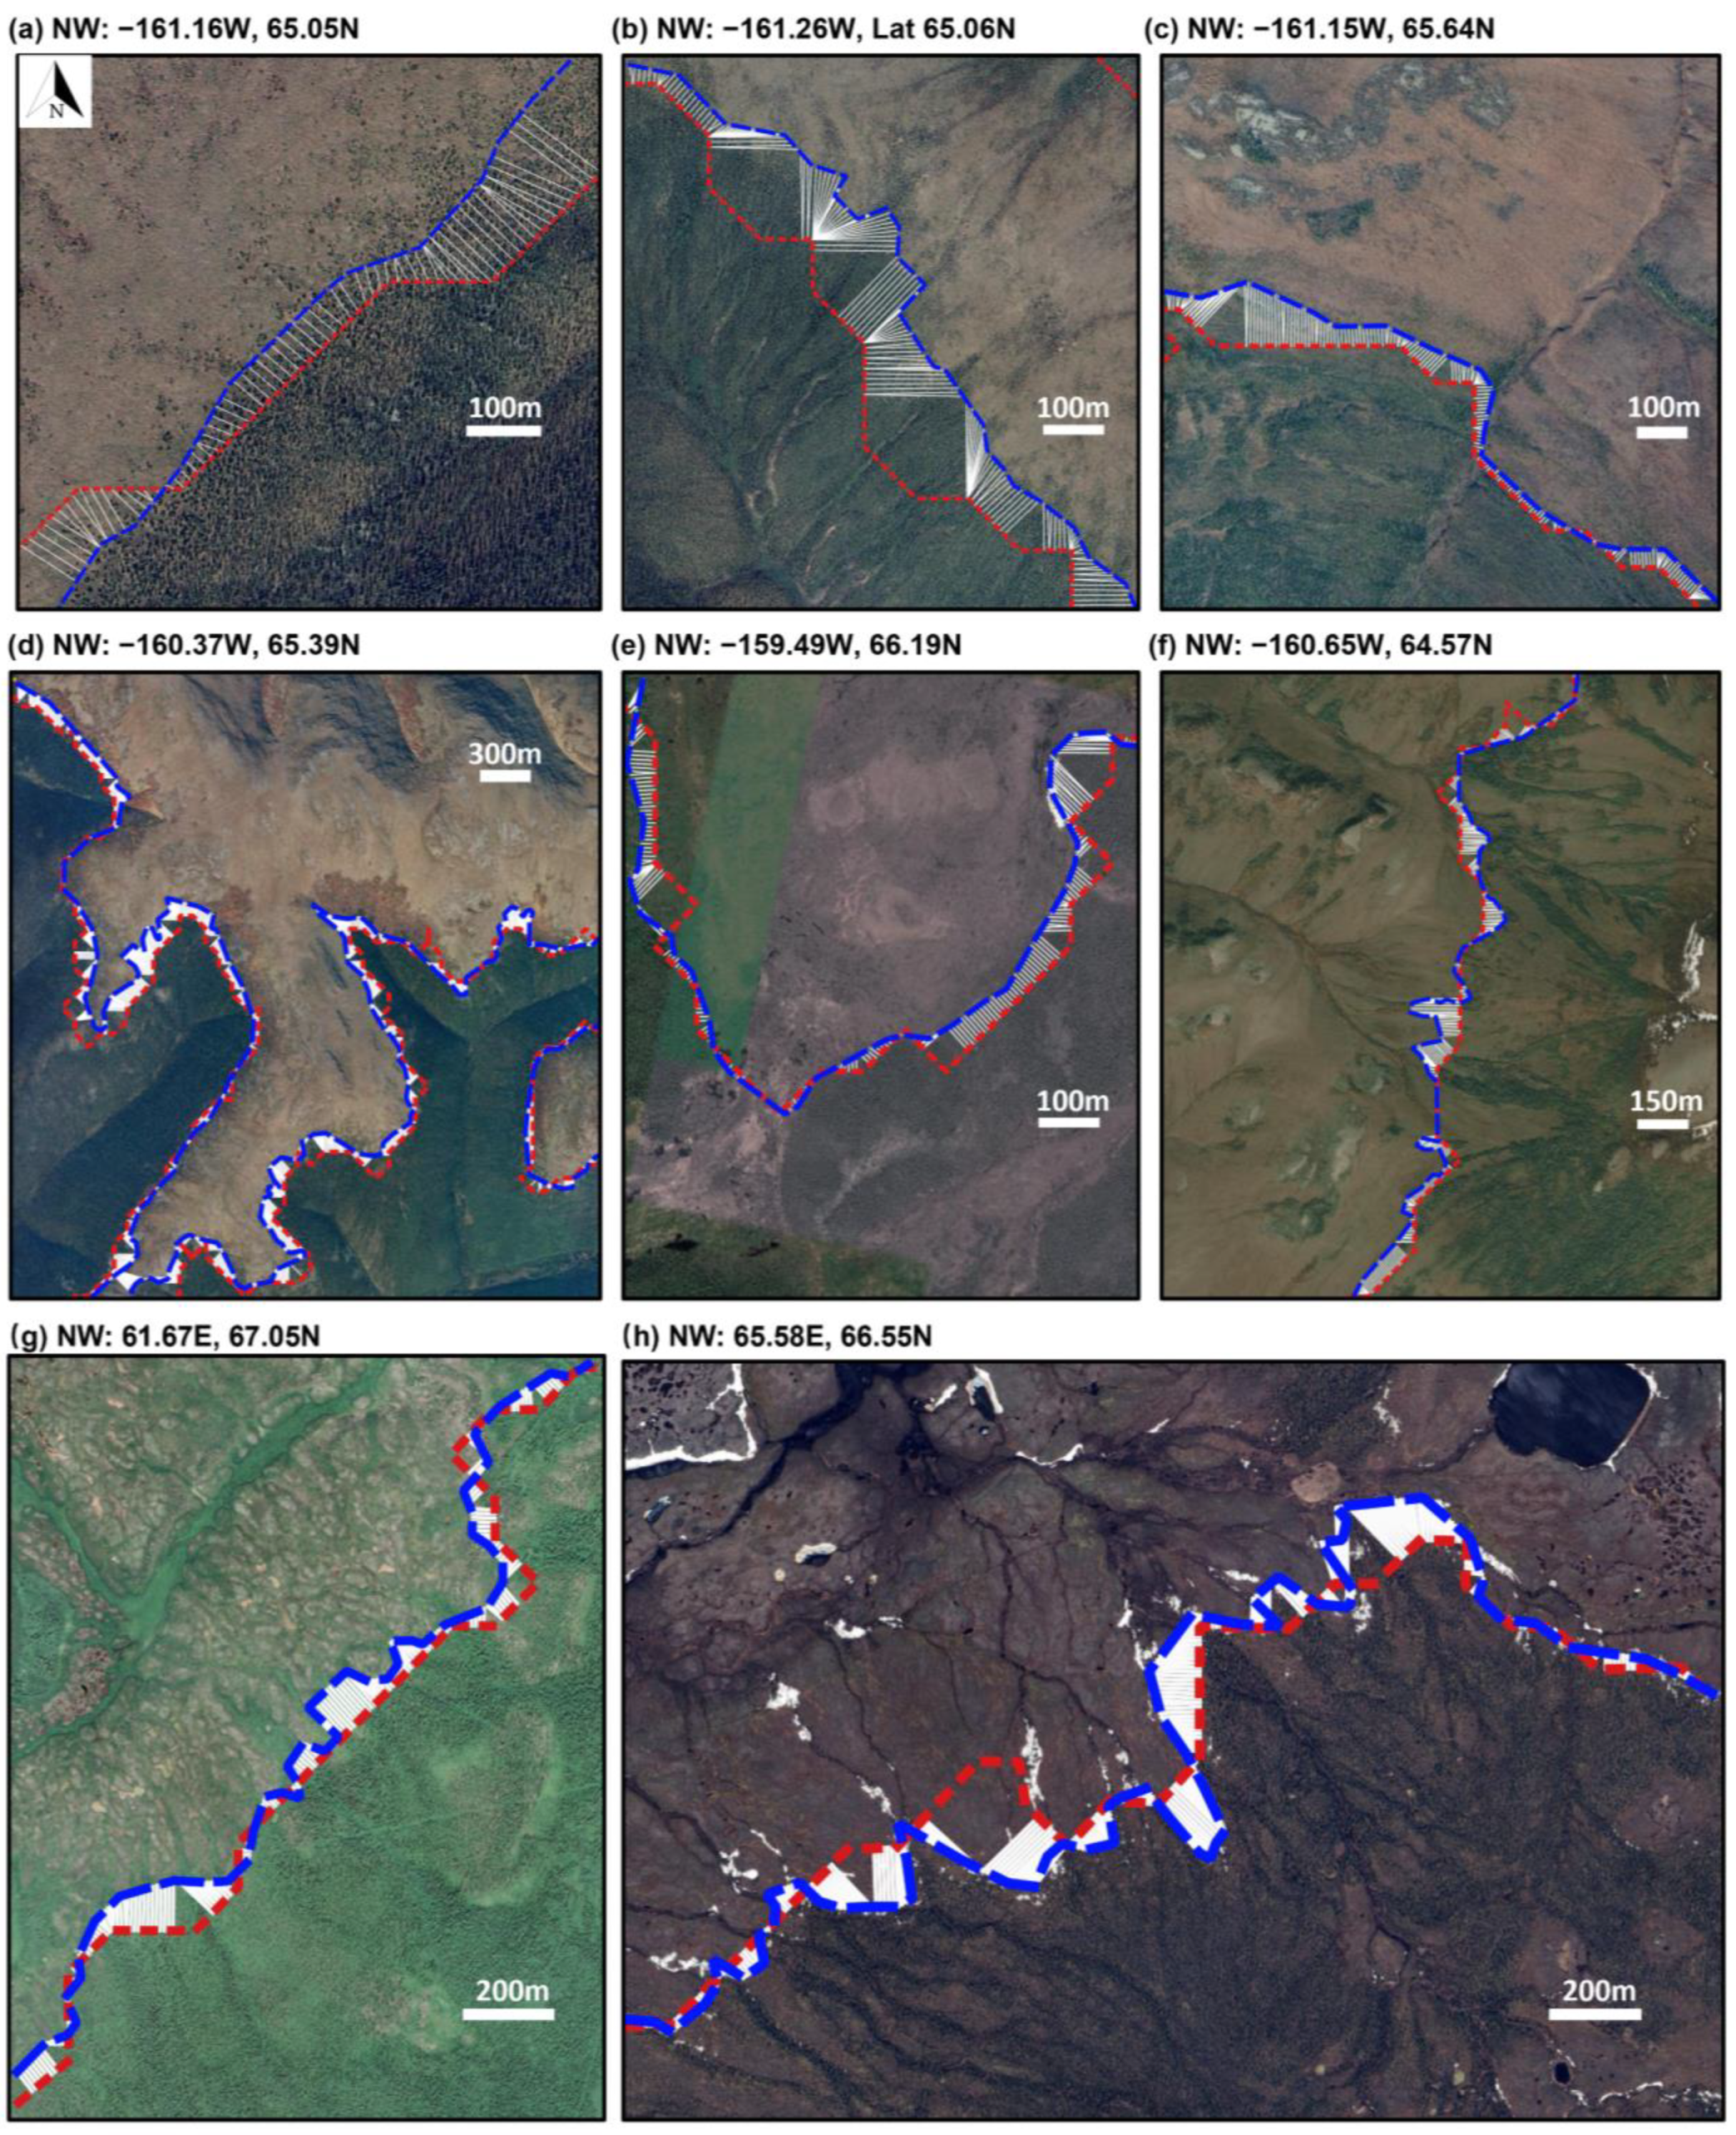
The reference timberlines used to quantitatively evaluate the accuracy of the timberline mapped by our proposed method were manually delineated from sub-meter-resolution Maxar satellite images archived in Google Earth at 8 small areas (Sites A–H, Figure 2), where 6 were in the Alaska region and 2 from Siberia due to image availability. We assigned points along the mapped timberline and the reference counterpart every 10 m (using the “point along geometry” tool in QGIS 3.23) to create linked paths between them for calculating the distance for each linked point pair (using the “distance to nearest hub” tool in QGIS 3.23). The accuracy metrics include the minimum, maximum, median, and standard deviation of the distances of all paired points within each selected area. For the timberline comparison, we presented the timberline mapped with the 0.3 iso-tree fCover-line (hereafter referred to as fCover-line0.3) [15] by generating a contour map from CGLS tree fCover to extract the contour line of tree fCover = 0.3 as the corresponding timberline.
To understand the tree encroachment status over the past two decades, we compared our mapped timberlines with the CAVM treeline [13] and the TTEs [11,12]. The CAVM treeline compiles an ensemble effort of worldwide experts and the source data in mapping treeline ranges from ecoregion and vegetation maps to personal experience [13,32], which has been widely used as a “gold standard” to mark the spatial domain (southern limit) of the TTE mapping [11,12]. The TTE product [12] was mapped from a 5-year composite of MODIS vegetation continuous field (VCF) imagery (2000–2005) using thresholding-based approaches and linearly adjusted using Quickbird-derived high-quality tree fCover samples. The entire TTE zone was divided into two classes: (1) class 1: TTE core areas with a 0.05–0.2 mean adjusted tree fCover, and (2) class 2: TTE transitional areas with mean tree fCover < 0.05 and standard deviation > 0.05. Here, class 2 marks the transitional areas between continuous forests and class 1. Finally, the updated TTE product [11] was developed based on thresholding the Landsat-derived tree fCover in year 2010 [19,33] as well as its local spatial gradient (abruptness), which categorizes the entire TTE region into abrupt, diffuse, and uniform patterns of tree cover that characterize spatially heterogeneous forest structures. This product provides two non-forest edge classes representing the transitional areas between forests and non-forests as an approximation of the associated treeline. Note that the treeline and TTE products are intrinsically connected yet different from our mapped timberline. Nevertheless, an advancement of timberline in comparison with the treeline reveals the regional-scale tree encroachment over the past two decades given the time frames of these products. Moreover, our initial timberlines primarily mark the outermost boundaries of continuous forest patches, which are not directly related to the other products. We identified the northern limit per longitude from the mapped timberlines as the latitudinal timberline, i.e., Arctic timberline, to enable a clearer comparison with the CAVM treeline.

3. Results

3.1. Timberline Delineation

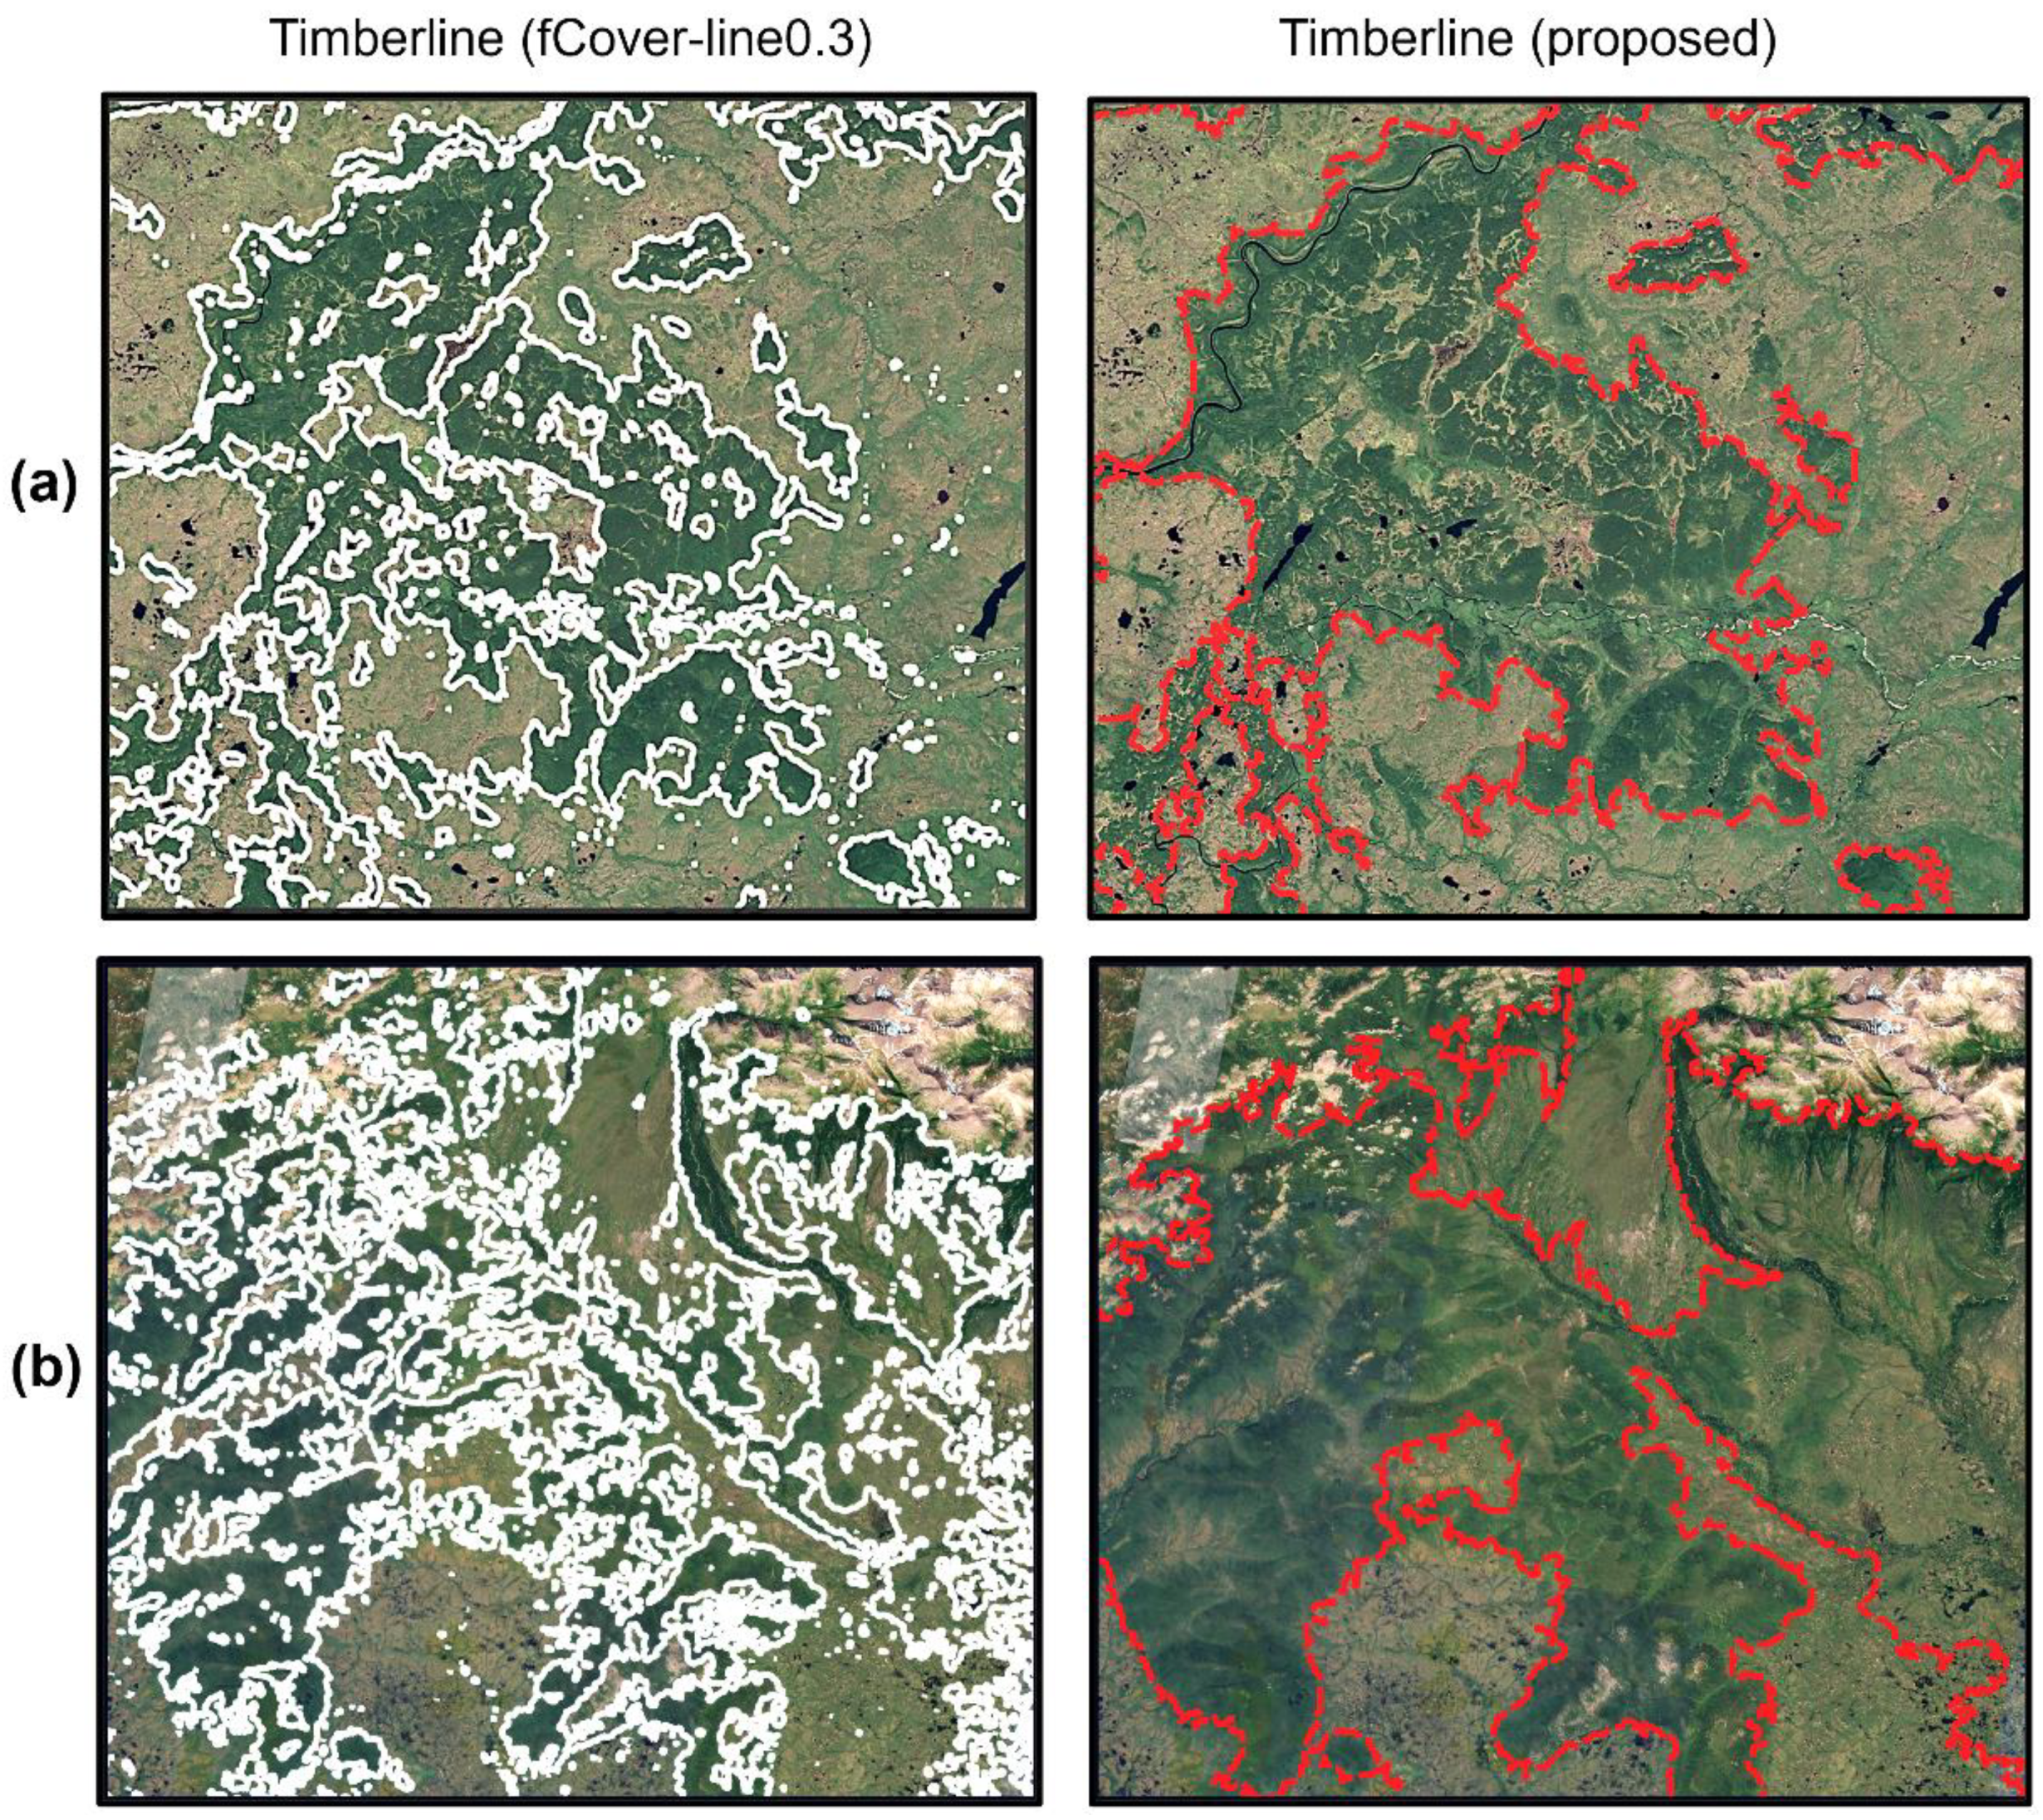
The mapped timberlines based on our method and the fCover-line0.3 approach for the zoomed areas in Figure 2 in Siberia and Alaska are illustrated in Figure 4. All timberlines spatially align well with the observed forest patterns in Landsat imagery. However, the timberline delineated by the fCover-line0.3 exhibits high spatial variability with canopy gaps. This spatially detailed timberline might be beneficial if the research objective were to understand the densifying patterns of forest cover, whereas it could complicate the regional-scale analysis of forest expansion/recession if the aim was to delineate the frontiers of continuous forests. Overall, our proposed timberline delineation approach appears to produce simplified timberlines that still effectively capture the outermost boundaries of large, spatially connected continuous forest patches while minimizing the spatial variability of delineated timberlines at forest canopy surfaces.
On the other hand, timberlines delineated from sub-meter-resolution satellite images at almost all test areas (Sites A–H) reveal more spatial details than can be resolved using medium-resolution Landsat-based products (Figure 5). While forest growth in high-latitude regions is generally slow, local disturbances or regrowth may occur and accumulate over 4–5 years, particularly near the advancing forest edge. Given the differences in both spatial resolution and acquisition dates between the source CGLS tree fCover (2019) and the very-high-resolution imagery (2023–2024), it is likely that some of the additional forest pixels observed near the forest boundary reflect real forest growth in the intervening years, in addition to higher image resolution. This highlights an inherent source of temporal uncertainty in our validation and underscores the importance of co-temporal, high-resolution tree cover datasets for future benchmarking and accuracy assessments. Nonetheless, given the use of fractional tree cover and conservative thresholds, our method remains structurally robust for delineating the stable frontiers of continuous forests. In this context, the timberlines derived from the medium-resolution CGLS product tend to yield more conservative estimates of forest extent, especially in ecotonal zones where expansion is gradual. This conservative nature is supported by the observed offset between automated and manually delineated timberlines, with average boundary distances ranging from 32.22 to 103.88 m (Table 2).

3.2. Comparison of the Delineated Timberline with the CAVM Treeline, the TTE Mapped by Ranson et al. (2011) [12], and the Non-Forest Edge Classes Mapped by Montesano et al. (2020) [11]

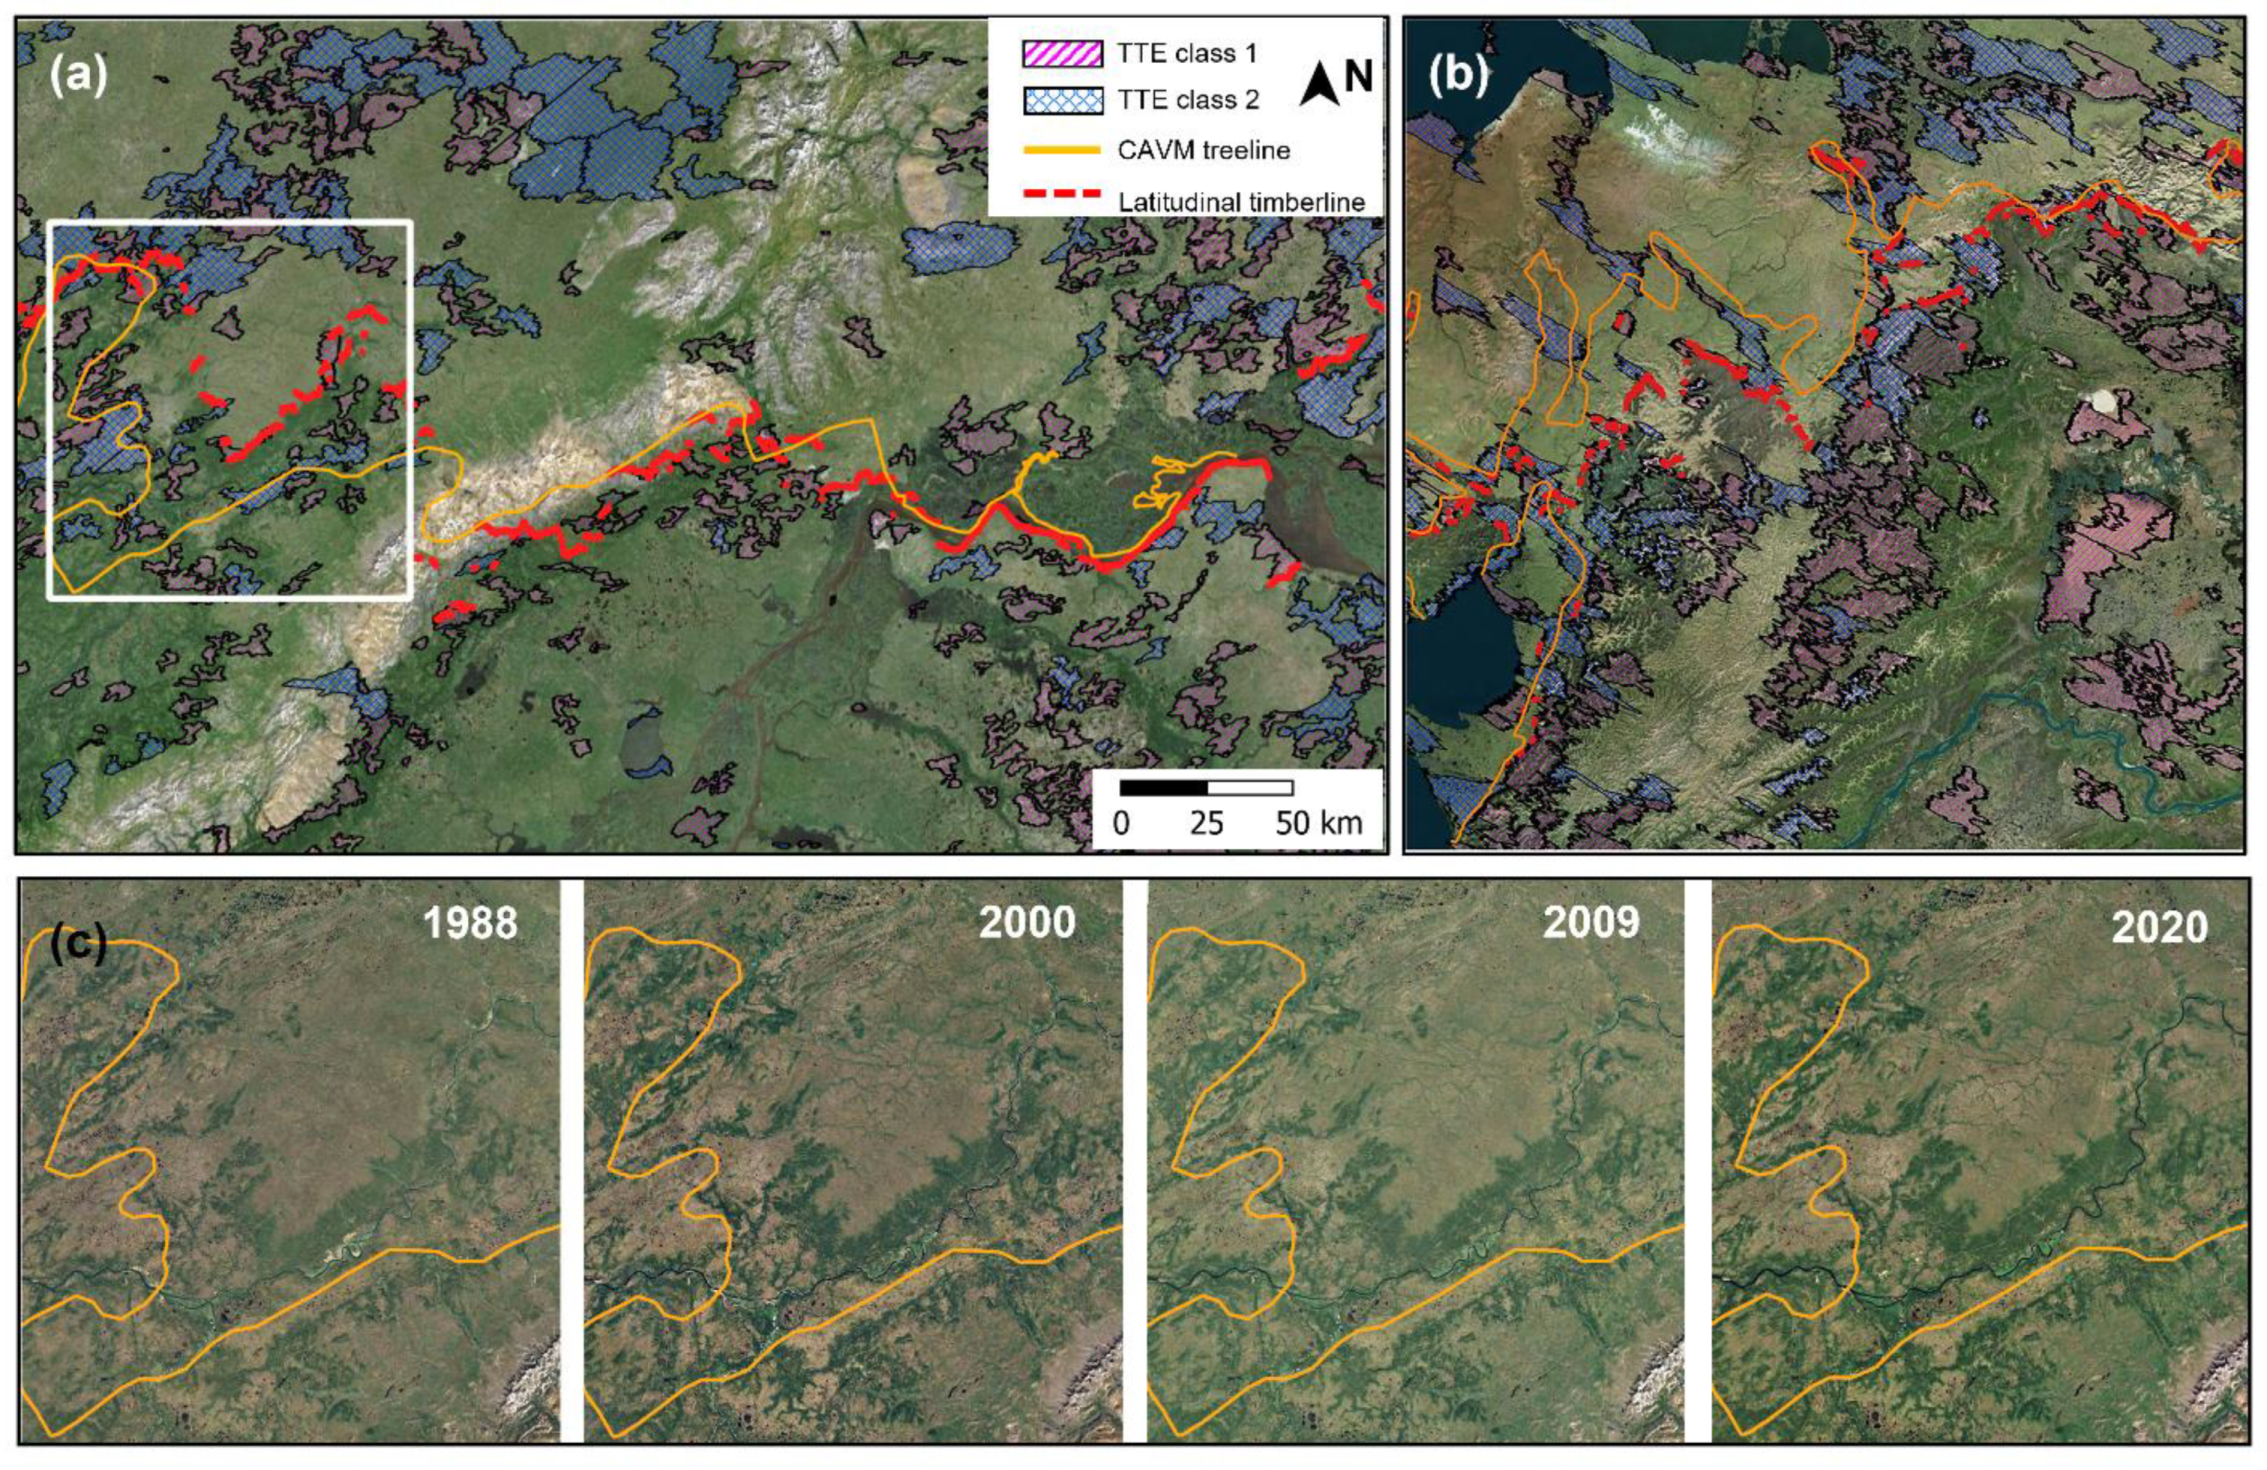
The comparison among our delineated latitudinal timberline, CAVM treeline [13], TTE product [12], and non-forest edge classes [11] for all of Siberia and Alaska (Figure 6 and Figure A1) suggests that our delineated timberline aligns well with the observed frontiers of major continuous forests visually identified from the satellite imagery (Figure 6). However, it is essential to recognize that these products are based on different ecological definitions and mapping objectives. The CAVM treeline delineates the northernmost occurrence of individual trees or sparse tree stands—effectively representing a tree presence threshold. In contrast, our delineated timberline represents the frontier of structurally continuous forest cover, derived from stable, spatially aggregated tree fractional cover. Given this distinction, the treeline is expected to lie north of the timberline, and any direct one-to-one comparison between the two may be misleading if the underlying ecological meanings are not considered.
That said, localized cases where our mapped timberline extends beyond the CAVM treeline—such as on the western flank of the Polar Ural Mountains (Figure 6a, white box)—may reflect real forest infilling or expansion since the early 2000s. Still, this interpretation must be tempered by the structural nature of our method and the conservative thresholding applied. Historical Landsat imagery (Figure 6c) confirms that the boundaries of continuous forest in this region have remained relatively stable since 1988, suggesting that the divergence from the CAVM product likely reflects definitional and methodological differences rather than rapid ecological change.
Compared to the other benchmark products, the non-forest edge classes [11] are effective at smoothing boundary noise within large forest patches but yield more spatial variability outside these zones, likely due to Landsat-derived fCover uncertainties (Figure A1). The TTE product by Ranson et al. [12], although based on multi-year MODIS composites (2000–2005), appears fragmented and difficult to interpret, especially due to the ambiguity between its core and transitional zones. These differences further highlight the advantage of a structurally defined, region-growing approach like ours, which provides a more coherent delineation of continuous forest boundaries at regional scales.

4. Discussion

4.1. Tree Encroachment at Regional Scales

Tree encroachment, which has been mostly studied at plot scales [34,35,36], strongly affects energy and carbon transfer processes at local to regional scales. Our findings indicate that tree encroachment at regional scales may not be as rapid and extensive as reported previously (e.g., [9]) due to the differences in forest definition and mapping data sources. When referring to the specific mapped products, though the differences among timberline, treeline, and TTE have been clarified in previous papers [8,37], these products were still generalized in terms of their meaning. For instance, the “treelines” mapped in [14,15] are essentially timberlines that represent the frontiers of continuous forests rather than individual trees. The treeline and TTE were even redefined in [9], in which treeline was moved to the center of the TTE rather than to the frontiers of forests, and the TTE was narrowed down to exclude the transition areas to continuous forest and tundra. Mixed uses of forestline and treeline are also found in [38,39], even the Alpine treeline zone (similar to TTE in the Arctic region) was identified as treeline in [40]. Inconsistency in the forest definitions throughout existing thresholding-based studies (Table 1) causes difficulties in cross-study comparisons as the mapped products may correspond to different land covers.
Our finding about the inconsistency between the CAVM treeline and Landsat historical images suggests that the resolution of the image sources used for delineating the CAVM treeline may not be sufficient for detecting trees present in high-resolution satellite imagery. The accuracy of the mapped treeline indicating the past tree growth limit in the Arctic region remains uncertain. Caution is needed when using the CAVM treeline as a reference to deduce recent tree encroachment status [9]. Moreover, there is a lack of rigorous validation of the mapped regional-scale products in previous mapping efforts that involve different data sources [9,11,12]. Specifically, Ranson et al. [12] used 5-year composite MODIS VCF imagery to map a pan-Arctic TTE zone to address the tree fCover estimate uncertainties in the original product. Walther et al. [9] used inter-annual time series statistics computed from satellite products of vegetation and climate to synthetic aperture radar polarization bands when predicting the recent TTE and treeline locations. Montesano et al. [11] also employed a thresholding-based approach to map the TTE but changed the tree fCover sources to Landsat GFCC products. The distinct spatial configurations among different data sources (MODIS or Landsat) may render the mapped products incomparable. For the purpose of understanding the tree encroachment status in the Arctic region, we recommend using consistent terminology regarding treeline/timberline/TTE and employing consistent mapping strategies to enable cross-comparison. Rigorous validation of the mapped products using high-resolution images can improve the comparability of the mapped products.
For clarity, we reiterate that in this study, timberline refers to the outer boundary of structurally continuous forest cover, as delineated by spatially aggregated, stable tree fCover. In contrast, treeline represents the most poleward (in the Arctic context) extent of individual trees, and the taiga–tundra ecotone (TTE) denotes the broad transitional zone between these two boundaries. While these terms are sometimes used interchangeably in the previous literature, we consistently apply them according to these structural and ecological definitions throughout our analysis.

4.2. Quality of the Source Tree fCover Data in Timberline Mapping

Tree fCover was selected in this study to experiment with our proposed timberline delineation method given that tree fCover contains fewer noises than original spectral bands. We find that the mapped timberline accurately captures the frontiers of continuous forests at medium-resolution scales. Yet, the timberline mapping accuracy relies heavily on the quality of the source tree fCover product.
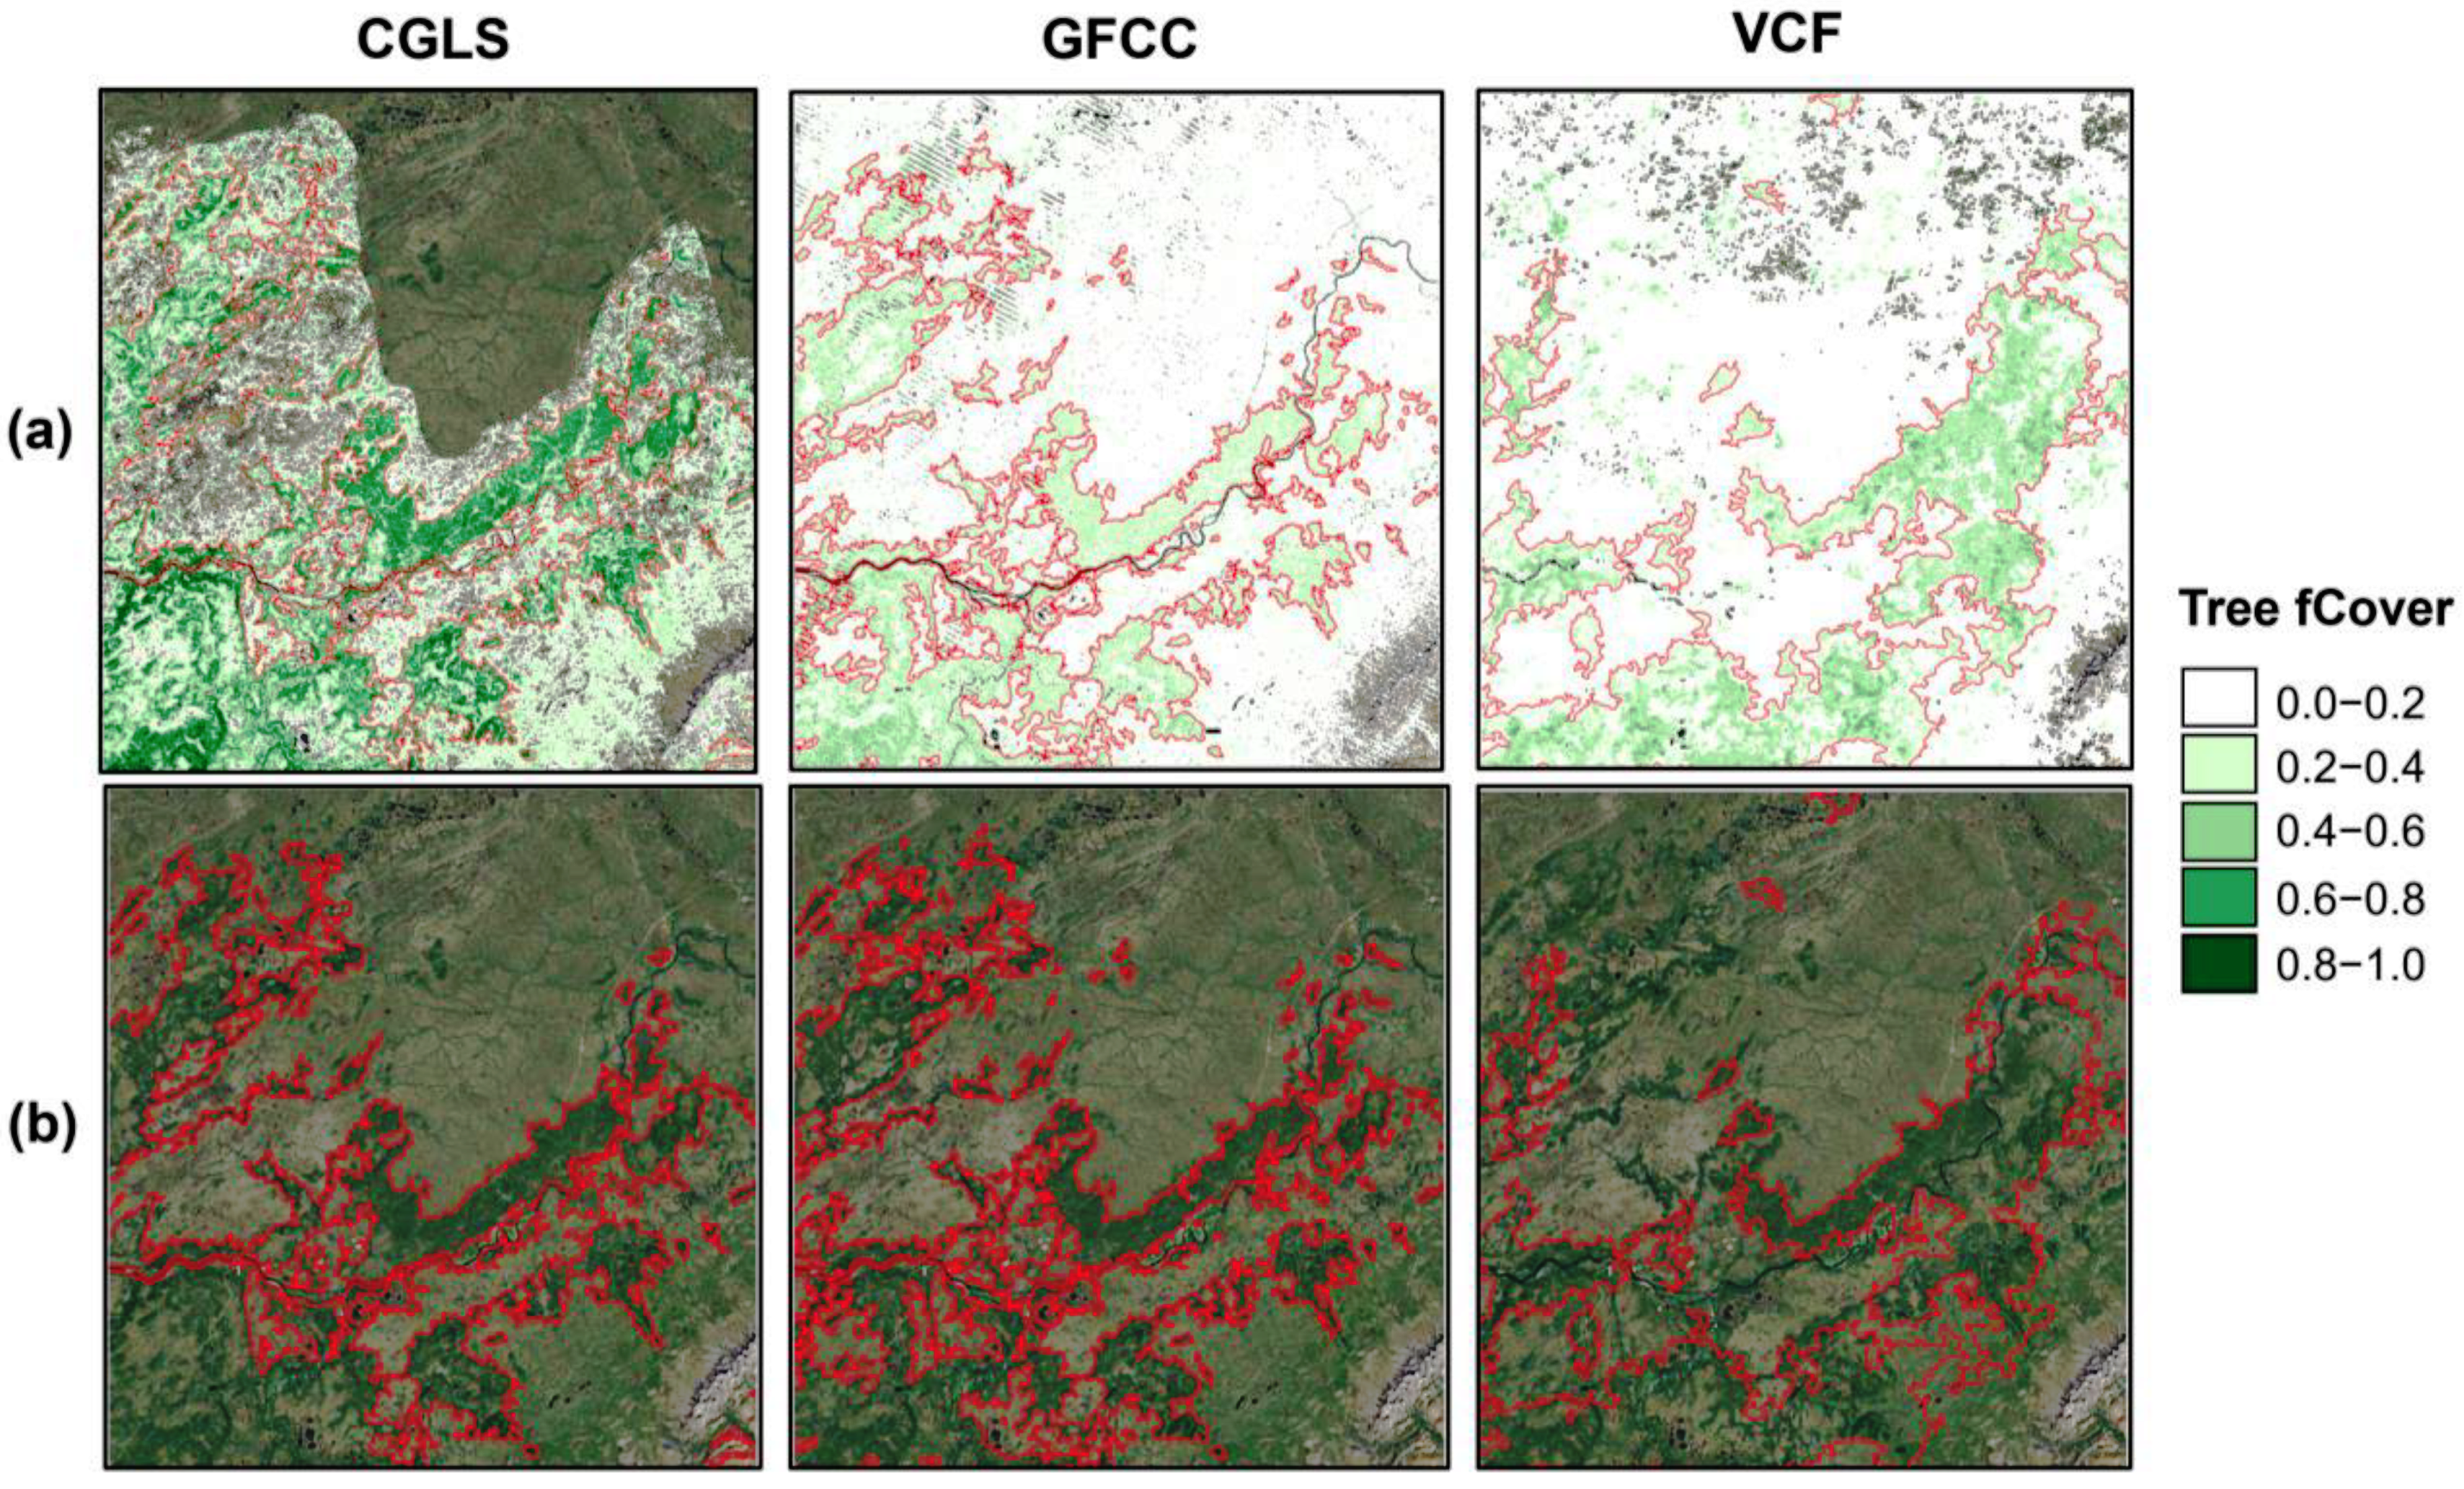
Other publicly accessible long-term tree fCover products with medium-to-coarse spatial resolutions not covered by the CGLS domain have been widely applied in forest gain/loss studies [19,41] including the MODIS VCF (yearly product since 2000) [17] and the Landsat GFCC (discrete observations every 5 years from 2000 to 2015) [18,19]. We then proceeded to map the timberlines using the VCF and GFCC tree cover products, employing the timberline delineation approach (Figure 7). Figure 7 clearly shows that the GFCC-derived continuous forests’ tree fCover (outlined by the CGLS-derived timberline with tree fraction < 0.4) is substantially underestimated compared to CGLS and VCF tree fCover, concurring with previous findings for Subarctic Western and Central Canada [42]. When lowering the thresholds (fCovermean, fCoverstd) for both GFCC and VCF (i.e., forestts), the continuous forest patches were modified to fCovermean > 0.15 with fCoverstd < 0.05 and fCovermean > 0.1 with fCoverstd < 0.1 for GFCC and VCF, respectively. The criteria for merging forest pixels on the edge were also modified in accordance with the modified fCovermean thresholds.
With the modified tree fCover thresholds, our proposed timberline delineation method remains effective in capturing the exterior boundaries of major continuous forest patches for both VCF and GFCC while reducing the spatial variability (Figure 7). Although VCF tree fCover seems more accurate than GFCC, the former product contains more noises (Figure 7a), causing the omission errors of continuous forests in timberline delineation. In contrast, CGLS and GFCC appear more reliable in preserving the spatial patterns of continuous forests, likely because of higher spatial resolutions. Note that the GFCC dataset also significantly underestimates the tree cover of the study domain (Figure 7) compared to the CGLS dataset. Despite this discrepancy, the proposed timberline delineation approach is able to capture the boundaries of all major continuous forests observed in the satellite imagery by adjusting the tree cover thresholds. GFCC can be used as a great supplement or alternative for the CGLS product in large-scale and long-term timberline delineation given its expanded spatial coverage and extended study period.
Some land cover products, such as the Dynamic World land cover product [22], offer annual observations on tree classification, where Dynamic World additionally reports near real-time class probability at 10 m resolution. Its fine spatial resolution and probabilistic framework make it a promising tool for certain forest applications, especially in heterogeneous landscapes. However, it is important to note that Dynamic World does not provide continuous fractional estimates of tree cover, but rather the probability that a pixel belongs to the “tree” class at a given time. This makes it fundamentally different from products like MODIS VCF, GFCC, GLOBMAP FTC, or CGLS, which quantify the proportion of canopy cover as a continuous variable. For analyses focused on delineating the structural timberline—where the continuity and density of tall trees must be evaluated over multiple years, class probability data alone are insufficient. The temporal instability of class probabilities and lack of a continuous fractional metric complicate its integration into a region-growing segmentation approach. Nonetheless, with further refinement, Dynamic World may serve as a valuable complementary dataset or as a training source for the high-resolution downscaling of fractional tree cover in the future.
Additionally, we found that finer-scale satellite images (e.g., sub-meter-resolution imagery) are needed for more accurate timberline delineation. Accurate timberlines with forest cover and height products enables a better characterization of different TTE forms (“abrupt” or “diffuse” patterns of forest cover) for understanding forest–climate feedback at ecotone scales [11,43]. Since low-statured shrubs with shorter growing seasons often grow faster than trees in the Arctic region [44], the developed methodology of timberline delineation will be extended to shrubline mapping for understanding short-term vegetation responses to climate changes.

5. Conclusions

This study presents a scalable, automatic approach for delineating the timberline—defined as the boundary of structurally continuous forest cover—using seeded region-growing segmentation applied to satellite-derived tree fractional cover. Our method minimizes spatial variability in mapped boundaries and captures the frontiers of continuous forest with greater coherence than thresholding-based alternatives. Through sub-meter-scale validation and comparisons with historical and existing treelines and TTE products, we found that tree encroachment at regional scales is more conservative than previously reported. This discrepancy stems in part from inconsistent definitions and mapping strategies in prior studies. This work highlights the importance of consistent terminology—distinguishing between timberline, treeline, and TTE—and the need for rigorous validation using high-resolution imagery to support reliable assessments of forest change in climate-sensitive transition zones. Our mapping framework is broadly applicable to ecotonal mapping beyond Arctic regions and may be extended to delineate shrublines, offering insights into short-term vegetation dynamics and climate responses across boreal and tundra landscapes.

Author Contributions

Conceptualization, T.Z. and D.L.; Methodology, T.Z.; Validation, T.Z.; Formal analysis, T.Z.; Writing—original draft, T.Z.; Writing—review & editing, T.Z., J.K., F.M.H., V.I., J.W., A.Y.S., W.Z., P.M. and D.L.; Supervision, D.L.; Funding acquisition, J.K., V.I., J.W., A.Y.S. and D.L. All authors have read and agreed to the published version of the manuscript.

Funding

Research was partially sponsored by the National Science Foundation Office of Polar Programs under grants 1724786 (Ohio State University), 1725654 (University of Michigan), 1724633 (Georgia Tech), and 1724868 (Kansas State University); and the United States Army Corps of Engineers (USACE) Engineering Research and Development Center (ERDC) Geospatial Research Laboratory (GRL), accomplished under Cooperative Agreement Federal Award Identification Number (FAIN) W9132V-22-2-0001. The views and conclusions contained in this document are those of the authors and should not be interpreted as representing the official policies, either expressed or implied, of USACE ERDC GRL or the U.S. Government. The U.S. Government is authorized to reproduce and distribute reprints for Government purposes notwithstanding any copyright notation herein. Partial support was provided by the Next Generation Ecosystem Experiments (NGEE)-Arctic project, which is sponsored by the Earth and Environmental Systems Sciences Division (EESSD) of the Biological and Environmental Research (BER) office in the US Department of Energy Office of Science. This manuscript has been authored in part by UT-Battelle, LLC, under contract DE-AC05-00OR22725 with the US Department of Energy (DOE).

Data Availability Statement

The developed timberline products in this study can be found at https://zenodo.org/records/10023630, accessed on 15 October 2023. The source tree fractional data used to evaluate our timberline delineation work were collected from the “tree-coverfraction” variable in the Copernicus Global Land Service product, which can be accessed via https://developers.google.com/earth-engine/datasets/catalog/COPERNICUS_Landcover_100m_Proba-V-C3_Global, accessed on 15 August 2023. The treeline product mapped by the Circumpolar Arctic Vegetation Map can be found at https://www.arcticatlas.org/maps/, accessed on 15 August 2023. The Taiga-Tundra Ecotone map developed by Ranson et al. [12] is downloadable via https://daac.ornl.gov/VEGETATION/guides/Taiga_Tundra_Ecotone_Tree_Cover.html, accessed on 15 August 2023. The Taiga-Tundra Ecotone map developed by Montesano et al. [11] is available as a Google Earth Engine asset upon request.

Acknowledgments

During the preparation of this work, the author(s) used ChatGPT3.5/4.0 to polish the manuscript in order to improve its readability. After using this tool/service, the author reviewed and edited the content as needed and take full responsibility for the content of the publication.

Conflicts of Interest

The authors declare no conflict of interest.

Appendix A

Figure A1. Regional-scale comparison among the latitudinal timberline mapped by the proposed method, the CAVM treeline of Walker et al. (2005) [13], and the non-forest edge classes of the TTE product (colored in magenta, Montesano et al. (2020) [11] in the (a) West Siberian Plain and (b) Alaska region displayed by Landsat imagery.
Remotesensing 17 02002 g0a1

References

  1. Harsch, M.A.; Hulme, P.E.; McGlone, M.S.; Duncan, R.P. Are Treelines Advancing? A Global Meta-Analysis of Treeline Response to Climate Warming. Ecol. Lett. 2009, 12, 1040–1049. [Google Scholar] [CrossRef] [PubMed]
  2. Hofgaard, A.; Ols, C.; Drobyshev, I.; Kirchhefer, A.J.; Sandberg, S.; Söderström, L. Non-Stationary Response of Tree Growth to Climate Trends Along the Arctic Margin. Ecosystems 2019, 22, 434–451. [Google Scholar] [CrossRef]
  3. Hofgaard, A.; Wilmann, B. Plant Distribution Pattern across the Forest-Tundra Ecotone: The Importance of Treeline Position. Écoscience 2002, 9, 375–385. [Google Scholar] [CrossRef]
  4. Jobbágy, E.G.; Jackson, R.B. Global Controls of Forest Line Elevation in the Northern and Southern Hemispheres. Glob. Ecol. Biogeogr. 2000, 9, 253–268. [Google Scholar] [CrossRef]
  5. Timoney, K.P.; Mamet, S.D.; Cheng, R.; Lee, P.; Robinson, A.L.; Downing, D.; Wein, R.W. Tree Cover Response to Climate Change in the Forest-Tundra of North-Central Canada: Fire-Driven Decline, Not Northward Advance. Écoscience 2019, 26, 133–148. [Google Scholar] [CrossRef]
  6. Cunill, R.; Pelachs, A.; Soriano, J.M. The Consequences on Landscape of New Land Uses in the Upper Forest Line. In Naturbanization: New Identities and Processes for Rural-Natural Areas; CRC Press: Boca Raton, FL, USA, 2008; pp. 247–260. [Google Scholar]
  7. Motta, R.; Morales, M.; Nola, P. Human Lands-Use, Forest Dynamics and Tree Growth at the Treeline in the Western Italian Alps. Ann. For. Sci. 2006, 63, 739–747. [Google Scholar] [CrossRef]
  8. Latwal, A.; Sah, P.; Sharma, S. A Cartographic Representation of a Timberline, Treeline and Woody Vegetation around a Central Himalayan Summit Using Remote Sensing Method. Trop. Ecol. 2018, 59, 177–186. [Google Scholar]
  9. Walther, C.; Hüttich, C.; Urban, M.; Schmullius, C. Modelling the Arctic Taiga-Tundra Ecotone Using ALOS PALSAR and Optical Earth Observation Data. Int. J. Appl. Earth Obs. Geoinf. 2019, 81, 195–206. [Google Scholar] [CrossRef]
  10. Callaghan, T.V.; Werkman, B.R.; Crawford, R.M. The Tundra-Taiga Interface and Its Dynamics: Concepts and Applications. Ambio 2002, 12, 6–14. [Google Scholar]
  11. Montesano, P.M.; Neigh, C.S.R.; Macander, M.; Feng, M.; Noojipady, P. The Bioclimatic Extent and Pattern of the Cold Edge of the Boreal Forest: The Circumpolar Taiga-Tundra Ecotone. Environ. Res. Lett. 2020, 15, 105019. [Google Scholar] [CrossRef]
  12. Ranson, K.J.; Montesano, P.M.; Nelson, R. Object-Based Mapping of the Circumpolar Taiga–Tundra Ecotone with MODIS Tree Cover. Remote Sens. Environ. 2011, 115, 3670–3680. [Google Scholar] [CrossRef]
  13. Walker, D.A.; Raynolds, M.K.; Daniëls, F.J.A.; Einarsson, E.; Elvebakk, A.; Gould, W.A.; Katenin, A.E.; Kholod, S.S.; Markon, C.J.; Melnikov, E.S.; et al. The Circumpolar Arctic Vegetation Map. J. Veg. Sci. 2005, 16, 267–282. [Google Scholar] [CrossRef]
  14. Prakash Singh, C.; Mohapatra, J.; Pandya, H.A.; Gajmer, B.; Sharma, N.; Shrestha, D.G. Evaluating Changes in Treeline Position and Land Surface Phenology in Sikkim Himalaya. Geocarto Int. 2020, 35, 453–469. [Google Scholar] [CrossRef]
  15. Van Bogaert, R.; Haneca, K.; Hoogesteger, J.; Jonasson, C.; De Dapper, M.; Callaghan, T.V. A Century of Tree Line Changes in Sub-Arctic Sweden Shows Local and Regional Variability and Only a Minor Influence of 20th Century Climate Warming. J. Biogeogr. 2011, 38, 907–921. [Google Scholar] [CrossRef]
  16. Myers-Smith, I.H.; Kerby, J.T.; Phoenix, G.K.; Bjerke, J.W.; Epstein, H.E.; Assmann, J.J.; John, C.; Andreu-Hayles, L.; Angers-Blondin, S.; Beck, P.S.A.; et al. Complexity Revealed in the Greening of the Arctic. Nat. Clim. Change 2020, 10, 106–117. [Google Scholar] [CrossRef]
  17. Carroll, M.; Townshend, J.; Hansen, M.; DiMiceli, C.; Sohlberg, R.; Wurster, K. MODIS Vegetative Cover Conversion and Vegetation Continuous Fields. In Land Remote Sensing and Global Environmental Change; Springer: Berlin/Heidelberg, Germany, 2010; pp. 725–745. [Google Scholar]
  18. Sexton, J.O.; Song, X.-P.; Feng, M.; Noojipady, P.; Anand, A.; Huang, C.; Kim, D.-H.; Collins, K.M.; Channan, S.; DiMiceli, C.; et al. Global, 30-m Resolution Continuous Fields of Tree Cover: Landsat-Based Rescaling of MODIS Vegetation Continuous Fields with Lidar-Based Estimates of Error. Int. J. Digit. Earth 2013, 6, 427–448. [Google Scholar] [CrossRef]
  19. Hansen, M.C.; Potapov, P.V.; Moore, R.; Hancher, M.; Turubanova, S.A.; Tyukavina, A.; Thau, D.; Stehman, S.V.; Goetz, S.J.; Loveland, T.R.; et al. High-Resolution Global Maps of 21st-Century Forest Cover Change. Science 2013, 342, 850–853. [Google Scholar] [CrossRef]
  20. Liu, Y.; Liu, R.; Qi, L.; Chen, J.; Dong, J.; Wei, X. Global Mapping of Fractional Tree Cover for Forest Cover Change Analysis. ISPRS J. Photogramm. Remote Sens. 2024, 211, 67–82. [Google Scholar] [CrossRef]
  21. Buchhorn, M.; Lesiv, M.; Tsendbazar, N.-E.; Herold, M.; Bertels, L.; Smets, B. Copernicus Global Land Cover Layers—Collection 2. Remote Sens. 2020, 12, 1044. [Google Scholar] [CrossRef]
  22. Brown, C.F.; Brumby, S.P.; Guzder-Williams, B.; Birch, T.; Hyde, S.B.; Mazzariello, J.; Czerwinski, W.; Pasquarella, V.J.; Haertel, R.; Ilyushchenko, S. Dynamic World, Near Real-Time Global 10 m Land Use Land Cover Mapping. Sci. Data 2022, 9, 251. [Google Scholar] [CrossRef]
  23. Adams, R.; Bischof, L. Seeded Region Growing. IEEE Trans. Pattern Anal. Mach. Intell. 1994, 16, 641–647. [Google Scholar] [CrossRef]
  24. Tsendbazar, N.-E.; Tarko, A.; Li, L.; Herold, M.; Lesiv, M.; Fritz, S.; Maus, V. Copernicus Global Land Service: Land Cover 100m: Version 3 Globe 2015–2019: Validation Report; Zenodo: Geneve, Switzerland, 2020. [Google Scholar]
  25. Özcan, A.H.; Ünsalan, C.; Reinartz, P. Ground Filtering and DTM Generation from DSM Data Using Probabilistic Voting and Segmentation. Int. J. Remote Sens. 2018, 39, 2860–2883. [Google Scholar] [CrossRef]
  26. Cai, S.; Liu, D.; Sulla-Menashe, D.; Friedl, M.A. Enhancing MODIS Land Cover Product with a Spatial–Temporal Modeling Algorithm. Remote Sens. Environ. 2014, 147, 243–255. [Google Scholar] [CrossRef]
  27. Liu, D.; Cai, S. A Spatial-Temporal Modeling Approach to Reconstructing Land-Cover Change Trajectories from Multi-Temporal Satellite Imagery. Ann. Assoc. Am. Geogr. 2012, 102, 1329–1347. [Google Scholar] [CrossRef]
  28. Král, K. Classification of Current Vegetation Cover and Alpine Treeline Ecotone in the Praděd Reserve (Czech Republic), Using Remote Sensing. Mt. Res. Dev. 2009, 29, 177–183. [Google Scholar] [CrossRef]
  29. Ranson, K.J.; Sun, G.; Kharuk, V.I.; Kovacs, K. Assessing Tundra–Taiga Boundary with Multi-Sensor Satellite Data. Remote Sens. Environ. 2004, 93, 283–295. [Google Scholar] [CrossRef]
  30. Kong, T.Y.; Rosenfeld, A. Topological Algorithms for Digital Image Processing; Elsevier: Amsterdam, The Netherlands, 1996. [Google Scholar]
  31. Soille, P. Morphological Image Analysis; Springer: Berlin/Heidelberg, Germany, 2004; ISBN 978-3-642-07696-1. [Google Scholar]
  32. Timoney, K.P.; la Roi, G.H.; Zoltai, S.C.; Robinson, A.L. The High Subarctic Forest-Tundra of Northwestern Canada: Position, Width, and Vegetation Gradients in Relation to Climate. Arctic 1992, 45, 1–9. [Google Scholar] [CrossRef]
  33. Montesano, P.M.; Neigh, C.S.R.; Sexton, J.; Feng, M.; Channan, S.; Ranson, K.J.; Townshend, J.R. Calibration and Validation of Landsat Tree Cover in the Taiga−Tundra Ecotone. Remote Sens. 2016, 8, 551. [Google Scholar] [CrossRef]
  34. Cazzolla Gatti, R.; Callaghan, T.; Velichevskaya, A.; Dudko, A.; Fabbio, L.; Battipaglia, G.; Liang, J. Accelerating Upward Treeline Shift in the Altai Mountains under Last-Century Climate Change. Sci. Rep. 2019, 9, 7678. [Google Scholar] [CrossRef]
  35. MacDonald, G.M.; Kremenetski, K.V.; Beilman, D.W. Climate Change and the Northern Russian Treeline Zone. Phil. Trans. R. Soc. B 2008, 363, 2283–2299. [Google Scholar] [CrossRef]
  36. Zhou, W.; Mazepa, V.; Shiyatov, S.; Shalaumova, Y.V.; Zhang, T.; Liu, D.; Sheshukov, A.; Wang, J.; El Sharif, H.; Ivanov, V. Spatiotemporal Dynamics of Encroaching Tall Vegetation in Timberline Ecotone of the Polar Urals Region, Russia. Environ. Res. Lett. 2021, 17, 014017. [Google Scholar] [CrossRef]
  37. Mathisen, I.E.; Mikheeva, A.; Tutubalina, O.V.; Aune, S.; Hofgaard, A. Fifty Years of Tree Line Change in the Khibiny Mountains, Russia: Advantages of Combined Remote Sensing and Dendroecological Approaches. Appl. Veg. Sci. 2014, 17, 6–16. [Google Scholar] [CrossRef]
  38. Bryn, A.; Potthoff, K. Assessing the Impact of Climate Change Versus Land Use on Tree- and Forest Line Dynamics in Norway. In Mountain Landscapes in Transition: Effects of Land Use and Climate Change; Schickhoff, U., Singh, R.B., Mal, S., Eds.; Sustainable Development Goals Series; Springer International Publishing: Cham, Switzerland, 2022; pp. 613–626. ISBN 978-3-030-70238-0. [Google Scholar]
  39. Harsch, M.A.; Bader, M.Y. Treeline Form—A Potential Key to Understanding Treeline Dynamics. Glob. Ecol. Biogeogr. 2011, 20, 582–596. [Google Scholar] [CrossRef]
  40. Bader, M.Y.; Llambí, L.D.; Case, B.S.; Buckley, H.L.; Toivonen, J.M.; Camarero, J.J.; Cairns, D.M.; Brown, C.D.; Wiegand, T.; Resler, L.M. A Global Framework for Linking Alpine-Treeline Ecotone Patterns to Underlying Processes. Ecography 2021, 44, 265–292. [Google Scholar] [CrossRef]
  41. Gao, Y.; Ghilardi, A.; Mas, J.-F.; Quevedo, A.; Paneque-Gálvez, J.; Skutsch, M. Assessing Forest Cover Change in Mexico from Annual MODIS VCF Data (2000–2010). Int. J. Remote Sens. 2018, 39, 7901–7918. [Google Scholar] [CrossRef]
  42. Timoney, K.P.; Mamet, S. No Treeline Advance over the Last 50 Years in Subarctic Western and Central Canada and the Problem of Vegetation Misclassification in Remotely Sensed Data. Écoscience 2020, 27, 93–106. [Google Scholar] [CrossRef]
  43. Montesano, P.M.; Sun, G.; Dubayah, R.O.; Ranson, K.J. Spaceborne Potential for Examining Taiga–Tundra Ecotone Form and Vulnerability. Biogeosciences 2016, 13, 3847–3861. [Google Scholar] [CrossRef]
  44. Treml, V.; Hejda, T.; Kašpar, J. Differences in Growth between Shrubs and Trees: How Does the Stature of Woody Plants Influence Their Ability to Thrive in Cold Regions? Agric. For. Meteorol. 2019, 271, 54–63. [Google Scholar] [CrossRef]
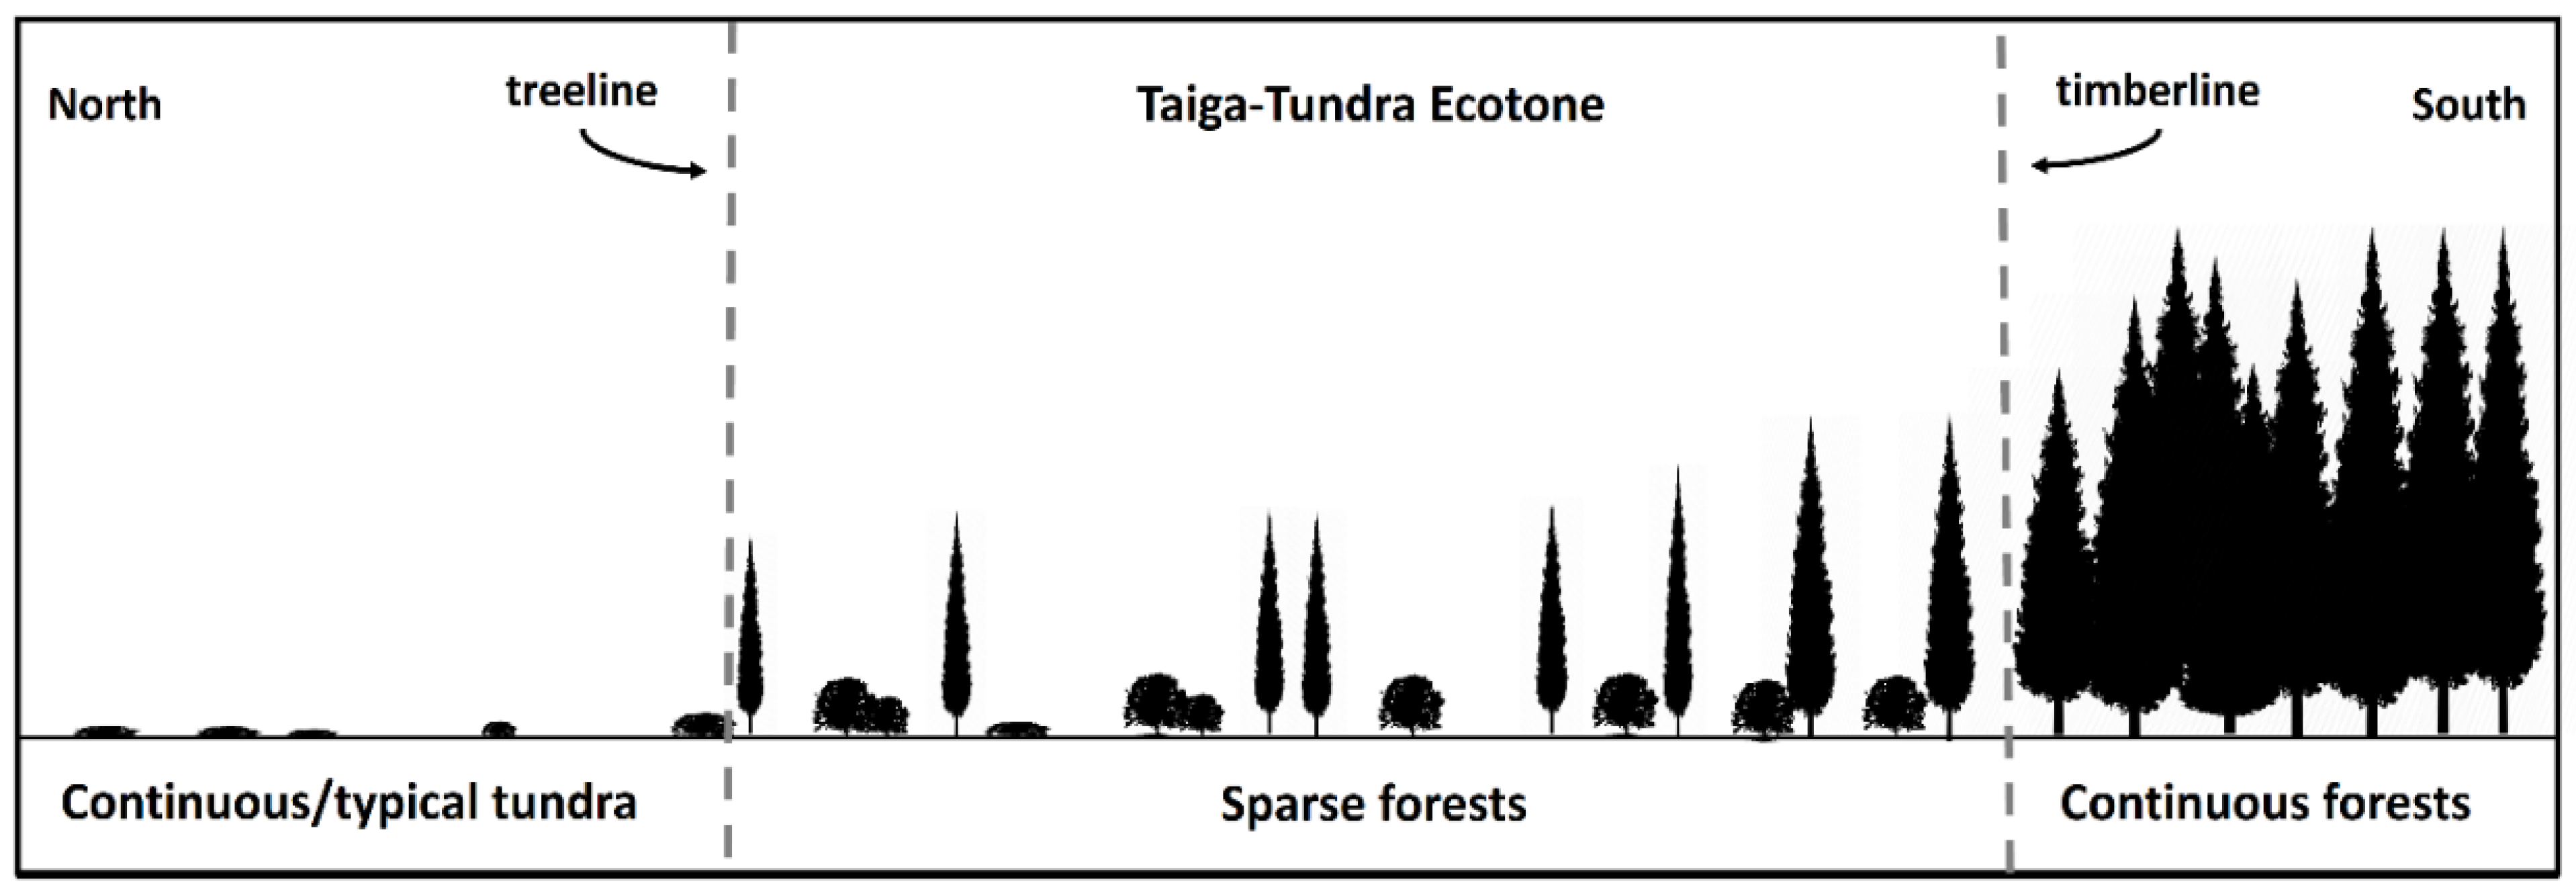
Figure 1. Illustration of treeline, timberline, and taiga–tundra ecotone in the Arctic region.
Remotesensing 17 02002 g001
Figure 2. Overview of the study sites displayed by Landsat imagery (archived in Google Satellite); the geographic locations in the West Siberian Plain (EPSG: 32242) and Alaska region (EPSG: 32606) are outlined with red and blue boxes, respectively. The colored tree fCover (fraction of tree cover per pixel) is the “tree-coverfraction” variable collected from the Copernicus Global Land Service product (spatial resolution: 100 m; year: 2019) [21]. All transparent areas with no tree fCover mean “no data” in the source CGLS product. The reference treeline (Circumpolar Arctic Vegetation Map, CAVM) [13] is marked with an orange line. Two small study sites outlined with black boxes in the West Siberian Plain and Alaska region are zoomed-in on for a close comparison between their mapped tree fCover (CGLS) and Landsat imagery. The locations of Sites A-G are indicated by magenta stars, where we evaluated the delineated timberlines at a sub-meter scale.
Remotesensing 17 02002 g002
Figure 3. Illustration of the proposed timberline delineation approach (a) and the idea of the seeded region-growing segmentation technique (b). Here, subscripts std, ts, tsmo, and rg represent standard deviation, thresholding-based, thresholding-based and morphological operation, and region-growing, respectively. The initial boundary of continuous forests and the delineated timberlines are indicated by blue and red solid lines respectively with the forest seed marked by a yellow star.
Remotesensing 17 02002 g003
Figure 4. Comparison between the timberlines delineated by the fCover-line0.3 approach (white solid lines, [15]) and by our proposed method (red dashed lines) at the zoomed-in areas (Figure 2) in the (a) West Siberian Plain and (b) Alaska sites overlaid on top of the Landsat imagery.
Remotesensing 17 02002 g004
Figure 5. Comparison between the mapped (red dotted line) and reference (blue dashed line) timberline (manual delineation) overlaid on top of sub-meter-resolution Maxar images at Sites A–H, respectively (please refer to Figure 2 for locations of Sites A–H). All paired points are linked by white solid lines.
Remotesensing 17 02002 g005
Figure 6. Regional-scale comparison among the latitudinal timberline mapped by the proposed method, the CAVM treeline by Walker et al. [13], and the TTE product by Ranson et al. [12] in the (a) West Siberian Plain and (b) Alaska region displayed by Landsat imagery. (c) compares Landsat historic images (years: 1988, 2000, 2009, 2020) with the CAVM treeline to demonstrate the forest change status at the white-outlined area in (a). Specifically, the latitudinal timberline (northern limit of continuous forests per longitude) of our proposed method and CAVM treeline are colored in red dotted and orange solid lines, respectively. Classes 1 and 2 of the TTE product are colored magenta and blue in stripe and lattice patterns, respectively.
Remotesensing 17 02002 g006
Figure 7. The delineated timberlines (red lines) displayed over Landsat imagery based on our proposed method and tree fCover data provided by CGLS (variable: “tree-coverfraction”; spatial resolution: 100 m; year: 2019), Landsat GFCC (variable: “tree_canopy_cover”; spatial resolution: 30 m; year: 2015), and MODIS VCF (variable: “Percent_Tree_Cover”; spatial resolution: 250 m; year: 2020) at the white-outlined area in Figure 6a, (a) with or (b) without tree fCover overlaid. Transparent pixels mean no tree fCover information was encoded in CGLS product or tree fCover = 0 in Landsat GFCC or MODIS VCF products.
Remotesensing 17 02002 g007
Table 1. Definitions of forests in existing studies.
TypeDefinitionsObjectiveDataSource
Taiga Tree fCover
>0.3
Local Arctic TTE mappingLandsat-7, MISR, MODIS, RADARSAT[29]
ForestsTree fCover
>0.2 (height > 5 m)
Pan-Arctic
TTE mapping
MODIS vegetation continuous fields (VCF), Quickbird[12]
Intermediate—Closed forestsTree fCover
>0.3 (height > 5 m)
Pan-Arctic
TTE mapping
Landsat global forest cover change (GFCC)[11]
Closed forestsTree fCover
>0.3 (height > 2 m)
Local Alpine treeline mapping
(timberline)
Repeat photography, dendrochronological analysis, field observations[15]
ForestsTree fCover
>0.1 (height > 5 m)
--FAO
Table 2. Distance statistics calculated between the mapped timberline and the reference counterparts, reported in meters.
Test AreasMinimumMaximumMedianStandard Deviation
Site A4.9396.0246.5823.17
Site B25.95189.93103.8846.39
Site C2.70172.4954.7338.85
Site D0.32341.4968.0053.32
Site E0.31144.5638.1530.35
Site F1.27216.4851.4145.29
Site G0.71115.3532.2229.32
Site H0.35175.2237.0148.37
Disclaimer/Publisher’s Note: The statements, opinions and data contained in all publications are solely those of the individual author(s) and contributor(s) and not of MDPI and/or the editor(s). MDPI and/or the editor(s) disclaim responsibility for any injury to people or property resulting from any ideas, methods, instructions or products referred to in the content.