Article

Remote-Sensed Evidence of Fire Alleviating Forest Canopy Water Stress Under a Drying Climate

1
Agriculture and Forest Sciences, Murdoch University, Murdoch, WA 6150, Australia
2
Department of Environmental Management, Vietnam National University of Forestry, Hanoi 13417, Vietnam
3
Forest Protection Research Centre, Vietnamese Academy of Forest Sciences, Hanoi 11910, Vietnam
*
Author to whom correspondence should be addressed.
Remote Sens. 2025, 17(12), 1979; https://doi.org/10.3390/rs17121979
Submission received: 23 April 2025 / Revised: 24 May 2025 / Accepted: 4 June 2025 / Published: 6 June 2025

Abstract

Fire is a distinctive factor in forest ecosystems. While uncontrolled wildfires can cause significant damage, prescribed burning is widely used as a management tool. However, despite the growing threat of forest water stress under climate change, there is a lack of concrete evidence on the impact of fire on water stress in forest ecosystems. This study utilized Landsat time-series remote sensing data combined with the Infrared Canopy Dryness Index (ICDI) to monitor changes in canopy dryness patterns across the eucalyptus-dominated Northern Jarrah Forest of southwestern Australia. The forest was chosen due to its exposure to a changing climate characterized by decreasing rainfall and more frequent droughts, signs of water stress in otherwise drought-resilient trees, and its well-documented fire management history. Analysis of ICDI patterns over the period from 1988 to 2024 revealed a clear overall trend of increasing water stress, coinciding with a small overall decline in annual rainfall in the 10,000 km2 study area. Furthermore, by examining five prescribed burns and five wildfires, we found that NDVI-assessed canopy cover recovered rapidly in fire-affected areas, typically within one to three years, depending on fire severity. However, ICDI water stress levels were reduced for approximately 7–8 years following low-severity prescribed burns and more than 20 years after high-severity wildfires. These findings suggest the potential of prescribed burning as a tool to mitigate water stress in vulnerable forest landscapes, particularly in regions prone to drought and climate change. Additionally, the study underscores the effectiveness of the ICDI in monitoring forest water stress and its potential for broader applications in forest management and climate adaptation strategies.

1. Introduction

Fire is a periodic factor in forest ecosystems but can have profound impacts on other components, such as water resources [1,2,3]. Rising global temperatures, prolonged droughts, and shifting weather patterns create drier conditions, making forests more susceptible to wildfires (WF) [4]. Warmer temperatures dry out vegetation, while reduced rainfall and prolonged droughts increase the flammability of forests and thus the extent and severity of fire following ignition [5]. Stronger winds also further accelerate fire spread [6]. Although natural causes, like lightning, and human activities, such as deforestation, contribute to WF, climate change acts as a multiplier, making fires more severe and harder to extinguish [4,7]. On the other hand, prescribed burning (PB) has been widely implemented in many countries to mitigate the risk of WF and minimize the damage they can cause [8,9,10].
Wildfires are unmanaged fires that spread rapidly across forests and grasslands, often causing significant environmental and economic damage. In contrast, PB is a fire management technique where forest managers deliberately set small, low-intensity fires under safe conditions to reduce fuel loads to prevent larger, more destructive wildfires. This method reduces the build-up of dry fuel that could otherwise lead to damaging wildfires [10,11].
The widespread use of PB also has a noticeable impact on forest-watershed hydrology [2,12,13,14]. The reduction in natural forest cover directly affects the water balance and water movement within the ecosystem [15]. Key effects include increased runoff and peak water flows, decreased soil permeability, and reduced interception and evapotranspiration [2,13,15,16,17,18]. In addition to its immediate and direct impacts, the effects of fire on hydrological processes become particularly evident within one to two years after the event [18,19]. However, research suggests that these effects can remain significant for up to seven years [18,19,20], depending on the severity of the fire. The recovery of hydrological processes to pre-fire conditions is closely tied to the restoration of vegetation cover to its undisturbed state [3,21,22]. Other critical factors influencing recovery include soil properties, erosion characteristics, and topographical features, particularly slope [20,23].
In southwestern Australia, fire has played a crucial role in shaping species composition. Indeed, species such as jarrah (Eucalyptus marginata), which is fire-resistant or capable of recovering well after fire, have a competitive advantage in dominating the forest ecosystem [1,24,25]. The Northern Jarrah Forest (NJF), which is mainly covered by E. marginata, experiences a Mediterranean climate, characterized by a stark contrast between warm dry and cool wet seasons. Prolonged dry spells, coupled with low rainfall and a hot, dry season lasting up to six months, create highly favourable conditions for forest fires [26,27,28].
In the context of climate change, there is growing evidence in this region of reduced rainfall and stream flow [29], more frequent and intense droughts, and severe heatwaves [30,31,32,33,34]. Prescribed burning has been widely practiced in jarrah forests since the early 1960s with one of the world’s most extensive and systematic prescribed burning programmes, aiming to reduce fuel loads and prevent catastrophic wildfires [11]. This approach was influenced by both indigenous fire management practices and more recent scientific research, demonstrating the benefits of PBs in maintaining forest health and biodiversity [35,36]. Despite its success in reducing WF severity, the use of PBs remains a topic of debate due to concerns about smoke pollution, carbon emissions, and impacts on wildlife [11]. Nevertheless, the effectiveness of targeted burning is undeniable, and it has become a widely used, multi-purpose management tool in other regions of the world, including Europe and North America [37,38].
Jarrah has an extensive root system, which enables it to access deep soil water reserves in the regolithic soils throughout the summer months [39,40,41]. Although jarrah trees are known for their resilience to drought and fire, natural jarrah forests are increasingly experiencing water stress, which can result in canopy damage and tree mortality [27,34,42,43,44]. Jarrah is well-equipped to withstand and recover from forest fires, which are a natural feature of its habitat. Its thick, fibrous bark acts as a protective barrier, shielding internal tissues from heat damage, while its underground lignotubers store energy and nutrients, enabling regeneration even if the tree’s above-ground structure is destroyed [24]. Jarrah also relies on epicormic buds hidden beneath its bark, which can rapidly sprout new leaves and branches following a fire. Fire also plays a crucial role in stimulating seed germination by breaking seed dormancy and providing nutrient-rich ash beds for young seedlings to establish. These traits enable jarrah not only to survive but to flourish in fire-regulated ecosystems, securing its dominance in the Northern Jarrah Forest (NJF) [24]. However, its resilience may be threatened by the increasing frequency and intensity of drought events driven by climate change due to weak physiological drought avoidance mechanisms and increasingly limited access to decreasing deep soil water reserves.
Numerous studies have highlighted the strong connection between water stress and forest canopy cover [45,46,47], especially leaf area index (LAI) as it directly reflects tree transpiration [48,49] and interception of rainfall [50]. Additionally, we previously observed that fire events leading to a decrease in canopy cover may have a positive impact on canopy dryness [51]. Obviously, to mitigate the adverse impacts of water stress on forest ecosystems, management interventions are essential. Among these, ecological thinning is considered a priority for jarrah forests [52,53]. However, this approach faces significant challenges due to its high demands for financial and time resources. In contrast, PB is a long-established and scalable practice with sustainable impacts on forest canopy health and understory vegetation [28,53]. The 70-year history of PB in jarrah forests thus offers a deeper and more nuanced understanding of the complex interactions between fire and forest hydrology, particularly in relation to canopy water stress under a drying climate.
Remote sensing has been used to monitor post-fire forest recovery since the 1990s [54,55,56], primarily by assessing changes in canopy cover through popular vegetation indices such as Normalized Difference Vegetation Index (NDVI), Enhanced Vegetation Index (EVI), and Normalized Burn Ratio (NBR), which rely on visible and infrared wavelength bands [56,57]. Radar and LiDAR (Light Detection and Ranging) data have also been used to assess the recovery of vertical forest structure [58,59,60]. However, there have been limited applications of remote sensing to monitor the recovery of forest ecological functions, particularly in terms of water balance. This aspect is especially crucial for regions frequently threatened by drought and heatwaves, such as jarrah forests.
In our previous study, we observed that prescribed burnt forest appeared to be less stressed than unburnt forest, based on a single temporal snapshot. This observation is important because the forest is under increasing water stress and damage from wildfire under climate change. However, we did not investigate this in any detail. Therefore, this study, utilized remote sensing indices [51] derived from multi-spectral and multi-temporal satellite imagery, to examine effects of PB and WF on canopy water stress. The findings in this study will provide insights for the conservation of natural forest ecosystems in southwestern Australia and other similar regions, especially in the face of changes in climate conditions.

2. Materials and Methods
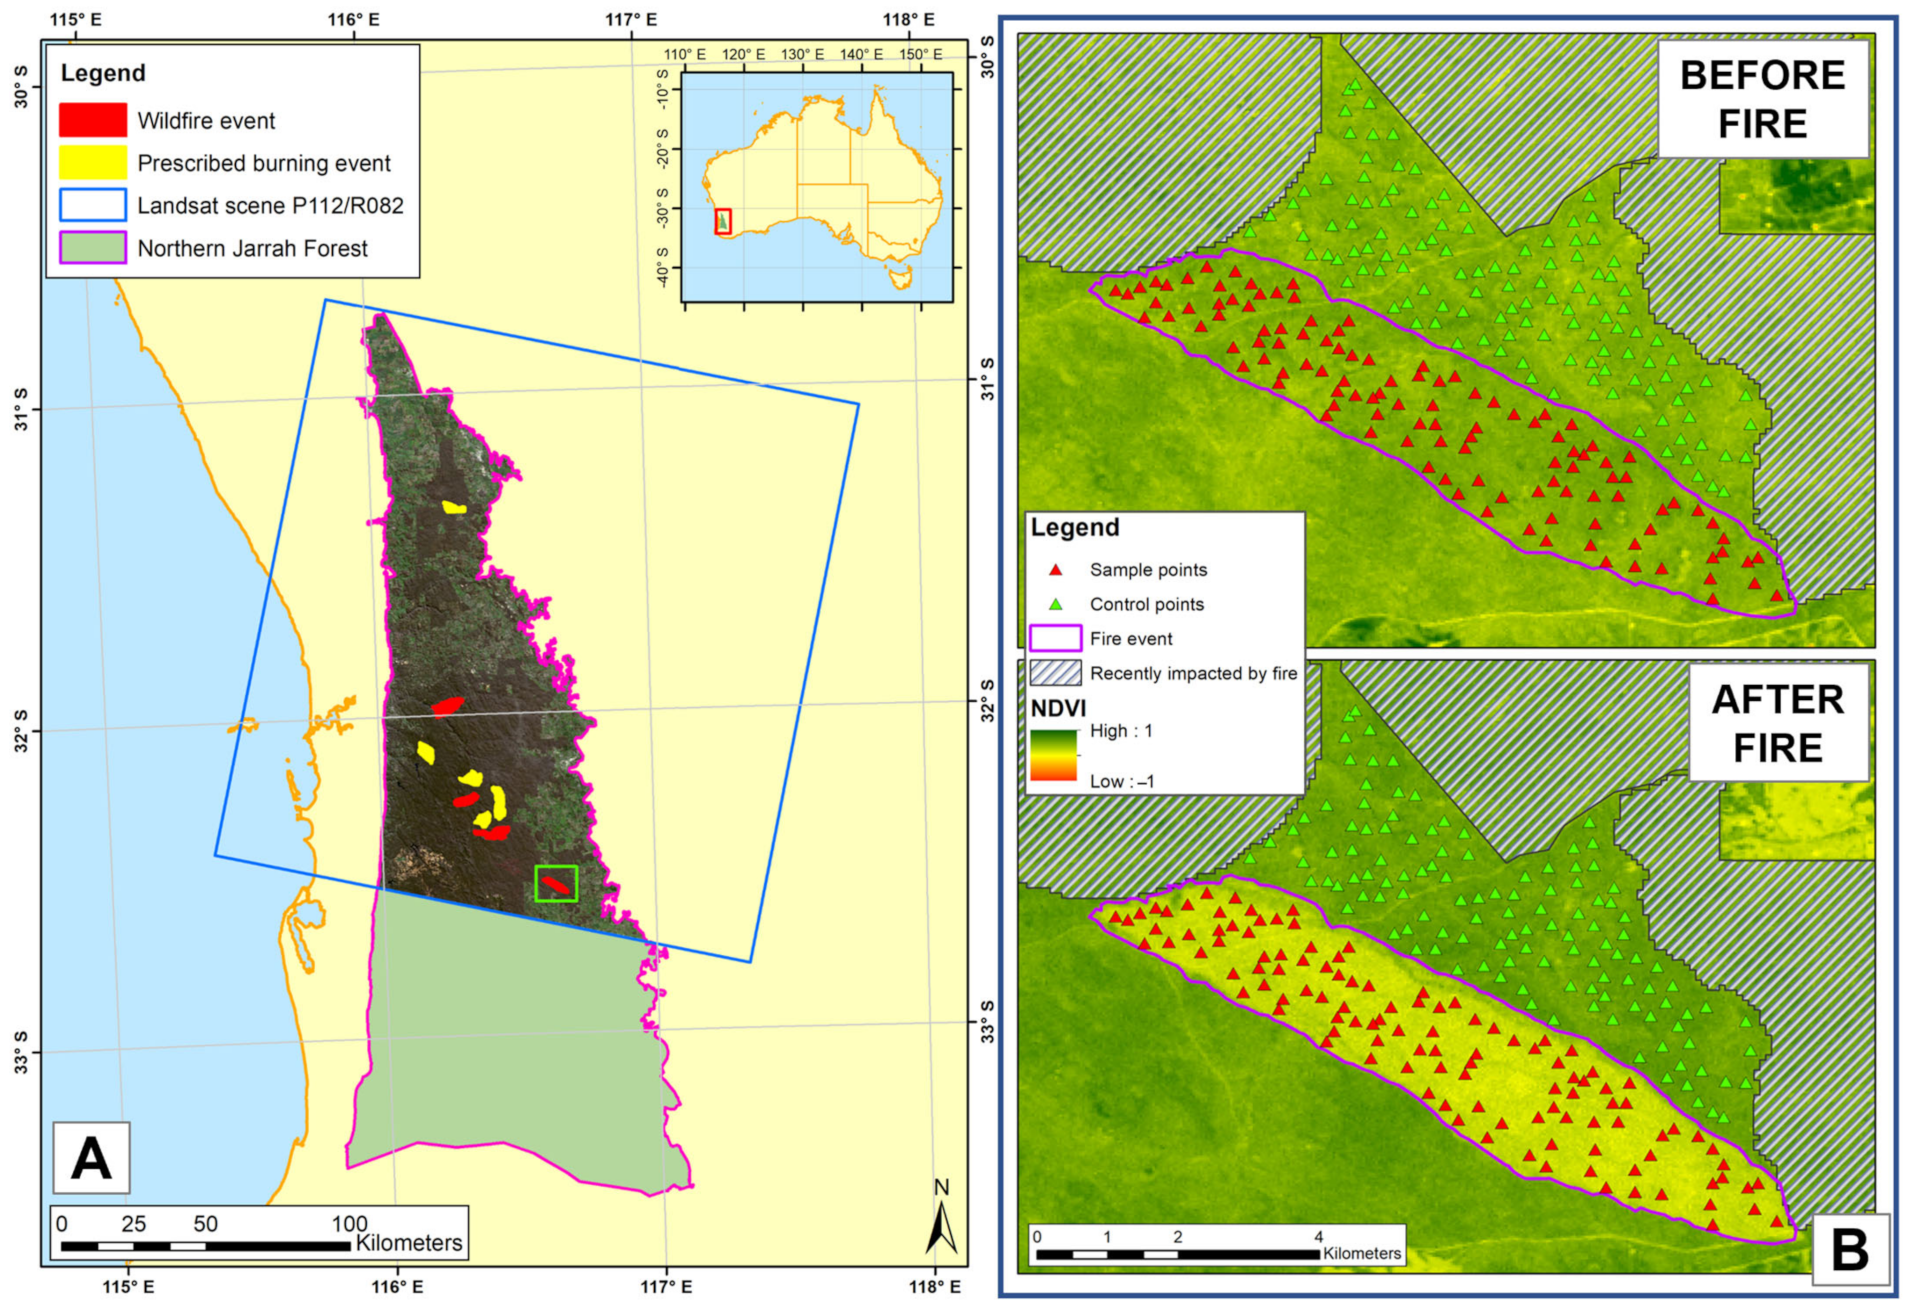
2.1. Study Location

The Northern Jarrah Forest, an expansive broad-leaved evergreen eucalypt forest covering 11,276 km2 and situated at an average elevation of 300 m above sea level [61], is a key ecological system in southwestern Australia (Figure 1A). Much of the forest has developed over deep and strongly weathered profiles which have poor fertility but provide significant soil water storage that allows the forest to survive during the annual summer drought [62]. For over five decades, the forest has been managed to support various activities, such as timber production, bauxite mining, biodiversity preservation, water catchment protection, WF prevention through PB activities, and recreational use.
The NJF experiences a typical Mediterranean climate characterized by two distinct seasons: a cool, wet season and a long, hot, dry season lasting from 4 to 7 months. The forest exhibits a pronounced west-to-east rainfall gradient, with annual precipitation exceeding 1100 mm along its western edge and decreasing to around 700 mm in the eastern and northern areas [41].

2.2. Data Sources

2.2.1. Remotely Sensed Data

This study utilized satellite imagery from Landsat Collection 2 Level-2 Science Products, which includes scene-based global surface reflectance and surface temperature data [63,64,65], spanning from 1987 to the present. A total of 70 Landsat scenes from path/row 112/082 were collected, covering approximately 63% of the northern portion of the Northern Jarrah Forest (Figure 1A). These scenes were selected due to the high frequency of both WF and PB in the area, as well as the increased likelihood of obtaining cloud-free images compared to those covering the southern part of the forest.
Based on data availability, Landsat images from three sensor types, namely Landsat 4-5 TM, Landsat 7 ETM+, and Landsat 8-9 OLI/TIRS, were selected, capturing the beginning and end of each dry season from 1987/1988 to 2023/2024. Exceptions were the end of the 1988/1989 season, the entire 2011/2012 season, and the beginning of the 2012/2013 season due to the absence of data. Three spectral bands, namely Red (RED), Near Infrared (NIR), and Short-Wave Infrared (SWIR), were used for remote sensing index calculations.

2.2.2. Fire History and Control Unburnt Data

The study used the fire history dataset (DBCA-060) provided by the Department of Biodiversity, Conservation, and Attractions, Western Australia [66]. This dataset contains records of fire events, including PB, WF, and other fire events, on government-managed lands, dating back to 1937. For this study, 3761 fire occurrences of the two main types (PB and WF) from 1987 onward within the study area were extracted for further analysis (Table 1). Each record is represented as a single polygon delineating the fire-affected area and includes various attributes such as the calendar year of the fire, fire season, affected area, fire type, and other relevant details.
Random points were generated using ESRI ArcGIS 10.8.2 at a density of one point per 10 ha within the fire-affected area (sample points) and the adjacent unburnt area (control points) (see example in Figure 1B). The control area was selected to have similar forest cover to the burnt area prior to the fire, as represented by NDVI feature values. Where possible, high-quality time-series images from Google Earth, utilizing a time-lapse tool, were used to verify the similarity of forest cover between the sample and control areas. Additionally, the locations of both sample and control points were required to have NDVI values above the first quartile (Q1) of all pixel data within the area (see Figure 2 for an example of NDVI Q1 determination). This condition helps minimize the influence of non-forested areas and fragmented shrublands, ensuring greater consistency for further analyses.

2.3. Analysis

The overall methodology, where Landsat imagery time series was used in association with actual fire history records to compare remote sensing indices of burnt and unburnt forest canopies is illustrated in Figure 3.

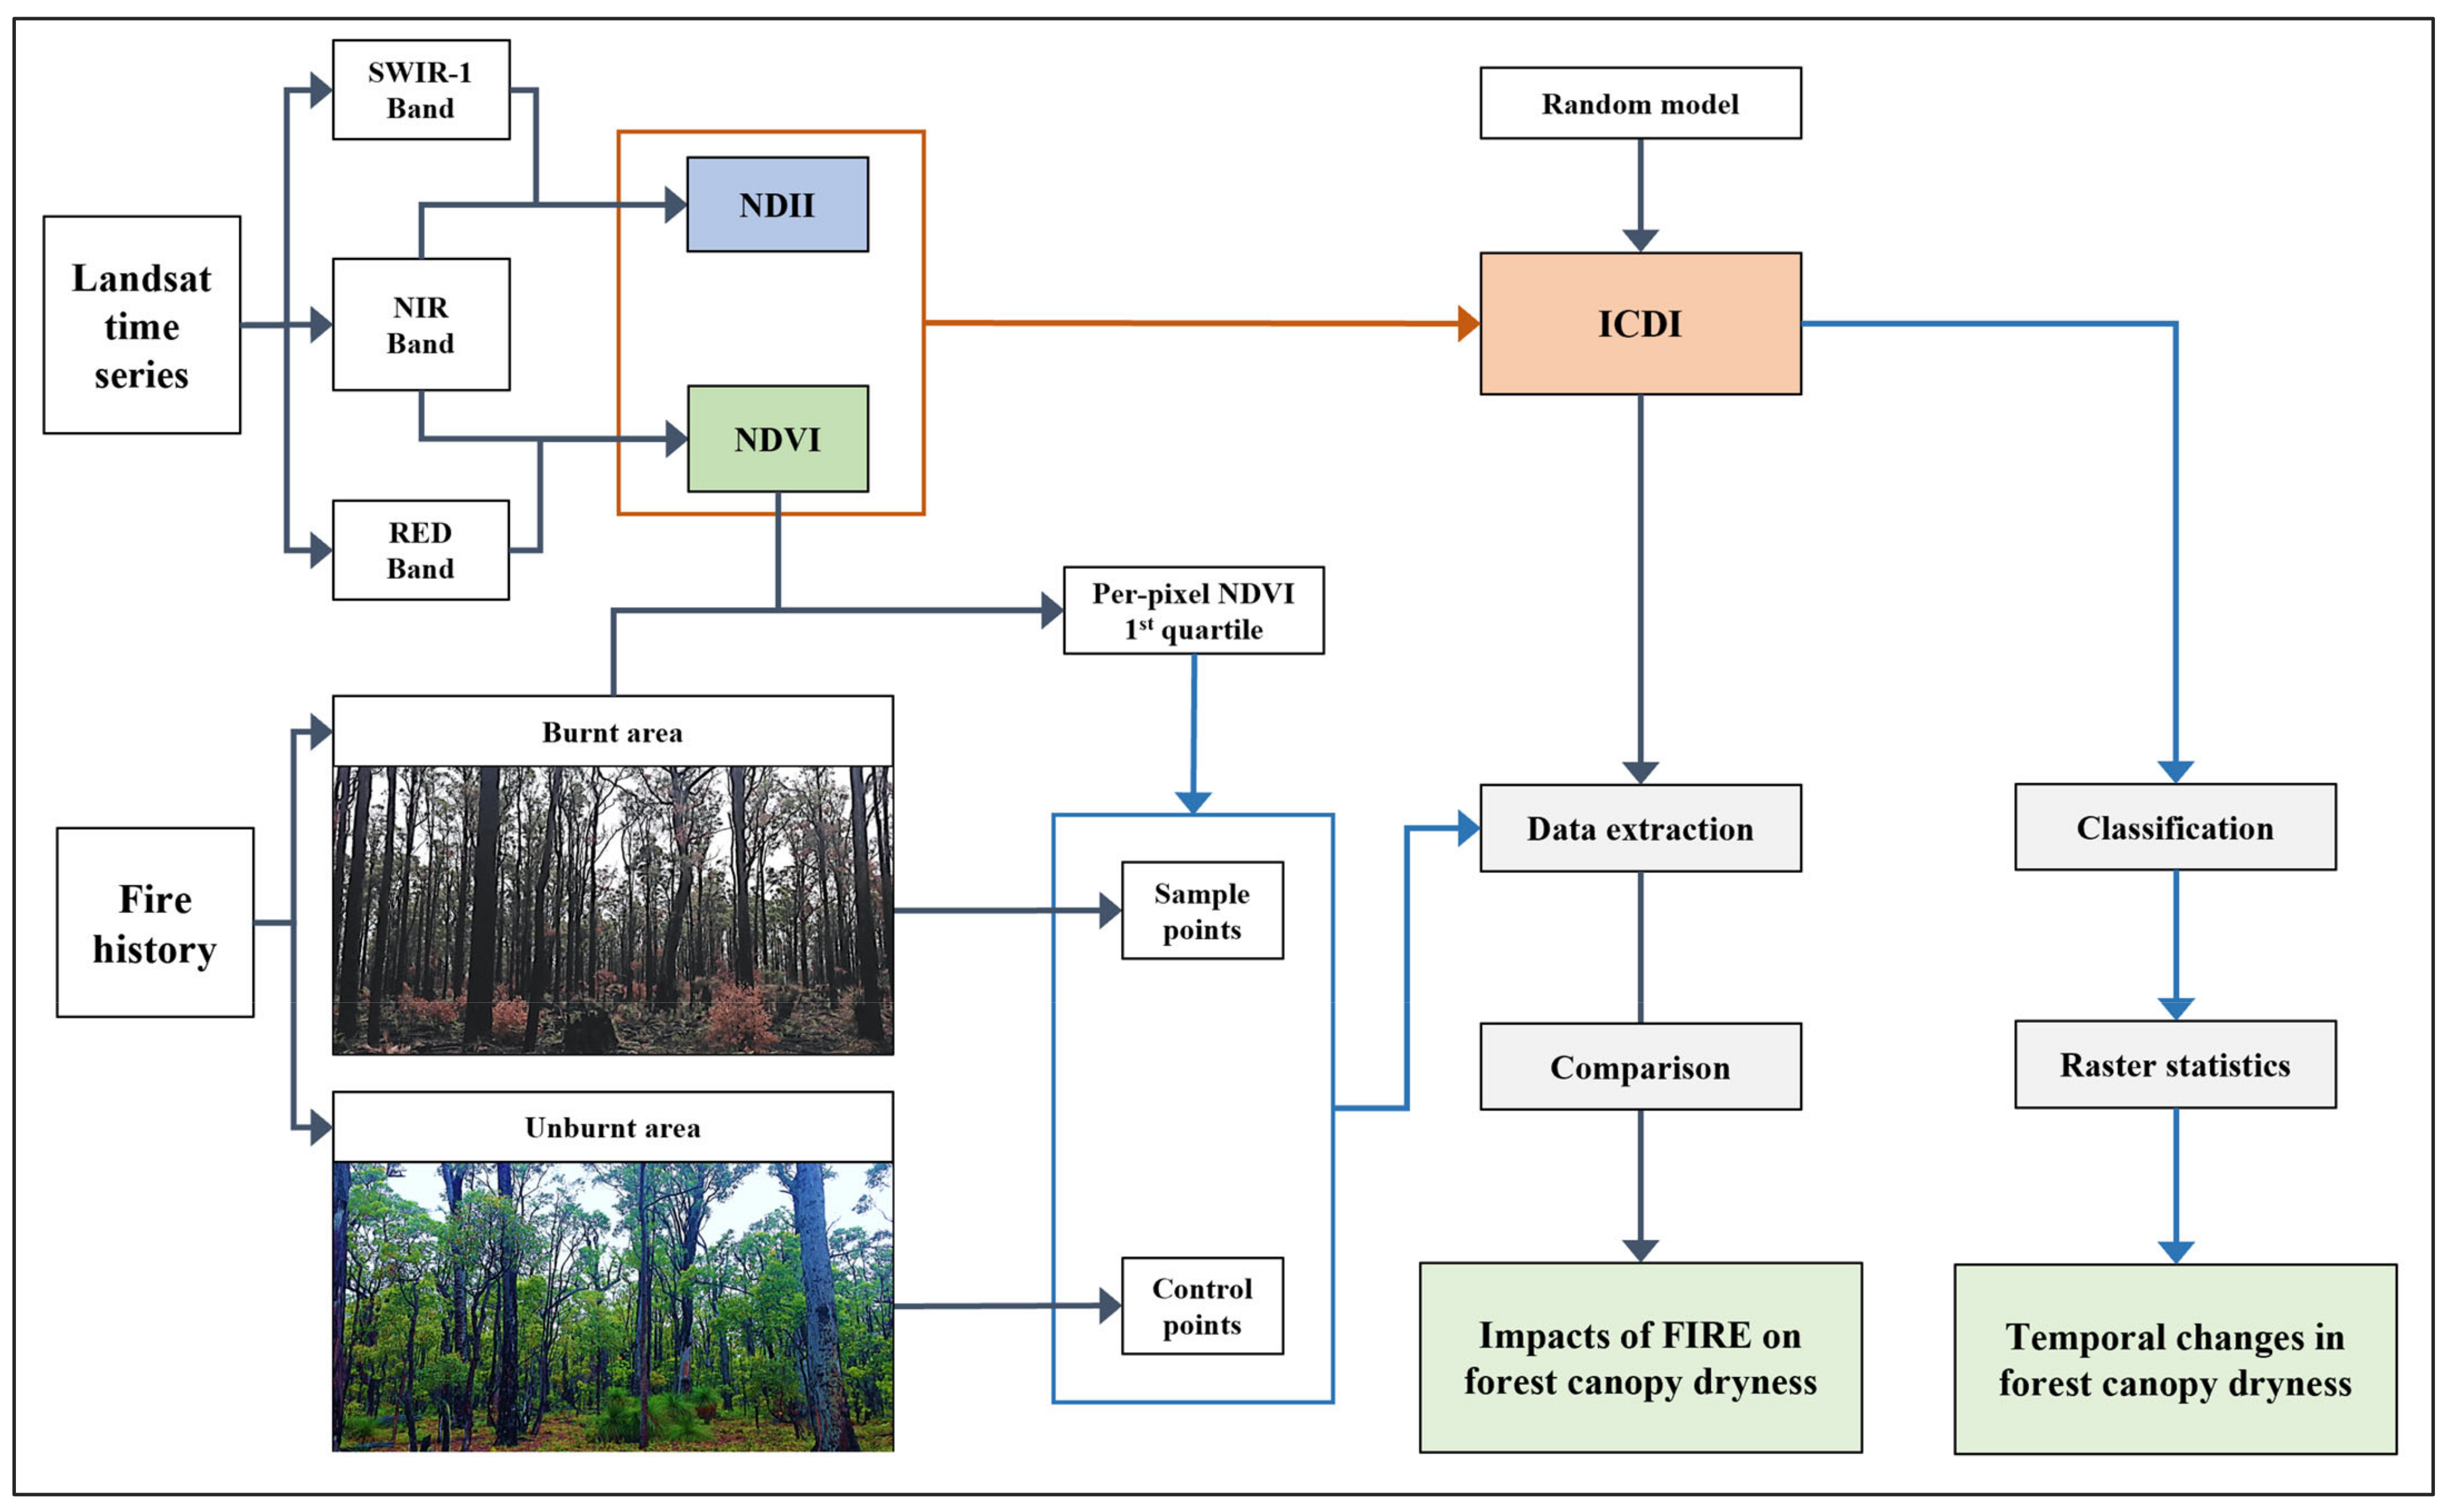
2.3.1. Data Pre-Processing

The fire records, along with the Landsat data, were projected to a common coordinate system, the World Geodetic System 84 (WGS 84), Zone 50 South. All satellite images were clipped to the boundary of the NJF to optimize memory usage and reduce processing time. Additionally, the digital number values from the satellite images were converted to surface reflectance values for each band using the scaling factor of 0.0000275 + (–0.2) [63,64,65].

2.3.2. Data Processing

Normalized Difference Vegetation Index (NDVI), Normalized Difference Infrared Index (NDII), and then Infrared Canopy Dryness Index (ICDI) [51] were calculated for each Landsat image. The ICDI is an index based on the relationship between NDVI and NDII, designed to express differences in canopy water content relative to the water content observed under the maximum water stress condition, while controlling for similar levels of canopy greenness.
The NDVI utilizes NIR and RED wavelengths to estimate fractional vegetation cover, which is determined as follows:
N D V I = N I R R E D N I R + R E D
The NDII [67], which employs NIR and SWIR1 bands to estimate the dynamics of water content in the vegetation canopy, is calculated as:
N D I I = N I R S W I R 1 N I R + S W I R 1
Meanwhile, ICDI [51] which effectively depicts forest dryness utilizing the differences in NDII/NDVI relationship, is determined as below:
I C D I = a N D V I i 2 + b N D V I i + c N D I I i
where a, b and c are the parameters from the identified dry edge function, which is the region indicative of significantly low water content in the NDII/NDVI feature space (see Le et al. [51] for more details). NDIIi and NDVIi are the values at the pixel i.

2.3.3. Changes in Forest Canopy Dryness over Time

To analyze temporal changes in overall forest water stress across the NJF, ICDI maps were generated at the beginning and end of each dry season (subject to cloud-free imagery availability) for the period 1987–2024. A visual comparison was conducted by overlaying these maps to observe changes over time.
We assessed whether water stress had increased over time, particularly in the context of climate change, by classifying ICDI values into three categories representing increasing canopy dryness (low, medium, and high) using an equal interval classification. The proportion of the NJF area falling within the high dryness class was calculated annually at the end of each dry season when water stress is expected to peak. These data were graphed alongside annual rainfall records, with trendlines derived from linear regression, to observe any long-term trend. Rainfall data were from Mundaring (Station No. 9030) (31.898°S;16.158°E) at the centre of the study area, provided by Australia Bureau of Meteorology (http://www.bom.gov.au/ (accessed on 15 November 2024)).

2.3.4. Exploring Prolonged Effects of Fire on Canopy Water Stress
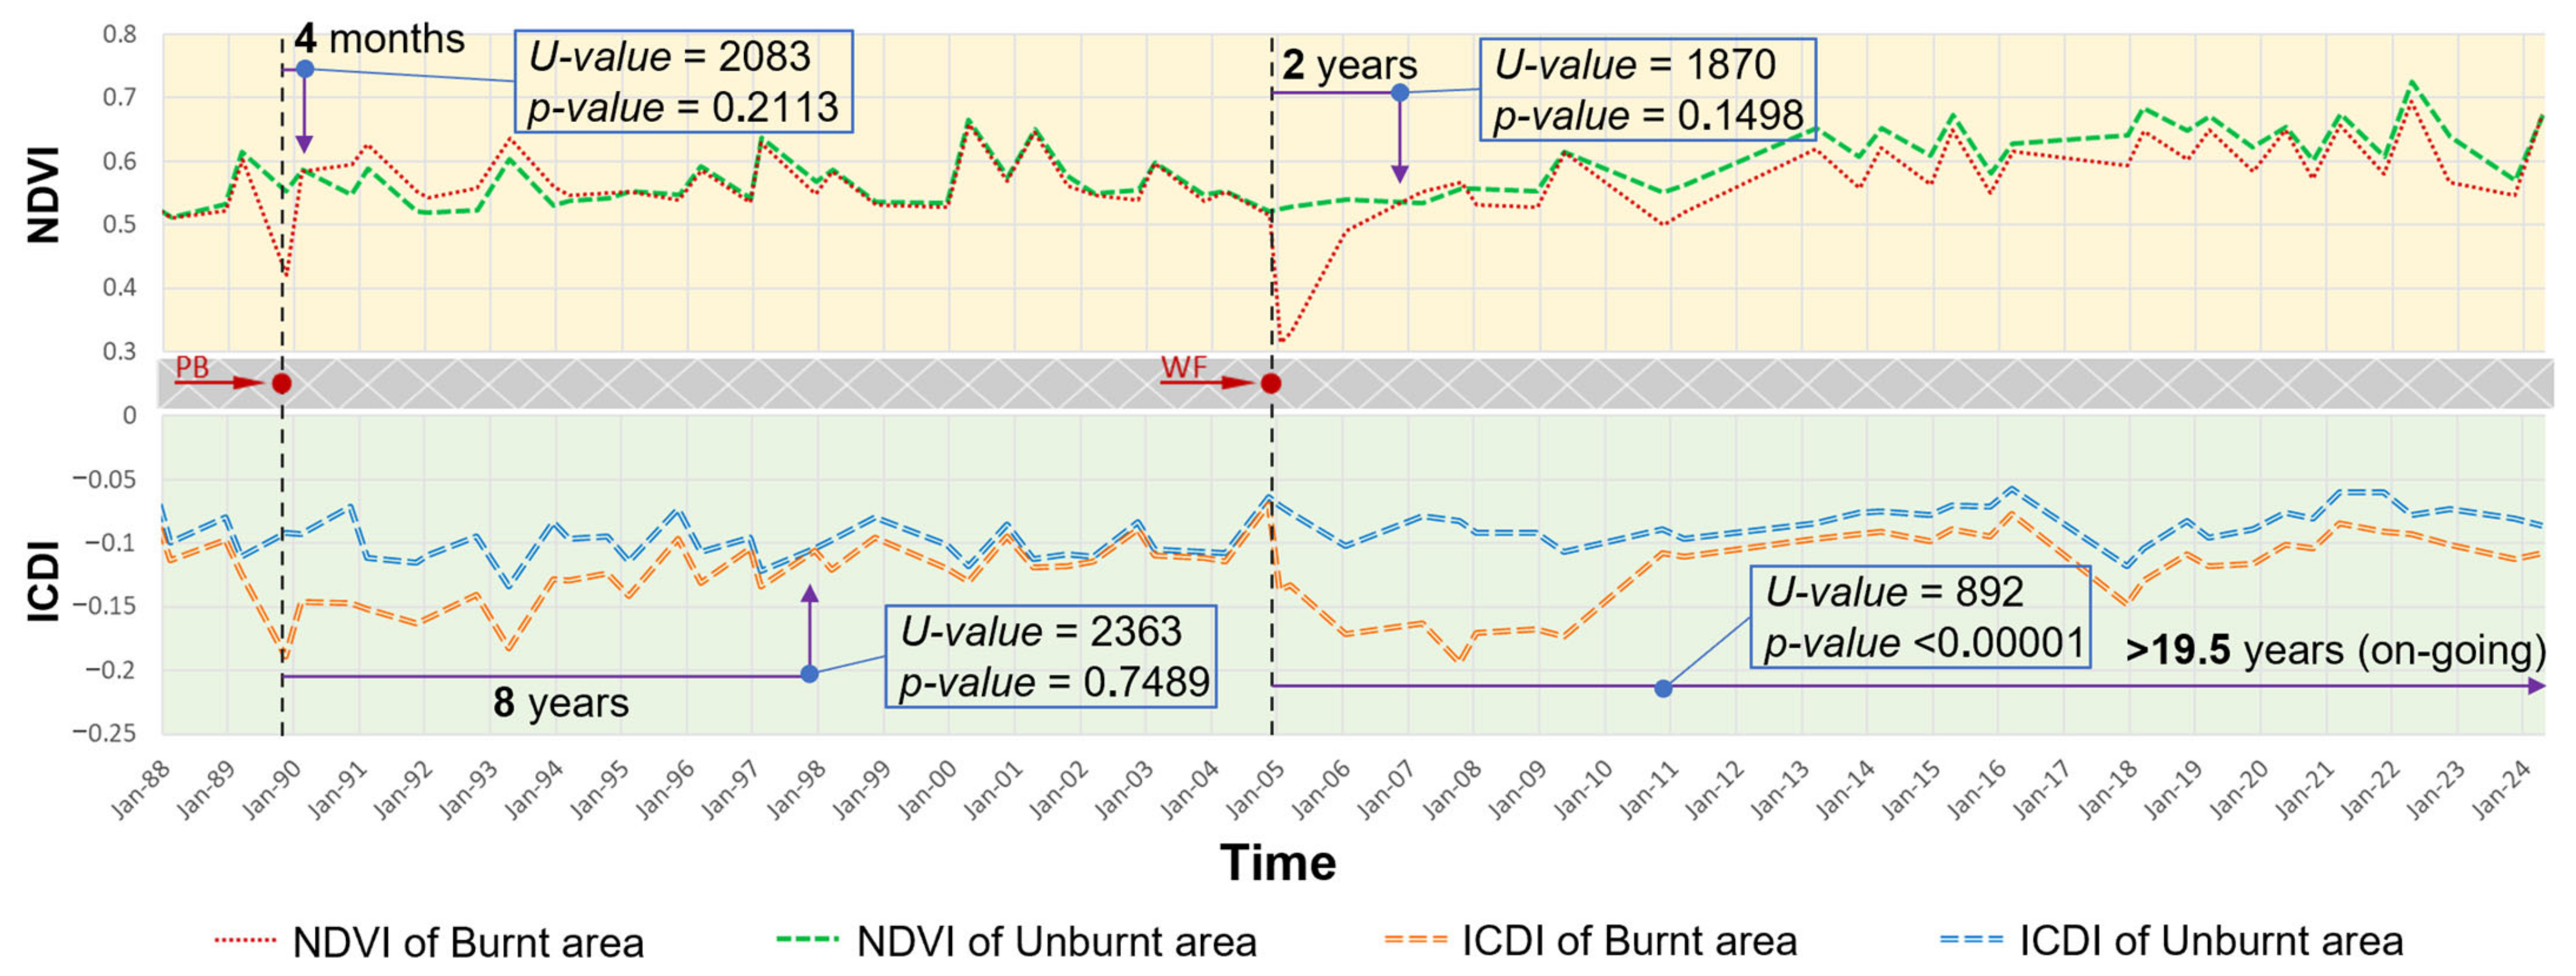
We randomly selected 10 fire events (5 WF and 5 PB), to examine how the dryness of the forest canopy responded to fire by analyzing changes in the ICDI (Table 2). To ensure enough sample points, the events were chosen from those with a burned area > 300 ha, which included 404 PB and 69 WF events. Additionally, all selected areas were required to have been fire-free for at least 10 years prior to the event to minimize the impact of previous fires on the analysis. Each sample was checked against the Landsat image database to confirm that the fire date recorded on DBCA-060 matched the actual date.
After generating the sample and control points, NDVI and ICDI values from 1987 to 2024 were calculated. These values were then plotted over the 37-year period. Additionally, the data were analyzed using the Mann–Whitney U Test built in Microsoft Excel software to determine if there were significant differences between the two datasets after fire events and to assess how long it took for the burnt forest to recover, in terms of both canopy cover and dryness, compared with the unburnt forest.
To further highlight the impact of fire, the study conducted a fire severity classification for each selected event using the dNBR (Differenced Normalized Burn Ratio) index following the method proposed by USGS [68]. The indices were calculated as below:
N B R = N I R S W I R 2 N I R + S W I R 2
d N B R = p r e N B R p o s t N B R
Fire severity was classified into five levels as in Table 3.

3. Results

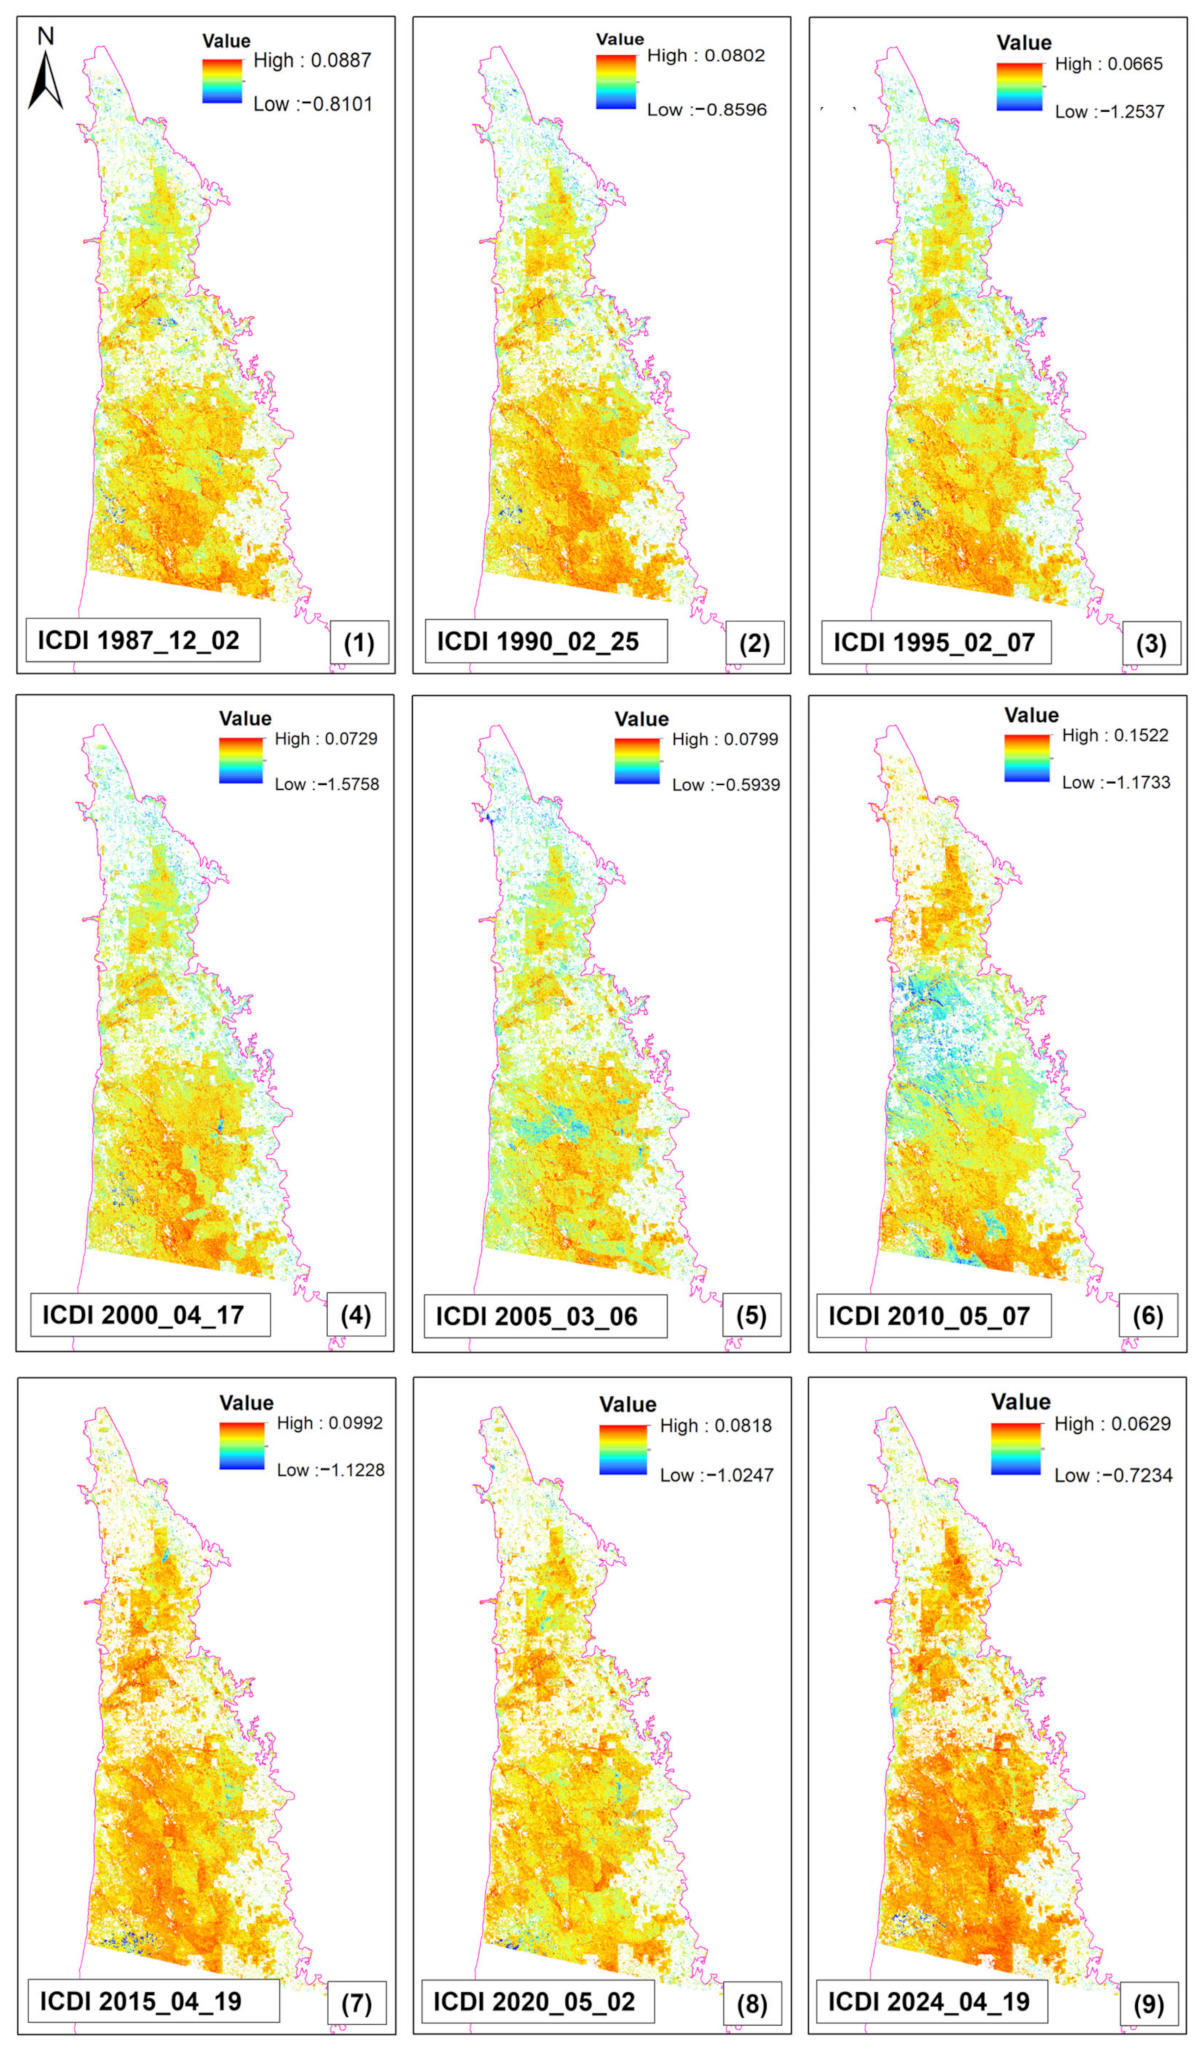
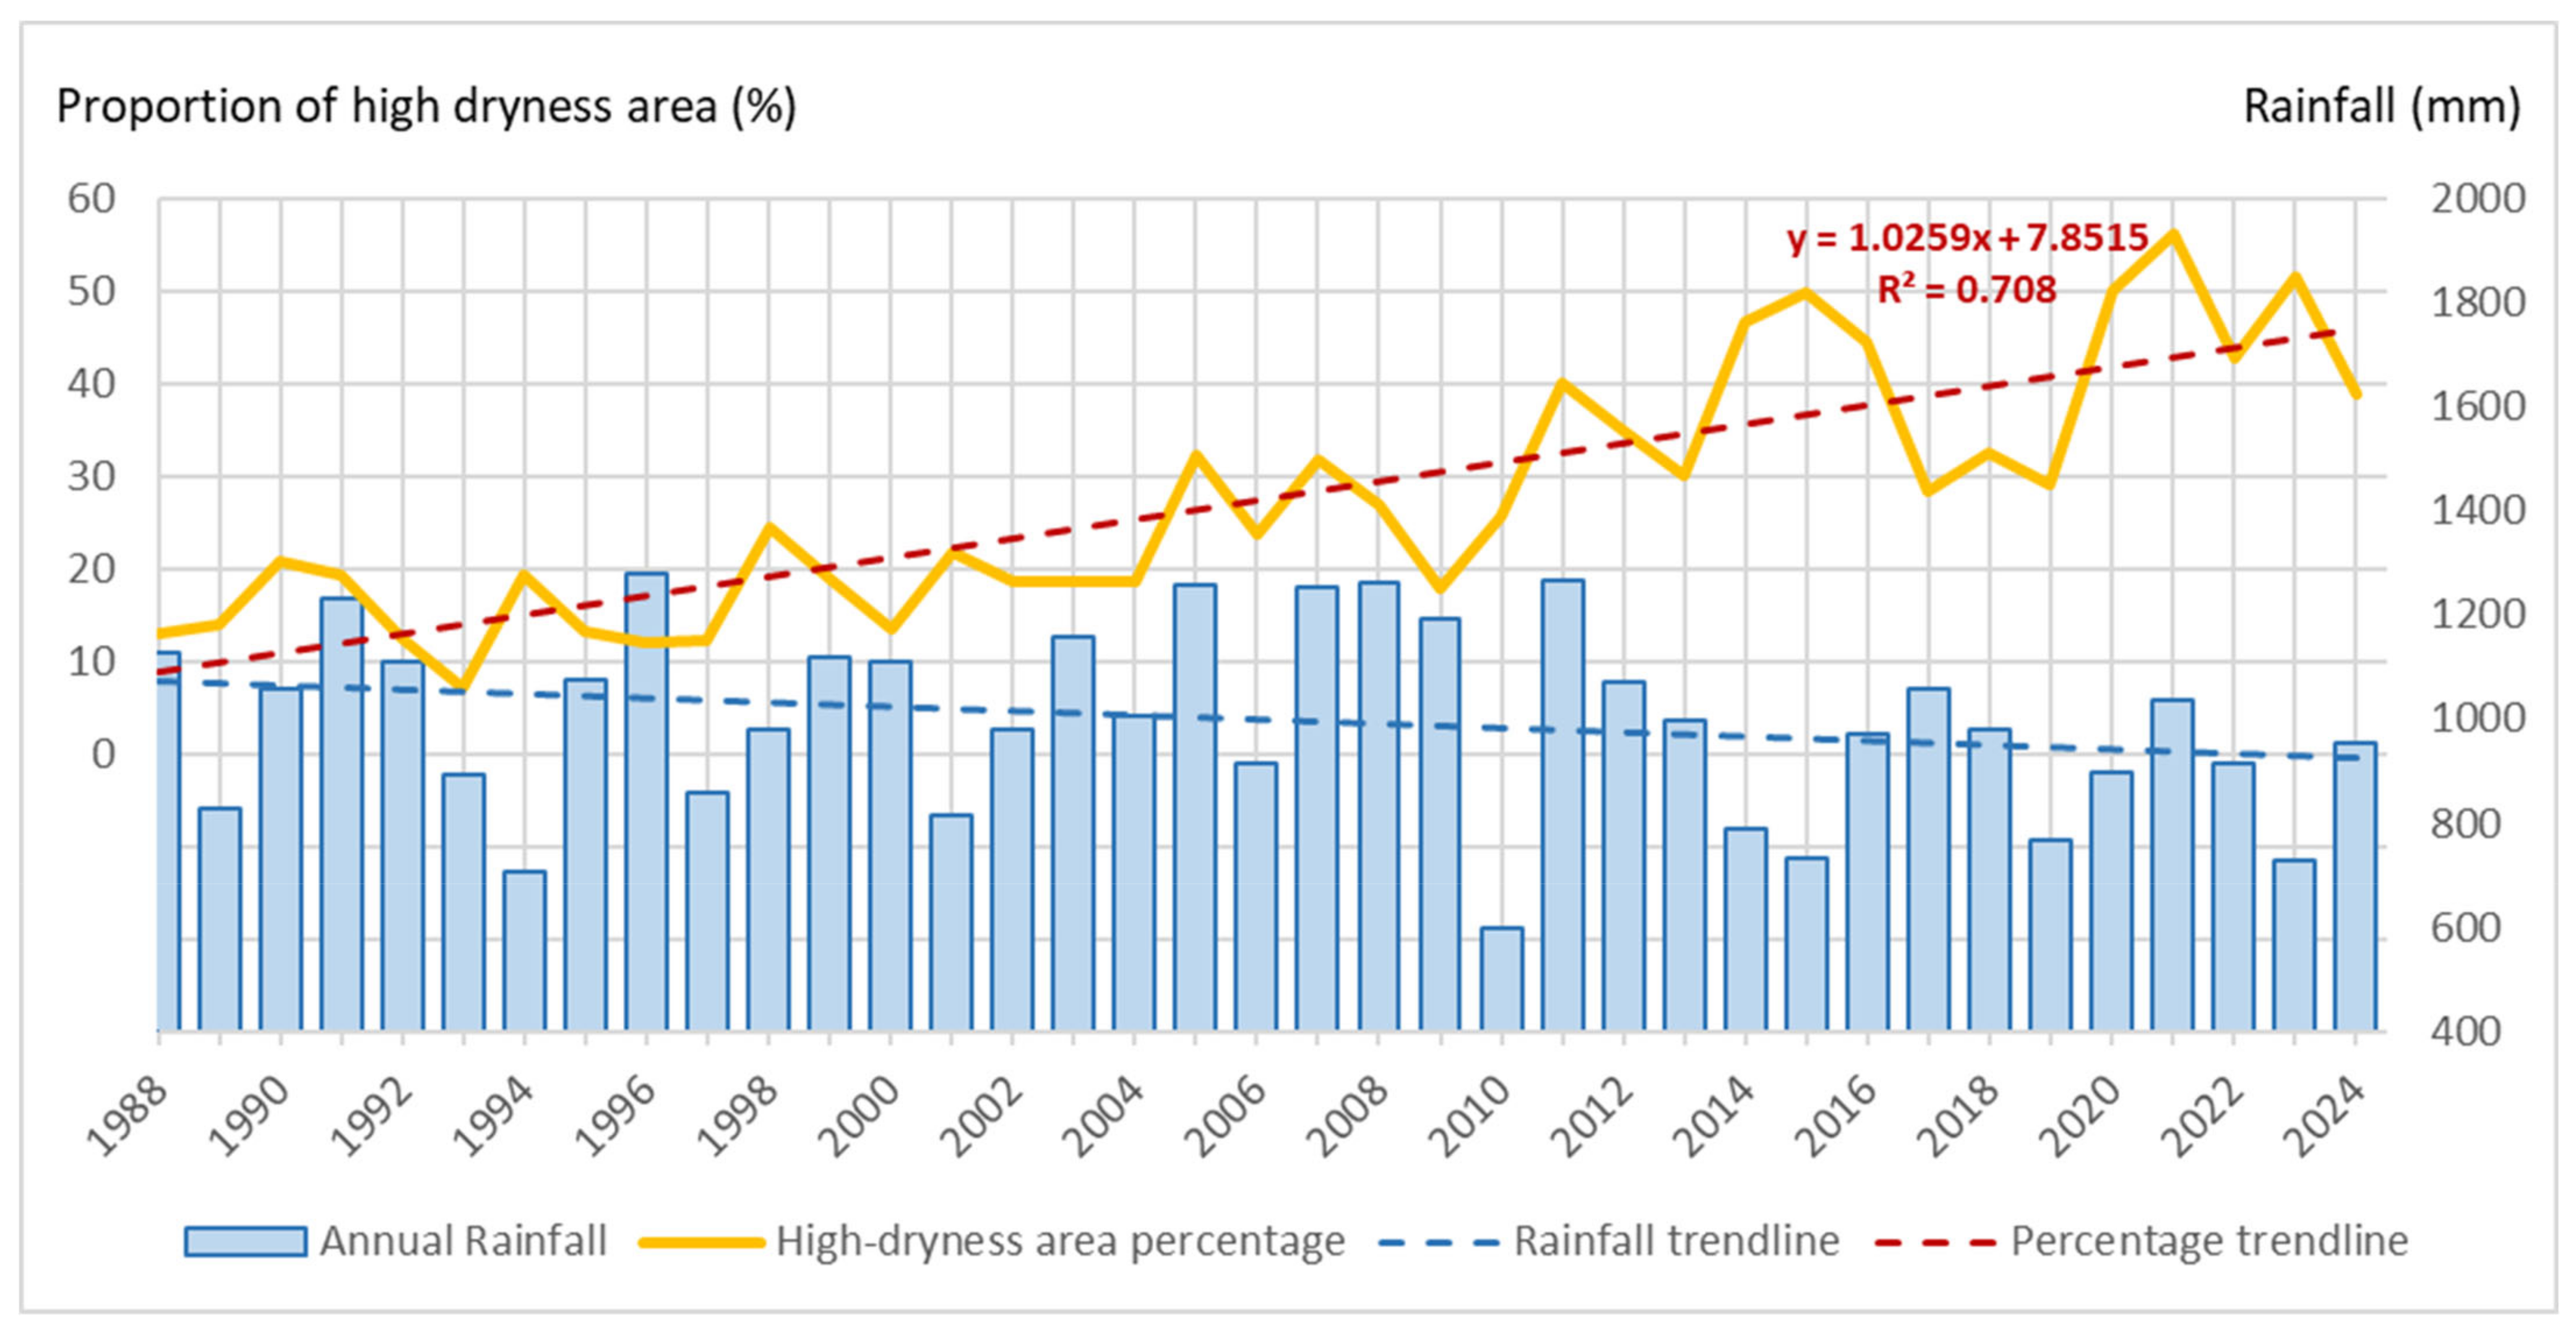
3.1. Canopy Dryness in the Northern NJF from 1987 to 2024

The study produced ICDI maps for each processed image, showcasing the patterns of canopy dryness in the target area over time. Figure 4 presents ICDI maps from late in the dry season at regular intervals over the period 1987 to 2024. Overall, dryness appears to increase gradually, as evidenced by the visible expansion of orange and red areas on the maps, indicating higher dryness levels. In certain periods, some areas exhibit unusual changes in dryness levels, clearly visible as patches (usually in light blue) on the maps. These fluctuations are likely driven by environmental factors, particularly pests, forest fires, forest harvesting and mining rehabilitation, which can alter the structure and function of the forest canopy.
The marked increase in water stress over time in the study area is evident in the increasing proportion of high dryness areas (Figure 5) which rose from 20% in the late 1990s to approximately 48% in the early 2020s (r2 = 0.708). An overall decline in annual rainfall is associated with the increasing trend in the proportion of high dryness areas over time, especially in the period from 2010 onwards (Figure 5).

3.2. Cover and Dryness of Burnt and Unburnt Forests

Figure 6 shows the changes in the NDVI and ICDI remote sensing indices for the corresponding control areas and PB and WF areas. This is for 2–3 years before and up to around 10 years after each individual fire. Before each fire, the indices for the control (unburnt) and burnt areas had similar values (NDVI in the range of 0.5–0.6 and ICDI values around −0.1). The trends and rates of change were consistent over the later years. This indicates a similarity in the vegetation greenness of the forests between the control and burnt areas. However, immediately after the fire, both the NDVI and ICDI indices for the burnt samples decreased significantly, while the corresponding values for the control areas remained stable.
Over the following years, the changes in the two indices became notably differentiated (Figure 6). For PB and low-intensity WF, the NDVI recovered rapidly from average NDVIs of 0.4 immediately after the fires. After a short period (1–2 years for low-intensity PBs, 2–3 years for moderate-intensity WFs), the NDVI values for the burnt areas increased markedly, and matched the values in the control areas (Table 4). In some cases, the burnt forest canopy recovered so strongly that the NDVI values slightly surpassed those of the unburnt areas.
However, the dryness of the forest canopy, as indicated by ICDI values after each fire, remained at lower levels for a considerably longer period. In the case of PBs, the ICDI values in the burnt areas remained lower for 6.5–7 years compared to the unburnt areas (Table 4). For wildfires, the NDVI values usually decreased to below 0.2 due to tree crown loss. Here, the ICDI values in the burnt areas took approximately 10–20 years to catch up with the unburnt areas. An example of the NDVI and ICDI pattern changes before and after a fire is shown in Figure 7.
Examining the selected sample sites, we found that site WF_20041220 experienced two fires during the 37-year analysis period, PB in late 1989 (low severity; dNBR = 0.1842) and then a high-severity WF in late 2004 (Figure 8). Notably, the control area remained fire-free throughout the entire period, and the second fire occurred at the site when the forest had recovered to the same state as the control area. The recovery time was greater for ICDI than for NDVI. However, with different fire intensities, the specific catch-up time corresponding to each fire event is different (Table 4).
The sample area was prescribed burnt in 1989 and within 5 months, the canopy had recovered to the level of the unburnt forest with an NDVI value of nearly 0.6. However, it was not until late 1996, 7 years later, that the post-fire ICDI values had caught up with the control forest with values of approximately −0.1 (Figure 8).
The similar conditions between the prescribed burnt and unburnt areas were maintained from 1996 until 2004. In nearly one year before the WF in 2004, they both experienced a decline in canopy (i.e., a decrease in NDVI) and a rapid increase in ICDI indicating that the forest was under water stress. This could also be considered a factor that increases the risk of fire. After the fire, the forest canopy recovered after 2 years, however by the time this analysis was performed (June 2024), nearly 20 years after the fire, the ICDI values in the burnt area were still considerably lower than the control area.

4. Discussion

4.1. ICDI Application for Forest Water Stress Monitoring

Forest water stress management has become increasingly important under climate change, as drought events become more frequent and severe. Satellite-based remote sensing, particularly using visible and infrared reflectance data, has emerged as the dominant method for monitoring water stress impacts and forest recovery over large areas. The integration of multispectral and hyperspectral satellite imagery, such as that from Landsat time-series, Sentinel-2 and MODIS [69], has facilitated the development and application of general vegetation indices and more specialized indices like the Temperature Vegetation Water Stress Index (TVWSI) [70] and the IASI Water Deficit Index (IASI-WDI) [71], which incorporate canopy temperature, water content, and vegetation structure to detect stress conditions with greater sensitivity [48]. General vegetation indices derived from canopy spectral reflectance, such as NDVI and EVI [72,73], are widely used due to their compatibility with satellite data, though they are limited in sensitivity and effectiveness for early detection. The need for more accurate assessment tools has driven research toward developing new indices using narrower spectral bands, but such approaches are currently restricted by the coarse spatial and spectral resolution of most satellite platforms. Developing new, more sensitive indices in association with the use of higher-quality satellite imageries, as well as refining and combining existing indicators, presents promising directions for future applications for forest water stress monitoring.
The ICDI can clearly detect changes in canopy dryness, thus providing valuable insights into patterns of forest water stress following prescribed burns and wildfire. The results indicate that fire plays a role in maintaining lower levels of canopy dryness, thereby reducing water stress intensity for several years following a fire event. Since low-intensity fires in jarrah forests primarily burn the understorey canopy and ground litter, without significantly hindering post-fire regeneration, these findings align with a previous study that showed that the understory species in the jarrah forest accounted for 51% of the evaporation [74]. It also aligns with the results of a study in this region that demonstrated an increase in soil water storage and recharge following a prescribed fire in a Banksia woodland [75]. The longer time to recovery after wildfire can be ascribed to the removal of both the understory and overstory canopies. Previous studies have established a strong relationship between leaf area (i.e., LAI) and plant water stress [76,77].
The success of this application is particularly significant in the context of climate change, which is increasing the risk of water stress in forests worldwide [32,78] and the jarrah forest in particular [34,42,44]. Popular ground-based methods for assessing water stress, which include predawn leaf water potential, sap flow measurement, leaf chlorophyll fluorescence, pigment concentrations and leaf water content [79,80], are not only time-consuming and labour-intensive but also most rely on destructive sampling. Employing ground-based methods is impractical for large-scale applications [79]. In contrast, ICDI enables the use of multi-temporal remote sensing data, making it possible to assess water stress even in inaccessible forest areas or for extensive fire events. The availability of continuous historical remote sensing data further enhances the ability to track fire-related changes over time. When sufficient data are available, calculating ICDI for a given study area is straightforward.
This study utilized Landsat imagery with a spatial resolution of 30 m. Theoretically, fires with a minimum area of 900 m2 (corresponding to a single Landsat pixel) could be examined. However, in practice, relying on a single pixel is unreliable, especially if it is located at a boundary between different land cover types or contains heterogeneous vegetation cover. To ensure statistically representative sample points, this study focused on fires larger than 300 ha. While no specific research has yet determined the minimum fire area applicable to ICDI, fire patterns tend to mirror the distribution and composition of surrounding forest vegetation. Based on previous studies, particularly Lu et al. [81], we recommend applying ICDI to fires with a minimum size equivalent to a 9×9 pixel window, approximately 7.3 ha, when using Landsat data.
Beyond the success in wildfire monitoring, ICDI also holds potential for assessing the impacts of other forest disturbances, both natural (e.g., drought, pest infestations) and anthropogenic (e.g., thinning, pruning, and other silvicultural interventions), on forest canopy dryness. Furthermore, given the widespread availability of multispectral remote sensing data, we expect that the ICDI has broad applicability across diverse forest types globally, though validation will be necessary for each specific forest type. In parts of the world where PB is being used in forests experiencing increasing water stress and the threat of wildfire, there is the opportunity to explore the use of this index to prioritize areas for intervention. Examples could include the pine forests in Sierra Nevada, USA where PB is recommended for reducing tree mortality from drought [82], and for increasing landscape heterogeneity and ecosystem resilience to wildfire and drought [83]. This is also supported by various studies in the Mediterranean region, such as in Spain [84,85] and Portugal [86], where PB has been effectively used as a forest management tool.

4.2. Prescribed Burning—Water Stress Relief Under Climate Change

Fire is a unique ecological factor in forest ecosystems, capable of both destruction and promoting biotic growth. When unmanaged, as in the case of wildfires, the consequences are almost always severe. However, forest managers have long used fire as a strategic tool to minimize the risk and intensity of wildfires. Through prescribed burns, they reduce combustible materials in the forest while avoiding significant adverse effects [10,11,58].
This study focuses on jarrah, a tree species known for its resilience to fire [24,39]. The NDVI results show that when fires are low-intensity or occur under unfavourable conditions for burning, the forest canopy can recover within a year. However, beyond canopy recovery, this study also investigates an often-overlooked aspect of forest health: canopy dryness. This reflects the lack of available water in the canopy to support optimal growth [51] with the IDCI remote sensing index considered as an indicator of water stress. Notably, in forests experiencing high level of water stress, drier canopies increase the likelihood of fire spread and intensity following ignition [87].
Recently, Camarero et al. [88] also explored the long-term impact of fire on forest growth, particularly in the context of drought and water stress. The authors confirmed a link between fire and reduced water stress in Mediterranean pine forests. The study was limited to using growth indicators, specifically tree-ring measurement, to compare individual trees on a small scale. By monitoring ICDI across different fire events, we found that forest fires significantly reduced signs of water stress for extended periods (from 7 to more than 20 years), even after the canopy had fully recovered (Figure 6, Table 4). The results of the ICDI analysis are also consistent with our observation in Le et al. [51]. Previous studies have examined the effects of fire on hydrological behaviours based on calculating water balance at the watershed scale, which affirmed that these effects had typically been observed to last between 5 and 7 years [18,19,20].
Several factors may explain this phenomenon. First, the reduction in both overstorey and understorey vegetation after a fire leads to lower overall leaf area, thereby reducing water demand through transpiration. Various studies have confirmed the relationship between defoliation and the reduction in water use in forest after fire [89,90]. Additionally, water that would have otherwise been used by the shrub layer becomes available for overstorey trees. Second, beyond altering canopy structure, fire also clears understorey vegetation and litter, significantly reducing interception [50]. As a result, more rainfall infiltrates the soil, increasing soil water stores and thus increasing subsequent water availability for trees through the dry season. Numerous studies have found that wildfires can enhance water availability and even raise groundwater levels [2,13,91]. This effect is particularly relevant for jarrah, a deep-rooted species with an extensive root system capable of accessing groundwater. Fire also temporarily increases nutrient availability and forest growth in the NJF [92].
In practice, the influence of spatial clustering and local heterogeneity on forest canopy may exist. However, there have been no studies on these factors in the NJF. In selecting 5 random sites for each of PB and WF, we ensured that the control and sample areas were paired with the same environmental conditions. In addition to random sampling, we tried to minimize the influence of spatial clustering and local heterogeneity by applying the condition “NDVI values above the first quartile (Q1)” as a filter. The homogeneity of sample and control points is reflected in the similarity of the indices, in terms of both figure and trend, for a long period before each fire event. In the future, a larger number of forest sites could be used to examine the effect of forest structure and heterogeneity on forest canopy response after fire.
Given the effect of PB in alleviating water stress reported here, a key question arises: which areas should be prioritized for PB implementation? Since applying this approach across an entire forest is impractical due to time and resource constraints, strategic planning is essential. In this context, the ICDI presents itself as a valuable decision-making tool. Mapping ICDI patterns can help identify areas with high canopy dryness, allowing forest managers to prioritize interventions where they are needed most. Although ecological thinning has been advocated in this region as a means of reducing forest water stress [53]; this involves mechanical intervention, is costly and has only been applied to small areas. Prescribed fire can be surmised to be a relatively cheap alternative.
There are concerns in the literature regarding the effect of forest fire on other ecosystem services. The effects of prescribed fire on biodiversity are contentious; with direct effects on biodiversity reported [93,94]. These have to be contrasted with the catastrophic effects of wildfire on biodiversity, which prescribed fire alleviates. Water stress will also result in biodiversity loss in the NJF [28], and alleviating this can potentially reduce these losses. In addition, carbon emissions from fire in the NJF come from the combustion of litter and under- and overstorey canopies [95]. In Australian Government National Greenhouse Gas Inventory reports to the United Nations Framework Convention on Climate Change (UNFCCC), these are regarded as neutral, as the forest regrows after fire [96]. Carbon losses from drought in this forest have also been quantified [44,97]; thus relieving water stress will likely reduce drought deaths and carbon loss via this route.

5. Conclusions

This study utilizes multi-temporal Landsat remote sensing data combined with historical fire records to investigate the effects of fire, including both prescribed burning (PB) and wildfire (WF), on water stress in the Northern Jarrah Forest ecosystem. The ICDI is employed as an indicator of canopy water stress.
Temporal analysis of ICDI data reveals a clear trend of increasing high-canopy-dryness areas within the study region. Analysis on burnt areas further shows that post-fire canopy dryness remains at lower levels for an extended period, even after full canopy recovery. We observed that, depending on fire severity, the reduction in water stress persisted for 7–8 years following low-severity prescribed burns and more than 20 years after high-severity wildfires. These findings suggest a role for PB in alleviating water stress, and that PB can serve as a strategic tool for water stress mitigation particularly with the advent of climate change.
Additionally, the ICDI proves to be a valuable decision-making tool, as its spatial patterns can help identify areas with high canopy dryness, enabling forest managers to prioritize interventions where they are most needed. Beyond its success in monitoring the impacts of wildfire, the ICDI also holds significant potential for assessing the impacts of other forest disturbances—both natural (e.g., drought, pest infestations) and anthropogenic (e.g., thinning and other silvicultural interventions)—on forest physiological responses.

Author Contributions

Conceptualization, B.D. and R.H.; methodology, T.S.L. and B.D.; software, T.S.L.; writing—original draft preparation, T.S.L.; writing—review and editing, B.D. and R.H.; visualization, T.S.L.; supervision, B.D. and R.H. All authors have read and agreed to the published version of the manuscript.

Funding

This research received no external funding.

Data Availability Statement

The datasets presented in this article are not readily available because they are part of an ongoing study. Requests to access the datasets should be directed to the corresponding author.

Acknowledgments

Thai Son Le received a Murdoch University Postgraduate International Scholarship.

Conflicts of Interest

The authors declare no conflicts of interest.

References

  1. Pekin, B.K.; Boer, M.M.; Macfarlane, C.; Grierson, P.F. Impacts of increased fire frequency and aridity on eucalypt forest structure, biomass and composition in southwest Australia. For. Ecol. Manag. 2009, 258, 2136–2142. [Google Scholar] [CrossRef]
  2. Moazeni, S.; Cerdà, A. The impacts of forest fires on watershed hydrological response. A review. Trees For. People 2024, 18, 10. [Google Scholar] [CrossRef]
  3. De Luis, M.; González-Hidalgo, J.C.; Raventós, J. Effects of fire and torrential rainfall on erosion in a Mediterranean gorse community. Land. Degrad. Dev. 2003, 14, 203–213. [Google Scholar] [CrossRef]
  4. Wasserman, T.N.; Mueller, S.E. Climate influences on future fire severity: A synthesis of climate-fire interactions and impacts on fire regimes, high-severity fire, and forests in the western United States. Fire Ecol. 2023, 19, 43. [Google Scholar] [CrossRef]
  5. Yin, J.; He, B.; Fan, C.; Chen, R.; Zhang, H.; Zhang, Y. Drought-related wildfire accounts for one-third of the forest wildfires in subtropical China. Agric. For. Meteorol. 2024, 346, 109893. [Google Scholar] [CrossRef]
  6. Xing, H.; Fang, K.; Yao, Q.; Zhou, F.; Ou, T.; Liu, J.; Zhou, S.; Jiang, S.; Chen, Y.; Bai, M.; et al. Impacts of changes in climate extremes on wildfire occurrences in China. Ecol. Indic. 2023, 157, 111288. [Google Scholar] [CrossRef]
  7. Gajendiran, K.; Kandasamy, S.; Narayanan, M. Influences of wildfire on the forest ecosystem and climate change: A comprehensive study. Environ. Res. 2024, 240, 117537. [Google Scholar] [CrossRef]
  8. Nieman, W.A.; Wilgen, B.W.v.; Leslie, A.J. A review of fire management practices in African savanna-protected areas. Koedoe-Afr. Prot. Area Conserv. Sci. 2021, 63, 160. [Google Scholar] [CrossRef]
  9. Williams, J.N.; Quinn-Davidson, L.; Safford, H.D.; Grupenhoff, A.; Middleton, B.R.; Restaino, J.; Smith, E.; Adlam, C.; Rivera-Huerta, H. Overcoming obstacles to prescribed fire in the North American Mediterranean climate zone. Front. Ecol. Environ. 2023, 22, e2687. [Google Scholar] [CrossRef]
  10. Valkó, O.; Deák, B. Increasing the potential of prescribed burning for the biodiversity conservation of European grasslands. Curr. Opin. Environ. Sci. Health 2021, 22, 100268. [Google Scholar] [CrossRef]
  11. Morgan, G.W.; Tolhurst, K.G.; Poynter, M.W.; Cooper, N.; McGuffog, T.; Ryan, R.; Wouters, M.A.; Stephens, N.; Black, P.; Sheehan, D.; et al. Prescribed burning in south-eastern Australia: History and future directions. Aust. For. 2020, 83, 4–28. [Google Scholar] [CrossRef]
  12. Gharun, M.; Possell, M.; Vervoort, R.W.; Adams, M.A.; Bell, T.L. Can a growth model be used to describe forest carbon and water balance after fuel reduction burning in temperate forests? Sci. Total Environ. 2018, 615, 1000–1009. [Google Scholar] [CrossRef] [PubMed]
  13. Soulis, K.X.; Generali, K.A.; Papadaki, C.; Theodoropoulos, C.; Psomiadis, E. Hydrological Response of Natural Mediterranean Watersheds to Forest Fires. Hydrology 2021, 8, 15. [Google Scholar] [CrossRef]
  14. Giuditta, E.; Coenders-Gerrits, A.M.J.; Bogaard, T.A.; Wenninger, J.; Greco, R.; Rutigliano, F.A. Measuring changes in forest floor evaporation after prescribed burning in Southern Italy pine plantations. Agric. For. Meteorol. 2018, 256–257, 516–525. [Google Scholar] [CrossRef]
  15. Rulli, M.C.; Rosso, R. Hydrologic response of upland catchments to wildfires. Adv. Water Resour. 2007, 30, 2072–2086. [Google Scholar] [CrossRef]
  16. Poon, P.K.; Kinoshita, A.M. Spatial and temporal evapotranspiration trends after wildfire in semi-arid landscapes. J. Hydrol. 2018, 559, 71–83. [Google Scholar] [CrossRef]
  17. Pereira, M.G.; Fernandes, L.S.; Carvalho, S.; Santos, R.B.; Caramelo, L.; Alencoão, A. Modelling the impacts of wildfires on runoff at the river basin ecological scale in a changing Mediterranean environment. Environ. Earth Sci. 2016, 75, 392. [Google Scholar] [CrossRef]
  18. Robichaud, P.R. Fire Effects on Infiltration Rates after Prescribed Fire in Northern Rocky Mountain Forests, USA. J. Hydrol. 2000, 231, 220–229. [Google Scholar] [CrossRef]
  19. Zhou, Y.; Zhang, Y.; Vaze, J.; Lane, P.; Xu, S. Impact of bushfire and climate variability on streamflow from forested catchments in southeast Australia. Hydrol. Sci. J. 2015, 60, 1340–1360. [Google Scholar] [CrossRef]
  20. Mayor, A.G.; Bautista, S.; Llovet, J.; Bellot, J. Post-fire hydrological and erosional responses of a Mediterranean landscpe: Seven years of catchment-scale dynamics. CATENA 2007, 71, 68–75. [Google Scholar] [CrossRef]
  21. Vega, J.A.; Fernández, C.; Fonturbel, T. Throughfall, runoff and soil erosion after prescribed burning in gorse shrubland in Galicia (NW Spain). Land. Degrad. Dev. 2005, 16, 37–51. [Google Scholar] [CrossRef]
  22. Marcos, E.; Tarrega, R.; Luis-Calabuig, E. Comparative Analysis of Runo and Sediment Yield with a Rainfall Simulator After Experimental Fire. Arid Soil Res. Rehabil. 2010, 14, 293–307. [Google Scholar] [CrossRef]
  23. Inbar, M.; Tamir, M.; Wittenberg, L. Runoff and erosion processes after a forest fire in Mount Carmel, a Mediterranean area. Geomorphology 1998, 24, 17–33. [Google Scholar] [CrossRef]
  24. Bell, D.; McCaw, W.; Burrows, N. Influence of fire on jarrah forest vegetation. In Jarrah Forest, A Complex Mediterranean Ecosystem; Dell, B., Havel, J.J., Malajczuk, N., Eds.; Kluwer Academic Publisher: Dordrecht, The Netherlands, 1989. [Google Scholar]
  25. Hood, S.M.; Keyes, C.R.; Bowen, K.J.; Lutes, D.C.; Seielstad, C. Fuel treatment longevity in ponderosa pine-dominated forest 24 years after cutting and prescribed burning. Front. For. Glob. Change 2020, 3, 78. [Google Scholar] [CrossRef]
  26. Gentilli, J. Climate of the jarrah forest. In The Jarrah Forest, A Complex Mediterranean Ecosystem; Dell, B., Havel, J.J., Malajczuk, N., Eds.; Kluwer Academic Publisher: Dordrecht, The Netherlands, 1989. [Google Scholar]
  27. Hardy, G.; Matusick, G.; Ruthrof, K. Impacts of large scale drought deaths in Western Australia’s Northern Jarrah (Eucalyptus marginata) Forest. In Proceedings of the Ecological Society of Australia, Annual Conference, Melbourne, Australia, 19–21 June 2012. [Google Scholar]
  28. Croton, J.T.; Dalton, G.T.; Green, K.A.; Mauger, G.W.; Dalton, J.A. Northern Jarrah Forest Water-Balance Study to Inform the Review of Silviculture Guidelines; Technical Report No. 9; Forest and Ecosystem Management Division, Department of Parks and Wildlife: Perth, WA, Australia, 2014. [Google Scholar]
  29. Liu, N.; Harper, R.J.; Smettem, K.R.J.; Dell, B.; Liu, S. Responses of streamflow to vegetation and climate change in southwestern Australia. J. Hydrol. 2019, 572, 761–770. [Google Scholar] [CrossRef]
  30. Allen, C.D.; Macalady, A.K.; Chenchouni, H.; Bachelet, D.; McDowell, N.; Vennetier, M.; Kitzberger, T.; Rigling, A.; Breshears, D.D.; Hogg, E.H.T.; et al. A global overview of drought and heat-induced tree mortality reveals emerging climate change risks for forests. For. Ecol. Manag. 2010, 259, 660–684. [Google Scholar] [CrossRef]
  31. Trenberth, K.E.; Dai, A.; Van Der Schrier, G.; Jones, P.D.; Barichivich, J.; Briffa, K.R.; Sheffield, J. Global warming and changes in drought. Nat. Clim. Change 2014, 4, 17–22. [Google Scholar] [CrossRef]
  32. Cook, B.I.; Mankin, J.S.; Anchukaitis, K.J. Climate change and drought: From past to future. Curr. Clim. Change Rep. 2015, 4, 164–179. [Google Scholar] [CrossRef]
  33. Cholet, C.; Houle, D.; Sylvain, J.-D.; Doyon, F.; Maheu, A. Climate change increases the severity and duration of soil water stress in the temperate forest of eastern north America. Front. For. Glob. Change 2022, 5, 13. [Google Scholar] [CrossRef]
  34. Matusick, G.; Ruthrof, K.X.; Brouwers, N.C.; Dell, B.; Hardy, G.S.J. Sudden forest canopy collapse corresponding with extreme drought and heat in a mediterranean-type eucalypt forest in southwestern Australia. Eur. J. For. Res. 2013, 132, 497–510. [Google Scholar] [CrossRef]
  35. Burrows, N.; McCaw, L. Prescribed burning in southwestern Australian forests. Front. Ecol. Environ. 2013, 11, e25–e34. [Google Scholar] [CrossRef]
  36. McCaw, W.L.; Burrows, N.D. Fire management. In The Jarrah Forest—A Complex Mediterranean Ecosystem; Dell, B., Havel, J.J., Malajczuk, N., Eds.; Kluwer Academic Publishers: Dordrecht, The Netherlands, 1989; pp. 317–334. [Google Scholar]
  37. Fernandes, P.M.; Davies, G.M.; Ascoli, D.; Fernández, C.; Moreira, F.; Rigolot, E.; Stoof, C.R.; Vega, J.A.; Molina, D. Prescribed burning in southern Europe: Developing fire management in a dynamic landscape. Front. Ecol. Environ. 2013, 11, 4–14. [Google Scholar] [CrossRef]
  38. Weir, J.R.; Scasta, J.D. Global Application of Prescribed Fire; CSIRO Publishing: Clayton, Australia, 2022. [Google Scholar]
  39. Abbott, I.; Dell, B.; Loneragan, O. The jarrah plant. In The Jarrah Forest: A Complex Mediterranean Ecosystem; Dell, B., Havel, J.J., Malajczuk, N., Eds.; Kluwer Academic Publishers: Dordrecht, The Netherlands, 1989; pp. 41–51. [Google Scholar]
  40. Abbott, I.; Loneragan, O. Ecology of Jarrah (Eucalyptus marginata) in the Northern Jarrah Forest of Western Australia; Department of Conservation and Land Management: Perth, WA, Australia, 1986; p. 137. [Google Scholar]
  41. Schofield, N.J.; Stoneman, G.L.; Loh, I.C. Hydrology of the jarrah forest. In The Jarrah Forest: A Complex Mediterranean Ecosystem; Dell, B., Havel, J.J., Malajczuk, N., Eds.; Kluwer Academic Publishers: Dordrecht, The Netherlands, 1989; pp. 179–201. [Google Scholar]
  42. Matusick, G.; Ruthrof, K.X.; Kala, J.; Brouwers, N.C.; Breshears, D.D.; Hardy, G. Chronic historical drought legacy exacerbates tree mortality and crown dieback during acute heatwave-compounded drought. Environ. Res. Lett. 2018, 13, 095002. [Google Scholar] [CrossRef]
  43. Bradford, J.B.; Shriver, R.K.; Robles, M.D.; McCauley, L.A.; Woolley, T.J.; Andrews, C.A.; Crimmins, M.; Bell, D.M. Tree mortality response to drought-density interactions suggests opportunities to enhance drought resistance. J. Appl. Ecol. 2022, 59, 549–559. [Google Scholar] [CrossRef]
  44. Walden, L.L.; Fontaine, J.B.; Ruthrof, K.X.; Matusick, G.; Harper, R.J. Drought then wildfire reveals a compound disturbance in a resprouting forest. Ecol. Appl. 2023, 33, e2775. [Google Scholar] [CrossRef]
  45. Jackson, R.D. Canopy temperature and crop water stress. Adv. Irrig. 1982, 1, 43–85. [Google Scholar] [CrossRef]
  46. Korner, C. Humidity responses in forest trees: Precautions in thermal scanning surveys. Arch. Meteorol. Geophys. Bioclimatol. B 1985, 36, 83–96. [Google Scholar] [CrossRef]
  47. Fuchs, M. Infrared measurement of canopy temperature and detection of plant water stress. Theor. Appl. Climatol. 1990, 42, 253–261. [Google Scholar] [CrossRef]
  48. Le, T.S.; Harper, R.; Dell, B. Application of remote sensing in detecting and monitoring water stress in forests. Remote Sens. 2023, 15, 3360. [Google Scholar] [CrossRef]
  49. Carbon, B.A.; Bartle, G.A.; Murry, A.M. Water stress, transpiration and leaf area index in eucalypt plantations in a bauxite mining area in south-west Australia. Aust. J. Ecol. 1981, 6, 459–466. [Google Scholar] [CrossRef]
  50. Su, L.; Yang, J.; Zhao, X.; Miao, Y. Effects of fire on interception loss in a coniferous and broadleaved mixed forest. J. Hydrol. 2022, 613, 128425. [Google Scholar] [CrossRef]
  51. Le, T.S.; Dell, B.; Harper, R. A new remote sensing index for forest dryness monitoring using multi-spectral satellite imagery. Forests 2024, 15, 915. [Google Scholar] [CrossRef]
  52. Sankey, T.; Tatum, J. Thinning increases forest resiliency during unprecedented drought. Sci. Rep. 2022, 12, 9041. [Google Scholar] [CrossRef] [PubMed]
  53. Burrows, N.; Baker, P.; Harper, R.; Silberstein, R. A Report on Silvicultural Guidelines 2033 Forest Management Plan for the Western Australian. Department of Biodiversity, Conservation and Attractions. 2022. Available online: https://www.dbca.wa.gov.au/media/3519/download (accessed on 30 October 2024).
  54. Szpakowski, D.M.; Jensen, J.L.R. A Review of the Applications of Remote Sensing in Fire Ecology. Remote Sens. 2019, 11, 2638. [Google Scholar] [CrossRef]
  55. Chuvieco, E.; Kasischke, E.S. Remote sensing information for fire management and fire effects assessment. J. Geophys. Res. 2007, 112, G01S90. [Google Scholar] [CrossRef]
  56. Gitas, I.; Mitri, G.; Veraverbeke, S.; Polychronaki, A. Advances in remote sensing of post-fire vegetation recovery monitoring—A review. In Remote Sensing of Biomas: Principles and Applications; Fatoyinbo, L., Ed.; IntechOpen: London, UK, 2012; pp. 143–176. [Google Scholar]
  57. Escuin, S.; Navarro, R.; Fernández, P. Fire severity assessment by using NBR (Normalized Burn Ratio) and NDVI (Normalized Difference Vegetation Index) derived from LANDSAT TM/ETM images. Int. J. Remote Sens. 2008, 29, 1053–1073. [Google Scholar] [CrossRef]
  58. Fernandez-Carrilloa, A.; McCawb, L.; Tanase, M.A. Estimating prescribed fire impacts and post-fire tree survival in Eucalyptus forests of Western Australia with L-band SAR data. Remote Sens. Environ. 2019, 224, 133–144. [Google Scholar] [CrossRef]
  59. Viana-Soto, A.; García, M.; Aguado, I.; Salas, J. Assessing post-fire forest structure recovery by combining LiDAR data and Landsat time series in Mediterranean pine forests. Int. J. Appl. Earth Obs. Geoinf. 2022, 108, 102754. [Google Scholar] [CrossRef]
  60. Gordon, C.E.; Price, O.F.; Tasker, E.M. Mapping and exploring variation in post-fire vegetation recovery following mixed severity wildfire using airborne LiDAR. Ecol. Appl. 2017, 27, 1618–1632. [Google Scholar] [CrossRef]
  61. Churchward, H.M.D.; Dimmock, G.M. The soils and landforms of the Northern Jarrah Forest. In The Jarrah Forest, a Complex Mediterranean Ecosystem; Dell, B., Havel, J.J., Malajczuk, N., Eds.; Kluwer Academic Publisher: Dordrecht, The Netherlands, 1989. [Google Scholar]
  62. Harper, R.; Smettem, K.R.J.; Ruprecht, J.K.; Dell, B.; Liu, N. Forest-water interactions in the changing environment of south-western Australia. Ann. For. Sci. 2019, 76, 12. [Google Scholar] [CrossRef]
  63. EROS. Landsat 7 Enhanced Thematic Mapper Plus Level-2, Collection 2 [Dataset]; Earth Resources Observation and Science (EROS) Center: Sioux Falls, SD, USA; U.S. Geological Survey: Reston, VA, USA, 2020. [Google Scholar]
  64. EROS. Landsat 4-5 Thematic Mapper Level-2, Collection 2 [Dataset]; Earth Resources Observation and Science (EROS) Center: Sioux Falls, SD, USA; U.S. Geological Survey: Reston, VA, USA, 2020. [Google Scholar]
  65. EROS. Landsat 8-9 Operational Land Imager/Thermal Infrared Sensor Level-2, Collection 2 [Dataset]; Earth Resources Observation and Science (EROS) Center: Sioux Falls, SD, USA; U.S. Geological Survey: Reston, VA, USA, 2020. [Google Scholar]
  66. DBCA. DBCA Fire History (DBCA-060); Fire Management Services Branch, Department of Biodiversity, Conservation and Attractions: Melbourne, Australia, 2024. [Google Scholar]
  67. Hunt, E.R.; Rock, B.N. Detection of changes in leaf water content using near- and middle-infrared reflectances. Remote Sens. Environ. 1989, 30, 43–54. [Google Scholar] [CrossRef]
  68. USGS. Normalized Burn Ratio (NBR). Available online: https://un-spider.org/advisory-support/recommended-practices/recommended-practice-burn-severity/in-detail/normalized-burn-ratio (accessed on 30 October 2024).
  69. Li, T.; Zhong, S. Advances in Optical and Thermal Remote Sensing of Vegetative Drought and Phenology. Remote Sens. 2024, 16, 4209. [Google Scholar] [CrossRef]
  70. Joshi, R.C.; Ryu, D.; Sheridan, G.J.; Lane, P.N.J. Modeling Vegetation Water Stress over the Forest from Space: Temperature Vegetation Water Stress Index (TVWSI). Remote Sens. 2021, 13, 4635. [Google Scholar] [CrossRef]
  71. Masiello, G.; Ripullone, F.; De Feis, I.; Rita, A.; Saulino, L.; Pasquariello, P.; Cersosimo, A.; Venafra, S.; Serio, C. The IASI Water Deficit Index to Monitor Vegetation Stress and Early Drying in Summer Heatwaves: An Application to Southern Italy. Land 2022, 11, 1366. [Google Scholar] [CrossRef]
  72. Moreno, A.; Maselli, F.; Chiesi, M.; Genesio, L.; Vaccari, F.; Seufert, G.; Gilabert, M.A. Monitoring water stress in Mediterranean semi-natural vegetation with satellite and meteorological data. Int. J. Appl. Earth Obs. Geoinf. 2014, 26, 246–255. [Google Scholar] [CrossRef]
  73. Vacchiano, G.; Garbarino, M.; Mondino, E.B.; Motta, R. Evidences of drought stress as a predisposing factor to Scots pine decline in Valle d’Aosta (Italy). Eur. J. For. Res. 2012, 131, 989–1000. [Google Scholar] [CrossRef]
  74. Greenwood, E.A.N.; Klein, L.; Beresford, J.D.; Watson, G.D.; Wright, K.D. Evaporation from the understorey in the Jarrah (Eucalyptus marginata Don ex Sm.) forest, southwestern Australia. J. Hydrol. 1985, 80, 337–349. [Google Scholar] [CrossRef]
  75. Silberstein, R.P.; Dawes, W.R.; Bastow, T.P.; Byrne, J.; Smart, N.F. Evaluation of changes in post-fire recharge under native woodland using hydrological measurements, modelling and remote sensing. J. Hydrol. 2013, 489, 1–15. [Google Scholar] [CrossRef]
  76. Battaglia, M.; Cherry, M.L.; Beadle, C.L.; Sands, P.J.; Hingston, A. Prediction of leaf area index in eucalypt plantations: Effects of water stress and temperature. Tree Physiol. 1998, 18, 521–528. [Google Scholar] [CrossRef]
  77. Cetin, M.; Alsenjar, O.; Aksu, H.; Golpinar, M.S.; Akgul, M.A. Estimation of crop water stress index and leaf area index based on remote sensing data. Water Supply 2023, 23, 1390–1404. [Google Scholar] [CrossRef]
  78. Feng, P.; Wang, B.; Luo, J.-J.; Liu, D.L.; Waters, C.; Ji, F.; Ruan, H.; Xiao, D.; Shi, L.; Yu, Q. Using large-scale climate drivers to forecast meteorological drought condition in growing season across the Australian wheatbelt. Sci. Total Environ. 2020, 724, 138162. [Google Scholar] [CrossRef] [PubMed]
  79. Govender, M.; Dye, P.J.; Weiersbye, I.M.; Witkowski, E.T.F.; Ahmed, F. Review of commonly used remote sensing and ground-based technologies to measure plant water stress. Water SA 2009, 35, 741–752. [Google Scholar] [CrossRef]
  80. Ahmad, U.; Alvino, A.; Marino, S. A review of crop water stress assessment using remote sensing. Remote Sens. 2021, 13, 4155. [Google Scholar] [CrossRef]
  81. Lu, D.; Li, G.; Moran, E.; Dutra, L.; Batistella, M. The roles of textural images in improving land-cover classification in the Brazilian Amazon. Int. J. Remote Sens. 2014, 35, 8188–8207. [Google Scholar] [CrossRef]
  82. Restaino, C.; Young, D.J.N.; Estes, B.; Gross, S.; Wuenschel, A.; Meyer, M.; Safford, H. Forest structure and climate mediate drought-induced tree mortality in forests of the Sierra Nevada, USA. Ecol. Appl. 2019, 29, e01902. [Google Scholar] [CrossRef]
  83. Boisramé, G.; Thompson, S.; Collins, B.; Stephens, S. Managed Wildfire Effects on Forest Resilience and Water in the Sierra Nevada. Ecosystems 2017, 20, 717–732. [Google Scholar] [CrossRef]
  84. Vilà-Vilardell, L.; Cáceres, M.D.; Piqué, M.; Casals, P. Prescribed fire after thinning increased resistance of sub-Mediterranean pine forests to drought events and wildfires. For. Ecol. Manag. 2023, 527, 120602. [Google Scholar] [CrossRef]
  85. Duane, A.; Aquilué, N.; Canelles, Q.; Morán-Ordoñez, A.; Cáceres, M.D.; Brotons, L. Adapting prescribed burns to future climate change in Mediterranean landscapes. Sci. Total Environ. 2019, 677, 68–83. [Google Scholar] [CrossRef]
  86. Pacheco, R.M.; Claro, J. Prescribed burning as a cost-effective way to address climate change and forest management in Mediterranean countries. Ann. For. Sci. 2021, 78, 100. [Google Scholar] [CrossRef]
  87. Vidal, A.; Devaux-Ros, C. Evaluating forest fire hazard with a Landsat TM derived water stress index. Agric. For. Meteorol. 1995, 77, 207–224. [Google Scholar] [CrossRef]
  88. Camarero, J.J.; Guijarro, M.; Calama, R.; Valeriano, C.; Pizarro, M.; Madrigal, J. Wildfires improve forest growth resilience to drought. Fire 2023, 6, 161. [Google Scholar] [CrossRef]
  89. Clemente, A.S.; Rego, F.C.; Correia, O.A. Growth, water relations and photosynthesis of seedlings and resprouts after fire. Acta Oecologica 2005, 27, 233–243. [Google Scholar] [CrossRef]
  90. Mappin, K.; Pate, J.; Bell, T. Productivity and water relations of burnt and long-unburnt semi-arid shrubland in Western Australia. Plant Soil 2003, 257, 321–340. [Google Scholar] [CrossRef]
  91. Hallema, D.W.; Sun, G.; Caldwell, P.V.; Norman, S.P.; Cohen, E.C.; Liu, Y.; Bladon, K.D.; McNulty, S.G. Burned forests impact water supplies. Nat. Commun. 2018, 9, 8. [Google Scholar] [CrossRef]
  92. Grove, T.S.; O’Connell, A.M.; Dimmock, G.M. Nutrient changes in surface soils after an intense fire in jarrah (Eucalyptus marginata Donn ex Sm.) forest. Aust. J. Ecol. 1986, 11, 303–317. [Google Scholar] [CrossRef]
  93. Thorn, S.; Wills, A.; McCaw, L. Biodiversity monitoring for the jarrah (Eucalyptus marginata) forest in south-west Western Australia: An extension to ten-year findings of Forestcheck. For. Ecol. Manag. 2024, 567, 122082. [Google Scholar] [CrossRef]
  94. Burrows, N.; Ward, B.; Wills, A.; Williams, M.; Cranfield, R. Fine-scale temporal turnover of jarrah forest understory vegetation assemblages is independent of fire regime. Fire Ecol. 2019, 15, 10. [Google Scholar] [CrossRef]
  95. Walden, L.L. The Effects of Drought and Wildfire on Forest Structure and Carbon Storage in a Resprouting Eucalypt Forest. Ph.D. Thesis, Murdoch University, Murdoch, WA, Australia, 2020. [Google Scholar]
  96. Kirschbaum, M.U.F. How should forest fires be treated in the National Greenhouse gas inventory? Aust. For. 2000, 3, 136–141. [Google Scholar] [CrossRef]
  97. Walden, L.L.; Fontaine, J.B.; Ruthrof, K.X.; Matusick, G.; Harper, R.J.; Hardy, G.E.S.J. Carbon consequences of drought differ in forests that resprout. Glob. Change Biol. 2019, 25, 1653–1664. [Google Scholar] [CrossRef]
Figure 1. The study area and example for locations of sample and control points; (A) The Northern Jarrah Forest covered by the Landsat scene P112/R082; (B) Example of sample and control points before and after a fire event (2 February 2002).
Remotesensing 17 01979 g001
Figure 2. An example for NDVI-Q1 value determination for sample and control point generation.
Remotesensing 17 01979 g002
Figure 3. Summary of analytical procedures used in the study. (NDII: Normalized Difference Infrared Index; NDVI: Normalized Difference Vegetation Index; ICDI: Infrared Canopy Dryness Index).
Remotesensing 17 01979 g003
Figure 4. Late dry season ICDI maps of the study area over the period 1987 to 2024 (capture date in layer name). This is the season when the forest experiences the highest water stress.
Remotesensing 17 01979 g004
Figure 5. Trends in annual rainfall and high-dryness area proportion (1988–2024). Rainfall data were drawn from Mundaring (Station No. 9030) at the centre of the study area (Source: Australia Bureau of Meteorology). High-dryness area was determined by ICDI values with equal-interval classification into low, medium and high dryness categories.
Remotesensing 17 01979 g005
Figure 6. Summary of NDVI and ICDI change over time for 5 prescribed burning (PB) and 5 wildfire (WF) events. The vertical dashed line shows the occurrence of each fire event. The time for recovery of the two indices to unburnt conditions are summarized in Table 4. The x-axis represents time. The top y-axis shows NDVI values, while the bottom y-axis shows ICDI values.
Remotesensing 17 01979 g006
Figure 7. Example of ICDI and NDVI patterns over time [at pre-fire (A) and 1, 27, 58, 77, 89 months after fire (BF)] from the sample WF_20020202.
Remotesensing 17 01979 g007
Figure 8. Example of NDVI and ICDI changes at sample WF_20041220 over a 37-year period. Two fires occurred during this period, with the first prescribed burn (1989) taking 8 years to catch up with the unburnt forest in terms of ICDI, and the following wildfire (2004) not caught up after 19.5 years.
Remotesensing 17 01979 g008
Table 1. Remote sensing indices used for detecting plant water stress.
Fire TypeNumber of EventsMinimum Area (ha)Maximum Area (ha)
Prescribed burning10680.1325,392.77
Wildfire27930.0928,289.89
Other fires13080.033956.03
Table 2. Summary of the ten selected prescribed fire (PB) and wildfire (WF) events. Coordinates based on World Geodetic System 84 (WGS 84), Zone 50 South.
No.Fire EventCoordinates (X;Y)Fire TypeDate of FireArea (ha)Number of Sample PointsNumber of Control Points
1PB_19951024422,045;
−3,553,428
PB16 September 19951911.9191130
2PB_19990501441,336;
−3,576,979
PB1 April 19991468.5147125
3PB_20071014437,977;
−3,562,773
PB14 October 20071959.7196128
4PB_20141015434,078;
−3,469,660
PB15 October 20141465.7147116
5PB_20170606446,960;
−3,571,018
PB6 June 20172835.8284148
6WF_19991223446,240;
−3,581,614
WF1 April 20001960.4196127
7WF_20020202465,461;
−3,600,251
WF1 November 20011358.7136125
8WF_20041220435,376;
−3,570,263
WF20 December 20041773.2177120
9WF_20080108440,016;
−3,581,642
WF8 January 2008606.96172
10WF_20180114429,971;
−3,537,654
WF14 January 20183259.5326167
Table 3. Burn severity levels obtained calculating dNBR (Source: USGS [68]).
Severity LeveldNBR Range
Enhanced Regrowth, high (post-fire)−0.500 to −0.251
Enhanced Regrowth, low (post-fire)−0.250 to −0.101
Unburned−0.100 to +0.099
Low Severity+0.100 to +0.269
Moderate–low Severity+0.270 to 0.439
Moderate–high Severity+0.440 to +0.659
High Severity+0.660 to +1.300
Table 4. Severity categories and time for NDVI and ICDI values to recover to adjacent unburnt forest values for 10 selected fire events in the Northern Jarrah Forest.
No.Fire EventdNBRSeverity LevelTime for NDVI Catch-Up (Years)Time for ICDI Catch-Up (Years)
1PB_199510240.1898Low0.56.5
2PB_199905010.1670Low17
3PB_200710140.1508Low17
4PB_201410150.3506Moderate–low9>10 (on going)
5PB_201706060.1364Low1.56.5
6WF_199912230.3812Moderate–low1.512
7WF_200202020.6588Moderate–high2.514
8WF_200412200.7026High2>19 (on going)
9WF_200801080.9464High1.58.5
10WF_201801140.8310High6>6 (on going)
Disclaimer/Publisher’s Note: The statements, opinions and data contained in all publications are solely those of the individual author(s) and contributor(s) and not of MDPI and/or the editor(s). MDPI and/or the editor(s) disclaim responsibility for any injury to people or property resulting from any ideas, methods, instructions or products referred to in the content.

