
Impact of Fengyun-4A Atmospheric Motion Vector Data Assimilation on PM2.5 Simulation


Abstract

1. Introduction
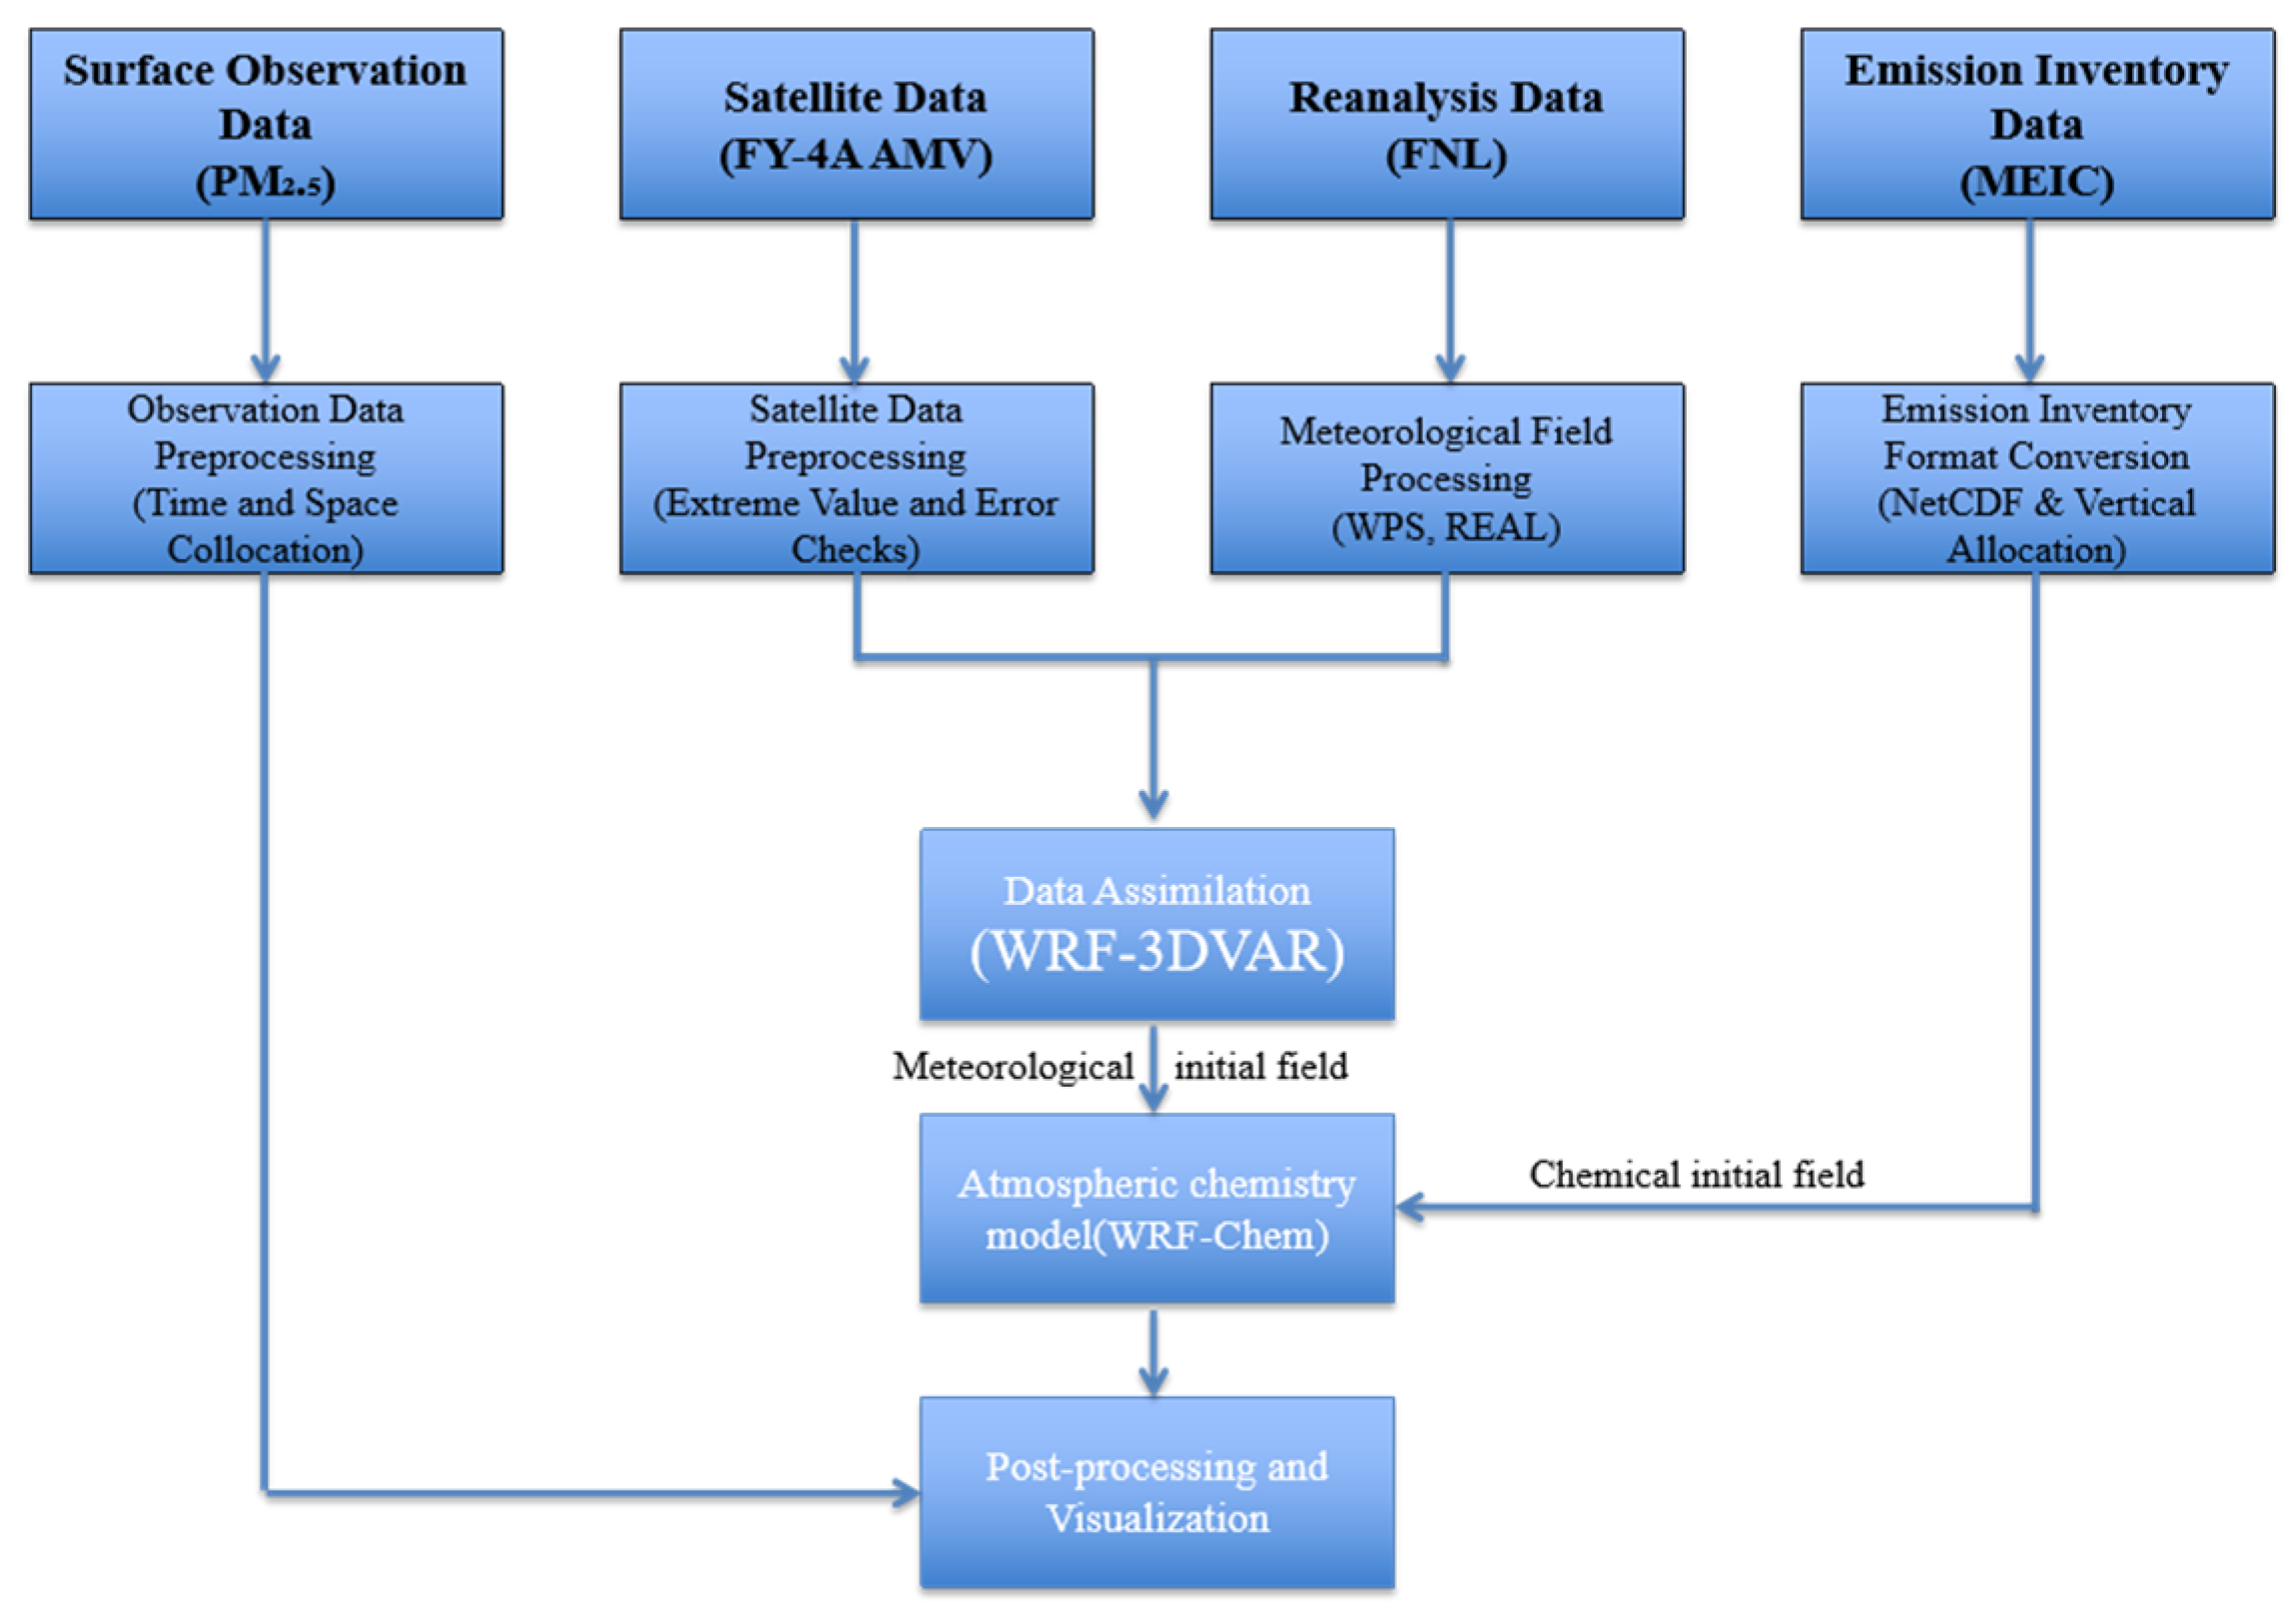
2. Methods and Data
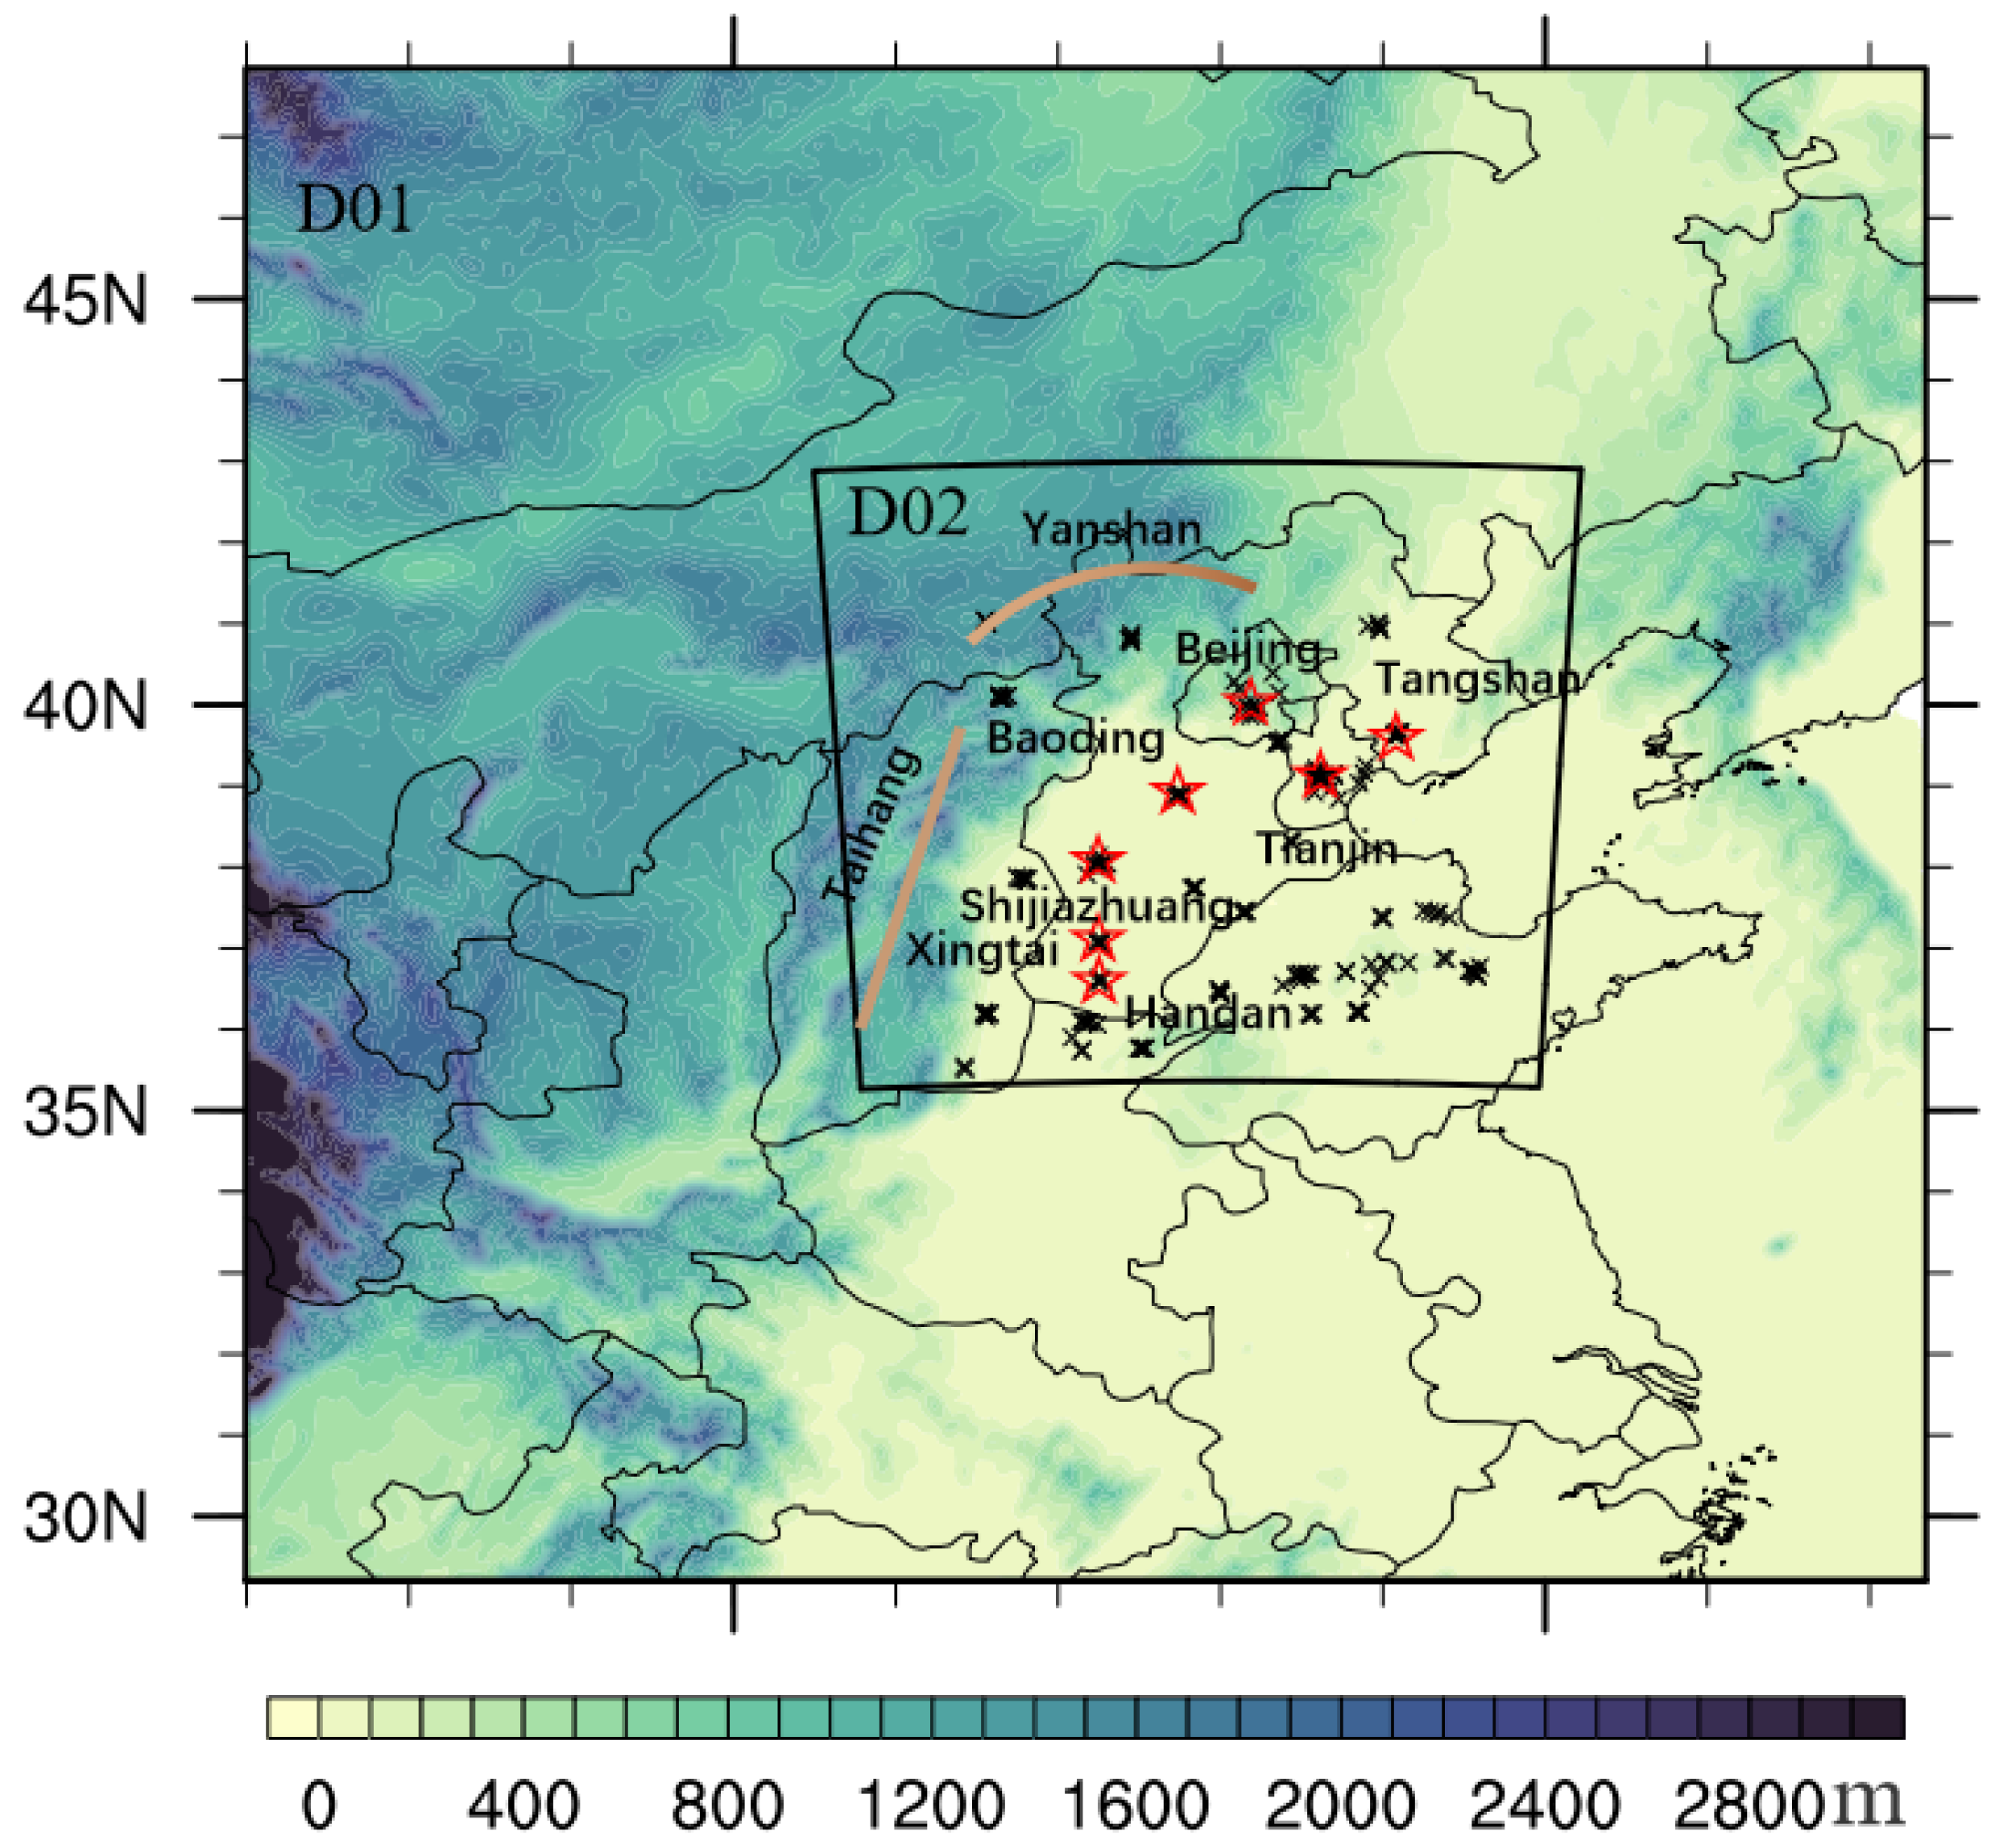
2.1. Data
2.2. Assessment Methods
3. Model and Experimental Design
3.1. Atmospheric Chemistry Models
3.2. Data Assimilation System
3.3. Experimental Design
4. Results
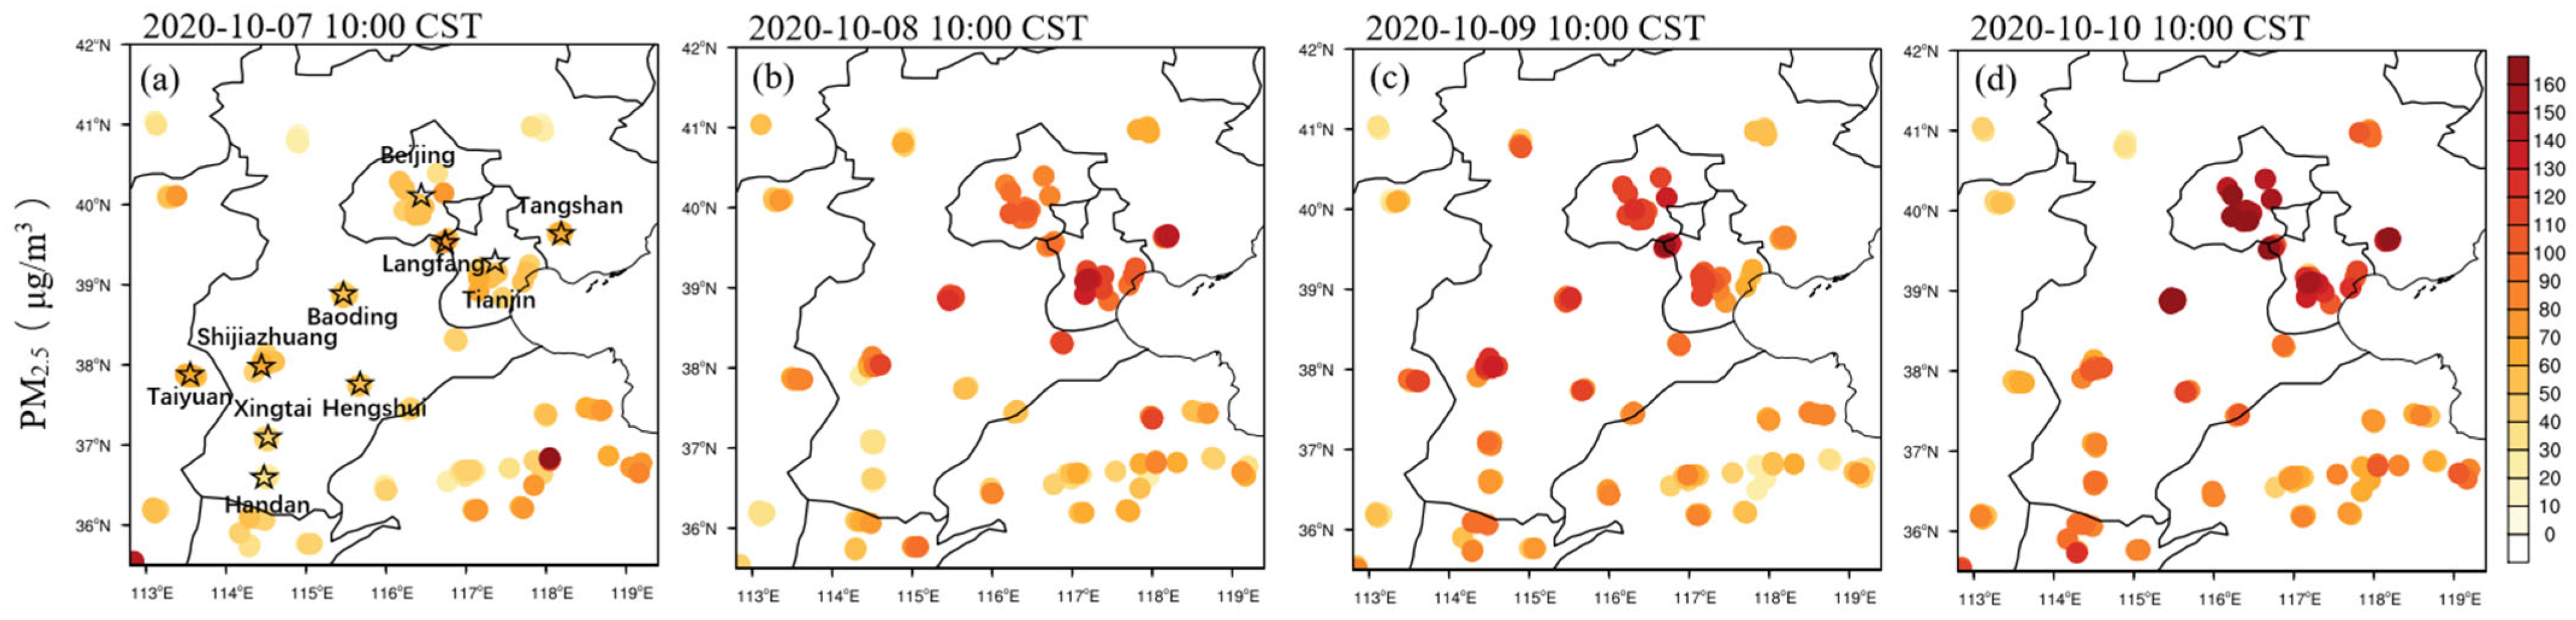
4.1. Analysis of the Severe PM2.5 Pollution Event
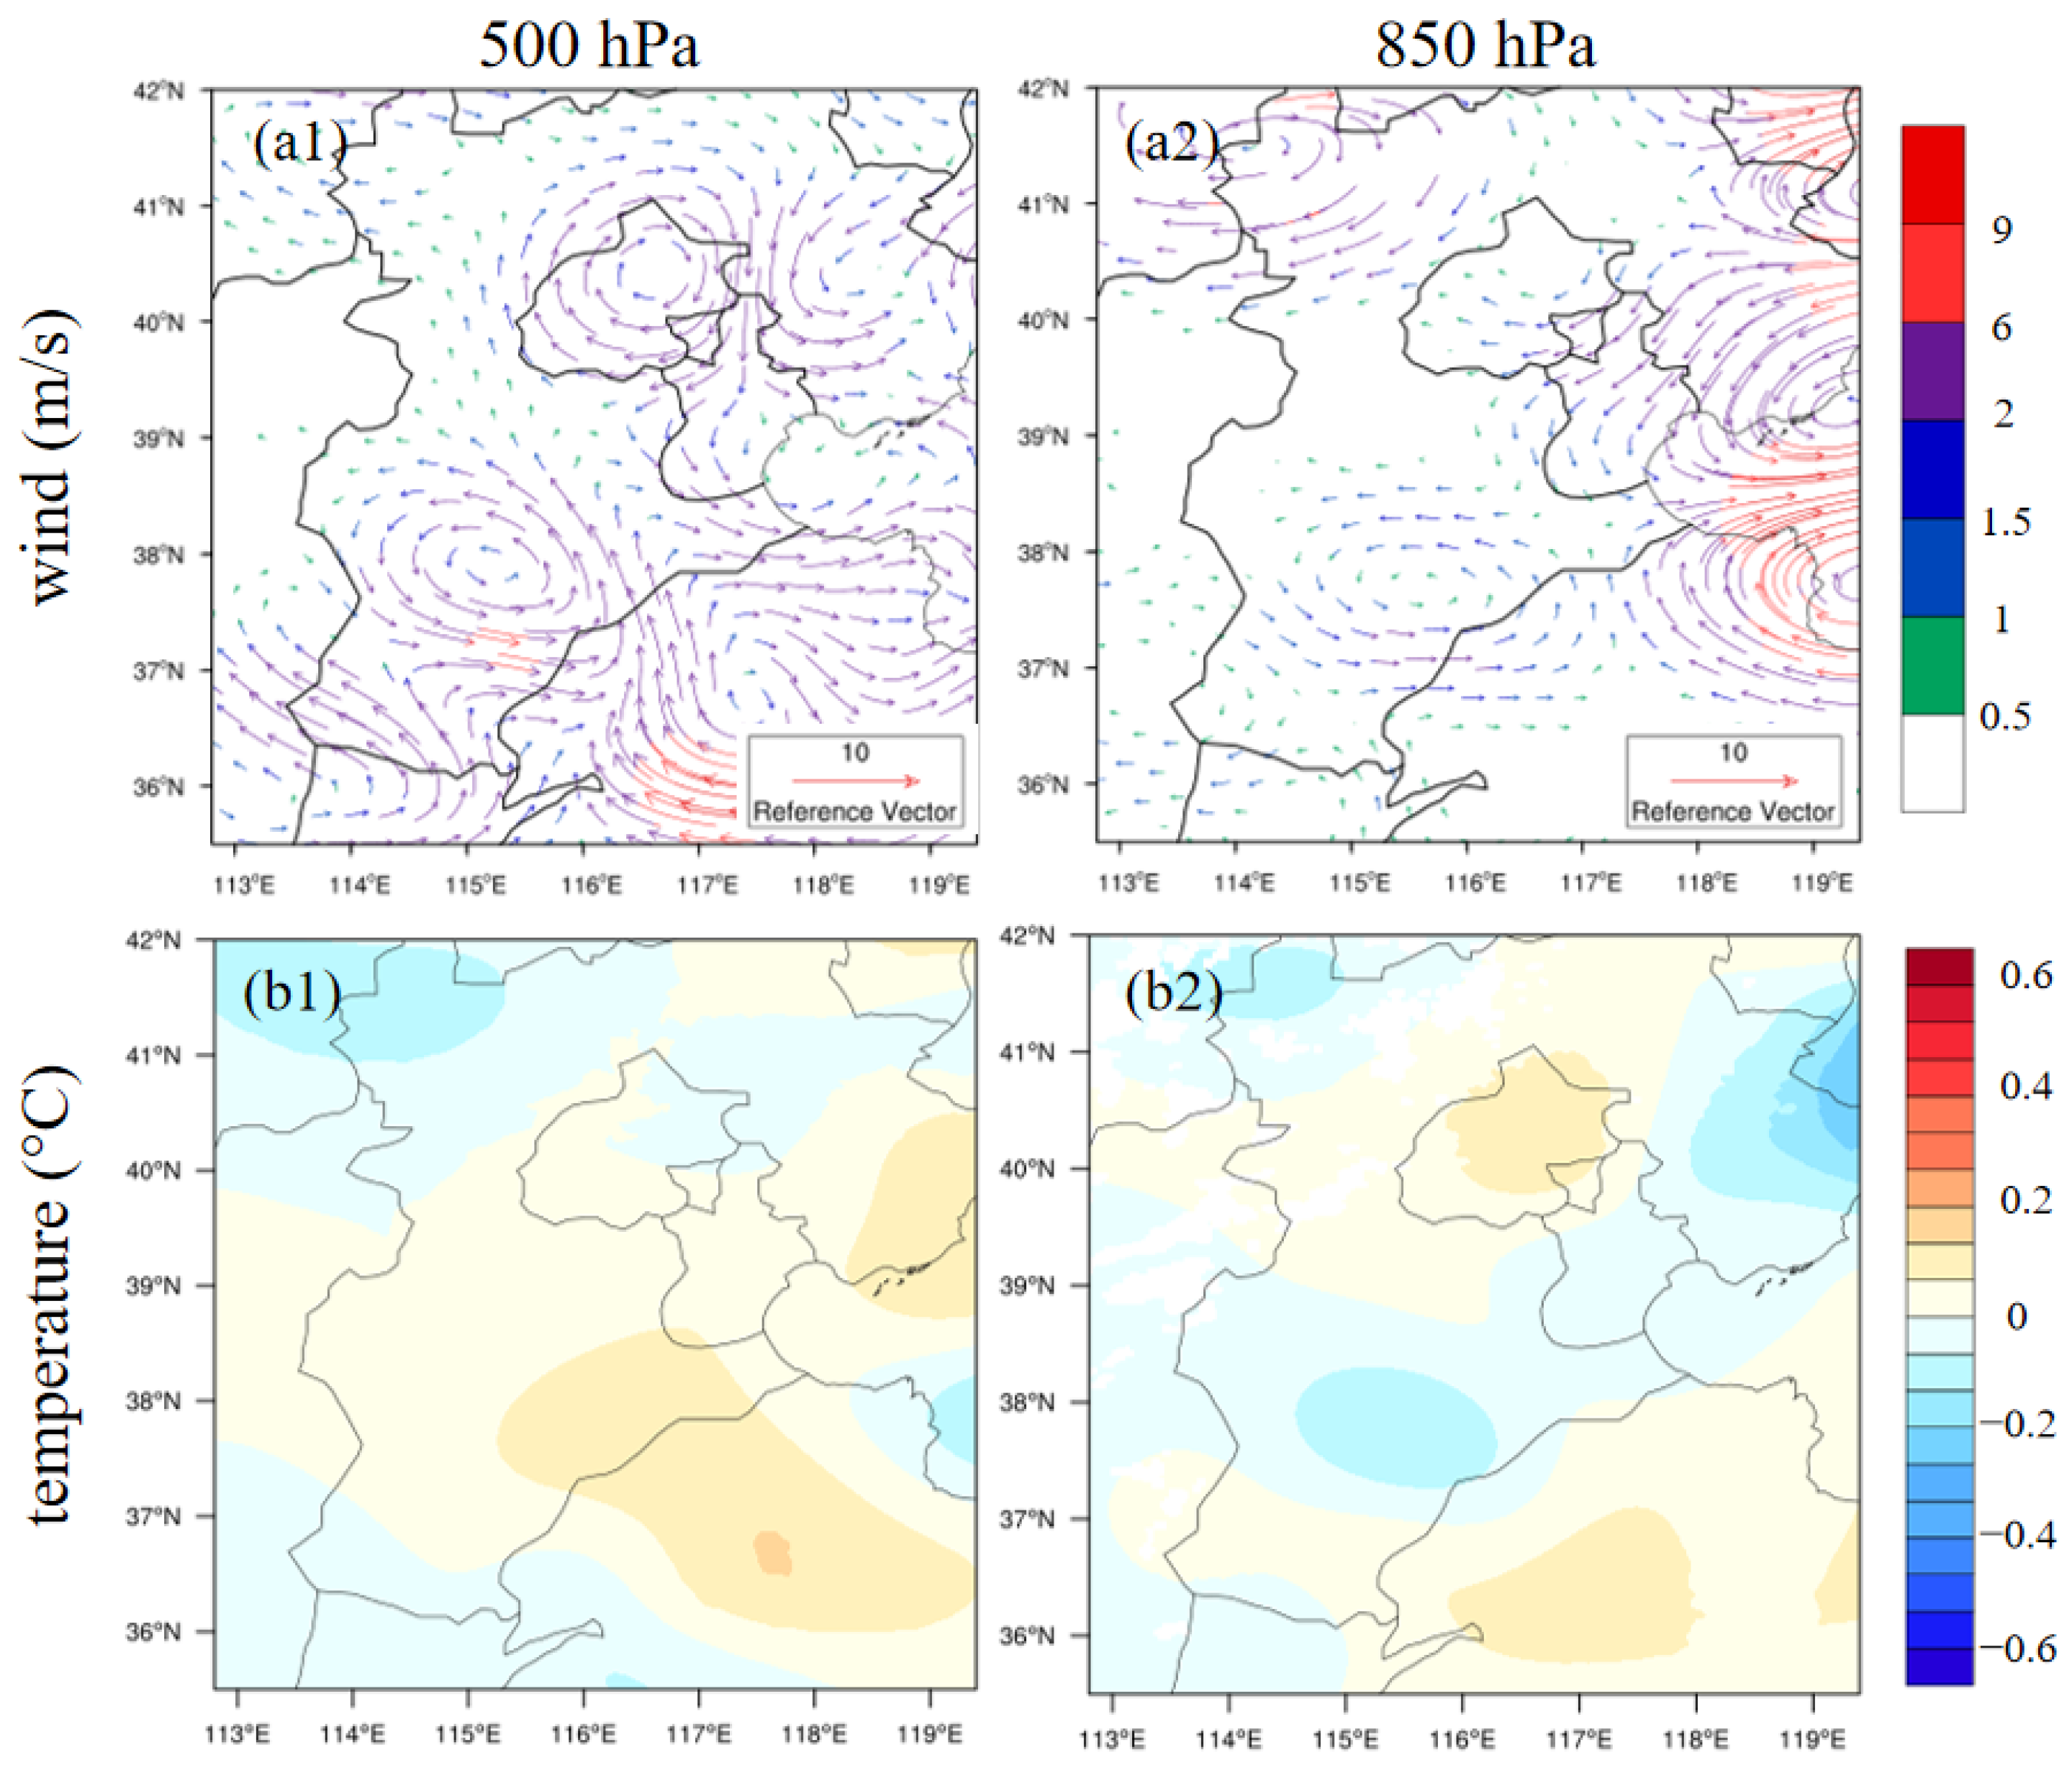
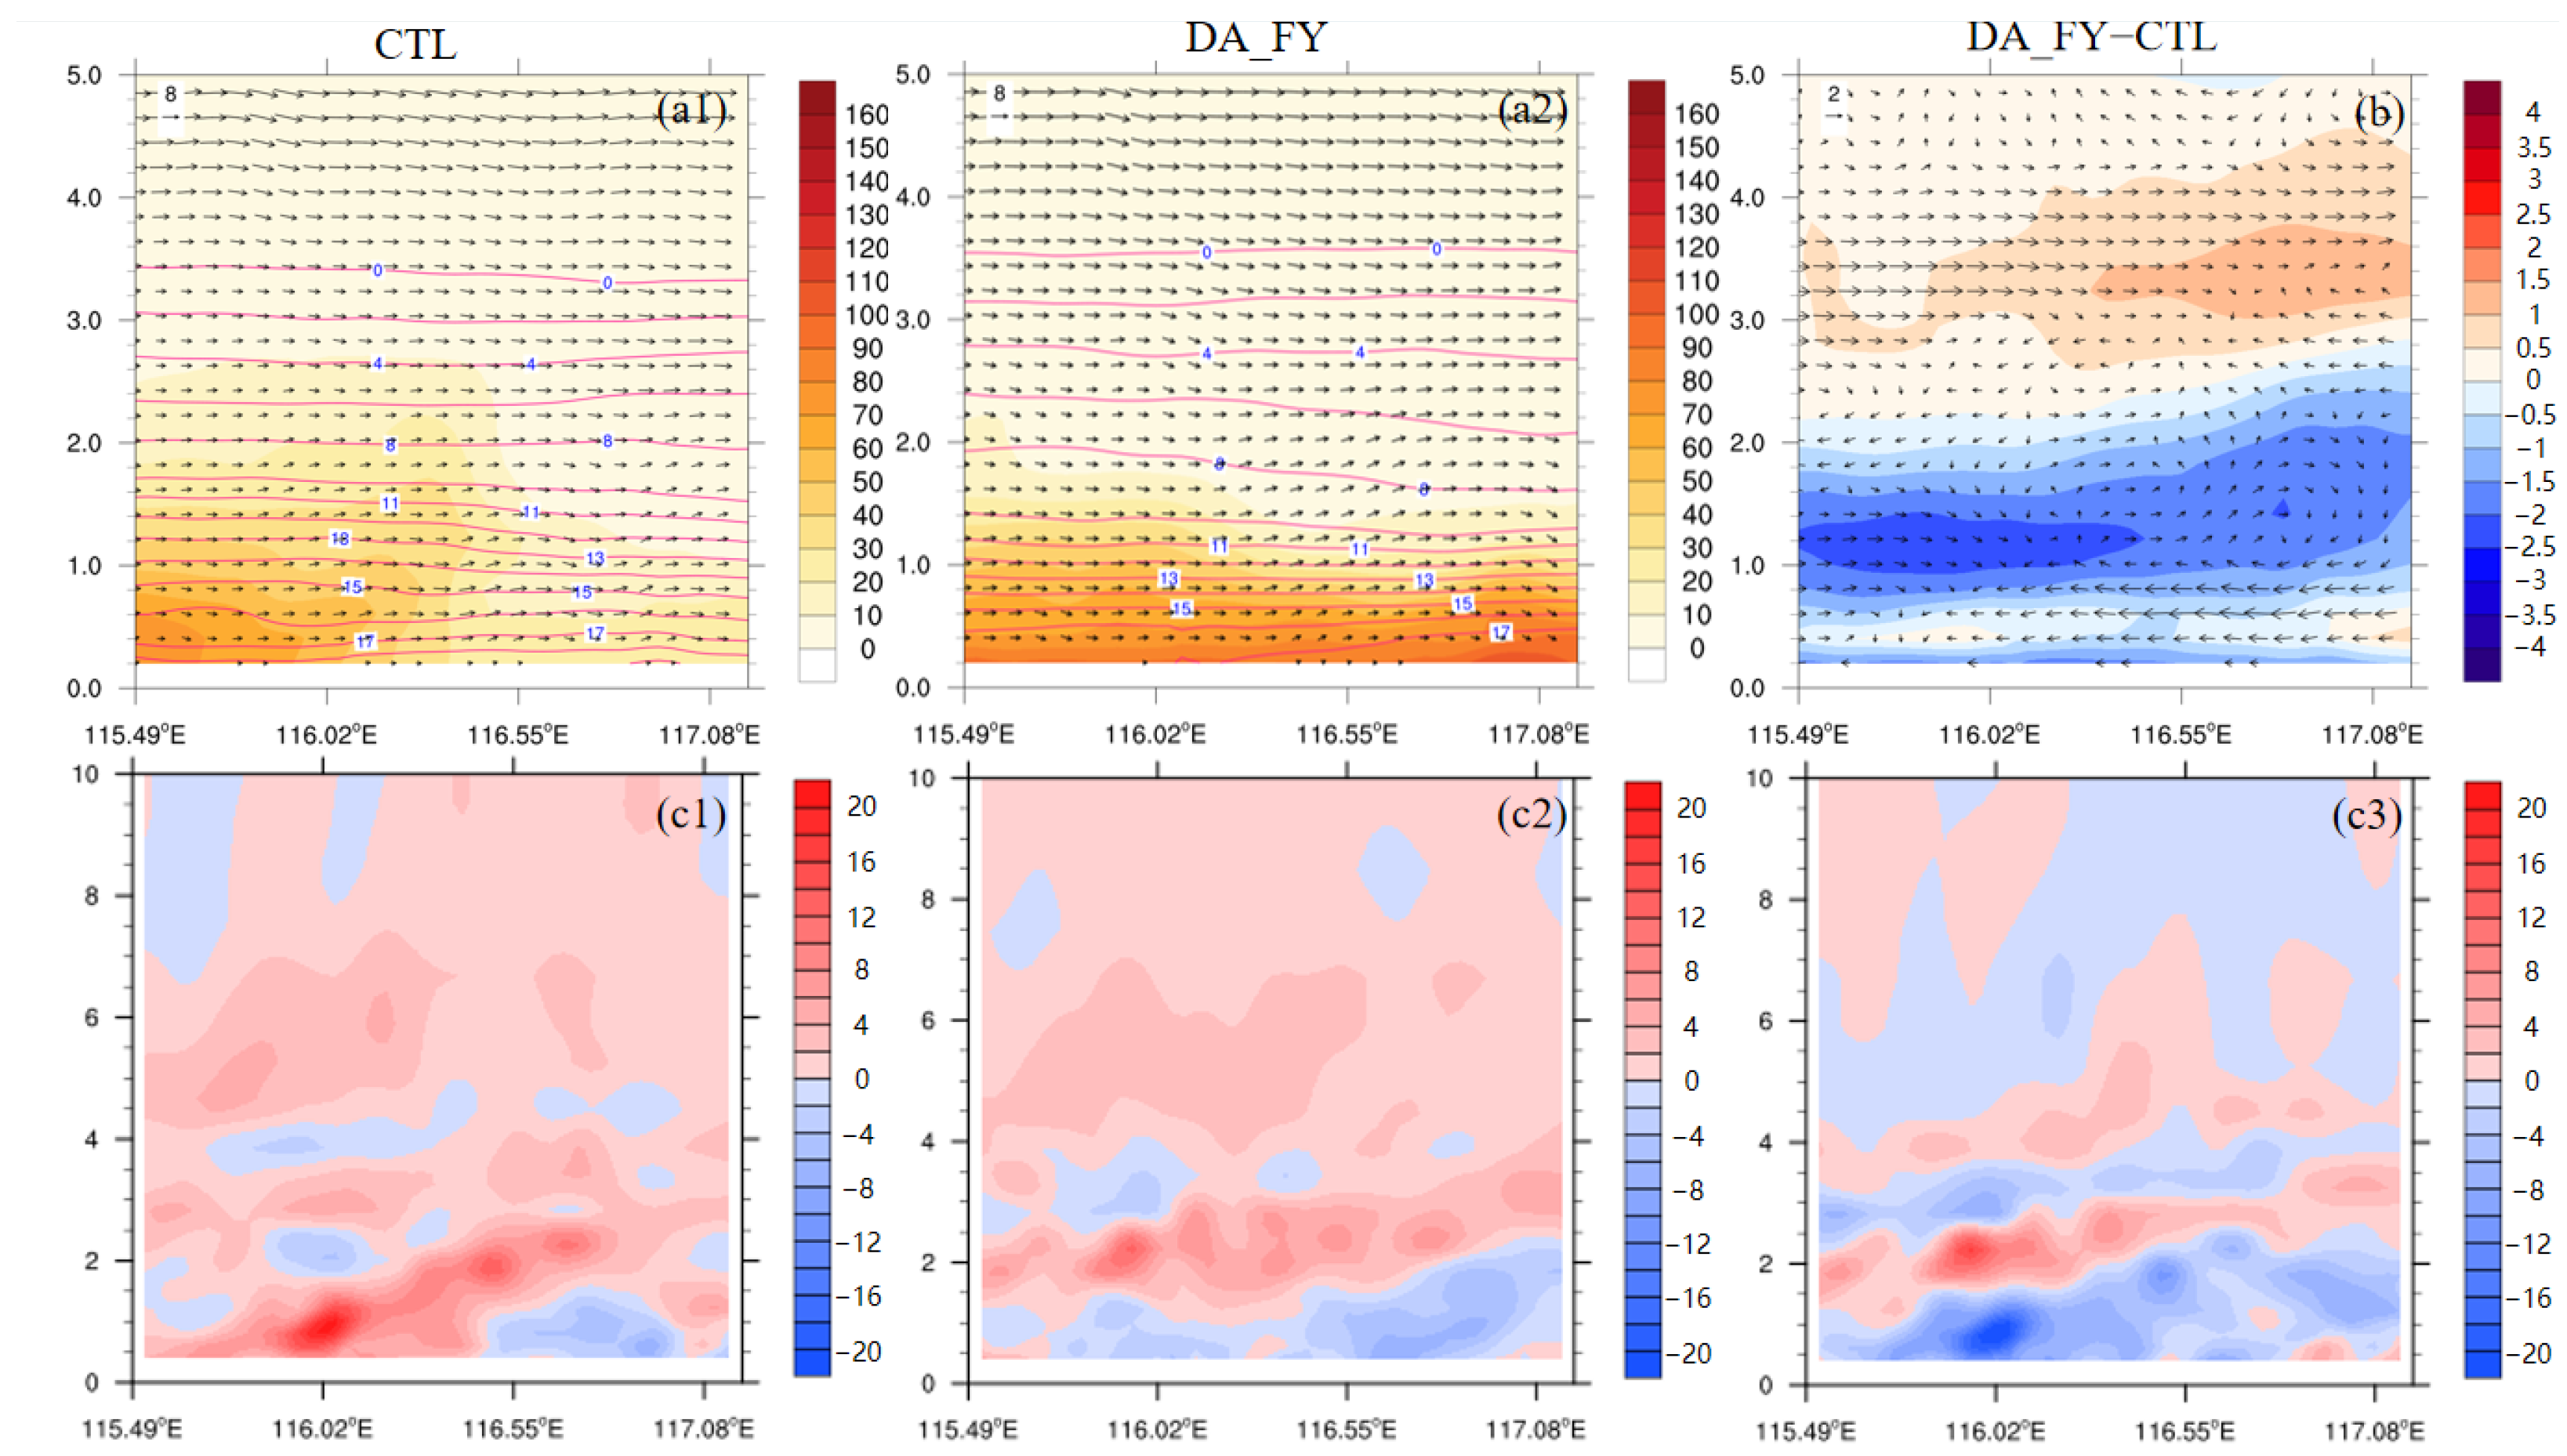
4.2. Effect of Assimilation on the Initial Wind Field
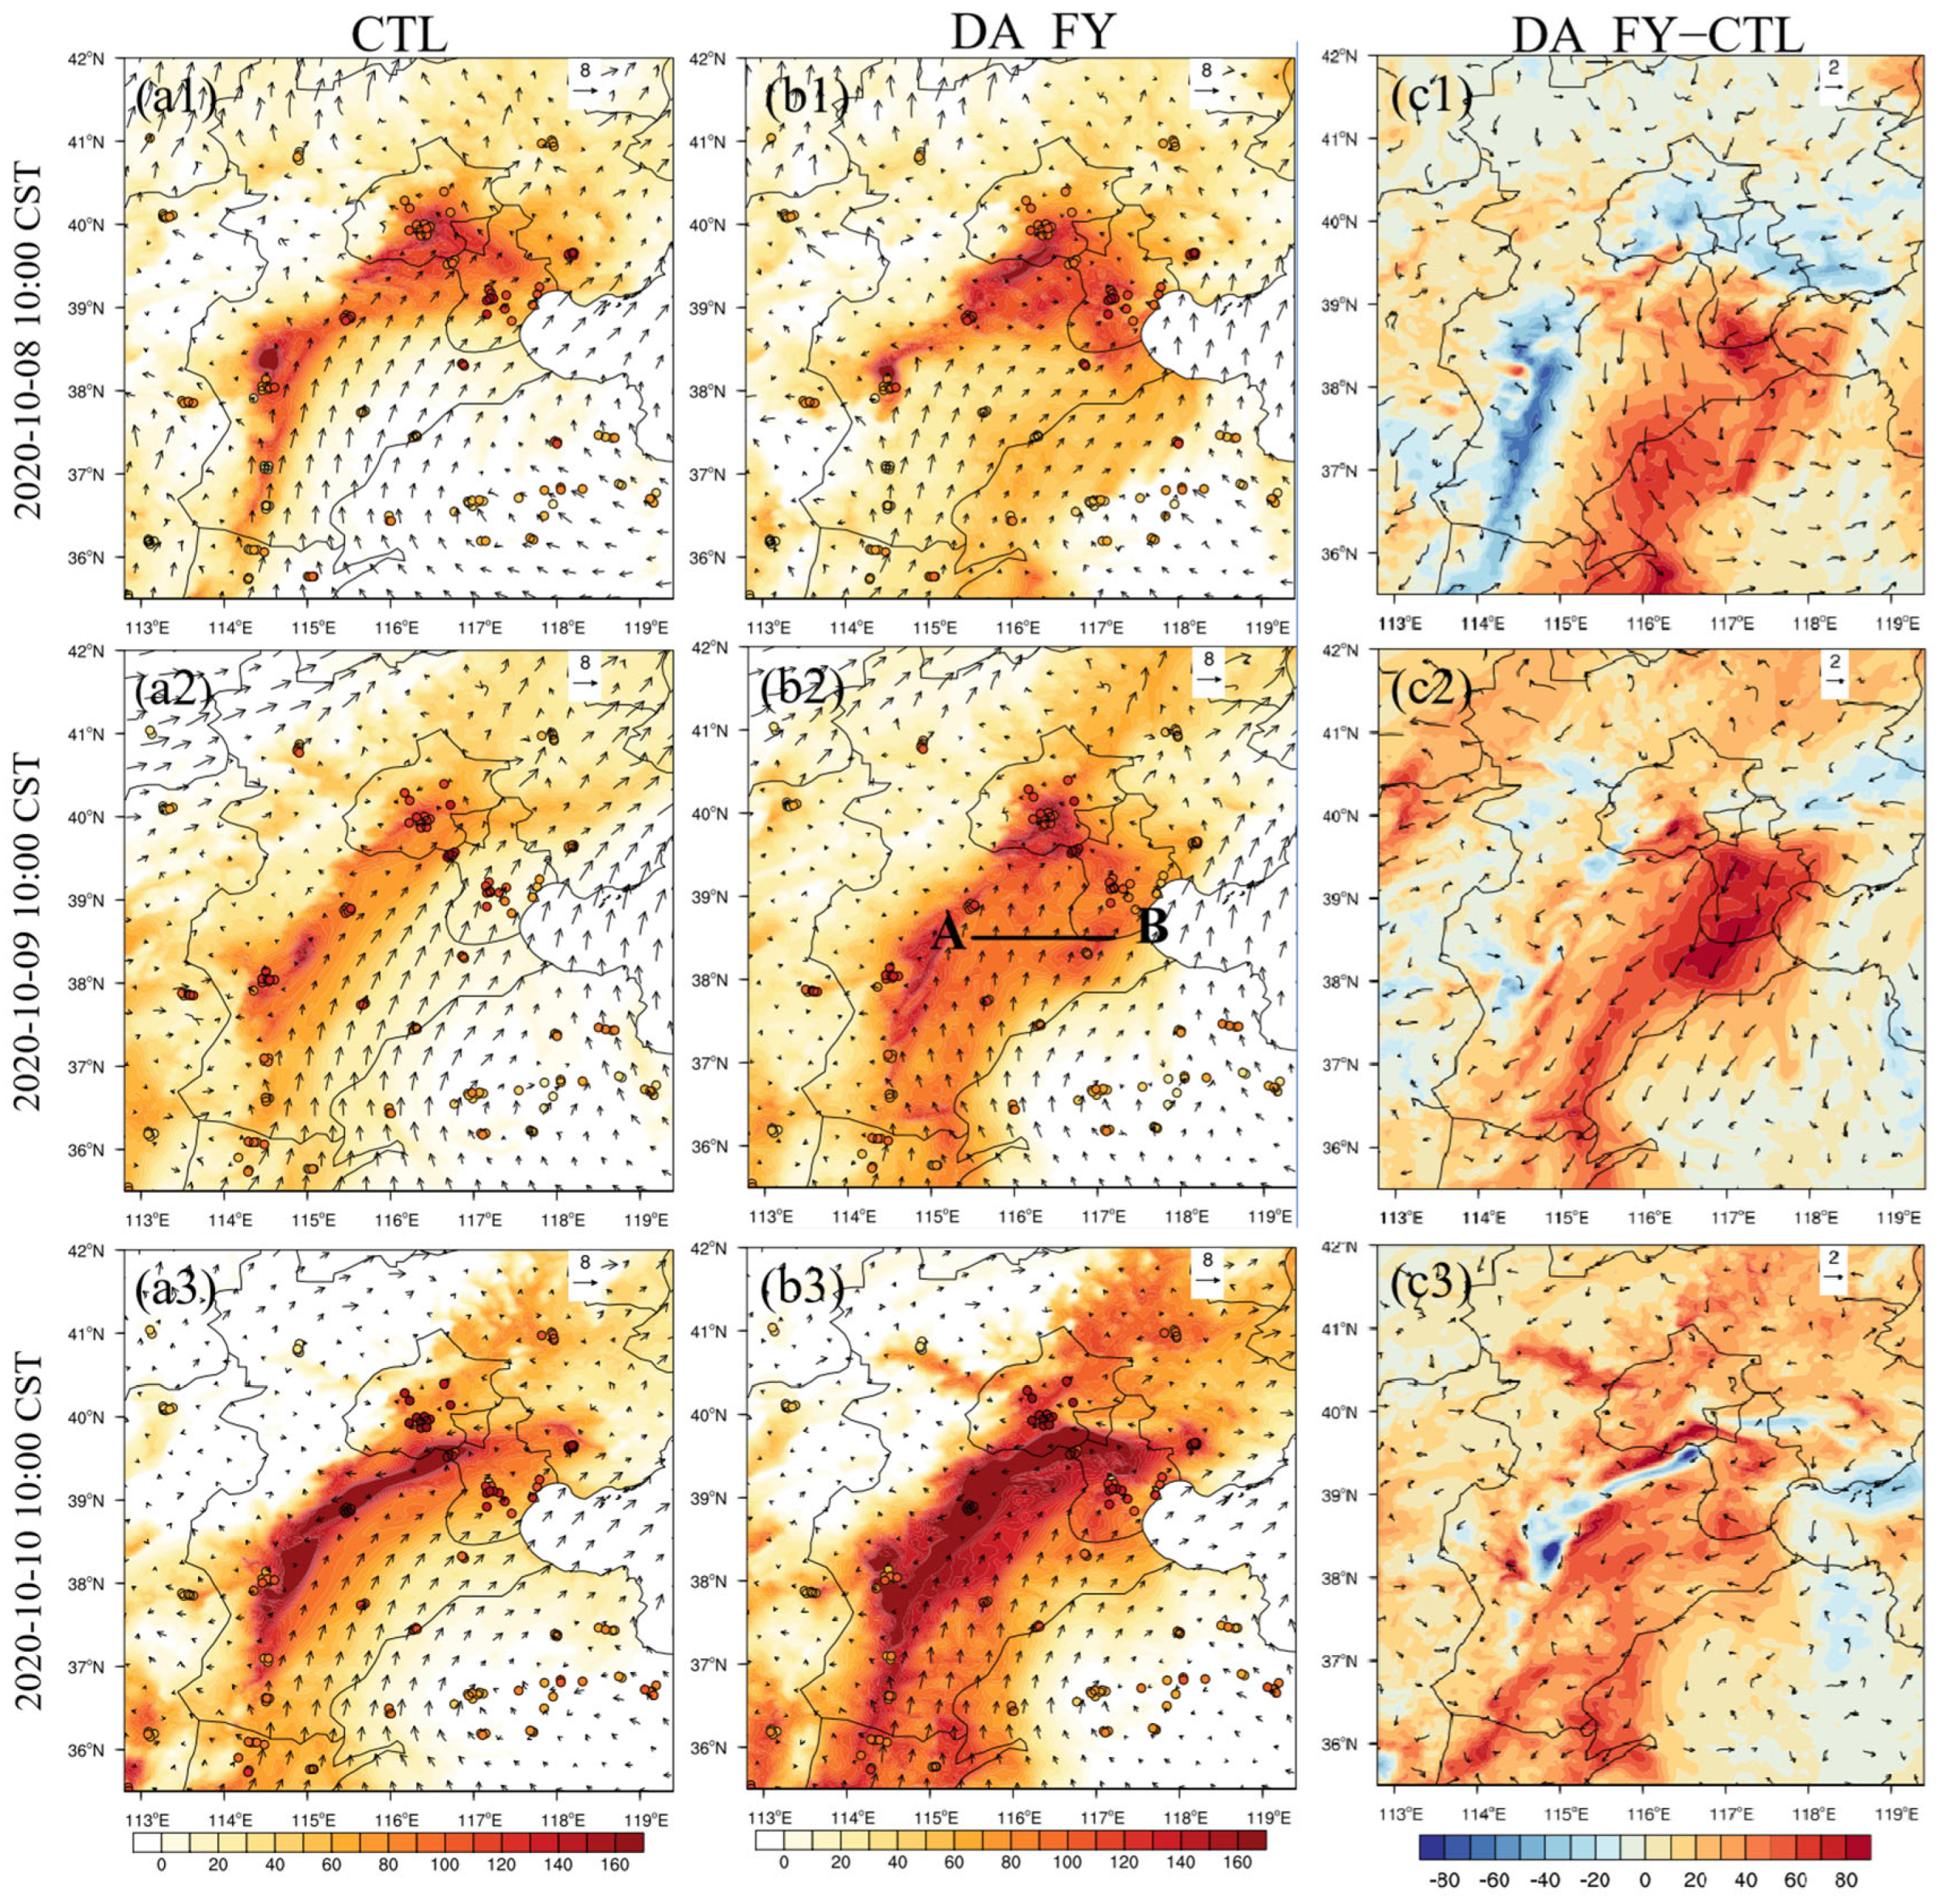
4.3. Spatial Variation Characteristics of PM2.5
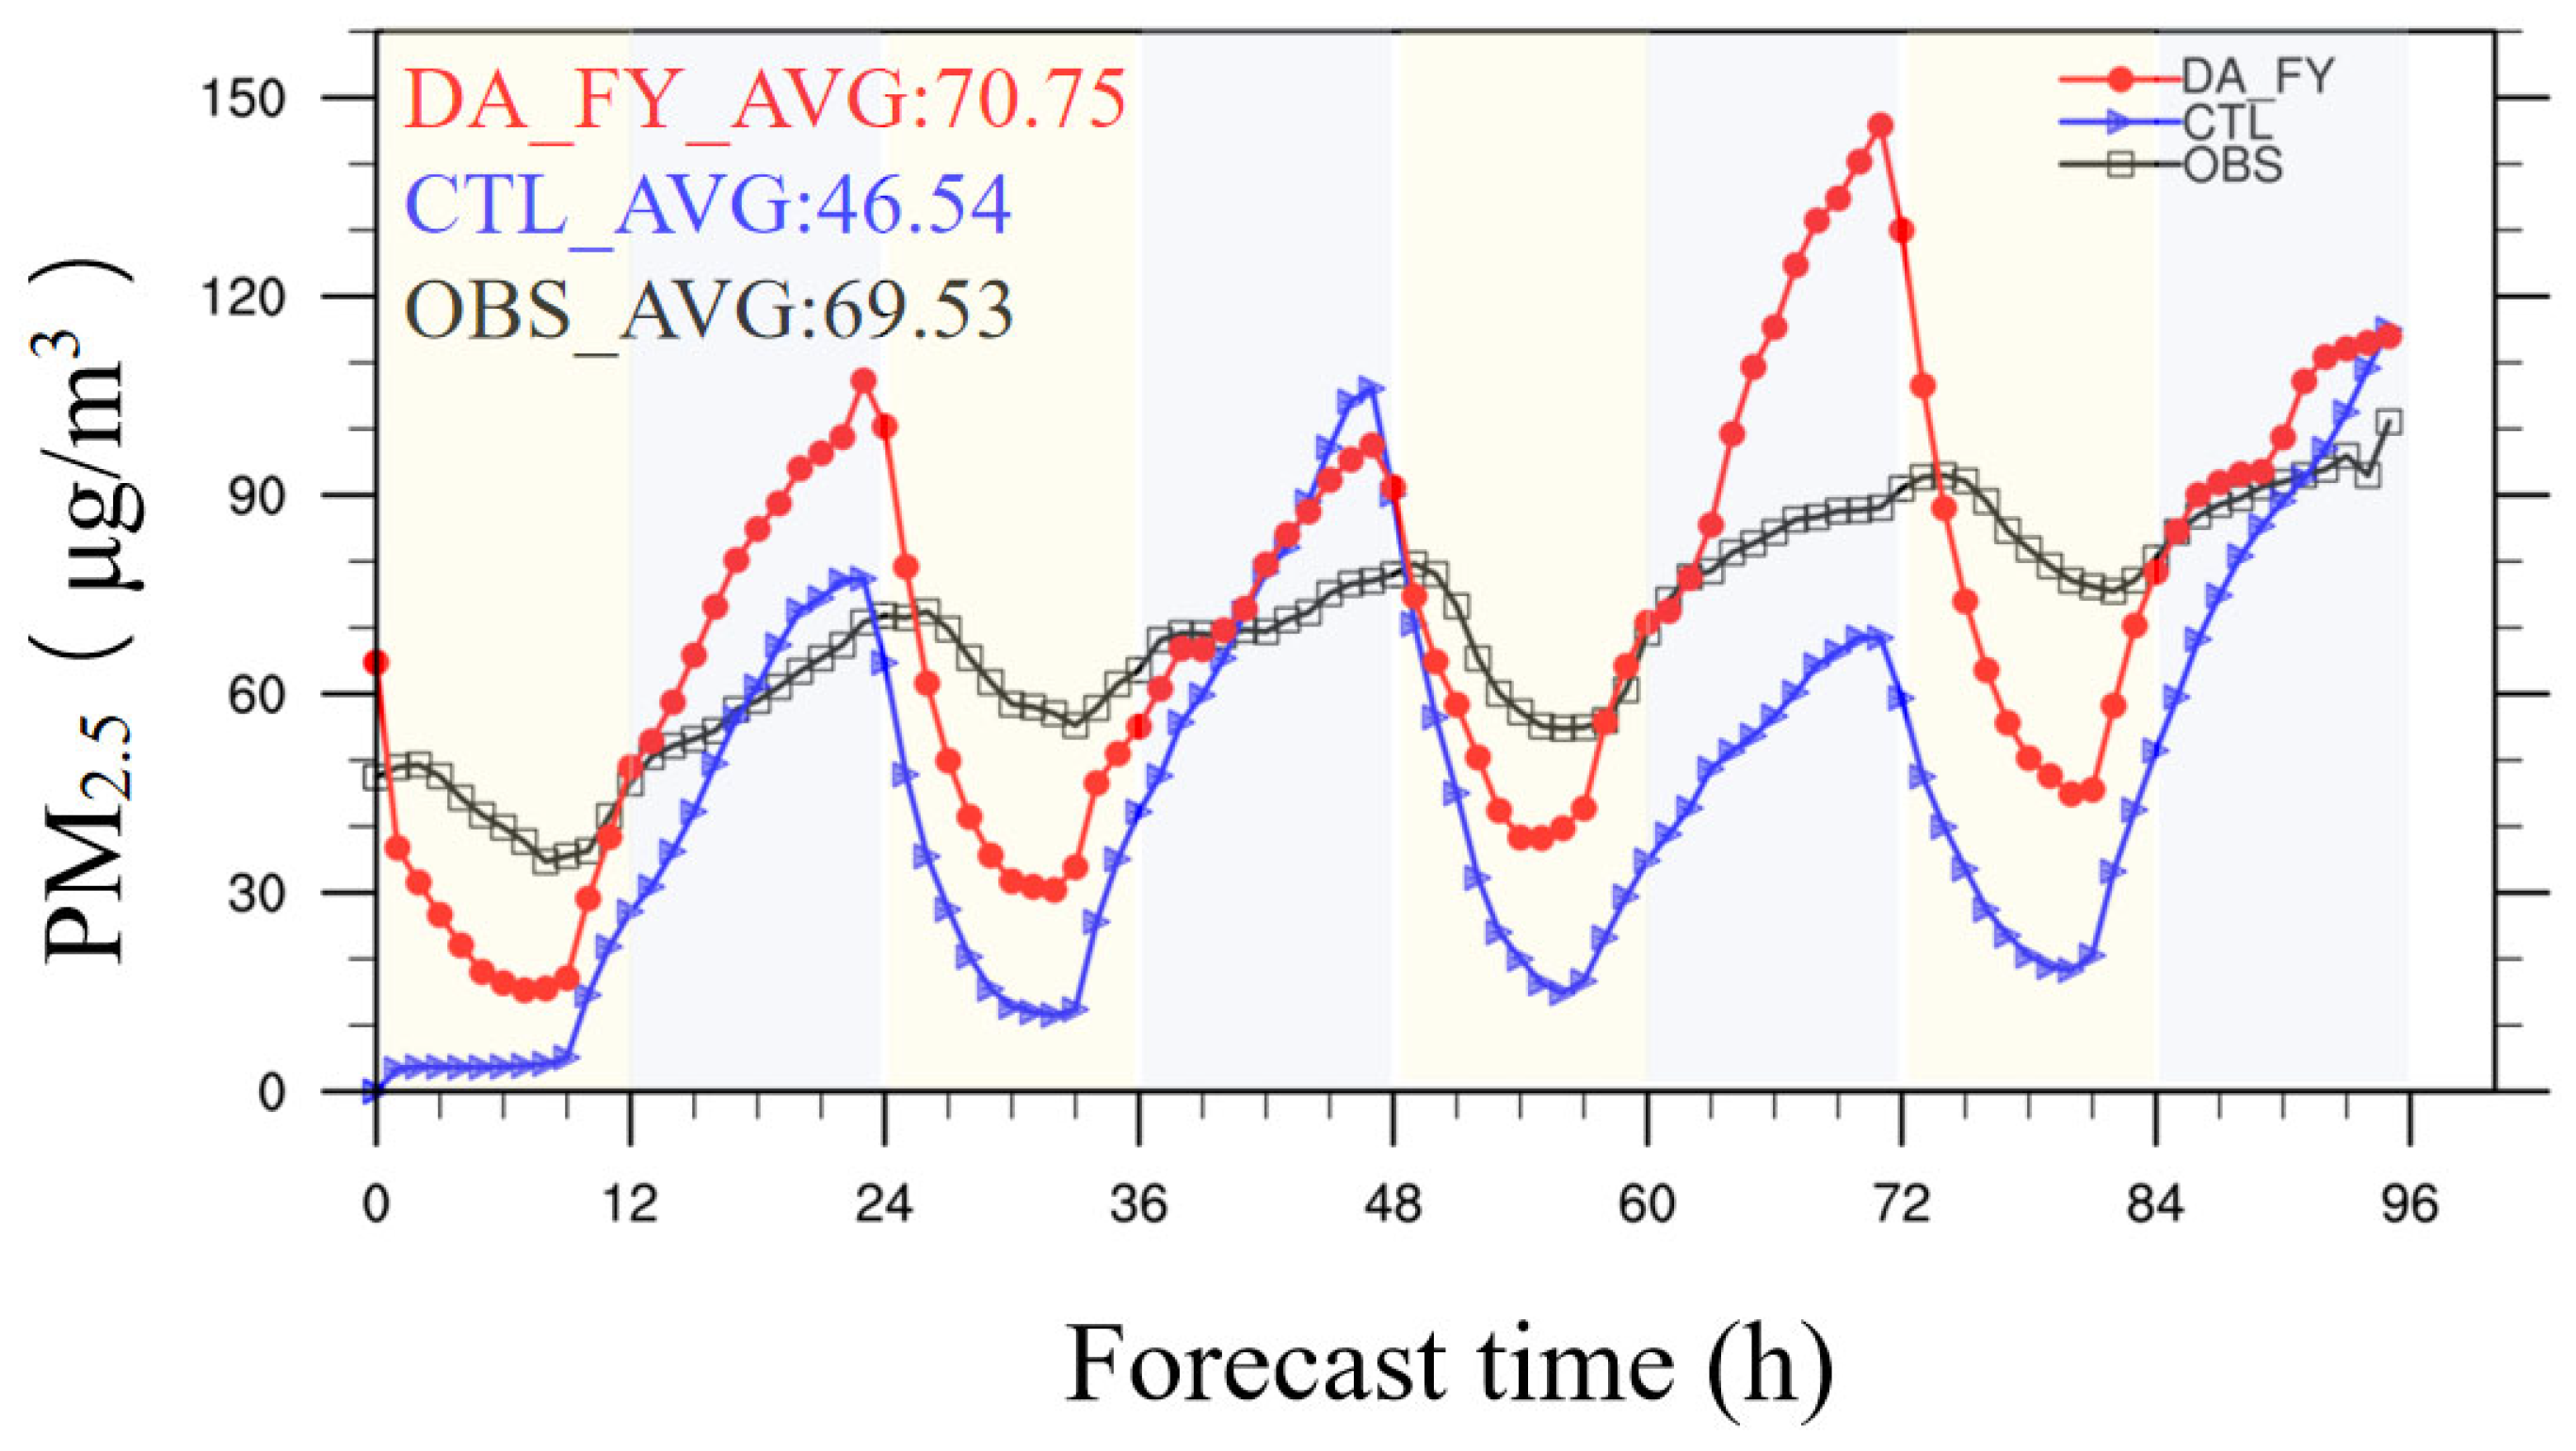
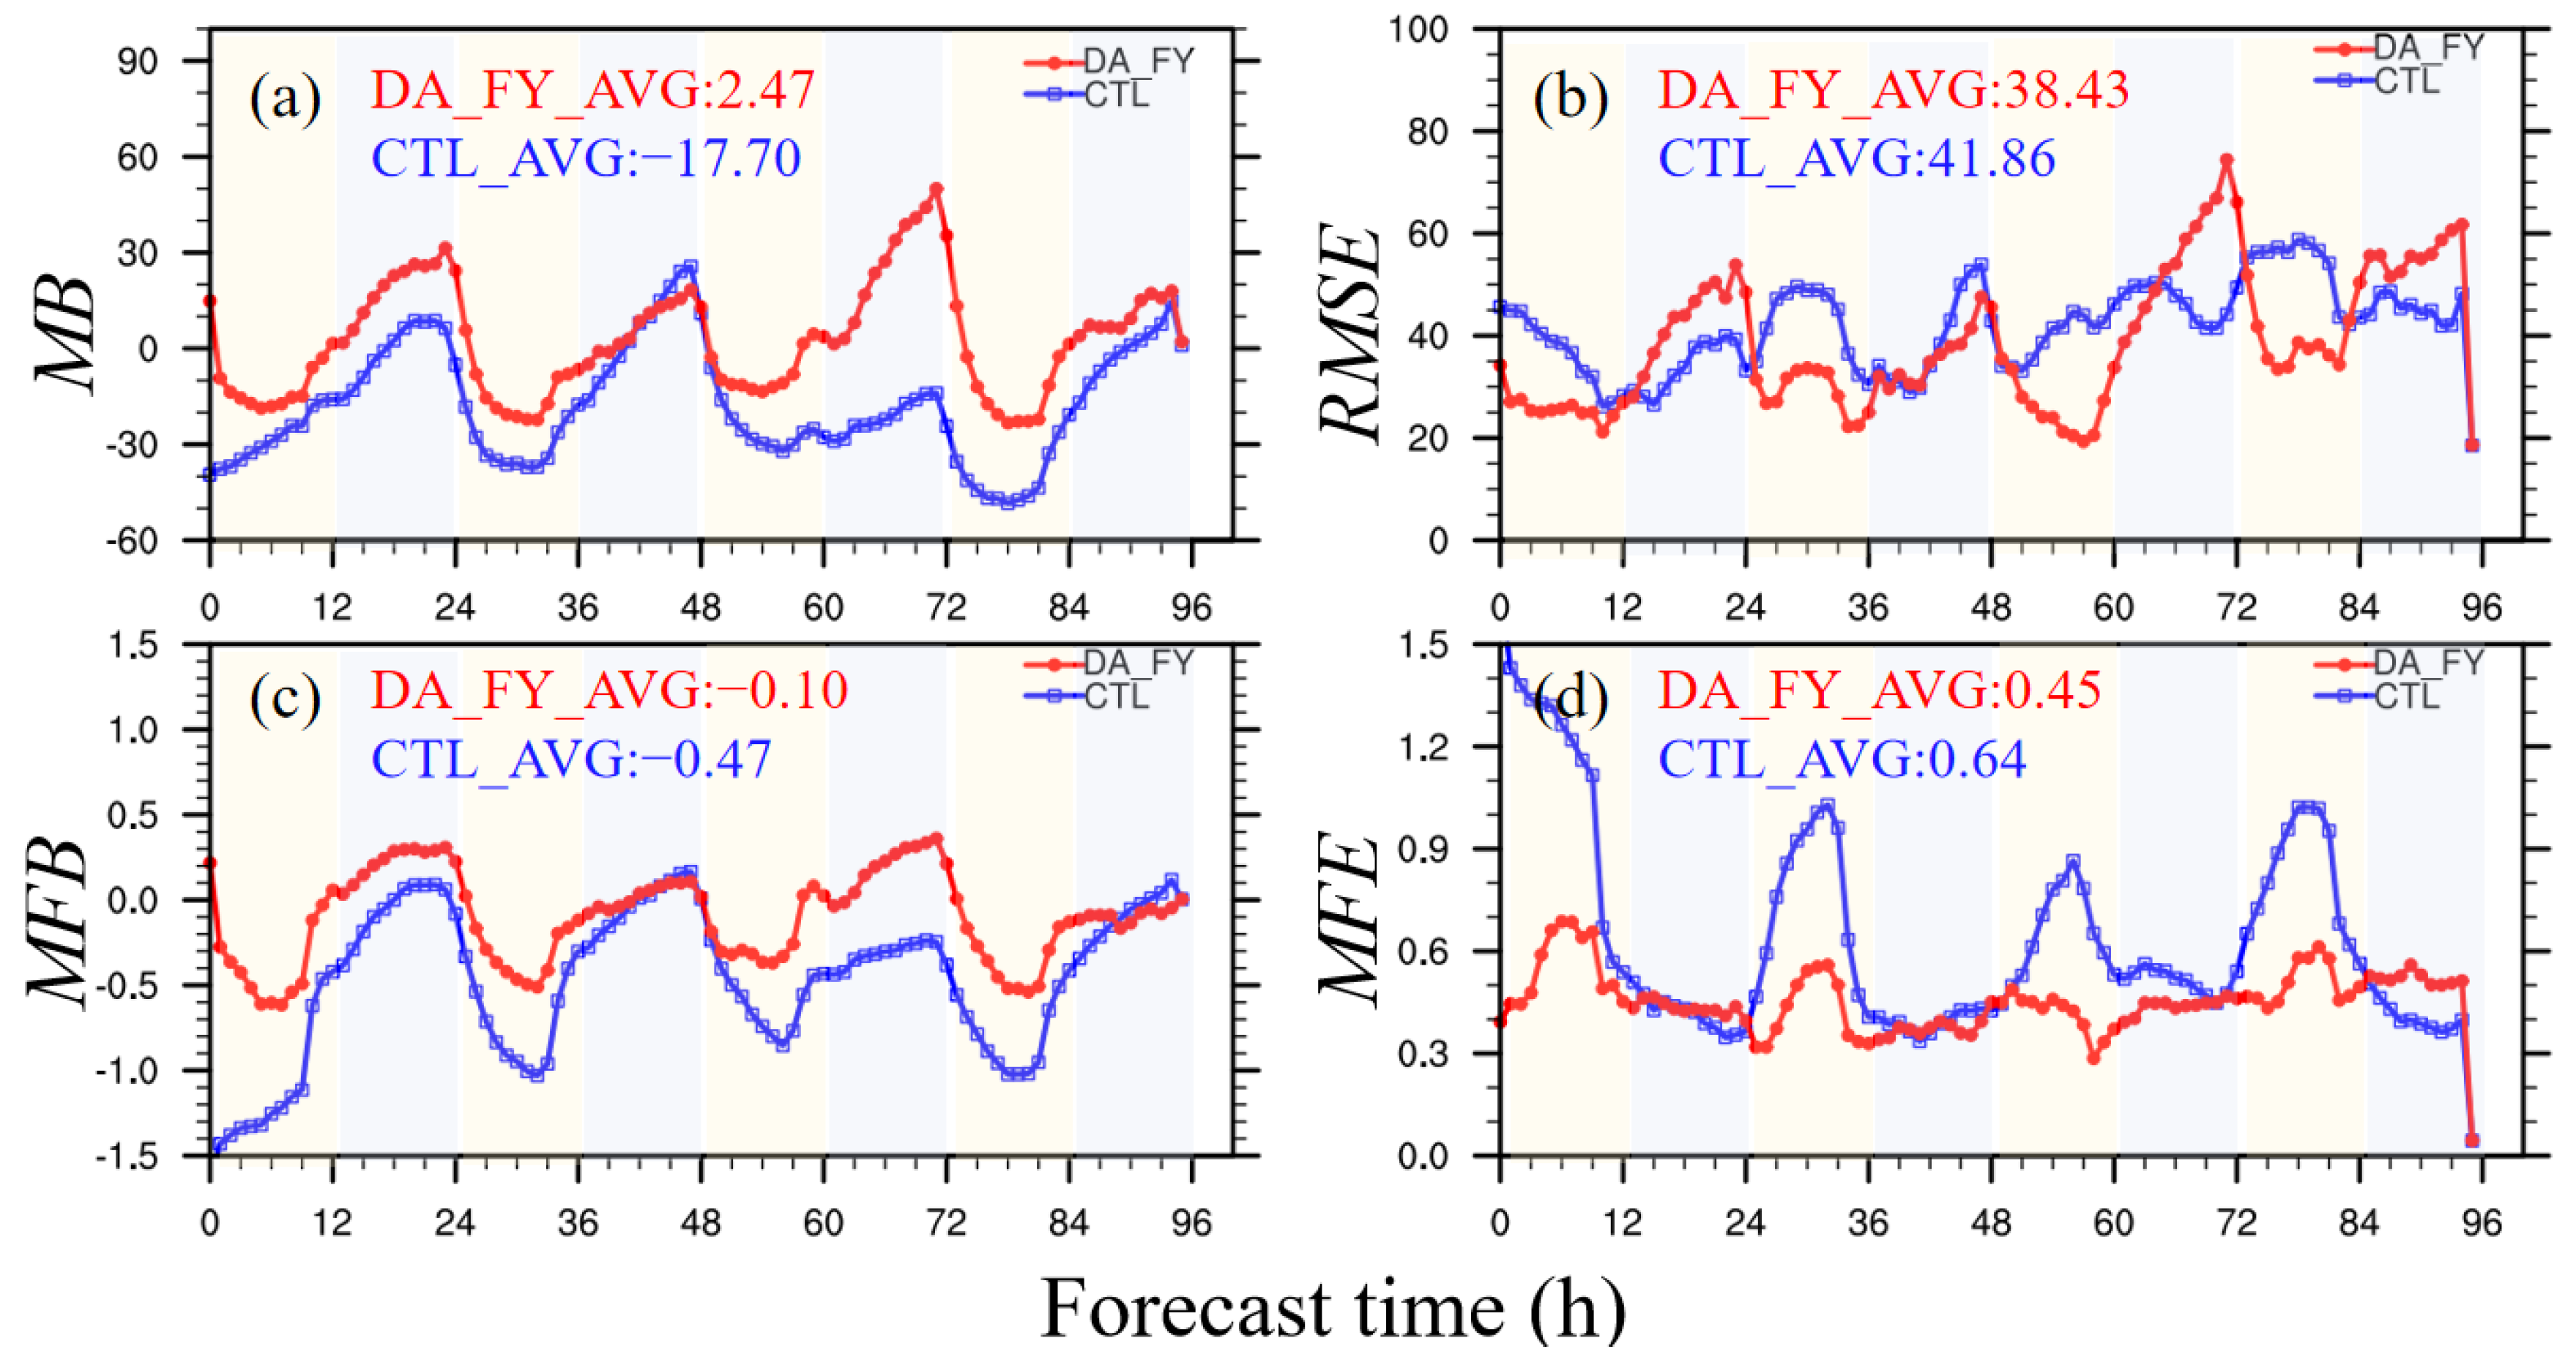
4.4. Temporal Variation Characteristics of PM2.5
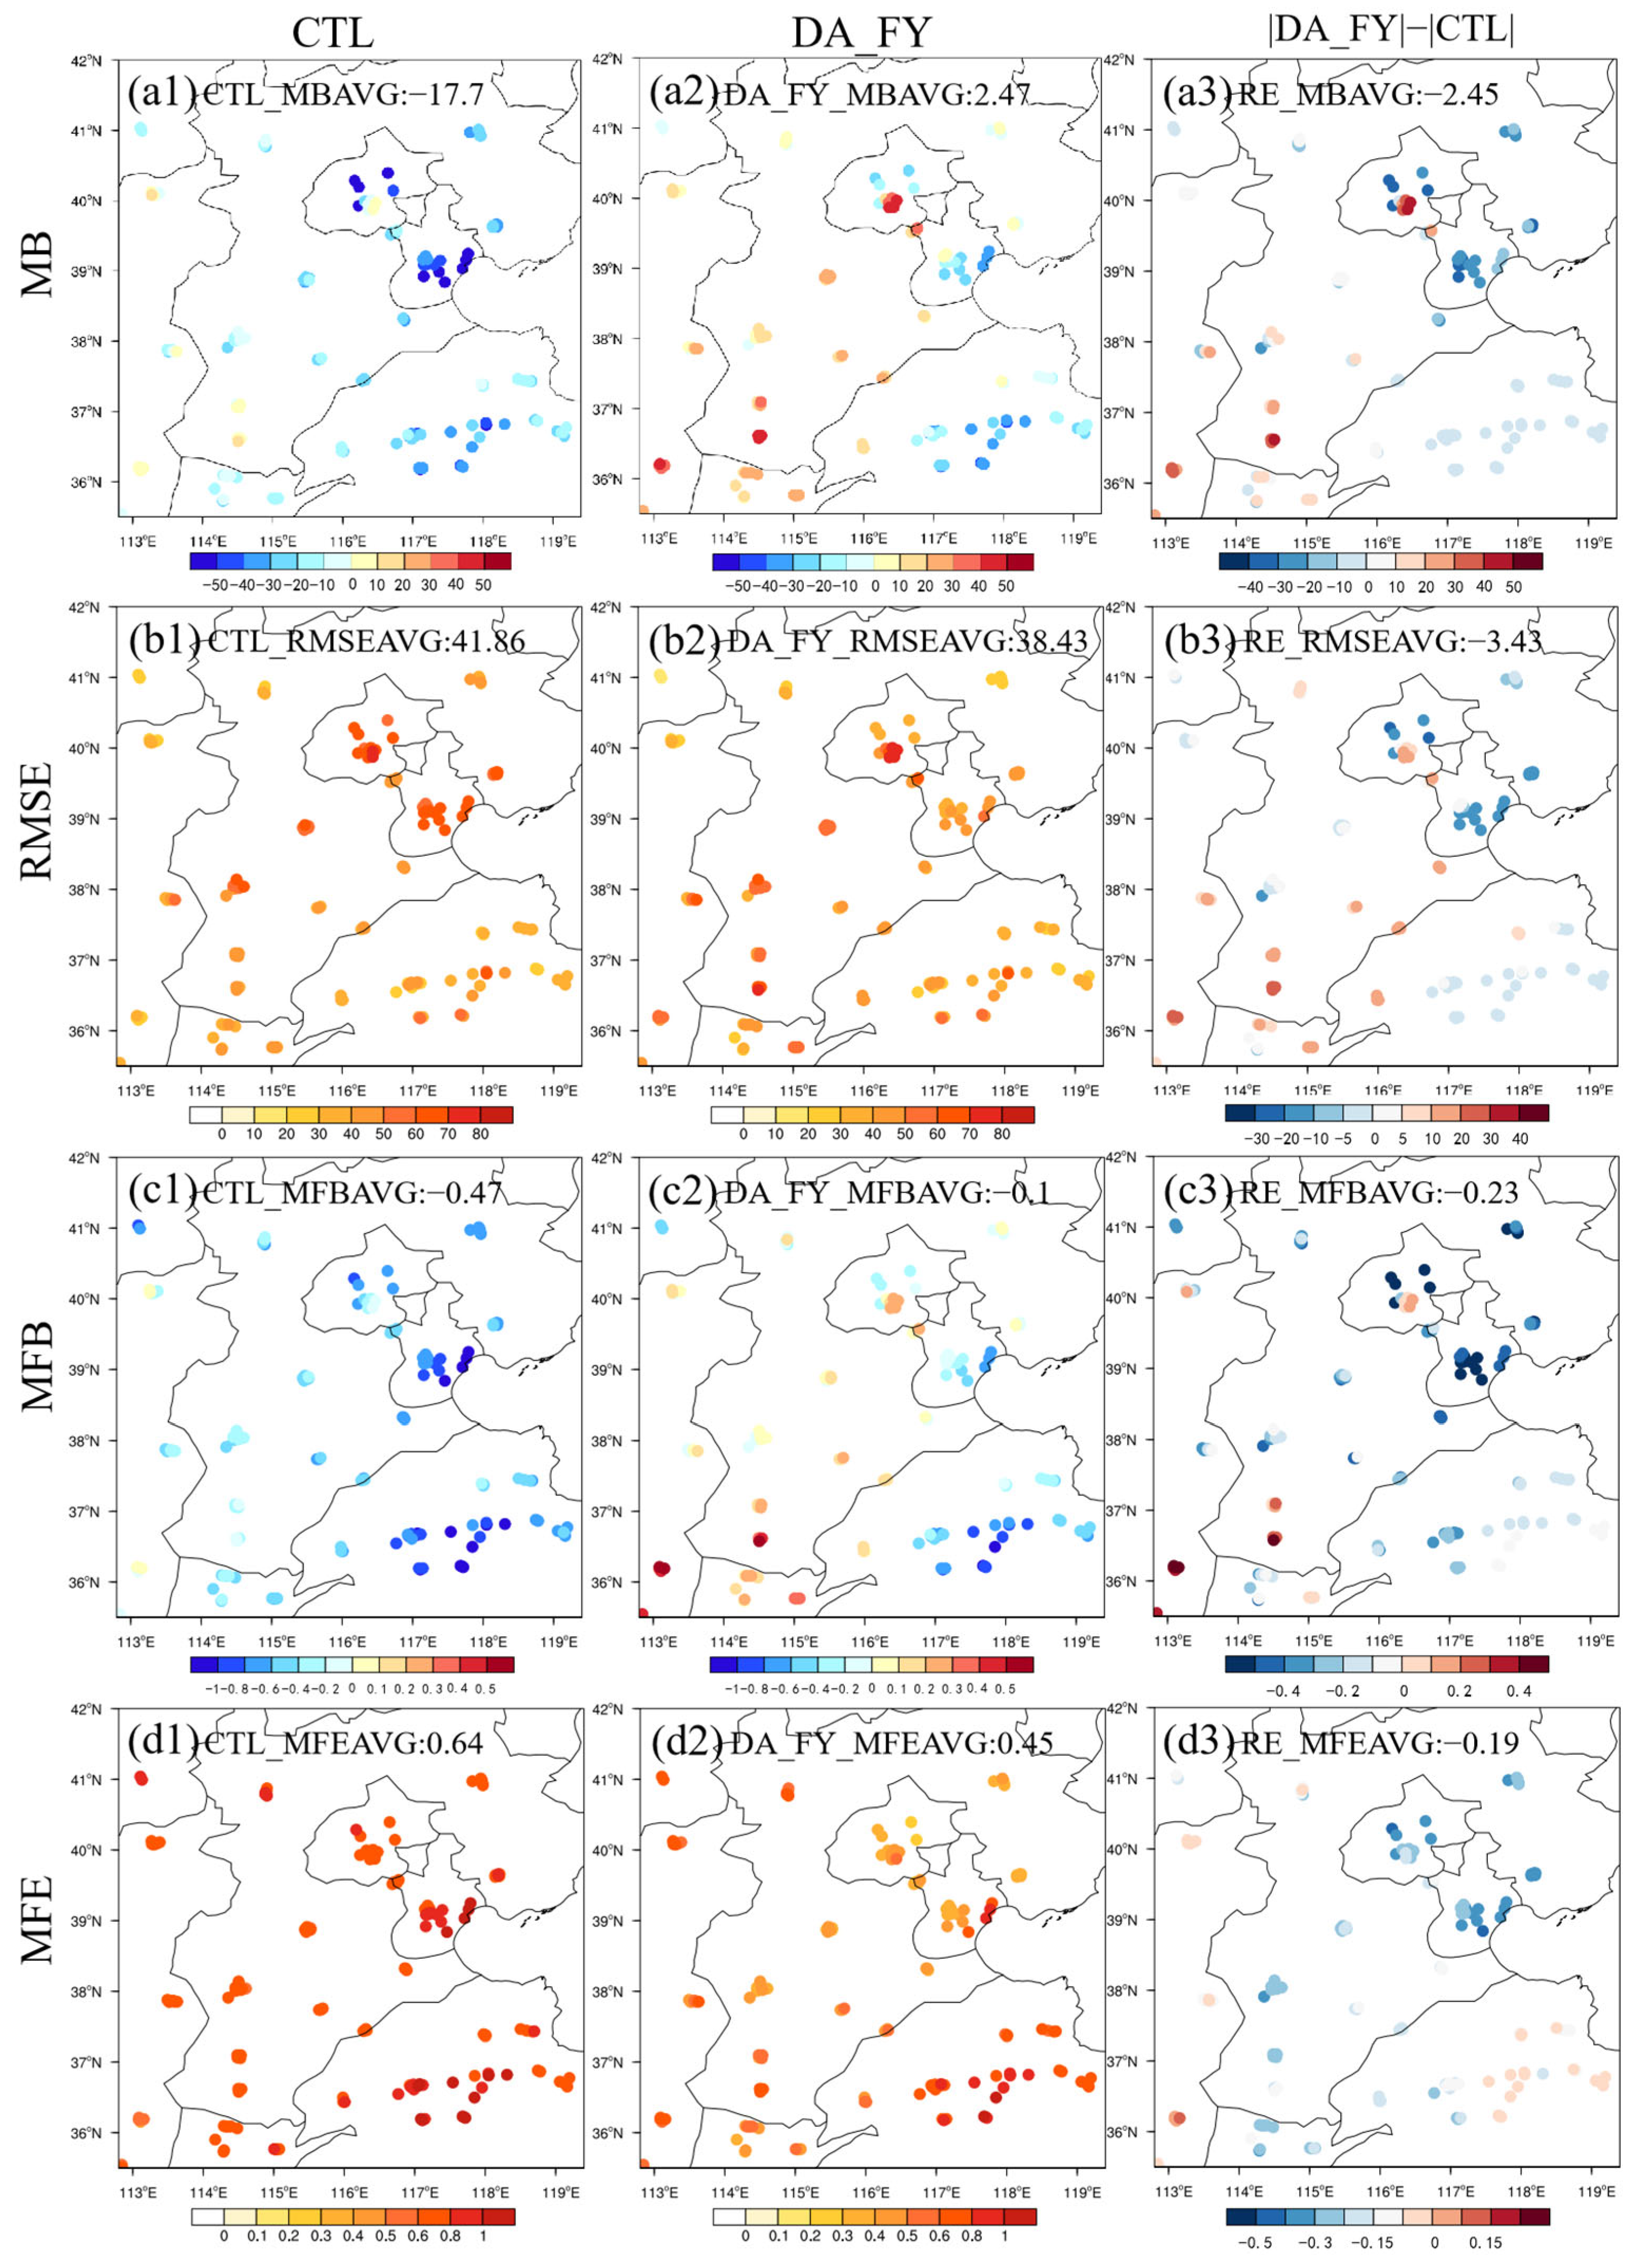
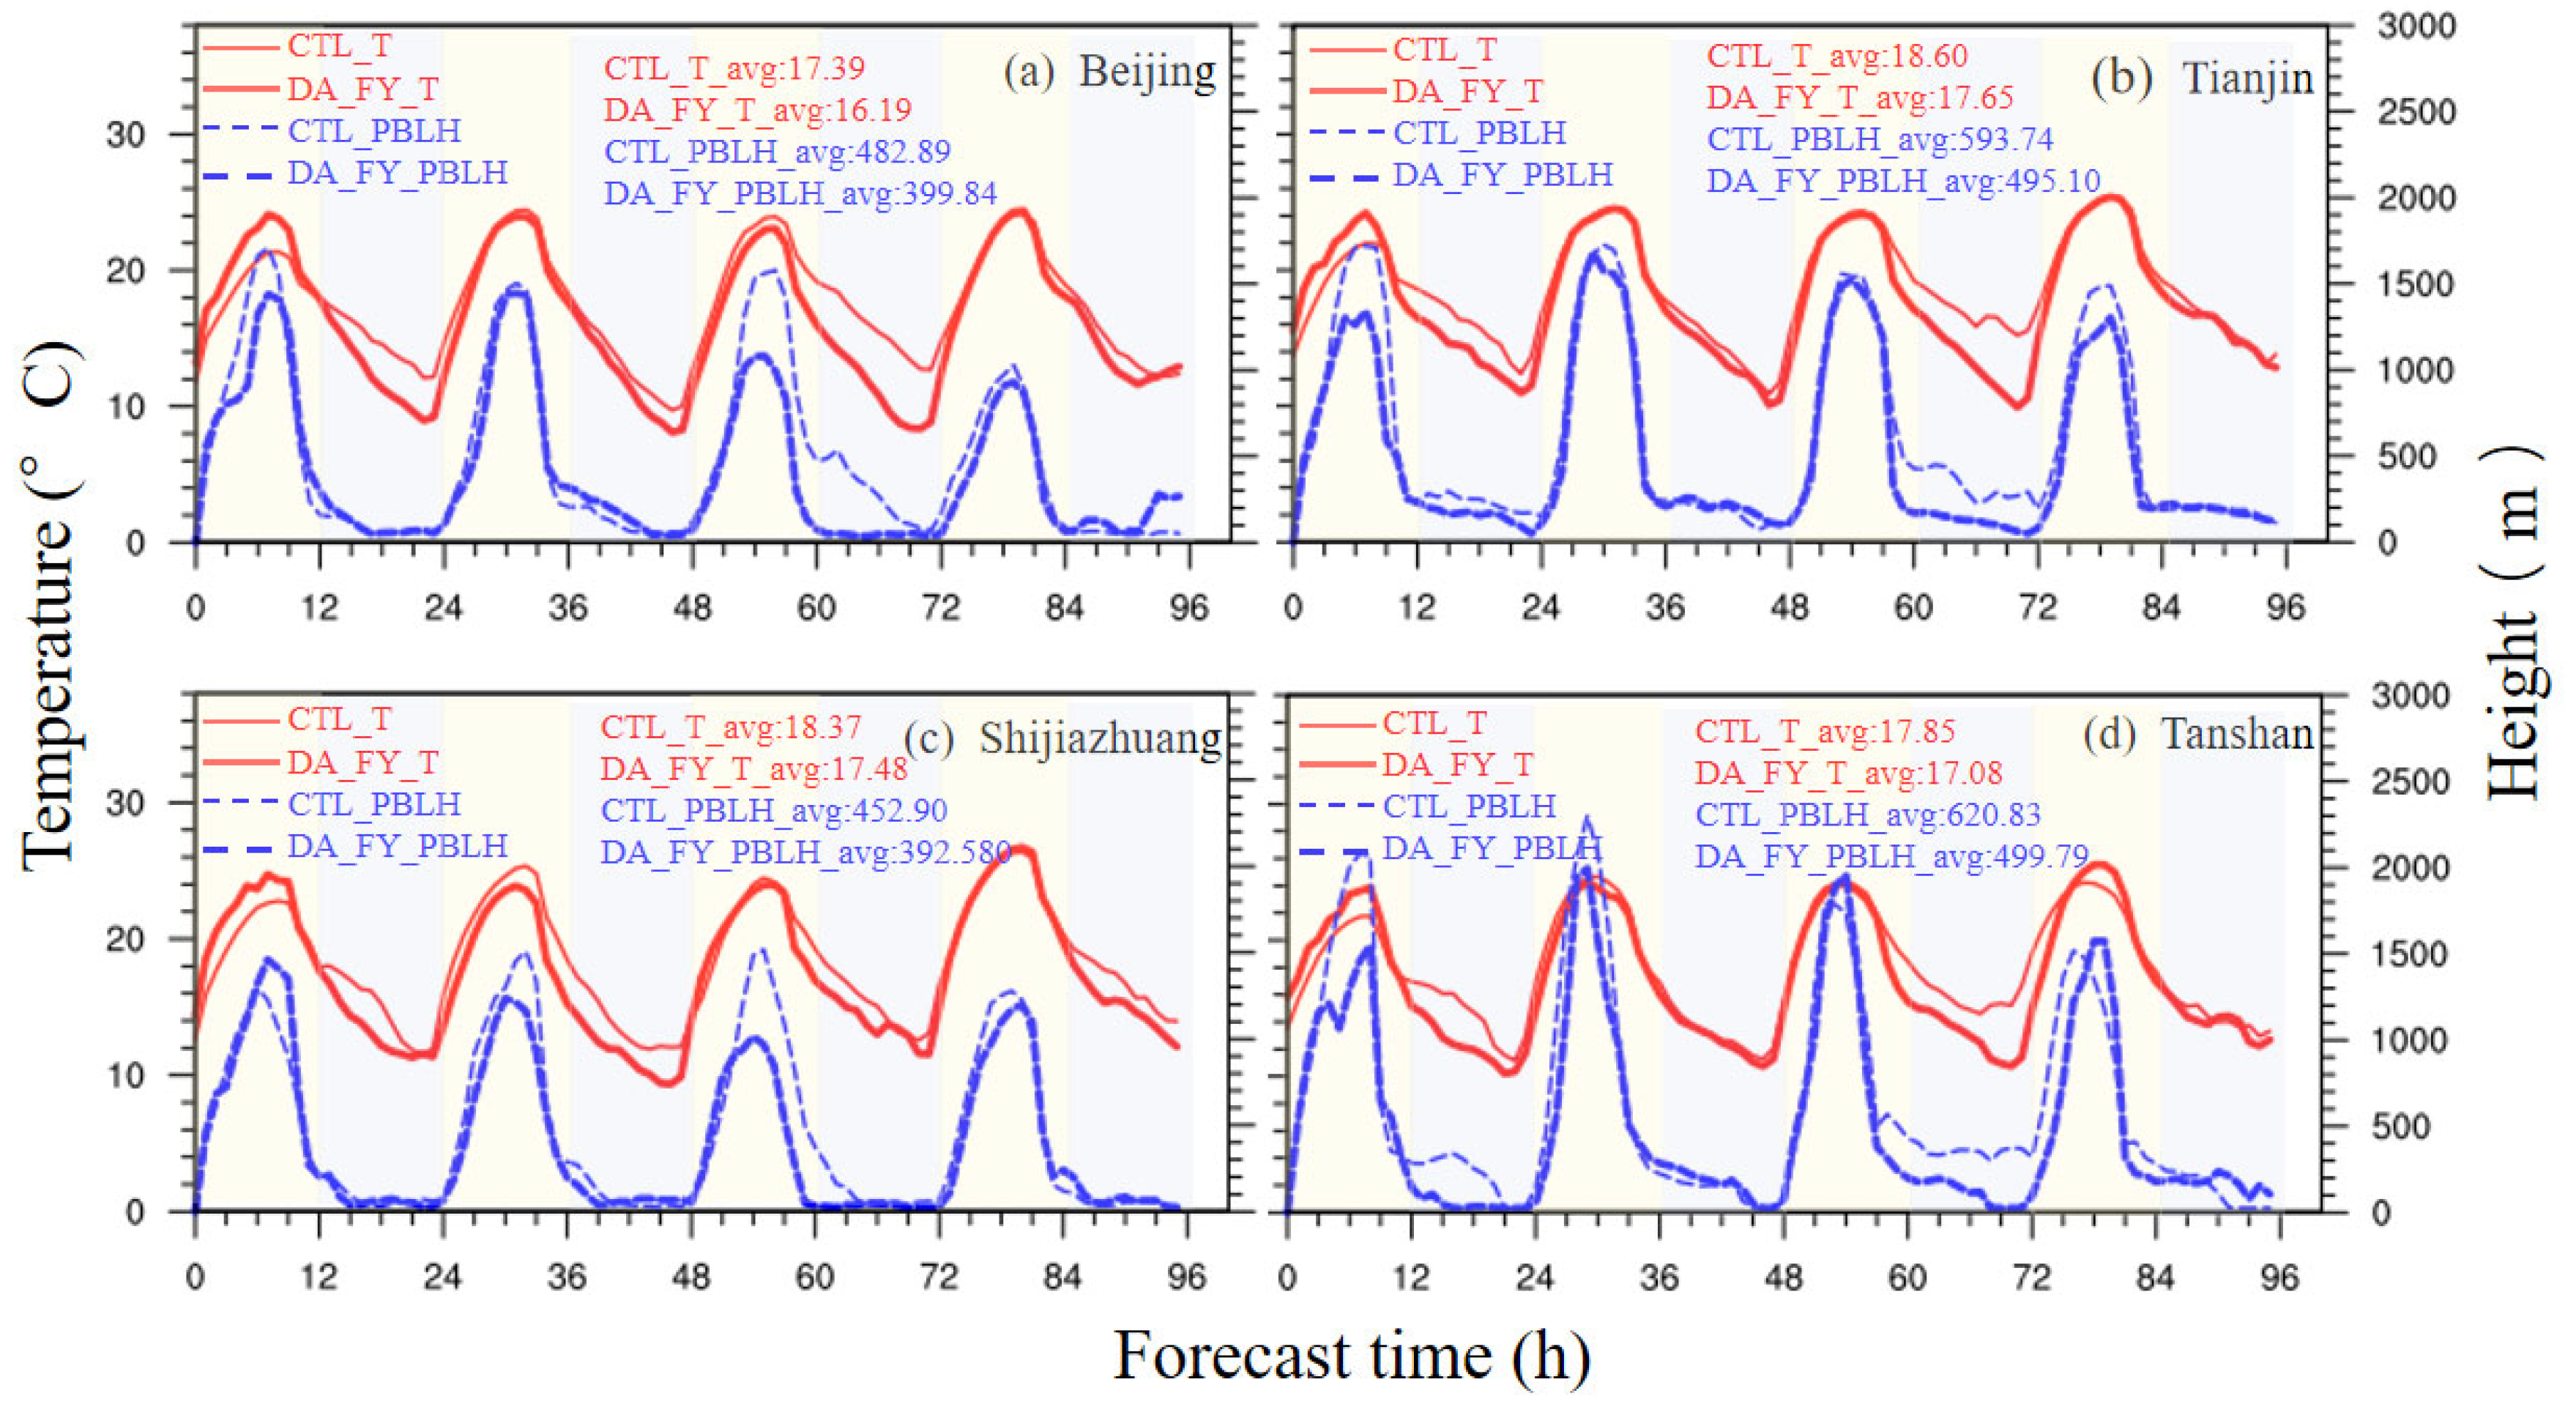
4.5. Simulation of PM2.5 in Severely Polluted Cities
4.6. Mechanistic Analysis
5. Conclusions
Author Contributions
Funding
Data Availability Statement
Acknowledgments
Conflicts of Interest
References
- Cai, W.Y.; Xu, X.D.; Cheng, X.H.; Wei, F.Y.; Qiu, X.F.; Zhu, W.H. Impact of “Blocking” Structure in the Troposphere on the Wintertime Persistent Heavy Air Pollution in Northern China. Sci. Total Environ. 2020, 741, 140325. [Google Scholar] [CrossRef]
- Huang, X.; Ding, A.; Gao, J.; Zheng, B.; Zhou, D.; Qi, X.; Tang, R.; Wang, J.; Ren, C.; Nie, W.; et al. Enhanced Secondary Pollution Offset Reduction of Primary Emissions during COVID-19 Lockdown in China. Natl. Sci. Rev. 2021, 8, nwaa137. [Google Scholar] [CrossRef]
- Ren, Y.L.R.; Chen, W.; Pang, B.; Lu, R.Y. Atmospheric Circulation Anomalies Related to the Winter PM2.5 Mass Concentration Rapid Decline Cases in Beijing, China. Atmos. Res. 2024, 311, 107665. [Google Scholar] [CrossRef]
- Wang, X.Y.; Zhang, R.H.; Tan, Y.K.; Yu, W. Dominant Synoptic Patterns Associated with the Decay Process of PM2.5 Pollution Episodes around Beijing. Atmos. Chem. Phys. 2021, 21, 2491–2508. [Google Scholar] [CrossRef]
- Zhang, Y.L.; Cao, F. Fine Particulate Matter (PM2.5) in China at a City Level. Sci. Rep. 2015, 5, 14884. [Google Scholar] [CrossRef]
- Zhao, S.P.; Yin, D.Y.; Yu, Y.; Kang, S.C.; Qin, D.H.; Dong, L.X. PM2.5 and O3 Pollution during 2015–2019 over 367 Chinese Cities: Spatiotemporal Variations, Meteorological and Topographical Impacts. Environ. Pollut. 2020, 264, 114694. [Google Scholar] [CrossRef]
- Fast, J.D.; Gustafson, W.I.; Easter, R.C.; Zaveri, R.A.; Barnard, J.C.; Chapman, E.G.; Grell, G.A.; Peckham, S.E. Evolution of Ozone, Particulates, and Aerosol Direct Radiative Forcing in the Vicinity of Houston Using a Fully Coupled Meteorology–Chemistry–Aerosol Model. J. Geophys. Res. Atmos. 2006, 111, D21305. [Google Scholar] [CrossRef]
- Grell, G.A.; Peckham, S.E.; Schmitz, R.; McKeen, S.A.; Frost, G.; Skamarock, W.C.; Eder, B. Fully Coupled “Online” Chemistry within the WRF Model. Atmos. Environ. 2005, 39, 6957–6975. [Google Scholar] [CrossRef]
- Trenberth, K.E.; Caron, J.M. Estimates of Meridional Atmosphere and Ocean Heat Transports. J. Clim. 2001, 14, 3433–3443. [Google Scholar] [CrossRef]
- Kumar, A.; Jiménez, R.; Belalcázar, L.C.; Rojas, N.Y. Application of WRF-Chem Model to Simulate PM10 Concentration over Bogotá. Aerosol Air Qual. Res. 2016, 16, 1206–1221. [Google Scholar] [CrossRef]
- Zhang, W.H.; Hai, S.F.; Zhao, Y.H.; Sheng, L.F.; Zhou, Y.; Wang, W.C.; Li, W.S. Numerical Modeling of Regional Transport of PM2.5 during a Severe Pollution Event in the Beijing-Tianjin-Hebei Region in November 2015. Atmos. Environ. 2021, 254, 118393. [Google Scholar] [CrossRef]
- Qiao, Z.; Cui, S.; Pei, C.; Ye, Z.; Wu, X.; Lei, L.; Luo, T.; Zhang, Z.; Li, X.; Zhu, W. Regional Predictions of Air Pollution in Guangzhou: Preliminary Results and Multi-Model Cross-Validations. Atmosphere 2022, 13, 1527. [Google Scholar] [CrossRef]
- Chen, Y.D.; Shen, J.; Fan, S.Y.; Meng, D.M.; Wang, C. Characteristics of Fengyun-4A Satellite Atmospheric Motion Vectors and Their Impacts on Data Assimilation. Adv. Atmos. Sci. 2020, 37, 1222–1238. [Google Scholar] [CrossRef]
- Peng, Y.; Wang, H.; Zhang, X.Y.; Zhao, T.L.; Jiang, T.; Che, H.Z.; Zhang, X.; Zhang, W.J.; Liu, Z.D. Impacts of PBL Schemes on PM2.5 Simulation and Their Responses to Aerosol-Radiation Feedback in GRAPES_CUACE Model during Severe Haze Episodes in Jing-Jin-Ji, China. Atmos. Res. 2021, 248, 105268. [Google Scholar] [CrossRef]
- Wang, X.M.; Wu, Z.Y.; Liang, G.X. WRF/CHEM Modeling of Impacts of Weather Conditions Modified by Urban Expansion on Secondary Organic Aerosol Formation over Pearl River Delta. Particuology 2009, 7, 384–391. [Google Scholar] [CrossRef]
- Zhang, W.J.; Wang, H.; Zhang, X.Y.; Peng, Y.; Zhong, J.T.; Zhao, Y.F. Evaluating the Contributions of Changed Meteorological Conditions and Emission to Substantial Reductions of PM2.5 Concentration from Winter 2016 to 2017 in Central and Eastern China. Sci. Total Environ. 2020, 716, 136892. [Google Scholar] [CrossRef] [PubMed]
- Gorai, A.K.; Tuluri, F.; Tchounwou, P.B.; Ambinakudige, S. Influence of Local Meteorology and NO2 Conditions on Ground-Level Ozone Concentrations in the Eastern Part of Texas, USA. Air Qual. Atmos. Health 2015, 8, 81–96. [Google Scholar] [CrossRef] [PubMed]
- Jones, A.M.; Harrison, R.M.; Baker, J. The Wind Speed Dependence of the Concentrations of Airborne Particulate Matter and NOx. Atmos. Environ. 2010, 44, 1682–1690. [Google Scholar] [CrossRef]
- Zeng, S.L.; Zhang, Y. The Effect of Meteorological Elements on Continuing Heavy Air Pollution: A Case Study in the Chengdu Area during the 2014 Spring Festival. Atmosphere 2017, 8, 71. [Google Scholar] [CrossRef]
- Bei, N.F.; Wu, J.R.; Elser, M.; Feng, T.; Cao, J.J.; El-Haddad, I.; Li, X.; Huang, R.J.; Li, Z.Q.; Long, X.; et al. Impacts of Meteorological Uncertainties on the Haze Formation in Beijing-Tianjin-Hebei (BTH) during Wintertime: A Case Study. Atmos. Chem. Phys. 2017, 17, 14579–14591. [Google Scholar] [CrossRef]
- Kim, T.; Myoung, J.; Lee, Y.; Suh, I.; Jang, L. A Study on Influence of Meteorological Patterns on Data Assimilation Effect Using the Air Quality Prediction Model. J. Korean Soc. Atmos. Environ. 2019, 35, 49–59. [Google Scholar] [CrossRef]
- Gao, L.N.; Liu, Z.Q.; Chen, D.; Yan, P.; Zhang, Y.; Hu, H.; Liang, H.; Liang, X.D. GPS-ZTD Data Assimilation and Its Impact on Wintertime Haze Prediction over North China Plain Using WRF 3DVAR and CMAQ Modeling System. Environ. Sci. Pollut. Res. 2021, 28, 68523–68538. [Google Scholar] [CrossRef] [PubMed]
- Liu, J.; Hong, J.; Mao, F.Y.; Gong, W.; Shen, L.J.; Liang, S.W.; Chen, J.P. Impact of Assimilating Multi-Source Observations on Meteorological and PM2.5 Forecast over Central China. Atmos. Res. 2020, 241, 104945. [Google Scholar] [CrossRef]
- Jones, T.A.; Otkin, J.A.; Stensrud, D.J.; Knopfmeier, K. Assimilation of Satellite Infrared Radiances and Doppler Radar Observations during a Cool Season Observing System Simulation Experiment. Mon. Weather Rev. 2013, 141, 3273–3299. [Google Scholar] [CrossRef]
- Jones, T.A.; Stensrud, D.; Wicker, L.; Minnis, P.; Palikonda, R. Simultaneous Radar and Satellite Data Storm-Scale Assimilation Using an Ensemble Kalman Filter Approach for 24 May 2011. Mon. Weather Rev. 2015, 143, 165–194. [Google Scholar] [CrossRef]
- Sokol, Z. Effects of an Assimilation of Radar and Satellite Data on a Very-Short Range Forecast of Heavy Convective Rainfalls. Atmos. Res. 2009, 93, 188–206. [Google Scholar] [CrossRef]
- Xian, D.; Zhang, P.; Gao, L.; Sun, R.J.; Zhang, H.Z.; Jia, X. Fengyun Meteorological Satellite Products for Earth System Science Applications. Adv. Atmos. Sci. 2021, 38, 1267–1284. [Google Scholar] [CrossRef]
- Min, M.; Wu, C.Q.; Li, C.; Liu, H.; Xu, N.; Wu, X.; Chen, L.; Wang, F.; Sun, F.L.; Qin, D.Y.; et al. Developing the Science Product Algorithm Testbed for Chinese Next-Generation Geostationary Meteorological Satellites: Fengyun-4 Series. J. Meteorol. Res. 2017, 31, 708–719. [Google Scholar] [CrossRef]
- Hong, J.; Mao, F.; Gong, W.; Gan, Y.; Zang, L.; Quan, J.; Chen, J. Assimilating Fengyun-4A Observations to Improve WRF-Chem PM2.5 Predictions in China. Atmos. Res. 2022, 265, 105878. [Google Scholar] [CrossRef]
- Chen, K.Y.; Guan, P.G. The Impacts of Assimilating Fengyun-4A Atmospheric Motion Vectors on Typhoon Forecasts. Atmosphere 2023, 14, 375. [Google Scholar] [CrossRef]
- Xie, Y.H.; Chen, M.; Zhang, S.T.; Shi, J.C.; Liu, R.X. Impacts of FY-4A Atmospheric Motion Vectors on the Henan 7.20 Rainstorm Forecast in 2021. Remote Sens. 2022, 14, 5637. [Google Scholar] [CrossRef]
- Chen, Z.Y.; Chen, D.L.; Zhao, C.F.; Kwan, M.P.; Cai, J.; Zhuang, Y.; Zhao, B.; Wang, X.Y.; Chen, B.; Yang, J.; et al. Influence of Meteorological Conditions on PM2.5 Concentrations across China: A Review of Methodology and Mechanism. Environ. Int. 2020, 139, 105558. [Google Scholar] [CrossRef]
- Zhao, Y.; Qiu, L.P.; Xu, R.Y.; Xie, F.J.; Zhang, Q.; Yu, Y.Y.; Nielsen, C.P.; Qin, H.X.; Wang, H.K.; Wu, X.C.; et al. Advantages of a City-Scale Emission Inventory for Urban Air Quality Research and Policy: The Case of Nanjing, a Typical Industrial City in the Yangtze River Delta, China. Atmos. Chem. Phys. 2015, 15, 12623–12644. [Google Scholar] [CrossRef]
- Boylan, J.W.; Russell, A.G. PM and Light Extinction Model Performance Metrics, Goals, and Criteria for Three-Dimensional Air Quality Models. Atmos. Environ. 2006, 40, 4946–4959. [Google Scholar] [CrossRef]
- Chapman, E.G.; Gustafson, W.I.; Easter, R.C.; Barnard, J.C.; Ghan, S.J.; Pekour, M.S.; Fast, J.D. Coupling Aerosol-Cloud-Radiative Processes in the WRF-Chem Model: Investigating the Radiative Impact of Elevated Point Sources. Atmos. Chem. Phys. 2009, 9, 945–964. [Google Scholar] [CrossRef]
- Guo, J.-P.; Wu, Y.-R.; Zhang, X.-Y.; Li, X.-W. Estimation of PM2.5 over Eastern China from MODIS Aerosol Optical Depth Using the Back Propagation Neural Network. Huan Jing Ke Xue 2013, 34, 817–825. [Google Scholar] [PubMed]
- Barker, D.M.; Huang, W.; Guo, Y.-R.; Bourgeois, A.J.; Xiao, Q.N. A Three-Dimensional Variational Data Assimilation System for MM5: Implementation and Initial Results. Mon. Weather Rev. 2004, 132, 897–914. [Google Scholar] [CrossRef]
- Lin, Y.L.; Farley, R.D.; Orville, H.D. Bulk Parameterization of the Snow Field in a Cloud Model. J. Clim. Appl. Meteorol. 1983, 22, 1065–1092. [Google Scholar] [CrossRef]
- Clough, S.A.; Kneizys, F.X.; Rothman, L.S.; Gallery, W.O. Atmospheric Spectral Transmittance and Radiance: FASCOD1 B. Proc. SPIE 1981, 277, 152–166. [Google Scholar] [CrossRef]
- Chou, M.D.; Suarez, M.J. A Solar Radiation Parameterization (CLIRAD-SW) for Atmospheric Studies; NASA Tech. Memo NASA/TM-1999-104606; NASA: Washington, DC, USA, 1999; Volume 15, p. 40. [Google Scholar]
- Chen, F.; Dudhia, J. Coupling an Advanced Land Surface-Hydrology Model with the Penn State–NCAR MM5 Modeling System. Part I: Model Implementation and Sensitivity. Mon. Weather Rev. 2001, 129, 569–585. [Google Scholar] [CrossRef]
- Hill, R.J. Implications of Monin-Obukhov Similarity Theory for Scalar Quantities. J. Atmos. Sci. 1989, 46, 2236–2244. [Google Scholar] [CrossRef]
- Hong, S.Y.; Noh, Y.; Dudhia, J. A New Vertical Diffusion Package with an Explicit Treatment of Entrainment Processes. Mon. Weather Rev. 2006, 134, 2318–2341. [Google Scholar] [CrossRef]
- Panchal, J.G.; Patel, R.V.; Menon, S.K. Preparation and Physicochemical Characterization of Carbamazepine (CBMZ): Para-Sulfonated Calix n Arene Inclusion Complexes. J. Incl. Phenom. Macrocycl. Chem. 2010, 67, 201–208. [Google Scholar] [CrossRef]
- Zaveri, R.A.; Easter, R.C.; Fast, J.D.; Peters, L.K. Model for Simulating Aerosol Interactions and Chemistry (MOSAIC). J. Geophys. Res. Atmos. 2008, 113, D13204. [Google Scholar] [CrossRef]
- Wild, O.; Zhu, X.; Prather, M.J. Fast-J: Accurate Simulation of In- and Below-Cloud Photolysis in Tropospheric Chemical Models. J. Atmos. Chem. 2000, 37, 245–282. [Google Scholar] [CrossRef]

| Site | MB | RMSE | MFB | MFE | ||||
|---|---|---|---|---|---|---|---|---|
| CTL | DA_FY | CTL | DA_FY | CTL | DA_FY | CTL | DA_FY | |
| Beijing | −22.86 | 15.96 | 52.36 | 44.60 | −0.41 | 0.07 | 0.59 | 0.33 |
| Tianjin | −42.59 | −10.55 | 58.01 | 37.29 | −0.80 | −0.22 | 0.88 | 0.37 |
| Shijiazhuang | −7.08 | 17.20 | 54.44 | 53.97 | −0.34 | 0.08 | 0.64 | 0.42 |
| Tangshan | −32.12 | 0.49 | 64.78 | 41.19 | −0.61 | −0.03 | 0.82 | 0.34 |
Disclaimer/Publisher’s Note: The statements, opinions and data contained in all publications are solely those of the individual author(s) and contributor(s) and not of MDPI and/or the editor(s). MDPI and/or the editor(s) disclaim responsibility for any injury to people or property resulting from any ideas, methods, instructions or products referred to in the content. |
© 2025 by the authors. Licensee MDPI, Basel, Switzerland. This article is an open access article distributed under the terms and conditions of the Creative Commons Attribution (CC BY) license (https://creativecommons.org/licenses/by/4.0/).
Share and Cite
Gu, K.; Wang, J.; Su, S.; Zhu, J.; Zhang, Y.; Bian, F.; Yang, Y. Impact of Fengyun-4A Atmospheric Motion Vector Data Assimilation on PM2.5 Simulation. Remote Sens. 2025, 17, 1952. https://doi.org/10.3390/rs17111952
Gu K, Wang J, Su S, Zhu J, Zhang Y, Bian F, Yang Y. Impact of Fengyun-4A Atmospheric Motion Vector Data Assimilation on PM2.5 Simulation. Remote Sensing. 2025; 17(11):1952. https://doi.org/10.3390/rs17111952
Chicago/Turabian StyleGu, Kaiqiang, Jinyan Wang, Shixiang Su, Jiangtao Zhu, Yu Zhang, Feifan Bian, and Yi Yang. 2025. "Impact of Fengyun-4A Atmospheric Motion Vector Data Assimilation on PM2.5 Simulation" Remote Sensing 17, no. 11: 1952. https://doi.org/10.3390/rs17111952
APA StyleGu, K., Wang, J., Su, S., Zhu, J., Zhang, Y., Bian, F., & Yang, Y. (2025). Impact of Fengyun-4A Atmospheric Motion Vector Data Assimilation on PM2.5 Simulation. Remote Sensing, 17(11), 1952. https://doi.org/10.3390/rs17111952