Abstract
Previous lunar missions, such as Surveyor, Apollo, and the Lunar Atmosphere and Dust Environment Explorer (LADEE), have played a pivotal role in advancing our understanding of the lunar exosphere’s dynamics and its relationship with solar wind flux. The insights gained from these missions have laid a strong foundation for our current knowledge. However, due to insufficient near-surface observations, the scientific community has faced challenges in interpreting the phenomena of lunar dust lofting and levitation. This paper introduces the concept of signals of opportunity (SoOP), which utilizes radio occultation (RO) to retrieve the near-surface dust density profile on the Moon. Gravity Recovery and Interior Laboratory (GRAIL) radio science beacon (RSB) signals are used to demonstrate this method. By mapping the concentration of lunar near-surface dust using RO, we aim to enhance our understanding of how charged lunar dust interacts with surrounding plasma, thereby contributing to future research in this field and supporting human exploration of the Moon. Additionally, the introduced SoOP will be able to provide observational constraints to physical model development related to lunar surface particle sputtering and the reactions of near-surface dust in the presence of solar wind and electrostatically charged dust grains.
1. Introduction
Airless bodies like Earth’s Moon exhibit complex interactions between lunar dust and the surrounding plasma environment on their surfaces. Lunar dust is generated by meteoroid impacts and the breakdown of surface rocks, significantly affecting the Moon’s surface appearance and environment. These dust particles acquire electrical charges due to their interactions with plasma, solar wind, and solar radiation. This results in intricate dynamics, such as levitation, lofting, and interactions with electromagnetic fields. Understanding how lunar dust behaves in the plasma environment is essential for future human and lander missions to the Moon, particularly in the South Pole region where the upcoming Artemis missions will take place.
Lunar dust, which can be lifted off the surface by electrostatic forces, has been observed since the historic Apollo missions when humans first set foot on the Moon. Five decades ago, the phenomenon known as the Horizon Glow was first noted in images taken by the Surveyor missions’ television cameras, serving as the earliest indication of electrostatic dust transport in space (Surveyor Mission Final Report) [1,2]. Subsequent lunar missions, laboratory experiments, and research investigations have revealed various types of lunar dust exosphere associated with different mechanisms and their interactions with surrounding plasma conditions. The concentration of dust near the lunar surface can vary significantly, sometimes by as much as three orders of magnitude [3,4,5]. However, interpretations of lunar dust cloud observations have been controversial among planetary scientists for decades. The lack of consensus within the scientific community underscores the need for further research and collaboration in this area, as the deficit of frequent near-surface observations hampers our understanding of dust transport mechanisms at the Moon’s surface.
SoOP obtained from NASA’s Gravity Recovery and Interior Laboratory (GRAIL) provide valuable insights into the complexities of lunar dust. Launched in September 2011, GRAIL consisted of two identical spacecraft named “Ebb” and “Flow”, which orbited the Moon together for nearly nine months. These twin spacecraft created the highest-resolution gravity map of any planetary body to date. They utilized a lunar gravity ranging system instrument to measure their relative motion, allowing for precise mapping of the Moon’s gravity field. Each spacecraft was equipped with an ultra-stable oscillator (USO), which provided timing for the S-band time transfer system, X-band radio science beacon (RSB), and Ka-band inter-satellite ranging signals. The USO exhibited an impressive short-term Allan deviation performance of . Highly stable X-band radio science beacon signals offered a unique opportunity to estimate lunar dust density by measuring electron density profiles near the lunar surface whenever the Moon occulted the twin GRAIL spacecraft.
Prior observations of the lunar exosphere indicate that electron density can vary by a factor of two [6]. Reasoner and Burke (1972) [7] and Vyshlov et al. (1976) [8] reported maximum electron density values from Luna 19 and Luna 22 in the range of 5 to m−3. Imamura et al. (2012) [9] documented an average profile from Kaguya/SELENE observations with a maximum electron density of approximately m−3. Choudhary et al. (2016) [10] found that observations from Chandrayaan-1 recorded maximum electron density values between 3 and 10 m−3. Tripathi et al. (2022) [11] reported that Chandrayaan-2 observations had maximum total electron content values of 1.0–1.5 m−2. Although they did not report the electron density profiles, the application of standard scaling relationships (introduced in [12]) projects that the corresponding maximum electron density is approximately m−3 in the wake region (SZA = 180 degrees). The major sources causing dense electron density concentrations include the photo-ionization of exospheric neutrals [13] and photoemission from lunar dust [6].
The primary goal of this research is to introduce a signal of opportunity to estimate the dust density concentration using radio occultation measurements, which represent the dust electrons resulting from electrostatically lofted dust particles in the terminator regions. Model simulations and observations reported by past lunar missions have interpreted the phenomena of dust lofting and levitation in lunar terminator regions due to a significant negative surface potential that drives the sizable electrostatic force on the dust particles [3,4,6]; the electrostatically lofting motions were observed to be even more significant by a few hundred volts of negative surface potential near the twilight crater areas by LADEE/LDEX [14]. The dust electron could be the polar regions’ most dominant source of the near-surface electron concentration, besides the ambient solar wind plasma (protons and electrons), with a level of a few particles per cubic centimeter [15] and a relatively minor number density from the photo-ionization process in the twilight polar regions [13].
This paper introduces the first application of radio science SoOP to estimate dust density profiles near the Moon’s surface. This novel method, which employs GRAIL RO SoOP data, has the potential to significantly enhance our understanding of dust transport mechanisms on the Moon. Furthermore, the introduced SoOP will establish observational constraints for developing physical models related to lunar surface particle sputtering and the reactions of near-surface dust in the presence of solar wind.
2. Lunar RO
In this section, we outline the methodologies and analytical techniques used in RO, a key remote sensing method for planetary science applications. By examining how the signal, transmitted from a spacecraft and received by antennas at the Deep Space Network (DSN), is impacted by the medium through which the signal propagates, we can extract valuable information about variations in the signal’s phase, frequency, amplitude attenuation, and polarization. These alterations provide essential scientific insights into the medium under investigation, such as the atmosphere and ionosphere. Before delving into how RO techniques are employed to study the Moon’s electron density and estimate near-surface dust density profiles, we will first introduce planetary RO and discuss the primary steps involved in the end-to-end data processing and retrieval of key parameters. Notably, past Martian RO missions have yielded decades’ worth of valuable atmospheric and ionospheric profiles for Mars. These missions include the Mars Global Surveyor (MGS), the Mars Reconnaissance Orbiter (MRO), the Mars Atmosphere and Volatile EvolutioN (MAVEN), and Mars Express (MEX). We will use Mars and the MRO orbiter to illustrate and discuss RO processing techniques before applying the same methods to the Moon with the GRAIL orbiter.
The RO experiment involves analyzing signals transmitted from spacecraft and received by open-loop receivers (OLRs) at Earth-based ground stations, such as the DSN. The frequency of the radio science signal recorded using OLRs can be expressed as follows [16]:
where and are the received and transmitted frequency, respectively, l is the signal path length, is the electron density through the propagation dispersive medium, is the number density of neutral gas (non-dispersive medium), and e (electron charge), (permittivity), c (speed of light), and k are refractive volume constants. In Equation (1), the second term represents the Doppler frequency shift resulting from the relative motion between the transmitter and receiver; the third term is the effect of dispersive medium (electrons) along the propagation path. The fourth term indicates the non-dispersive medium effect (neutral gas–atmosphere) along the signal path. In addition, we added a noise in the last term of the equation to represent the noise of the OLR recording, which is typically dominated by the USO stability and the thermal noise related to OLR channel bandwidths.
NASA’s GRAIL RSB radio signals were received by the DSN antennas and recorded using open-loop receivers in a set of narrow-band intermediate frequency channels at DSN stations. The frequency residual is defined as the difference between the observed frequency received at the DSN and the prediction of the received frequency. The predicted frequency is based on the classical and relativistic Doppler shifts experienced by the radio signal. It deliberately does not include a prediction of the effects of the lunar environment. As the refractive index of a plasma differs from the vacuum value of unity by an amount proportional to the electron density, this radio signal experiences refraction as it passes through the lunar ionosphere during an occultation. Consequently, electron densities in the lunar ionosphere affect the frequency of the radio signal. The resultant frequency residual is described by the following [16]:
where e is the electron charge, is the electron mass, is the permittivity of free space, c is the speed of light, f is the radio frequency, t is the time, is the electron density, and is an element of the path length. The total electron content along the ray path, , is defined by .
The initial observed time series of should be consistent with zero at times when the entire ray path is above the lunar ionosphere. However, it may show a systematic displacement from zero due to errors such as imprecise knowledge of the spacecraft trajectory or the transmitted frequency. As part of the standard processing approach for RO observations, these systematic errors are removed by subtracting a fitted baseline correction that is linear in time. After this correction, the revised observed time series of aligns with zero at times when the entire ray path is above the lunar ionosphere. Section 4.1 shows the two selected RO frequency residual () time series comparisons between the signatures of the lower and higher electron concentrations on 27 May 2012, respectively.
Equation (2) is integrated with respect to time to obtain a time series of . For the purposes of this analysis, the boundary condition is not significant. We utilize trajectory information to determine how the location of the ray path’s closest approach to the center of mass of the Moon varied during the occultation. This yields as a function of the closest approach distance. If the lunar ionosphere is assumed to be spherically symmetric in the regions sampled by the occultation, then the vertical profile of electron density , where r is the radial distance from the center of mass, can be found from via an Abel transform [12]:
Equation (3) only involves the gradient of , which confirms that the derived electron density values are unaffected by the boundary condition used for . The electron density profiles that are generated from Equation (3) are expressed as a function of radius, but the geophysical relevant vertical coordinate is altitude. Consequently, the altitude z is determined from the radius , where km is the mean radius of the Moon.
Equation (3) requires values of the total electron content up to infinite radial distances. That is not possible. Values of can only be obtained up to the orbital altitude of the spacecraft, 55 km on average. In reality, the application of Equation (3) assumes that is zero above this altitude. This requires that N be zero above this altitude as well. If plasma densities in the actual lunar environment are negligible above this altitude, then the derived values of N are accurate. On the other hand, if plasma densities in the actual lunar environment are appreciably non-zero above this altitude, then the derived values of N are lower limits on the actual plasma densities. Although this statement may not be obvious from inspection of Equation (3), it follows naturally from consideration of in terms of .
Application of Equation (3) to determine the electron density at some radial distance assumes that the spacecraft is well outside a sphere of radius ; this is not the case for radial distances close to the spacecraft altitude.
3. Lunar Dust Density Estimate and Uncertainty
This section expands on the RO method and discusses how these observations can be used to estimate the density of lunar dust. It outlines the theoretical framework and observational techniques needed to understand the impact of dust particles on radio wave propagation. Importantly, this research provides valuable insights into the dynamic behavior of lunar regolith in response to external factors, such as solar radiation and micrometeorite impacts.
In this paper, we estimate the density of charged particles () lofting near the surface of the Moon. To compute the dust density, we need to determine the particle size () and the charge () using the dusty electron relationship defined in Equation (4) corresponding to the formulation derived in [6].
where is the electron density profile, e is the electron charge, and is the permittivity of free space. Once the particle size () and dust charge () are provided, we can derive the dust density profile using Equation (5):
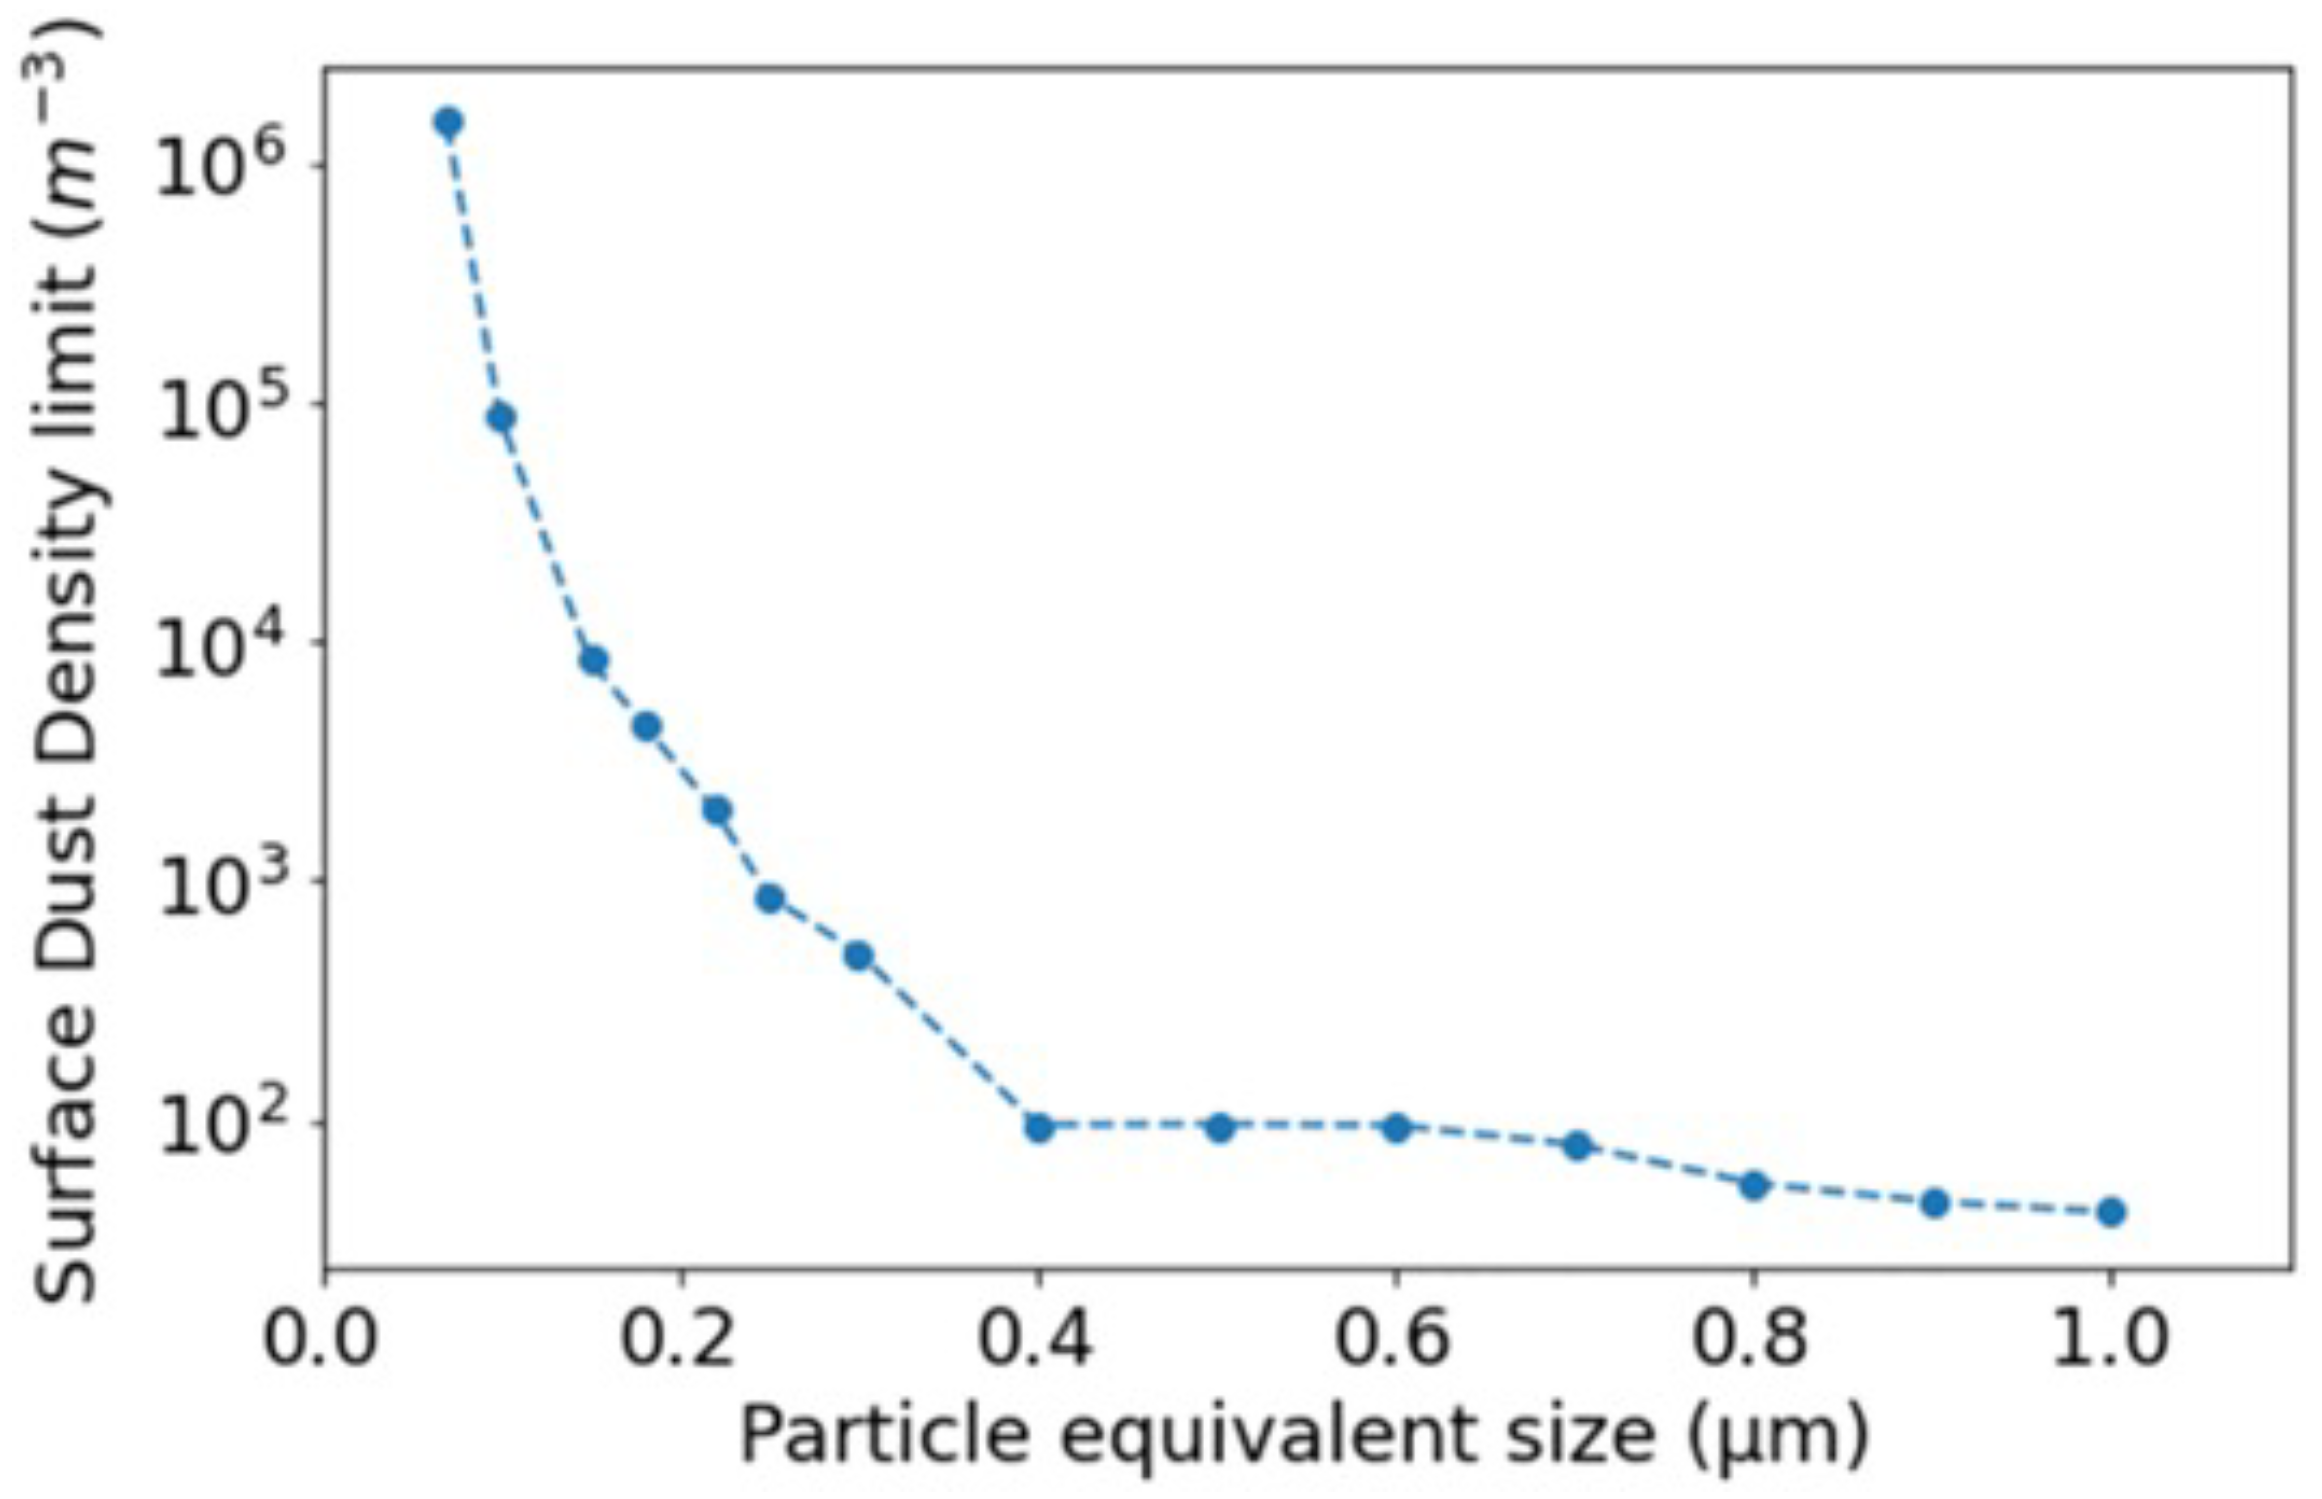
We can also compare the GRAIL observations with the dust concentration model derived using LDAEE-UVS data, as shown in Figure 1.

Figure 1.
The dust density model derived using LADEE-UVS data [5].
Using the dusty electron relationship defined in Equation (4) and the analytical method to estimate electron density uncertainties [17], we can establish the uncertainty in the dust density estimate, as expressed in Equation (6):
The uncertainties in electron density and dust density derived from RO for past lunar missions are compared to the performance of GRAIL and are listed in Table 1.

Table 1.
Uncertainties in electron density and dust density derived from RO for past lunar missions.
4. Results and Discussion
This section presents the end-to-end analysis of GRAIL RO data. This analysis is instrumental in retrieving the Moon’s near-surface electron density profile and estimating near-surface dust concentrations based on the electron profile derived from RO. End-to-end signal processing starts with the GRAIL open-loop (OL) file, which includes in-phase (I) and quadrature (Q) data recorded by radio science open-loop receivers (OLRs). In addition to the I and Q samples, the GRAIL OL file includes information from the received DSN station and the predicted Doppler frequency compensation used to center the received GRAIL signals in narrow-band channels. A second-order phase-locked loop (PLL) is used to track the GRAIL OLR baseband signals and extracts the signal’s phase, frequency, and power recorded in the OLR channel.
4.1. GRAIL RO Frequency Residual
Here, we illustrate the process of analyzing two selected ingress RO data collected by GRAIL over the Lunar South Pole region. We demonstrate how to derive intermediate results, including frequency residuals, electron density, and dust density profiles. Figure 2 depicts the observation geometry for the two RO ingresses occurring at 07:09 and 10:56 UTC (Earth Receive Time, ERT) on 27 May 2012. The GRAIL RO RSB signal traversed the terminator region at the southern pole of the Moon and was received at the DSS-45 antenna located in Canberra.
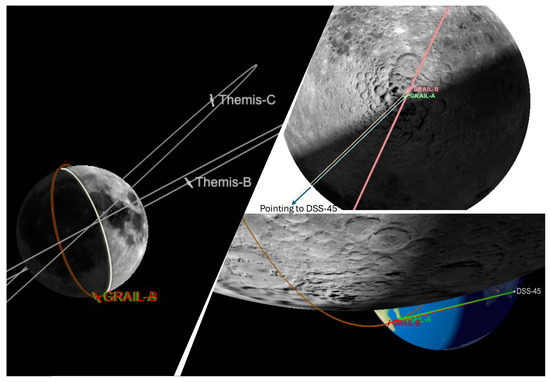
Figure 2.
Left: GRAIL RO orbit geometry viewing from the DSS-45 antenna (in the Canberra DSN complex) to the GRAIL-pointing direction. The upper and bottom-right show the RO signal path (GRAIL-to-DSS 45) over the Moon’s South Pole region.
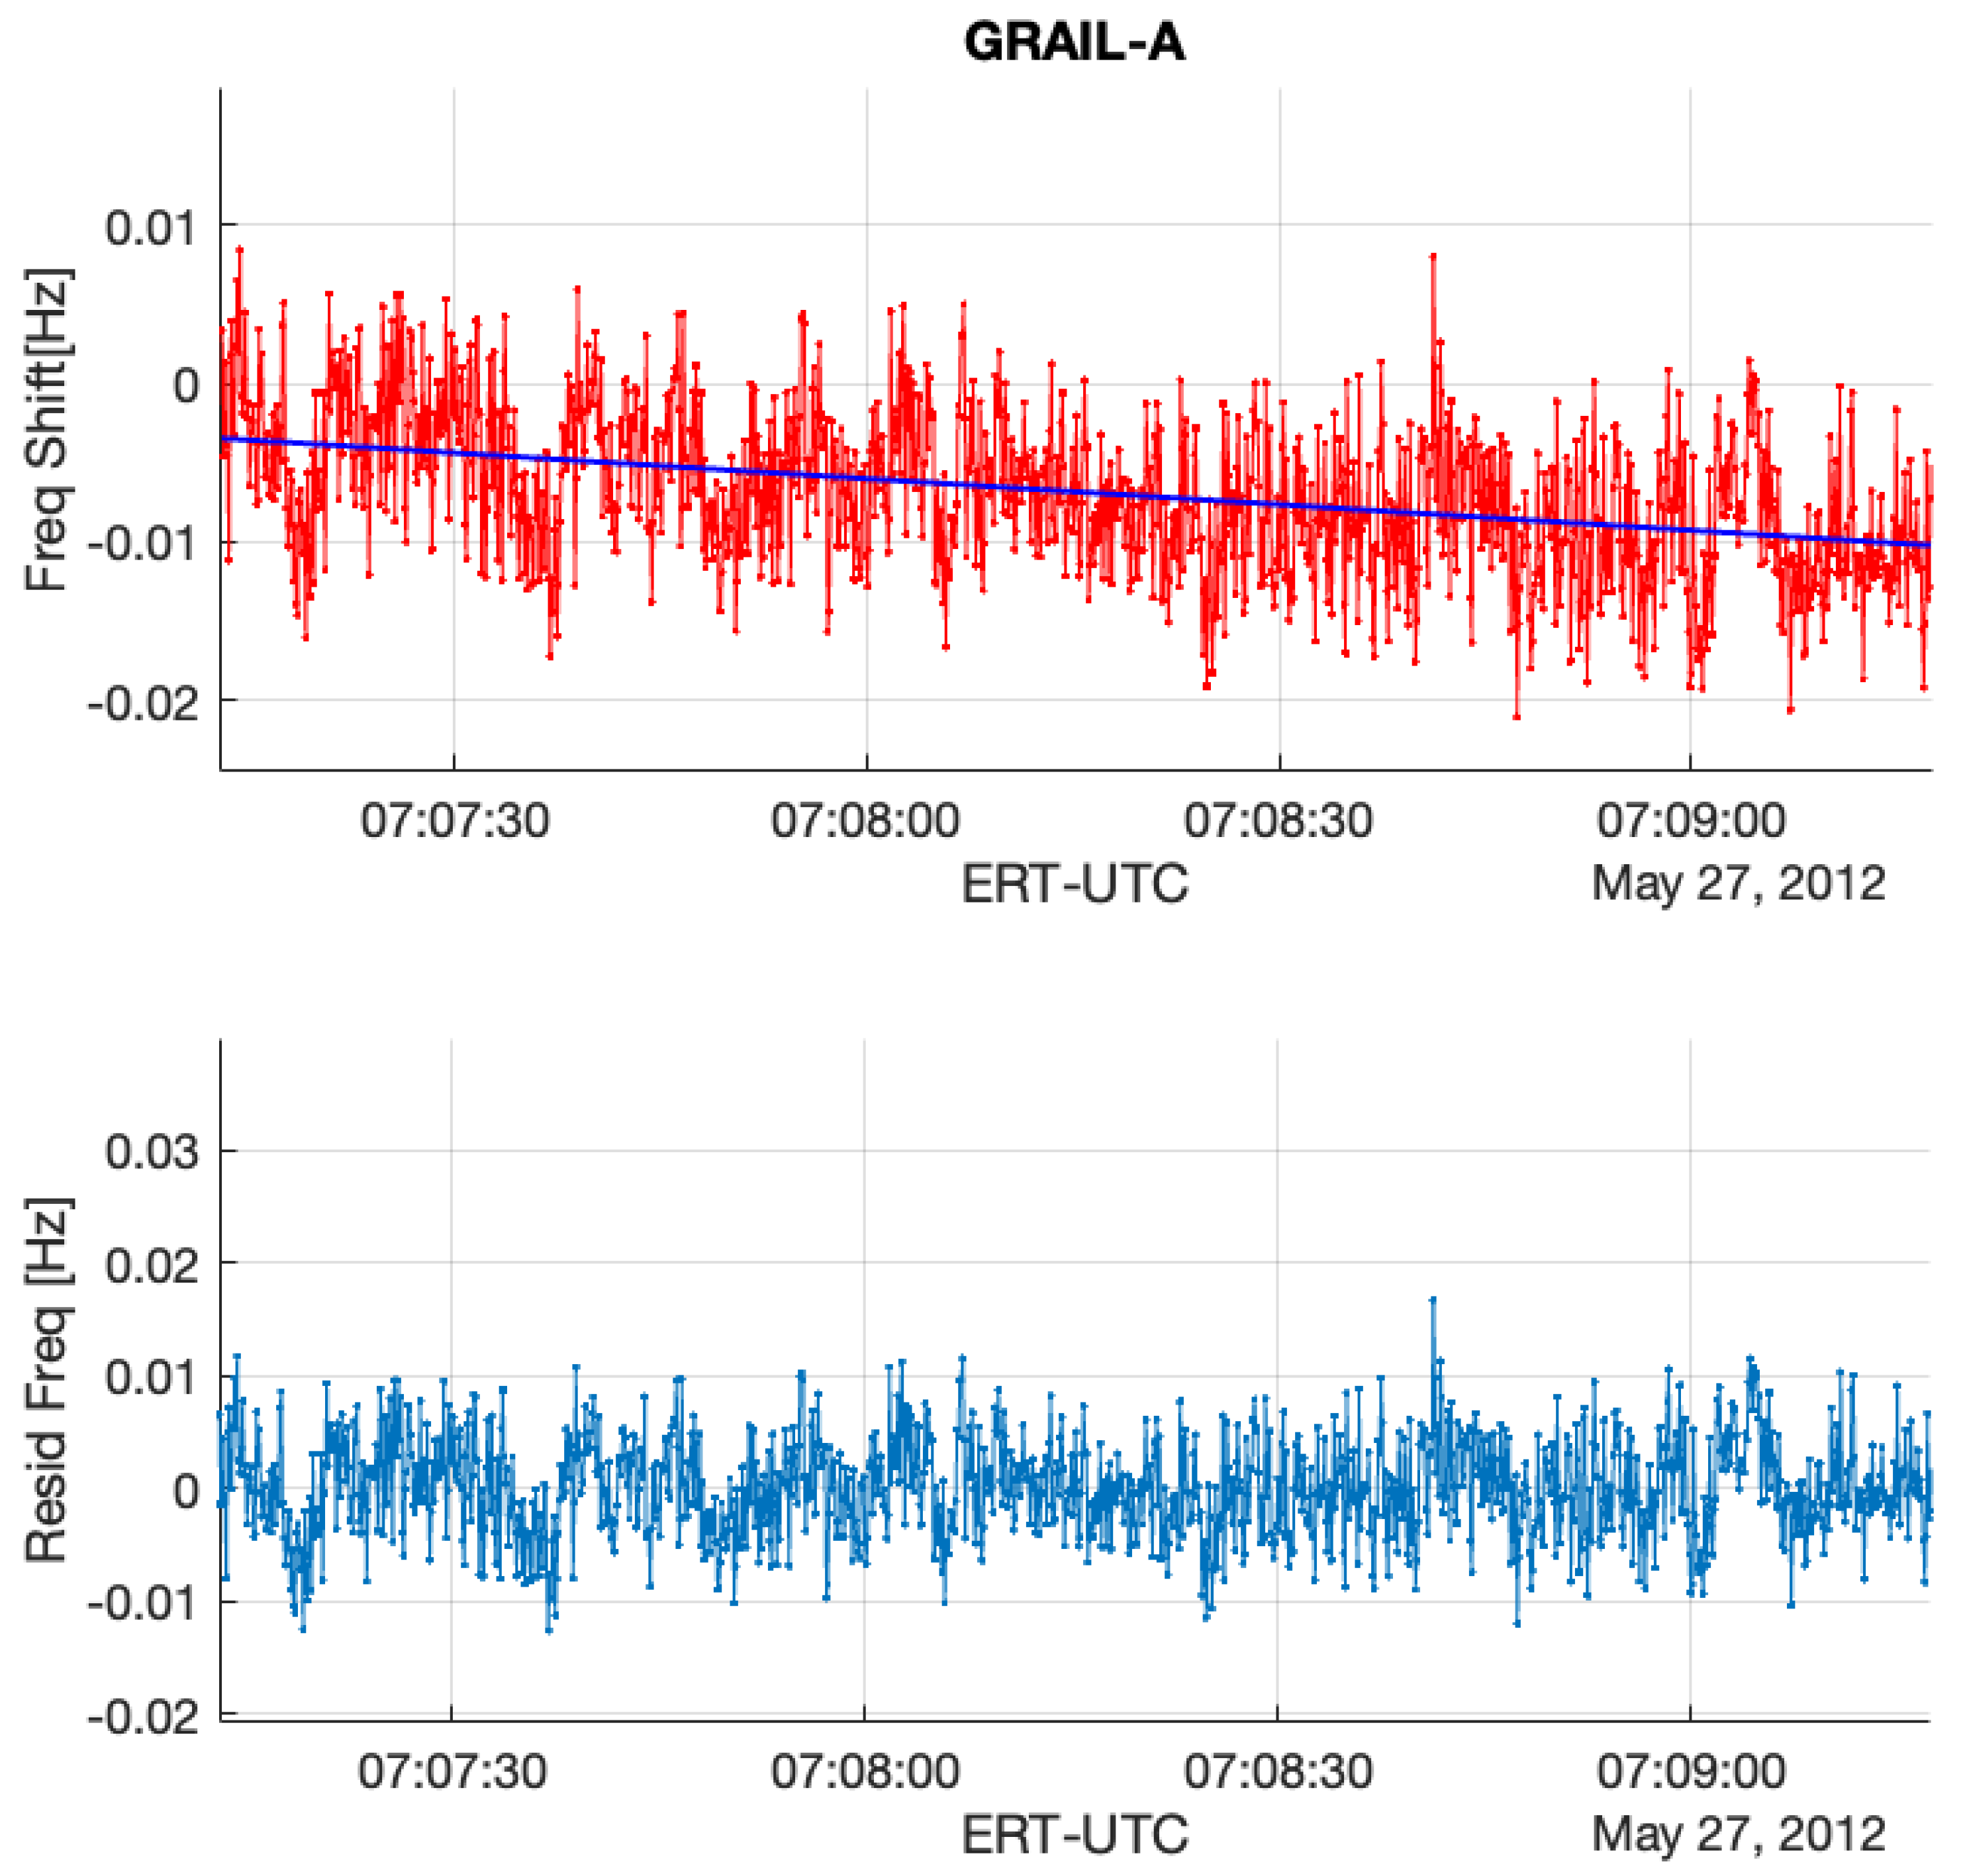
GRAIL X-band radio signals were received by the antennas of the DSN at site DSS-45 and recorded using open-loop receivers with a 1 kHz bandwidth channel. Figure 3 and Figure 4 (the upper plot) present frequency residuals, incorporating calibrations for Doppler effects as well as adjustments for Earth’s atmosphere and ionosphere, as discussed in Section 2. The background trends observed in the two residual frequency time series are attributed to biases in the calibrations related to Earth’s atmosphere, ionosphere, and orbital effects. These trends are eliminated by applying a polynomial fit. The standard deviation of the two residual frequencies is approximately 3.2 mHz, which corresponds to an Allan deviation of about .

Figure 3.
(Upper): GRAIL RO residual frequency (GRAIL-A/DSS45 2012DOY148 (UTC07:09)) with the removal of Doppler and Earth’s atmosphere and ionosphere effects. (Bottom): the final residual frequency with a first-order polynomial fit to remove the background trend resulting from the uncertainties of calibrations including orbit, atmosphere, and ionosphere.

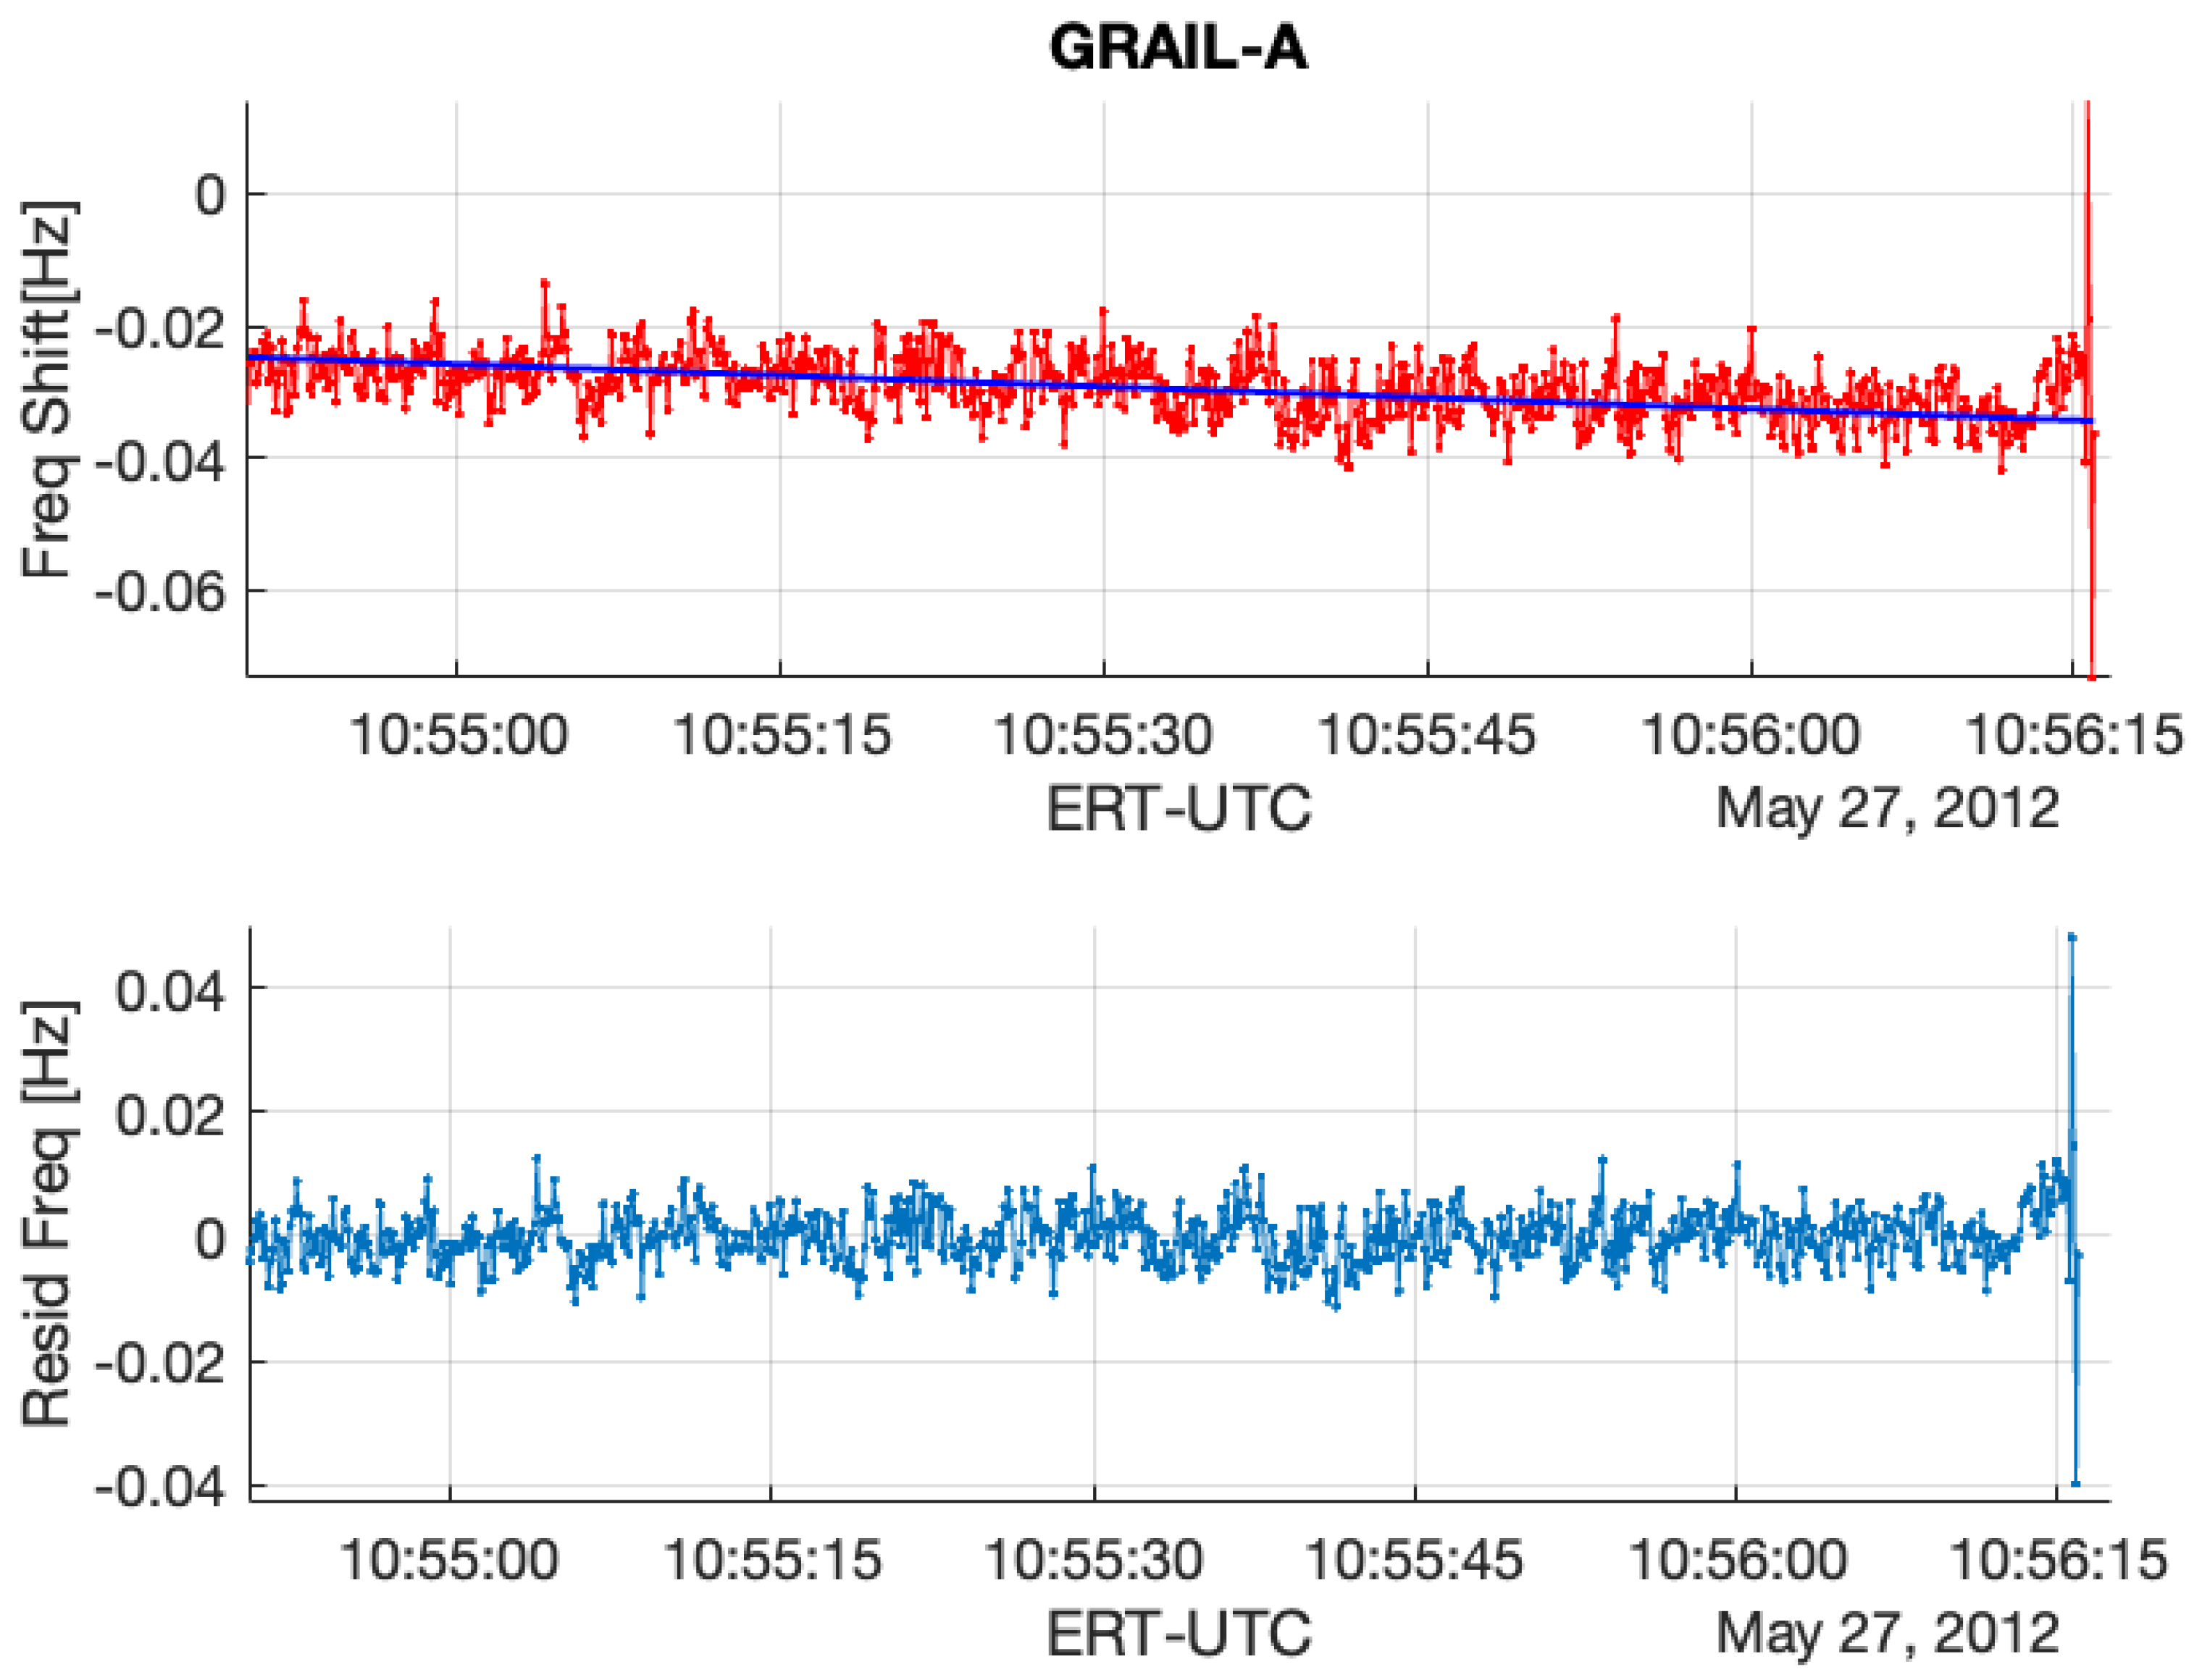
Figure 4.
(Upper): GRAIL RO residual frequency (GRAIL-A/DSS45 2012DOY148 (UTC10:56)) with the removal of Doppler and Earth’s atmosphere and ionosphere effects. (Bottom): the final residual frequency with a first-order polynomial fit to remove the background trend resulting from the uncertainties of calibrations including orbit, atmosphere, and ionosphere.
The lower plots in Figure 3 and Figure 4 show the comparison of frequency residuals between the appearances of lunar ionosphere signatures and those without the electron concentration near the Moon’s surface. As the end of the ingress RO approaches, the residual frequency increases, while the dispersive medium created by near-surface electrons on the Moon causes GRAIL RSB’s phase delay.
4.2. GRAIL RO Electron Density
After removing the background trend from the two residual frequency time series displayed in Figure 3 and Figure 4, we can calculate the electron density using the method outlined in Section 2 (see (2) and (3)), utilizing the RO geometry determined by GRAIL orbits (https://naif.jpl.nasa.gov/pub/naif/pds/data/grail-l-spice-6-v1.0/grlsp_1000/aareadme.htm, accessed on 28 May 2025). Figure 5 and Figure 6 illustrate the electron density profiles retrieved from the selected residual frequency time series. The shaded area in these figures indicates the uncertainties in the electron density, which range approximately from 4.3– m−3 (denoted as ). The uncertainty () is calculated using Equation (6) in Section 3, with a standard deviation of the residual frequency () of 3.2 mHz and a spacecraft velocity (V) of 1.56 km/s. Figure 7 shows the electron density profile retrieved from South Pole terminator RO data at 05:38 UTC on 1 April 2012.
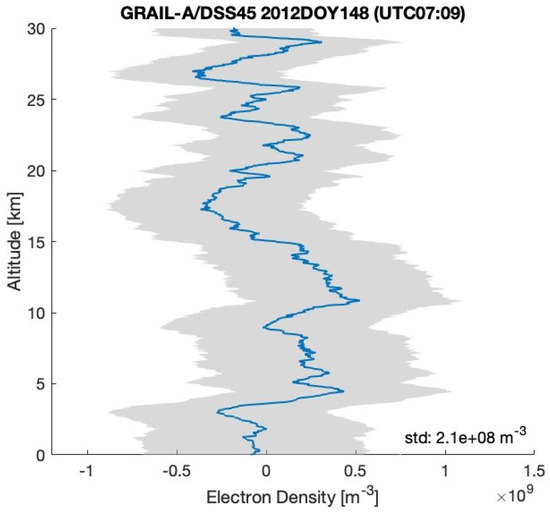
Figure 5.
The electron density profiles retrieved from the radio occultation residual frequency time series (GRAIL-A/DSS45 2012DOY148 (UTC 07:09)) shown in Figure 3. The RO observations located in the South Pole terminator region with SZA of about 88°.
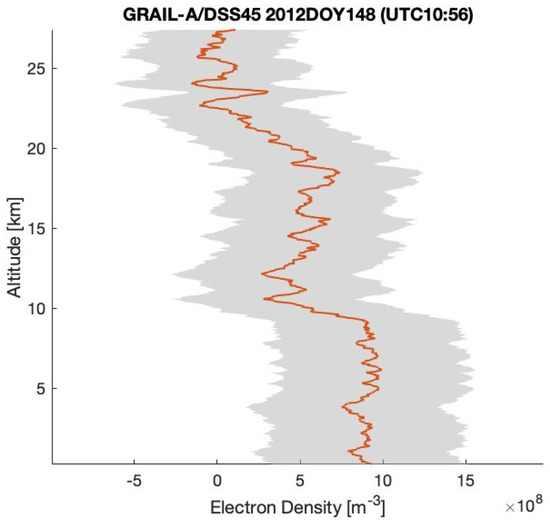
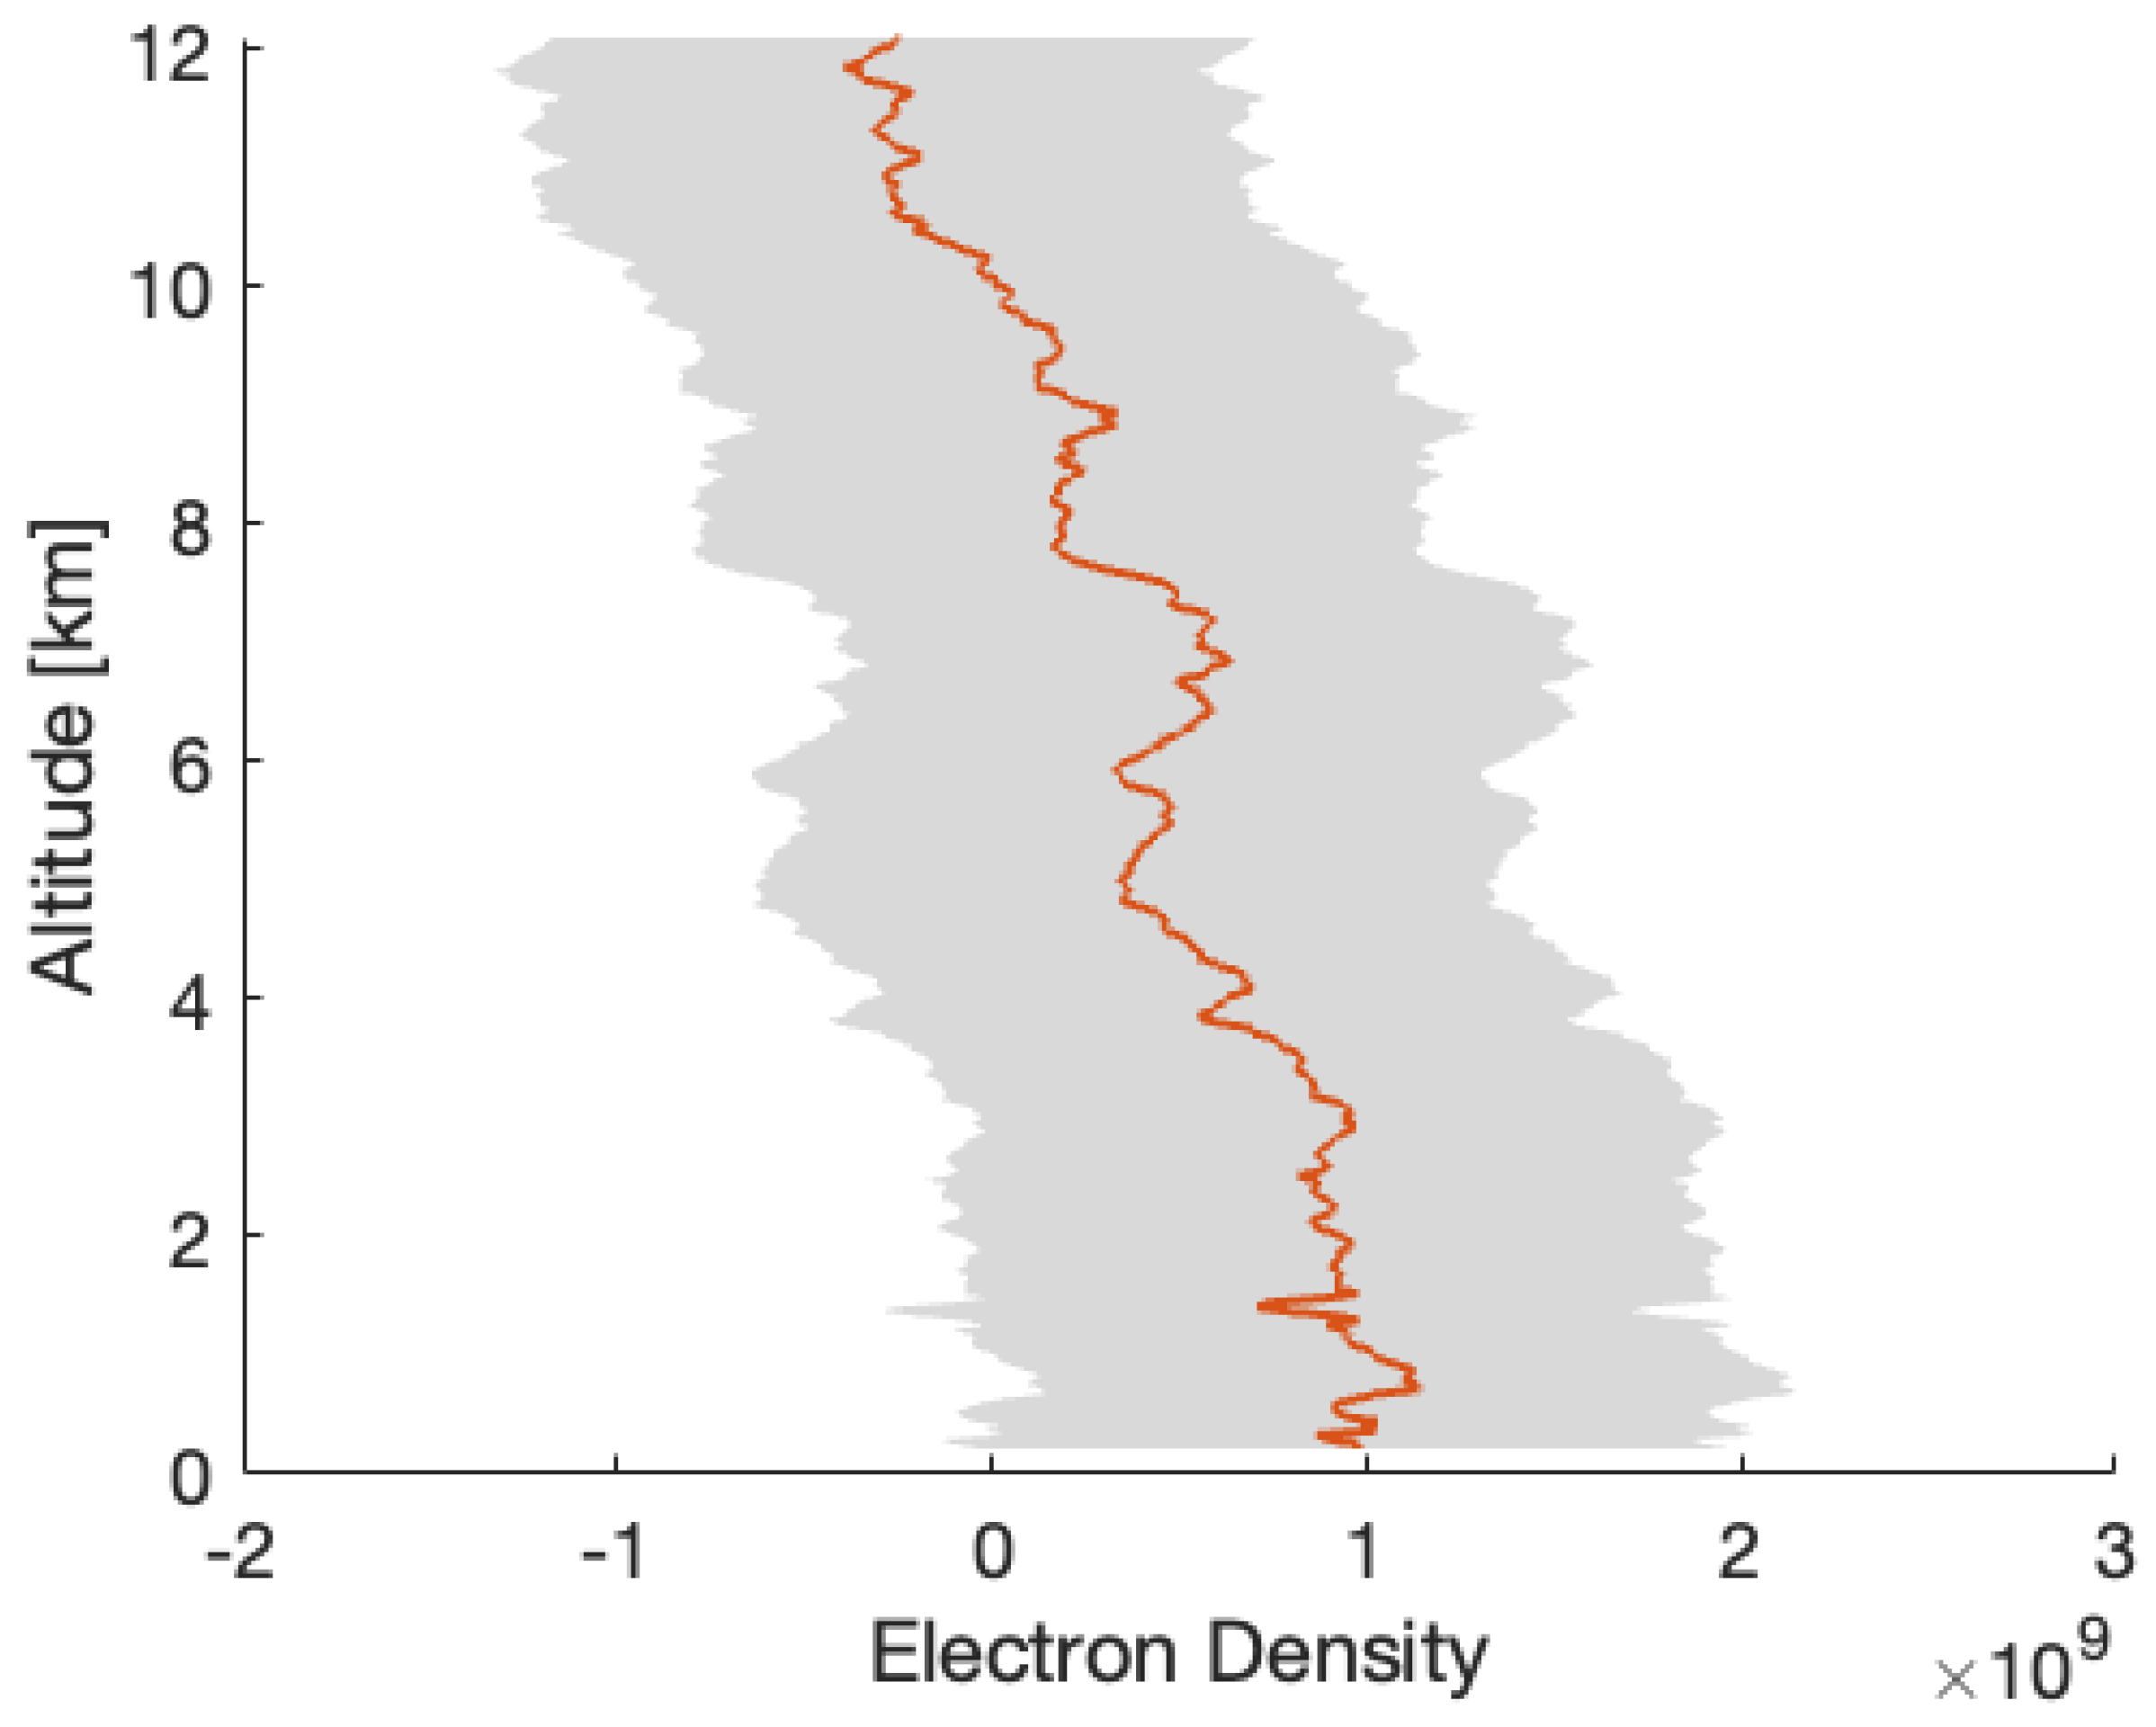
Figure 6.
The electron density profiles retrieved from the radio occultation residual frequency time series (GRAIL-A/DSS45 2012DOY148 (UTC 10:56)) shown in Figure 4. The RO observations located in the South Pole terminator region with SZA of about 88°.
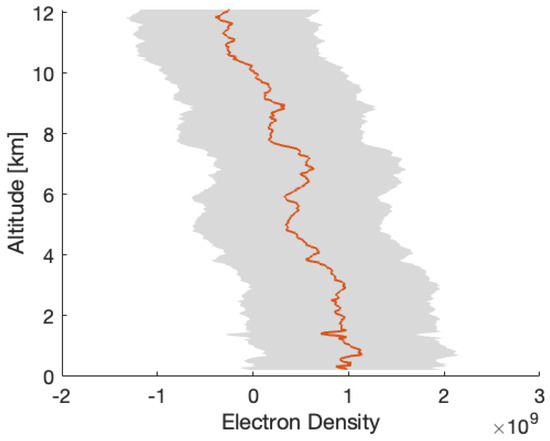
Figure 7.
The electron density profiles retrieved from the radio occultation (GRAIL-A/DSS45 2012DOY092 (UTC 05:38)) located in the South Pole terminator region with SZA of about 92°.
4.3. GRAIL RO Dust Density Profile Estimate
To estimate the density of charged particles () near the surface of the Moon, we used the method introduced in Section 3. We selected two particle sizes, μm and μm, based on observations from the LADEE/UVS (see Figure 1). Additionally, we considered surface potentials of 5 V and 40 V, as reported by [6,18,19]. This estimation utilizes the retrieved electron density profile, which indicates the presence of near-surface electron clouds. The density of charged particles, , is then determined using Equation (4). Figure 8 and Figure 9 present estimates of the dust density profiles for two selected particle sizes ( μm and 1 μm) and surface charging potentials ( V) from the RO observations on 1 April (Figure 6) and 27 May (Figure 7) 2012, respectively.
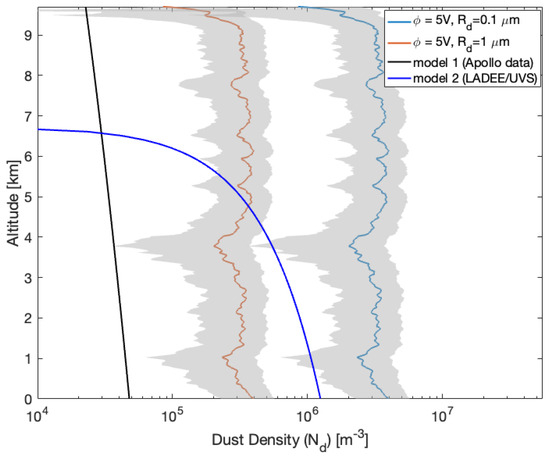
Figure 8.
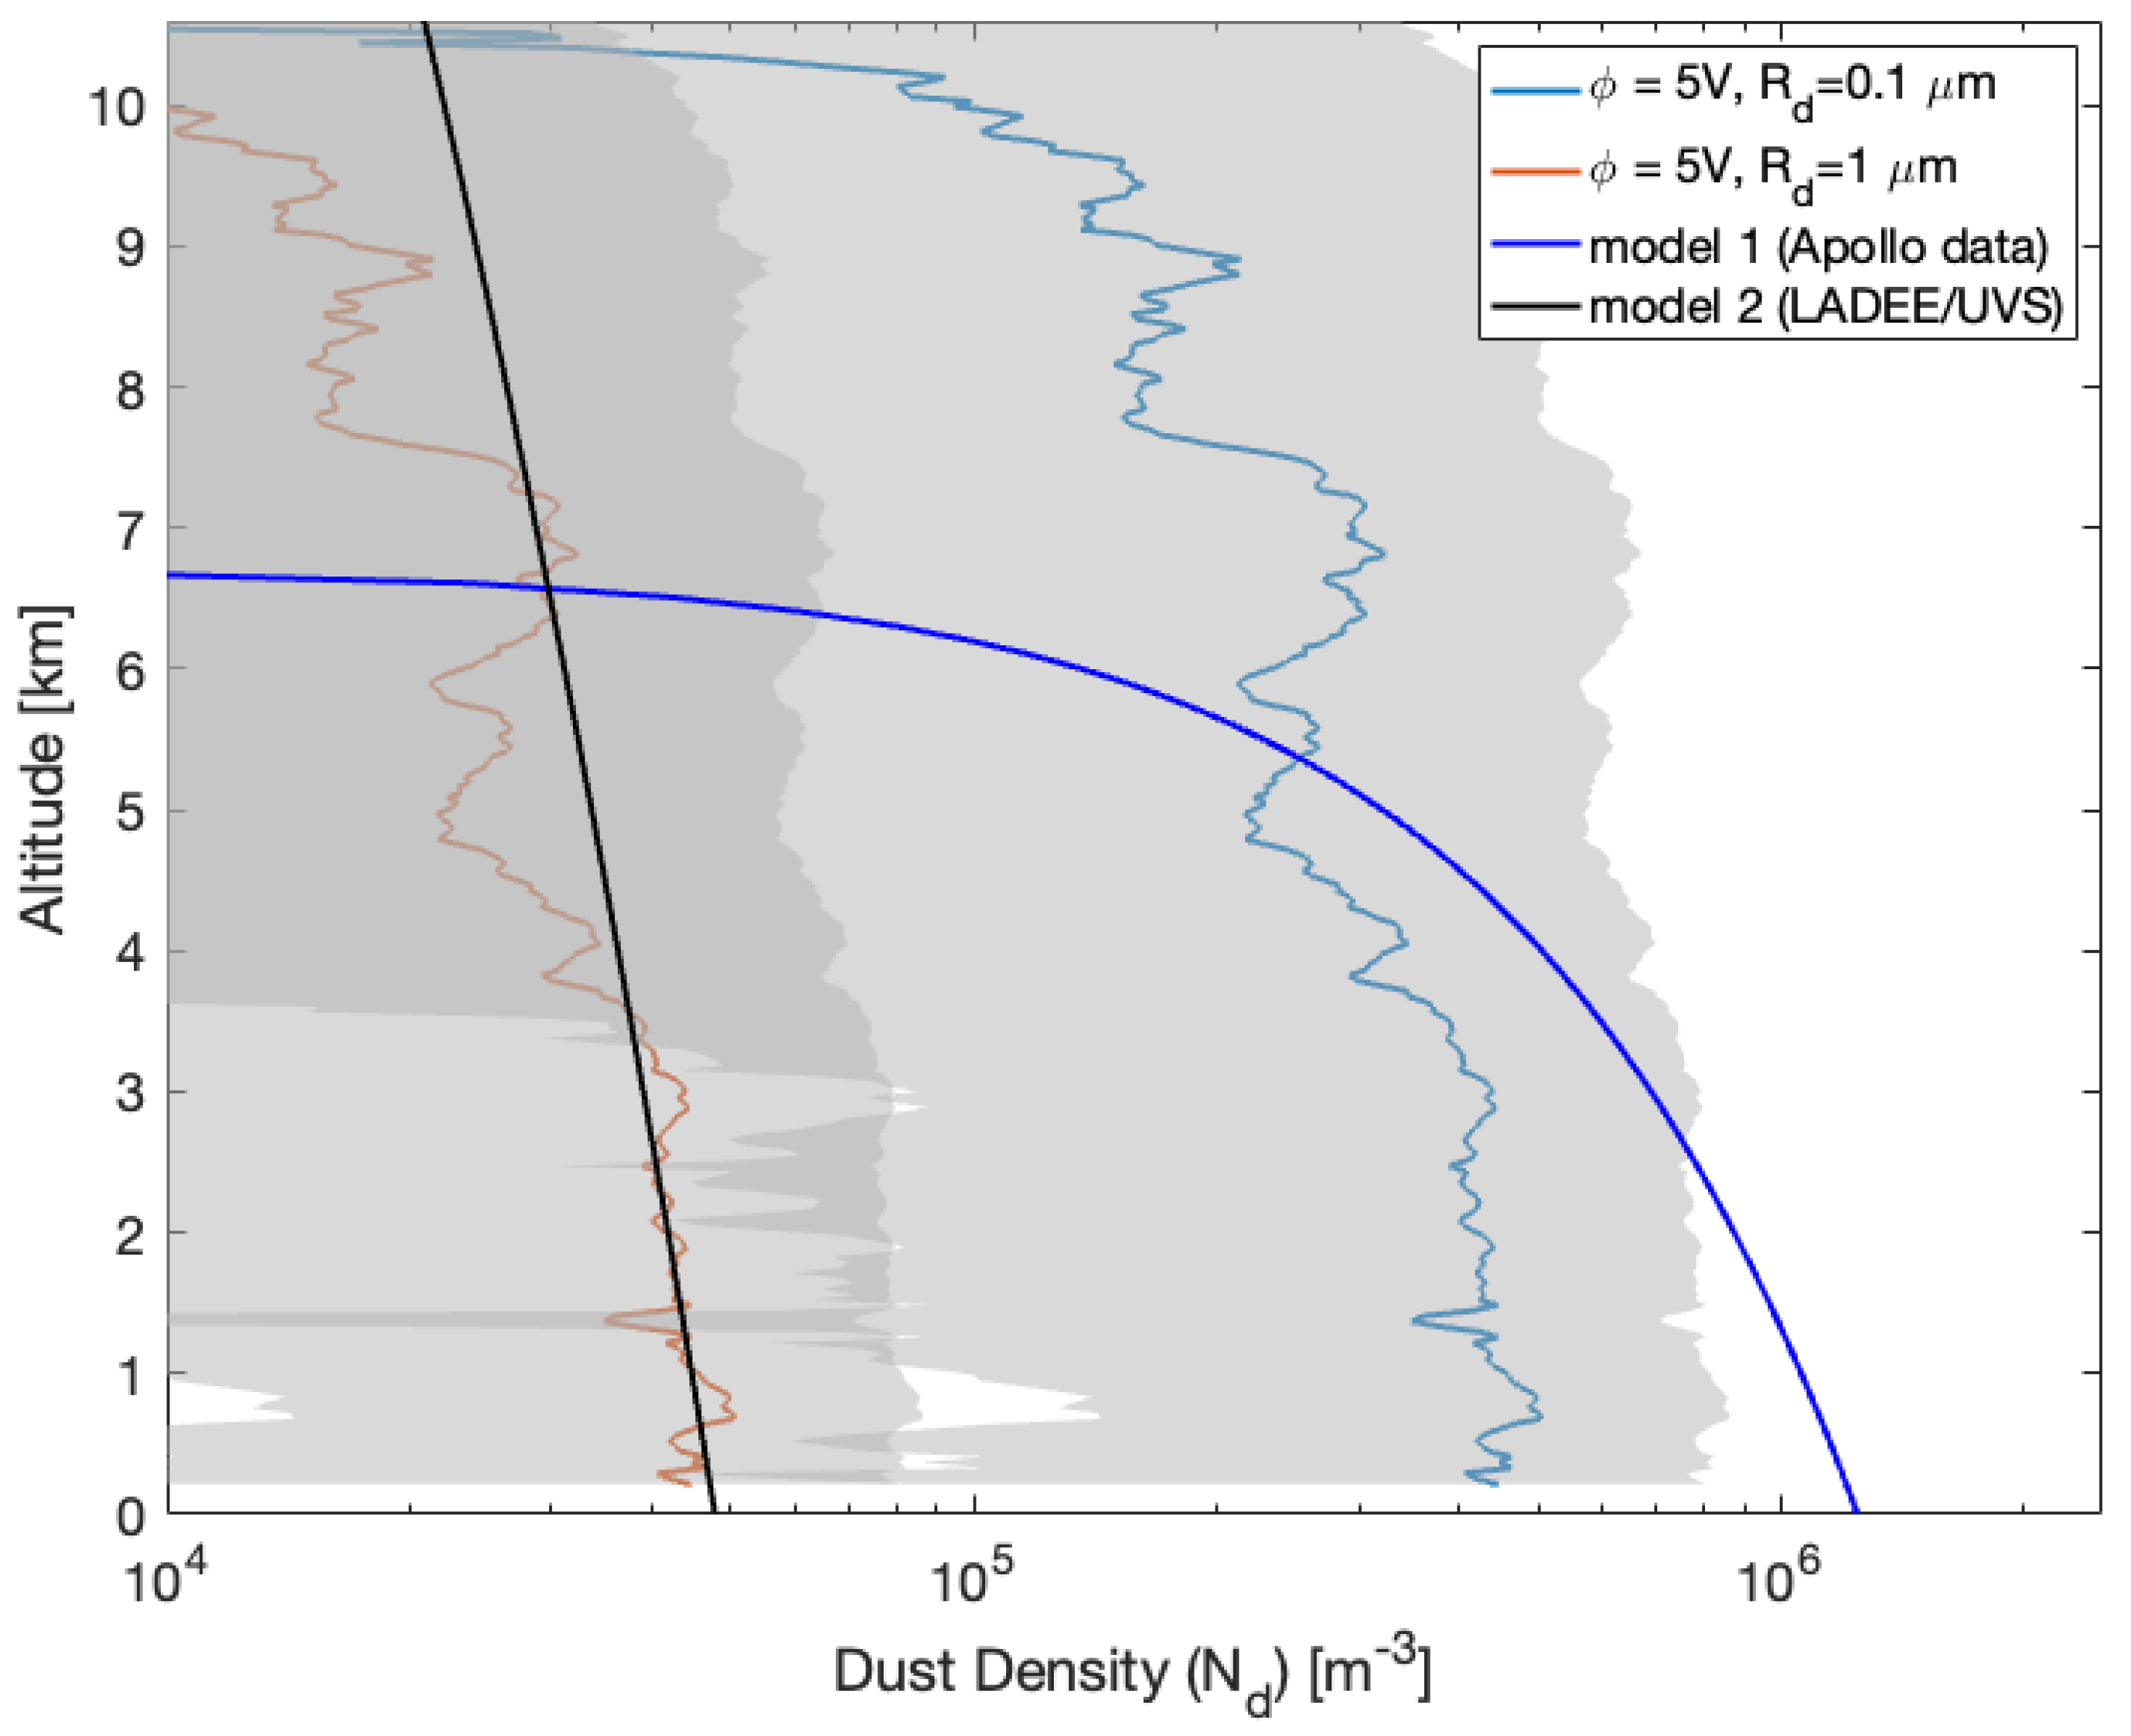
Dust density profiles estimated using the GRAIL RO residual frequency (GRAIL-A/DSS45 2012DOY148 (UTC 10:56)) with the charging potential 5 V and two dust particle sizes ( μm and μm) shown as blue and red profiles, respectively. The shaded area shows the dust density uncertainty.
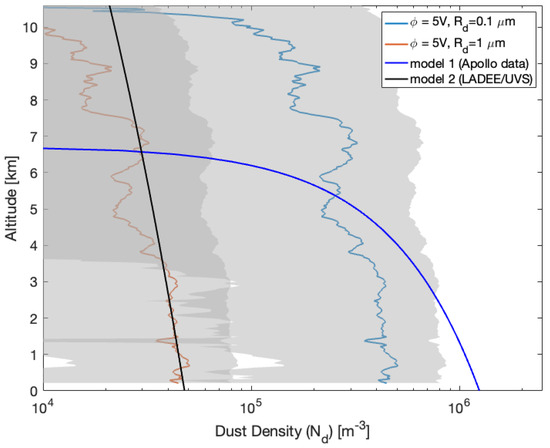
Figure 9.
Dust density profiles estimated using the GRAIL RO-derived electron density profile (Figure 7) with the charging potential 5 V and two dust particle sizes ( μm and μm) shown as blue and red profiles, respectively. The shaded area shows the dust density uncertainty.
Wang et al., (2016) [20] introduced a patched charge model to explain dust charging and lofting when dust particles are irradiated by ultraviolet (UV) light or an electron beam. This occurs due to the accumulation of photoelectrons or secondary electrons within microcavities of the regolith. The significant buildup of negative charges on dust grains generates a repulsive force strong enough to lift dust grains. The patched charge model has been supported by subsequent laboratory experiments ([21,22,23,24]), and it has been used to identify the initial conditions of lofted dust grains and predict their dynamics in the lunar terminator region.
Yeo et al., (2021) [19] employed a model to investigate the lofting of dust grains within a photoelectron sheath. The initial lofting velocity v and its relationship to the sizes of dust particles and surface potential is defined as follows:
In this equation, is the electric potential on the dust grains (, as described by [25]). The factor accounts for only half of the surface area exposed inside the microcavity.
Under typical conditions of positive charging to the surface, based on experimental results by [20], the maximum lofting heights on the Moon were approximately 30 cm for dust grains with a radius of and 3 km for grains with a radius of . This was observed with initial dust potentials () ranging from 1 to 10.5 V ([19]). The dust density profiles derived from GRAIL RO measurements, considering a potential of 5 V and a dust grain radius of , align with the 3 km loft height reported by [19], except in cases of observations related to coronal mass ejection (CME) events.
In the terminator region, lofting heights can vary from 8 to 120 km for dust grains with sizes of 0.01 μm and from 0.1 to 1.25 km for dust grains of 0.1 μm. These variations are influenced by different plasma conditions and sheath characteristics [26,27]. Moreover, inter-particle cohesive forces can lead to a wide range of velocity distributions [25]. Dust grains with larger negative values ( to 10.5 V) achieve higher launch velocities and spend less time in the photoelectron sheath. As a result, their lofting heights are less influenced by the sheath electric field, showing less than a difference compared to conditions influenced solely by gravity, as indicated by [19]. The modeled lofting heights align with the estimates from the GRAIL RO mission, where we observe high dust concentrations extending from the surface up to 10 km.
Additionally, Figure 8 and Figure 9 compare the observations of RO dust density profiles with two dust density models derived using Apollo (the black-colored line in the Figures) [3] and LADEE/UVS data (the blue-colored line in the Figures) [5]. Although surface densities are close to the two models, the RO density profiles show significant discrepancies from the modeled profiles above the lunar surface (Figure 8). The variations of RO-observed near-surface dust density concentrations imply the nature of dust motions in terminator regions; we hardly know the temporal variations from the two models derived using LADEE/UVS and Apollo data since these dust density models are functions of height, which implies stationary dust motions over their observing periods. Figure 8 and Figure 9 also indicate that the dust density trend decreases as altitudes increase, which is more consistent with the trend of the Apollo data-derived model.
5. Conclusions
During previous lunar missions, significant variations in dust density have been observed above and near the Moon’s surface, extending up to 20 km. The dust densities in these areas range from to . Recent studies, such as those conducted by [28], have demonstrated the feasibility of using GRAIL radio occultation (RO) data to derive electron density profiles. The assessment we provide as part of this publication indicates that the RO approach, using configurations like those of GRAIL, is sensitive enough to detect dust-electron densities in the Moon’s terminator regions, where previous research concluded that the electrostatically charged dust grains could be the primary source of near-surface electron concentrations [28]. We can estimate dust density in the terminator regions using these RO-derived electron densities by applying known values for dust charge and grain sizes obtained from past missions. The analysis reveals that RO observations can constrain the near-surface dust density to a range of to . Understanding the Moon’s dust concentration in the exosphere will help clarify the potential mechanisms behind forming a dense “ionosphere” on the Moon. Determining the near-surface dust concentration will provide valuable insight into the interactions between lunar-charged dust transport, such as levitation and lofting, and solar winds. This knowledge will also aid in the development of strategies for human exploration of the Moon.
RO data products, such as GRAIL, provide coverage from 0 to 100 km in altitude within polar regions. These products offer a fine vertical resolution of about 0.1 km, with a measurement uncertainty of up to for evaluating dust and electron levels. In addition, further research will be required to investigate other sources, such as out-gassing and meteor shower impacts, that could also contribute to near-surface electron concentrations besides ambient cis-lunar plasma and electrons resulting from photo-ionizing the thin neutral particles in the exosphere. However, these unique lunar RO observations can also significantly enhance the LADEE/LDEX measurement campaign, which focuses on the 3–250 km range over the equatorial regions. Furthermore, RO observations of lunar dust will offer clean reference data, free from interference of lander activities, for future studies on moon dust dynamics. This is especially important for the South Pole region, where future Artemis human missions are planned to land.
Author Contributions
Conceptualization, K.O. and Y.-M.Y.; methodology, K.O. and Y.-M.Y.; validation, K.O., Y.-M.Y., and D.E.; formal analysis, K.O., Y.-M.Y. and D.E.; funding acquisition, Y.-M.Y. and K.O.; writing—original draft preparation, K.O.; writing—review and editing, Y.-M.Y., D.E. and K.O. All authors have read and agreed to the published version of the manuscript.
Funding
This research was carried out at the Jet Propulsion Laboratory, California Institute of Technology, under a contract with the National Aeronautics and Space Administration. The research was supported by a NASA ROSES fund for the Lunar Data Analysis Program (LDAP). The funding was provided by the National Aeronautics and Space Administration through the Research Opportunities in Space and Earth Sciences funding opportunity number NNH22ZDA001N-LDAP© 2025. All rights reserved. California Institute of Technology. Government sponsorship acknowledged.
Data Availability Statement
The GRAIL’s Radio Science data archived in the NASA Planetary Data System (PDS) employed in this study are available to the scientific community. Currently, the data can be downloaded from the PDS (https://pds.nasa.gov).
Acknowledgments
The authors would like to thank the GRAIL project team for providing and maintaining the GRAIL radio science data collected that made this project possible.
Conflicts of Interest
The authors declare no conflicts of interest. The funders had no role in the design of the study; in the collection, analyses, or interpretation of data; in the writing of the manuscript; or in the decision to publish the results.
References
- Criswell, D.R. Horizon-Glow and the Motion of Lunar Dust. In Proceedings of the Photon and Particle Interactions with Surfaces in Space; Grard, R.J.L., Ed.; Astrophysics and Space Science Library. Springer: Dordrecht, The Netherlands, 1973; Volume 37, p. 545. [Google Scholar] [CrossRef]
- Rennilson, J.J.; Criswell, D.R. Surveyor Observations of Lunar Horizon-Glow. Moon 1974, 10, 121–142. [Google Scholar] [CrossRef]
- Glenar, D.A.; Stubbs, T.J.; McCoy, J.E.; Vondrak, R.R. A reanalysis of the Apollo light scattering observations, and implications for lunar exospheric dust. Planet. Space Sci. 2011, 59, 1695–1707. [Google Scholar] [CrossRef]
- Horányi, M.; Szalay, J.R.; Kempf, S.; Schmidt, J.; Grün, E.; Srama, R.; Sternovsky, Z. A permanent, asymmetric dust cloud around the Moon. Nature 2015, 522, 324–326. [Google Scholar] [CrossRef] [PubMed]
- Sharma, H.; Hedman, M.M.; Wooden, D.H.; Colaprete, A.; Cook, A.M. Constraining Low-Altitude Lunar Dust Using the LADEE-UVS Data. J. Geophys. Res. Planets 2021, 126, e2021JE006935. [Google Scholar] [CrossRef]
- Stubbs, T.; Glenar, D.; Farrell, W.; Vondrak, R.; Collier, M.; Halekas, J.; Delory, G. On the role of dust in the lunar ionosphere. Planet. Space Sci. 2011, 59, 1659–1664. [Google Scholar] [CrossRef]
- Reasoner, D.L.; Burke, W.J. Direct observation of the lunar photoelectron layer. Lunar Planet. Sci. Conf. Proc. 1972, 3, 2639. [Google Scholar]
- Vyshlov, A.S.; Savich, N.A.; Vasilyev, M.B.; Samoznaev, L.N.; Sidorenko, A.I.; Shtern, D.Y. Some results of cislunar plasma research. In NASA Special Publication; NASA: Washington, DC, USA, 1976; Volume 397, pp. 81–85. [Google Scholar]
- Imamura, T.; Nabatov, A.; Mochizuki, N.; Iwata, T.; Hanada, H.; Matsumoto, K.; Noda, H.; Kono, Y.; Liu, Q.; Futaana, Y.; et al. Radio occultation measurement of the electron density near the lunar surface using a subsatellite on the SELENE mission. J. Geophys. Res. Space Phys. 2012, 117. [Google Scholar] [CrossRef]
- Choudhary, R.K.; Ambili, K.M.; Choudhury, S.; Dhanya, M.B.; Bhardwaj, A. On the origin of the ionosphere at the Moon using results from Chandrayaan-1 S band radio occultation experiment and a photochemical model. Geophys. Res. Lett. 2016, 43, 10025–10033. [Google Scholar] [CrossRef]
- Tripathi, K.R.; Choudhary, R.K.; Ambili, K.M.; Bindu, K.R.; Manikantan, R.; Parikh, U. A study on the characteristic features of the lunar ionosphere using dual frequency radio science (DFRS) experiment onboard Chandrayaan-2 orbiter. Mon. Not. R. Astron. Soc. Lett. 2022, 515, L61–L66. [Google Scholar] [CrossRef]
- Dalba, P.A.; Withers, P. Cassini Radio Occultation Observations of Titan’s Ionosphere: The Complete Set of Electron Density Profiles. J. Geophys. Res. Space Phys. 2019, 124, 643–660. [Google Scholar] [CrossRef]
- Ambili, K.M.; Choudhary, R.K. Three-dimensional distribution of ions and electrons in the lunar ionosphere originated from the photochemical reactions. Mon. Not. R. Astron. Soc. 2021, 510, 3291–3300. [Google Scholar] [CrossRef]
- Xie, L.; Zhang, X.; Li, L.; Zhou, B.; Zhang, Y.; Yan, Q.; Feng, Y.; Guo, D.; Yu, S. Lunar Dust Fountain Observed Near Twilight Craters. Geophys. Res. Lett. 2020, 47, e2020GL089593. [Google Scholar] [CrossRef]
- Zhang, H.; Cao, J.; Lin, Y.; Wei, Y.; Li, L.; Zhang, X.; Lin, H.; Xie, L. Key Questions of Solar Wind–Moon Interaction. Space Sci. Technol. 2023, 3, 0060. [Google Scholar] [CrossRef]
- Phipps, P.H.; Withers, P. Radio occultations of the Io plasma torus by Juno are feasible. J. Geophys. Res. Space Phys. 2017, 122, 1731–1750. [Google Scholar] [CrossRef]
- Withers, P.; Stubbs, T.; Mazarico, E. A theoretical assessment of the feasibility of potential Lunar Reconnaissance Orbiter radio occultation observations of the lunar ionosphere. Adv. Space Res. 2021, 67, 4099–4109. [Google Scholar] [CrossRef]
- Wang, J.; He, X.; Cao, Y. Modeling Electrostatic Levitation of Dust Particles on Lunar Surface. IEEE Trans. Plasma Sci. 2008, 36, 2459–2466. [Google Scholar] [CrossRef]
- Yeo, L.H.; Wang, X.; Deca, J.; Hsu, H.W.; Horányi, M. Dynamics of electrostatically lofted dust on airless planetary bodies. Icarus 2021, 366, 114519. [Google Scholar] [CrossRef]
- Wang, X.; Schwan, J.; Hsu, H.W.; Grün, E.; Horányi, M. Dust charging and transport on airless planetary bodies. Geophys. Res. Lett. 2016, 43, 6103–6110. [Google Scholar] [CrossRef]
- Schwan, J.; Wang, X.; Hsu, H.W.; Grün, E.; Horányi, M. The charge state of electrostatically transported dust on regolith surfaces. Geophys. Res. Lett. 2017, 44, 3059–3065. [Google Scholar] [CrossRef]
- Dove, A.; Horányi, M.; Robertson, S.; Wang, X. Laboratory investigation of the effect of surface roughness on photoemission from surfaces in space. Planet. Space Sci. 2018, 156, 92–95. [Google Scholar] [CrossRef]
- Hood, N.; Carroll, A.; Mike, R.; Wang, X.; Schwan, J.; Hsu, H.W.; Horányi, M. Laboratory Investigation of Rate of Electrostatic Dust Lofting Over Time on Airless Planetary Bodies. Geophys. Res. Lett. 2018, 45, 13206–13212. [Google Scholar] [CrossRef]
- Orger, N.C.; Toyoda, K.; Masui, H.; Cho, M. Experimental investigation on silica dust lofting due to charging within micro-cavities and surface electric field in the vacuum chamber. Adv. Space Res. 2019, 63, 3270–3288. [Google Scholar] [CrossRef]
- Carroll, A.; Hood, N.; Mike, R.; Wang, X.; Hsu, H.W.; Horányi, M. Laboratory measurements of initial launch velocities of electrostatically lofted dust on airless planetary bodies. Icarus 2020, 352, 113972. [Google Scholar] [CrossRef]
- Örger, N.; Cordova Alarcon, J.R.; Toyoda, K.; Cho, M. Lunar Surface Charging and Electrostatic Lofting of Lunar Dust Particles under Different Solar Wind Conditions and Solar Ultraviolet Radiation. In Proceedings of the 13th Space Environment Symposium, Tokyo, Japan, 1–2 November 2016. [Google Scholar]
- Orger, N.C.; Cordova Alarcon, J.R.; Toyoda, K.; Cho, M. Lunar dust lofting due to surface electric field and charging within Micro-cavities between dust grains above the terminator region. Adv. Space Res. 2018, 62, 896–911. [Google Scholar] [CrossRef]
- Yang, Y.M.; Oudrhiri, K.; Withers, P.; Erwin, D.A.; Buccino, D.R.; Haha, I. Investigating Lunar Ionosphere Using GRAIL Radio Science Signals. In Proceedings of the 2024 EGU General Assembly Conference Abstracts, Vienna, Austria, 14–19 April 2024; p. 12526. [Google Scholar] [CrossRef]


Disclaimer/Publisher’s Note: The statements, opinions and data contained in all publications are solely those of the individual author(s) and contributor(s) and not of MDPI and/or the editor(s). MDPI and/or the editor(s) disclaim responsibility for any injury to people or property resulting from any ideas, methods, instructions or products referred to in the content. |
© 2025 by the authors. Licensee MDPI, Basel, Switzerland. This article is an open access article distributed under the terms and conditions of the Creative Commons Attribution (CC BY) license (https://creativecommons.org/licenses/by/4.0/).