Article

On Flood Detection Using Dual-Polarimetric SAR Observation

1
Department of Energy and Mineral Resources Engineering, Sejong University, 209 Neungdong-ro, Gwangjin-gu, Seoul 05006, Republic of Korea
2
Department of Geoinformation Engineering, Sejong University, 209 Neungdong-ro, Gwangjin-gu, Seoul 05006, Republic of Korea
*
Author to whom correspondence should be addressed.
Remote Sens. 2025, 17(11), 1931; https://doi.org/10.3390/rs17111931
Submission received: 6 April 2025 / Revised: 22 May 2025 / Accepted: 30 May 2025 / Published: 2 June 2025

Abstract

:
This study aims to elucidate the optimal exploitation of polarimetric scattering information in dual-pol SAR data. For an effective comparison of the flood detection performance between dual-pol parameters, we presented a simple fuzzy-based flood detection algorithm. Scattering characteristics of water surface and non-water land can vary depending on the region and flood conditions. Therefore, the flood detection performance of the dual-pol parameters was evaluated across three datasets with different geographic, climatic, and land cover conditions. The results demonstrated that accurate and stable performance in the detection of inundated areas under different surface conditions can be achieved by combining water body information from dual-pol channels in a disjunctive way. It also suggests that synergy in flood detection can be expected when using polarization observation data by considering each polarimetric channel as an independent information source and combining them rather than deriving the most relevant polarization parameter. Furthermore, combining common information from two dual-pol channels in a conjunctive way could provide the most reliable SAR flood detection results with minimum false alarms from the user’s perspective. Based on these experimental results, a two-class flood classification scheme was proposed for improving the applicability of SAR remote sensing in identifying flooded areas.

1. Introduction

Floods are the most common and frequent natural disasters worldwide that have devastating effects on humans and infrastructure. Considering the abrupt and fast movement of water bodies, rapid detection and monitoring of flood-affected areas is required. In this context, remote sensing technology has been widely used in flood response. In particular, Synthetic Aperture Radar (SAR) system enables all-weather observation and can be one of the most important tools in identifying flooded areas. Observation of floods using SAR systems has been mainly carried out based on the single polarization backscattering intensity. Several methods, e.g., histogram thresholding [1,2,3,4], supervised classification [5,6], and active contour models [7,8], have been applied to delineate flooded areas in the backscattering intensity.
Since water-covered areas typically exhibit lower radar backscatter values than other objects, flood detection using a simple histogram threshold approach has been widely used for the practical application of SAR data [9,10,11,12,13]. Nonetheless, water bodies may be missed or falsely detected depending on the radar scattering characteristics of the complex ground objects. Smooth surfaces with low backscatter can often be falsely detected as flooded areas, and dynamic water factors such as wind-driven surface waves make it difficult to distinguish submerged areas from other objects [12,13]. In addition, the radar shadow and double reflection phenomena, which can be caused by the scattering geometry of rugged terrain or elevated structures, also lead to false detection of water bodies in SAR images [10]. To improve the detectability of flood-affected areas, there have been several studies on the refinement of detection methodologies, such as novel strategies in histogram thresholding [14,15,16] and the combined use of SAR images and hydraulic models [17,18,19,20].
On the other hand, different polarization channels may convey different scattering information, and the abovementioned problems in intensity-based flood detection can be more pronounced or mitigated depending on the signal polarization. Several studies have explored polarimetric scattering characteristics to improve the detectability of flooded areas. In particular, studies have been focused on improving the performance of flood detection based on dual-polarization (dual-pol) data, which has been commonly used as a background observation mode in recent satellite-based SAR systems. Moser et al. [21] used the dual-pol (HH-VV) TerraSAR-X data to classify open water, flooded vegetation, irrigated cultivation, and land around the wetland using Kennaugh matrix elements that can facilitate the analysis of physical scattering mechanisms. Irwin et al. [22] also analyzed TerraSAR-X data and compared the water body detection performance of single- and dual-pol (HH-VV) data. They reported that by using dual-pol parameters, such as Kennaugh matrix elements and entropy/alpha parameters, it was possible to effectively identify areas of open water, ice-covered water, and flooded vegetation. On the other hand, Pham-Duc [23] performed a supervised classification of water bodies using dual-pol (VV-VH) Sentinel-1 data and reported improvements in classification accuracy by combined use of dual-pol intensities than those using single-pol intensity. Uddin et al. [24] proposed a method for water body detection using Sentinel-1 dual-pol (VV-VH) data. RGB images were constructed using VV and VH polarization intensities and VV to VH intensity ratio, and a two-class RGB clustering was applied to obtain water bodies and other classes.
Previous studies have reported the potential of dual-pol observations in improving the performance of classifying water bodies from SAR images. However, practical flood detection strategies that effectively utilize dual-pol data in the context of operational applications have not been fully investigated. This study aims to elucidate the optimal exploitation of polarimetric scattering information in rapid flood detection problems and to present a dual-pol SAR processing algorithm for generating a single reliable flood map. Here, we particularly focused on producing practical and timely flood information. In this context, we developed a simple algorithm that enables automated processing without training procedure or analyst intervention and is free from the baseline time-series SAR data archived in the same observation mode or other ancillary data. The dual-pol SAR in this study is defined as the case of transmitting a single fixed polarization and receiving the scattered wave in two coherent polarization channels. It can be one of the key SAR observational modes in monitoring flood events because it can obtain partial polarimetric scattering information without losing observation coverage. Among the available dual-pol data, we used C-band Sentinel-1 VH-VV mode data that transmits the V polarization signal and receives scattered signals at V and H polarization channels. The rest of the manuscript is organized as follows. The polarization information of dual-pol observation data and the methodology for detecting water bodies using them are described in Section 2. Section 3 presents experimental results evaluating the optimal polarization-based flood map for several recent flood events. Section 4 evaluates our results in comparison to previous studies and discusses the sources of variation in flood detection performance. Finally, the summary and concluding remarks are presented in Section 5.

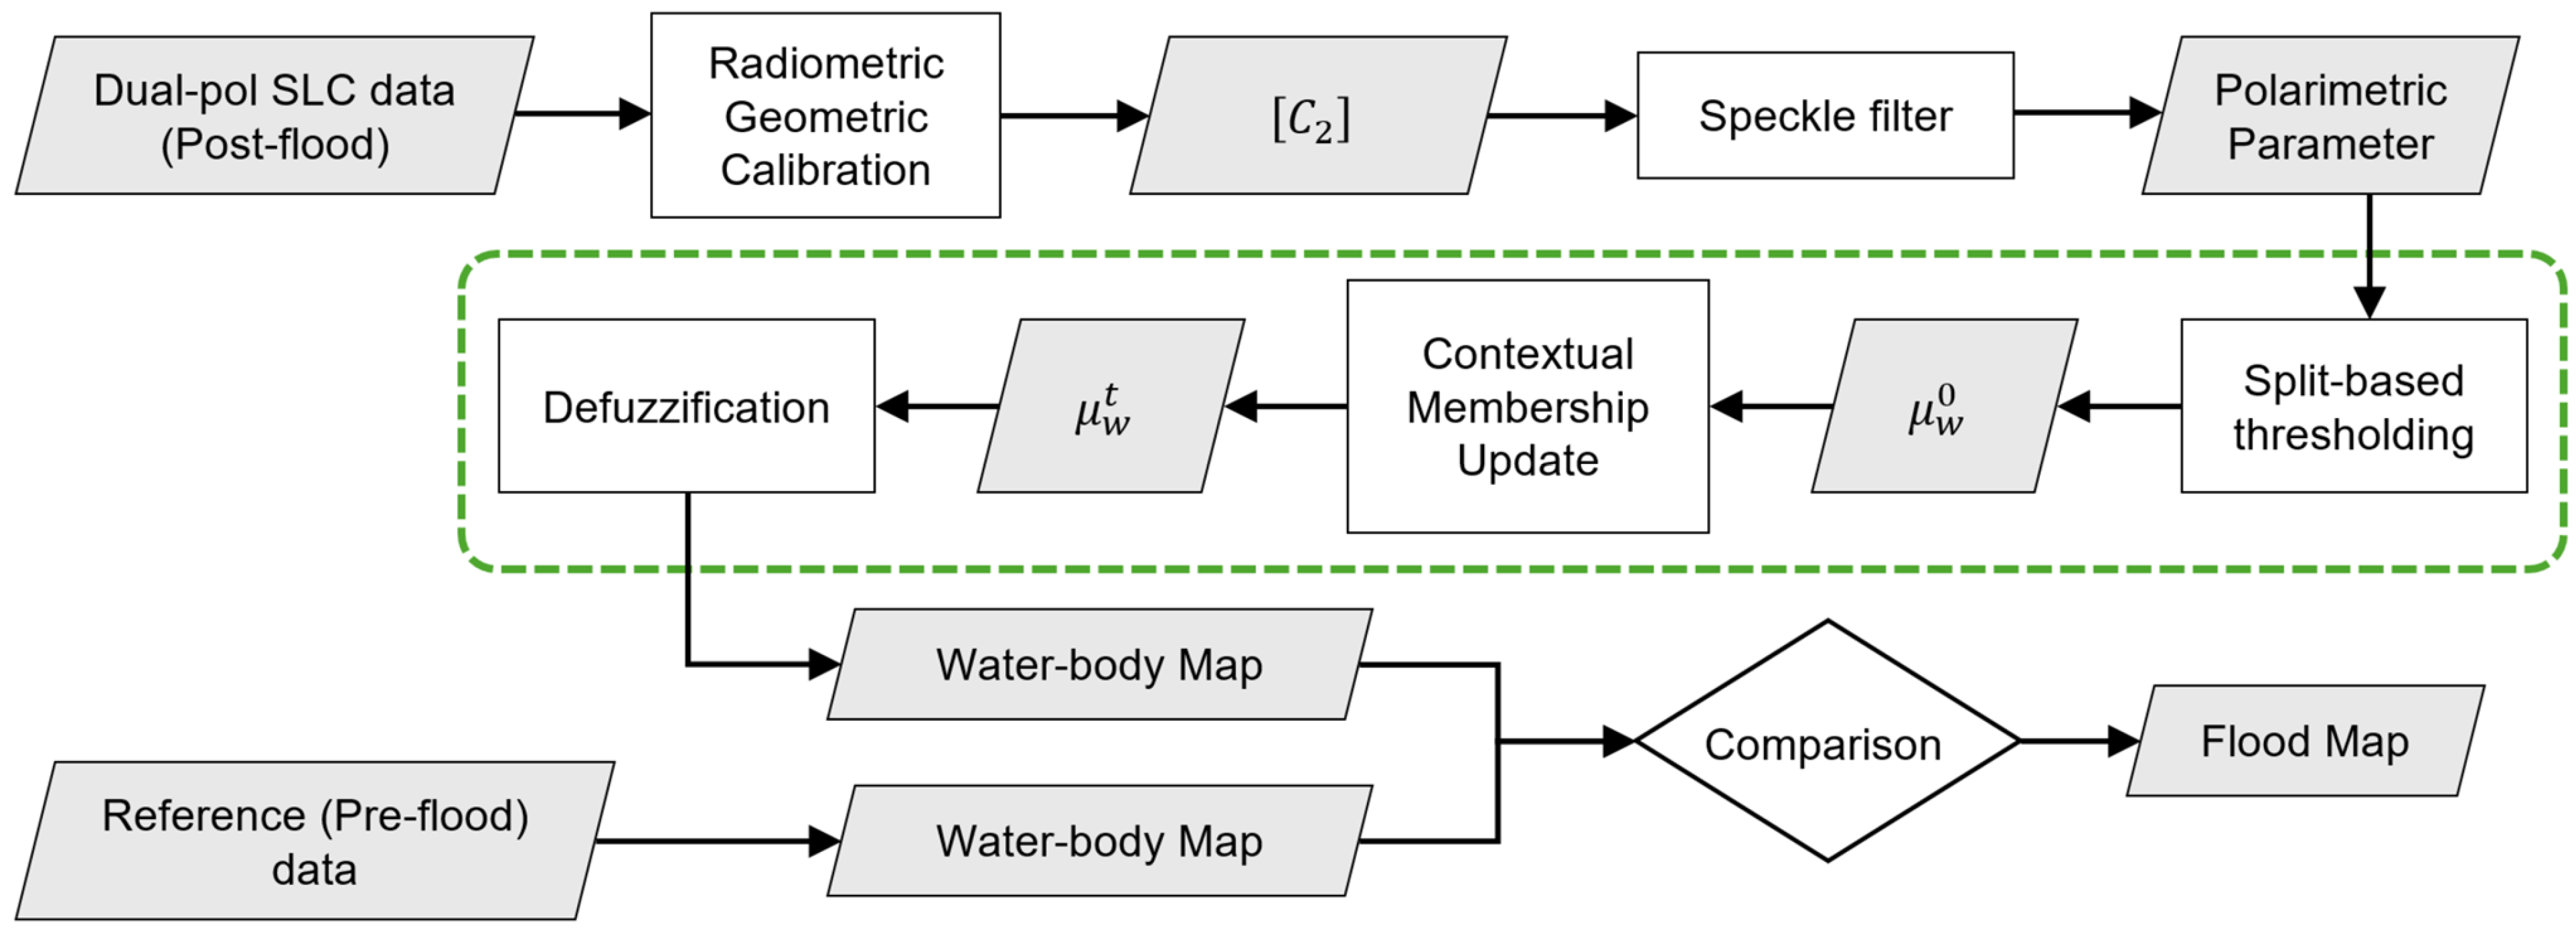
2. Dual-Pol Flood Detection Methods

2.1. Dual-Pol Scattering Observation

The basic observation of dual-pol SAR data for the V polarization transmission can be defined as the 2 × 2 complex covariance matrix C 2 as follows:
C 2 = S V V S V V * S V V S V H * S V H S V V * S V H S V H *
The diagonal terms of the covariance matrix are the backscatter intensities | S V V | 2 and | S V H | 2 at VV and VH polarization channels, respectively. The off-diagonal term corresponds to the correlation properties between the dual-pol scattering amplitudes. Since naturally distributed scatterers generally have no co- and cross-pol correlations [25], VV- and VH-pol intensities can be the two main parameters explaining the scattering properties of the dual-pol covariance matrix.
Instead of the two intensity parameters, one may be interested in deriving a single representative dual-pol observation for describing scattering properties. In this case, the span of the covariance matrix shown in (2) can be a useful tool to represent the overall scattering intensity.
S p a n = t r [ C 2 ] = | S V V | 2 + | S V H | 2
where t r ( ) is the trace of a matrix. In addition to the scattering intensity information, it is important to understand the signal depolarization properties in interpreting the scattering characteristics of distributed scatterers. If we want to highlight depolarization properties, the degree of polarization D o P defined as (3) [26] can be used as a representative parameter characterizing the dual-pol covariance matrix.
D o P = 1 4 d e t ( C 2 ) t r [ C 2 ] 2
where d e t ( ) is the determinant of a matrix. It ranges from 0 for random scattering to 1 for a completely polarized signal.
Considering both intensity and depolarization information of the scattering media, another matrix-characterizing parameter, named the Shannon entropy ( S E ), has been developed to effectively characterize scattering properties in the observed covariance matrix. It can be defined as the sum of the two contributions related to overall intensity and degree of polarization as follows [27]:
S E = 2 log π e 2 t r [ C 2 ] + log 4 d e t ( C 2 ) t r [ C 2 ] 2
It has been reported that S E derived from fully polarimetric SAR data can improve the performance of water body detection [28,29]. In the case of dual-pol SAR, Betbeder et al. [30] showed that dual-pol S E can be an effective tool for distinguishing wetland vegetation.

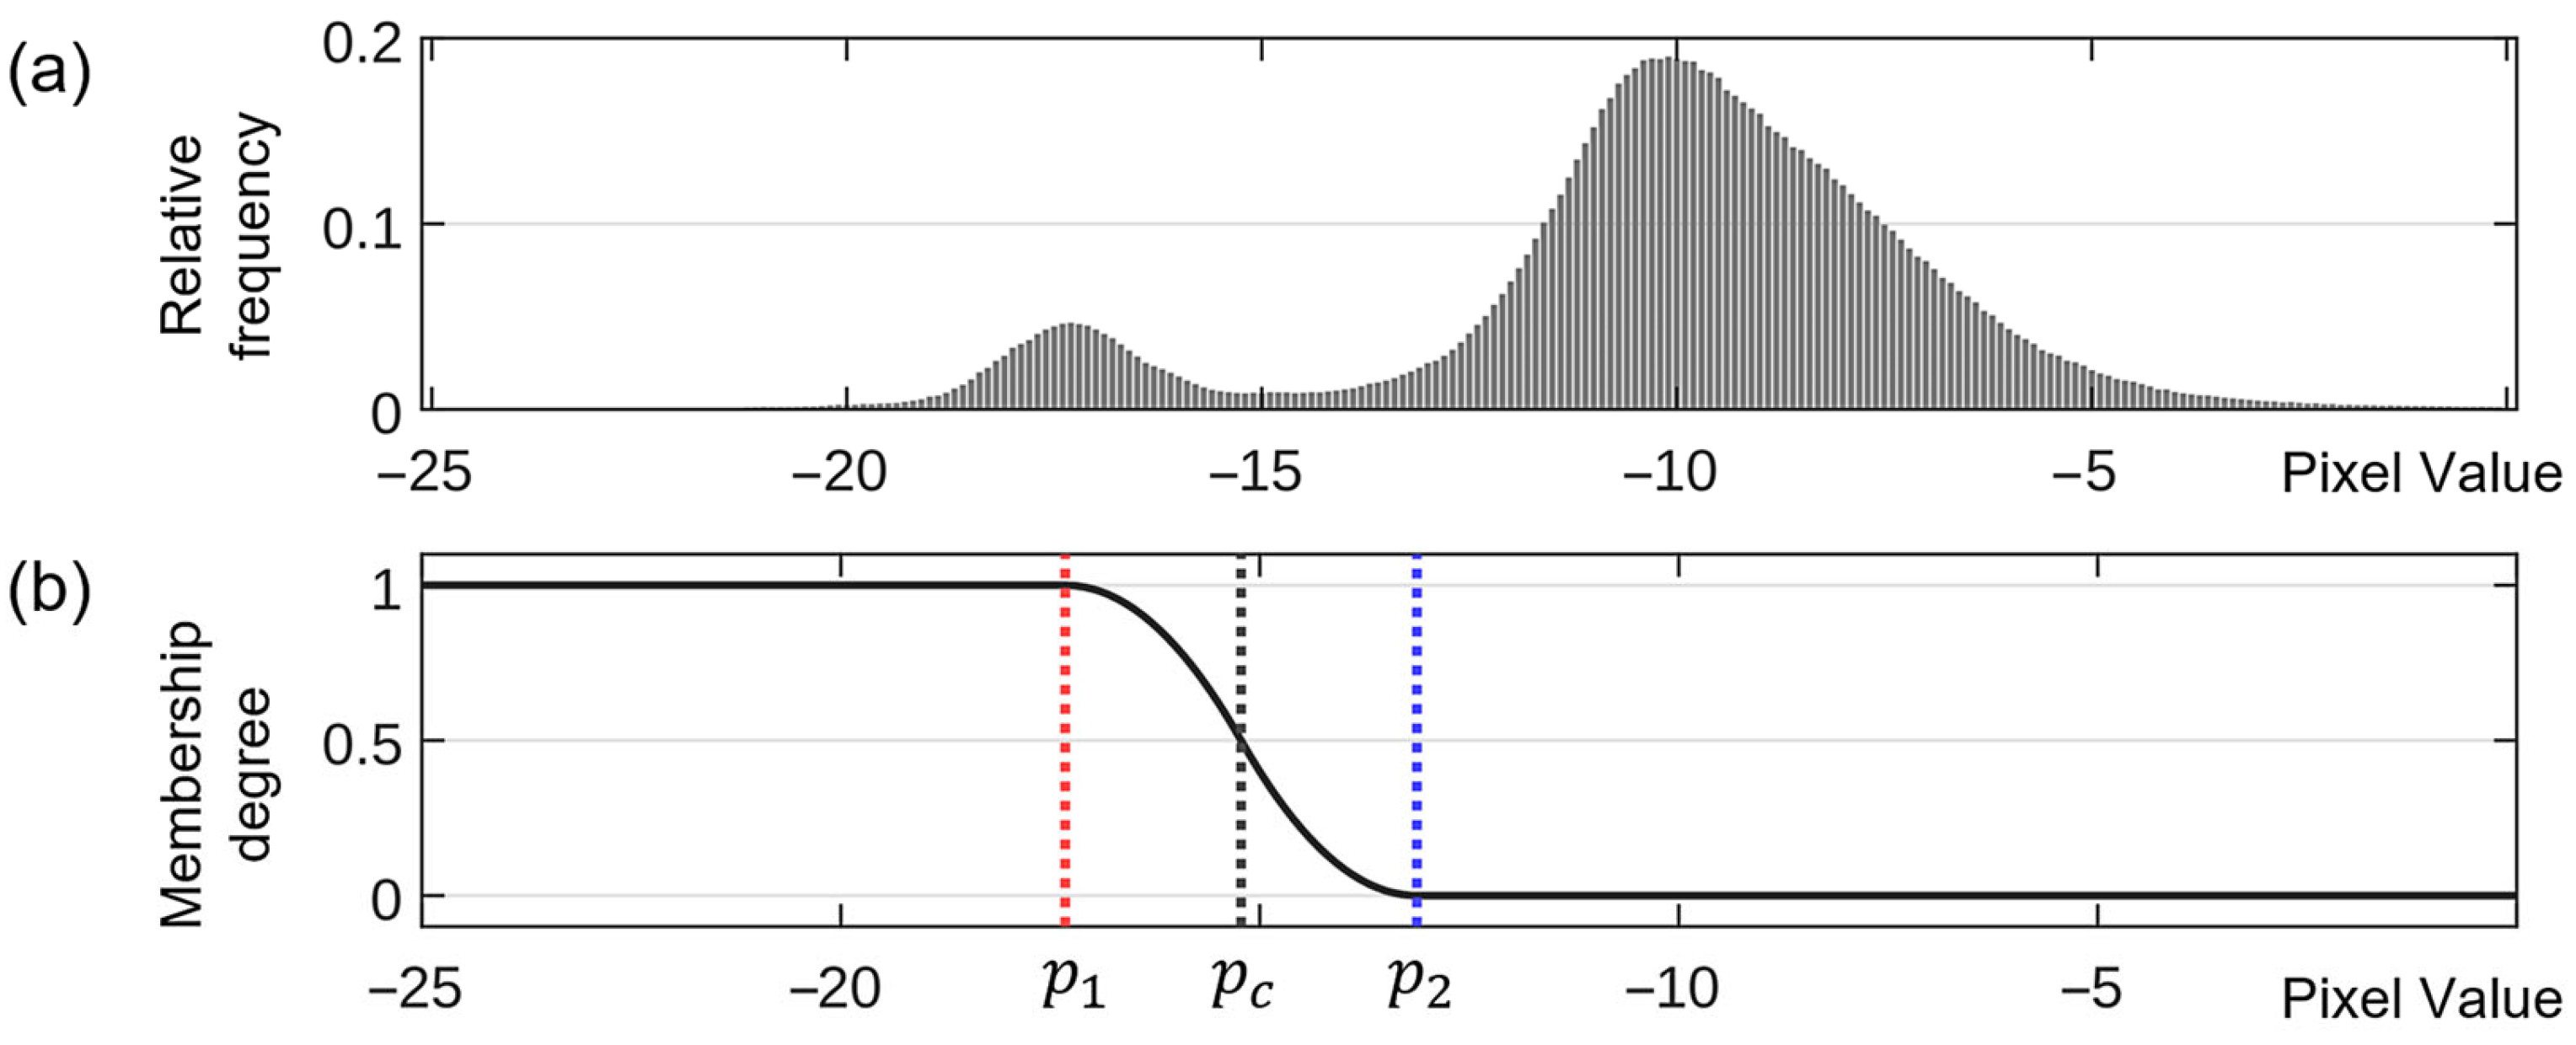
2.2. Flood Detection Using the Selected Dual-Pol Parameters

Since it is difficult to discriminate transient water bodies from permanent standing water in a single image, most flood detection studies have used the change detection approaches. Unsupervised flood detection using change detection approaches is often performed by applying image segmentation or histogram thresholding techniques to change-enhanced images, such as a difference image, between images before and after floods to identify change pixels possibly related to floods [12,14,31,32,33,34]. However, when images with different observation conditions are used to observe ground changes, the difference image includes changes unrelated to the change of interest or due to unintended differences in observation conditions. Therefore, it is required to implement a change detection approach that is less affected by radiometric changes caused by different observation conditions unrelated to flooding. In this context, this study selected the post-classification comparison approach to identify flooded areas by independently classifying water bodies in SAR images of each period and comparing water classes before and after the flood events.
The methodology centers on automatically detecting water bodies in a single SAR image. In particular, since we focus on comparing and evaluating the performance of dual-pol parameters rather than devising a new detection strategy, the water body detection method itself should be as simple as possible, applicable to the different characteristics of dual-pol parameters, computationally efficient, and easily extendable to combine different dual-pol parameters. The fuzzy set theory [35] can be one of the useful tools that can provide a general mathematical framework for different data having different physical and numerical characteristics [11,36,37]. Figure 1 illustrates the overall fuzzy-based processing flow adopted in this study. This section focuses on presenting a fuzzy-based water body detection system for a selected dual-pol parameter marked in the green box in Figure 1.
A pixel value in the selected dual-pol parameter X is often vague to be assigned either target (water body) or clutter (non-water) classes. Such vagueness can be expressed in terms of fuzzy set theory, and each element of the selected dual-pol parameter can be mapped into the membership grade to water class, i.e., μ w X [ 0,1 ] . In order to apply the fuzzy concept in the water body detection, we need to determine the membership grade for each pixel of the dual-pol parameter. Considering the radar scattering characteristics on water-covered areas, we proposed a histogram-based membership grade determination strategy. Since water bodies have characteristic low scattering intensity and scattering disorder, they usually exhibit significantly different values compared to other objects. Figure 2a shows a typical histogram of SAR images containing a significant portion of water bodies. Based on the image histogram, we defined the membership grade of the target class using the standard Z-function [38] as shown in Figure 2b. The membership grades μ w x k for the k t h pixel x k of the dual-pol image X can be written as:
μ w x k = 1 x k p 1 1 2 x k p 1 / p 2 p 1 2 p 1 x k p c 2 x k p 2 / p 2 p 1 2 p c x k p 2 0 x k p 2
For obtaining membership grade from the given x k , it is necessary to define the cross-over point p c = p 1 + p 2 / 2 and one of the fuzzy thresholds either p 1 or p 2 . To support an automated flood detection system, these parameters of the membership function determined set using the image thresholding method using the Expectation-Maximization (EM) technique [39,40]. Global thresholding has been widely used to distinguish between objects with distinct observation values, but the selection of an appropriate threshold can be a difficult problem when the histogram is not bimodal. In particular, if the spatial extent of water bodies is limited to a small portion of the full observation coverage, the histogram may not be ideally bimodal, and there may be difficulties in applying the conventional global thresholding technique [41].
As a simple way to address this issue, some studies have proposed a strategy to partition the entire image into subimages and derive thresholds only for subimages or blocks that are likely to contain both water and non-water classes [9,13,15,41]. To prevent erroneous threshold selection while ensuring automated processing, this study applied the split-based optimal thresholding method [41]. It performs a bimodality test on the subimages and estimates the probability density functions for the water and non-water classes and global threshold value exclusively using the subimages having a bimodal histogram. The thresholding procedure can be summarized as follows:
(1)
Split the entire image into N non-overlapping subimages of user-defined size.
(2)
Apply a bimodality test, such as Hartigan’s dip statistic (HDS) [42], to each subimage.
(3)
Select L subimages with a p -value of HDS less than 0.01.
(4)
Define a new vector given by the union of pixel values of all the L selected subimages.
(5)
Compute threshold value T and the mean values m w associated with the water class, respectively, by applying the EM technique.
The fuzzy membership grade in (5) can be determined using the estimates obtained by the EM technique for the selected dual-pol parameter X . The cross-over point p c was set equal to the global threshold, such as p c = T , and the fuzzy thresholds p 1 and p 2 were defined by using the mean value of the water class m w , as p 1 = m w and p 2 = 2 T m w .
Since the membership grade is determined exclusively by the pixel value, there may be noisy memberships for small and scattered areas that show weak signals independent of the water body. Given the spatially connected nature of water bodies, spatial contextual information was considered in the fuzzy processing system to improve the discriminability of the membership grade. In this study, we adopted the iterative contextual membership updating process using the local neighborhood of a pixel [43]. Let μ w 0 denote the initial membership grade given by (5). The contextual membership updates of the pixel under consideration x 0 at (t) iteration, μ w t ( x 0 ) , can be obtained by:
μ w t ( x 0 ) = 0 , if   μ w t 1 x 0 = 0 1 n j N 0 μ w t 1 ( x j ) , if   μ w t 1 x 0 0
where N 0 is the local neighborhood system and n is the number of pixels in the local neighborhood.
After updating the contextual membership grade, we can obtain a hard membership or a binary detection map through the defuzzification process. The pixel value of the detection map at (t) iteration Ω t was generated accordingly with a simple decision rule, such as
Ω t ( x 0 ) = 1 , i f   ( μ w t ( x 0 ) 0.5 ) 0 , i f   ( μ w t x 0 < 0.5 )
The iteration stops when the percentage of newly labeled pixels becomes smaller than 0.1%.
The final processing step is performed based on the water body detection results obtained for the post-flood image in comparison with the standing water areas derived from either pre-flood image or available reference water map. In this study, the water body detection results using the dual-pol SAR image obtained just before the flood were used as the standing water areas for comparison. The flood detection map is generated by determining the pixel as a flood area if it is classified as a non-water class in the pre-flood condition and becomes a water class in the post-flood image.

2.3. Flood Detection Using the Fusion of Dual-Pol Intensities

The scattering properties in the dual-pol covariance matrix observed in the naturally distributed scatterers can be fully described by the co- and cross-pol intensities | S V V | 2 and | S V H | 2 , respectively. Here, it is important to note that the co- and cross-pol scattering intensities may highlight different aspects of the scattering properties of ground scatterers. For example, VV-pol intensity may not detect water bodies with rough surfaces, but it can be useful in distinguishing water bodies in vegetated areas. On the other hand, VH-pol intensity may cause false alarms in non-water regions with dominant single-bounce scattering but may reduce the missed detection for water bodies. In this context, the intensity fusion strategy can be considered in flood detection to exploit the synergy between the two polarization scattering information.
One of the advantages of using the fuzzy set as a tool for water body detection is that it provides an effective mathematical framework for information fusion. The membership grade of each scattering intensity can be combined through fuzzy operators. In this study, two different fuzzy operators, conjunctive and disjunctive types, were used to evaluate the effective combination of co- and cross-pol intensities. The contextual membership grade of the two scattering intensities μ w V V and μ w V H can be aggregated using a simple conjunctive-type operator, fuzzy intersection, and a disjunctive-type operator, fuzzy union, as follows
μ w V V V H = min μ w V V , μ w V H
μ w V V V H = m ax μ w V V , μ w V H
Then the combined membership grade can be plugged into the defuzzification and flood detection process in Figure 1. In the defuzzification step, the same decision rule in equation (7) as in the flood detection of a single selected dual-pol parameter was used for the aggregated membership grade.

3. Experimental Results
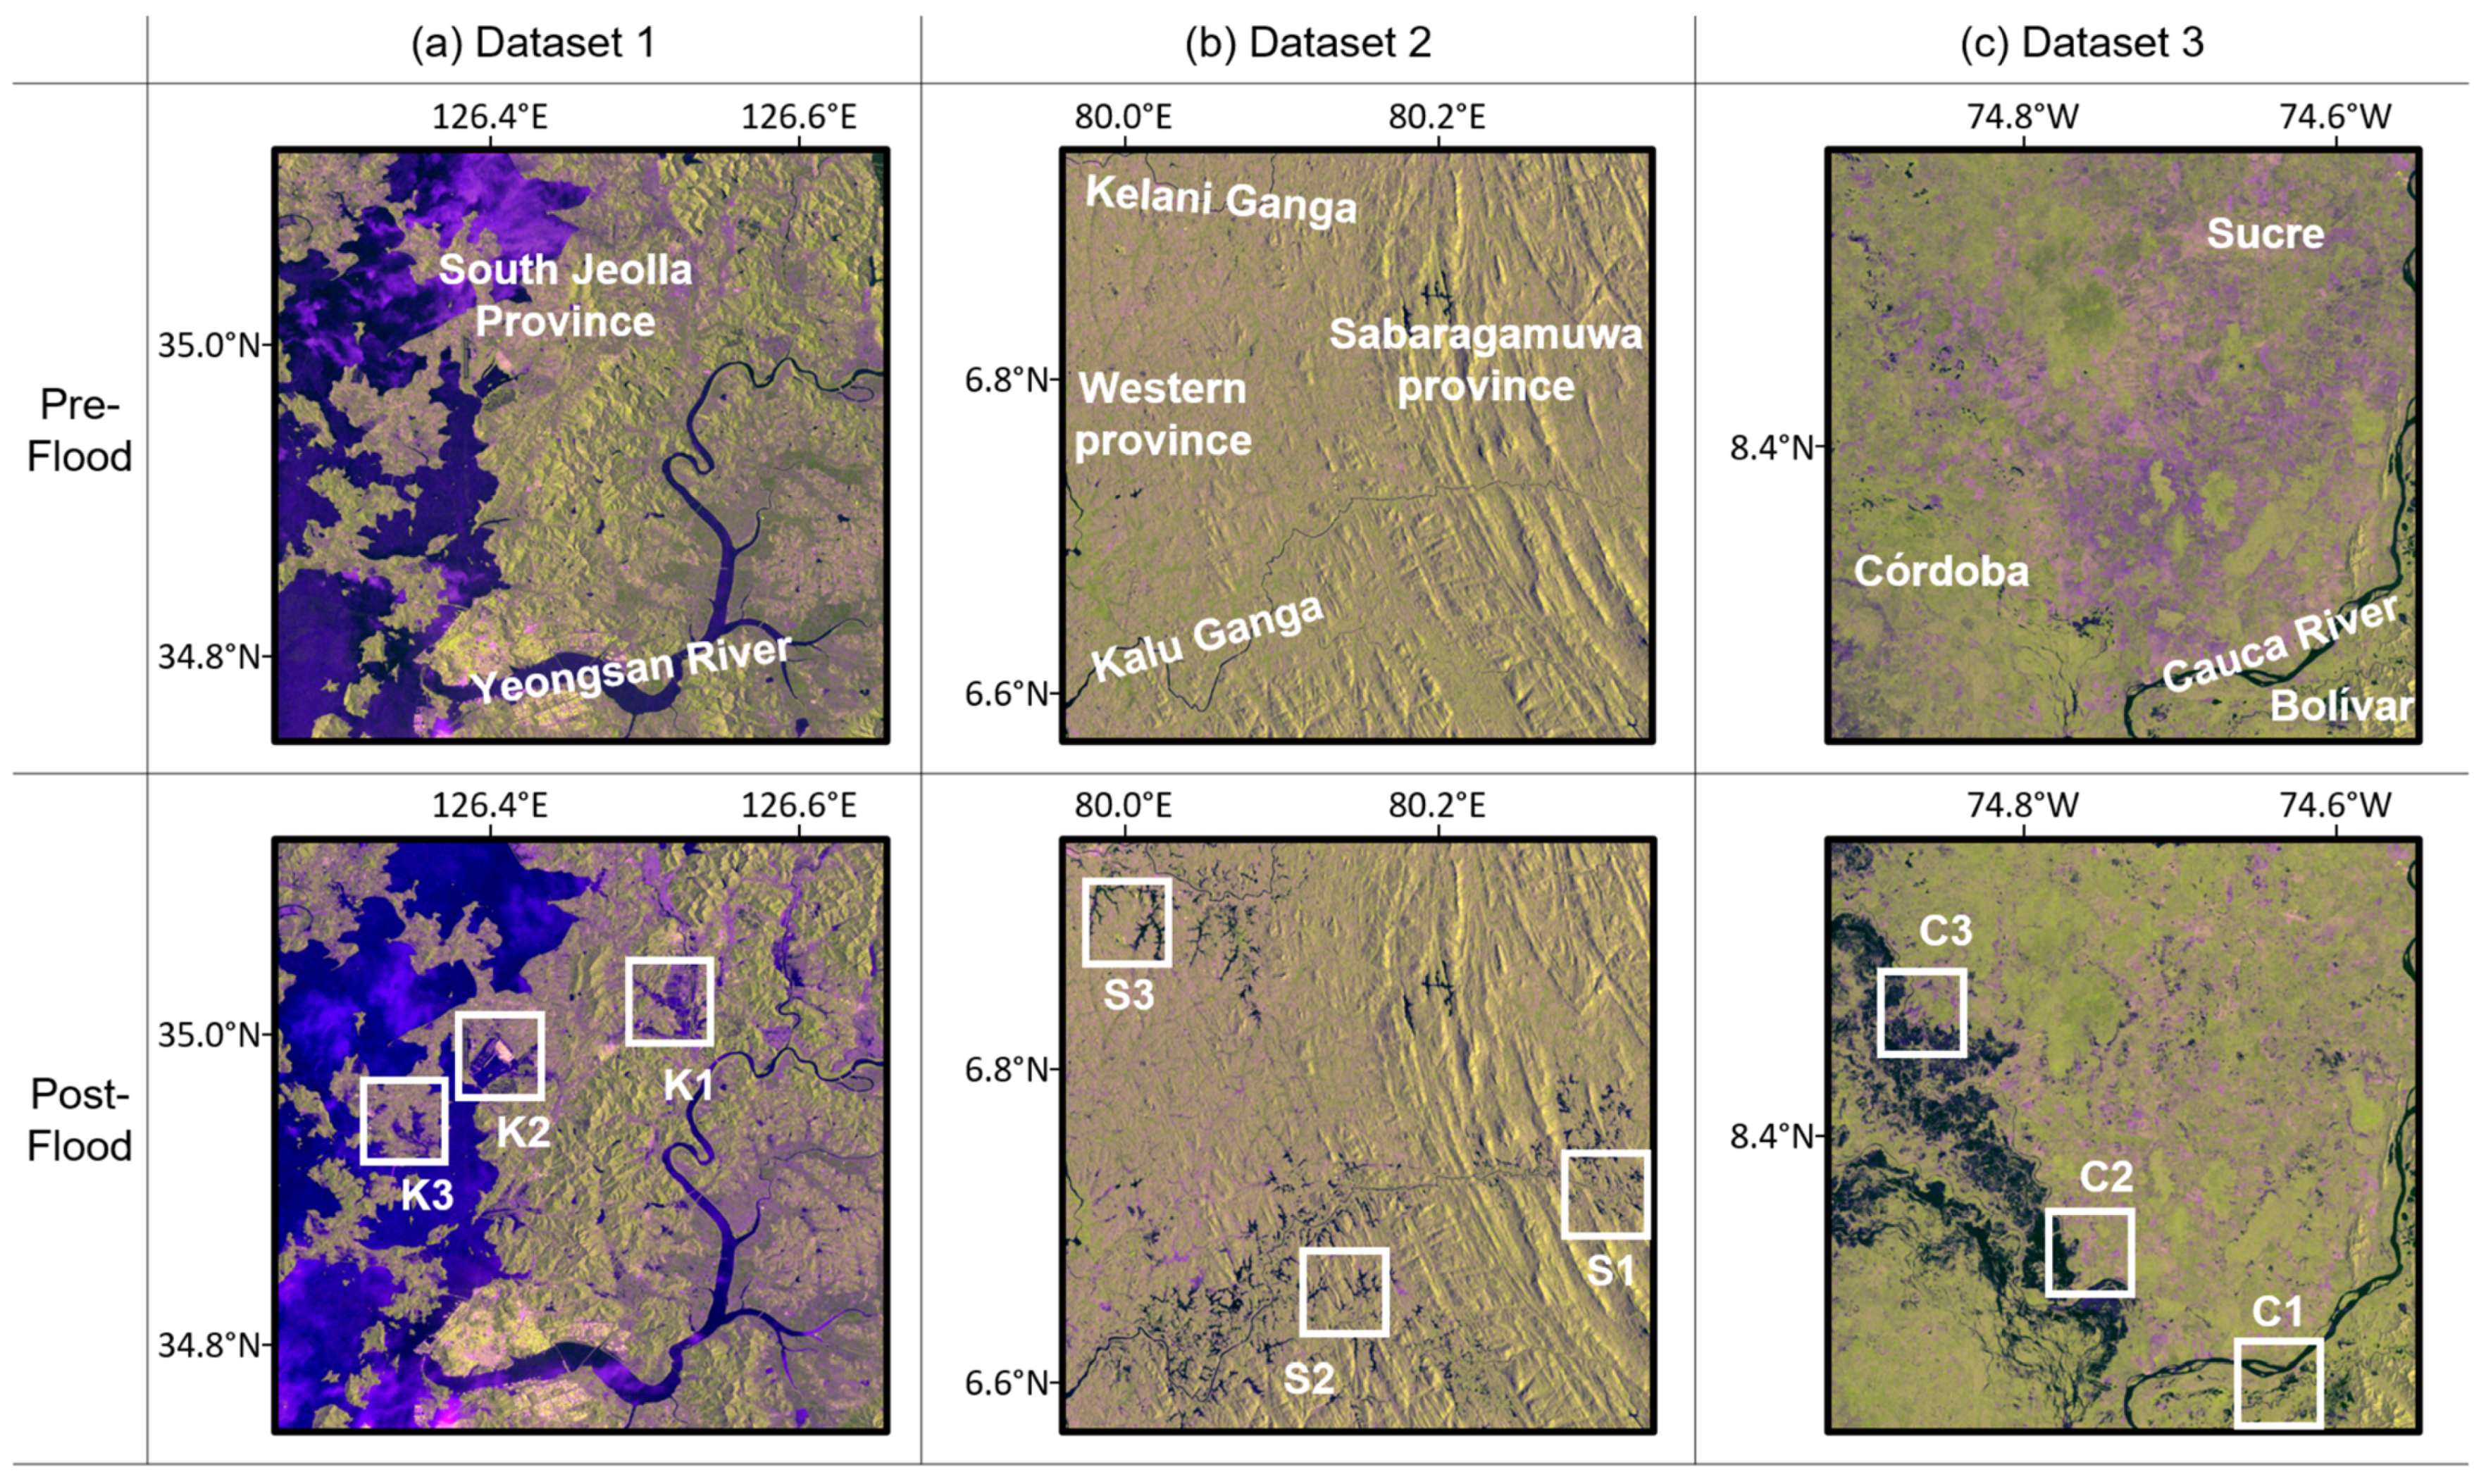
3.1. Datasets

SAR observations can distinguish between water bodies and land areas based on the contrast between the specular reflection from the water body and the diffused surface or volume scattering from non-water areas. Since floods can occur anywhere in the world under various environmental conditions, scattering characteristics of non-water land can vary depending on the region. Also, the scattering from the water body can vary depending on the roughness condition of the water surface. Therefore, the flood detection performance of the dual-pol parameters was evaluated across different flood types and environmental conditions.
We selected three datasets of recent flood events in Korea, Sri Lanka, and Colombia for comprehensive evaluation. In all three datasets, Sentinel-1 dual-pol (VV-VH) data acquired in the interferometric wide swath (IW) mode were used and processed identically to ensure methodological consistency. Figure 3a–c show the geographic location of each dataset and the corresponding pre- and post-flood Sentinel-1 data. The SAR data acquired for flood detection are summarized in Table 1.

3.1.1. Dataset 1: Korea

Dataset 1 is located in the Yeongsan River basin in the southwestern part of the Korean peninsula as shown in Figure 3a. It consists of built-up areas, agricultural lands, salt farms, and livestock farms in flat areas, and mountainous terrains are distributed mostly in the central part of the study area. The Yeongsan River, one of the four major rivers of South Korea, runs through this area, and various tributaries of the Yeongsan River are distributed throughout the study area. According to measurements from meteorological stations in this area, rainfall continued from the afternoon of 23 July 2023 to the night of 24 July 2023 and intense rainfall events occurred from midnight to the morning of 24 July.
Two Sentinel-1 SAR single look complex (SLC) data were obtained in pre- and post-flood conditions. The first image was observed on the evening of 23 July, just before the heavy rainfall event, and the second image was observed at the end of the most intense rainfall, making it possible to identify flooded areas by comparing the two images. Sentinel-1 baseline observations in Korea are usually performed every 12 days in the ascending orbit. The pre-flood image was also obtained in the baseline observation scenario. However, to detect flooded areas after the heavy rainfall events, urgent observations were required between baseline observations. For this purpose, the post-flood image was acquired in descending orbits. As a result, it was possible to construct a bi-temporal SAR image pair suitable for flood detection with only a half-day temporal gap. During heavy rain, flooding occurred in the inland Yeongsan River basin and island regions. As shown in Figure 3a, we generated the evaluation dataset with the size of 2900 × 2800 (43.5 km × 42 km) to cover the main flood-affected areas.

3.1.2. Dataset 2: Sri Lanka

Dataset 2 is located in the southwestern coastal plain near Colombo, Sri Lanka, as shown in Figure 3b. The area is mainly covered by closed-canopy wet deciduous and mixed forests. On the eastern side of the study area, hilly areas are distributed, while on the western side, wide lowland areas are adjacent to the sea. The Kelani River runs in the northern part of the study area and the Kalu River flows in the south. The study area, known as the wet zone due to its high annual precipitation, was affected by the southwest monsoon from mid-May 2024 to June 2024. The lowland districts of Colombo, Kalutara, and Ratnapura were under the most severe level of flood warnings due to rising water levels in the Kelani River Basin from 1 June to 11 June 2024.
To detect flood-affected areas, two Sentinel-1 SLC data were acquired before and after the floods. For the pre-flood period, we used the image from 5 April 2024 corresponding to the pre-monsoon condition, and for the post-flood period, we used the image from 4 June 2024, right after the heaviest rainfall. The image size of the dataset was 2980 × 2980 (41.5 km × 41.5 km), similar to the size of dataset 1. Repetitive flooding in this area allowed the acquisition of SAR images before and after flooding in the same orbit.

3.1.3. Dataset 3: Colombia

Dataset 3 is located in the La Mojana region at the confluence of three major rivers in Colombia (San Jorge, Cauca, and Magdalena). It is a wetland ecosystem in northern Colombia spanning the provinces of Antioquia, Sucre, Bolívar, and Córdoba. It contains various vegetation types, including crops, grasses, shrubs, other herbaceous vegetation, and forests. The flat terrain of La Mojana, which is generally below 40 m above sea level, makes it highly susceptible to flooding. It has experienced recurrent flooding since 2021, which led to the repeated collapse of the embankment. The lack of hydrologic infrastructure and rapid land cover changes, such as the decline of mangroves, made the La Mojana area more prone to flooding. Heavy rains between 6 May and 11 June 2024 caused the embankment to fail, resulting in severe flooding in the study area.
To detect the flooded area in Colombia, Sentinel-1 SLC data on 25 April 2024 for pre-flood conditions and 19 May 2024 for post-flood conditions were acquired as shown in Figure 3c. The image size, signal polarization, and orbital direction were the same as in dataset 2. However, since dataset 2 used sub-swath 2 and dataset 3 used sub-swath 1, there is a difference in the incidence angles of the experimental datasets.

3.2. Flood Detection Results for Each Dataset

For all three datasets, we used bitemporal dual-pol Sentinel-1 SAR data for detecting post-flood water bodies and for delineating water areas in pre-flood conditions. Flood detection was performed for the entire SAR coverage using the method presented in Section 2. The dual-pol parameters used in the experimental evaluation are as follows:
(1)
VV-pol intensity ( V V )
(2)
VH-pol intensity ( V H )
(3)
Span of the covariance matrix ( S p a n )
(4)
Degree of polarization ( D o P )
(5)
Shannon entropy ( S E )
(6)
Fuzzy intersection ( V V V H )
(7)
Fuzzy union ( V V V H )
For a quantitative evaluation of the optimal use of dual-pol parameters, three test sites with a size of 400 × 400 pixels per site were selected for each dataset as shown in Figure 3. Due to the limited availability of comprehensive ground truth or high-quality local datasets for flood extent validation in the study areas, reference flood maps were manually generated for each site using reports from local governments, Google Earth historical images, and visual interpretation of SAR images. The overall performance of the binary flood detection map including both the target (flood class) and clutter (non-flood class) was evaluated by the overall accuracy (OA), F1-score, and Kappa coefficient. In addition, since it is important to pay special attention to the ability of the dual-pol parameters to detect flooded areas, we used two other evaluation metrics focusing on the true positive decision, such as precision and recall, also referred to as the user’s accuracy and the producer’s accuracy, respectively, for the flood class. Figure 4 shows the flood detection results of each test site within the three datasets. The quantitative performances of different dual-pol parameters are summarized in Table 2, Table 3 and Table 4 (shaded cells represent the top three parameters for a given metric and bold text indicates the highest accuracy among them).
Let us first evaluate the flood detection results for dataset 1. In terms of the overall binary classification accuracy metrics, such as OA, F1, and Kappa, the fuzzy union, V H , and S E parameters yielded successful performance, while the D o P failed to detect flooded areas. Among them, the fuzzy union approach provided the best binary classification result. The precision metric exceeded 0.88 for most parameters except D o P , indicating that the SAR-based detection of the flood class is generally consistent with the actual flooded areas. In particular, the V V , S p a n , and fuzzy intersection parameters showed high precision. On the other hand, the recall values of those parameters were lower than 0.60, indicating that they could not sufficiently detect the actual flooded area. The detection results using fuzzy union, V H , and S E parameters showed high recall scores indicating their usability for the overall identification of actual flooded areas.
Regarding the dataset 2 Sri Lanka region, we could first confirm the similarity with dataset 1. The D o P parameter was insufficient in detecting the flood-inundated areas and considering the overall binary classification accuracy, the S E , fuzzy union, and V H parameters provided successful performance. However, the assessment focused on the flooded areas showed some differences from the results of dataset 1. In particular, V V and S p a n showed relatively low precisions of about 0.7–0.8, unlike the results of dataset 1, and some false detections occurred in non-flooded areas. It can be associated with the radar shadow that was partially included in the S1 and S2 sites due to the rugged terrain distributed in the eastern part of the study area. Even in this case, the detection results of S E and fuzzy union were highly consistent with the actual flooded areas.
For the dataset 3, all parameters except D o P recorded OA, F1, Kappa, precision, and recall values above 0.85, indicating that the choice of dual-pol parameter was less sensitive and revealed overall effectiveness in detecting actual flood-inundated areas. It can be attributed to the characteristics of the study area, which has gentle topography and few non-water-related flat surfaces such as roads or bare soil, and the flood characteristics of this area, where a large area of flood-inundation occurs with a rare appearance of small isolated flood patches. The fuzzy intersection showed the highest precision, and the S E yielded the highest value in the recall metric. In terms of the overall classification accuracies, the S and fuzzy union yielded the most successful performance.

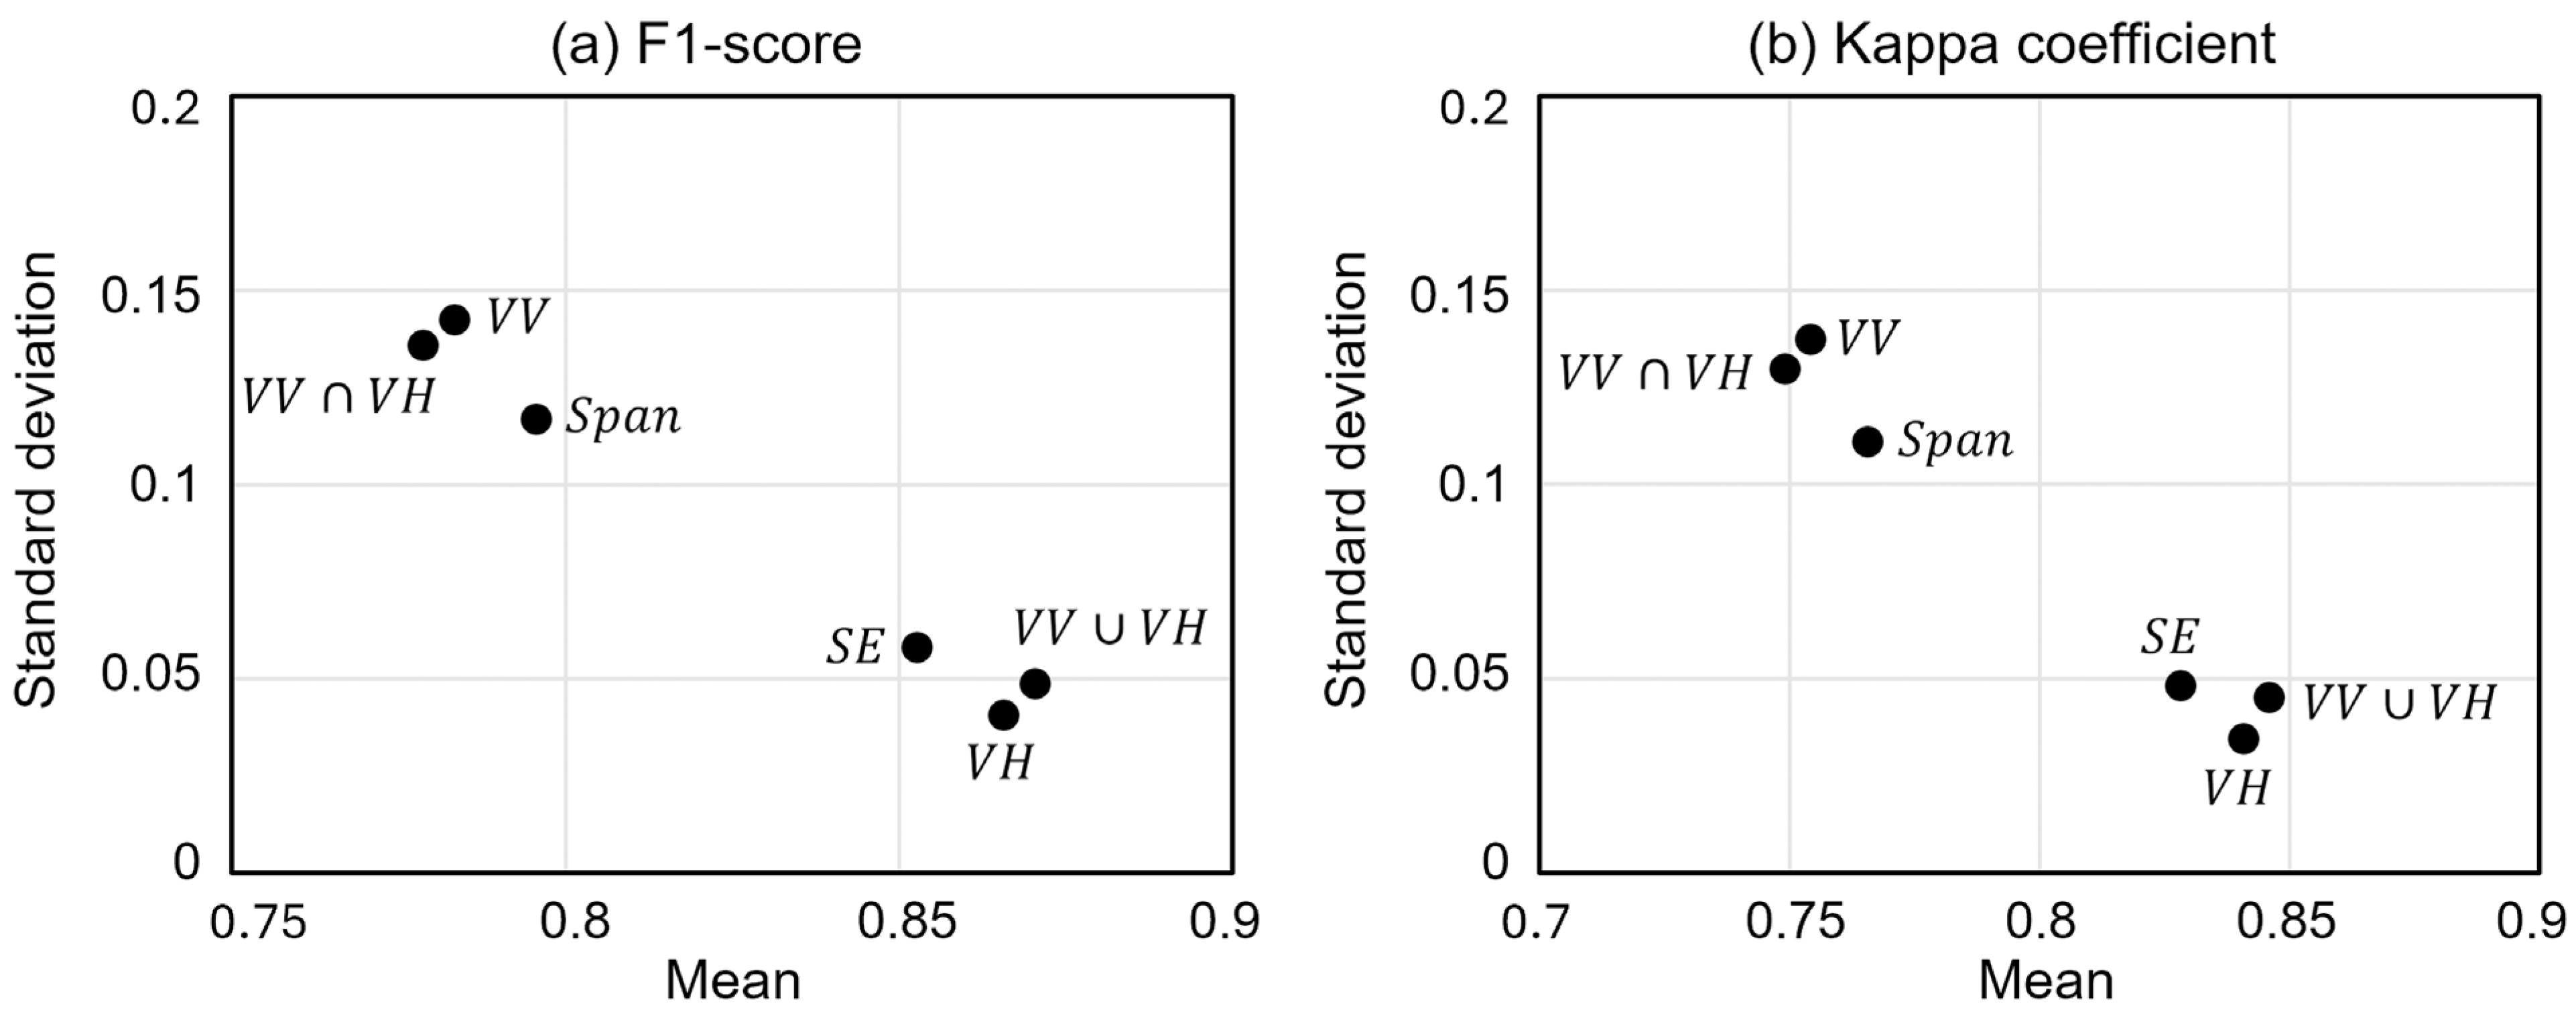
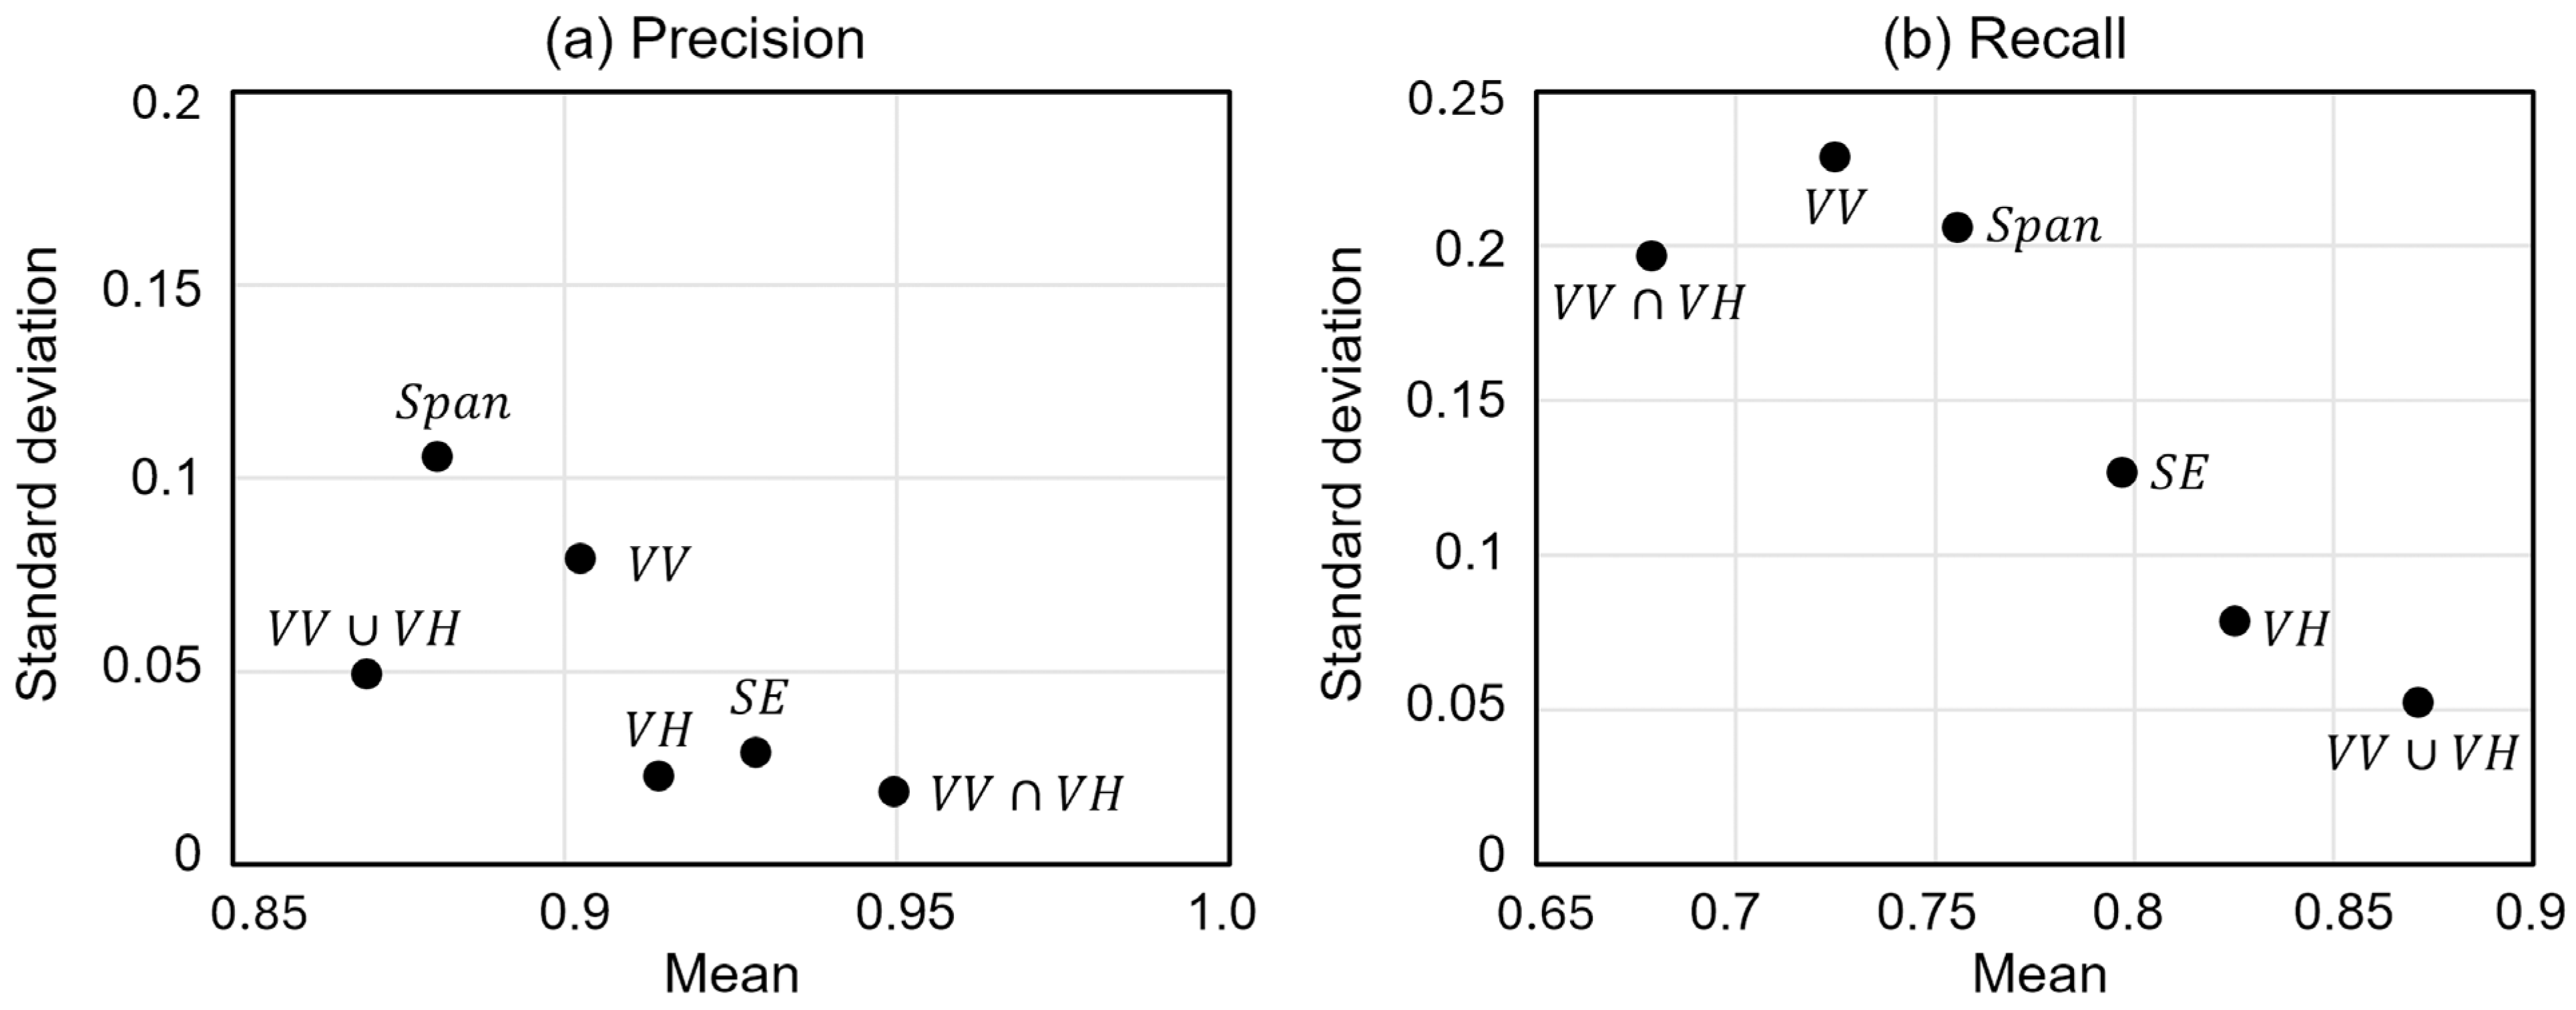
3.3. Overall Flood Detection Performance of Dual-Pol Parameters

The results of the flood detection of the three datasets show that the detection performance of different dual-pol parameters varies considerably for different land cover and flood types. Therefore, it is necessary to evaluate whether flood detection using dual-pol parameters provides stable performance while being less affected by regional or flood characteristics. The experimental results for each dataset also suggested that the overall binary classification performance and the detection performance focusing on the relevant (target) class need to be examined separately.
Let us first examine the overall performance of the dual-pol parameters in all three datasets regarding binary classification. Figure 5 shows the mean and standard deviation (std) of F1 and Kappa values for all three datasets. Here, the OA metric, which could not highlight differences between dual-pol parameters, was not used in the evaluation. Also, the D o P parameter, which showed poor detection performance in all three datasets, was excluded from the overall assessment. The mean-std plane explains that the dual-pol parameter located at the bottom right corner of the graph provides stable results in different areas or flood conditions with the highest accuracy. Considering the results from all study regions, the V H and fuzzy union provided stable performance with high accuracy.
On the other hand, we can examine the characteristics of the dual-pol parameters in different datasets based on the relevance of the flood detection results by using the precision and recall metrics. Figure 6 shows the mean and std of the precision and recall values of the different study areas. Unlike the overall classification perspective examined above, we could identify the single best parameter when evaluating detection performance by precision and recall metrics. The detection performance in terms of the precision value in Figure 6a exhibits that the fuzzy intersection outperformed other dual-pol parameters. When generating a flood detection map using the fuzzy intersection method, one can expect that the actual flood area can be detected with an average accuracy of about 0.95 with the least variations in the detection performance under different land cover and flood conditions. On the other hand, the fuzzy union provided the best results in terms of the recall metric as shown in Figure 6b. The fuzzy union method had the highest average accuracy in detecting actual inundated areas due to flooding, and in particular, the variability of detection performance across study areas was significantly lower than that of other dual-pol parameters.
Summarizing the results from multiple datasets, the overall flood detection performance analysis indicates that the V H and fuzzy union parameters outperformed other dual-pol parameters. In particular, experimental results confirmed that the fuzzy union method could provide the best flood detection result additionally considering the recall score. However, we could also observe that the fuzzy intersection method yielded the highest accuracy if we limit the problem to the reliability of a flood class corresponding to the actual flood from the user’s point of view. Based on these experimental results, we can consider extending the binary detection of flooded and non-flooded areas to a three-class classification of dividing flooded areas into two types: flood-relevant class indicating areas related to inundated areas more broadly by using comprehensive (fuzzy union) dual-pol intensity information, and flood-reliable class indicating more reliable flooded regions based on common information (fuzzy intersection) of dual-pol intensities.
Figure 7 shows an example of the flood map with two flood classes for the K1 test site in dataset 1. The performance difference between the polarization parameters is noticeable in this test site, which effectively exhibits the synergy of the two intensity fusion methods. The hatched area in the flood map represents the flood-relevant class detected by fuzzy union, and the filled area represents the flood-reliable class detected by fuzzy intersection. Figure 7b–e enlarge the southeast parts of the K1 site for a more effective illustration. The flood map using the two intensity fusion classes was well consistent with the actual flood area, while also providing the possibility to respond to potential false alarms, for example, a small isolated flood-relevant patch indicated by the red dotted ellipse. The difference between the two flood classes can be attributed to the type and environmental conditions of the scatterer and the state of the water surface. It is difficult to provide a general interpretation of the flood-relevant and flood-reliable classes with an absence of real-time flood information. Nonetheless, to provide an idea of the ground conditions that influence the difference between the two flood classes, two ancillary data corresponding to land cover and elevation information are also displayed in Figure 7d,e, respectively. The high-resolution land cover map was obtained from the Korean Ministry of Environment, and the Copernicus 30 m Digital Elevation Model (DEM) (GLO-30) was used to assess topographic influences on floodwater distribution. Since the latest high-resolution land cover information was only available in the Korean study area, we examined the K1 site as a representative example of assisting the qualitative interpretation of the proposed three-class flood detection strategy. The flooded areas were mostly agricultural land for rice cultivation both in flood-relevant (dashed ellipse) and flood-reliable (solid ellipse) classes, with no significant difference in land cover. On the other hand, the flood-relevant areas detected by fuzzy union were relatively lower in elevation than the flood-reliable areas detected by fuzzy intersection. During a flood event, overflow water may flow faster and more turbulently in low-elevation areas, suggesting that the water body detection capability in VV polarization, which is more sensitive to surface roughness, may be degraded.

4. Discussion

4.1. Comparison with Previous Studies

In this study, we examined a practical and effective way of exploiting dual-pol SAR observations to distinguish flooded areas. Research on operational flood detection using various dual-pol parameters has rarely been conducted, making comparative evaluation difficult. Nonetheless, a few recent studies have explored the flood detection performances of dual-pol intensities, allowing us to partially examine the similarities and differences with our results. In the study by Twele et al. [44], the fully automated flood processor [11] widely used in operational flood monitoring services was applied to Sentinel-1 dual-pol SAR data to investigate the performance of dual-pol scattering intensities. The water body detection method was applied to VV and VH intensities independently for the long-lasting flooded area of the Evros River located on the border between Greece and Turkey. The experimental results showed that VV intensity performed slightly better than VH. These results differ from our study, where the overall classification accuracy of the flood map of VH intensity was higher than that of VV polarization, except for a slightly higher Kappa value of VV in dataset 3. Because the experiments were not conducted with identical data, it is not possible to conclude from this study and ours alone whether these differences are due to methodology or the characteristics of the data.
It is difficult to find other studies on the application of dual-pol data in flood detection problems through direct analysis of backscatter characteristics in an unsupervised way. However, several recent studies on the use of deep learning technology for flood detection [45,46,47] have compared and evaluated the performance of dual-pol intensities from the perspective of what input data is appropriate to build a deep learning model. These studies used different models and data but came to similar conclusions in terms of polarization. Among them, Bereczky et al. [46] clearly summarized the performance difference between the different dual-pol scattering intensities. In particular, they also include a comparison of deep learning-based results with the Sentinel-1 fully automatic flood process [44] described above, which provides an overall understanding of the previous studies. According to the results presented in the study, the deep learning model trained using both VV and VH yielded the best flood detection results in terms of average F1 scores on the various experimental datasets, followed by the VH-based deep learning model, the VV-based fully automatic processor, and the VV-based deep learning model. The average F1 score rankings in our study were also in the order of fusion (union) of VV and VH intensities, VH intensity, and VV intensity, which confirms agreement with the result of the deep learning-based flood detection study.

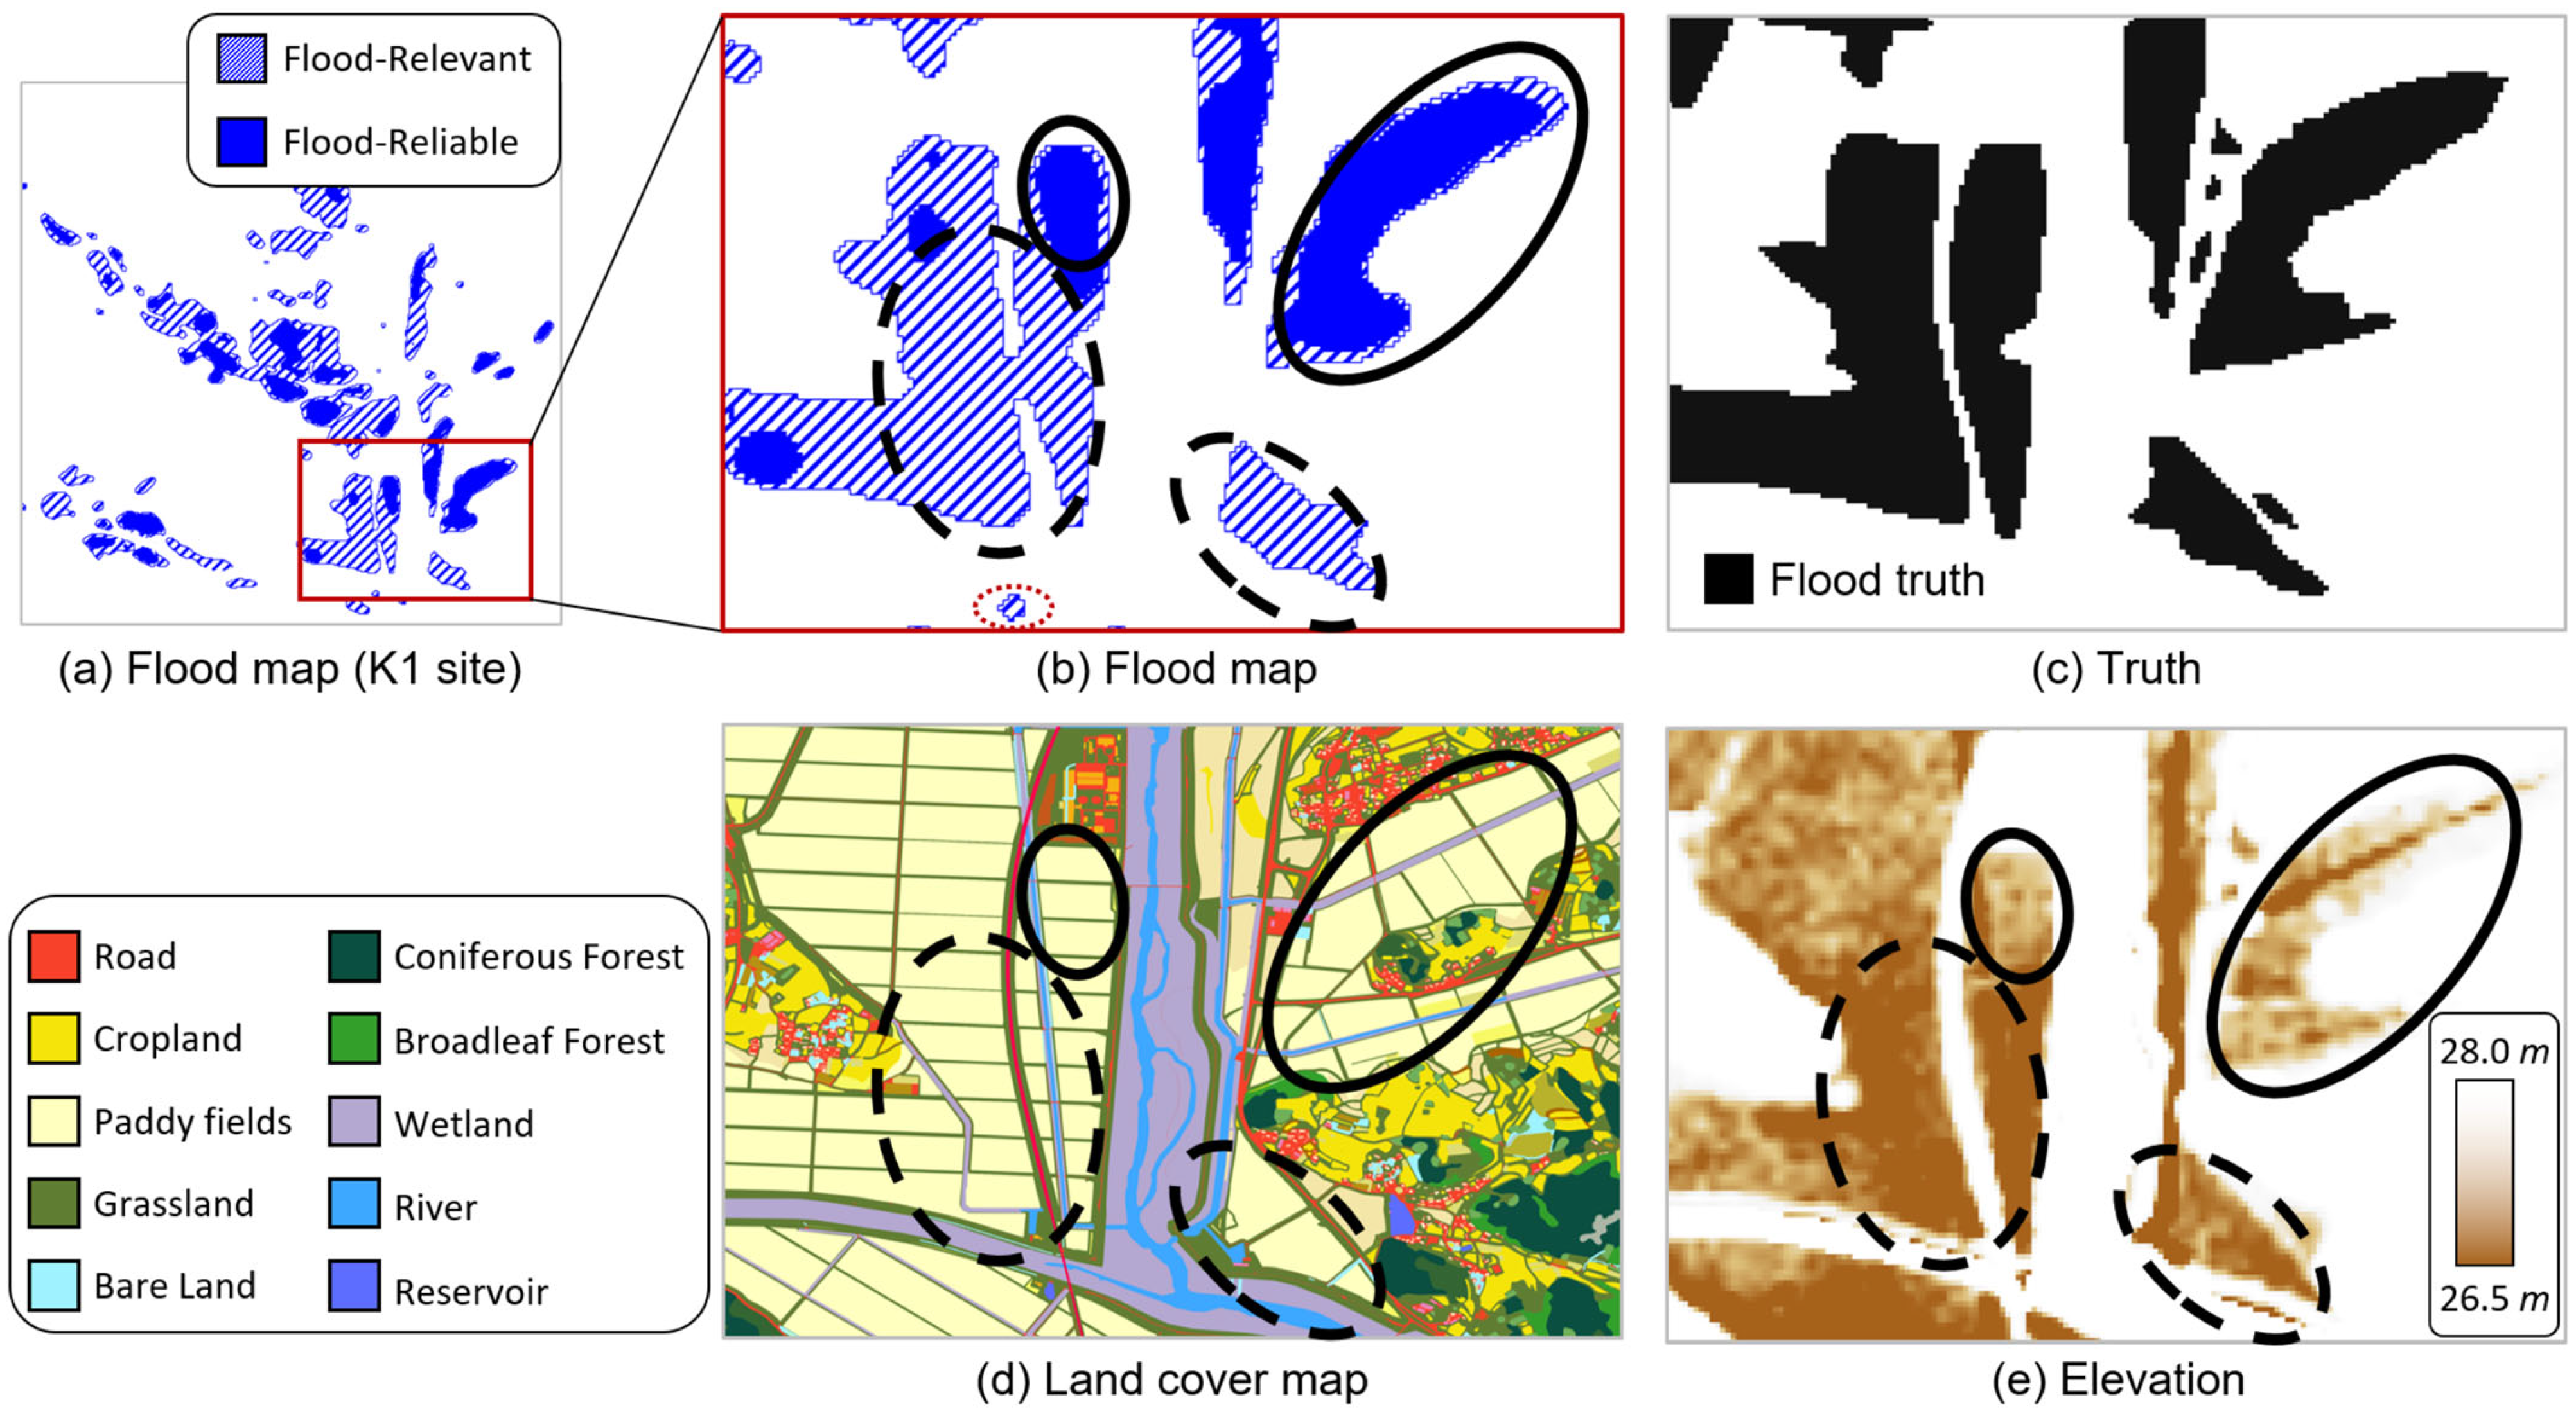
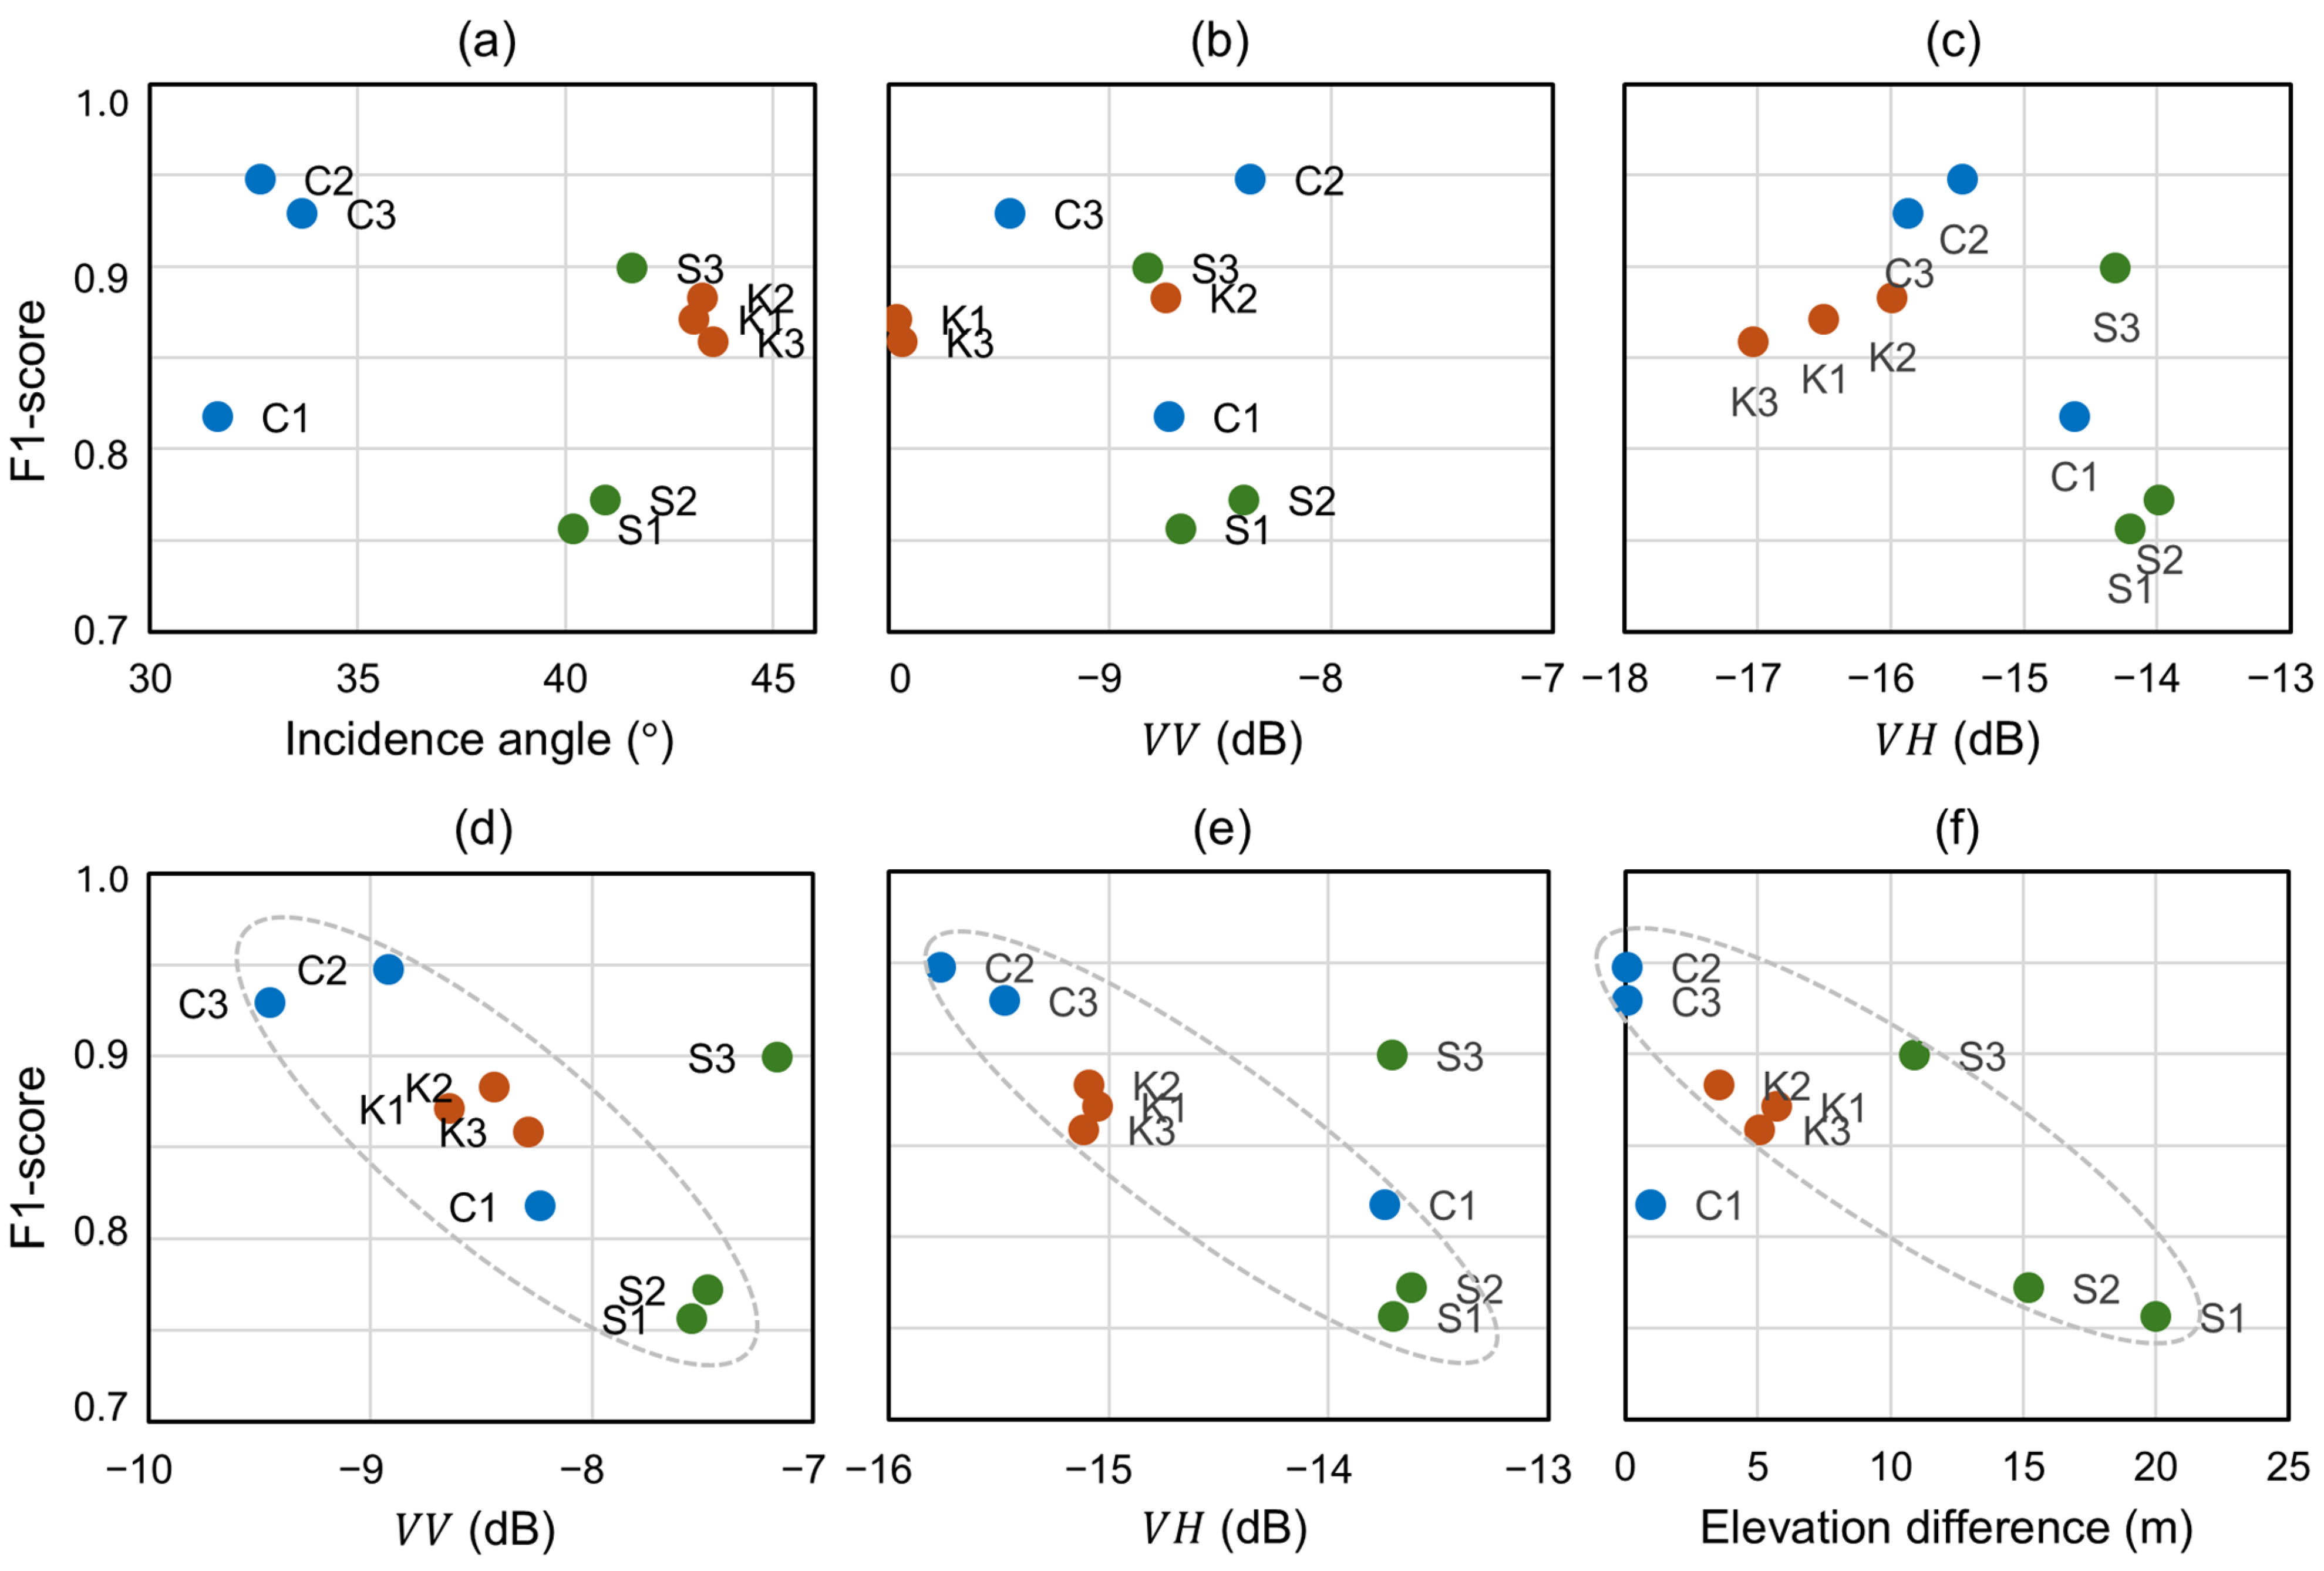
4.2. Flood Detection Performance in Terms of Local Characteristics

The study areas in this study are in different geographic regions and have different climatic conditions and land cover characteristics. Also, three datasets observed these areas with different observation conditions. The test sites within each dataset also have various local characteristics even though they belong to the same country. Here, we further examined how these local characteristics affect flood detection performance. The flood detection performance of the fuzzy union approach was estimated separately for each test site and compared against the local observation conditions and scattering characteristics.
Figure 8a shows the detection performance with respect to the average local incidence angle of each test site of all datasets. The incidence angles of all test sites ranged from 31.7° to 43.6°. It is well known that a smooth surface, such as a water body, could be one of the most sensitive objects to the radar incidence angle [48]. Increasing the incidence angle may decrease the radar return from the water surface, which in turn may increase the ability to distinguish the water body due to increased contrast with surrounding scatterers. In Figure 8a, when restricted to only the test sites in one dataset, there seems to be a trend for detection performance to increase with the incident angle. However, the incidence angle varied less than 3° within a dataset, which spanned too small ranges to explain the difference in performance by the difference in the incident angle. Rather, the combined results of all test sites over a broader range of incident angles illustrate that the incident angle did not significantly affect flood detection.
To understand factors other than the incidence angle that can be associated with differences in detection performance across test sites, we examined the effect of ground objects on detection performance as shown in Figure 8b–e. Figure 8b,c are the scattering responses in the VV and VH polarizations, respectively, just before the flood event at the scatterers situated in the flooded area. They exhibit that the flood occurred in objects with considerably different scattering intensities across the test site. It is seen that the detection performance is hardly related to the types or physical properties of flooded objects. On the other hand, Figure 8d,e show the VV and VH intensities, respectively, for objects surrounding the flooded areas in the test sites. The scattering responses of neighboring non-inundated areas are not directly related to flooding but can affect the statistical characteristics of flood detection processes. Both plots exhibit a possible correlation between detection performance and scattering intensity around flood areas. The flood detection performance may be degraded in the presence of objects with high scattering intensity, such as dense forests or man-made structures.
Another ground condition that could explain the differences in detection performance between test sites is the characteristics of the water body during flooding. Although it is not included in this study, near-surface winds in the ERA5 reanalysis data indicate that all three study sites had calm wind conditions at the time of data acquisition. Thus, the difference in flood detection cannot be interpreted as being attributed to wind effects. Also, since there was no direct field observation of the flood situation, we conducted an indirect analysis using elevation information, which could be related to the floodwater flow. Figure 8f shows the variation of F1 scores of each test site according to the average elevation difference between the flooded and surrounding areas. It exhibits that detection performance was related to the topographic features of the flooded area, i.e., the elevation level relative to the surrounding area. Assuming that the distribution of overflowing water is preferentially controlled by the topography, the elevation difference on the horizontal axis can be interpreted as the flood depth. Figure 8f suggests that flood detection performance can vary depending on the flood depth and corresponding characteristic flood water flow. To better clarify this, further research is required on the detection performance of SAR data in relation to flood flows based on field observations.

5. Conclusions

This study investigated the optimal utilization of dual-pol SAR observations, which have been widely adopted as the baseline mode of recent SAR satellites, for the rapid detection of flood-affected areas. To ensure high detection performance under different ground conditions and flood situations, we focused on the comparative evaluation of polarimetric observables of the dual-pol data for deducing flood information.
The experimental results demonstrated that accurate and stable performance in the detection of inundated areas under various surface conditions can be achieved by combining water body information from dual-pol channels in a disjunctive way. It suggests that synergy in flood detection can be expected when using polarization observation data by considering each polarimetric channel as an independent information source and combining them rather than deriving the most relevant polarization parameter. Also, combining common information from two polarization channels in a conjunctive way could provide the most reliable SAR flood detection results with minimum false alarms from the user’s perspective. Based on these experimental results, we further proposed a two-class flood classification scheme including flood-relevant and flood-reliable classes. The proposed method can generate a single flood map containing spatial information to identify inundated areas and information about their reliability, which can improve the applicability of SAR remote sensing in identifying flooded areas under different land cover and flood conditions.
The fuzzy-based detection method proposed for the evaluation of dual-pol data can detect flood-affected areas over a wide region without any training process and/or in situ information. It was validated against different flood events and showed successful performance even if there were significant differences in types or modes of the data between pre-flood and post-flood acquisitions. In addition, it has a technical framework that can be easily fused with other ancillary data such as elevation, slope, and weather information. Given that the method can be easily applied to new observations without retraining, even when there are significant differences in the types or acquisition modes of SAR data between pre-flood and post-flood acquisitions, it shows strong potential for operational application. Also, the proposed approach provides a theoretical framework to be integrated with other types of data to enhance detection performance under diverse flood conditions and has the potential to be extended to time-series analysis.
Despite these advantages, there are some areas for further verification or improvement of the dual-pol flood detection and optimal use of dual-pol data. As this method was primarily applied to fully inundated areas affected by riverine flooding, its generalizability to other flood scenarios, such as urban inundation or beneath-vegetation flooding, remains unclear and needs to be further investigated. Additional polarization parameters or detection strategies that can effectively track changes in dihedral scattering should be further investigated for these areas. Since the polarimetric scattering information for adequately emphasizing double-bounce scattering phenomena is limited or absent in dual-pol observation, future research should explore the extension of this approach to fully polarimetric SAR (quad-pol) data, which offers enhanced sensitivity to double-bounce scattering and has the potential to significantly improve flood detection in urban or structurally complex environments.

Author Contributions

Conceptualization, S.-Y.K. and S.-E.P.; methodology, S.-Y.K., Y.L. and S.-E.P.; software, S.-Y.K. and Y.L.; validation, S.-Y.K. and S.-E.P.; formal analysis, S.-Y.K. and Y.L.; investigation, S.-Y.K. and Y.L.; resources, S.-Y.K. and Y.L.; data curation, S.-Y.K. and Y.L.; writing—original draft preparation, S.-Y.K. and S.-E.P.; writing—review and editing, Y.L. and S.-E.P.; visualization, S.-Y.K.; supervision, S.-E.P.; project administration, Y.L.; funding acquisition, S.-E.P. All authors have read and agreed to the published version of the manuscript.

Funding

This work was supported by the National Research Foundation of Korea (NRF) grant funded by the Korea government (MSIT) (No. RS-2023-00222563) and in part by the Korean Institute of Marine Science & Technology Promotion (KIMST) funded by the Korea Coast Guard (RS-2023-00238652, Integrated Satellite-based Applications Development for Korea Coast Guard).

Data Availability Statement

The original contributions presented in the study are included in the article, further inquiries can be directed to the corresponding author.

Conflicts of Interest

The authors declare no conflicts of interest.

References

  1. Brivio, P.A.; Colombo, R.; Maggi, M.; Tomasoni, R. Integration of remote sensing data and GIS for accurate mapping of flooded areas. Int. J. Remote Sens. 2002, 23, 429–441. [Google Scholar] [CrossRef]
  2. Henry, J.B.; Chastanet, P.; Fellah, K.; Desnos, Y.L. Envisat multi-polarized ASAR data for flood mapping. Int. J. Remote Sens. 2006, 27, 1921–1929. [Google Scholar] [CrossRef]
  3. Matgen, P.; Schumann, G.; Henry, J.B.; Hoffmann, L.; Pfister, L. Integration of SAR-derived river inundation areas, high-precision topographic data and a river flow model toward near real-time flood management. Int. J. Appl. Earth Obs. Geoinf. 2007, 9, 247–263. [Google Scholar] [CrossRef]
  4. Brown, K.M.; Hambidge, C.H.; Brownett, J.M. Progress in operational flood mapping using satellite synthetic aperture radar (SAR) and airborne light detection and ranging (LiDAR) data. Prog. Phys. Geogr. 2016, 40, 196–214. [Google Scholar] [CrossRef]
  5. De Roo, A.; Van Der Knijff, J.; Horritt, M.; Schmuck, G.; De Jong, S. Assessing flood damages of the 1997 Oder flood and the 1995 Meuse flood. In Proceedings of the Second International ITC Symposium on Operationalization of Remote Sensing, Enschede, The Netherlands, 16–20 August 1999; pp. 16–20. [Google Scholar]
  6. Townsend, P.A. Estimating forest structure in wetlands using multitemporal SAR. Remote Sens. Environ. 2002, 79, 288–304. [Google Scholar] [CrossRef]
  7. Bates, P.D.; Horritt, M.S.; Smith, C.N.; Mason, D. Integrating remote sensing observations of flood hydrology and hydraulic modelling. Hydrol. Process. 1997, 11, 1777–1795. [Google Scholar] [CrossRef]
  8. Mason, D.C.; Horritt, M.S.; Dall’Amico, J.T.; Scott, T.R.; Bates, P.D. Improving river flood extent delineation from Synthetic Aperture Radar using airborne laser altimetry. IEEE Trans. Geosci. Remote Sens. 2007, 45, 3932–3943. [Google Scholar] [CrossRef]
  9. Martinis, S.; Twele, A.; Voigt, S. Towards operational near real-time flood detection using a split-based automatic thresholding procedure on high resolution TerraSAR-X data. Nat. Hazards Earth Syst. Sci. 2009, 9, 303–314. [Google Scholar] [CrossRef]
  10. Chung, H.-W.; Liu, C.-C.; Cheng, I.-F.; Lee, Y.-R.; Shieh, M.-C. Rapid Response to a Typhoon-induced flood with an SAR-derived map of inundated areas: Case Study and Validation. Remote Sens. 2015, 7, 11954–11973. [Google Scholar] [CrossRef]
  11. Martinis, S.; Kersten, J.; Twele, A. A fully automated TerraSAR-X based flood service. ISPRS J. Photogramm. Remote Sens. 2015, 104, 203–212. [Google Scholar] [CrossRef]
  12. Clement, M.A.; Kilsby, C.G.; Moore, P. Multi-temporal Synthetic Aperture Radar flood mapping using change detection. J. Flood Risk Manag. 2018, 11, 152–168. [Google Scholar] [CrossRef]
  13. Cao, H.; Zhang, H.; Wang, C.; Zhang, B. Operational flood detection using Sentinel-1 SAR data over large areas. Water 2019, 11, 786. [Google Scholar] [CrossRef]
  14. Long, S.; Fatoyinbo, T.E.; Policelli, F. Flood extent mapping for Namibia using change detection and thresholding with SAR. Environ. Res. Lett. 2014, 9, 035002. [Google Scholar] [CrossRef]
  15. Bovolo, F.; Bruzzone, L. A split-based approach to unsupervised change detection in large-size multitemporal images: Application to tsunami-damage assessment. IEEE Trans. Geosci. Remote Sens. 2007, 45, 1658–1670. [Google Scholar] [CrossRef]
  16. Natsuaki, R.; Nagai, H. Synthetic Aperture Radar flood detection under multiple modes and multiple orbit conditions: A case study in Japan on typhoon Hagibis, 2019. Remote Sens. 2020, 12, 903. [Google Scholar] [CrossRef]
  17. Mason, D.C.; Speck, R.; Devereux, B.; Schumann, G.J.P.; Neal, J.C.; Bates, P.D. Flood detection in urban areas using TerraSAR-X. IEEE Trans. Geosci. Remote Sens. 2010, 48, 882–894. [Google Scholar] [CrossRef]
  18. Giustarini, L.; Chini, M.; Hostache, R.; Pappenberger, F.; Matgen, P. Flood hazard mapping combining hydrodynamic modeling and multi annual remote sensing data. Remote Sens. 2015, 7, 14200–14226. [Google Scholar] [CrossRef]
  19. Schlaffer, S.; Matgen, P.; Hollaus, M.; Wagner, W. Flood detection from multi-temporal SAR data using harmonic analysis and change detection. Int. J. Appl. Earth Obs. Geoinf. 2015, 38, 15–24. [Google Scholar] [CrossRef]
  20. Ezzine, A.; Saidi, S.; Hermassi, T.; Kammessi, I.; Darragi, F.; Rajhi, H. Flood mapping using hydraulic modeling and Sentinel-1 image: Case study of Medjerda Basin, northern Tunisia. Egypt. J. Remote Sens. Space Sci. 2020, 23, 303–310. [Google Scholar] [CrossRef]
  21. Moser, L.; Schmitt, A.; Wendleder, A.; Roth, A. Monitoring of the Lac Bam Wetland Extent Using Dual-Polarized X-Band SAR Data. Remote Sens. 2016, 8, 302. [Google Scholar] [CrossRef]
  22. Irwin, K.; Braun, A.; Fotopoulos, G.; Roth, A.; Wessel, B. Assessing Single-Polarization and Dual-Polarization TerraSAR-X Data for Surface Water Monitoring. Remote Sens. 2018, 10, 949. [Google Scholar] [CrossRef]
  23. Pham-Duc, B.; Prigent, C.; Aires, F. Surface Water Monitoring within Cambodia and the Vietnamese Mekong Delta over a Year, with Sentinel-1 SAR Observations. Water 2017, 9, 366. [Google Scholar] [CrossRef]
  24. Uddin, K.; Matin, M.A.; Meyer, F.J. Operational Flood Mapping Using Multi-Temporal Sentinel-1 SAR Images: A Case Study from Bangladesh. Remote Sens. 2019, 11, 1581. [Google Scholar] [CrossRef]
  25. Cloude, S.R.; Pottier, E. A review of target decomposition theorems in radar polarimetry. IEEE Trans. Geosci. Remote Sens. 1996, 34, 498–518. [Google Scholar] [CrossRef]
  26. Wolf, E. Coherence properties of partially polarized electromagnetic radiation. Nuovo Cim. 1959, 13, 1165–1181. [Google Scholar] [CrossRef]
  27. Réfrégier, P.; Morio, J. Shannon entropy of partially polarized and partially coherent light with Gaussian fluctuations. JOSA A 2006, 23, 3036–3044. [Google Scholar] [CrossRef]
  28. Marechal, C.; Pottier, E.; Hubert-Moy, L.; Rapinel, S. One year wetland survey investigations from quad-pol RADARSAT-2 time-series SAR images. Can. J. Remote Sens. 2012, 38, 240–252. [Google Scholar] [CrossRef]
  29. Jung, Y.T.; Park, S.E.; Baek, C.S.; Kim, D.H. Evaluation of polarimetric parameters for flood detection using PALSAR-2 quad-pol data. Korean J. Remote Sens. 2018, 34, 117–126. [Google Scholar]
  30. Betbeder, J.; Rapinel, S.; Corgne, S.; Pottier, E.; Hubert-Moy, L. TerraSAR-X dual-pol time-series for mapping of wetland vegetation. ISPRS J. Photogramm. Remote Sens. 2015, 107, 90–98. [Google Scholar] [CrossRef]
  31. Matgen, P.; Hostache, R.; Schumann, G.; Pfister, L.; Hoffmann, L.; Savenije, H.H.G. Towards an automated SAR-based flood monitoring system: Lessons learned from two case studies. Phys. Chem. Earth Parts A/B/C 2011, 36, 241–252. [Google Scholar] [CrossRef]
  32. Giustarini, L.; Hostache, R.; Matgen, P.; Schumann, G.J.P.; Bates, P.D.; Mason, D.C. A change detection approach to flood mapping in urban areas using TerraSAR-X. IEEE Trans. Geosci. Remote Sens. 2012, 51, 2417–2430. [Google Scholar] [CrossRef]
  33. Lu, J.; Giustarini, L.; Xiong, B.; Zhao, L.; Jiang, Y.; Kuang, G. Automated flood detection with improved robustness and efficiency using multi-temporal SAR data. Remote Sens. Lett. 2014, 5, 240–248. [Google Scholar] [CrossRef]
  34. Vanama, V.S.K.; Rao, Y.S.; Bhatt, C.M. Change detection based flood mapping using multi-temporal Earth Observation satellite images: 2018 flood event of Kerala, India. Eur. J. Remote Sens. 2021, 54, 42–58. [Google Scholar] [CrossRef]
  35. Zadeh, L.A. Fuzzy sets. Inf. Control 1965, 8, 338–353. [Google Scholar] [CrossRef]
  36. Martinis, S.; Twele, A. A hierarchical spatio-temporal Markov model for improved flood mapping using multi-temporal X-band SAR data. Remote Sens. 2010, 2, 2240–2258. [Google Scholar] [CrossRef]
  37. Pulvirenti, L.; Pierdicca, N.; Chini, M.; Guerriero, L. An algorithm for operational flood mapping from Synthetic Aperture Radar (SAR) data using fuzzy logic. Nat. Hazards Earth Syst. Sci. 2011, 11, 529–540. [Google Scholar] [CrossRef]
  38. Pal, S.K.; Rosenfeld, A. Image enhancement and thresholding by optimization of fuzzy compactness. Pattern Recognit. Lett. 1988, 7, 77–86. [Google Scholar] [CrossRef]
  39. Dempster, A.P.; Laird, N.M.; Rubin, D.B. Maximum likelihood from incomplete data via the EM algorithm. J. R. Stat. Soc. Ser. B 1977, 39, 1–22. [Google Scholar] [CrossRef]
  40. Bruzzone, L.; Prieto, D.F. Automatic analysis of the difference image for unsupervised change detection. IEEE Trans. Geosci. Remote Sens. 2000, 38, 1171–1182. [Google Scholar] [CrossRef]
  41. Park, S.E. Detection of water bodies from Kompsat-5 SAR data. Korean J. Remote Sens. 2016, 32, 539–550. [Google Scholar] [CrossRef]
  42. Hartigan, J.A.; Hartigan, P.M. The dip test of unimodality. Ann. Stat. 1985, 13, 70–84. [Google Scholar] [CrossRef]
  43. Solaiman, B.; Pierce, L.; Ulaby, F. Multisensor data fusion using fuzzy concepts: Application to land-cover classification using ERS-1/JERS-1 SAR composites. IEEE Trans. Geosci. Remote Sens. 1999, 37, 1316–1326. [Google Scholar] [CrossRef]
  44. Twele, A.; Cao, W.; Plank, S.; Martinis, S. Sentinel-1-based flood mapping: A fully automated processing chain. Int. J. Remote Sens. 2016, 37, 2990–3004. [Google Scholar] [CrossRef]
  45. Katiyar, V.; Tamkuan, N.; Nagai, M. Near-real-time flood mapping using off-the-shelf models with SAR imagery and deep learning. Remote Sens. 2021, 13, 2334. [Google Scholar] [CrossRef]
  46. Bereczky, M.; Wieland, M.; Krullikowski, C.; Martinis, S.; Plank, S. Sentinel-1-based water and flood mapping: Benchmarking convolutional neural networks against an operational rule-based processing chain. IEEE J. Sel. Top. Appl. Earth Obs. Remote Sens. 2022, 15, 2023–2036. [Google Scholar] [CrossRef]
  47. Ghosh, B.; Garg, S.; Motagh, M.; Martinis, S. Automatic flood detection from Sentinel-1 data using a nested UNet model and a NASA benchmark dataset. PFG J. Photogram. Remote Sens. Geoinf. Sci. 2024, 92, 1–18. [Google Scholar] [CrossRef]
  48. Ulaby, F.T.; Moore, R.K.; Fung, A.K. Microwave Remote Sensing: Active and Passive. Volume 2-Radar Remote Sensing and Surface Scattering and Emission Theory; Artech House: Norwood, MA, USA, 1982. [Google Scholar]
Figure 1. Flowchart of the proposed flood detection method. The green box represents the fuzzy-based water body detection system.
Remotesensing 17 01931 g001
Figure 2. (a) A histogram of the dual-pol parameter X and (b) corresponding fuzzy membership grade for water class. The parameters p 1 , p 2 , and p c denote fuzzy thresholds and cross-over point.
Remotesensing 17 01931 g002
Figure 3. Study areas and acquired Sentinel-1 SAR data (R: VV, G: VH, B: VV/VH) in pre- and post-flood conditions for (a) dataset 1 (Korea), (b) dataset 2 (Sri Lanka), and (c) dataset 3 (Colombia). The small rectangles in the Sentinel-1 SAR image represent the selected test sites for evaluation.
Remotesensing 17 01931 g003
Figure 4. Flood detection results in selected test sites for dataset 1 (K1, K2, and K3), dataset 2 (S1, S2, and S3), and dataset 3 (C1, C2, C3). The images from the first to the last column represent the ground truth image and flood detection results using V V intensity, V H intensity, S p a n , D o P , S E , fuzzy intersection, and fuzzy union parameters, respectively.
Remotesensing 17 01931 g004
Figure 5. The mean and standard deviation values of the (a) F1 and (b) Kappa accuracy metrics for all study areas and datasets.
Remotesensing 17 01931 g005
Figure 6. The mean and standard deviation values of the (a) precision and (b) recall accuracy metrics for all study areas and datasets.
Remotesensing 17 01931 g006
Figure 7. (a) An example of the flood map with two flood classes (hatched areas: flood-relevant class; filled areas: flood-reliable class) for the K1 test site. (b) The flood map for a zoomed area of the K1 site. (c) reference (truth) map. The second row shows two ancillary information, such as the (d) land cover map from the Korean Ministry of Environment and (e) elevation from Copernicus 30 m DEM of the zoomed area.
Remotesensing 17 01931 g007
Figure 8. Flood detection performance at each test site using the fuzzy union approach with respect to (a) incidence angle, scattering intensities in (b) VV and (c) VH polarization just before the flood event at the scatterers situated in the flooded area, scattering intensities in (d) VV and (e) VH polarization from neighboring non-inundated areas, and (f) average elevation difference between the flooded and surrounding areas.
Remotesensing 17 01931 g008
Table 1. Summary of Sentinel-1 SAR datasets for all three study areas.
Dataset 1 (Korea)Dataset 2 (Sri Lanka)Dataset 3 (Colombia)
Pre-FloodPost-FloodPre-FloodPost-FloodPre-FloodPost-Flood
PolarizationVV-VHVV-VHVV-VH
OrbitAscendingDescendingDescendingDescendingDescendingDescending
IW sub-swathIW1IW3IW2IW2IW1IW1
Acquisition
Date (UTC)
23 July 2023
09:33
23 July 2023
21:31
5 April 2024 00:254 June 2024 00:2525 April 2024 10:5019 May 2024 10:50
Table 2. Quantitative performances of different dual-pol parameters for dataset 1. Shaded cells represent the top three parameters for a given metric and bold text indicates the highest accuracy among them.
ParameterOAF1KappaPrecisionRecall
V V 0.94510.62870.60290.97110.4648
V H 0.97470.87110.85710.88780.8551
S p a n 0.95080.68100.65690.97000.5247
D o P 0.89250.07830.05130.27540.0456
S E 0.96700.81020.79260.95420.7040
V V V H 0.94500.62850.60270.97090.4646
V V V H 0.97470.87130.85730.88800.8552
Table 3. Quantitative performances of different dual-pol parameters for dataset 2. Shaded cells represent the top three parameters for a given metric and bold text indicates the highest accuracy among them.
ParameterOAF1KappaPrecisionRecall
V V 0.95520.81350.78810.81550.8116
V H 0.96160.82210.80090.93040.7364
S p a n 0.94790.79130.76160.76430.8204
D o P 0.92880.58930.55670.96400.4244
S E 0.96300.82910.80860.93430.7452
V V V H 0.96070.81520.79370.93990.7197
V V V H 0.95650.82080.79600.81390.8278
Table 4. Quantitative performances of different dual-pol parameters for dataset 3. Shaded cells represent the top three parameters for a given metric and bold text indicates the highest accuracy among them.
ParameterOAF1KappaPrecisionRecall
V V 0.94640.90880.87090.91980.8981
V H 0.94390.90350.86390.92360.8842
S p a n 0.94900.91470.87830.90820.9214
D o P 0.79320.48350.39000.93710.3258
S E 0.95050.91870.88320.89710.9414
V V V H 0.93920.89280.85050.93730.8523
V V V H 0.95120.91880.88390.90790.9299
Disclaimer/Publisher’s Note: The statements, opinions and data contained in all publications are solely those of the individual author(s) and contributor(s) and not of MDPI and/or the editor(s). MDPI and/or the editor(s) disclaim responsibility for any injury to people or property resulting from any ideas, methods, instructions or products referred to in the content.

