Article

Extraction of Levees from Paddy Fields Based on the SE-CBAM UNet Model and Remote Sensing Images

1
College of Information Technology, Jilin Agricultural University, Changchun 130118, China
2
State Key Laboratory of Black Soils Conservation and Utilization, Northeast Institute of Geography and Agroecology, Chinese Academy of Sciences, Changchun 130102, China
*
Author to whom correspondence should be addressed.
Remote Sens. 2025, 17(11), 1871; https://doi.org/10.3390/rs17111871
Submission received: 9 April 2025 / Revised: 25 May 2025 / Accepted: 26 May 2025 / Published: 28 May 2025

Abstract

:
During rice cultivation, extracting levees helps to delineate effective planting areas, thereby enhancing the precision of management zones. This approach is crucial for devising more efficient water field management strategies and has significant implications for water-saving irrigation and fertilizer optimization in rice production. The uneven distribution and lack of standardization of levees pose significant challenges for their accurate extraction. However, recent advancements in remote sensing and deep learning technologies have provided viable solutions. In this study, Youyi Farm in Shuangyashan City, Heilongjiang Province, was chosen as the experimental site. We developed the SCA-UNet model by optimizing the UNet algorithm and enhancing its network architecture through the integration of the Convolutional Block Attention Module (CBAM) and Squeeze-and-Excitation Networks (SE). The SCA-UNet model leverages the channel attention strengths of SE while incorporating CBAM to emphasize spatial information. Through a dual-attention collaborative mechanism, the model achieves a synergistic perception of the linear features and boundary information of levees, thereby significantly improving the accuracy of levee extraction. The experimental results demonstrate that the proposed SCA-UNet model and its additional modules offer substantial performance advantages. Our algorithm outperforms existing methods in both computational efficiency and precision. Significance analysis revealed that our method achieved overall accuracy (OA) and F1-score values of 88.4% and 90.6%, respectively. These results validate the efficacy of the multimodal dataset in addressing the issue of ambiguous levee boundaries. Additionally, ablation experiments using 10-fold cross-validation confirmed the effectiveness of the proposed SCA-UNet method. This approach provides a robust technical solution for levee extraction and has the potential to significantly advance precision agriculture.

1. Introduction

The northeastern region of China, as one of the primary rice-growing areas, holds an irreplaceable position in ensuring national food security and propelling the development of modern agriculture [1]. The growing demands for land use and production construction have introduced new challenges for the management of agricultural land. Levees form the predominant boundaries of paddy fields, and thus, the accurate extraction of levees within these fields is fundamental to precise paddy field management zoning. The application of remote sensing technology has provided rich detail features of paddy fields for refined management. Accurate levee information aids in the rational division of paddy field management units and offers technical support for improving agricultural quality and efficiency, as well as for water and fertilizer conservation [2].
In traditional agricultural image segmentation research, image segmentation based on mathematical morphology and edge detection using the Canny algorithm has been proposed [3]. Mathematical morphology is prone to losing detailed information and struggles with irregularly shaped levees [4]. The Canny algorithm is susceptible to external noise and other factors, suffering from difficulties in false edge detection and poor adaptability [5]. Compared with early traditional methods, the integration of deep learning (DL) and high-resolution data has emerged as a promising solution due to its comprehensive ability to optimize semantically meaningful feature extraction and classification [6]. By automatically learning multi-level features, deep learning techniques have significantly improved the accuracy and robustness of levee extraction in complex scenes.
Recent advancements in remote sensing image segmentation have been marked by the introduction of innovative methods aimed at enhancing the precision and applicability of segmentation techniques. Chen et al. [7] developed RSPrompter, a prompt-based learning approach that utilizes SAM for instance segmentation in remote sensing imagery. This method significantly boosts segmentation accuracy by incorporating contextual information through prompts. Similarly, Yan et al. [8] introduced RingMo-SAM, which extends the capabilities of SAM to multimodal remote sensing data by embedding features from diverse data sources using a prompt encoder. Despite these improvements, SAM’s reliance on high-quality immediate inputs to filter out irrelevant features remains a limitation, particularly for applications requiring automated image interpretation. In the realm of agricultural image processing, Xia Li et al. [9] proposed a machine vision-based system for extracting navigation lines using the Faster-UNet semantic segmentation model. This system integrates deep learning semantic segmentation with adaptive multi-ROI midpoint fitting, achieving a 65.86% reduction in model parameters and an average path planning accuracy (mPA) of 97.39%. This advancement addresses the challenge of generalizing single-crop inter-row navigation path recognition. Wang Y et al. [10] introduced a Multi-Task Deformable UNet Combined Augmented Network (MDE-UNet) designed specifically for paddy field boundary segmentation. This innovative approach achieved remarkable performance metrics, with an accuracy rate of 96.41% and a mean Intersection over Union (mIoU) of 91.29%. These results demonstrate that the MDE-UNet method not only outperforms the widely recognized DeepLabv3+ but also holds significant potential for enhancing the precision of paddy field boundary segmentation tasks. In another notable study, Kaur S et al. [11] developed a novel method for crop classification using remote sensing images. Their approach integrates UNet with the SEResNext50 architecture as the backbone network. This combination yielded impressive results, achieving an average Intersection over Union (IoU) of 0.6465, an average precision of 0.7371, an average recall of 0.7191, and an average F1 score of 0.7352. These findings highlight the effectiveness of their method in accurately classifying crops based on remote sensing data, contributing valuable insights to the field of agricultural remote sensing. Meyarian A et al. [12] proposed a CNN model for classifying farmland by identifying internal levees from high-resolution aerial imagery. This method, which includes refinement through superpixel-based segmentation, increased the overall accuracy by 3.08% and reduced the error rate by 28.57%. Dakota S. Dale et al. [13] developed a deep learning method based on open-source aerial imagery, constructing a ResNet/UNet hybrid model to identify levees in contour irrigation systems. The model achieved an ROC score of 0.991, which dropped significantly to 0.691 when the spatial resolution was reduced to 60 m.
The core concept of attention mechanisms is to mimic the selective focusing ability in human cognition, where different parts of the input information are assigned varying weights to dynamically adjust the allocation of computational resources in the model [14]. Attention mechanisms can indicate where our focus should be [15]. Weighting features using attention mechanisms is an effective approach [16]. Yang X et al. [17] improved the UNet network by introducing channel attention mechanisms in the encoding stage, highlighting target features and suppressing background noise to enhance the accuracy of information fusion between shallow and deep layers. Bai X et al. [18] developed a dual-stream semantic segmentation network algorithm based on the ResNet neural network for semantic segmentation, employing multi-scale convolutional attention mechanisms between the encoder and decoder to expand the receptive field while controlling computational complexity. Wang J et al. [19] proposed the SAR-UNet model, which replaces the convolutions in the UNet framework with residual modules and incorporates Squeeze-and-Excitation Network (SE) blocks in the encoder, along with an Atrous Spatial Pyramid Pooling (ASPP) module to replace the transition and output layers [20]. Thus, many networks have augmented the original UNet by incorporating attention mechanisms to focus on salient features. In recent years, the use of the UNet network has become increasingly widespread due to its ability to simultaneously store and express shallow, mid-level, and deep features, thereby reducing the loss of detailed information caused by convolution and pooling operations. However, most existing studies have employed single attention mechanisms, neglecting the complementarity of multidimensional features. Many methods directly concatenate feature maps in the encoder–decoder skip connections without considering the weight allocation between shallow details and deep semantics, which can easily lead to blurred edges.
To address the technical limitations of existing levee extraction methods in complex farmland scenarios, such as the omission of small targets and blurred edges, we propose a novel deep learning model called SCA-UNet. By integrating multimodal remote sensing data with advanced deep learning algorithms, we aim to develop a high-precision classification algorithm for accurate levee identification and extraction, thereby minimizing the impact of levees on zoning results. To achieve this, we innovatively enhanced the traditional UNet encoder–decoder architecture by incorporating a dual-path feature fusion mechanism that integrates Squeeze-and-Excitation Networks (SENet) and a Convolutional Block Attention Module (CBAM). Our study employs a dual-attention collaborative mechanism, in which SENet and CBAM modules complement each other; SENet enhances the saliency of key channels, while CBAM optimizes spatial localization accuracy. The SENet module is applied in the shallow layers of the encoder to suppress noise, while the CBAM module refines edges in the deeper layers. Through dual-path skip connections, we dynamically fuse high-resolution features from shallow layers (containing edge details) with semantic features from deeper layers (containing contextual information), thereby preventing the loss of small target information. Through these efforts, we aim to improve the accuracy of zoning results and enhance the overall economic benefits of agricultural area estimation.

2. Materials and Methods

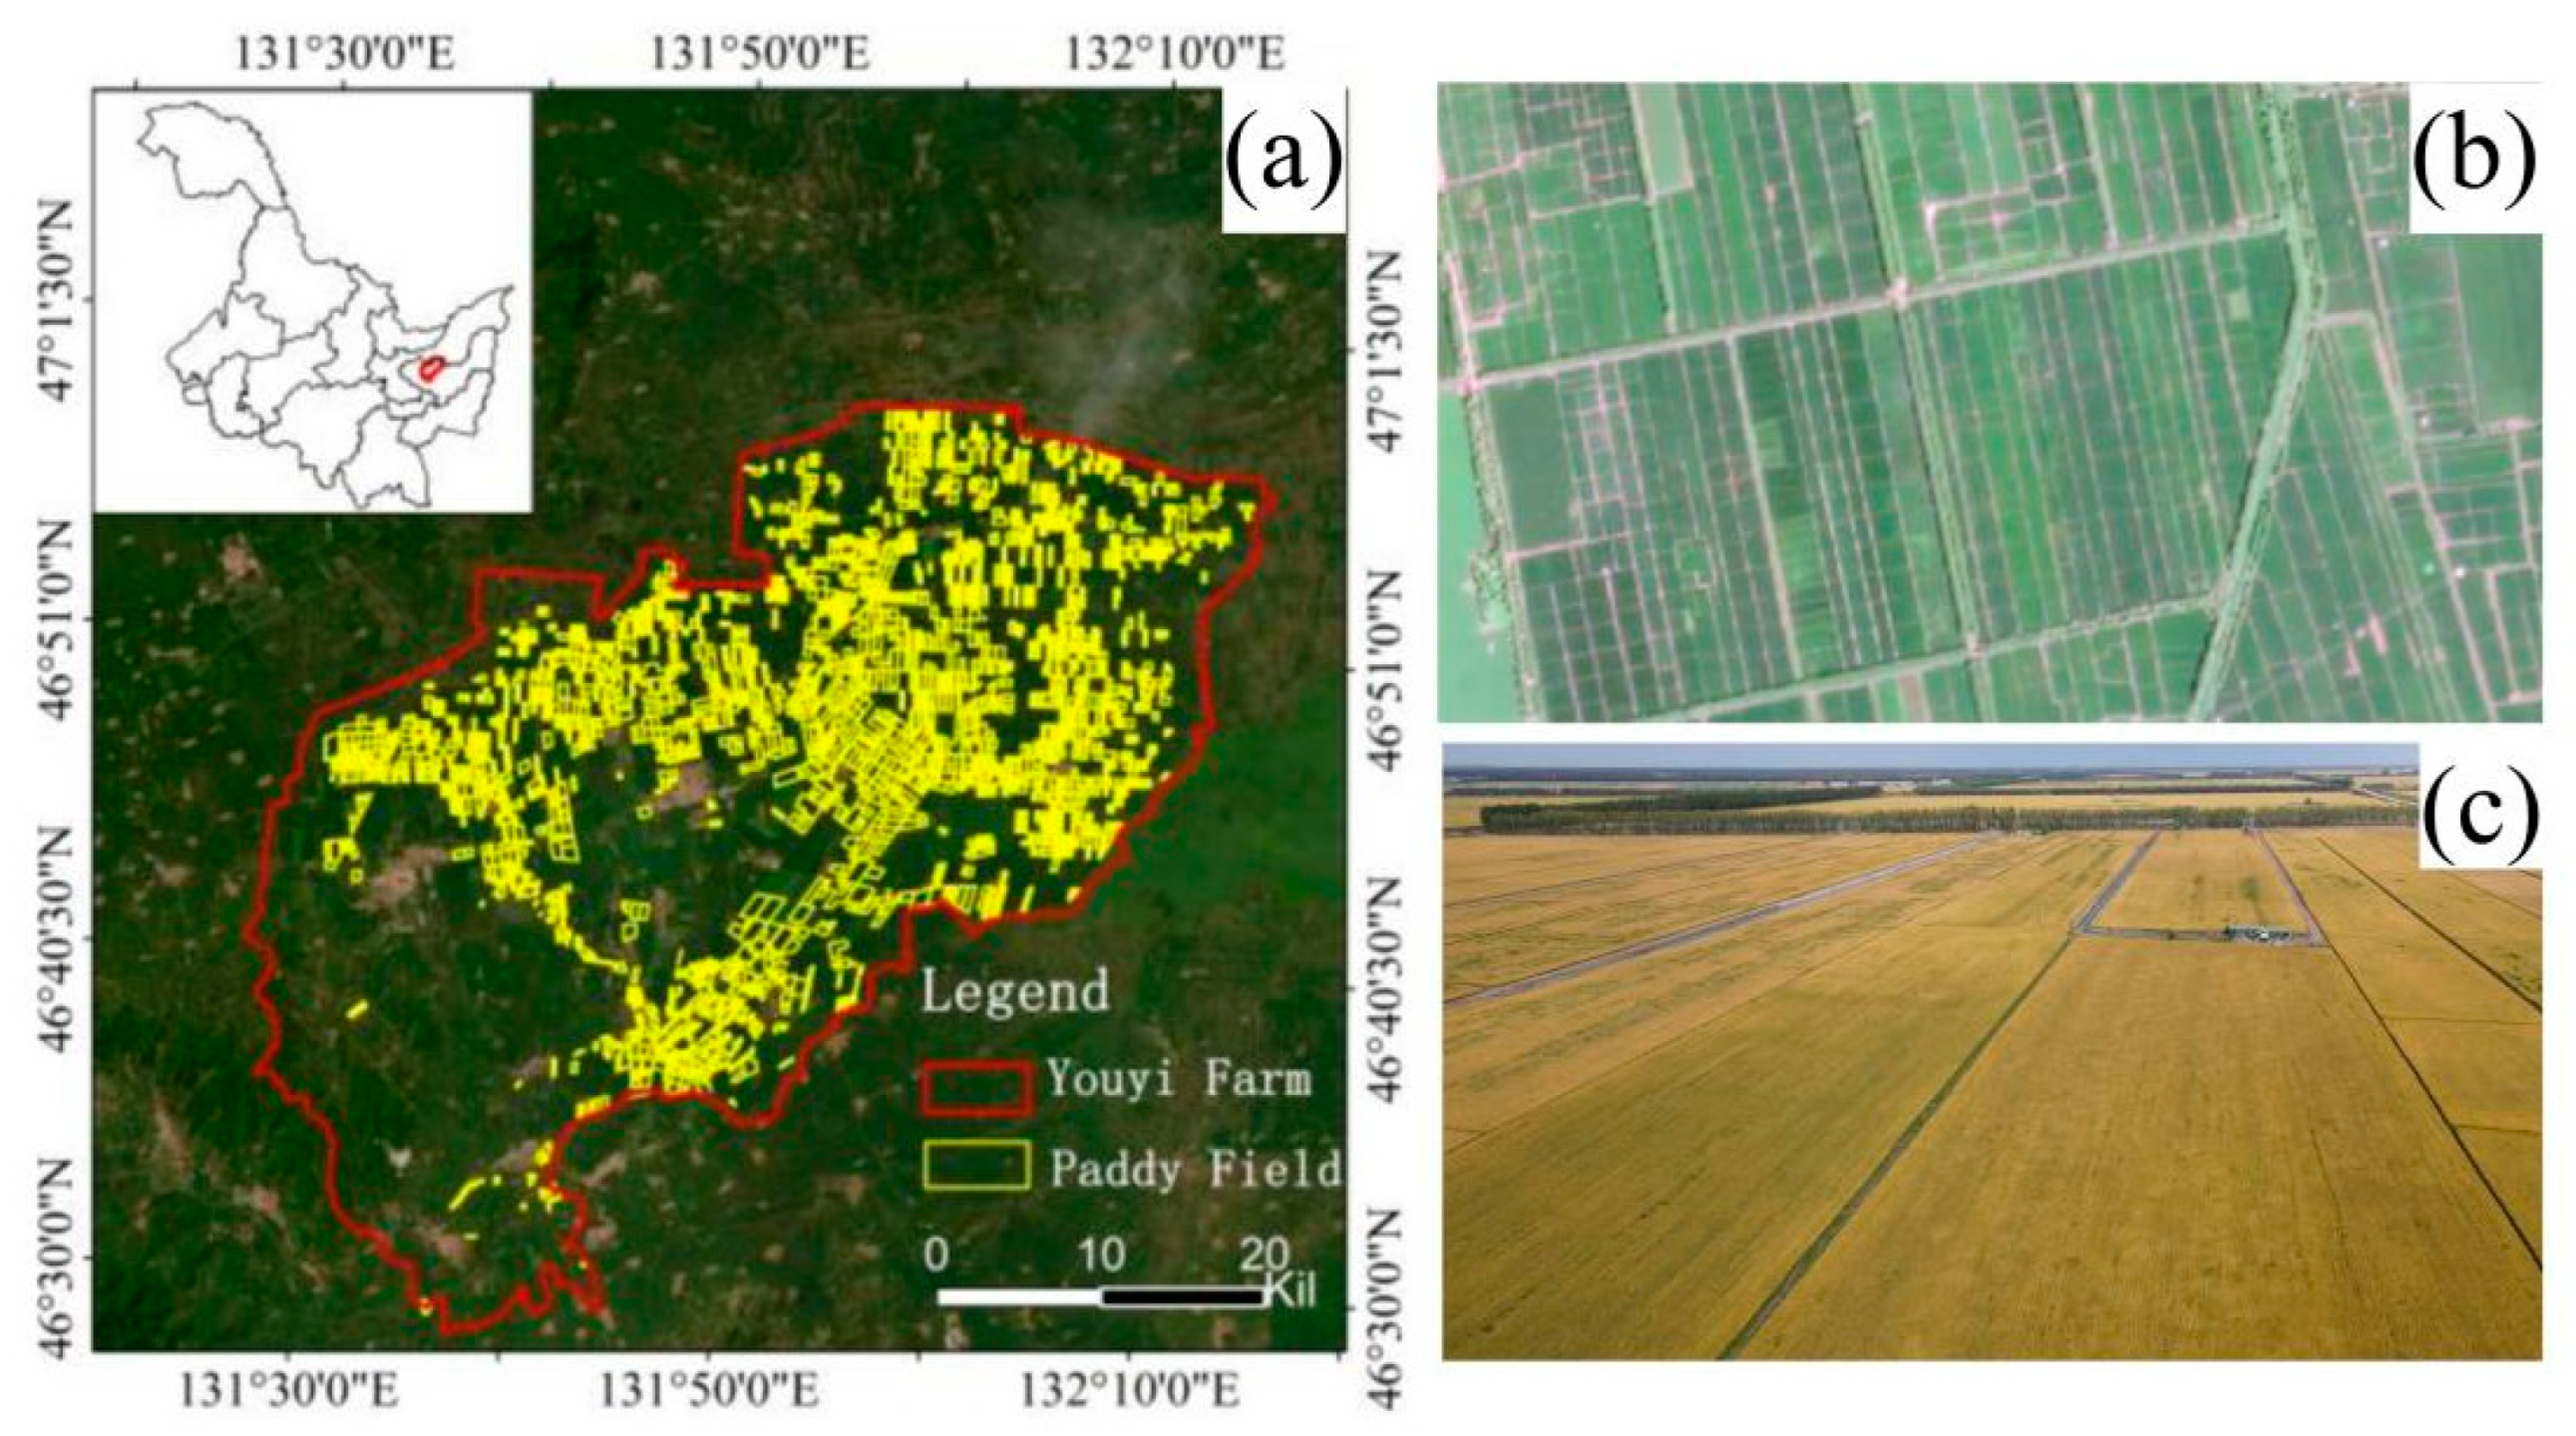
2.1. Study Areas and Datasets

The study area is situated in Youyi Farm, Youyi County, Shuangyashan City, Heilongjiang Province (46°30′0″–47°1′30″N, 131°30′0″–132°10′0″E). Characterized by a mid-temperate continental monsoon climate, the region has an average annual temperature of 3.1 °C and an effective accumulated temperature of 2300–2600 °C for temperatures ≥10 °C [21]. With an average annual precipitation of 450–650 mm and a frost-free period of 143 days, it is well-suited for cultivating high-quality japonica rice. The terrain is higher in the south and west and lower in the north and east and exhibits significant spatial differentiation. The northeastern part is predominantly low-lying with marshy soils, making rice the dominant crop due to unique geographical factors [22]. These conditions ensure the stability and robustness of the experimental data. The rice planting area covers approximately 40% of Youyi Farm, about 253,000 acres [23], providing ample data for the study. The levees within the farmland, ranging in width from 20 to 40 cm, can be identified and extracted using high-resolution imagery. Crop classification is performed through manual labeling to delineate rice planting areas. The accurate and effective extraction of levee morphology is crucial for local agricultural development and precise management. The study area is shown in Figure 1a, the distribution of levees in paddy fields is depicted in remote sensing imagery in Figure 1b, and the spatial morphology of levees is shown in Figure 1c.

2.1.1. Data Acquisition and Preprocessing

The data for this experiment were obtained from the “Gaofen-1” satellite, the first satellite of China’s high-resolution Earth observation system. Gaofen-1 is equipped with a high-resolution multispectral camera, providing a panchromatic resolution of 2 m and a multispectral resolution of 8 m. This resolution allows for the clear identification of smaller objects and detailed features on the ground. The satellite’s multispectral camera covers four spectral bands: blue, green, red, and near-infrared. Each band has distinct reflectance characteristics for different types of land cover. The rich land cover information provided by the remote sensing imagery, based on spectral features, enables precise land cover classification and facilitates the accurate identification of levees in paddy fields. To enhance data quality, a series of preprocessing steps was conducted on the acquired satellite imagery using ENVI software [24]. These steps included radiometric calibration, atmospheric correction, orthorectification, and image registration. Radiometric calibration converts the digital numbers (DN) of the image into radiance or reflectance values. Solar radiation, influenced by atmospheric aerosols, terrain, and adjacent land cover, impinges on the surface and is subsequently reflected to the sensor. As a result, the raw imagery contains a composite of information from the surface, atmosphere, and sun. To discern the spectral properties of a particular surface, it is imperative to isolate its reflectance information from the atmospheric and solar components, necessitating atmospheric correction. Orthorectification is then performed on the imagery. For panchromatic imagery, orthorectification is directly applied using a digital elevation model (DEM) to correct each pixel for topographic variations, ensuring that the imagery conforms to orthographic projection requirements. Finally, image registration is conducted between multispectral and panchromatic imagery. Once image registration is complete, ENVI software is employed to merge the images, yielding high-resolution multispectral imagery.
According to the growth characteristics of rice throughout its entire growth period in Northeast China, July typically coincides with the critical phenological stages of panicle initiation and heading. During this period, the canopy leaf area index reaches its peak, creating a significant difference in vegetation indices such as NDVI compared to the bare soil areas of levees, thus achieving optimal spectral separability [25,26]. Temporal analysis indicates that the boundary features between paddy fields and levees are most pronounced during this period, with the highest classification confidence. Therefore, imagery data from July were selected as the experimental data source for this study.

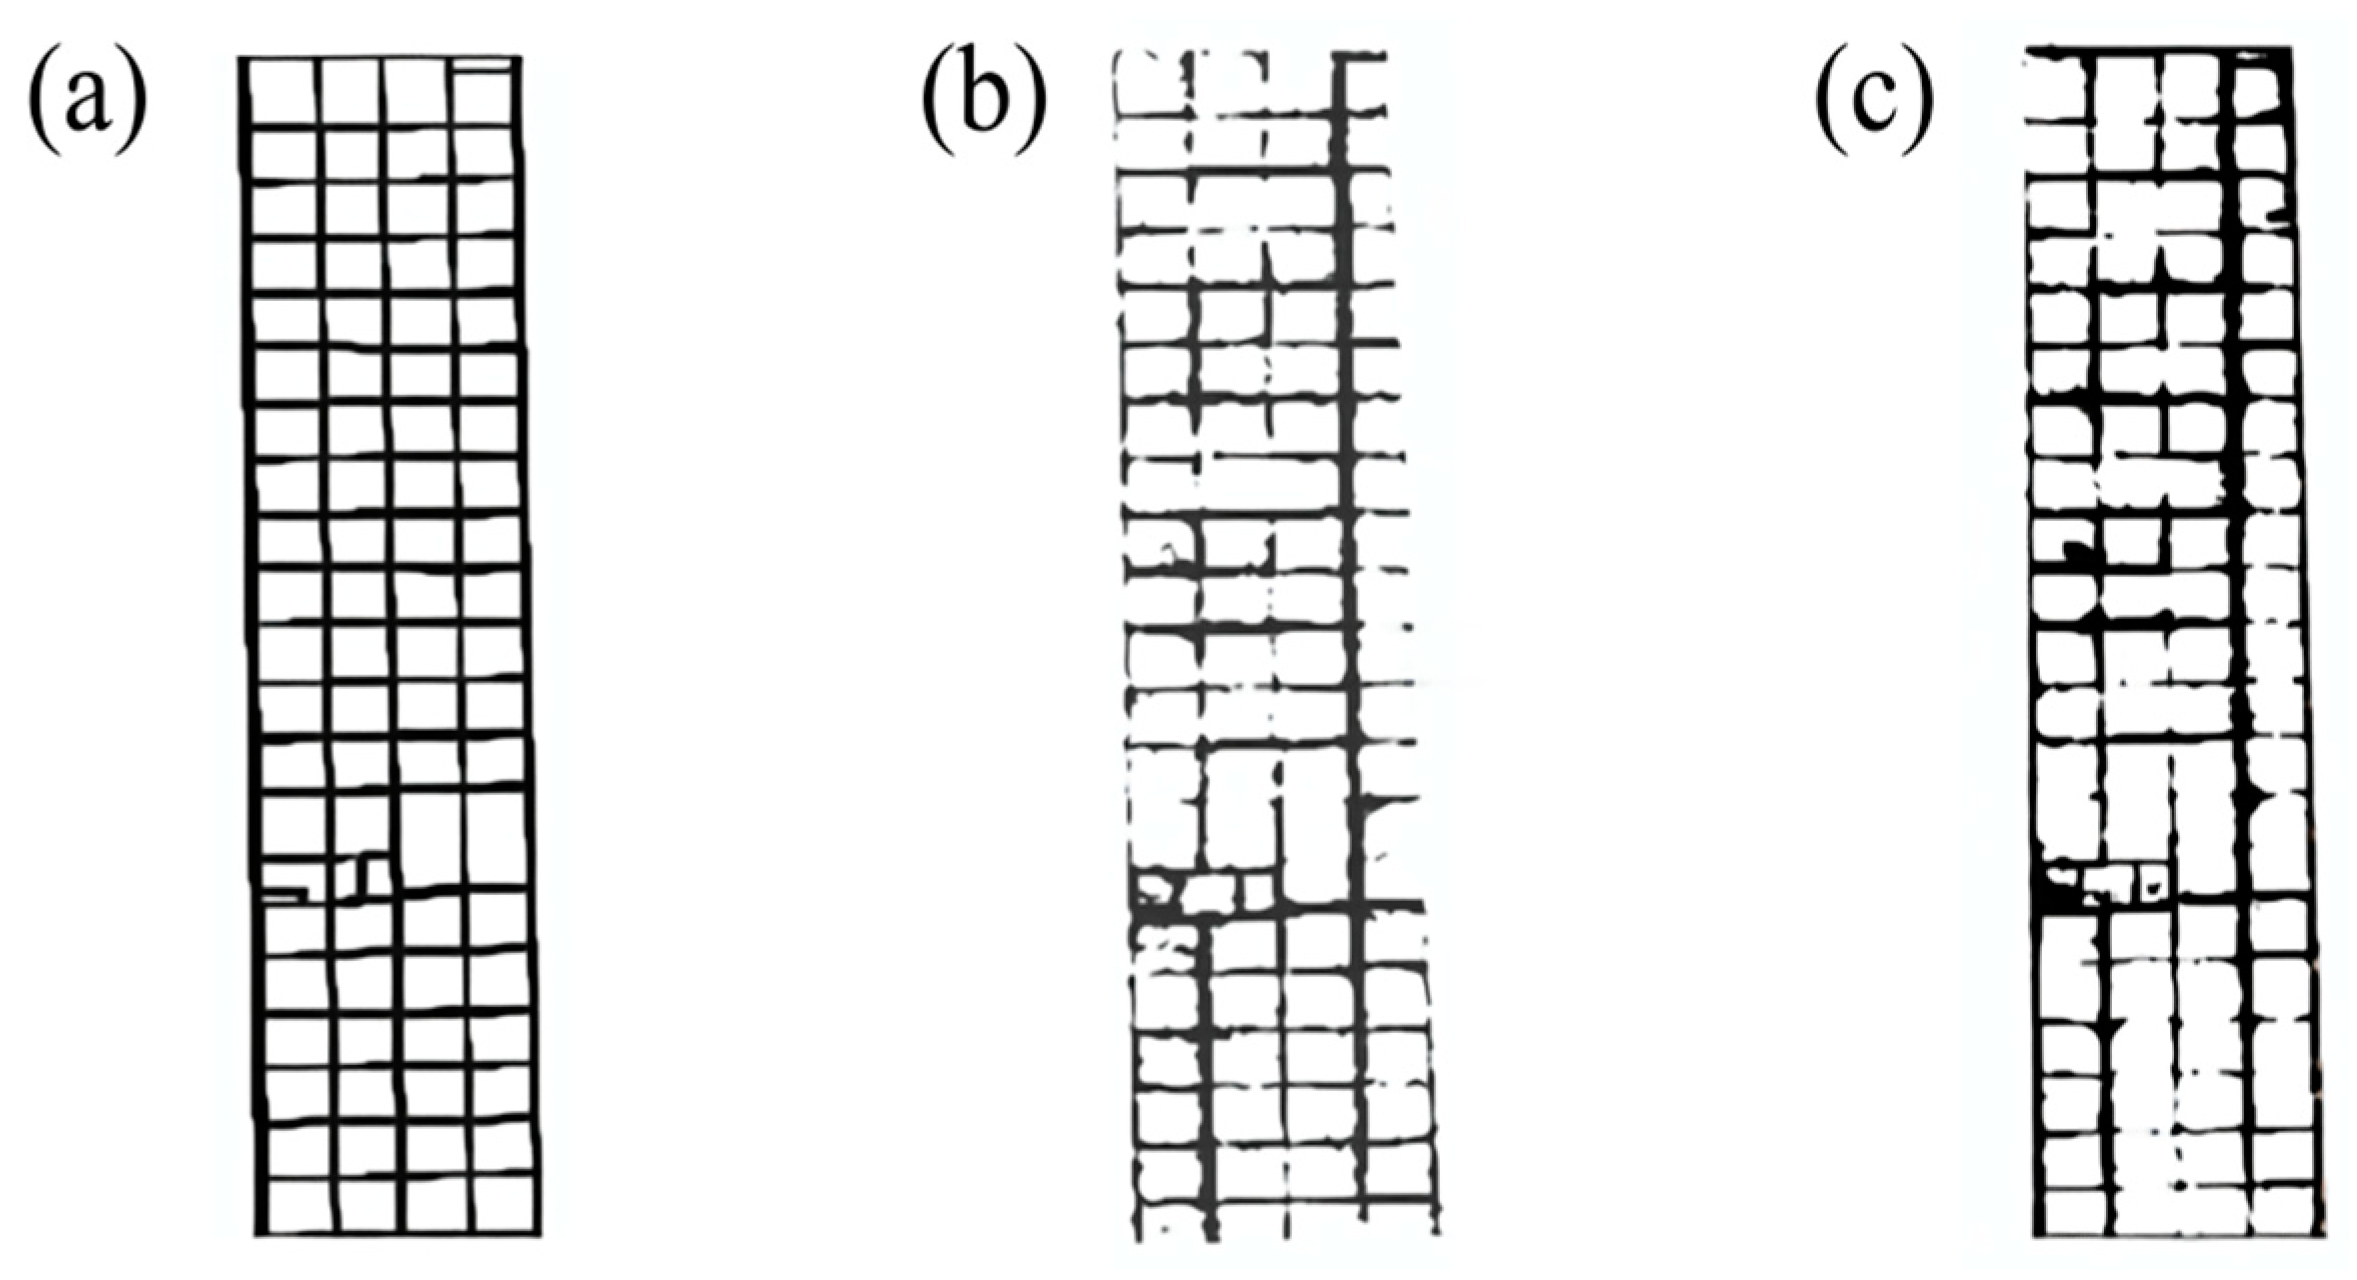
2.1.2. Labeled Dataset Construction

The accurate labeling of levees is a crucial factor when constructing a labeled dataset. Multimodal fusion labeling can generate a richer labeling system, aiding the model in learning the associations between different modalities and reducing the risk of overfitting. In this paper, we construct the labeled dataset in two ways, one is to build the labeled dataset using an index extraction method, and the other is to build the labeled dataset through manual labeling. We first use manual labeling to annotate levees, utilizing ArcGIS 10.6 to construct label data for the boundaries of each plot, which are then merged to form a labeled dataset for a larger plot area. This study integrates the Enhanced Vegetation Index (EVI) and the Normalized Difference Vegetation Index (NDVI) to build an automated labeling system [27]. EVI, which is commonly used for extracting land cover types in dense vegetation areas, shows significant spectral separability in distinguishing among four typical land cover types: forests, shrublands, herbaceous vegetation, and bare soil. Using EVI with specific threshold settings to extract training samples for deep learning is of great significance for reducing manual labeling and improving identification accuracy [28]. As an Enhanced Vegetation Index, EVI is an improvement over NDVI, considering the effects of atmospheric scattering and land surface reflectance to more accurately assess the health and productivity of vegetation ecosystems [29]. The calculation of EVI is shown in Equation (1).
  EVI = G   ×   ( NIR     Red ) NIR + C 1   ×   Red     C 2   ×   Blue + L
The coefficients C1, C2, and L are incorporated to accommodate diverse environmental conditions. Specifically, G is set to 2.5 to amplify the vegetation signal and thereby increase the sensitivity of the Enhanced Vegetation Index (EVI) to changes in vegetation. The coefficients C1 and C2 are assigned values of 6 and 7.5, respectively. These values adjust the weights of the red and blue spectral bands within the formula, which helps to mitigate the interference from soil background and atmospheric effects. The coefficient L is set to 1, primarily to prevent the denominator from becoming zero and to ensure the mathematical stability of the formula. Additionally, L provides a minor adjustment to the overall calculation result.
During the tillering, heading, and ripening stages of rice growth, distinct phenological characteristics are exhibited at both the pixel and plot scales, with clear differences from weeds and trees. The Normalized Difference Vegetation Index (NDVI) outperforms the Visible-band Difference Vegetation Index (VDVI) in terms of the accuracy of vegetation cover extraction. NDVI achieves the highest precision in extracting vegetation cover for all three stages of rice growth, with extraction errors of 0.40%, 0.43%, and 0.81%, respectively. The coefficient of determination R2 values are 0.77, 0.92, and 0.98, and the Root Mean Square Error (RMSE) values are 9.09%, 2.97%, and 0.38% [30]. The calculation of NDVI is shown in Equation (2).
    NDVI = ( NIR     Red ) ( NIR + Red )
Here, NIR represents the reflectance of the near-infrared band, while Red denotes the reflectance of the red band. Based on the aforementioned conclusions, this study employs both EVI and NDVI for label annotation. The manual labeling results are shown in Figure 2a, the extraction results of levees using NDVI are depicted in Figure 2b, and the extraction results using EVI are illustrated in Figure 2c.
To address the issue of the easy loss of levee edge information, this study innovatively proposes a multimodal collaborative labeling approach, employing a combined mode of three categories to construct the labeled dataset. By integrating automated pre-labeling using vegetation indices with manual labeling, the spatial representational completeness of the labeled dataset is enhanced, thereby improving the model’s generalization capability.

2.1.3. Construction of the Training and Testing Dataset

Owing to the limitations imposed by the model’s input feature dimensions, it became necessary to clip both the constructed labeled dataset and the image dataset. Utilizing the Image Analysis tool, which is accessible via the Geoprocessing tool option in ArcGIS Pro software, we selected the target and exported it as a deep learning sample. The image and label data were input, with a clipping size set at 256, to facilitate the batch clipping of our deep learning sample dataset. To acquire uniformly sized image sets from two regions, a sliding window method was employed. Both the image and label datasets were collected using an overlapping sliding method, with a stride equivalent to 0.1 times the window width, culminating in a final data sample size of 256 × 256 × 4. The clipped results were subsequently utilized to partition the training set, test set, and validation set. To bolster the generalization capability of our model and avoid overfitting during the model training phase, we harnessed data augmentation methods within the PyCharm framework [31]. These methods were applied to each batch of the clipped image and label datasets. The primary data augmentation techniques encompassed (1) a 90° rotation of images and labels, as depicted in Figure 3c; (2) the vertical flipping of images and labels, as illustrated in Figure 3d; and (3) the horizontal flipping of images and labels, as shown in Figure 3e. Through data augmentation, the dataset was augmented from 2418 to 9672 samples, which were then apportioned into training, test, and validation sets at a ratio of 8:1:1.

2.2. UNet Network Model

The UNet model is an end-to-end semantic segmentation network, named for its U-shaped architecture [32]. Comprising an input layer, convolutional layers, pooling layers, transposed convolutional layers, activation functions, and an output layer, the UNet model’s convolutional layers utilize multiple 3 × 3 convolutional kernels with a stride of 1 to generate feature maps [33]. The decoder consists of several upsampling blocks, each incorporating transposed convolutions, skip connections, and convolutional layers, aimed at progressively restoring spatial resolution to produce pixel-level segmentation masks [34]. Activation functions, such as sigmoid, tanh, and ReLU, introduce non-linearity into the neural network, enhancing its capacity to fit non-linear mappings and improving model expressiveness. ReLU, a widely used non-linear activation function [35], is defined as shown in Equation (3).
  ReLU =     x     0                 x x < 0 0
The ReLU function outputs the input directly if it is greater than 0; otherwise, it outputs 0. While ReLU is linear in the positive domain, its overall non-linear nature enables neural networks to learn complex non-linear relationships. The zeroing of negative inputs, which results in some neurons having an output of 0, enhances the sparsity of the network and can improve generalization capability. Compared with sigmoid or tanh, the sparsity and linear characteristics of ReLU can accelerate the training speed [36]. The UNet model employs an encoder–decoder structure, with skip connections that directly transfer features from the encoder layers to the corresponding decoder layers. This preserves detailed information that might otherwise be lost due to downsampling and helps maintain spatial resolution, which is crucial for tasks that require fine segmentation, such as levee identification [32]. High-resolution remote sensing images often require significant downsampling, which can lead to the loss of levee details. Additionally, UNet’s lack of global context modeling makes it susceptible to local noise interference. Therefore, incorporating attention mechanisms can help suppress background noise.

2.3. Attention Mechanism

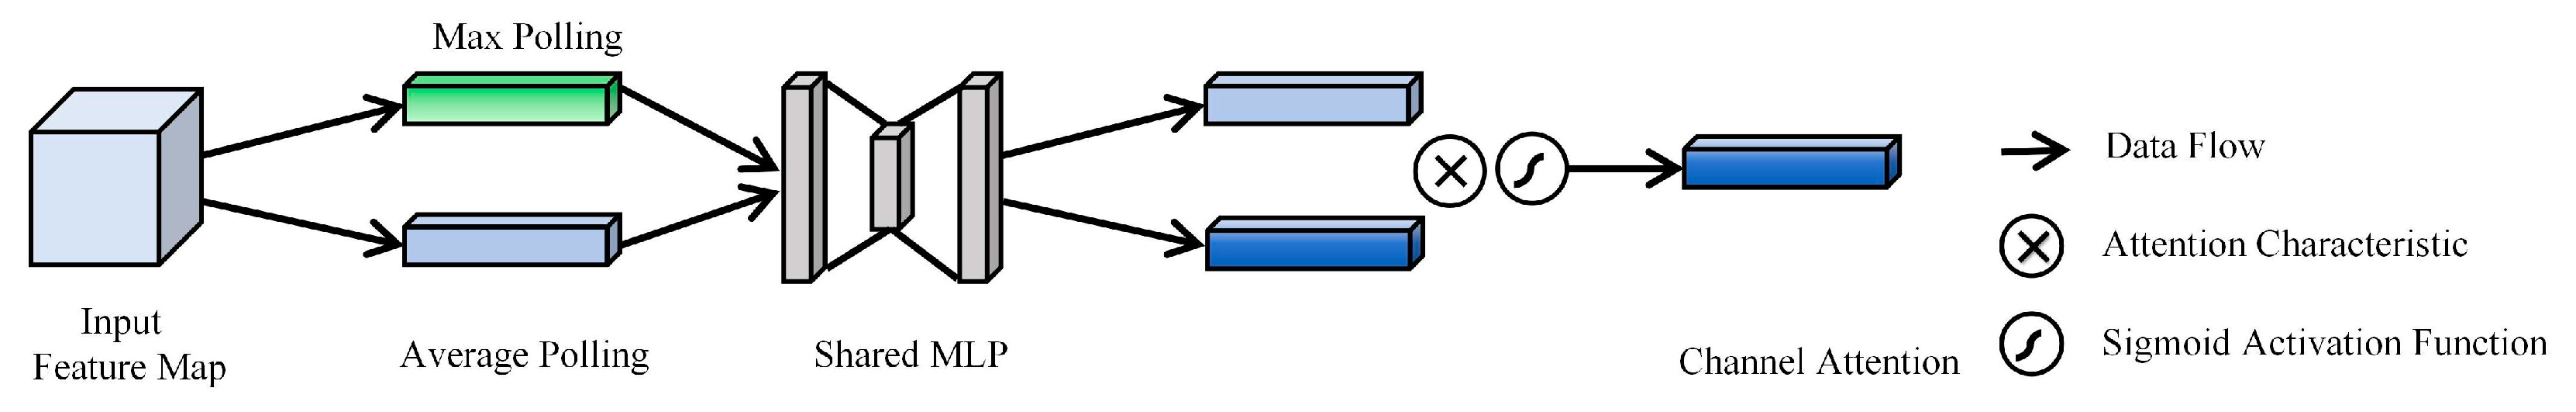
2.3.1. Squeeze and Excitation

Current deep learning-based change detection methods primarily achieve convincing results by incorporating attention mechanisms into traditional convolutional networks [37]. The Squeeze-and-Excitation module mainly enhances the quality of feature representation by adaptively adjusting channel weights. It is defined as shown in Equation (4).
  Z c = 1 H   ×   W i = 1 H j = 1 W X c i , j
Here, H and W represent the height and width of the feature map, while XC denotes the feature of the C-th channel. The Excitation module learns the non-linear dependencies among channels to generate channel weight vectors. It reduces the dimension from C to C r   (where r is the compression ratio, set to 16) using a fully connected layer with parameter W1, followed by the ReLU activation function. Another fully connected layer with parameter W2 restores the original channel dimension C, and the sigmoid function normalizes the weights to the [0, 1] interval [32]. This process is defined in Equation (5).
  S =   σ W 2 · ReLu W 1 · Z  
The SE attention block re-weights the feature maps of the UNet layers, highlighting only the useful channels. The SE module is extremely lightweight, requiring minimal parameters and computational resources to significantly enhance performance. It can be easily integrated into existing network architectures [38]. With its inherent multi-scale feature fusion, UNet, when combined with the SE module, can perform a more refined weighted fusion of features across different scales. However, the addition of the SE module increases the model’s computational load. The Squeeze and Excitation operations on the channel dimension, which involve matrix multiplications, can prolong model training and inference times. This may become a limiting factor when dealing with large-scale image data or in applications that require high real-time performance [39].

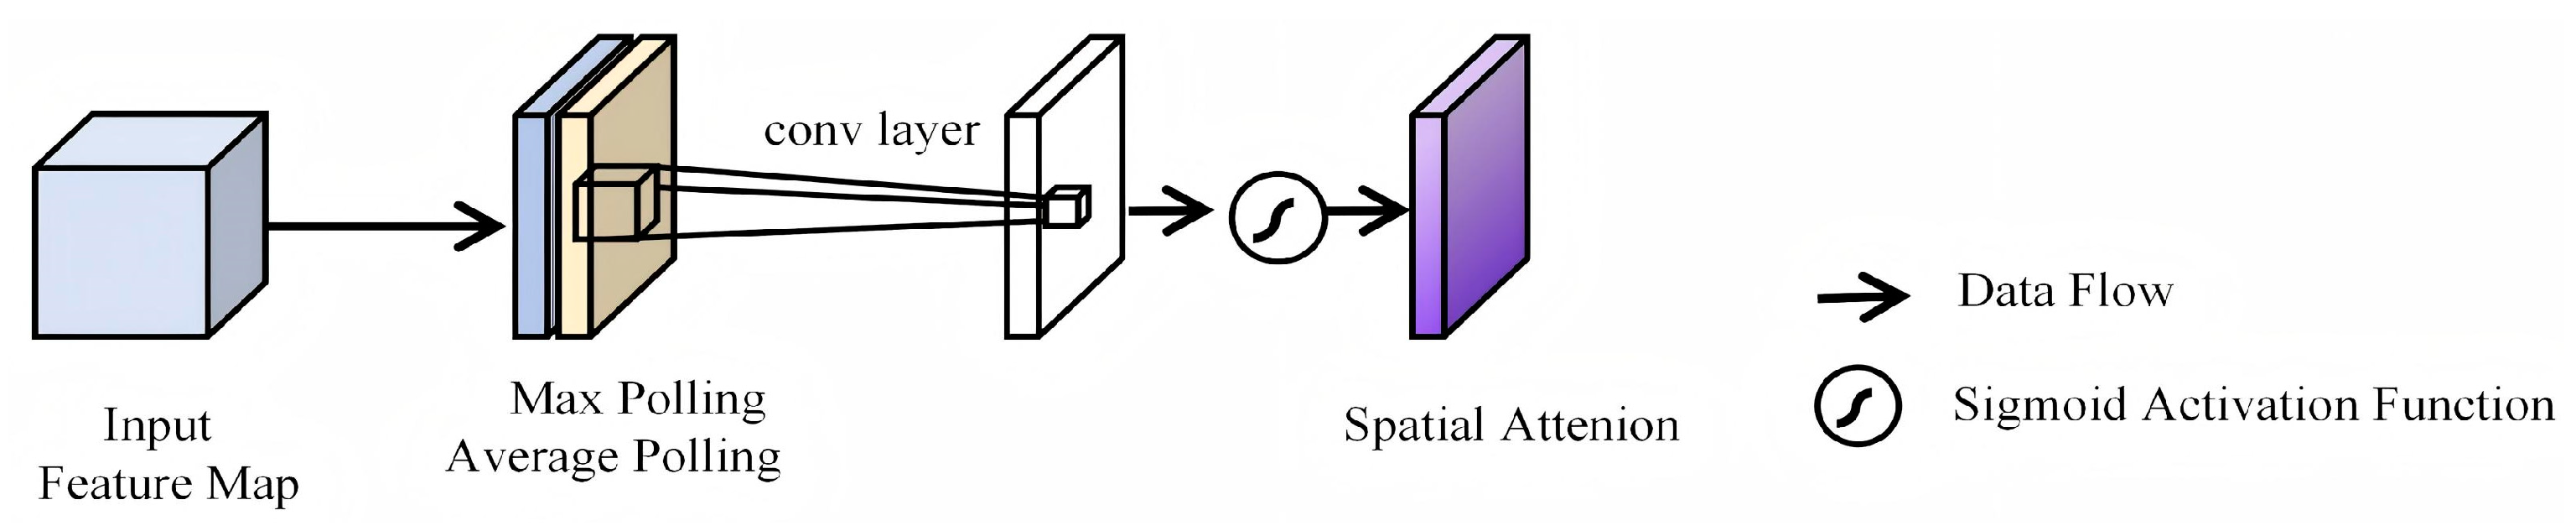
2.3.2. Convolutional Block Attention Module

In high-resolution remote sensing image segmentation, the targets to be extracted often have complex and variable shapes and sizes. The segmentation results obtained by upsampling single-depth features often fail to accurately delineate levee boundaries. To accommodate targets of different shapes and sizes, segmentation maps derived from multilayer feature upsampling are fused to produce the final extraction results. To address this issue, an attention mechanism structure has been incorporated into the UNet network architecture to obtain weights for different depth feature information. The Convolutional Block Attention Module (CBAM) is an attention module that is integrated into convolutional neural networks and aimed at enhancing the model’s feature representation capabilities by emphasizing important features and suppressing less important ones. The CBAM module introduces two attention processes: the Channel Attention Module (CAM) and the Spatial Attention Module (SAM) [40]. Its structure is shown in Figure 4.
The Channel Attention Module (CAM) aims to enhance the feature representation capabilities of different channels, and its structure is shown in Figure 5. The input to this module has dimensions of H × W × C, where H, W, and C represent the height, width, and number of channels of the feature map, respectively. Initially, the input feature layers are subjected to both global average pooling and global max pooling. Subsequently, the results of these two types of pooling are processed through a shared multilayer perceptron (MLP). Afterward, the weights of each channel are activated using a commonly used activation function in neural networks and then applied to the corresponding feature channels of the feature map. Ultimately, these weights are multiplied channel-wise with the input feature layers to adjust the channel response intensities in a weighted manner [15].
The Spatial Attention Module (SAM) focuses on the spatial dimensions of the image, extracting information from multiple perspectives. Its structure is shown in Figure 6. Initially, when computing spatial attention, average pooling and max pooling operations are performed along the channel dimension for each feature point. Subsequently, a convolution operation is applied to compress the multi-channel information into a single channel, thereby reducing the influence of inter-channel information on spatial attention. Finally, the sigmoid function is used to activate the weights of the features containing spatial information [41]. The calculated weights are then applied to the input feature layers through channel-wise multiplication, achieving weighted feature processing.
The channel attention mechanism is described as shown in Equation (6).
M C F = σ MLP AvgPool F + MLP MaxPool F
  = σ W 1 W 0 F avg C + W 1 W 0 F max C
Here,   σ is the sigmoid function, F is the input features, W0 and W1 are the MLP weights, W 0 R C / r × C , W 1 R C × C / r , C is the number of channels, and r is the reduction ratio. The formula for the spatial attention mechanism can be expressed as follows in Equation (7).
M s F =   σ f 7 × 7 F avg , c F max c
where σ is the sigmoid function, f 7   ×   7 denotes a 7   ×   7 convolution operation, and F avg , c F max c denotes a 7 × 7 convolution operation that represents the splicing of the average pooled and maximum pooled feature maps. The CBAM module sequentially generates attention weight maps along the channel attention and spatial attention sub-modules, and it is evident that the novel functionalities are derived from the multiplication of the attention weight maps with the constituent features.

2.4. SCA-UNet Model Construction

The Dual-Attention UNet with Feature Fusion (DAU-FI Net) addresses the challenges of semantic segmentation, especially in the context of multi-class imbalanced datasets and limited samples [42]. While the SE-UNet model focuses primarily on channel features, it tends to overlook spatial information. Therefore, in this study, we incorporate the CBAM module into the SE-UNet to enhance its ability to extract important patterns. This addition is highly effective in capturing both channel and spatial dependencies, allowing the network to focus on important regions and refine feature representation [43]. Our model, which is based on the UNet framework, enhances image segmentation capabilities through hierarchical attention mechanisms and dynamic feature fusion strategies. The encoder is responsible for extracting features from the input image, while the decoder maps these features back to the original image space to achieve pixel-level segmentation. The model architecture is illustrated in Figure 7.
The encoder employs a four-level downsampling structure, with each level consisting of a double convolutional layer (BasicBlock) and a max pooling operation. Specifically, each BasicBlock is composed of two sets of Conv (3 × 3)-BN-ReLU stacked together, and the spatial dimensions of the feature maps are progressively compressed through max pooling operations (MaxPool, 2 × 2). The input channels expand from the initial 3 channels (RGB) to 512 channels level by level and are further expanded to 1024 channels through the Bottleneck layer to capture deep semantic information. A Squeeze-and-Excitation (SE) module is embedded after each BasicBlock to recalibrate channel-wise feature responses, thereby suppressing noise interference and preserving high-frequency details. For deep feature processing, a Convolutional Block Attention Module (CBAM) is used, which combines channel and spatial attention mechanisms to enhance edge responses and contextual dependencies.
The decoder restores spatial resolution through four levels of upsampling. Transposed convolutions (Transposed Conv, 2 × 2) are used to achieve 2× upsampling, and low-resolution feature maps are concatenated (Concat) with high-resolution features from the corresponding layers of the encoder, followed by the refinement and fusion of features through a BasicBlock. The number of feature channels is progressively reduced from the initial 1024 channels during upsampling to 64 channels and finally mapped to the target class space through a 1 × 1 convolutional layer. To alleviate the loss of small target information, a dual-path skip connection strategy is proposed. The high-resolution path directly transfers shallow (levels 1–2) features to preserve original edge details and texture information. The semantic path applies the CBAM module to deep (levels 3–4) features to filter key semantic contexts. In the decoder, a lightweight attention network generates a channel–spatial joint weight matrix to adaptively fuse the dual-path features, the calculation process of which can be expressed as shown in Equation (8).
  F fused   = α · F high - res + 1     α · F semantic  
The weight coefficients are collaboratively optimized by the SE module (channel attention) and the CBAM module (spatial attention). This collaboration aids in further filtering and identifying levee features, thereby enhancing the precision of levee feature recognition. Additionally, it helps to mitigate the vanishing gradient problem, reduce model parameters, and lower the risk of overfitting.

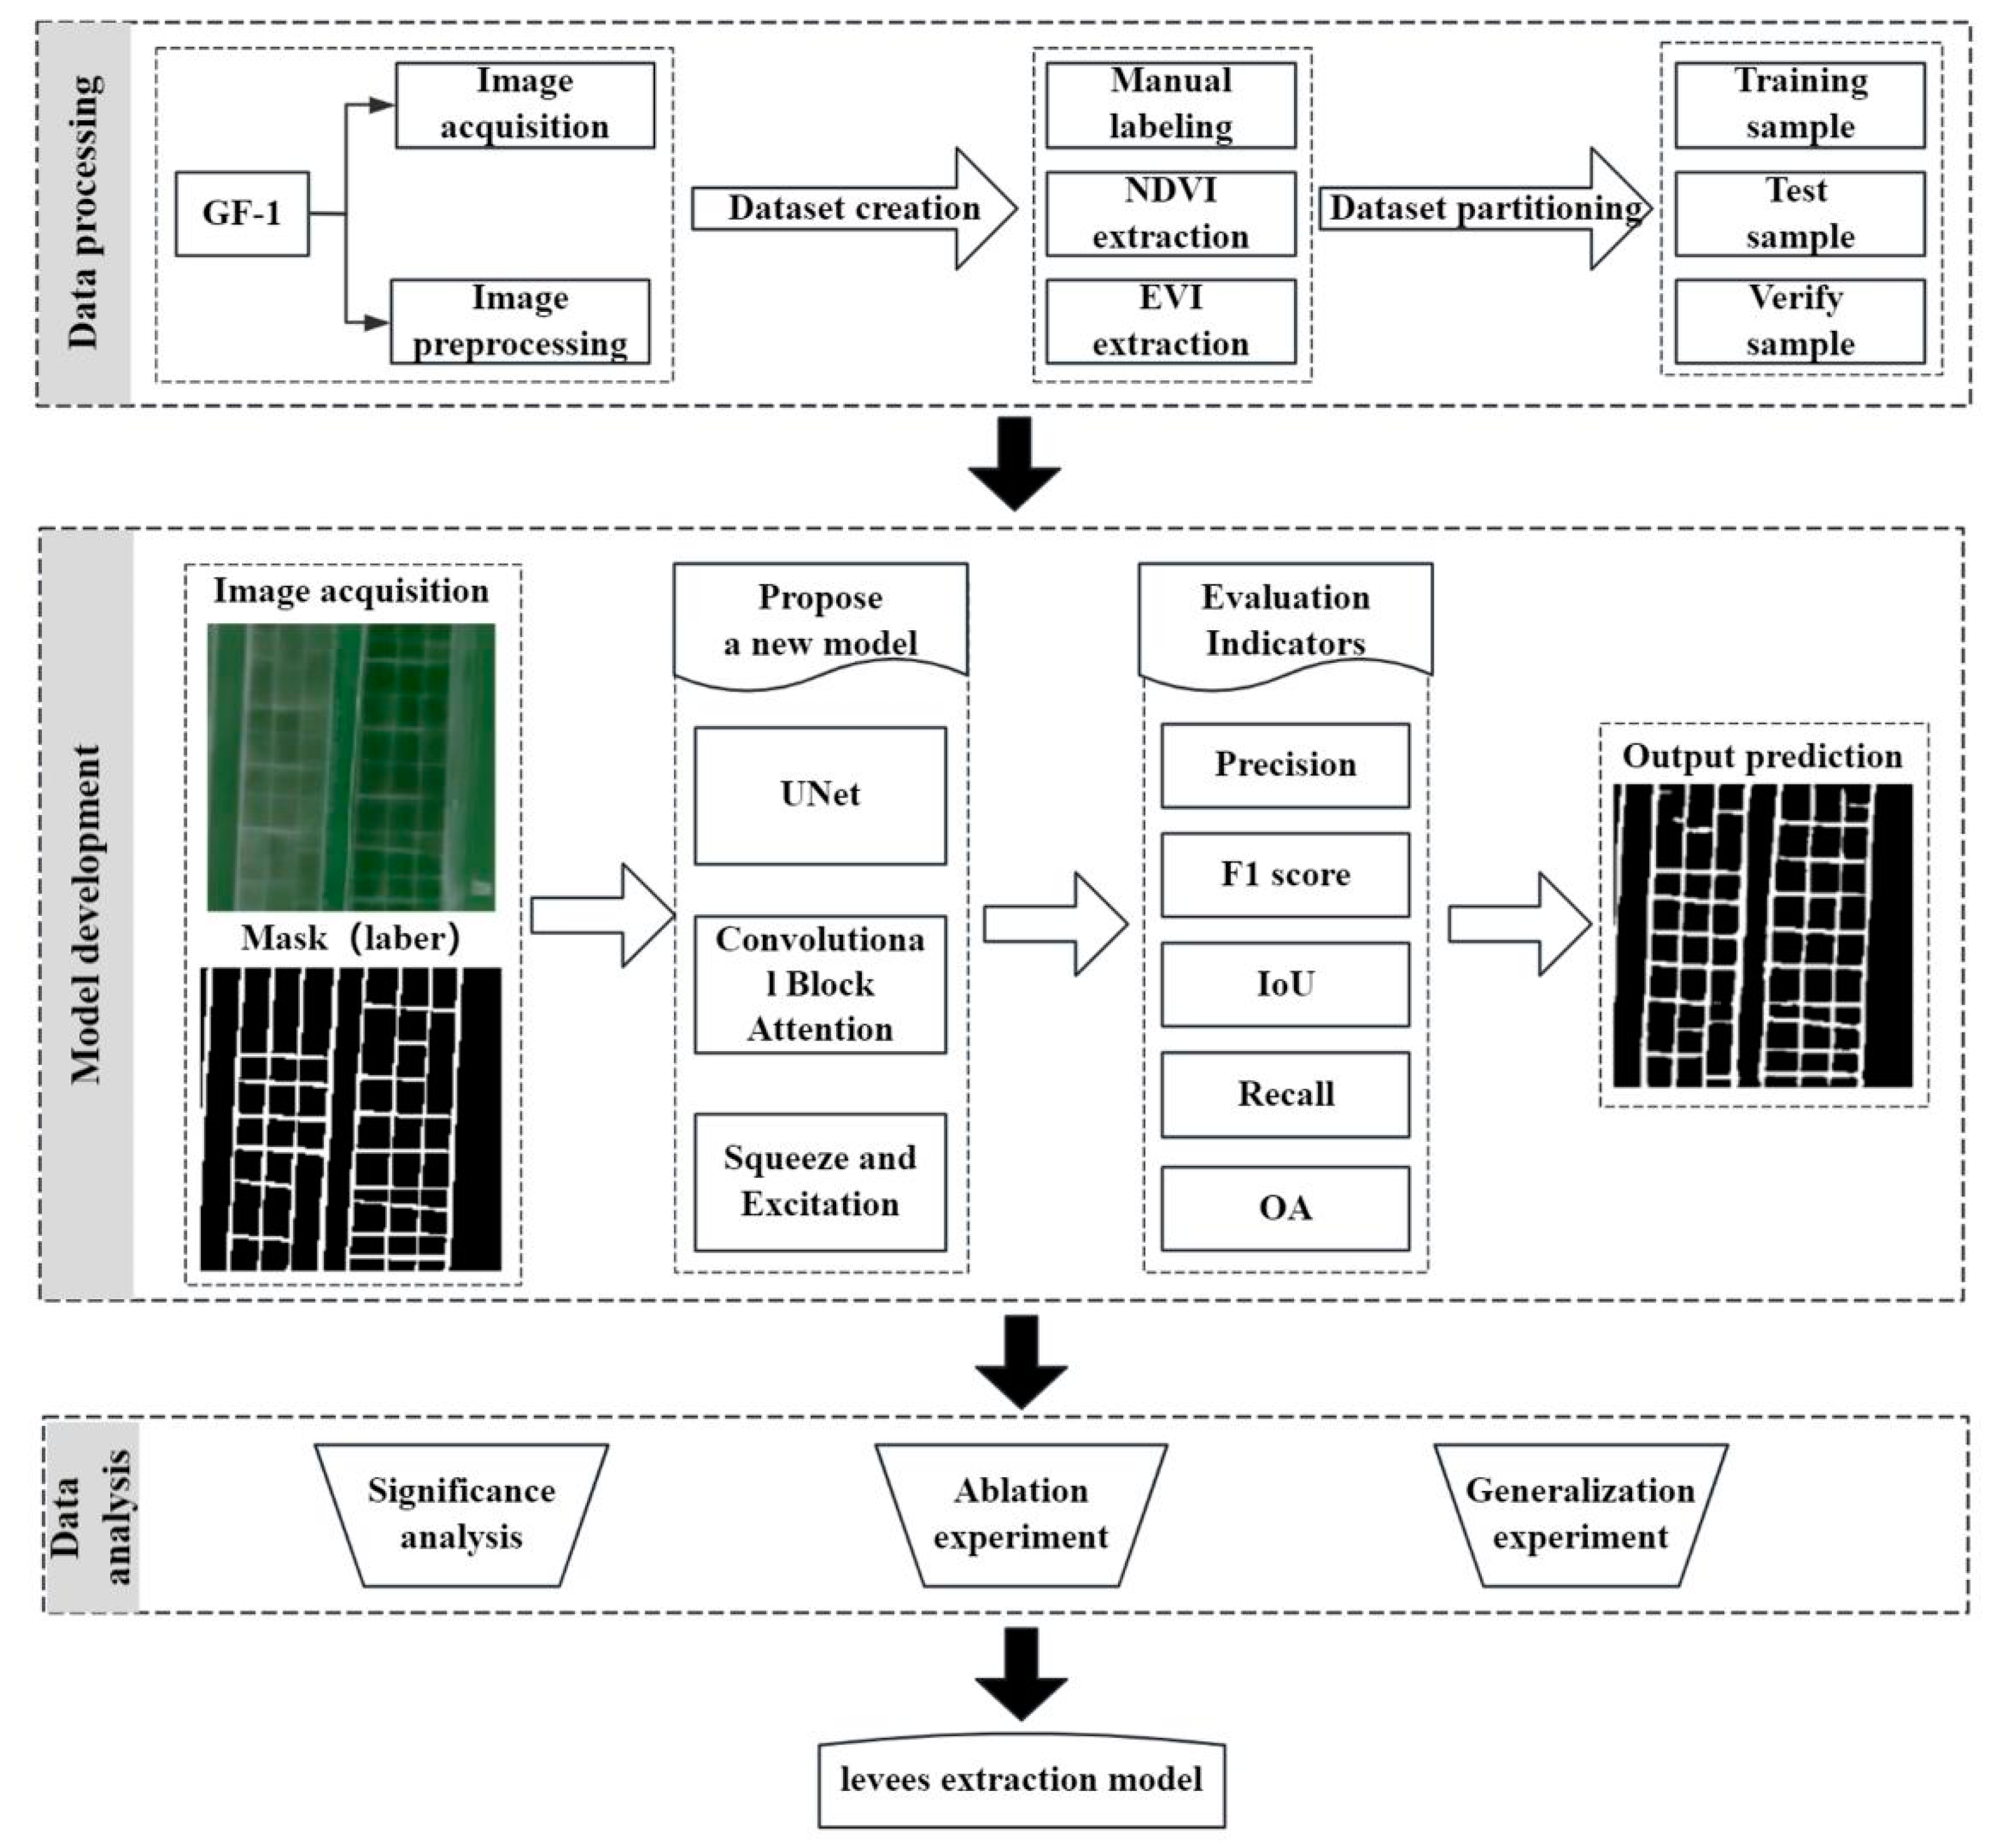
2.5. Technological Processes

This research is divided into three parts, as shown in Figure 8, and is illustrated as follows:
(1)
Data Collection and Preprocessing: High-resolution remote sensing images from the Gaofen-1 satellite were collected. The acquired data were preprocessed to create a labeled dataset using three methods: manual labeling, NDVI extraction, and EVI extraction.
(2)
Model Construction: A model optimized for levee extraction was constructed by integrating the SE and CBAM dual-attention mechanisms into the UNet model, based on remote sensing data, to enhance model performance.
(3)
Accuracy Assessment and Result Analysis: Significance analysis of the extraction results is a crucial method for evaluating the reliability and effectiveness of the experimental outcomes. Ablation experiments are a key component in verifying model effectiveness. Generalization experiments can validate the model’s performance on data outside the training distribution.
Figure 8. Workflow of the study.
Remotesensing 17 01871 g008

3. Results

3.1. Experimental Environment and Parameter Settings

3.1.1. Experimental Settings

This experiment was completed in the PyCharm 2024 development environment [44], the programming language is Python 3.6 [45], the hardware platform used for the experiment is a server equipped with an Intel(R) Xeon(R) Silver 4210R CPU (2.40 GHz), an NVIDIA RTX A6000 graphics card, from Intel Corporation and NVIDIA Corporation in Santa Clara, CA, USA, and 128 GB of RAM, and the operating systems are Windows 10. In the training process of the model, the configuration of hyperparameters is crucial. The key network hyperparameters include the number of iterations (epoch), batch size, input image size, early stopping strategy, activation function, optimizer type, learning rate initialization, and decay strategy [46]. To ensure that the experiments are carried out under the same conditions, this paper adopts the hyperparameter configurations shown in Table 1.

3.1.2. Model Comparison

To evaluate the performance of the proposed semantic segmentation model on the agricultural levee dataset, seven different models were selected for comparative assessment: SCA-UNet, UNet [47], UNet++, DeepLabV3+ [48], SegNet [49], ResNet, and EfficientViT-SAM [50].

3.1.3. Evaluation Criteria

It is essential to measure the robustness of the model and the precision of the ridge extraction. Five main metrics, namely, Intersection over Union (IoU), recall, precision, F1 score, and overall accuracy (OA), were selected in this study for the performance evaluation of the model.
Precision is the ratio of the number of correctly predicted change pixels to the number of all predicted change pixels [51], and it is calculated as shown in Equation (9).
Precision = TP TP + FP
The F1 score is an overall assessment of the segmentation results, combining precision and recall for calculation [29], as shown in Equation (10).
F 1   score   =   2   ×   Precision   ×   Recall Precision + Recall
Intersection over Union (IoU) is the ratio of the intersection area to the concatenation area between the predicted and true labels in the data to be classified, where TP is the number of pixels correctly predicted to be true, FP is the number of false positive pixels, and FN is the number of false negative pixels [52]. The calculation formula is shown in Equation (11).
IoU = TP TP + FN + FP
Recall is the ratio of the number of correctly predicted change pixels to the number of labeled change pixels [53], and it is calculated as shown in Equation (12).
Recall = TP TP + FN
OA denotes the ratio of correct pixels predicted as ridges and backgrounds to all pixels [54], and the calculation formula is shown in Equation (13).
OA = TP + TN TP + FN + FP + TN
The value ranges of the five evaluation metrics are all between 0 and 1. A higher calculated result indicates a greater overlap between the predicted results and the true labels, indicating a higher segmentation quality.

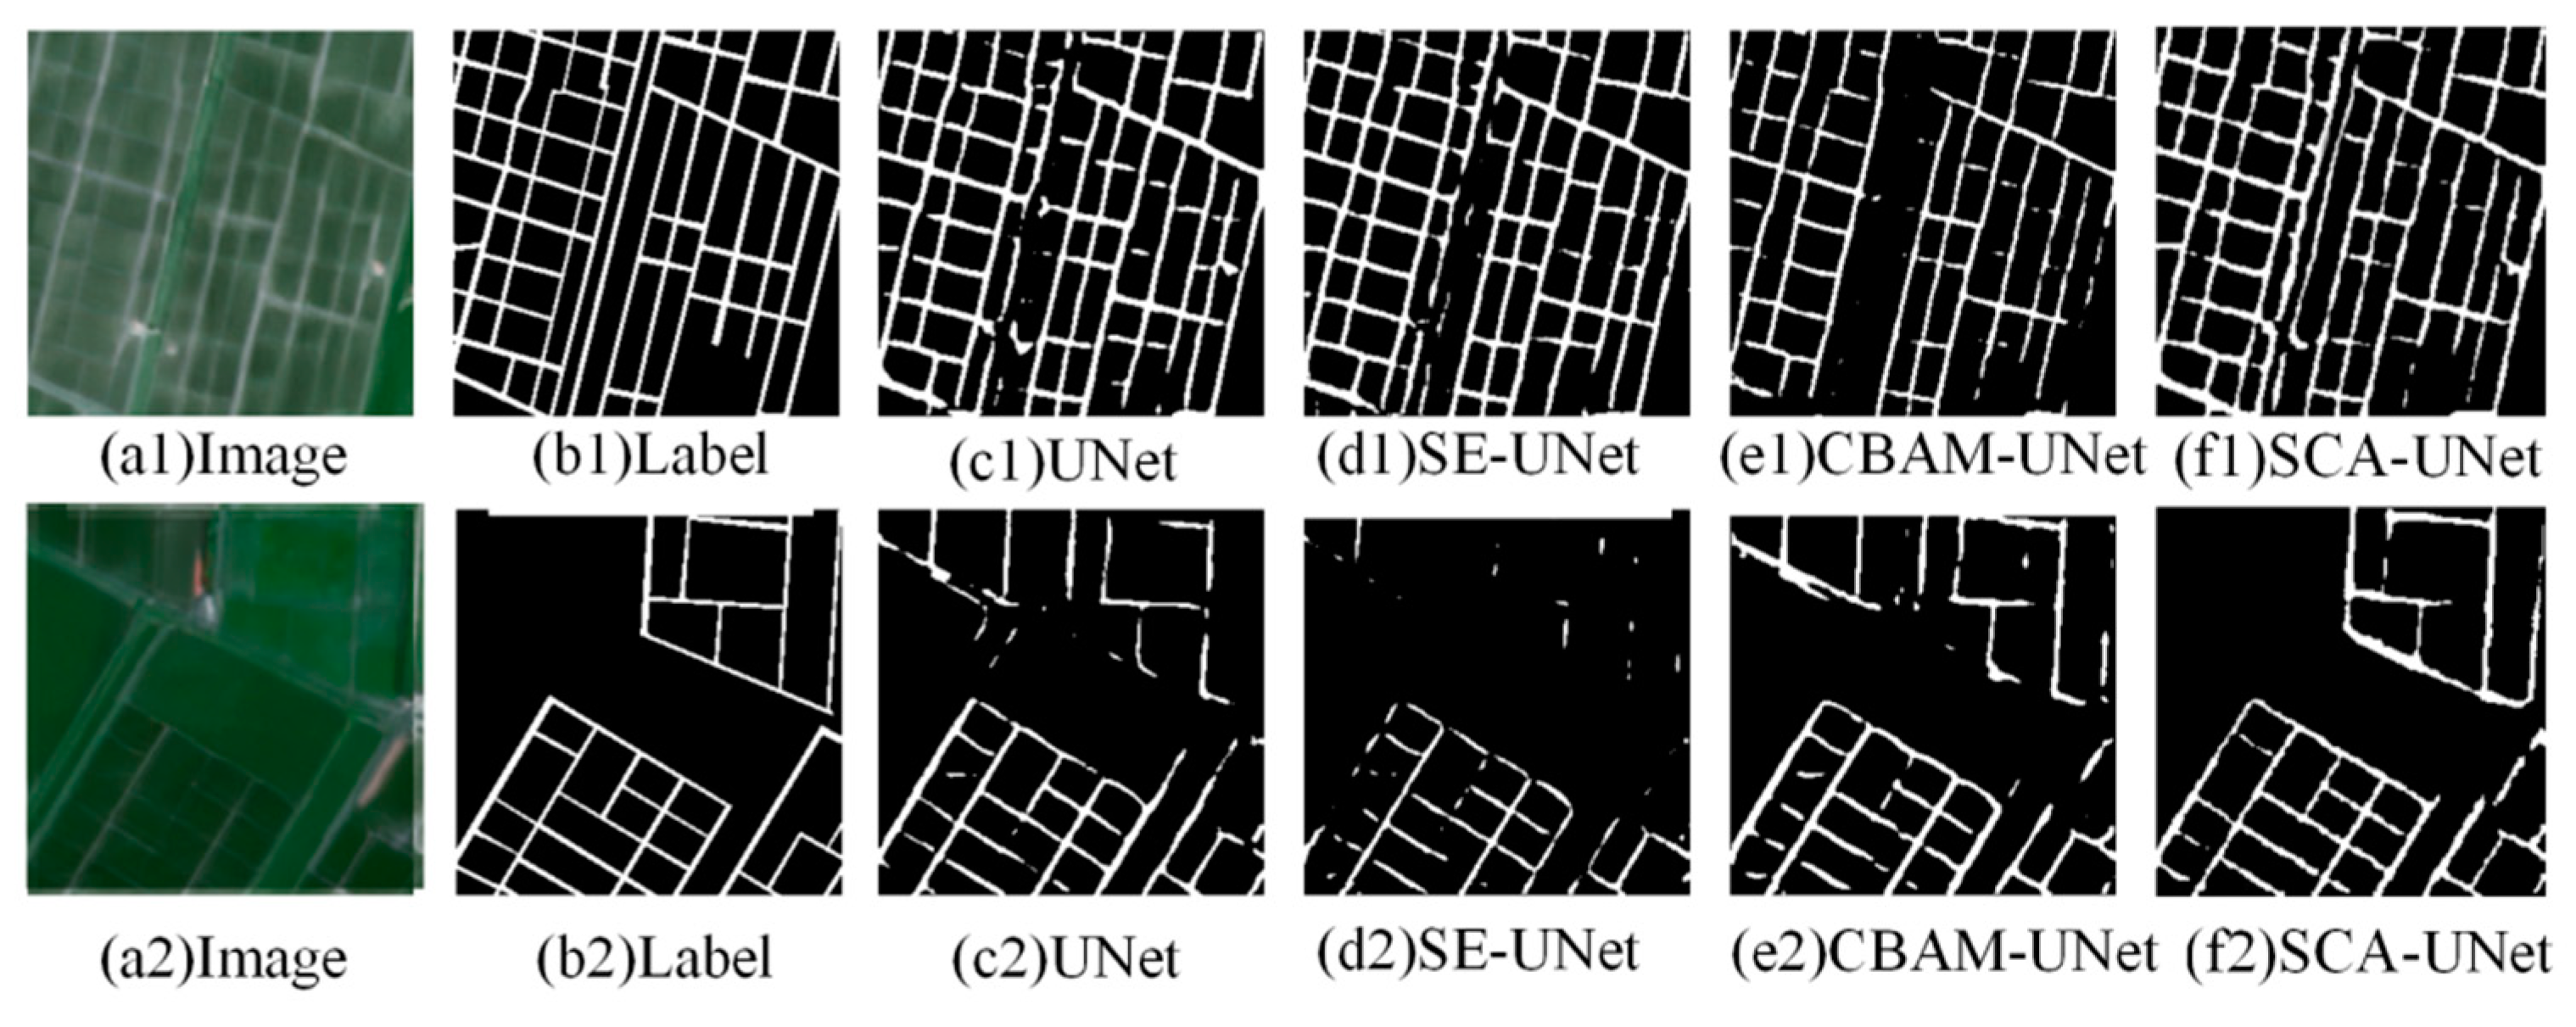
3.2. Comparison Experiment

In this experiment, we introduced the Dice coefficient loss function to further optimize the performance of the SCA-UNet model. The Dice coefficient is a commonly used evaluation metric in image segmentation tasks, measuring the similarity between two samples, especially in binary classification problems. Incorporating the Dice coefficient loss function helps the model better learn the boundaries of the target regions, thereby improving segmentation accuracy. The formula for the Dice loss function is shown in Equation (14).
L Dice = 1     2   × p i · y i P i 2 + y i 2
Pi represents the model’s predicted segmentation results, and yi represents the true segmentation results. The Dice loss function helps to improve the model’s ability to identify target regions. To test the algorithm’s effectiveness while considering the performance of the experimental equipment, the batch size was set to 14 for each experiment. If memory permits, the batch size can be increased to accelerate the training process. The initial learning rate was set to 0.00001 and adjusted based on the loss changes during training. If the model converges too quickly during the early stages of training, the learning rate is increased. If training is unstable, the learning rate is decreased. The number of epochs was set to 100 and adjusted based on the model’s performance on the validation set. Early stopping was set to 20 epochs; if the validation loss does not significantly decrease over 20 epochs, training is halted early to prevent overfitting. The ReLU activation function was used, which can accelerate the training process.
During the training process, the accuracy and loss of the training set, as well as the accuracy and loss of the validation set, were recorded every epoch. As shown in Figure 9a,b, both the validation and training losses start at high values but quickly decrease, which is a positive sign that indicates that the model is effectively learning from the data. The losses stabilize around the 20th epoch, suggesting that the model is converging. The validation loss also decreases and stabilizes. When the epoch approaches 90, the model curve becomes relatively flat, indicating that the model has reached a stable state and is very close to the training loss, demonstrating ideal generalization capability.
To verify the superiority of the proposed model, this study conducted experiments using UNet, UNet++, DeepLabV3+, SegNet, ResNet, and EfficientViT-SAM on the same dataset and compared and analyzed the results. The experimental results are shown in Figure 10, where Figure 10a–i display the images, labels, and extraction results from various models. As shown in Figure 10c–i, when the levee structures are relatively simple, DeepLabV3+, UNet, and UNet++ all demonstrate good extraction performance. However, SegNet and ResNet show slightly inferior performance at the connections, with unsatisfactory edge detail handling and levee continuity, resulting in broken levees and loss of edge details. When the levee situation becomes more complex, SegNet shows a marked improvement in discontinuity, but the extraction performance of SegNet, ResNet, and DeepLabV3+ is slightly worse than that of UNet, with some discontinuities and poor completeness in the levee extraction results. UNet++ and EfficientViT-SAM achieve better extraction performance than DeepLabV3+ and UNet, with significant improvement in discontinuity and better overall extraction results.
The method proposed in this study shows a noticeable improvement in overall extraction accuracy compared with EfficientViT-SAM, with more precise edge detail information in the extraction results. This is mainly attributed to the SE and CBAM modules introduced in this study, which optimize key information from both the channel and spatial dimensions, enhancing the quality of feature fusion in the skip connections. This leads to better screening of the levee feature information and the accurate identification of levee features, resulting in more complete extraction results. These findings demonstrate the effectiveness and superiority of the proposed method, which can be applied to levee extraction tasks in high-resolution remote sensing images.
Table 2 presents the quantitative evaluation results of different models on the dataset. In terms of overall accuracy (OA), the UNet++ network and the EfficientViT-SAM network achieved OA values of 88.35% and 89.68%, respectively, while the SegNet network underperformed in comparison to the DeepLabV3 network (OA = 87.89%). In contrast, the proposed method reached an OA of 92.12%, representing a 4% and 3.77% improvement over UNet and UNet++, respectively, and significantly outperforming the benchmark models. Regarding classification performance, the DeepLabV3+ network (93.02%) outperformed the EfficientViT-SAM (92.35%) network, the ResNet (89.56%) network, and the UNet++ network. The proposed method achieved a 3.02% improvement over UNet++ and a 1.23% improvement over DeepLabV3+. In terms of segmentation performance, both the UNet and SegNet networks had IoU values below 87% (86.65% and 86.45%, respectively), while the proposed method achieved an IoU of 89.36%, which represents a 2% improvement over UNet++. Regarding precision, the EfficientViT-SAM method achieved the highest precision among the models, at 98.23%. Additionally, UNet++ demonstrated higher recall than the DeepLabV3+ (90.67%) and SegNet (89.09%) networks. The proposed method further increased recall to 92.67%, which is a 2.53% improvement over the UNet network.
These quantitative results indicate that the introduction of dual-channel and spatial co-attention mechanisms effectively enhances the model’s ability to discriminate levee features. Channel attention optimizes the weight distribution of multi-scale features, while spatial attention accurately locates the boundary details of levees. The combined effect of these mechanisms allows the model to maintain high precision while significantly improving recall and IoU values, demonstrating the algorithm’s robustness in complex farmland scenarios.

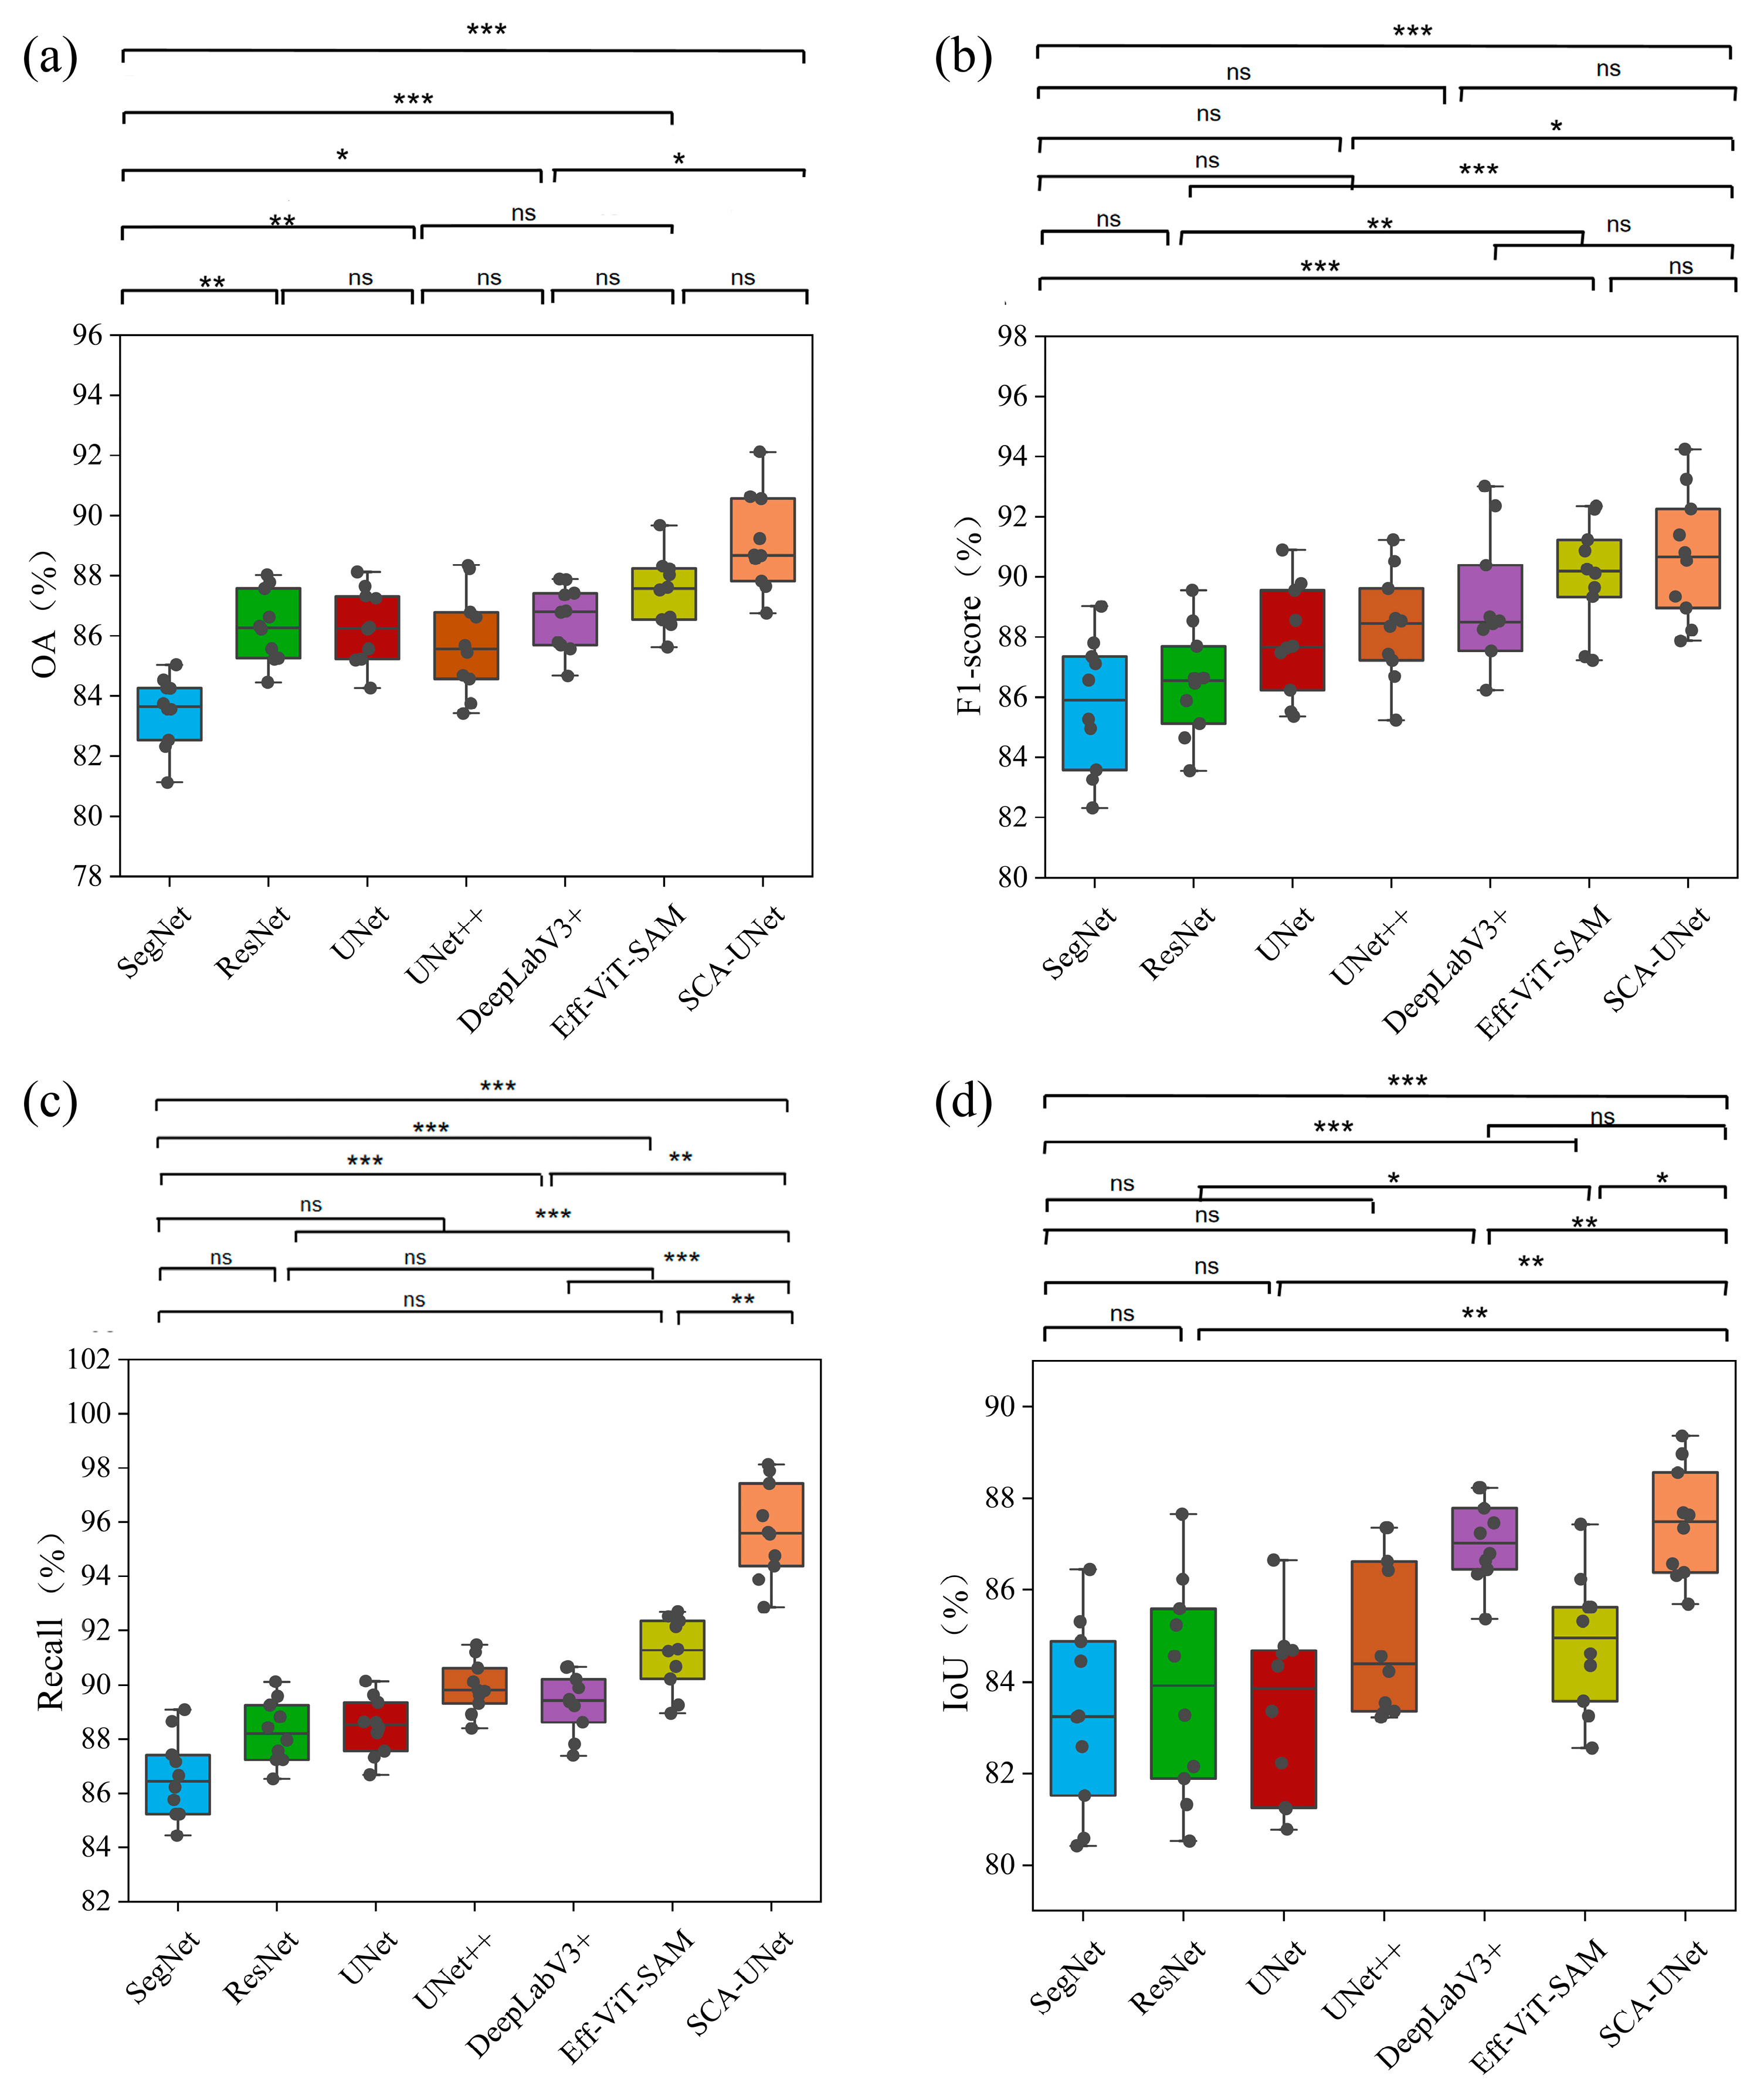
3.3. Significance Analysis of Experimental Results

To further analyze the statistical significance of the results, we employed the Friedman test to determine whether there are significant differences among multiple related samples. When the epoch was set to 100, each model was subjected to 10 rounds of experiments for the statistical analysis of the results. As shown in Figure 11, we evaluated four metrics: overall accuracy (OA), F1-score, recall, and IoU. Significant differences were found among the models (p < 0.05). Subsequently, t-tests were conducted between SCA-UNet and the other models to analyze whether the differences in means between the two samples and their respective populations were significant. A p-value less than 0.05 indicates a significant difference between the populations.
The dataset was randomly split six times to form six distinct datasets for training and testing each model. Initially, the Shapiro–Wilk test was performed on each set of test results to assess normality. As shown in Table 3, all p-values were greater than 0.05, indicating that the normality assumption could be accepted. This confirms that the data follow a normal distribution, allowing for the t-tests to be conducted. Table 4 presents the t-test results for the Dice coefficient and the accuracy of SCA-UNet compared with other models.
As shown in Figure 11c, the statistical analyses reveal that there are significant differences between the SCA-UNet model and other models, albeit to varying extents. Compared with SegNet, SCA-UNet exhibits substantial superiority (p < 0.01). In Figure 11d, SCA-UNet demonstrates a smaller but still significant advantage over UNet (p < 0.05) and DeepLabV3+ (p < 0.05). However, DeepLabV3+ and EfficientViT-SAM also show competitiveness in terms of overall accuracy (OA) and F1 score, with no statistically significant differences between them in these two metrics. Compared with ResNet, SCA-UNet shows significant differences in Figure 11b,c (p < 0.01). In terms of recall, model analysis indicates a statistically significant difference between SCA-UNet and DeepLabV3+.

3.4. Ablation Experiment

Ablation studies are a common experimental approach in the field of deep learning, with the core idea of using the control variable method to incrementally add certain components, features, or modules to a model and observe the changes in model performance. In research, ablation studies are a crucial component in demonstrating model effectiveness [55]. To verify the effectiveness and necessity of each module in the SCA-UNet model, ablation experiments were conducted. By comparing the performance of the model before and after improvements, the aim was to demonstrate the impact of the dual-channel attention mechanism on the accuracy of levee extraction. Figure 12(a1–f1) show the remote sensing images, labels, and extraction results from UNet, SE-UNet, CBAM-UNet, and SCA-UNet, respectively. As seen in Figure 12(d2), the extraction results from SE-UNet exhibit discontinuities and loss of edge details. While CBAM-UNet shows marked improvement in discontinuity, the issue of edge detail loss persists. By integrating the CBAM and SE modules, the method further enhances recognition capabilities, significantly improving discontinuity and markedly enhancing the completeness of edge details. These findings underscore the effectiveness and necessity of the proposed method.
Table 5 presents the results of the test set for each model. When the CBAM and SE modules are incorporated, the model’s capability for global feature extraction is enhanced. Compared to the UNet network, the model shows improvements in OA, F1 score, IoU, precision, and recall by 4%, 3.35%, 2.71%, 3.49%, and 2.53%, respectively. The OA and F1 score values reach 92.12% and 94.25%, respectively. These metrics indicate that compared to the single-channel attention mechanism (SE), the dual-attention mechanism, with CBAM’s spatial attention reinforcing local feature focus, enables the proposed model to perform better in various recognition tasks. As shown in Figure 13, the OA value of our model is higher than that of other models in the ablation experiments, confirming the effectiveness of combining CBAM and SE attention mechanisms with UNet.
To analyze the generalization capability and overfitting risk of the SCA-UNet model, we conducted a 10-fold cross-validation analysis [56]. The results of the analysis are presented in Table 6, showing the mean values and standard deviations for each validation set. Notably, the SCA-UNet model demonstrated low standard deviations in its performance metrics across the 10 validation trials, with a standard deviation of 1.47% for overall accuracy (OA) and 1.61% for intersection over union (IoU). These results experimentally confirm that the SCA-UNet model possesses good generalization ability.

3.5. Generalization Experiment

Generalization experiments are used in deep learning to evaluate a model’s adaptability and predictive accuracy on unseen data. The core objective is to verify the model’s performance on data outside the training distribution [57]. Overfitting occurs when a model excessively adapts to the training data, resulting in poor generalization ability. One of the purposes of generalization experiments is to detect whether the model has overfitting issues.
As shown in Figure 12, SCA-UNet is capable of effectively distinguishing between levee and farmland regions when confronted with diverse levee shapes, with the segmentation results closely matching the true labels visually. To further verify the model’s adaptability to unseen scenarios, this study randomly selected four remote sensing images from the vicinity of Youyi Farm that were not involved in training. SCA-UNet was directly applied for end-to-end segmentation, and the segmentation results were visually inspected to assess the model’s performance on unseen domain samples. The segmentation contours of the levees were complete, as illustrated in Figure 14. The segmentation results indicate that SCA-UNet can effectively delineate levee regions, even in terrain images that are different from the training set, demonstrating the model’s generalization ability.

4. Discussion

4.1. Analysis of Method Performance Advantages and Disadvantages

During the cultivation and management of rice, the precision of field partitioning is significantly influenced by the characteristics of levee boundaries. The partitioning effect of levees can lead to considerable heterogeneity within the same “block” (e.g., differences in soil moisture and fertility distribution). Therefore, the accurate extraction of levee boundaries is a necessary prerequisite for achieving management zoning. To minimize the impact of levees on partitioning results, this study employs high-resolution remote sensing imagery and constructs a levee extraction model based on semantic segmentation technology. Throughout the process of optimizing the quality of labeled data, we constructed the dataset using multimodal methods, including manual labeling and index-based levee extraction.
The traditional UNet model has limitations in the extraction of fine levee features, such as edge blurring and sensitivity to noise. To address these issues, this study optimizes the UNet model by introducing Convolutional Block Attention Module (CBAM) and Squeeze-and-Excitation (SE) modules in the encoder and decoder stages. These additions enhance the model’s focus on levee shapes through the synergy of channel and spatial attention. During model optimization, significance analysis is a crucial step in verifying the effectiveness of the improvements [58]. By comparing model differences and conducting statistical significance tests (such as t-tests and Shapiro–Wilk tests), we can ensure that the performance improvements are not due to random factors. This further guarantees the effectiveness and feasibility of the proposed method and constructed model in the field of levee extraction.
The core metrics for assessing model complexity include the number of parameters and floating-point operations (FLOPs). The number of parameters refers to the total count of learnable parameters in the model, directly affecting storage requirements and memory usage. FLOPs, on the other hand, indicate the number of floating-point operations required for a single forward pass, serving as a crucial measure of computational efficiency [59]. A lower FLOP value typically signifies that a model is more suitable for real-time processing scenarios. The complexity metrics of our proposed model are shown in Table 7. Compared with EfficientViT-SAM and UNet++, our model demonstrates a significant advantage in terms of the number of parameters, with a total of 31.3 × 10⁶ parameters. This is notably lower than UNet and UNet++, indicating a more compact structure with reduced redundant parameters. Additionally, the computational requirement is 67.1 × 10⁹ FLOPs, which is significantly lower than UNet++ and slightly higher than UNet, suggesting superior computational efficiency over UNet++ and comparable performance to UNet. Although SegNet, ResNet, and DeepLabV3+ have lower computational requirements than our SCA-UNet model, the precision of our model is significantly higher than that of these comparison models. This indicates that by moderately increasing complexity, our method achieves a notable improvement in precision. This balance between complexity and performance enables SCA-UNet to efficiently utilize computational resources while achieving higher precision, making it particularly suitable for applications such as levee extraction, where high precision is required.

4.2. Connections with Existing Research

The performance results of the model proposed in this study outperform those of Alsabhan W et al. [60], who used UNet-ResNet50 for automatic building extraction from satellite images, achieving an IoU accuracy of 82.2% and an F1 score of 90%. Our results are also consistent with previous studies, demonstrating that the UNet model can be successfully applied to the segmentation of diverse data types.
The DeepLabV3+ model also shows promising results. Its structure allows it to interpret objects of varying shapes and sizes, which is beneficial when dealing with levees of different morphologies. However, the lack of direct gaps between layers may lead to some loss of spatial details. Hui Chen et al. [61] improved the DeepLabV3+ model, proposing a lightweight semantic segmentation method for remote sensing images to identify residential houses. The MIoU increased by 2.17%, 1.35%, and 3.42% compared to DeepLabV3+, UNet, and PSP-Net, respectively.
Ryhede Bengtsson B. et al. [62] introduced a lightweight and efficient SAM medical image segmentation model based on EfficientViT-SAM. This model significantly reduced the model complexity while maintaining segmentation performance. In this study, our model’s extraction results are superior to those of EfficientViT-SAM. Lightweight models, which typically reduce the number of layers and channels, may not provide a rich enough feature hierarchy. ViT relies on large-scale datasets and thus may suffer from overfitting or insufficient generalization on small remote sensing datasets, leading to decreased accuracy. In contrast, the model proposed in this study achieves a significant improvement in levee extraction accuracy, demonstrating the importance of optimizing model structure and data adaptation strategies based on task characteristics.

4.3. Limitations and Future Prospects

Current research primarily focuses on utilizing remote sensing imagery and deep learning techniques to extract roads, buildings, and arable land plots in urban areas, while the application of deep learning for levee extraction in paddy fields remains relatively underexplored. Therefore, this study aims to investigate methods for extracting artificially constructed levees in paddy fields based on remote sensing imagery, which holds significant importance for achieving precise agricultural management zoning [63]. However, the limitations of the proposed method lie in the inability of low-resolution remote sensing imagery to adequately capture fine levee structures, leading to blurred levee boundaries and consequently affecting extraction accuracy. This restricts the application of the model in scenarios in which data acquisition is limited. Additionally, the timing of remote sensing imagery acquisition significantly impacts levee extraction, necessitating the selection of periods when levees are not obscured to ensure accurate feature representation. To enhance extraction accuracy, context-aware mechanisms can be introduced, and texture feature analysis can be combined to analyze surrounding land information, thereby aiding in the precise extraction of levee boundaries.
A significant direction for future research is the integration of remote sensing imagery data with other types of data, such as elevation data, to obtain richer levee information. By leveraging the strengths of different data sources, the limitations of single-source remote sensing imagery can be mitigated. Moreover, by collecting and analyzing imagery data from different seasons and time points, a time-series model of levee changes can be constructed. This model will be applied in smart agricultural management apps, where levee recognition eliminates the impact of levees on precise management zoning results, facilitating subsequent precise fertilization and irrigation within the plots. It also enhances the accuracy of crop yield estimation within the plots. Precise management zoning involves dividing farmland into regions with similar soil characteristics, topography, or other conditions affecting crop growth, as well as providing differentiated fertilization plans for crops within each region and implementing precision fertilization techniques. Through this precise zoning and fertilization, the overuse of fertilizers can be effectively avoided, thereby reducing resource waste and cost inputs, improving crop yield and quality, and contributing to environmental protection. This approach promotes the development of modern agriculture toward intelligent and green practices.

5. Conclusions

To eliminate the impact of levees on the accuracy of rice field partitioning and address the challenge of precisely extracting levees from remote sensing imagery, we innovatively proposed the integration of the Convolutional Block Attention Module (CBAM), Squeeze-and-Excitation Networks, and the UNet model to construct the SCA-UNet model. This model optimizes features through a dual-stage attention mechanism. On the channel dimension, Squeeze-and-Excitation Networks calculate channel weight coefficients to dynamically adjust the response intensity of feature channels. On the spatial dimension, the spatial attention submodule of CBAM generates a spatial weight matrix to enhance the activation response of levee feature regions, highlighting important areas while suppressing irrelevant background information.
Our constructed model significantly enhances the model’s feature extraction capabilities in complex backgrounds, particularly demonstrating stronger robustness in the recognition of small targets and detailed features. In terms of dataset construction, this study adopted a multimodal approach, combining index-based automatic labeling with manual fine labeling to create a high-quality dataset comprising 9672 samples. This dataset encompasses levees of various shapes and can precisely represent their spatial distribution characteristics.
In the experimental phase, we fine-tuned the network model’s hyperparameters, designed multidimensional experiments based on the current experimental environment, and performed various comparative analyses to comprehensively evaluate the model’s performance under different configurations. Experimental studies have led to the following results: (1) Our model performs excellently in the task of levee extraction. Compared with UNet, SegNet, ResNet, UNet++, DeepLabV3+, and EfficientViT-SAM models, our algorithm achieves higher extraction accuracy, ensuring the continuity of levee identification and edge details. (2) In the trade-off between model complexity and performance, significance analysis can quantify whether computational resources contribute statistically significant performance improvements. Through significance tests (e.g., p-value < 0.05), it can be proven that the accuracy improvement of SCA-UNet is statistically significant and not a random occurrence. (3) Ablation experiments have verified the effectiveness of the dual-attention mechanism. By comparing different attention mechanism modules, such as standard UNet, SE-UNet, and CBAM-UNet, the introduction of CBAM and SE modules separately increased the F1 score by 2% and 1.98%, respectively, while their combined effect resulted in a 3.35% performance gain. The necessity of introducing CBAM and SE modules was validated by using 10-fold cross-validation, thereby confirming the effectiveness of the proposed model.
This study indicates that the proposed model shows significant advantages in maintaining the topological integrity and edge clarity of levees, with broad application potential. However, it is worth noting that despite the model’s breakthrough in levee extraction, as the resolution of remote sensing imagery increases and the volume of data grows, the model’s computation time also shows an upward trend. Therefore, future research will focus on constructing a multi-temporal levee evolution dataset and developing a dynamic monitoring model based on time-series analysis. Additionally, transfer learning strategies will be explored to enhance the model’s generalization ability across different agricultural landscape regions. These research achievements provide solid technical support for the further development of high-resolution remote sensing imagery in precision agriculture applications.

Author Contributions

Conceptualization, H.A.; methodology, H.A., Y.H. and X.Z. (Xiaomeng Zhu); software, X.Z. (Xiaomeng Zhu) and C.Q.; validation, H.A., X.Z. (Xiaomeng Zhu) and S.M.; formal analysis, X.Z. (Xinle Zhang) and Y.W.; data curation, Y.M. and X.Z. (Xiaomeng Zhu); writing—original draft preparation, X.Z. (Xiaomeng Zhu) and H.A.; writing—review and editing, H.A. and S.M.; project administration, X.Z. (Xinle Zhang), X.H., and Y.Y. All authors have read and agreed to the published version of the manuscript.

Funding

This research was supported by the Strategic Priority Research Program of the Chinese Academy of Sciences (Grant No. XDA28100000), the National KeyR&D Program of China (2024YFD1501100), the National KeyR&D Program Sub-themes of China (2024YFD150110504), the National KeyR&D Program of China (2021YFD1500100), the Science and Technology Development Plan Project of Jilin Province, China (20240101043JC), and the Jilin Agricultural University Introduction of Talents Project (No.202020010).

Data Availability Statement

Some of the datasets for this article can be obtained at https://pan.baidu.com/s/1HA9vkOk8A3nKndzCCg-W8g?pwd=hx4p (accessed on 24 March 2025).

Acknowledgments

We thank the National Earth System Science Data Center for providing geographic information data.

Conflicts of Interest

The authors declare no conflicts of interest.

References

  1. Hu, X.; Xu, Y.; Huang, P.; Yuan, D.; Song, C.; Wang, Y.; Cui, Y.; Luo, Y. Identifying Changes and Their Drivers in Paddy Fields of Northeast China: Past and Future. Agriculture 2024, 14, 1956. [Google Scholar] [CrossRef]
  2. Somashekar, K.S.; Moinuddin; Belagalla, N.; Srinatha, T.N.; Abhishek, G.J.; Kumar, V.; Tiwari, A. Revolutionizing Agriculture: Innovative Techniques, Applications, and Future Prospects in Precision Farming. J. Sci. Res. Rep. 2024, 30, 405–419. [Google Scholar]
  3. Wang, S.G.; Wu, S.K.; Wang, X.S.; Li, Z.L. A Canny operator road edge detection method based on color features. J. Phys. Conf. Ser. 2020, 1629, 012018. [Google Scholar] [CrossRef]
  4. Rana, D.; Dalai, S. Review on traditional methods of edge detection to morphological based techniques. Int. J. Comput. Sci. Inf. Technol. 2014, 5, 5915–5920. [Google Scholar]
  5. Shi, G.; Suo, J. Remote sensing image edge-detection based on improved Canny operator. In Proceedings of the 2016 8th IEEE International Conference on Communication Software and Networks (ICCSN), Beijing, China, 4–6 June 2016; pp. 652–656. [Google Scholar]
  6. Xu, L.; Ming, D.; Du, T.; Chen, Y.; Dong, D.; Zhou, C. Delineation of cultivated land parcels based on deep convolutional networks and geographical thematic scene division of remotely sensed images. Comput. Electron. Agric. 2022, 192, 106611. [Google Scholar] [CrossRef]
  7. Chen, K.; Liu, C.; Chen, H.; Zhang, H.; Li, W.; Zou, Z.; Shi, Z. RSPrompter: Learning to Prompt for Remote Sensing Instance Segmentation Based on Visual Foundation Model. IEEE Trans. Geosci. Remote Sens. 2024, 62, 4701117. [Google Scholar] [CrossRef]
  8. Yan, Z.; Li, J.; Li, X.; Zhou, R.; Zhang, W.; Feng, Y.; Diao, W.; Fu, K.; Sun, X. RingMO-SAM: A foundation model for segment anything in multimodal remote-sensing images. IEEE Trans. Geosci. Remote Sens. 2023, 61, 5625716. [Google Scholar] [CrossRef]
  9. Li, X.; Su, J.; Yue, Z.; Duan, F. Adaptive Multi-ROI Agricultural Robot Navigation Line Extraction Based on Image Semantic Segmentation. Sensors 2022, 22, 7707. [Google Scholar] [CrossRef]
  10. Wang, Y.; Gu, L.; Jiang, T.; Gao, F. MDE-UNet: A multitask deformable UNet combined enhancement network for farmland boundary segmentation. IEEE Geosci. Remote Sens. Lett. 2023, 20, 3001305. [Google Scholar] [CrossRef]
  11. Kaur, S.; Madaan, S. A hybrid unet based approach for crop classification using sentinel-1b synthetic aperture radar images. Multimed. Tools Appl. 2025, 84, 4223–4252. [Google Scholar] [CrossRef]
  12. Meyarian, A.; Yuan, X.; Liang, L.; Wang, W.; Gu, L. Gradient convolutional neural network for classification of agricultural fields with contour levee. Remote Sens. 2021, 43, 75–94. [Google Scholar] [CrossRef]
  13. Dale, D.S.; Liang, L.; Zhong, L.; Reba, M.L.; Runkle, B.R. Deep learning solutions for mapping contour levee rice production systems from very high resolution imagery. Comput. Electron. Agric. 2023, 211, 107954. [Google Scholar] [CrossRef]
  14. Chaudhari, S.; Mithal, V.; Polatkan, G.; Ramanath, R. An attentive survey of attention models. ACM Trans. Intell. Syst. Technol. (TIST) 2021, 12, 53. [Google Scholar] [CrossRef]
  15. Woo, S.; Park, J.; Lee, J.-Y.; Kweon, I.S. Cbam: Convolutional block attention module. In Lecture Notes in Computer Science, Proceedings of the 15th European Conference on Computer Vision (ECCV 2018), Munich, Germany, 8–14 September 2018; Springer: Cham, Switzerland, 2018; pp. 3–19. [Google Scholar]
  16. Ge, Z.; Cao, G.; Shi, H.; Zhang, Y.; Li, X.; Fu, P. Compound multiscale weak dense network with hybrid attention for hyperspectral image classification. Remote Sens. 2021, 13, 3305. [Google Scholar] [CrossRef]
  17. Yang, X.; Li, X.; Ye, Y.; Lau, R.Y.K.; Zhang, X.; Huang, X. Road detection and centerline extraction via deep recurrent convolutional neural network U-Net. IEEE Trans. Geosci. Remote Sens. 2019, 57, 7209–7220. [Google Scholar] [CrossRef]
  18. Bai, X.; Guo, L.; Huo, H.; Zhang, J.; Zhang, Y.; Li, Z.L. Rse-net: Road-shape enhanced neural network for road extraction in high resolution remote sensing image. Int. J. Remote Sens. 2023, 45, 7339–7360. [Google Scholar] [CrossRef]
  19. Wang, J.; Lv, P.; Wang, H.; Shi, C. SAR-U-Net: Squeeze-and-excitation block and atrous spatial pyramid pooling based residual U-Net for automatic liver segmentation in computed tomography. Comput. Methods Programs Biomed. 2021, 208, 106268. [Google Scholar] [CrossRef]
  20. Tan, M.; Le, Q.V. EfficientNet: Rethinking model scaling for convolutional neural networks. In Proceedings of the 36th International Conference on Machine Learning, PMLR, Long Beach, CA, USA, 9–15 June 2019; pp. 6105–6114. [Google Scholar]
  21. Xu, Q.; Liang, H.; Wei, Z.; Zhang, Y.; Lu, X.; Li, F.; Wei, N.; Zhang, S.; Yuan, H.; Liu, S.; et al. Assessing climate change impacts on crop yields and exploring adaptation strategies in Northeast China. Earth’s Future 2024, 12, e2023EF004063. [Google Scholar] [CrossRef]
  22. Chen, H.; Meng, F.; Yu, Z.; Tan, Y. Spatial–temporal characteristics and influencing factors of farmland expansion in different agricultural regions of Heilongjiang Province, China. Land Use Policy 2022, 115, 106007. [Google Scholar] [CrossRef]
  23. Liu, Y.; Liu, X.; Liu, Z. Effects of climate change on paddy expansion and potential adaption strategies for sustainable agriculture development across Northeast China. Appl. Geogr. 2022, 141, 102667. [Google Scholar] [CrossRef]
  24. Zhang, K.; Zhang, F.; Yang, S. Fusion of multispectral and panchromatic images via spatial weighted neighbor embedding. Remote Sens. 2019, 11, 557. [Google Scholar] [CrossRef]
  25. Yin, Q.; Liu, M.; Cheng, J.; Ke, Y.; Chen, X. Mapping Paddy Rice Planting Area in Northeastern China Using Spatiotemporal Data Fusion and Phenology-Based Method. Remote Sens. 2019, 11, 1699. [Google Scholar] [CrossRef]
  26. Duan, J.; Wang, H.; Yang, Y.; Cheng, M.; Li, D. Rice Growth Parameter Estimation Based on Remote Satellite and Unmanned Aerial Vehicle Image Fusion. Agriculture 2025, 15, 1026. [Google Scholar] [CrossRef]
  27. Zhang, G.; Xiao, X.; Biradar, C.M.; Dong, J.; Qin, Y.; Menarguez, M.A.; Zhou, Y.; Zhang, Y.; Jin, C.; Wang, J.; et al. Spatiotemporal patterns of paddy rice croplands in China and India from 2000 to 2015. Sci. Total Environ. 2017, 579, 82–92. [Google Scholar] [CrossRef]
  28. Zhang, M.; Lin, H.; Wang, G.; Sun, H.; Fu, J. Mapping paddy rice using a convolutional neural network (CNN) with Landsat 8 datasets in the Dongting Lake Area, China. Remote Sens. 2018, 10, 1840. [Google Scholar] [CrossRef]
  29. de la Rosa, F.L.; Gómez-Sirvent, J.L.; Sánchez-Reolid, R.; Morales, R.; Fernández-Caballero, A. Geometric transformation-based data augmentation on defect classification of segmented images of semiconductor materials using a ResNet50 convolutional neural network. Expert Syst. Appl. 2022, 206, 117731. [Google Scholar] [CrossRef]
  30. Shao, G.; Wang, Y.; Han, W. Estimation method of leaf area index for summer maize using UAV-based multispectral remote sensing. Smart Agric. 2020, 2, 118–128. [Google Scholar]
  31. Hu, Q.; Ma, L.; Zhao, J. DeepGraph: A PyCharm tool for visualizing and understanding deep learning models. In Proceedings of the 2018 25th Asia-Pacific Software Engineering Conference (APSEC), Nara, Japan, 4–7 December 2018; pp. 628–632. [Google Scholar]
  32. Ronneberger, O.; Fischer, P.; Brox, T. U-Net: Convolutional networks for biomedical image segmentation. In Lecture Notes in Computer Science, Proceedings of the 18th International Conference on Medical Image Computing and Computer-Assisted Intervention—MICCAI 2015, Munich, Germany, 5–9 October 2015; Springer International Publishing: Cham, Switzerland, 2015; Volume 9351, pp. 234–241. [Google Scholar]
  33. Yan, C.; Fan, X.; Fan, J.; Wang, N. Improved U-Net remote sensing classification algorithm based on multi-feature fusion perception. Remote Sens. 2022, 14, 1118. [Google Scholar] [CrossRef]
  34. Wang, Y. AMSA-UNet: An Asymmetric Multiple Scales U-net Based on Self-attention for Deblurring. arXiv 2024, arXiv:2406.09015. [Google Scholar]
  35. Kim, D.; Kim, J.; Kim, J. Elastic exponential linear units for convolutional neural networks. Neurocomputing 2020, 406, 253–266. [Google Scholar] [CrossRef]
  36. He, J.; Li, L.; Xu, J.; Zheng, C. ReLU deep neural networks and linear finite elements. arXiv 2018, arXiv:1807.03973. [Google Scholar]
  37. Yin, M.; Chen, Z.; Zhang, C. A CNN-transformer network combining CBAM for change detection in high-resolution remote sensing images. Remote Sens. 2023, 15, 2406. [Google Scholar] [CrossRef]
  38. Rajendran, T.; Valsalan, P.; Amutharaj, J.; Jenifer, M.; Rinesh, S.; Charlyn, P.L.G. Hyperspectral image classification model using squeeze and excitation network with deep learning. Comput. Intell. Neurosci. 2022, 2022, 9430779. [Google Scholar]
  39. Gu, J.; Sun, X.; Zhang, Y.; Fu, K.; Wang, L. Deep residual squeeze and excitation network for remote sensing image super-resolution. Remote Sens. 2019, 11, 1817. [Google Scholar] [CrossRef]
  40. Fu, J.; Liu, J.; Tian, H.; Li, Y.; Bao, Y.; Fang, Z.; Lu, H. Dual attention network for scene segmentation. In Proceedings of the 2019 IEEE/CVF Conference on Computer Vision and Pattern Recognition (CVPR), Long Beach, CA, USA, 15–20 June 2019; pp. 3141–3149. [Google Scholar]
  41. Wang, W.; Tan, X.; Zhang, P.; Wang, X. A CBAM based multiscale transformer fusion approach for remote sensing image change detection. IEEE J. Sel. Top. Appl. Earth Obs. Remote Sens. 2022, 15, 6817–6825. [Google Scholar] [CrossRef]
  42. Alshawi, R.; Hoque, M.T.; Ferdaus, M.M.; Abdelguerfi, M.; Niles, K.; Prathak, K.; Tom, J.; Klein, J.; Mousa, M.; Lopez, J.J. Dual attention u-net with feature infusion: Pushing the boundaries of multiclass defect segmentation. arXiv 2023, arXiv:2312.14053. [Google Scholar]
  43. Amin, S.U.; Abbas, M.S.; Kim, B.; Jung, Y.; Seo, S. Enhanced anomaly detection in pandemic surveillance videos: An attention approach with EfficientNet-B0 and CBAM integration. IEEE Access 2024, 12, 162697–162712. [Google Scholar] [CrossRef]
  44. Van Horn, B.M., II.; Nguyen, Q. Hands-On Application Development with PyCharm: Build Applications Like a Pro with the Ultimate Python Development Tool; Packt Publishing Ltd.: Birmingham, UK, 2023. [Google Scholar]
  45. Hunt, J. Python Virtual Environments. In A Beginner’s Guide to Python 3 Programming; Springer International Publishing: Cham, Switzerland, 2023; pp. 469–486. [Google Scholar]
  46. Kingma, D.P.; Ba, J. Adam: A method for stochastic optimization. arXiv 2014, arXiv:1412.6980. [Google Scholar]
  47. Zhang, Z.; Liu, Q.; Wang, Y. Road extraction by deep residual U-Net. IEEE Geosci. Remote Sens. Lett. 2018, 15, 749–753. [Google Scholar] [CrossRef]
  48. Chen, L.C.; Zhu, Y.; Papandreou, G.; Schroff, F.; Adam, H. Encoder-decoder with atrous separable convolution for semantic image segmentation. In Lecture Notes in Computer Science, Proceedings of the 15th European Conference on Computer Vision (ECCV), Munich, Germany, 8–14 September 2018; Springer: Cham, Switzerland, 2018; pp. 801–818. [Google Scholar]
  49. Panboonyuen, T.; Jitkajornwanich, K.; Lawawirojwong, S.; Srestasathiern, P.; Vateekul, P. Road segmentation of remotely-sensed images using deep convolutional neural networks with landscape metrics and conditional random fields. Remote Sens. 2017, 9, 680. [Google Scholar] [CrossRef]
  50. Zhang, Z.; Cai, H.; Han, S. EfficientViT-SAM: Accelerated Segment Anything Model Without Accuracy Loss. arXiv 2024, arXiv:2402.05008. [Google Scholar]
  51. Trigka, M.; Dritsas, E. A Comprehensive Survey of Machine Learning Techniques and Models for Object Detection. Sensors 2025, 25, 214. [Google Scholar] [CrossRef] [PubMed]
  52. Alshehri, M.; Ouadou, A.; Scott, G.J. Deep transformer-based network deforestation detection in the Brazilian Amazon using sentinel-2 imagery. IEEE Geosci. Remote Sens. Lett. 2024, 21, 2502705. [Google Scholar] [CrossRef]
  53. Li, L.; Jiang, Y.; Shen, X.; Li, D. Long-term assessment and analysis of the radiometric quality of standard data products for Chinese Gaofen-1/2/6/7 optical remote sensing satellites. Remote Sens. Environ. 2024, 308, 114169. [Google Scholar] [CrossRef]
  54. Zhao, Z.; Liu, Z.; Luo, H.; Yang, H.; Wang, B.; Jiang, Y.; Liu, Y.; Wu, Y. GF-2 Remote Sensing-Based Winter Wheat Extraction with Multitask Learning Vision Transformer. IEEE J. Sel. Top. Appl. Earth Obs. Remote Sens. 2025, 18, 12454–12469. [Google Scholar] [CrossRef]
  55. Liu, Y.; Li, H.; Hu, C.; Luo, S.; Luo, Y.; Chen, C.W. Learning to aggregate multi-scale context for instance segmentation in remote sensing images. IEEE Trans. Neural Netw. Learn. Syst. 2024, 36, 595–609. [Google Scholar] [CrossRef]
  56. Zhou, L.; Liu, S.; Zheng, W. Automatic analysis of transverse musculoskeletal ultrasound images based on the multi-task learning model. Entropy 2023, 25, 662. [Google Scholar] [CrossRef]
  57. Yang, H.; Zhang, Y.; Xu, J.; Lu, H.; Heng, P.-A.; Lam, W. Unveiling the generalization power of fine-tuned large language models. arXiv 2024, arXiv:2403.09162. [Google Scholar]
  58. Solopov, M.; Chechekhina, E.; Kavelina, A.; Akopian, G.; Turchin, V.; Popandopulo, A.; Filimonov, D.; Ishchenko, R. Comparative Study of Deep Transfer Learning Models for Semantic Segmentation of Human Mesenchymal Stem Cell Micrographs. Int. J. Mol. Sci. 2025, 26, 2338. [Google Scholar] [CrossRef]
  59. Höge, M.; Wöhling, T.; Nowak, W. A primer for model selection: The decisive role of model complexity. Water Resour. Res. 2018, 54, 1688–1715. [Google Scholar] [CrossRef]
  60. Alsabhan, W.; Alotaiby, T. Automatic building extraction on satellite images using UNet and ResNet50. Comput. Intell. Neurosci. 2022, 2022, 5008854. [Google Scholar] [CrossRef] [PubMed]
  61. Chen, H.; Qin, Y.; Liu, X.; Wang, H.; Zhao, J. An improved DeepLabv3+ lightweight network for remote-sensing image semantic segmentation. Complex Intell. Syst. 2024, 10, 2839–2849. [Google Scholar] [CrossRef]
  62. Ryhede Bengtsson, B.; Bengs, J. Accelerated Segmentation with Mixed-Precision Quantization of EfficientViT-SAM. Master’s Thesis, Lund University, Lund, Sweden, 2024. [Google Scholar]
  63. Haroon, Z.; Cheema, M.J.M.; Saleem, S.; Amin, M.; Anjum, M.N.; Tahir, M.N.; Hussain, S.; Zahid, U.; Khan, F. Potential of precise fertilization through adoption of management zones strategy to enhance wheat production. Land 2023, 12, 540. [Google Scholar] [CrossRef]
Figure 1. Overview of the research area. (a) Youyi Farm rice paddy area. (b) Levees in a remote sensing image. (c) Spatial distribution pattern of levees.
Remotesensing 17 01871 g001
Figure 2. Three labeling methods. (a) Manual labeling. (b) NDVI extraction. (c) EVI extraction.
Remotesensing 17 01871 g002
Figure 3. Data enhancement of labels. (a) Image. (b) Label. (c) Label rotation 90°. (d) Label vertical flip. (e) Label horizontal flip.
Remotesensing 17 01871 g003
Figure 4. Convolutional Block Attention Module structure.
Remotesensing 17 01871 g004
Figure 5. Channel Attention Module structure.
Remotesensing 17 01871 g005
Figure 6. Spatial Attention Module structure.
Remotesensing 17 01871 g006
Figure 7. Improved UNet network.
Remotesensing 17 01871 g007
Figure 9. (a) Training and validation accuracy. (b) Training and validation loss.
Remotesensing 17 01871 g009
Figure 10. Levee dataset extraction results. (a) Image; (b) Label; (c) SegNet; (d) ResNet; (e) UNet; (f) UNet++; (g) DeepLabV3+; (h) EfficientViT-SAM; (i) SCA-UNet.
Remotesensing 17 01871 g010
Figure 11. (a) Comparison of the performance of segmentation models based on OA, (b) F1 score, (c) recall, and (d) IoU metrics. The charts show the distribution of metric values for each model. * p < 0.1; ** p < 0.05; *** p < 0.01; ns—differences are not significant.
Remotesensing 17 01871 g011
Figure 12. Ablation experiment results. (a1,a2) Image. (b1,b2) Label. (c1,c2) UNet extraction result. (d1,d2) SE-UNet extraction result. (e1,e2) CBAM-UNet extraction result. (f1,f2) SCA-UNet extraction result.
Remotesensing 17 01871 g012
Figure 13. The OA accuracy of the SCA-UNet model ablation experiment was improved.
Remotesensing 17 01871 g013
Figure 14. (ad) The images of the four areas and the extraction results from the generalization experiments.
Remotesensing 17 01871 g014
Table 1. Hyperparameter configuration of the experiment.
ParameterValue
Initialized learning rate0.00001
Early Stopping20
Epoch100
Batch size14
Pixel256 × 256
OptimizerAdam
Table 2. Training results on the dataset.
MothodOA/%F1-Score/%IoU/%Precision/%Recall/%
SegNet85.0489.0286.4592.7989.09
ResNet88.0289.5687.6593.5490.12
UNet88.1290.986.6594.6490.14
UNet++88.3591.2387.3695.6991.49
DeepLabV3+87.8993.0288.2396.2190.67
EfficientViT-SAM89.6892.3587.4398.2392.69
Ours92.1294.2589.3698.1392.67
Table 3. Statistical significance analysis between SCA-UNet and other models using the Shapiro–Wilk test.
ModelOAF1 ScoreRecallIoUShapiro-Wilk
SegNet0.834 ± 0.0110.857 ± 0.0210.865 ± 0.0150.824 ± 0.0320.781
ResNet0.863 ± 0.0120.864 ± 0.0180.882 ± 0.0160.834 ± 0.0290.873
UNet0.863 ± 0.0250.878 ± 0.0180.884 ± 0.0170.848 ± 0.0120.959
UNet++0.857 ± 0.0170.883 ± 0.0180.889 ± 0.0090.850 ± 0.0170.924
DeepLabV3+0.865 ± 0.0110.892 ± 0.0210.893 ± 0.0110.856 ± 0.0130.507
EfficientViT-SAM0.872 ± 0.0130.890 ± 0.0180.910 ± 0.0170.845 ± 0.0160.483
Ours0.884 ± 0.0210.906 ± 0.0230.916 ± 0.0420.875 ± 0.0160.376
Notes. The mean values calculated for the validation sample of images and the values of the standard deviations are given for OA, F1 score, Recall, and IoU.
Table 4. Statistical significance analysis between SCA-UNet and other models using the t-test.
ModelMean Difference
±
Standard Error
95%CIp-Value
SegNet4.968 ± 0.064[4.84, 5.09]p < 0.001
ResNet4.217 ± 0.33[2.22, 6.22]p < 0.05
UNet2.82 ± 0.281[2.27, 3.37]p < 0.001
UNet++2.344 ± 0.33[1.70, 2.99]p < 0.05
DeepLabV3+1.451 ± 0.015[1.42, 1.48]p < 0.0001
EfficientViT-SAM1.403 ± 0.013[1.37, 1.42]p < 0.05
Table 5. Ablation experiment accuracy evaluation.
ModelOA/%F1-Score/%IoU/%Precision/%Recall/%
UNet88.1290.0986.6594.6490.14
SE-UNet87.8292.8886.7194.8989.77
CBAM-UNet88.0592.9086.7594.7191.44
SCA-UNet92.1294.2589.3698.1392.67
Table 6. Results of 10-fold cross-validation on SCA-UNet.
MetricsMean (%)SD (%)
OA90.471.47
F1-score90.692.02
IoU87.181.61
Precision95.182.39
Recall95.132.32
Table 7. Model computational complexity.
ModelOA (%)Parameters (106)FLOPS (109)
SegNet85.0423.0228.4
ResNet88.0225.603.8
UNet88.1233.8965.3
UNet++88.3545.89150.29
DeepLabV3+87.8926.8925.3
EfficientViT-SAM89.6834.869
Ours92.1231.367.1
Disclaimer/Publisher’s Note: The statements, opinions and data contained in all publications are solely those of the individual author(s) and contributor(s) and not of MDPI and/or the editor(s). MDPI and/or the editor(s) disclaim responsibility for any injury to people or property resulting from any ideas, methods, instructions or products referred to in the content.

