

Spatio-Temporal Fusion of Landsat and MODIS Data for Monitoring of High-Intensity Fire Traces in Karst Landscapes: A Case Study in China


 , ,
, ,
Abstract
1. Introduction
- For the first time, a systematic validation framework for the spatio-temporal fusion technology for karst fire traces has been constructed. By integrating heterogeneous remote sensing fusion algorithms and innovatively establishing a multi-dimensional evaluation standard system, the breakthrough reveals the applicability boundary of spatio-temporal fusion technology in karst landscape areas, laying the methodological foundation for the application of this technology in special landscape scenarios.
- This study pioneeringly proposed a multi-source remote sensing cooperative optimisation model for karst areas. By deeply analyzing the spectral response characteristics of different algorithms and establishing a mechanism for complementing the advantages of multiple models, we have overcome the technical bottleneck of obtaining remote sensing data with high spatial and temporal resolution in complex terrain areas, and we have provided innovative solutions for monitoring fragile karst ecosystems.
- We have constructed a dynamic monitoring technology system for karst ecosystem disaster processes. We have achieved the precise identification of the boundaries of fire traces, and we have established a time-series remote sensing inversion model, revealing for the first time the dynamic evolution law of vegetation restoration in karst areas and providing a universal technical paradigm for disaster assessment and ecological restoration of ecologically fragile areas.
2. Materials and Methods
2.1. Experimental Materials
2.1.1. Study Area
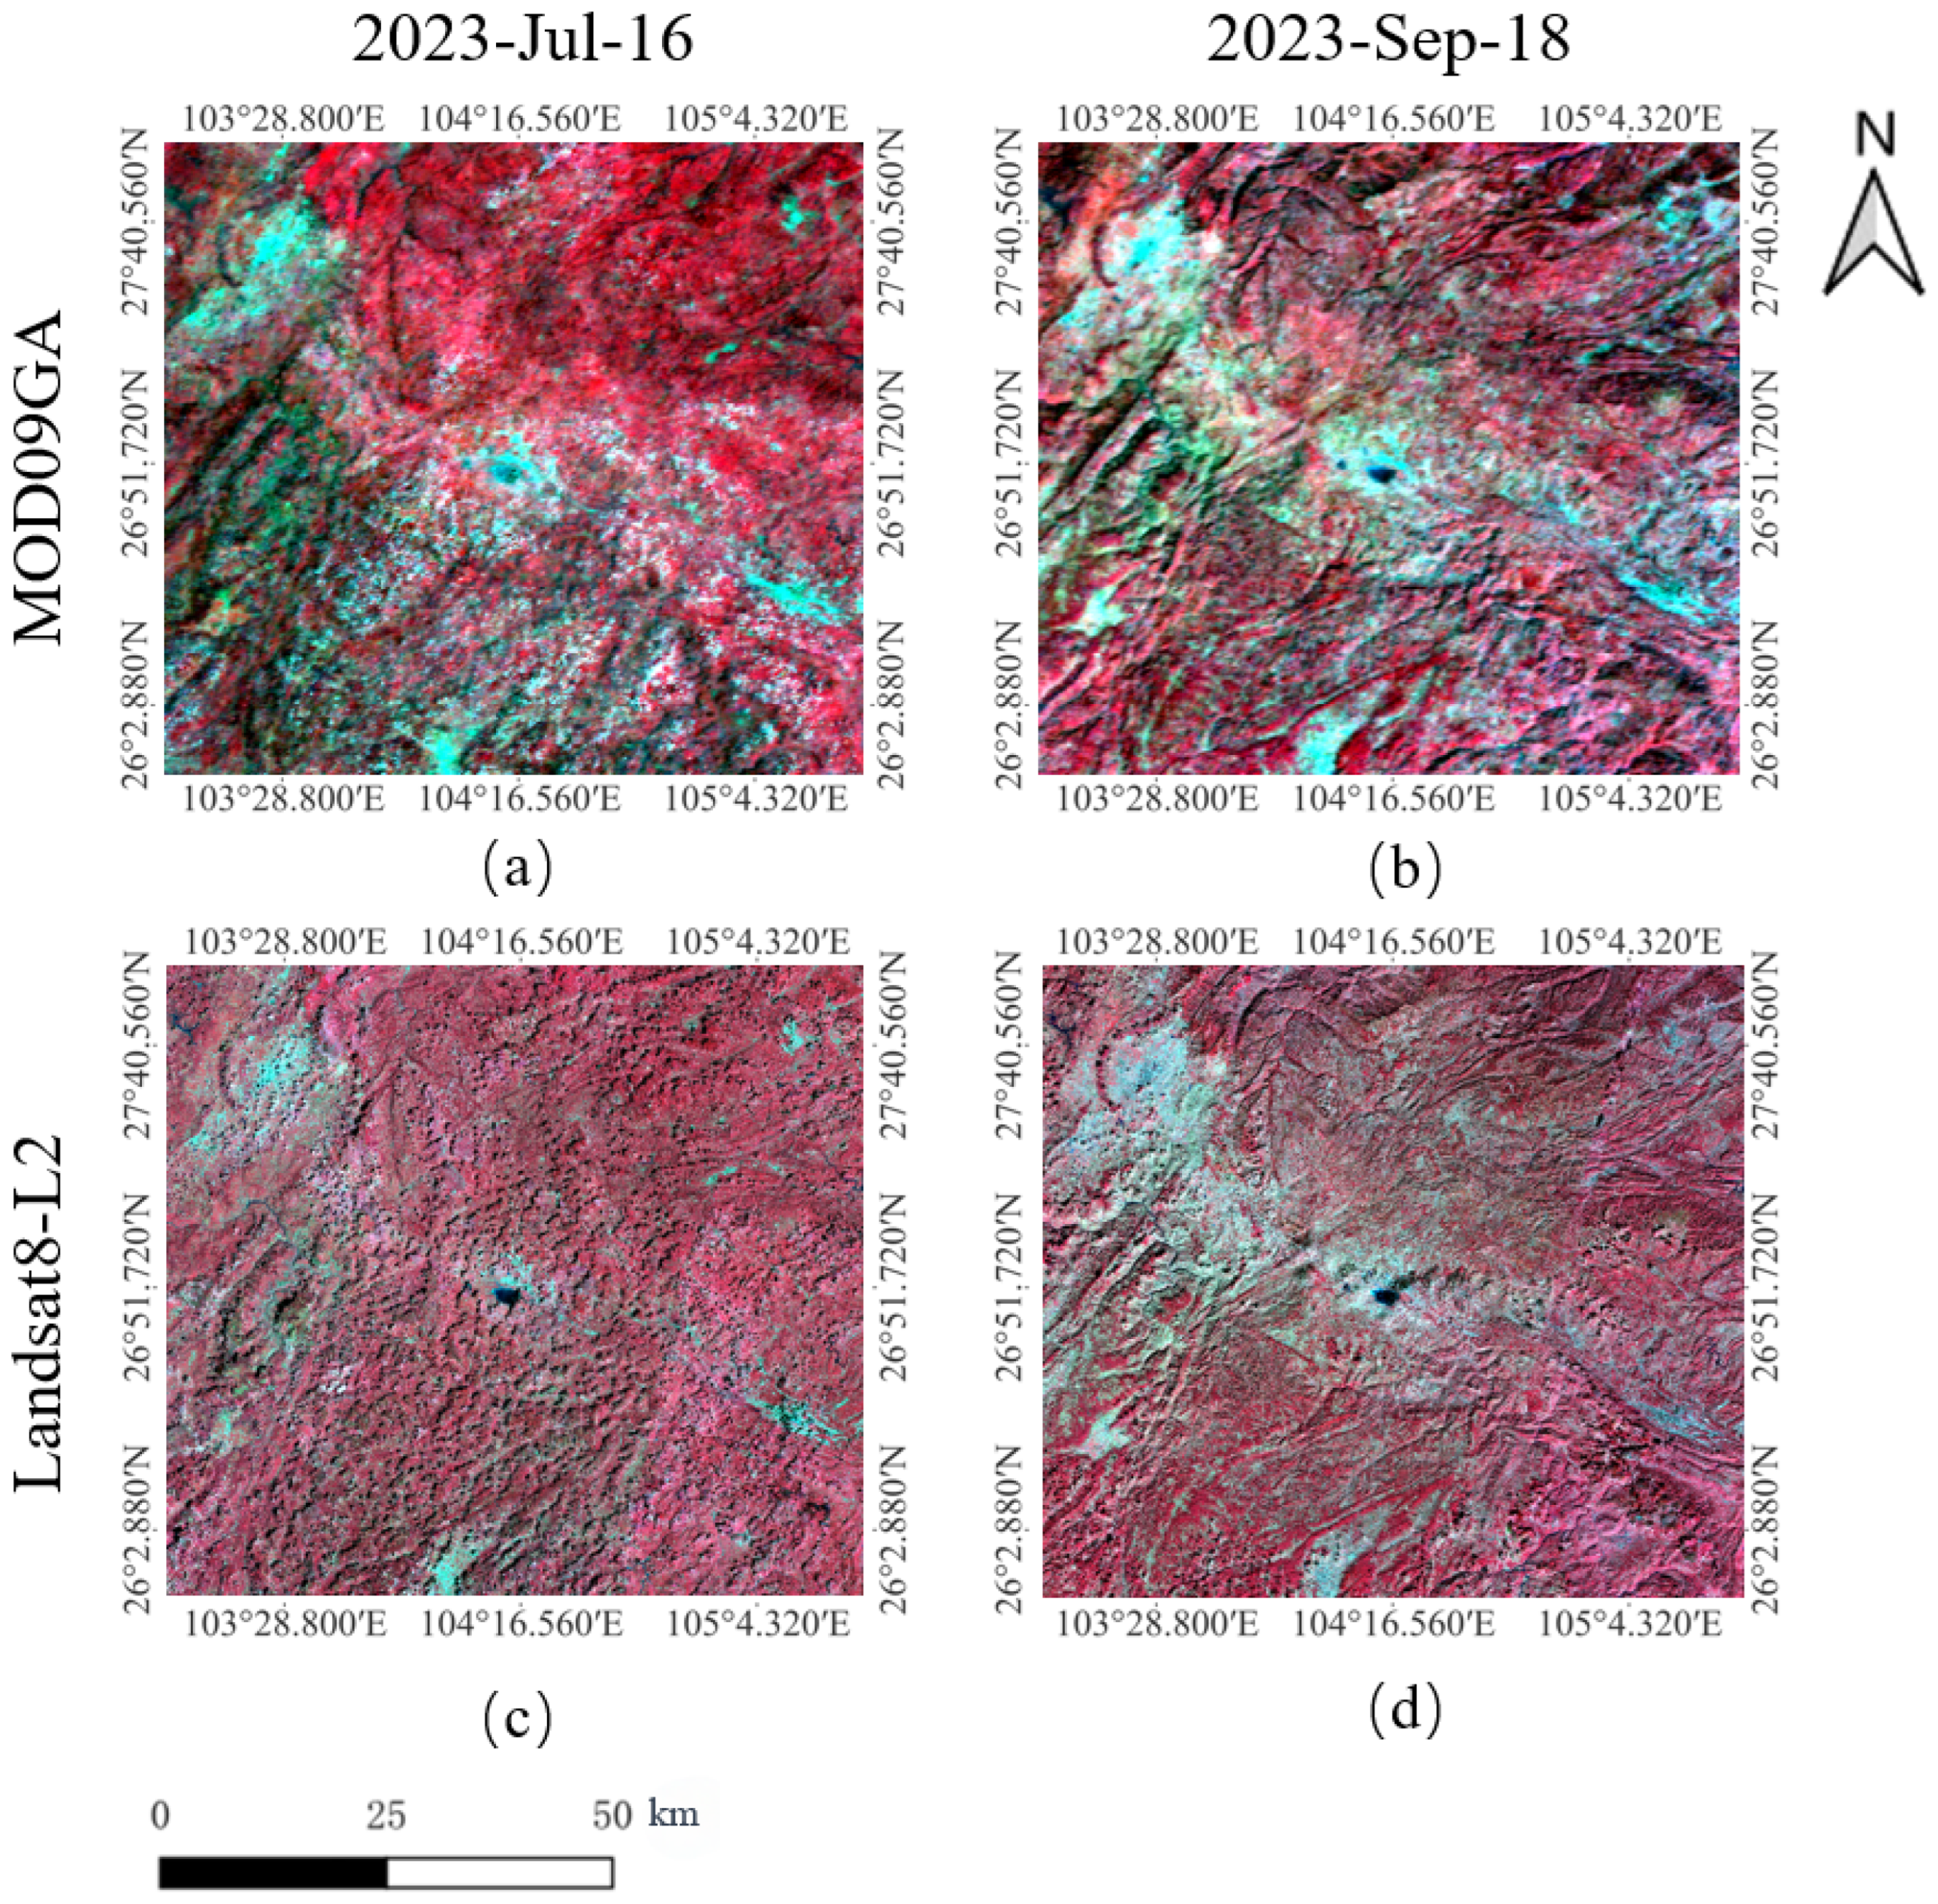
2.1.2. Data Sources
2.1.3. Fusion Data Selection
2.2. Methods
2.2.1. Fusion Method
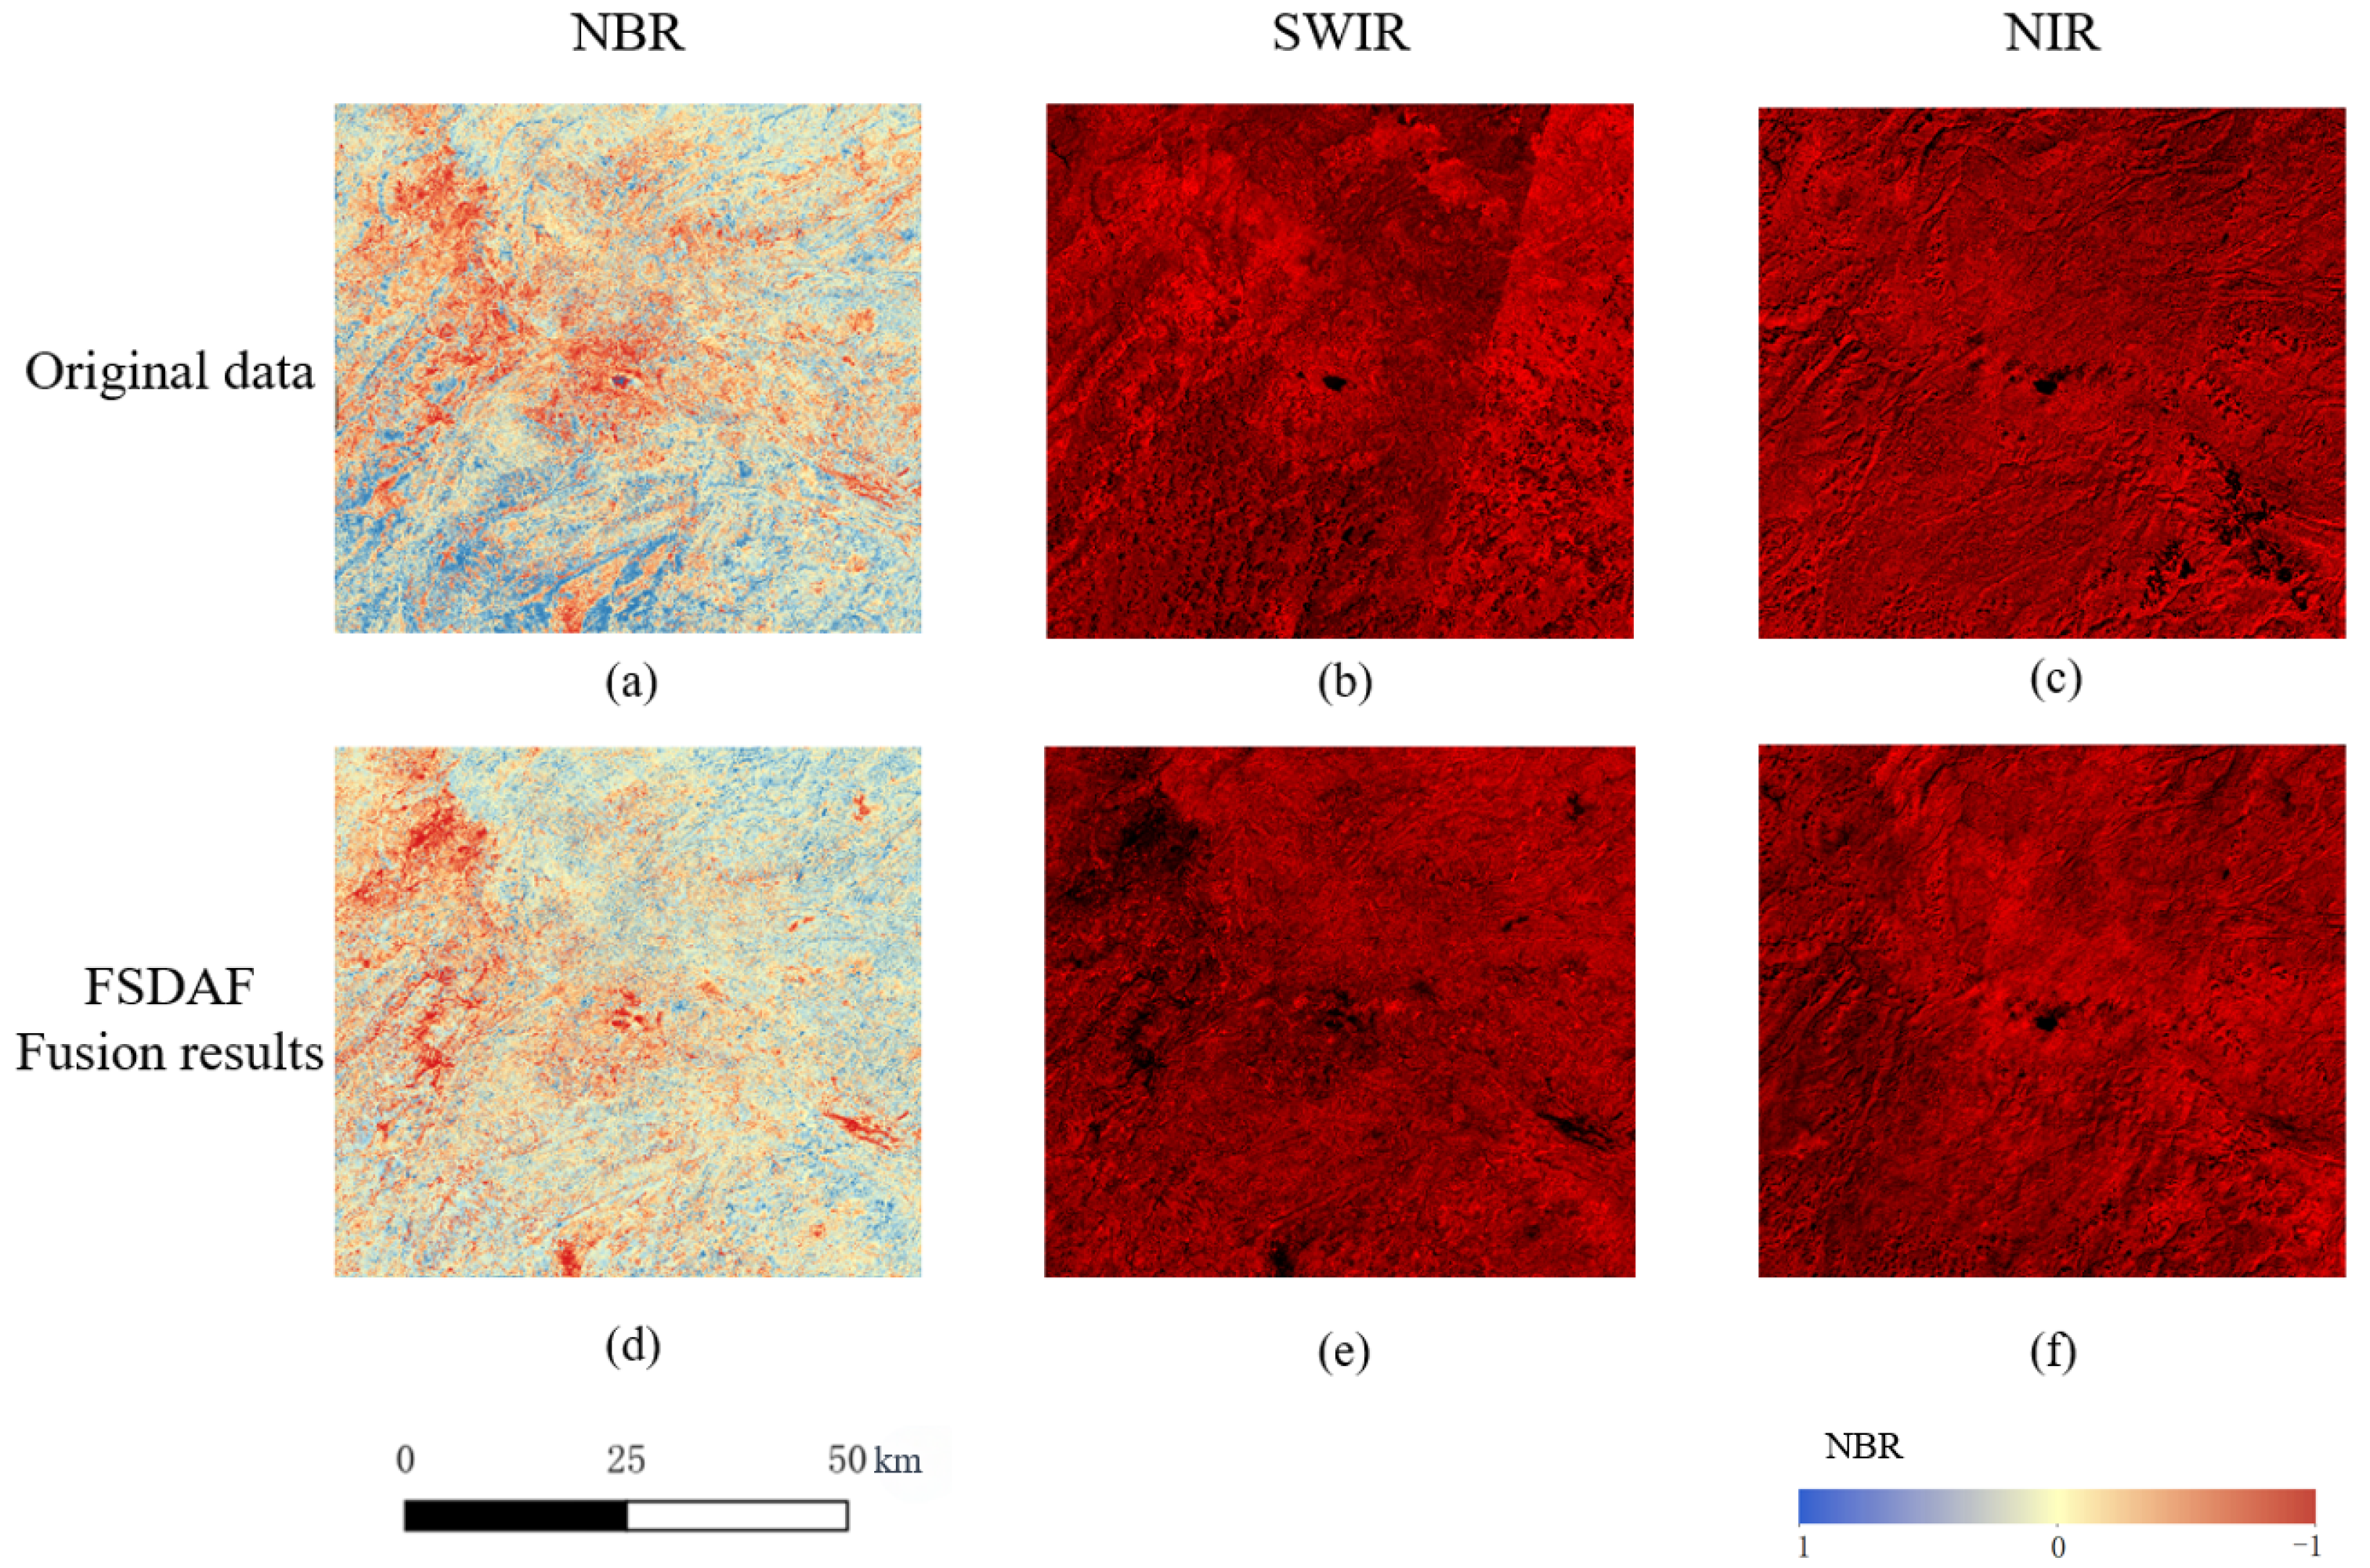
- FSDAF
- 2.
- STARFM
- 3.
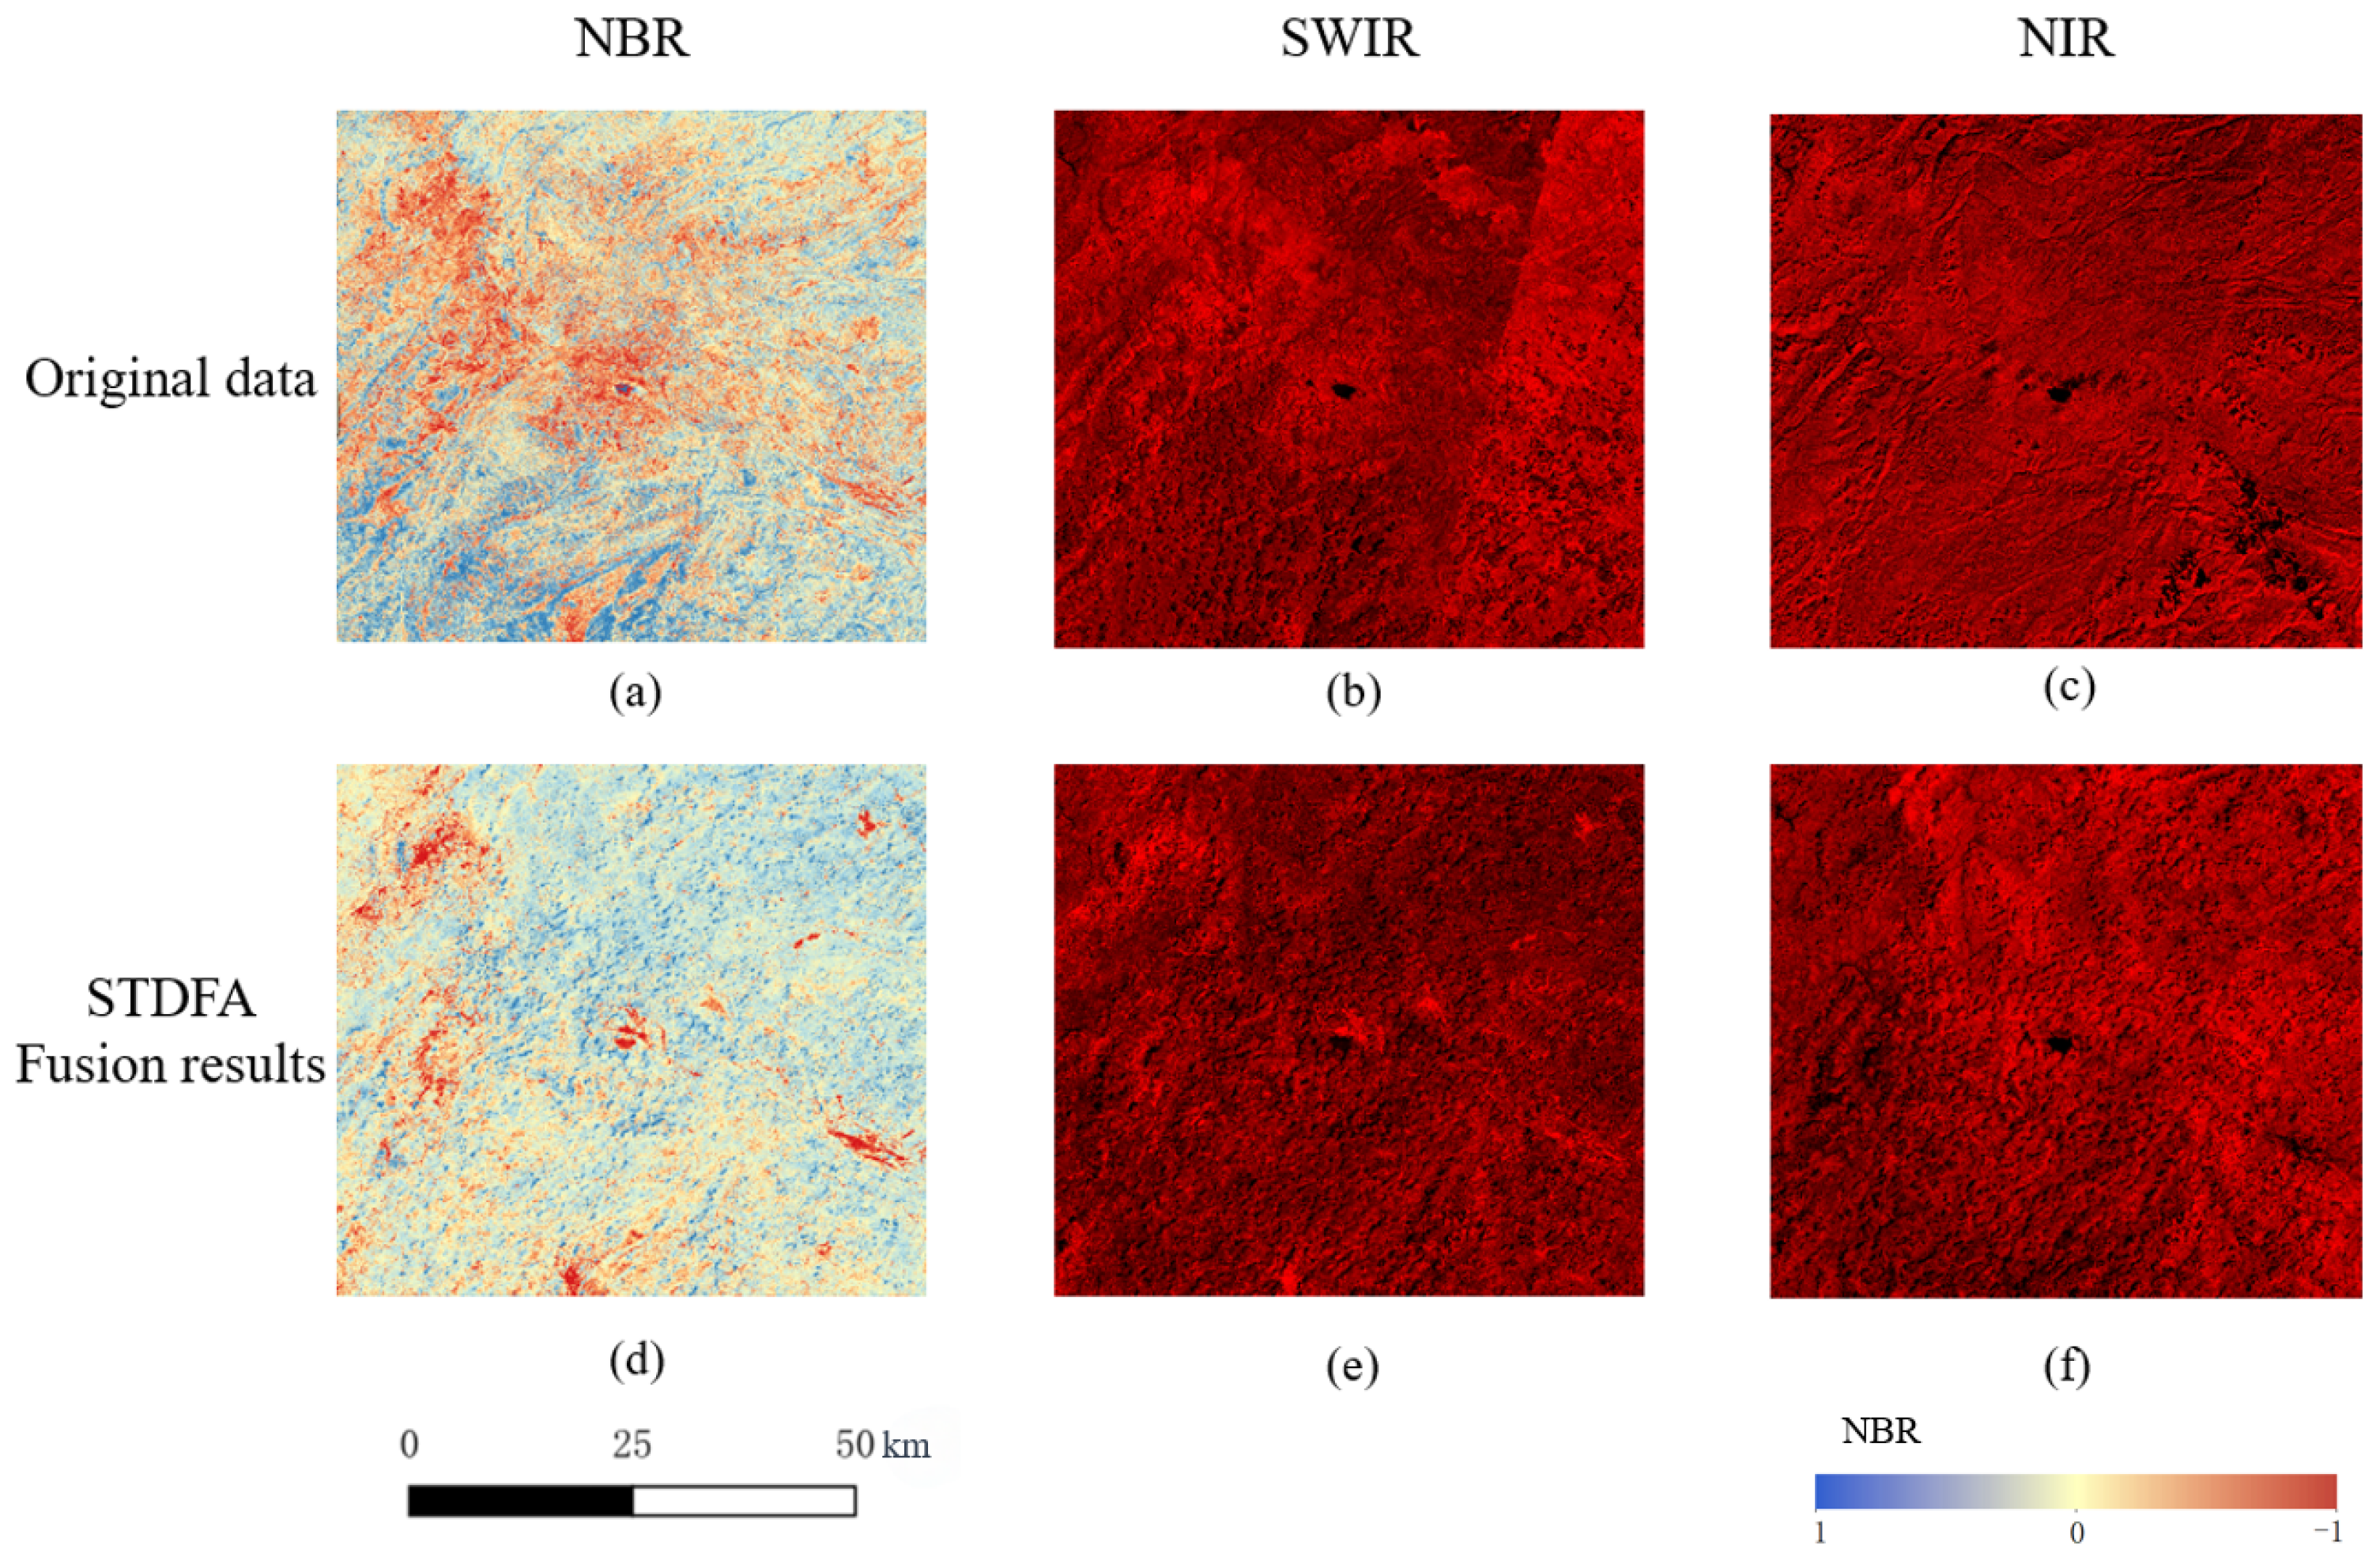
- STDFA
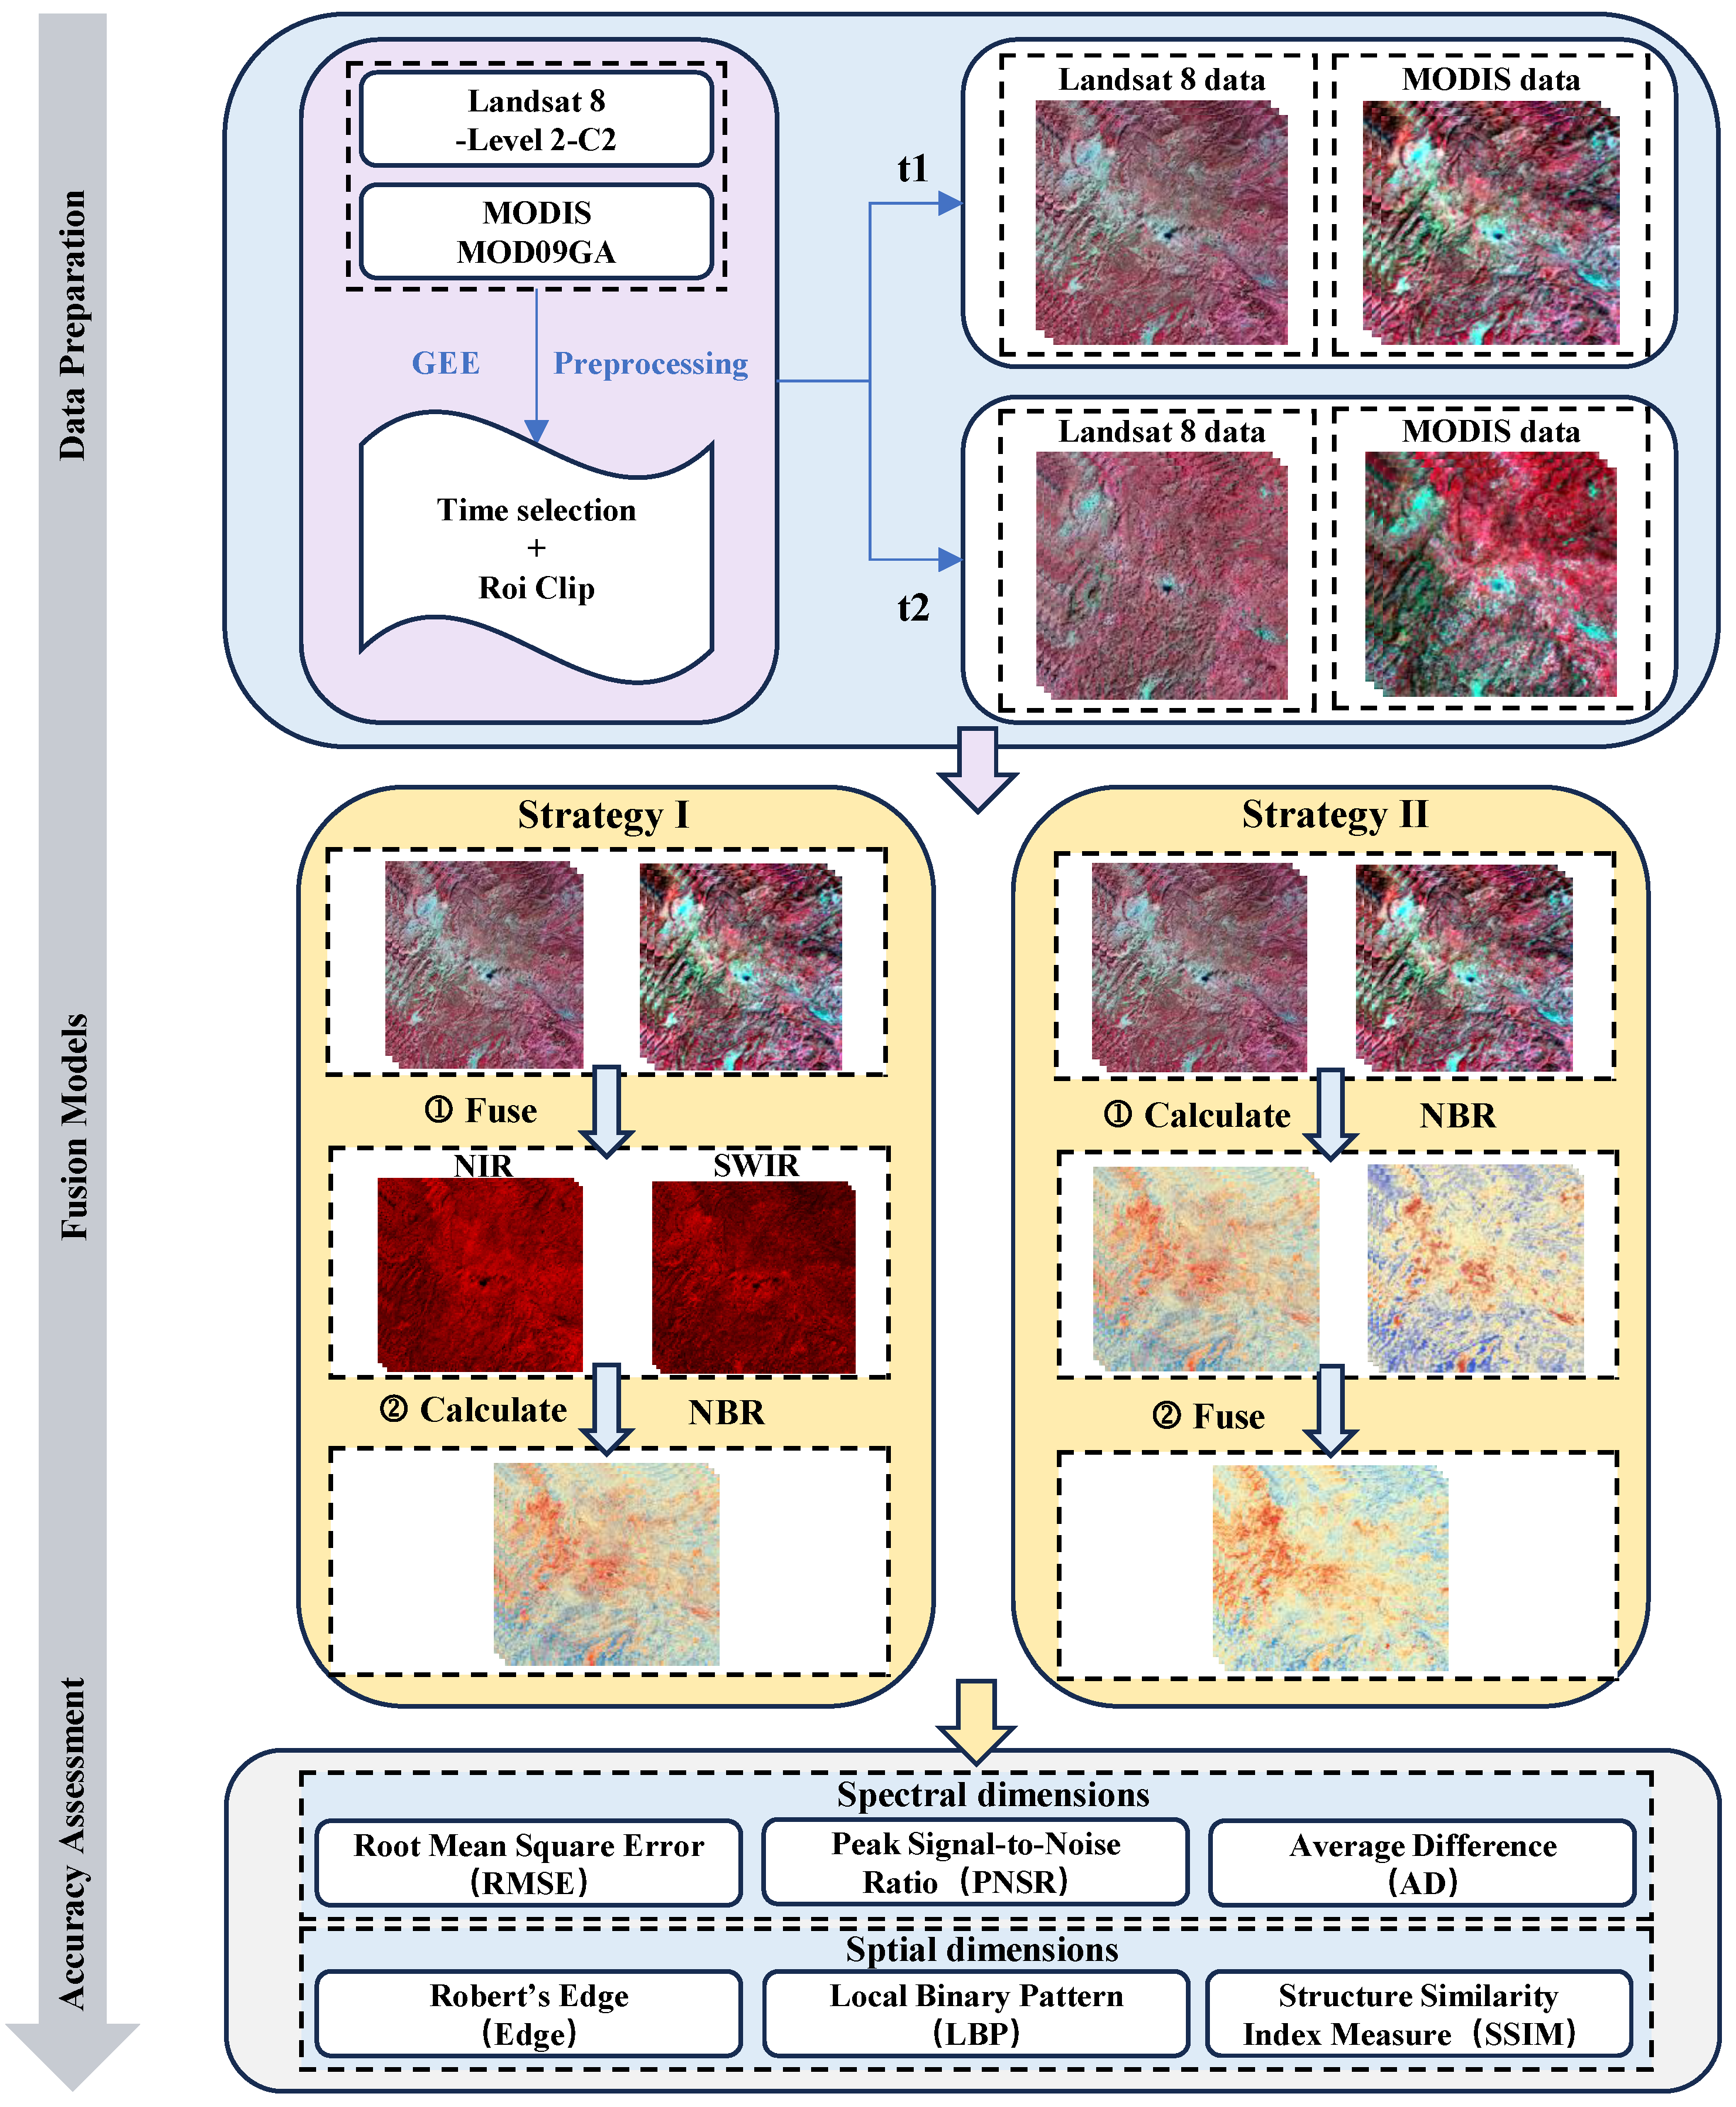
2.2.2. Fusion Strategies
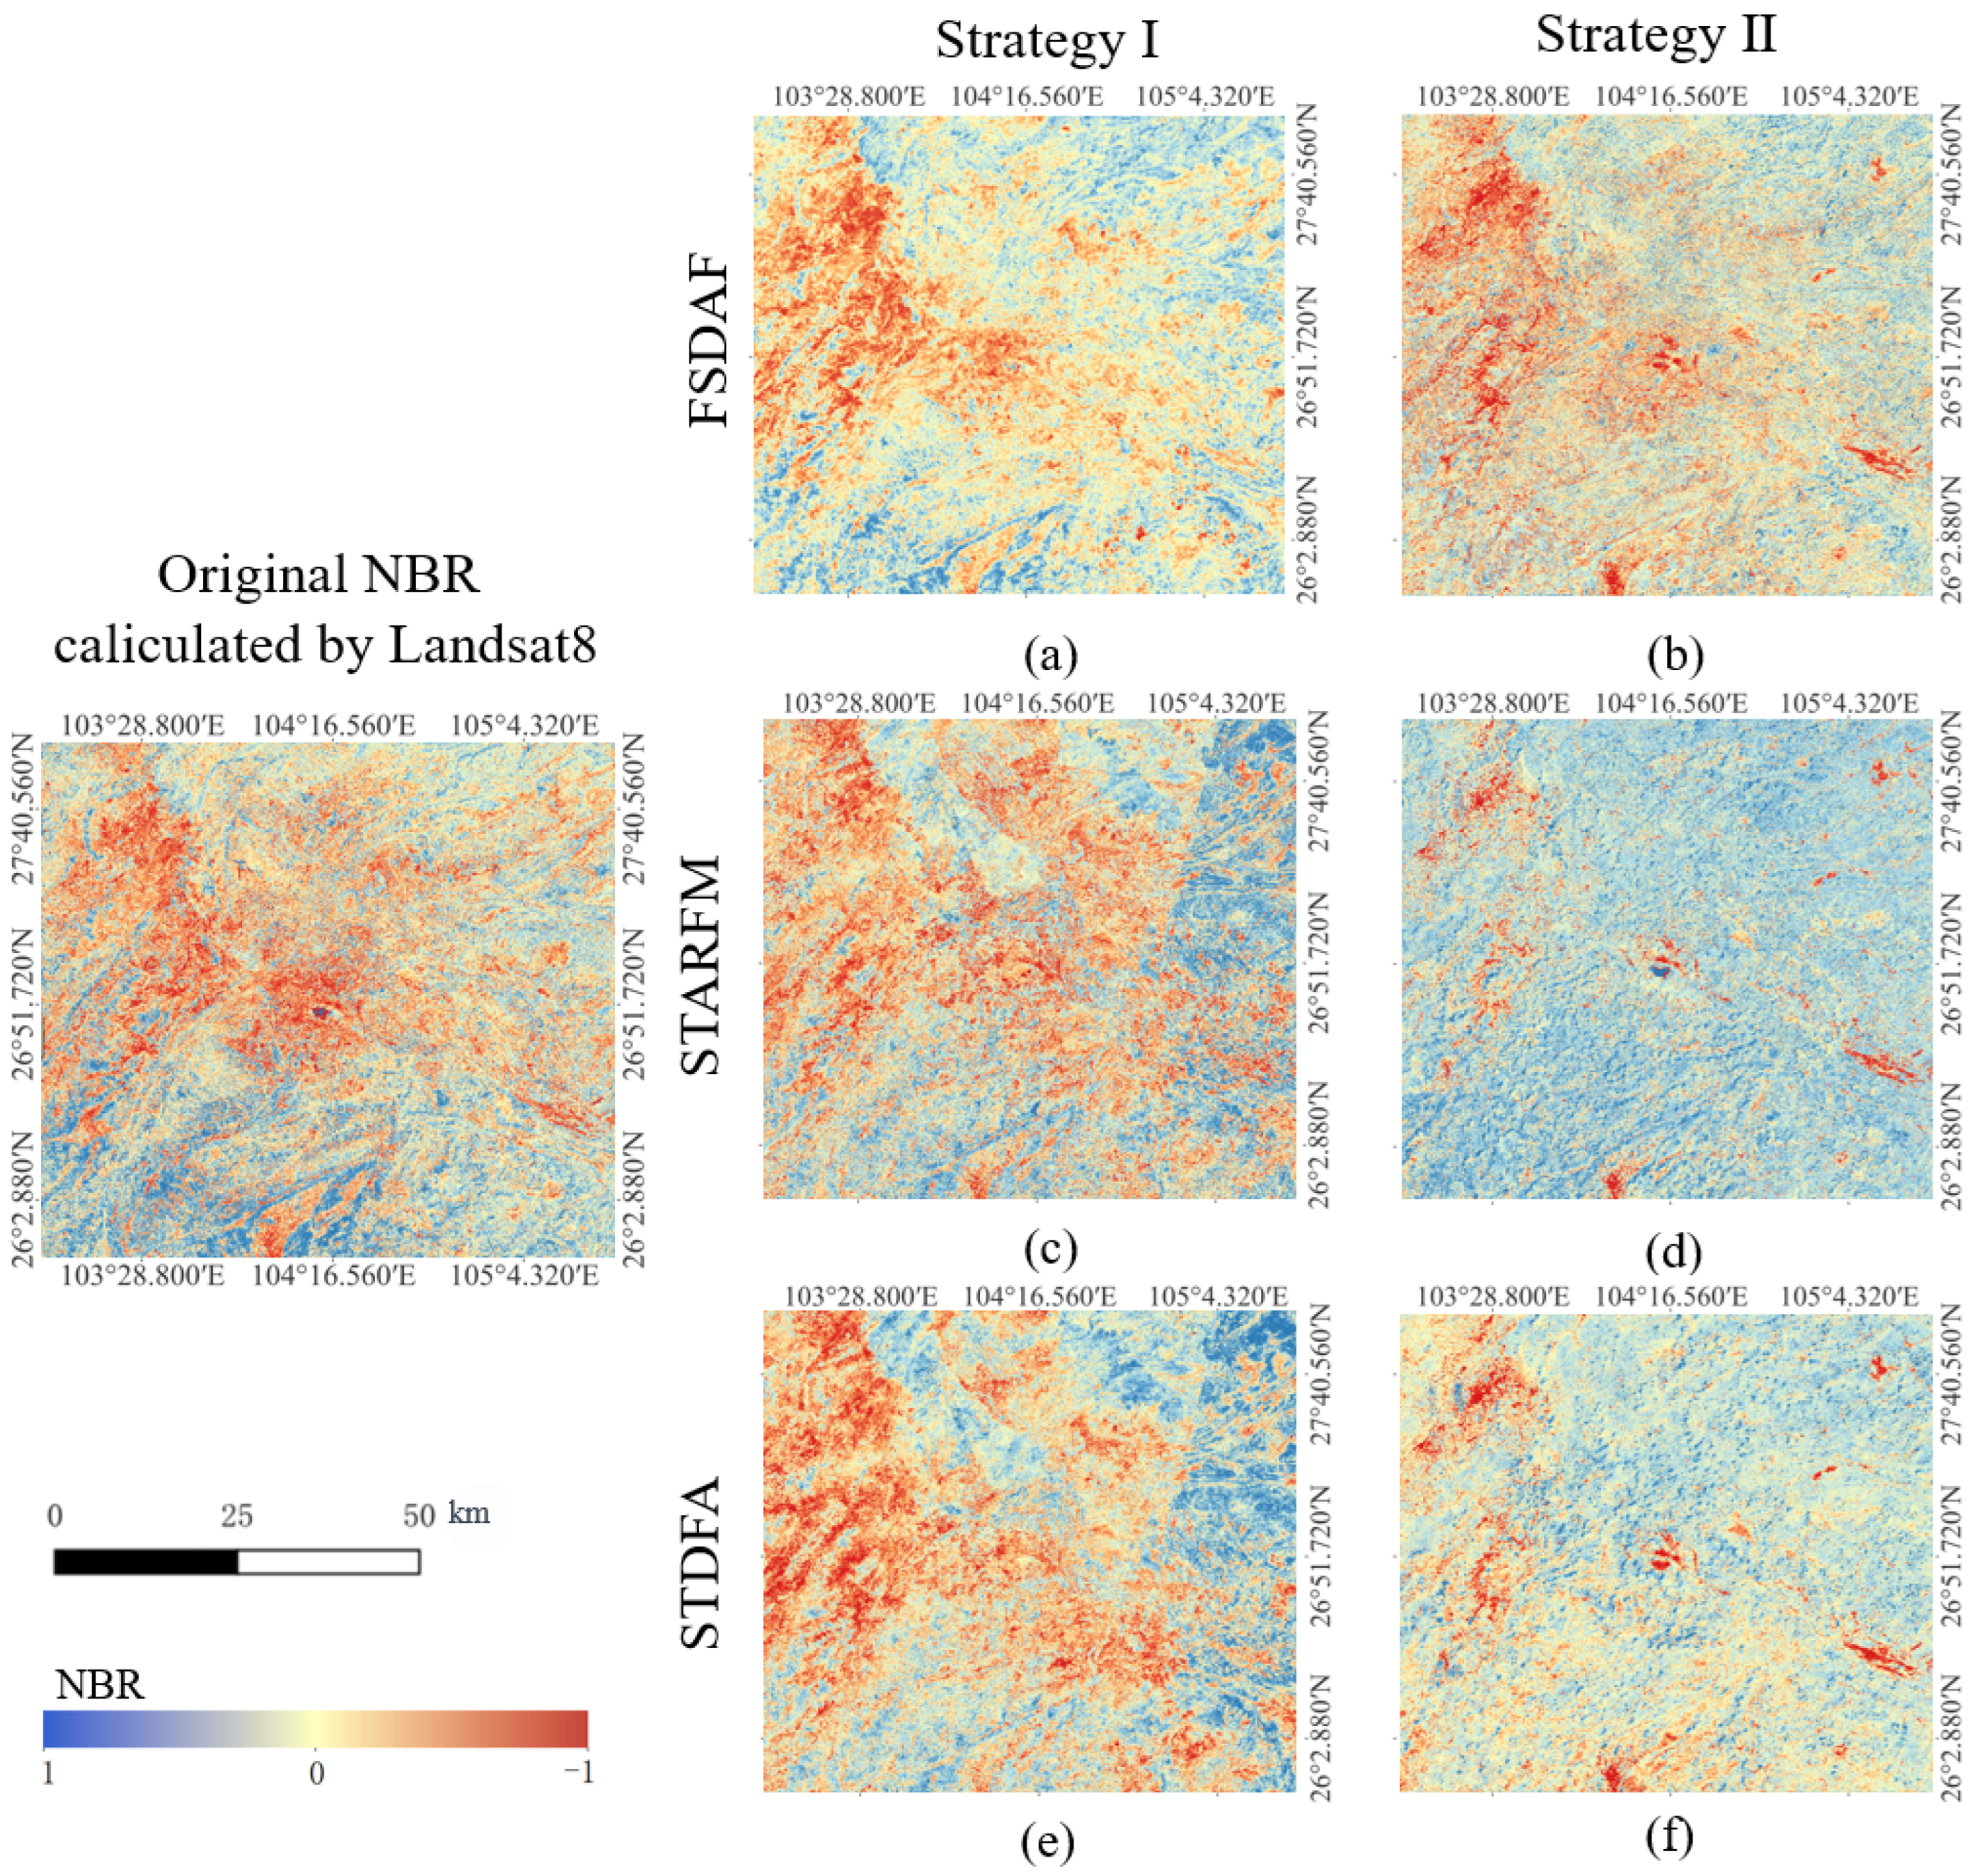
- Strategy I: The NBR is calculated using the reflectance of the NIR and shortwave IR bands, and then the calculated NBR is fused using each of the three models.
- Strategy II: We utilize the three models to perform spatio-temporal fusion of the NIR (Landsat 8 is band 5 and MOD09GA is band sur-refl-b02) and short-wave IR (Landsat 8 is band 7 and MOD09GA is band sur-refl-b07) bands, which are required for the calculation of the NBR index. The NBR is then computed using the two fused bands.
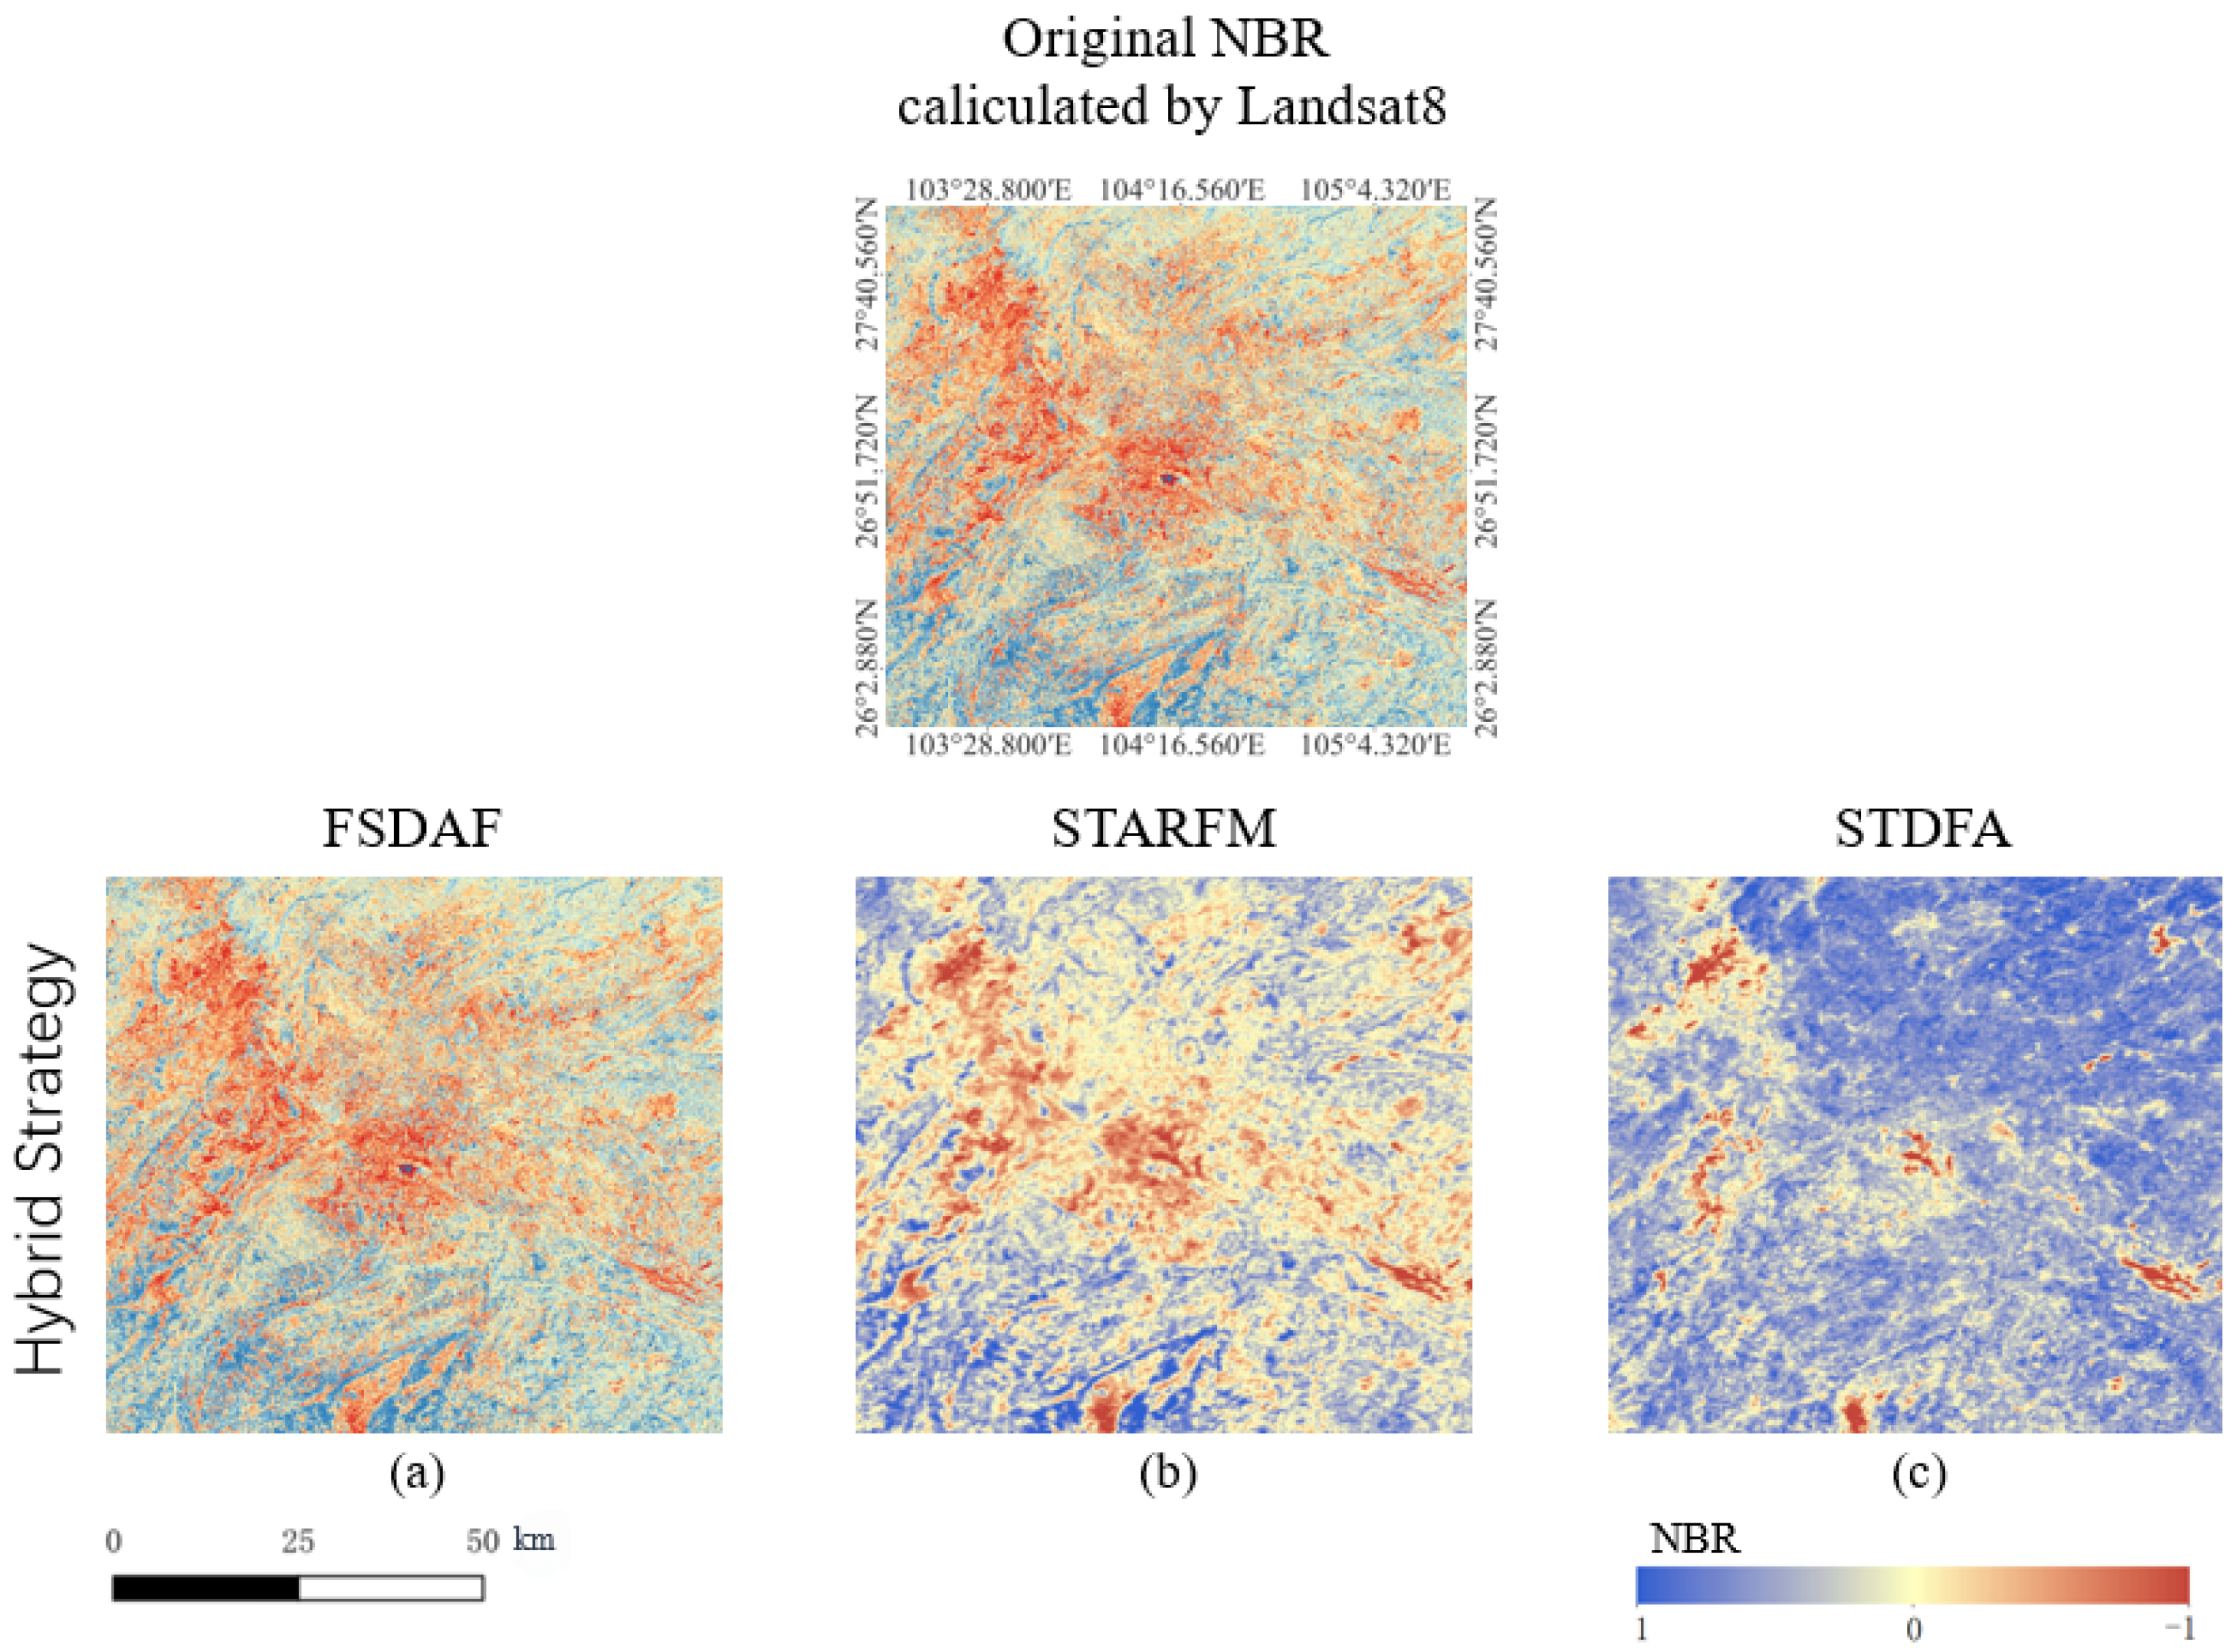
- Hybrid Strategy: The NBR is calculated in stages and the fusion weights are dynamically adjusted, with Strategy II adopted in sparse data areas (when cloud cover is severe) to enhance spatial and temporal continuity, and Strategy I adopted in complex terrain areas to preserve spectral details.
2.2.3. Extraction Methods for Fire Sites
2.2.4. Accuracy Evaluation Methods
- Spatio-temporal fusion accuracy assessment
- 2.
- Validation of the results of fire trace extraction
3. Results
3.1. Results of the Spatial-Temporal Fusion of Multi-Source Satellite Data
3.2. Results of Experiments Comparing Fusion Strategies
3.3. Fire Trace Extraction Results
4. Discussion
4.1. Methodological Improvements and Application Potential for Fire Monitoring in Karst Landscapes
4.2. Mechanistic Advantages of FSDAF in Topographically Complex Environments
4.3. Applicability of a Spatio-Temporal Adaptive Fusion Framework Based on Dynamic Strategy Selection and Weighted Mixing in Regions with Thick Cloud Cover or Complex Terrain, Exemplified by Karstic Terrain Areas
4.4. Innovations and Limitations of Fire Response Paradigm Construction and the Fire Trail Extraction Framework in Karst Regions
5. Conclusions
Author Contributions
Funding
Data Availability Statement
Acknowledgments
Conflicts of Interest
References
- Hu, Y.; Wang, H.; Niu, X.; Shao, W.; Yang, Y. Comparative analysis and comprehensive trade-off of four spatiotemporal fusion models for NDVI generation. Remote Sens. 2022, 14, 5996. [Google Scholar] [CrossRef]
- Kurbanov, E.; Vorobev, O.; Lezhnin, S.; Sha, J.; Wang, J.; Li, X.; Cole, J.; Dergunov, D.; Wang, Y. Remote sensing of forest burnt area, burn severity, and post-fire recovery: A review. Remote Sens. 2022, 14, 4714. [Google Scholar] [CrossRef]
- Yue, X.; Unger, N. Fire air pollution reduces global terrestrial productivity. Nat. Commun. 2018, 9, 5413. [Google Scholar] [CrossRef] [PubMed]
- Lai, C.; Zeng, S.; Guo, W.; Liu, X.; Li, Y.; Liao, B. Forest fire prediction with imbalanced data using a deep neural network method. Forests 2022, 13, 1129. [Google Scholar] [CrossRef]
- Zhang, X.; Wang, T.; Chen, G.; Tan, X.; Zhu, K. Convective clouds extraction from Himawari–8 satellite images based on double-stream fully convolutional networks. IEEE Geosci. Remote Sens. Lett. 2019, 17, 553–557. [Google Scholar] [CrossRef]
- Chen, G.; Zhang, K.; Zhang, X.; Xie, H.; Yang, H.; Tan, X.; Wang, T.; Ma, Y.; Wang, Q.; Cao, J.; et al. Enhancing Terrestrial Net Primary Productivity Estimation with EXP-CASA: A Novel Light Use Efficiency Model Approach. arXiv 2024, arXiv:2406.19969. [Google Scholar] [CrossRef]
- Kong, J.; Ryu, Y.; Huang, Y.; Dechant, B.; Houborg, R.; Guan, K.; Zhu, X. Evaluation of four image fusion NDVI products against in situ spectral-measurements over a heterogeneous rice paddy landscape. Agric. For. Meteorol. 2021, 297, 108255. [Google Scholar] [CrossRef]
- Hazaymeh, K.; Hassan, Q.K. Spatiotemporal image-fusion model for enhancing the temporal resolution of Landsat-8 surface reflectance images using MODIS images. J. Appl. Remote Sens. 2015, 9, 096095. [Google Scholar] [CrossRef]
- Liu, C.; Zhang, X.; Wang, T.; Chen, G.; Zhu, K.; Wang, Q.; Wang, J. Detection of vegetation coverage changes in the Yellow River Basin from 2003 to 2020. Ecol. Indic. 2022, 138, 108818. [Google Scholar] [CrossRef]
- Zhou, X.; Wang, P.; Tansey, K.; Zhang, S.; Li, H.; Tian, H. Reconstruction of time series leaf area index for improving wheat yield estimates at field scales by fusion of Sentinel-2,-3 and MODIS imagery. Comput. Electron. Agric. 2020, 177, 105692. [Google Scholar] [CrossRef]
- Wang, Y.; Luo, X.; Wang, Q. A boundary finding-based spatiotemporal fusion model for vegetation index. Int. J. Remote Sens. 2021, 42, 8236–8261. [Google Scholar] [CrossRef]
- Liu, M.; Liu, X.; Dong, X.; Zhao, B.; Zou, X.; Wu, L.; Wei, H. An improved spatiotemporal data fusion method using surface heterogeneity information based on estarfm. Remote Sens. 2020, 12, 3673. [Google Scholar] [CrossRef]
- Lin, R.; Wei, Z.; Chen, H.; Han, C.; Zhang, B.; Jule, M. Improving the Spatiotemporal Resolution of Land Surface Temperature Using a Data Fusion Method in Haihe Basin, China. Remote Sens. 2024, 16, 2374. [Google Scholar] [CrossRef]
- Gao, F.; Anderson, M.C.; Zhang, X.; Yang, Z.; Alfieri, J.G.; Kustas, W.P.; Mueller, R.; Johnson, D.M.; Prueger, J.H. Toward mapping crop progress at field scales through fusion of Landsat and MODIS imagery. Remote Sens. Environ. 2017, 188, 9–25. [Google Scholar] [CrossRef]
- Cao, Y.; Du, P.; Zhang, M.; Bai, X.; Lei, R.; Yang, X. Quantitative Evaluation of Grassland SOS Estimation Accuracy Based on Different MODIS-Landsat Spatio-Temporal Fusion Datasets. Remote Sens. 2022, 14, 2542. [Google Scholar] [CrossRef]
- Schroeder, W.; Oliva, P.; Giglio, L.; Csiszar, I.A. The New VIIRS 375 m active fire detection data product: Algorithm description and initial assessment. Remote Sens. Environ. 2014, 143, 85–96. [Google Scholar] [CrossRef]
- Wang, C.; He, T.; Song, D.X.; Zhang, L.; Zhu, P.; Man, Y. Comparison of change-based and shape-based data fusion methods in fine-resolution land surface phenology monitoring with Landsat and Sentinel-2 data. Sci. Total Environ. 2024, 927, 172014. [Google Scholar] [CrossRef]
- Gao, F.; Masek, J.; Schwaller, M.; Hall, F. On the blending of the Landsat and MODIS surface reflectance: Predicting daily Landsat surface reflectance. IEEE Trans. Geosci. Remote Sens. 2006, 44, 2207–2218. [Google Scholar]
- Zhu, X.; Chen, J.; Gao, F.; Chen, X.; Masek, J.G. An enhanced spatial and temporal adaptive reflectance fusion model for complex heterogeneous regions. Remote Sens. Environ. 2010, 114, 2610–2623. [Google Scholar] [CrossRef]
- Guo, D.; Shi, W.; Hao, M.; Zhu, X. FSDAF 2.0: Improving the performance of retrieving land cover changes and preserving spatial details. Remote Sens. Environ. 2020, 248, 111973. [Google Scholar] [CrossRef]
- Xu, C.; Du, X.; Fan, X.; Jian, H.; Yan, Z.; Zhu, J.; Wang, R. FastVSDF: An efficient spatiotemporal data fusion method for seamless data cube. IEEE Trans. Geosci. Remote Sens. 2024, 62, 1–22. [Google Scholar] [CrossRef]
- Gao, H.; Zhu, X.; Guan, Q.; Yang, X.; Yao, Y.; Zeng, W.; Peng, X. cuFSDAF: An enhanced flexible spatiotemporal data fusion algorithm parallelized using graphics processing units. IEEE Trans. Geosci. Remote Sens. 2021, 60, 1–16. [Google Scholar] [CrossRef]
- Xu, C.; Du, X.; Yan, Z.; Zhu, J.; Xu, S.; Fan, X. VSDF: A variation-based spatiotemporal data fusion method. Remote Sens. Environ. 2022, 283, 113309. [Google Scholar] [CrossRef]
- Yang, M.; Zhou, Y.; Xie, Y.; Shao, W.; Luo, F. Accuracy Evaluation of Four Spatiotemporal Fusion Methods for Different Time Scales. IEEE J. Sel. Top. Appl. Earth Obs. Remote Sens. 2024, 17, 8291–8301. [Google Scholar] [CrossRef]
- Key, C.H.; Benson, N.C. Landscape assessment (LA). In FIREMON: Fire Effects Monitoring and Inventory System; Gen. Tech. Rep. RMRS-GTR-164-CD; Lutes, D.C., Keane, R.E., Caratti, J.F., Key, C.H., Benson, N.C., Sutherland, S., Gangi, L.J., Eds.; US Department of Agriculture, Forest Service, Rocky Mountain Research Station: Fort Collins, CO, USA, 2006; Volume 164, p. LA-1-55. [Google Scholar]
- Miller, J.D.; Thode, A.E. Quantifying burn severity in a heterogeneous landscape with a relative version of the delta Normalized Burn Ratio (dNBR). Remote Sens. Environ. 2007, 109, 66–80. [Google Scholar] [CrossRef]
- Irwin, K.; Beaulne, D.; Braun, A.; Fotopoulos, G. Fusion of SAR, optical imagery and airborne LiDAR for surface water detection. Remote Sens. 2017, 9, 890. [Google Scholar] [CrossRef]
- Wang, K.; Zhang, C.; Chen, H.; Yue, Y.; Zhang, W.; Zhang, M.; Qi, X.; Fu, Z. Karst landscapes of China: Patterns, ecosystem processes and services. Landsc. Ecol. 2019, 34, 2743–2763. [Google Scholar] [CrossRef]
- Su, Z.; Tigabu, M.; Cao, Q.; Wang, G.; Hu, H.; Guo, F. Comparative analysis of spatial variation in forest fire drivers between boreal and subtropical ecosystems in China. For. Ecol. Manag. 2019, 454, 117669. [Google Scholar] [CrossRef]
- Zeng, Z.Q.; Wang, S.L.; Zhang, C.M.; Gong, C.; Hu, Q. Carbon storage in evergreen broad-leaf forests in mid-subtropical region of China at four succession stages. J. For. Res. 2013, 24, 677–682. [Google Scholar] [CrossRef]
- Pellegrini, A.F.; Harden, J.; Georgiou, K.; Hemes, K.S.; Malhotra, A.; Nolan, C.J.; Jackson, R.B. Fire effects on the persistence of soil organic matter and long-term carbon storage. Nat. Geosci. 2022, 15, 5–13. [Google Scholar] [CrossRef]
- Van Der Werf, G.R.; Randerson, J.T.; Collatz, G.J.; Giglio, L. Carbon emissions from fires in tropical and subtropical ecosystems. Glob. Change Biol. 2003, 9, 547–562. [Google Scholar] [CrossRef]
- Vijayakumar, S.; Saravanakumar, R.; Arulanandam, M.; Ilakkiya, S. Google Earth Engine: Empowering developing countries with large-scale geospatial data analysis—A comprehensive review. Arab. J. Geosci. 2024, 17, 139. [Google Scholar] [CrossRef]
- Xing, H.; Chen, B.; Feng, Y.; Ni, Y.; Hou, D.; Wang, X.; Kong, Y. Mapping irrigated, rainfed and paddy croplands from time-series Sentinel-2 images by integrating pixel-based classification and image segmentation on Google Earth Engine. Geocarto Int. 2022, 37, 13291–13310. [Google Scholar] [CrossRef]
- Guo, Y.; Chen, S.; Li, X.; Cunha, M.; Jayavelu, S.; Cammarano, D.; Fu, Y. Machine learning-based approaches for predicting SPAD values of maize using multi-spectral images. Remote Sens. 2022, 14, 1337. [Google Scholar] [CrossRef]
- Zhao, R.; Li, Y.; Ma, M. Mapping paddy rice with satellite remote sensing: A review. Sustainability 2021, 13, 503. [Google Scholar] [CrossRef]
- Zheng, T.; Chen, Z.; Bai, J.; Xie, H.; Jiang, Y.G. Tps++: Attention-enhanced thin-plate spline for scene text recognition. arXiv 2023, arXiv:2305.05322. [Google Scholar]
- Zhang, H.; Song, Y.; Han, C.; Zhang, L. Remote sensing image spatiotemporal fusion using a generative adversarial network. IEEE Trans. Geosci. Remote Sens. 2020, 59, 4273–4286. [Google Scholar] [CrossRef]
- Roy, D.P.; Jin, Y.; Lewis, P.; Justice, C. Prototyping a global algorithm for systematic fire-affected area mapping using MODIS time series data. Remote Sens. Environ. 2005, 97, 137–162. [Google Scholar] [CrossRef]
- Wang, Q.; Zhang, X.; Chen, G.; Dai, F.; Gong, Y.; Zhu, K. Change detection based on Faster R-CNN for high-resolution remote sensing images. Remote Sens. Lett. 2018, 9, 923–932. [Google Scholar] [CrossRef]
- Tan, X.; Chen, G.; Wang, T.; Wang, J.; Zhang, X. Segment change model (scm) for unsupervised change detection in vhr remote sensing images: A case study of buildings. In Proceedings of the IGARSS 2024—2024 IEEE International Geoscience and Remote Sensing Symposium, Athens, Greece, 7–12 July 2024; pp. 8577–8580. [Google Scholar]
- Miller, J.D.; Knapp, E.E.; Key, C.H.; Skinner, C.N.; Isbell, C.J.; Creasy, R.M.; Sherlock, J.W. Calibration and validation of the relative differenced Normalized Burn Ratio (RdNBR) to three measures of fire severity in the Sierra Nevada and Klamath Mountains, California, USA. Remote Sens. Environ. 2009, 113, 645–656. [Google Scholar] [CrossRef]
- Key, C.H. Ecological and sampling constraints on defining landscape fire severity. Fire Ecol. 2006, 2, 34–59. [Google Scholar] [CrossRef]
- Zhu, X.; Duan, S.B.; Li, Z.L.; Zhao, W.; Wu, H.; Leng, P.; Gao, M.; Zhou, X. Retrieval of land surface temperature with topographic effect correction from Landsat 8 thermal infrared data in mountainous areas. IEEE Trans. Geosci. Remote Sens. 2020, 59, 6674–6687. [Google Scholar] [CrossRef]
- Yi, L.; Zhang, G. Object-oriented remote sensing imagery classification accuracy assessment based on confusion matrix. In Proceedings of the 2012 20th International Conference on Geoinformatics, Hong Kong, China, 15–17 June 2012; pp. 1–8. [Google Scholar]
- Shu, H.; Jiang, S.; Zhu, X.; Xu, S.; Tan, X.; Tian, J.; Xu, Y.N.; Chen, J. Fusing or filling: Which strategy can better reconstruct high-quality fine-resolution satellite time series? Sci. Remote Sens. 2022, 5, 100046. [Google Scholar] [CrossRef]
- Knauer, K.; Gessner, U.; Fensholt, R.; Kuenzer, C. An ESTARFM fusion framework for the generation of large-scale time series in cloud-prone and heterogeneous landscapes. Remote Sens. 2016, 8, 425. [Google Scholar] [CrossRef]
- Yan, W.; He, Y.; Cai, Y.; Qu, X.; Cui, X. Relationship between extreme climate indices and spatiotemporal changes of vegetation on Yunnan Plateau from 1982 to 2019. Glob. Ecol. Conserv. 2021, 31, e01813. [Google Scholar] [CrossRef]
- Shi, Z.; Sha, Y.; Liu, X.; Xie, X.; Li, X. Effect of marginal topography around the Tibetan Plateau on the evolution of central Asian arid climate: Yunnan–Guizhou and Mongolian Plateaux as examples. Clim. Dyn. 2019, 53, 4433–4445. [Google Scholar] [CrossRef]
- Liu, H.; Zhou, B.; Bai, Z.; Zhao, W.; Zhu, M.; Zheng, K.; Yang, S.; Li, G. Applicability assessment of multi-source DEM-assisted InSAR deformation monitoring considering two topographical features. Land 2023, 12, 1284. [Google Scholar] [CrossRef]
- Borini Alves, D.; Montorio Llovería, R.; Pérez-Cabello, F.; Vlassova, L. Fusing Landsat and MODIS data to retrieve multispectral information from fire-affected areas over tropical savannah environments in the Brazilian Amazon. Int. J. Remote Sens. 2018, 39, 7919–7941. [Google Scholar] [CrossRef]
- Hilker, T.; Wulder, M.A.; Coops, N.C.; Seitz, N.; White, J.C.; Gao, F.; Masek, J.G.; Stenhouse, G. Generation of dense time series synthetic Landsat data through data blending with MODIS using a spatial and temporal adaptive reflectance fusion model. Remote Sens. Environ. 2009, 113, 1988–1999. [Google Scholar] [CrossRef]
- Wu, M.; Niu, Z.; Wang, C.; Wu, C.; Wang, L. Use of MODIS and Landsat time series data to generate high-resolution temporal synthetic Landsat data using a spatial and temporal reflectance fusion model. J. Appl. Remote Sens. 2012, 6, 063507. [Google Scholar]


| Data Products | Bands | Spatial Resolution/(m) | Time Resolution/(day) |
|---|---|---|---|
| Landsat 8 Level 2-C2 | Band5 (NIR) | 30 | 16 |
| Band7 (SWIR2) | 30 | 16 | |
| MODIS MOD09GQ | Band2 (NIR) | 250 | 1 |
| Band7 (SWIR2) | 500 | 1 |
| Method | Input Data | Validation Data | |||||||
|---|---|---|---|---|---|---|---|---|---|
| Landsat-8 | MODIS | Landsat-8 | |||||||
| Band | Resolution | Shooting Date | Band | Resolution | Shooting Date | Band | Resolution | Shooting Date | |
| STARFM | NIR/SWIR2 | 30 m | 16-July-2023 | NIR/SWIR2 | 500 m | 16-July-2023 | NIR/SWIR2 | 30 m | 18-September-2023 |
| - | 18-Sepember-2023 | ||||||||
| FSDAF | NIR/SWIR2 | 30 m | 16-July-2023 | NIR/SWIR2 | 500 m | 16-July-2023 | NIR/SWIR2 | 30 m | 18-Sepember-2023 |
| - | 18-Sepember-2023 | ||||||||
| STDFA | NIR/SWIR2 | 30 m | 16-July-2023 | NIR/SWIR2 | 500 m | 16-July-2023 | NIR/SWIR2 | 30 m | 18-Sepember-2023 |
| - | 18-Sepember-2023 | ||||||||
| Method | Accuracy Indicators for Different Bands in the Spectral Dimension | ||||||||
|---|---|---|---|---|---|---|---|---|---|
| NIR | SWIR | NBR | |||||||
| RMSE | PSNR | AD | RMSE | PSNR | AD | RMSE | PSNR | AD | |
| FSDAF | 0.1111 | 23.8079 | 0.1041 | 0.0181 | 39.1097 | 0.0042 | 2.5185 | 71.6486 | 0.1475 |
| STARFM | 0.1410 | 21.7413 | 0.1004 | 0.0557 | 29.3322 | −0.0165 | 8.1681 | 61.4290 | 0.2118 |
| STDFA | 0.2407 | 17.0950 | 0.2117 | 0.0615 | 28.4754 | 0.8150 | 2.5218 | 71.6374 | 0.2901 |
| Method | Accuracy Indicators for Different Bands in the Sptial Dimension | ||||||||
|---|---|---|---|---|---|---|---|---|---|
| NIR | SWIR | NBR | |||||||
| Edge | LBP | SSIM | Edge | LBP | SSIM | Edge | LBP | SSIM | |
| FSDAF | 0.8226 | 0.9998 | 0.8843 | 0.8269 | 0.9998 | 0.9648 | 0.0000 | 0.9998 | 1.0000 |
| STARFM | 0.1987 | 0.9998 | 0.5867 | 0.0786 | 0.9999 | 0.7303 | 0.0000 | 0.9999 | 1.0000 |
| STDFA | 0.2011 | 0.9997 | 0.5122 | 0.0752 | 0.9997 | 0.7035 | 0.0000 | 0.9996 | 1.0000 |
| Method | Strategy | Accuracy Indicators | |||||
|---|---|---|---|---|---|---|---|
| RMSE | PSNR | AD | Edge | LBP | SSIM | ||
| FSDAF | Strategy I | 0.1749 | 94.8161 | −0.1586 | 1.0000 | 0.9999 | 1.0000 |
| Strategy II | 2.5185 | 71.6486 | 0.1475 | 0.0000 | 0.9998 | 1.0000 | |
| Hybrid Strategy | 0.0598 | 98.3348 | 0.2486 | 1.0000 | 0.9999 | 1.0000 | |
| STARFM | Strategy I | 2.8435 | 70.5945 | −0.0246 | 0.0000 | 1.0000 | 1.0000 |
| Strategy II | 8.1681 | 61.4290 | 0.2118 | 0.0000 | 0.9999 | 1.0000 | |
| Hybrid Strategy | 1.7526 | 71.5982 | 0.1469 | 0.0000 | 1.0000 | 1.0000 | |
| STDFA | Strategy I | 2.8526 | 70.5668 | −0.1988 | 0.0000 | 0.9999 | 1.0000 |
| Strategy II | 2.5218 | 71.6374 | 0.2901 | 0.0000 | 0.9996 | 1.0000 | |
| Hybrid Strategy | 3.6584 | 72.8524 | 0.3487 | 0.0000 | 0.9999 | 1.0000 | |
| Confusion Matrix | Prediction | ||
|---|---|---|---|
| Positive | Negative | ||
| Reference | Positive | TP = 162 | FN = 18 |
| Negative | FP = 72 | TN = 806 | |
Disclaimer/Publisher’s Note: The statements, opinions and data contained in all publications are solely those of the individual author(s) and contributor(s) and not of MDPI and/or the editor(s). MDPI and/or the editor(s) disclaim responsibility for any injury to people or property resulting from any ideas, methods, instructions or products referred to in the content. |
© 2025 by the authors. Licensee MDPI, Basel, Switzerland. This article is an open access article distributed under the terms and conditions of the Creative Commons Attribution (CC BY) license (https://creativecommons.org/licenses/by/4.0/).
Share and Cite
Zhang, X.; Zhao, J.; Chen, G.; Wang, T.; Wang, Q.; Wang, K.; Miao, T. Spatio-Temporal Fusion of Landsat and MODIS Data for Monitoring of High-Intensity Fire Traces in Karst Landscapes: A Case Study in China. Remote Sens. 2025, 17, 1852. https://doi.org/10.3390/rs17111852
Zhang X, Zhao J, Chen G, Wang T, Wang Q, Wang K, Miao T. Spatio-Temporal Fusion of Landsat and MODIS Data for Monitoring of High-Intensity Fire Traces in Karst Landscapes: A Case Study in China. Remote Sensing. 2025; 17(11):1852. https://doi.org/10.3390/rs17111852
Chicago/Turabian StyleZhang, Xiaodong, Jingyi Zhao, Guanzhou Chen, Tong Wang, Qing Wang, Kui Wang, and Tingxuan Miao. 2025. "Spatio-Temporal Fusion of Landsat and MODIS Data for Monitoring of High-Intensity Fire Traces in Karst Landscapes: A Case Study in China" Remote Sensing 17, no. 11: 1852. https://doi.org/10.3390/rs17111852
APA StyleZhang, X., Zhao, J., Chen, G., Wang, T., Wang, Q., Wang, K., & Miao, T. (2025). Spatio-Temporal Fusion of Landsat and MODIS Data for Monitoring of High-Intensity Fire Traces in Karst Landscapes: A Case Study in China. Remote Sensing, 17(11), 1852. https://doi.org/10.3390/rs17111852