Article

Evolution of Vegetation Landscape Pattern Dynamics in Ejina Delta, Northwest China—Before and After Ecological Water Diversion

1
Key Laboratory of Water Cycle and Related Land Surface Processes, Institute of Geographic Sciences and Natural Resources Research, Chinese Academy of Sciences, Beijing 100101, China
2
College of Resources and Environment, University of Chinese Academy of Sciences, Beijing 100408, China
*
Author to whom correspondence should be addressed.
Remote Sens. 2025, 17(11), 1843; https://doi.org/10.3390/rs17111843 (registering DOI)
Submission received: 20 April 2025 / Revised: 18 May 2025 / Accepted: 22 May 2025 / Published: 25 May 2025

Abstract

:
As a typical desert oasis ecosystem in the arid region of Northwest China, the Ejina Delta plays a crucial role in regional ecological security through its vegetation dynamics and landscape pattern changes. Based on Landsat remote sensing images (1990–2020), runoff data, and vegetation landscape surveys, this study investigated the evolutionary patterns and driving mechanisms of vegetation degradation and restoration processes using Normalized Difference Vegetation Index (NDVI), landscape metrics, and Land Use Transition Matrix (LUTM) methods. The following key findings were obtained: (1) Since the implementation of the Ecological Water Diversion Project (EWDP) in the Heihe River Basin (HRB) in 2000, a significant recovery in vegetation coverage has been observed, with an NDVI growth rate of 0.0187/10 yr, which is five times faster than that in the pre-diversion period. The areas of arbor vegetation, shrubland, and grassland increased to 356.8, 689.5, and 2192.6 km2, respectively. However, there is a lag of about five years for the recovery of arbor and shrub compared to grass. (2) The implementation of EWDP has effectively reversed the trend of vegetation degradation, transforming the previously herb-dominated fragmented landscape into a more integrated pattern comprising multiple vegetation types. During the degradation period (1990–2005), the landscape exhibited a high degree of fragmentation, with an average number of patches (NP) reaching 45,875. In the subsequent recovery phase (2005–2010), fragmentation was significantly reduced, with the average NP dropping to 30,628. (3) Stronger vegetation growth and higher NDVI values were observed along the riparian zone, with the West River demonstrating greater restoration effectiveness compared to the East River. This study revealed that EWDP serves as the key factor driving vegetation recovery. To enhance oasis stability, future ecological management strategies should optimize spatiotemporal water allocation while considering differential vegetation responses.

1. Introduction

Arid and semi-arid regions cover approximately 40% of the Earth’s land surface and support fragile ecosystems that are highly susceptible to climate change and anthropogenic disturbances [1]. In these environments, vegetation dynamics and landscape configurations are primarily governed by hydrological processes, particularly surface water availability and groundwater recharge [2,3]. Among the most critical landscape features in these regions are desert oases, which serve as natural buffers against desertification and play an essential role in maintaining regional ecological security [4,5]. However, excessive water extraction for agriculture and urban development in upstream areas has severely altered hydrological regimes in downstream oases, resulting in vegetation degradation, landscape fragmentation, and ecosystem deterioration [6,7].
China’s northwestern arid zone, home to prominent inland river basins such as the Heihe, Tarim, Shiyang, and Shule basins, exemplifies these challenges [8,9,10,11]. The HRB, the second largest inland river system in Northwest China, has experienced severe ecological degradation since the late 20th century. Unregulated agricultural water use in the basin’s middle reaches drastically reduced downstream runoff, leading to near-complete vegetation loss in the Ejina Delta and the full desiccation of East Juyan Lake by 1992 [12]. These ecological consequences not only threatened biodiversity, but also exacerbated dust storms and desertification, posing risks to both regional and national ecological security [13].
In response, China launched the EWDP in 2000 to mitigate ecosystem collapse and reconcile water demands between upstream agriculture and downstream ecosystems. Before 2000, unsustainable irrigation had reduced annual inflows to the delta by over 80%, resulting in widespread Populus euphratica die-offs, the contraction of shrublands, and the expansion of desertified grasslands [14]. Since then, the EWDP has delivered an average of 120 million m3 of water annually to the Ejina Delta, raising groundwater levels and partially recharging terminal lakes [15,16]. Research has shown significant vegetation recovery in the Ejina Delta, with NDVI increasing by 50% between 2000 and 2020. [17]. However, recovery patterns remain spatially heterogeneous; riparian zones have shown faster vegetation resurgence compared to the peripheral desert margins [18]. Most assessments have emphasized overall vegetation trends, overlooking the spatial and temporal variability in vegetation responses among different plant functional types (e.g., arbors, shrubs, grasses). A deeper understanding of the underlying mechanisms is essential for optimizing water allocation and enhancing long-term oasis sustainability.
Previous research on the EWDP’s effects has spanned hydrological, ecological, and ecosystem service domains. It has been reported that the EWDP raised groundwater levels by 0.5–1.2 m in riparian areas, supporting phreatophytic species such as Populus euphratica and Tamarix [19]. For instance, Zhang (2011) attributed the trend of increasing oasis vegetation by 80.4% to the EWDP, which drove a rise in runoff [18]. Species-level studies have revealed that Populus euphratica primarily depends on river water during diversion periods (accounting for 84% of its water intake), while Tamarix relies more on groundwater, especially in non-diversion seasons (70%) [20]. Similar findings have been reported in other inland river basins, such as the Tarim and Shule Rivers, highlighting the critical role of regulated water releases in reversing ecosystem degradation [21,22].
At the landscape scale, metrics such as fragmentation indices and transition matrices have been used to assess spatial changes. Bao (2015) reported reduced landscape fragmentation in the Ejina Delta’s core oasis following the EWDP’s implementation [23]. However, most landscape-scale analyses emphasize aggregate indicators (e.g., NP) without differentiating between vegetation types. Moreover, existing studies often fail to link vegetation patterns with growth vigor, such as NDVI dynamics, and seldom explore the specific recovery patterns of arbors, shrubs, and grasses. Additionally, the hierarchical interactions between hydrological changes, vegetation-type responses, and landscape evolution remain poorly understood [24,25]. Similar gaps exist in other inland river basins: studies on the Tarim River Basin emphasize the role of the EWDP in promoting Populus euphratica forest recovery, but fail to elucidate how landscape heterogeneity regulates this process [26,27]. These limitations have hindered the development of adaptive management strategies tailored to heterogeneous arid ecosystems.
Despite notable progress, major research gaps persist. First, landscape-scale analyses often overlook vegetation-type-specific landscape patterns and their spatiotemporal evolution. Second, vegetation growth (e.g., NDVI trends) and structural landscape changes are typically assessed in isolation, limiting insights into how hydrological restoration drives ecosystem-scale recovery. Third, the temporal lag and spatial heterogeneity of vegetation responses remain insufficiently characterized. For example, although grassland expansion may signify initial recovery, the transition to shrub and arbor vegetation remains poorly understood.
To address these research gaps, an integrated approach incorporating landscape ecology, remote sensing, and hydrological science was employed to examine the spatiotemporal interactions among the EWDP, vegetation dynamics, and landscape pattern evolution. The degradation–restoration trajectories of various vegetation types were quantitatively assessed, with distinct lagged recovery patterns being identified across arbor vegetation, shrubland, and grassland ecosystems. Focusing on the Ejina Delta during the 1990–2020 period, this study was designed to (1) characterize the spatiotemporal evolution of NDVI and vegetation landscape patterns; (2) evaluate the ecological impacts of the EWDP through systematic linkages between hydrological drivers (including runoff and groundwater variations) and vegetation recovery processes; and (3) determine type-specific vegetation responses to EWDP implementation. Through the integration of NDVI metrics, landscape metrics, and LUTM analyses, new insights into vegetation dynamics in arid basins have been generated, which are expected to contribute to the formulation of adaptive, evidence-based water management strategies.

2. Study Area

The Ejina Delta, located in the lower reaches of the HRB in the arid region of Northwest China, represents a typical desert–oasis ecosystem. Its geographical range spans 98°10′E~101°40′E and 41°00′N~42°47′N, with an area of approximately 11,000 km2 (Figure 1). Characterized by a hyper-arid continental climate, the study area features scarce precipitation, intense evaporation, and extreme temperature fluctuations. Meteorological records from the Ejina Station (1961–2020) indicate a mean annual precipitation of 35.2 mm, potential evaporation of 1500 mm, and average annual temperature of 9.5 °C, with summer and winter averages of 25.6 °C and −7.6 °C, respectively. Such hyper-arid climatic conditions constrain vegetation growth, resulting in sparse, low-diversity plant communities dominated by xerophytic and halophytic desert species.
The Ejina Delta’s topography slopes northeastward from 900 to 1100 m elevation, with the lowest elevations occurring at the East and West Juyan Lakes. Downstream of the Langxinshan hydrological station, the landscape comprises interconnected fluvial distributaries (East/West Ejina Rivers), terminal lakes (East/West Juyan Lakes), and desert–gobi and riparian ecosystems supporting Populus euphratica forests, shrublands, and meadow vegetation, forming a distinctive desert ecological matrix. Vegetation types in the Ejina Delta are diverse, ranging from Populus euphratica forests to riparian arboreal-shrub communities, xerophytic shrubs, and saline–alkali-tolerant plants. Notably, Populus euphratica stands serve as keystone ecosystems for maintaining regional biodiversity and ecological stability. The spatial distribution and ecosystem resilience of these vegetation communities are primarily determined by water recharge from the Heihe River, with groundwater dynamics and soil moisture regimes being critical controlling factors.

3. Data and Methods

3.1. Data

The data used in this study are primarily composed of four categories: runoff records, landscape survey measurements, Landsat satellite imagery, and NDVI data.
Runoff Data: These were employed to analyze the impacts of runoff variations during 1990 and 2020 on vegetation degradation and recovery processes in the Ejina Delta. The annual runoff records for Langxinshan hydrological station were obtained from the Hydrological Yearbook of the People’s Republic of China. This station serves as the hydrological monitoring control point for the Heihe River’s mainstream inflow into the Ejina Delta, as shown in Figure 1.
Landscape Survey Data: The landscape survey data were obtained through a field vegetation survey conducted in the Ejina Delta in 2024. In total, 138 surveying plots were established, consisting of 77 plots surveyed by UAV-based methods and 61 plots surveyed by ground-based field methods. The plots were designed to represent the major vegetation types, including arborous, shrubby, sub-shrubby, semi-shrubby, and herbaceous vegetation. These data were employed for supervised classification.
Landsat Satellite Data: Landsat 5 and 8 satellite images (30 m resolution) were employed to classify landscape types and analyze their spatial distribution in the Ejina Delta from 1990 to 2020. Under natural conditions without human disturbance, the transition from bare ground to coverage by annual or perennial herbaceous vegetation typically requires 1 to 3 years. The establishment of dwarf woody species or shrubs generally occurs after 4 to 5 years, while the development of mature trees takes at least 10 years [28]. Given that vegetation types are relatively stable state variables, this study conducts landscape interpretation at five-year intervals. The selected interpretation years are 1990, 1995, 2000, 2005, 2010, 2015, and 2020, resulting in a total of seven time points. Additionally, the images were processed to derive NDVI values for the Ejina Delta. Landsat 5 and 8 satellite images were obtained from the United States Geological Survey (USGS), https://www.usgs.gov/landsat-missions (accessed on 11 October 2024).
NDVI Data: Vegetation growth vigor exhibits notable interannual variability. To analyze these changes in the Ejina Delta, this study utilizes Landsat imagery to calculate the annual average NDVI for each year. The NDVI is derived using the red and near-infrared (NIR) bands from Landsat 5 and Landsat 8 data, as described in Equation (1). According to the criteria proposed by Wang (2022), areas with NDVI values greater than 0.1 were classified as vegetated regions [17]. NDVI values are positively correlated with vegetation vigor, with higher values reflecting denser and healthier vegetation.
N D V I = N I R R e d N I R + R e d

3.2. Method

3.2.1. Landscape Type Changes

(1) Landscape Classification
The landscape in the Ejina Delta was classified into eight categories based on regional land cover characteristics: arbor vegetation, shrubland, grassland, bare land, lakes, farmland, artificial surfaces, and rivers. Vegetation exhibits vigorous growth during the growing season (from May to September), enhancing the accuracy and reliability of vegetation identification in remote sensing imagery. In addition, to ensure image quality and minimize the influence of cloud contamination on the interpretation of remote sensing features, it is generally required that cloud cover remains below a specified threshold. A commonly adopted standard is to use images with less than 10% cloud cover [29]. Accordingly, Landsat images acquired between May and September with cloud cover below 10% were selected for landscape interpretation. A supervised classification approach using the Random Forest (RF) algorithm was implemented through the following workflow:
Landscape Sample Preparation: Vegetation training samples (arbor vegetation, shrubland, grassland) were obtained through field vegetation surveys. Farmland areas were identified by analyzing seasonal reflectance variations in visible-light spectra between winter and summer imagery. Water bodies (lakes, rivers) were delineated using spectral index thresholding combined with visual interpretation.
RF Classification: This study employs the RF supervised classification algorithm integrated within ENVI5.6 software to identify landscape types from Landsat imagery. Based on ensemble learning principles, the algorithm utilizes bootstrap resampling to generate multiple subsets from the original training dataset. Each subset is used to train an individual decision tree, forming a forest of classifiers. Approximately 63.2% of the samples are used to train each tree, while the remaining 36.8%, known as out-of-bag data, are used for internal validation to assess the model’s generalization accuracy without relying solely on an independent validation set. During classification, the algorithm integrates multispectral band information into a multidimensional feature space and determines the final class labels using a majority voting strategy across all trees. To enhance processing efficiency for large-scale, high-resolution imagery, ENVI incorporates tile-based processing and parallel computing, which significantly optimize memory usage and computational speed. Key model parameters, such as the number of decision trees (n_estimators), maximum tree depth (max_depth), and minimum samples required to split an internal node (min_samples_split), are adaptively optimized based on out-of-bag error. Considering the balance between classification accuracy and computational cost, this study sets n_estimators to 100, while other parameters are kept at their default values [30,31].
Model Validation: In this study, the confusion matrix tool in ENVI was used to assess the classification accuracy. By comparing the classified image with independent validation ROIs, a confusion matrix was generated, and overall accuracy and the Kappa coefficient were calculated as evaluation metrics.
(2) Landscape Type Change Analysis
To analyze spatiotemporal landscape dynamics in the Ejina Delta (1990–2020), an LUTM was employed to quantify inter-class conversions and area transfers across seven five-year intervals. The LUTM provides a comprehensive representation of the inflow and outflow of various landscape types within the study area over a given period, effectively revealing the sources and transitions of each landscape type by the end of the period. This widely used method in landscape change studies can be mathematically expressed as follows [32]:
A i j = A 11 A 12 A 1 n A 21 A 22 A 2 n A n 1 A n 2 A n n
A represents the LUTM; n represents the total number of landscape types; i and j represent the landscape types at the beginning and end of the research period; and Aij represents the landscape transition from type i to j.

3.2.2. Landscape Metrics Analysis

Landscape metrics have been widely recognized as essential tools for spatial patterns in landscape ecology. As a fundamental approach for characterizing landscape patterns, these metrics systematically quantify structural and functional attributes across three hierarchical levels: patch, class, and landscape [33,34]. While patch-level metrics are used to assess individual patch characteristics and serve as the foundation for higher-level indices, their fine-scale resolution makes them less suitable for regional-scale analysis. Consequently, class-level and landscape-level metrics were selected to examine the spatiotemporal dynamics of landscape patterns in the Ejina Delta [35]. Given the simple structure, low vegetation diversity, and fragment distribution characteristics of arid desert landscapes, the following metrics are employed:
(1) Class-Level Metrics: Percentage of Landscape (PLAND), Patch Density (PD), Largest Patch Index (LPI).
(2) Landscape-Level Metrics: Number of patches (NP), Landscape Shape Index (LSI), Perimeter–Area Fractal Dimension (PAFRAC), Shannon’s Diversity Index (SHDI).
The mathematical formulations and ecological interpretations of these metrics are depicted in Table 1.

4. Results

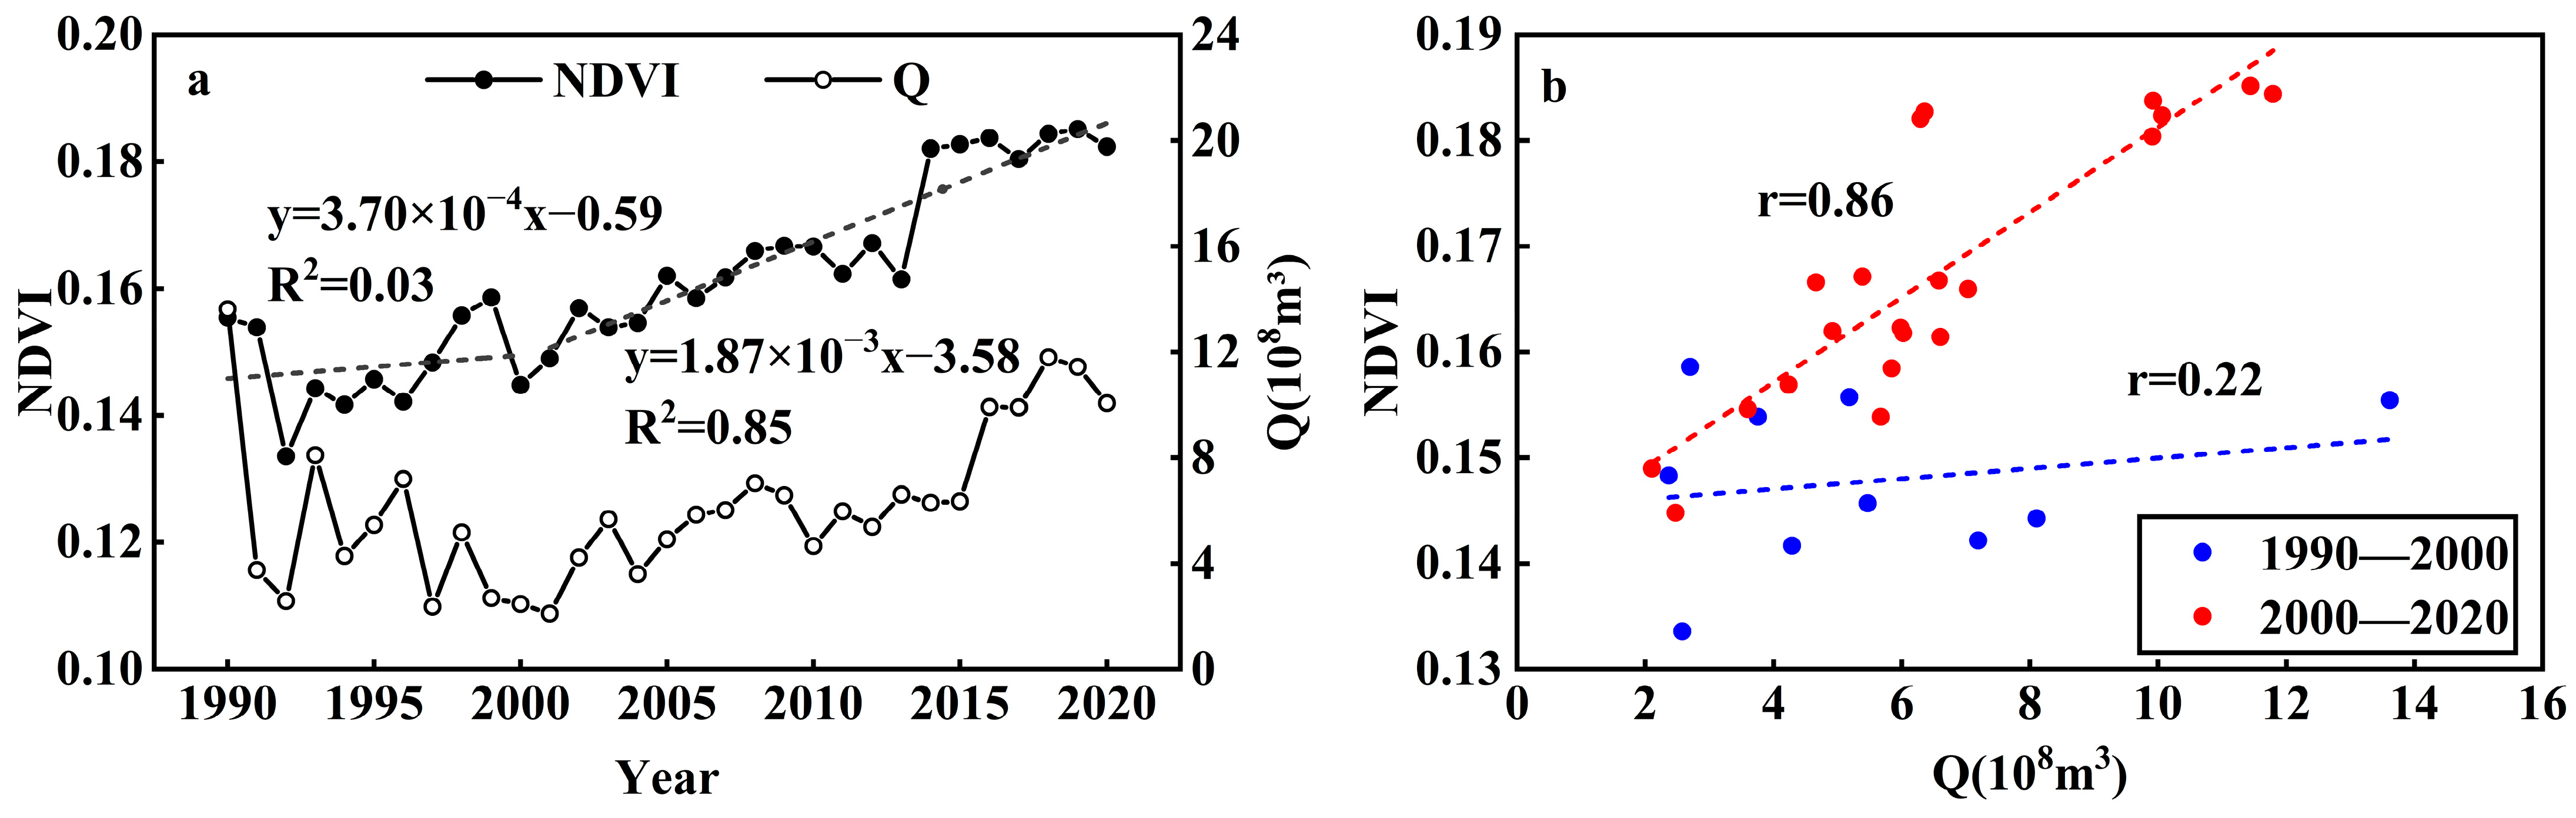
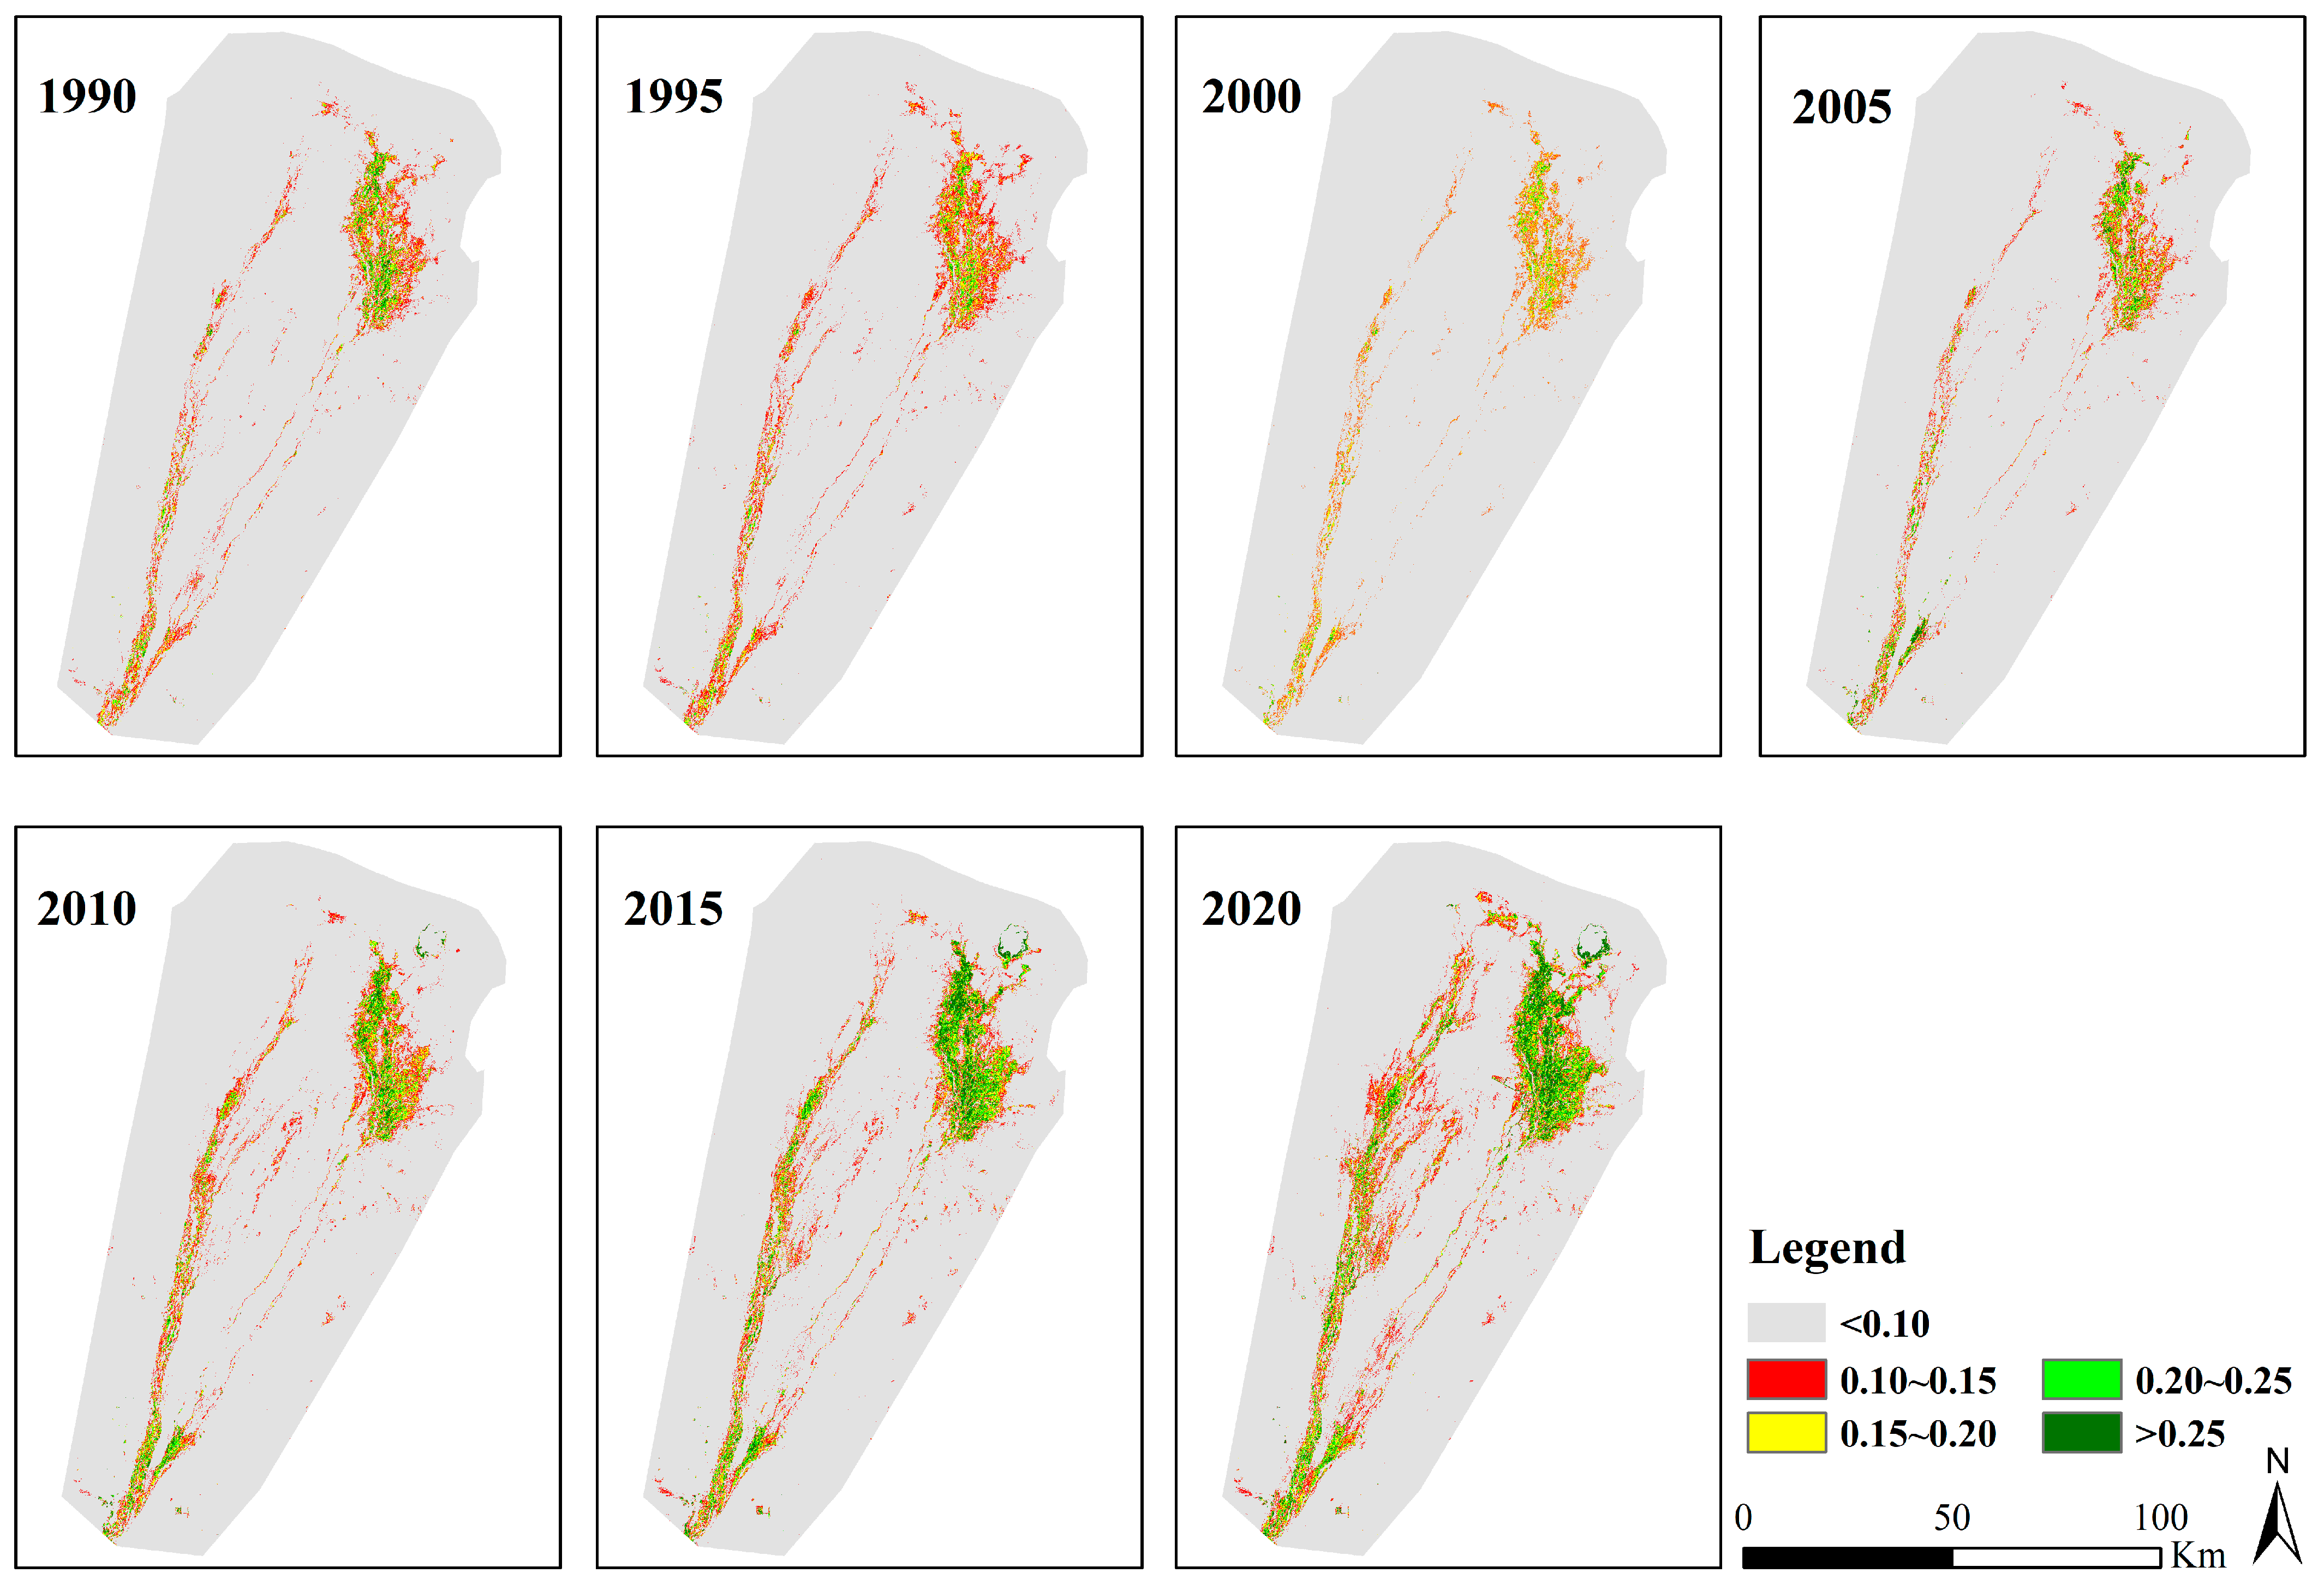
4.1. Spatiotemporal Variations in NDVI

Temporal variations in vegetation growth in the Ejina Delta from 1990 to 2020 and the correlation between runoff and NDVI are presented in Figure 2. Overall, NDVI values, ranging between 0.12 and 0.20, indicated sparse vegetation cover across the study area. During the pre-EWDP period (1990–2000), a gradual but fluctuating increase in NDVI was observed at a rate of 0.037/10 yr (R2 = 0.03, p < 0.05), suggesting that vegetation conditions had stabilized at a degraded state. After 2000, the NDVI increased at a rate of 0.0187 per decade (R2 = 0.85, p < 0.05), approximately five times faster than during the pre-EWDP period, indicating a substantial acceleration in vegetation restoration. The relationship between vegetation dynamics and runoff exhibited distinct temporal patterns. During 1990–2000, vegetation growth showed weak correlation with runoff (r = 0.22, p < 0.05), although parallel trends were evident. For example, the dramatic runoff decline (1990–1993) coincided with reduced NDVI values, while subsequent runoff increases (1994–1996) preceded vegetation recovery (1996–1999). After 2000, the correlation between NDVI and runoff strengthened considerably (r = 0.86, p < 0.05), being 4 times higher than the pre-EWDP period (Figure 2b). The correlation between runoff and vegetation significantly increased after the EWDP, indicating the restoration effect of the EWDP on vegetation in the Ejina Delta.
The spatial variation in the NDVI across the Ejina Delta (1990–2020) and the corresponding vegetation coverage classes are presented in Figure 3 and Table 2. Vegetated areas were predominantly distributed along the Ejina River in a distinct zonal pattern, with density gradually decreasing outward from the riverbanks. Three primary ecological centers were identified where NDVI values exceeded 0.25: (1) the lower reaches of the East River oasis core, (2) the periphery of East Juyan Lake, and (3) the upper reaches of the Ejina River near Langxin Mountain.
Spatial comparisons revealed that the West River consistently maintained higher NDVI values and a greater vegetated area (NDVI > 0.1) than the East River. While minimal spatial differentiation was observed in the East River’s upper and middle reaches, the West River exhibited notable declines in vegetation greenness toward its lower reaches. Temporally, vegetation degradation was evident prior to 2000, followed by progressive recovery initiating in the East River’s lower reaches before expanding westward post-2000. Three distinct temporal phases of vegetation dynamics were identified: degradation (1990–2000), recovery (2000–2015), and stabilization (2015–2020).
Degradation Phase (1990–2000): A significant expansion of bare land (NDVI < 0.1) was observed, increasing from 94.42% to 96.10%, indicating progressive desertification. Low vegetation cover (NDVI: 0.10–0.15) decreased from 3.08% to 2.47%, with a temporary peak (3.80%) in 1995. Moderate coverage (NDVI: 0.15–0.20) declined from 1.55% to 1.07%. High coverage (NDVI: 0.20–0.25) reduced from 0.69% to 0.31%, and areas with NDVI > 0.25 declined from 0.26% to 0.05%. This degradation phase was attributed to reduced runoff and the desiccation of Juyan Lake, with deteriorating hydrological conditions driving widespread vegetation decline.
Recovery Phase (2000–2015): Vegetation improvement was initiated following the implementation of the EWDP. Bare land (NDVI < 0.1) contracted from 96.10% to 90.55%. Low vegetation (NDVI: 0.10–0.15) cover increased from 2.47% to 3.80%, reflecting the emergence of newly formed fragmented vegetation patches as indicators of early recovery. Moderate coverage (NDVI: 0.15–0.20) rose from 1.07% to 2.45%. High coverage (NDVI: 0.20–0.25) expanded from 0.31% to 1.65%, and areas with NDVI > 0.25 increased substantially from 0.05% to 1.55%, particularly within the oasis core.
Stabilization Phase (2015–2020): Vegetation patterns reached a relative equilibrium with continued improvement. Bare land (NDVI < 0.1) area further declined from 90.55% to 87.18%. Low vegetation cover (NDVI: 0.10–0.15) increased from 3.80% to 5.29%, moderate coverage (NDVI: 0.15–0.20) rose from 2.45% to 3.25%, and high coverage (NDVI: 0.20–0.25) increased from 1.65% to 2.16%. The proportion of areas with NDVI > 0.25 also increased from 1.55% to 2.12%, indicating sustained vegetation recovery across the region.

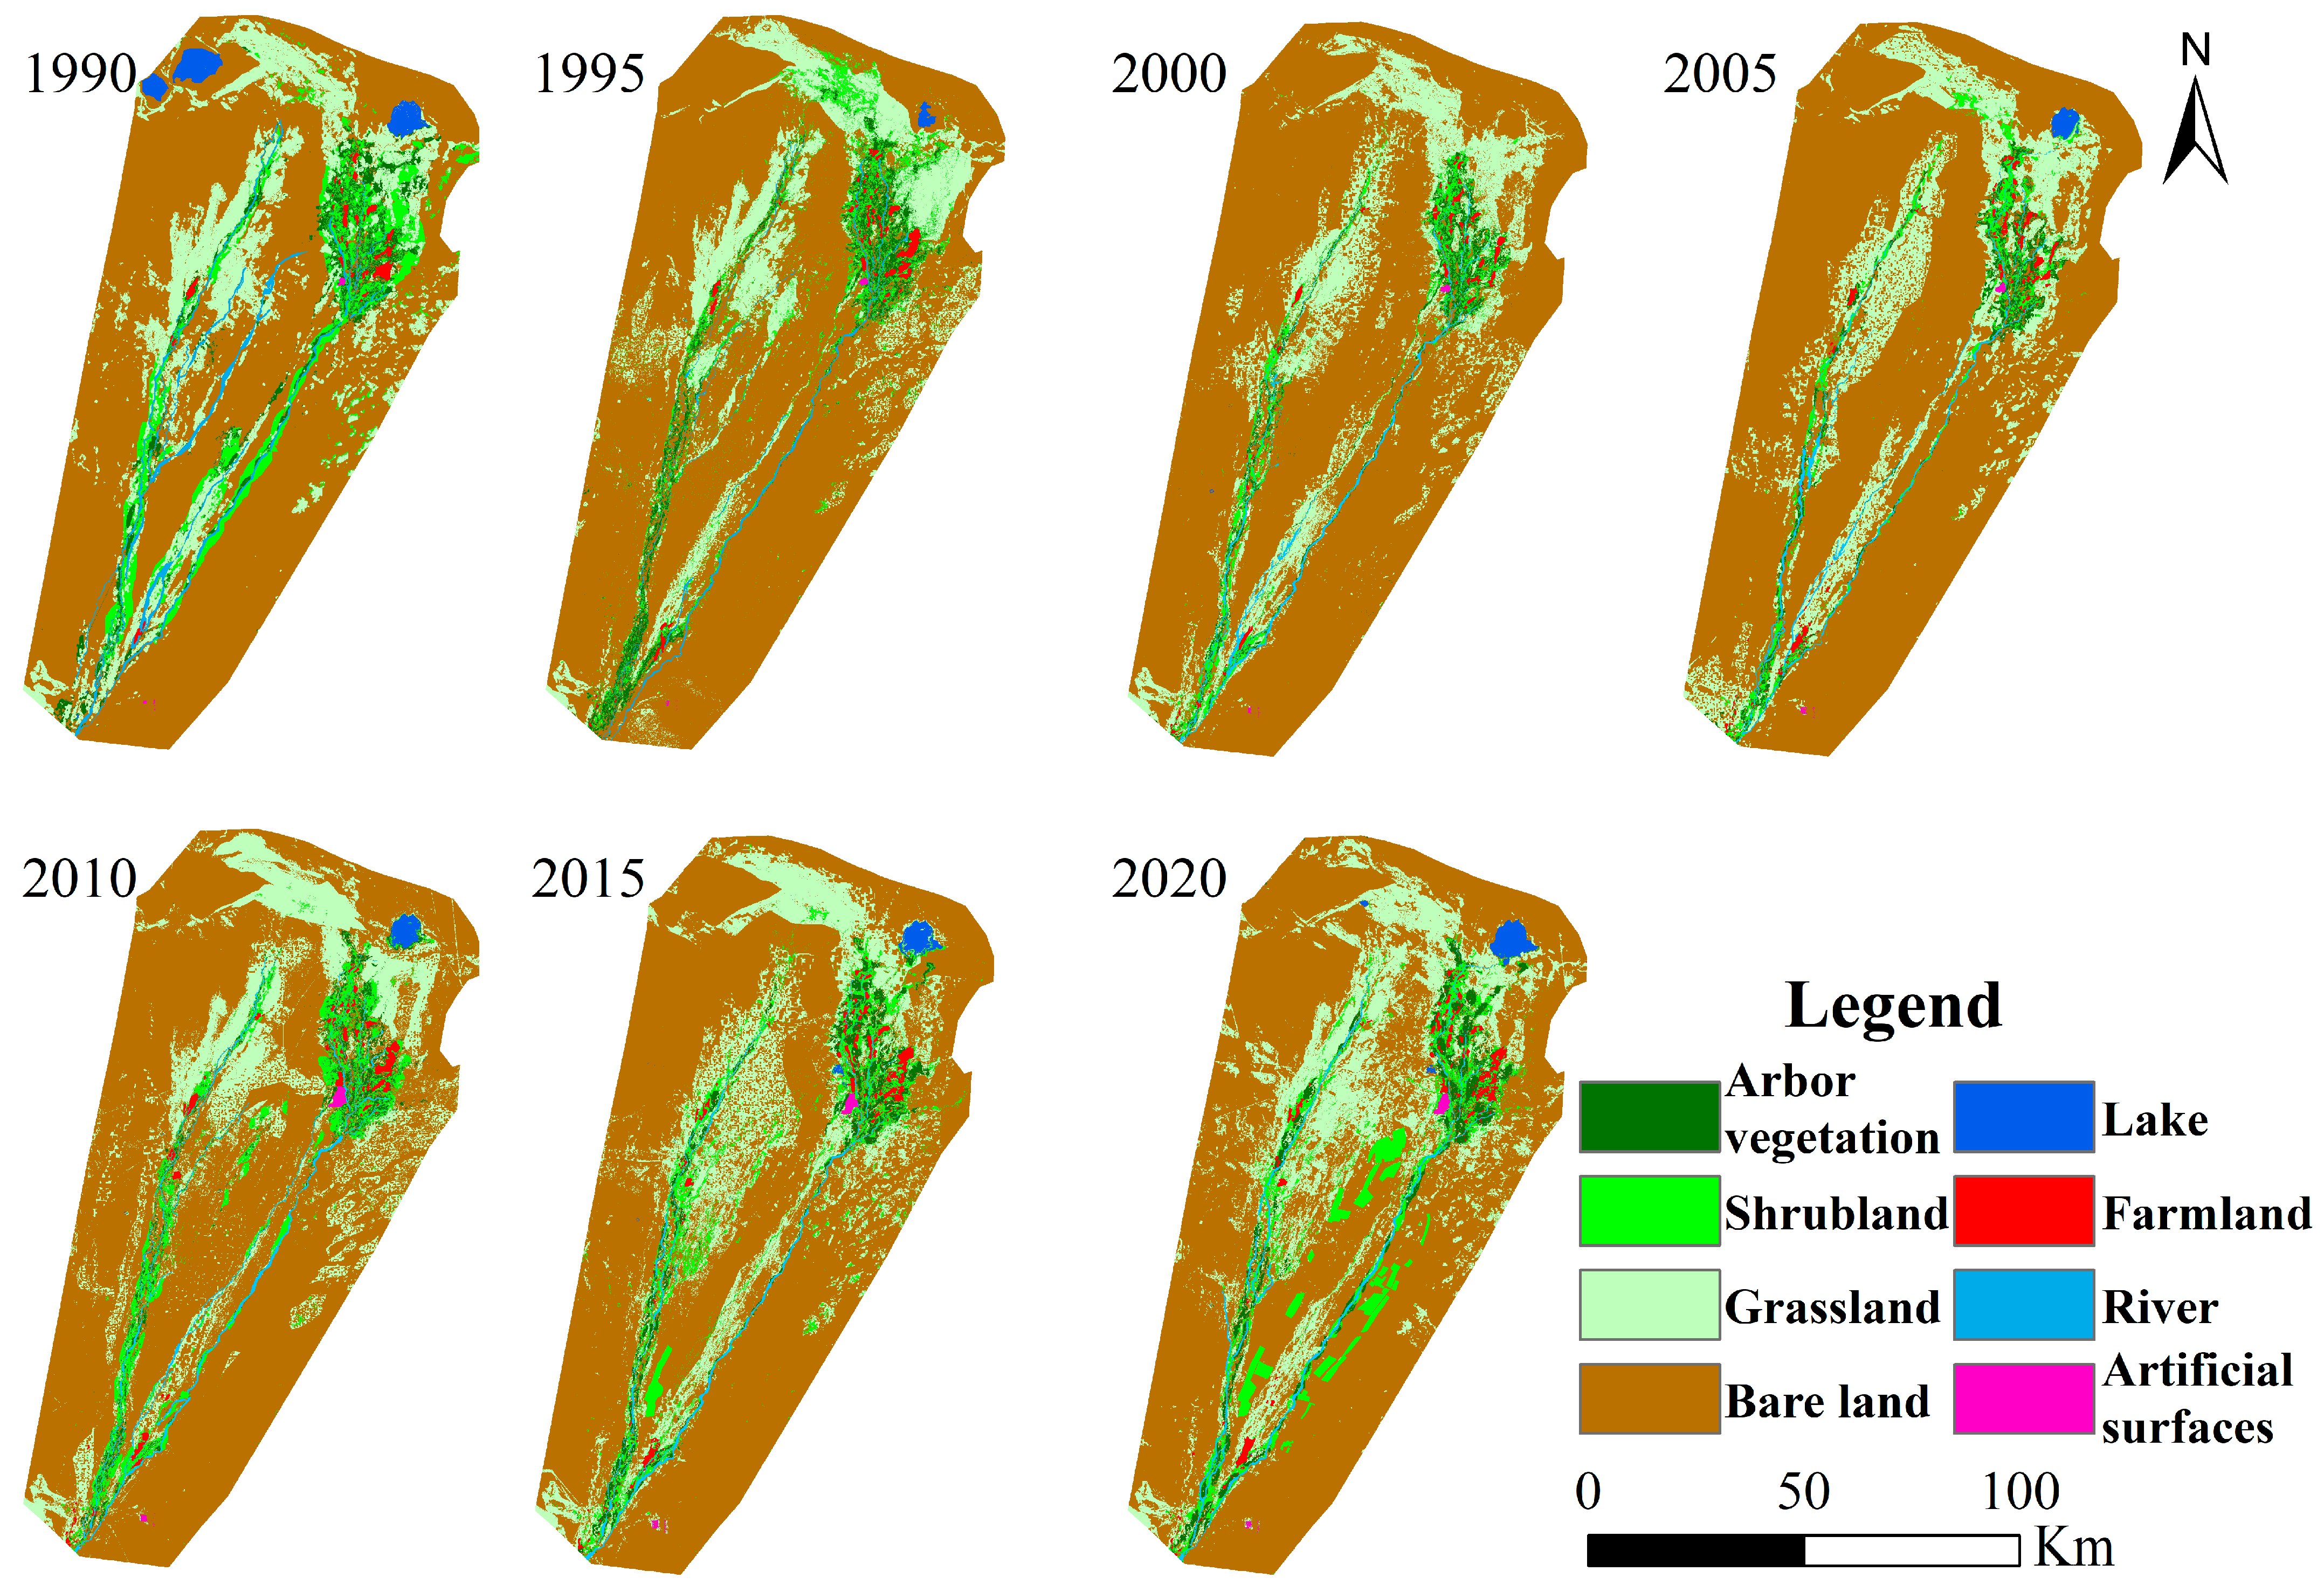
4.2. Spatiotemporal Dynamics of Landscape Patterns

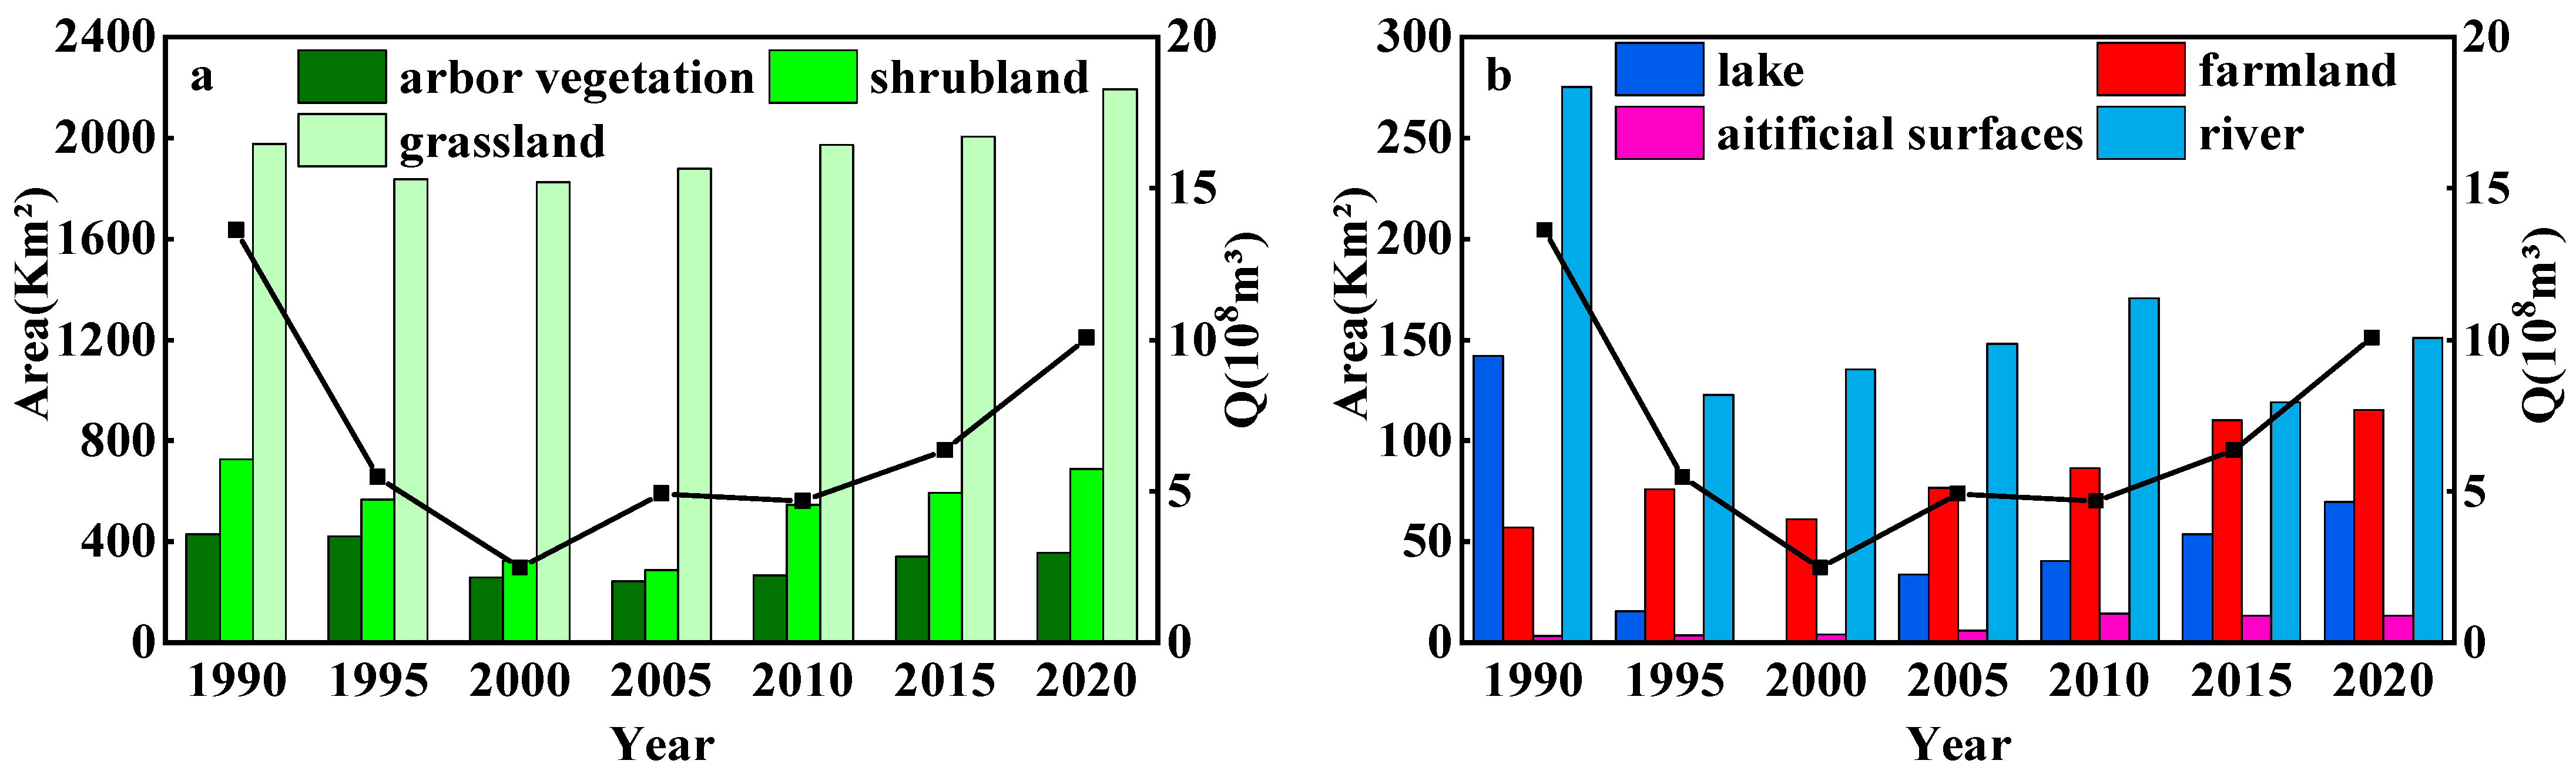
4.2.1. Landscape Dynamics Analysis

The spatiotemporal evolution of landscape types in the Ejina Delta from 1990 to 2020 is illustrated in Figure 4. The OA and Kappa coefficient for all seven images exceed 85%, indicating that the landscape classification results are reasonably reliable and of high quality. Spatially, the delta’s landscape is characterized by a triangular oasis zone centered along the East and West Rivers, with the following key spatial patterns: (1) Riparian arbor vegetation: Populus euphratica-dominated forest forms narrow linear belts along the East and West Rivers, demonstrating strong hydrological dependence. These riparian corridors were particularly well developed within 5–10 km of the river channels. (2) Shrubland distribution: Tamarix shrubland exhibited wider distribution than Populus euphratica, extending 10–20 km from the river channels. Shrub vitality was notably higher in the lower reaches of the East River compared to the upper/middle sections, while the West River supports healthier shrubs in its middle/lower reaches. (3) Grassland patterns: Grasslands were primarily distributed in areas farther from the riverbanks, gobi desert plains, and low-lying riparian/lacustrine margins. These communities displayed characteristically fragmented spatial configurations. (4) Anthropogenic landscapes: Farmland covered a small proportion (0.5–1.0%), scattered in the upper delta and the core oasis zone of the East River’s lower reaches. In addition, artificial surfaces (0.03–0.13%) were concentrated southwest of the East River’s oasis core, adjacent to the meteorological station in Figure 1. (5) Aquatic Systems: The East/West Rivers and East/West Juyan Lakes constituted the hydrological framework that structured the delta’s landscape structure.
As illustrated in Figure 5, the landscape of the Ejina Delta underwent notable transformations between 1990 and 2020. The temporal dynamics revealed three distinct phases of landscape change. (1) Vegetation dynamics: As shown in Figure 5a, arbor vegetation, shrubland, and grassland areas experienced a marked decline followed by gradual recovery, showing strong correlation with runoff variations. Before 2000, river runoff into the delta was significantly reduced due to the effects of climate change and extensive agricultural expansion in the middle reaches of the HRB, leading to widespread vegetation loss. Following the implementation of the EWDP in 2000, vegetation recovery was initiated through water redistribution to the delta. The lowest recorded values occurred in 2005 for arbor vegetation (244.3 km2) and shrubland (288.2 km2), followed by subsequent increases to 356.8 km2 and 689.5 km2, respectively, by 2020. Similarly, grassland coverage reached its minimum in 2000 (1824.3 km2), before recovering to 2192.6 km2 by 2020. Although shrubland and grassland returned to their 1990 levels, arbor vegetation remained 74 km2 below its baseline, indicating a lag in its recovery process. (2) Aquatic system changes: A dramatic reduction in aquatic areas is demonstrated in Figure 5b, with a sharp decline in lake and river areas between 1990 and 1995. Complete desiccation of both the East and West Juyan Lakes was reached by 2000. After the onset of the EWDP, the East Juyan Lake gradually regained water, reaching an area of 69.6 km2 by 2020. (3) Anthropogenic expansion: Although artificial surfaces and farmland areas constituted only 0.55–1.73% of the total landscape area, consistent expansion of both land use types is evident in Figure 5b. Residential area increased from 3.6 km2 in 1990 to 13.5 km2 in 2020, while farmland expanded from 57.0 km2 to 115.3 km2 during the same period. The expansion of farmland and artificial surfaces suggested an increase in available water resources, implying an improvement in the local ecological environment.
The landscape transition dynamics are visualized in Figure 6, detailing interconversions between different landscape types. During 1990–1995, significant reductions in grassland and shrubland areas were observed, with extensive conversion into bare land. Notably, although 420.4 km2 of bare land was transformed to grassland, the net loss of grassland due to conversion into bare land remained substantial. Arbor vegetation areas also declined, primarily degrading into bare land, with minor transitions into shrubland or grassland. Meanwhile, dramatic contraction was recorded in lake areas, while artificial surfaces and farmland remained relatively stable.
Between 1995 and 2000, a deceleration in vegetation degradation was observed. Arbor vegetation areas were primarily converted into shrubland or grassland, rather than degrading into bare land directly. Similarly, shrubland areas predominantly transitioned into grassland. At the same time, a near-complete disappearance of lakes was recorded, with most lacustrine areas being converted into bare land.
Following the implementation of the EWDP in 2000, partial vegetation recovery was observed. Between 2000 and 2005, grassland area expanded significantly, even though arbor vegetation and shrubland continued to decline. Arbor vegetation primarily transitioned into shrubland and grassland, while shrubland and grassland exhibited clear bidirectional conversions. Notably, the area of land converted from bare land to grassland exceeded the amount lost. Additionally, lake recovery began during this period, with East Juyan Lake reaching 33.8 km2.
Between 2005 and 2010, significant vegetation recovery was observed across all types. Arbor vegetation area increased to 266.7 km2, which was mainly converted from shrubland and bare land. Shrubland area expanded to 546.9 km2, which was mainly converted from grassland and bare land. Grassland area grew to 1973.1 km2, which was predominantly converted from bare land. Between 2010 and 2020, the recovery trend continued with the accelerated expansion of arbor vegetation, primarily due to conversion from shrubland. Bare land areas remained relatively stable during this period.
Overall, the Ejina Delta was found to have followed a clear “degradation–restoration” trajectory between 1990 and 2020. The EWDP was shown to significantly promote vegetation recovery. However, different vegetation types responded at different rates. Grassland demonstrated the most rapid response to improved hydrological conditions, while arbor vegetation and shrubland were delayed, responding about five years later than grassland.

4.2.2. Landscape Pattern Analysis

The landscape of the Ejina Delta is composed of vegetation, farmland, lakes, rivers, bare land, and artificial surfaces. Among these, vegetation has been identified as playing a critical role in maintaining regional ecological stability. Consequently, this study focuses on analyzing the spatiotemporal evolution of vegetation landscapes, with particular emphasis on their distinct subtypes.
As shown in Figure 7, four key landscape metrics revealed distinct evolution patterns. (1) NP exhibited a bimodal trend, initially increasing from 1990 to 1995 due to fragmentation, then decreasing as fragmented patches merged, reaching minimal fragmentation around 2005, followed by secondary aggregation. (2) LSI showed similar dynamics, with an initial increase during the degradation phase, followed by a decrease after 2000 and a subsequent increase, reflecting complexity during the recovery phase. (3) SHDI declined from 1990 to 2005, indicating reduced landscape diversity and spatial heterogeneity. After 2005, SHDI gradually increased as vegetation restoration enhanced spatial heterogeneity. (4) PAFRAC remained relatively high before the implementation of the EWDP, reflecting irregularly shaped patches formed under natural processes. After the EWDP, PAFRAC declined to its lowest point in 2005 and then steadily increased, indicating a re-establishment of more natural and complex patch geometries during vegetation recovery.
Variations in landscape metrics for arbor vegetation, shrubland, and grassland from 1990 to 2020 are depicted in Figure 8. (1) PLAND values ranged from 2.3 to 3.9% for arbor vegetation, 2.7 to 6.8% for shrubland, and 16.5 to 20.0% for grassland (Figure 8a), indicating that grassland consistently occupied the largest proportion of area, followed by shrubland, with arbor vegetation being the least abundant. All three vegetation types exhibited a consistent trend of initial decline followed by recovery. Arbor vegetation and shrubland reached their minimum PLAND in 2005, with a sharp decline in 2000, which corresponds to the degradation phase described in Section 4.2.1. By 2020, shrubland had nearly returned to its 1990 extent and grassland had exceeded its historical coverage, while arbor vegetation had not yet fully recovered, reflecting a slower restoration trajectory. (2) The LPI trends of arbor and shrub vegetation exhibited similar patterns, both showing initial decreases followed by increases, though the changes were more gradual for arbor vegetation and more pronounced for shrubs (Figure 8b). The minimum LPI for arbor vegetation occurred in 2010 (10 years post-implementation of the EWDP), while shrubland reached the minimum in 2005 (5 years post-implementation of the EWDP). This temporal disparity indicates that shrubland landscapes responded more rapidly to water resource changes and arbor vegetation showed a greater lag in hydrological response. Grassland displayed significantly higher LPI values than woody vegetation, with a reverse L-shaped trend; the value remained stable between 3 and 5 until 2015, after which it rose sharply, signifying a shift from scattered patches to increasingly consolidated grassland areas. (3) The PD dynamics are shown in Figure 8c. Arbor vegetation and grassland exhibited PD values ranging from 0 to 1.4 patches/km2, while shrubland showed considerably greater variability (0 to 8 patches/km2), suggesting a more fragmented spatial distribution. All three vegetation types displayed a bimodal PD trend. The first peak, around 1995, reflected maximum fragmentation during the degradation phase, followed by a decline as patches coalesced into larger clusters, especially for shrubland and grassland by 2005. A second PD peak emerged during the restoration phase: arbor vegetation and grassland peaked in 2010, while shrubland reached its maximum in 2015. These peaks represent the initial proliferation of new patches before their gradual coalescence into more contiguous vegetation zones.

5. Discussion

Runoff is identified as the primary driver of the vegetation landscape dynamics in the Ejina Delta [41]. According to the changing areas of vegetation types, Zhang (2011) reported that approximately 80.4% of oasis vegetation in the region had exhibited signs of recovery a decade after the initiation of the EWDP [18]. In this study, significant declines in the areas of arbor vegetation, shrubland, and grassland were observed during the period of reduced runoff between 1990 and 2000. Following the increase in runoff after 2000, grassland showed early signs of recovery, while arbor vegetation and shrubland began gradual expansion from 2005. These patterns indicate that runoff has provided critical hydrological conditions for vegetation restoration, supporting the expansion of multiple vegetation types. The results of this study are consistent with previous findings, confirming that the EWDP effectively promotes vegetation restoration in the Ejina Delta. From the perspective of landscape patterns, runoff augmentation also improved vegetation connectivity, particularly for arbor vegetation and shrubland. This trend was most clearly reflected in the LPI. The LPI of arbor vegetation initially declined but increased after 2010, while that of shrubland reached its minimum in 2005 and then showed an upward trend. These turning points demonstrated that the EWDP improved landscape connectivity for arbor vegetation and shrubland. Grassland, however, did not follow this pattern. In terms of growth vigor, NDVI recovery coincided with the implementation of the EWDP, and a positive correlation between runoff and NDVI was observed [42]. Noticeable improvements in the implementation of the EWDP have led to noticeable improvements in vegetation status. However, the response of arbor vegetation and shrubland to runoff variations exhibited a temporal lag, typically around five years.
The Ejina Delta is characterized by groundwater-dependent desert vegetation [43]. Spatially, groundwater depth is relatively shallow (<3 m) near river channels and increases with distance from rivers, which is a key feature of the groundwater distribution in the region. A pronounced north–south gradient also exists: groundwater depth increases from south to north along the river flow, ranging from 1.0 to 2.0 m in the southern part, 2.0 to 3.5 m in the central part, and 3.5 to 8.0 m in the northern part. Additionally, groundwater depth along the Western River is generally lower than that along the Eastern River [44,45]. Section 4.1 of this study reveals that areas with high vegetation cover are distributed in a belt-like pattern along the Ejina River, with NDVI values generally being higher along the Western River than the Eastern River. This indicates that areas with shallower groundwater tend to have higher NDVI values. From a temporal perspective, the relationship between groundwater depth and vegetation patterns is also evident. Zhang found that groundwater levels in the region declined from 1992 to 2003, followed by a gradual recovery from 2003 to 2010 and stabilization after 2011 [46]. Correspondingly, vegetation in the Ejina Delta experienced degradation from 1990 to 2005 and began to recover after 2005. The timing of vegetation recovery closely aligns with the rise in groundwater levels, suggesting that vegetation growth in the Ejina Delta is strongly influenced by groundwater depth: shallower groundwater is associated with better vegetation conditions. Additionally, vegetation exhibits species-specific lag responses to groundwater dynamics. Herbaceous species respond within 3–5 years, shrublands require a longer time, and trees may take over a decade to stabilize, largely due to variations in root architecture and water-use strategies [47]. In addition to groundwater depth, the interaction between groundwater dynamics and soil salinization further shapes landscape differentiation. In the early stages of the EWDP, rising groundwater tables led to soil desalinization in riparian zones, facilitating vegetation restoration. However, sustained high water tables may induce secondary salinization, restricting the growth of deep-rooted plants and forming marginal degradation zones dominated by salt-tolerant herbaceous species [48,49].
Precipitation in the Ejina Delta is extremely low, averaging only 34.2 mm/yr during 1980 and 2012 [50], which is insufficient to support vegetation growth. Therefore, groundwater is the key factor for maintaining the regional ecological ecosystem. Both runoff and precipitation primarily recharge groundwater, which in turn supports long-term vegetation development [51]. In the alluvial–proluvial plains in the central delta, rainfall contributes very little to groundwater recharge. In contrast, limited rainfall infiltration occurs in the southeastern desert areas and parts of the lacustrine plains. However, strong surface evaporation greatly reduces effective recharge. Overall, groundwater in the Ejina Delta is mainly replenished through river seepage [52]. In the context of long-term hydrological monitoring in the Ejina Delta, precipitation is not considered as a major factor influencing vegetation growth in most studies. This conclusion is supported by Li (2017), who reported that the maximum infiltration depth of rainfall in this region is less than 20 cm, which is much shallower than the root absorption depths of Populus euphratica and Tamarix [20]. As a result, the contribution of precipitation to vegetation development is negligible. River water—primarily through surface runoff and seepage—and shallow groundwater recharge remain the principal hydrological sources sustaining these deep-rooted species.

6. Conclusions

The Ejina Delta is recognized as a vital ecological barrier in Northwest China, where vegetation restoration has been significantly enhanced through the implementation of the EWDP. To evaluate landscape-scale ecological changes, this study analyzed vegetation dynamics and spatiotemporal landscape transformations through landscape metrics, land use transition matrices, and spatial analysis techniques. In addition, this study discussed how hydrological drivers have shaped vegetation degradation and restoration trajectories, with particular attention to changes in landscape types and spatial configurations.
(1) Vegetation cover in the Ejina Delta was generally sparse, with NDVI values varying within the range of 0.12 to 0.20. Spatially, high NDVI values were primarily concentrated along river corridors, and the oasis core located in the lower reaches of the East River had the largest continuous area with high NDVI values. Between 1990 and 2020, the NDVI exhibited a distinct trajectory of degradation–recovery–stabilization, with 2000 and 2015 identified as key inflection points. Overall, vegetation coverage expanded, and the high-NDVI zones became larger and more continuous, indicating substantial restoration at the landscape scale.
(2) Between 1990 and 2020, the Ejina Delta underwent significant changes in landscape types, reflecting a “degradation–restoration” pattern. Vegetation experienced both gradual decline and direct transitions into bare land. After 2000, the EWDP enhanced runoff availability, which supported the recovery of arbor vegetation, shrubland, and grassland. Grassland was the first to respond, followed by transitions from grassland to shrubland and subsequently to arbor vegetation. Arbor vegetation and shrubland exhibited delayed responses to hydrological restoration, with lag times of approximately five years.
(3) During the degradation phase, vegetation contraction led to increased fragmentation at both class and landscape levels, which was caused by patch isolation and spatial dispersion. As degradation processes advanced, the remaining vegetation gradually aggregated in localized zones. Initially, this led to an increase in patchiness, but eventually, larger contiguous clusters were formed. During the restoration phase, fragmentation briefly intensified due to the scattered emergence of vegetation patches but subsequently declined as patches merged, resulting in enhanced overall connectivity across the landscape.

Author Contributions

Conceptualization, J.Y.; methodology, C.D. and J.D.; software, J.D.; formal analysis, J.D.; investigation, C.D. and J.D.; data curation, J.D.; writing—original draft preparation, J.D.; writing—review and editing, C.D.; visualization, J.D. All authors have read and agreed to the published version of the manuscript.

Funding

This research was funded by the National Key Research and Development Program of China (Grant No. 2023YFC3206803).

Data Availability Statement

The data presented in this study are available on request from the corresponding author.

Acknowledgments

The authors would like to thank the reviewers for their constructive comments and suggestions.

Conflicts of Interest

The authors declare that they have no conflicts of interest.

References

  1. Van Der Zee, S.E.A.T.M.; Stofberg, S.F.; Yang, X.; Liu, Y.; Islam, M.N.; Hu, Y.F. Irrigation and Drainage in Agriculture: A Salinity and Environmental Perspective. In Current Perspective on Irrigation and Drainage; Kulshreshtha, S., Elshorbagy, A., Eds.; InTech: Milton, Australia, 2017; ISBN 978-953-51-2951-6. [Google Scholar]
  2. Jobbágy, E.G.; Nosetto, M.D.; Villagra, P.E.; Jackson, R.B. Water Subsidies from Mountains to Deserts: Their Role in Sustaining Groundwater-Fed Oases in a Sandy Landscape. Ecol. Appl. 2011, 21, 678–694. [Google Scholar] [CrossRef] [PubMed]
  3. Jiao, W.; Wang, L.; Smith, W.K.; Chang, Q.; Wang, H.; D’Odorico, P. Observed Increasing Water Constraint on Vegetation Growth over the Last Three Decades. Nat.Commun. 2021, 12, 3777. [Google Scholar] [CrossRef] [PubMed]
  4. Lee, J.; Yin, X.; Zhu, H.; Zheng, X. Geographical Detector-Based Research of Spatiotemporal Evolution and Driving Factors of Oasification and Desertification in Manas River Basin, China. Land 2023, 12, 1487. [Google Scholar] [CrossRef]
  5. Marasco, R.; Fusi, M.; Ramond, J.B.; Van Goethem, M.W.; Seferji, K.; Maggs-Kölling, G.; Cowan, D.A.; Daffonchio, D. The Plant Rhizosheath–Root Niche Is an Edaphic “Mini-Oasis” in Hyperarid Deserts with Enhanced Microbial Competition. ISME Commun. 2022, 2, 47. [Google Scholar] [CrossRef]
  6. Song, W.; Zhang, Y. Expansion of Agricultural Oasis in the Heihe River Basin of China: Patterns, Reasons and Policy Implications. Phys. Chem. Earth 2015, 89–90, 46–55. [Google Scholar] [CrossRef]
  7. Ngondo, J.; Mango, J.; Liu, R.; Nobert, J.; Dubi, A.; Cheng, H. Land-Use and Land-Cover (LULC) Change Detection and the Implications for Coastal Water Resource Management in the Wami–Ruvu Basin, Tanzania. Sustainability 2021, 13, 4092. [Google Scholar] [CrossRef]
  8. Zeng, J.; Cui, Y. Vegetation–Topographic Landscape and the Influence of Water and Sediment in the Shule River Basin. Atmosphere 2024, 15, 459. [Google Scholar] [CrossRef]
  9. Zhang, C.; Li, Y. Verification of Watershed Vegetation Restoration Policies, Arid China. Sci. Rep. 2016, 6, 30740. [Google Scholar] [CrossRef]
  10. Zhu, C.; Shen, Q.; Zhang, K.; Zhang, X.; Li, J. Multiscale Detection and Assessment of Vegetation Eco-Environmental Restoration Following Ecological Water Compensation in the Lower Reaches of the Tarim River, China. Remote Sens. 2022, 14, 5855. [Google Scholar] [CrossRef]
  11. Ke, H.; Tian, M.; Liang, L.; Yuan, C.; Wang, M.; Gao, Y. Analysis of Ecological Environment Changes Associate with Driving Factors in the Inland River Basin of Northwest China Based on GeoDetector. Pol. J. Environ. Stud. 2025, 34, 719–733. [Google Scholar] [CrossRef]
  12. Lu, J.; Li, L.; Jiang, E.; Gan, R.; Liu, C.; Deng, Y. Ecological Water Demand Estimations for Desert Terminal Lake Survival under Inland River Water Diversion Regulation. Water 2022, 15, 66. [Google Scholar] [CrossRef]
  13. Vasilevskiy, P.; Wang, P.; Pozdniakov, S.; Wang, T.; Zhang, Y.; Zhang, X.; Yu, J. Simulating River/Lake–Groundwater Exchanges in Arid River Basins: An Improvement Constrained by Lake Surface Area Dynamics and Evapotranspiration. Remote Sens. 2022, 14, 1657. [Google Scholar] [CrossRef]
  14. Gong, J.D.; Cheng, G.D.; Zhang, X.Y.; Xiao, H.L.; Li, X.Y. Environmental evolution in the Ejina region of the lower reaches of the Heihe River. Adv. Earth Sci. 2002, 17, 491–496. (In Chinese) [Google Scholar]
  15. Huang, F.; Wang, W.B.; Dong, G.T. Ecological priority and green development: Making the Heihe River a river of well-being. In Proceedings of the Symposium on Building Happy Rivers and Lakes in Response to New Era Water Reform; Heihe River Basin Authority, Yellow River Conservancy Commission: Heihe, China, 2021; pp. 141–144. (In Chinese). [Google Scholar]
  16. Hu, X.; Lu, L.; Li, X.; Wang, J.; Lu, X. Ejin Oasis Land Use and Vegetation Change between 2000 and 2011: The Role of the Ecological Water Diversion Project. Energies 2015, 8, 7040–7057. [Google Scholar] [CrossRef]
  17. Wang, C.; Zhang, Y.Y.; Zhao, W.Z. Eco-hydrological restoration effect of ecological water conveyance in Ejina oasis, lower reaches of the Heihe River in recent 20 years. Chin. J. Ecol. 2022, 41, 2180–2187. (In Chinese) [Google Scholar]
  18. Zhang, Y.C.; Yu, J.J.; Wang, P.; Fu, G.B. Vegetation Responses to Integrated Water Management in the Ejina Basin, Northwest China. Hydrol. Process. 2011, 25, 3448–3461. [Google Scholar] [CrossRef]
  19. Zhang, J.; Wang, P.; Liu, S.; Yu, J. Mechanism Controlling Groundwater Chemistry in the Hyper-Arid Basin with Intermittent River Flow: Insights from Long-Term Observations (2001–2023) in the Lower Heihe River, Northwest China. Front. Environ. Sci. 2024, 12, 1376443. [Google Scholar] [CrossRef]
  20. Li, Y.F.; Yu, J.J.; Lu, K.; Wang, P.; Zhang, Y.C.; Du, C.Y. Water sources of Populus euphratica and Tamarix ramosissima in Ejina Delta, the lower reaches of the Heihe River, China. Chin. J. Plant Ecol. 2017, 41, 519–528. (In Chinese) [Google Scholar]
  21. Jiao, A.; Wang, W.; Ling, H.; Deng, X.; Yan, J.; Chen, F. Effect Evaluation of Ecological Water Conveyance in Tarim River Basin, China. Front. Environ. Sci. 2022, 10, 1019695. [Google Scholar] [CrossRef]
  22. Chen, Y.; Chen, Y.; Zhu, C.; Wang, Y.; Hao, X. Ecohydrological Effects of Water Conveyance in a Disconnected River in an Arid Inland River Basin. Sci. Rep. 2022, 12, 9982. [Google Scholar] [CrossRef]
  23. Bao, H.M.; Wang, J.M.; Zhao, H.J.; Amugulang. Landscape Pattern Dynamic Changes in the Core Area of Ejina Oasis after Heihe Water Allocation. For. Inventory Plann. 2015, 40, 36–41. (In Chinese) [Google Scholar]
  24. Zhang, G.; Su, X.; Singh, V.P.; Ayantobo, O.O. Modeling NDVI Using Joint Entropy Method Considering Hydro-Meteorological Driving Factors in the Middle Reaches of Hei River Basin. Entropy 2017, 19, 502. [Google Scholar] [CrossRef]
  25. Triplett, A.; Condon, L.E. Climate-Warming-Driven Changes in the Cryosphere and Their Impact on Groundwater–Surface-Water Interactions in the Heihe River Basin. Hydrol. Earth Syst. Sci. 2023, 27, 2763–2785. [Google Scholar] [CrossRef]
  26. Lv, Z.; Li, S.; Xu, X.; Lei, J.; Peng, Z. Ecological Risk Assessment of Landscape in Arid Area Watersheds under Ecological Water Conveyance: A Case Study of Taitema Lake. Heliyon 2024, 10, e29575. [Google Scholar] [CrossRef]
  27. Zhang, P.; Deng, X.; Long, A.; Xu, H.; Ye, M.; Li, J. Change in Spatial Distribution Patterns and Regeneration of Populus Euphratica under Different Surface Soil Salinity Conditions. Sci. Rep. 2019, 9, 9123. [Google Scholar] [CrossRef]
  28. Liu, B.; Song, W. Mapping Abandoned Cropland Using Within-Year Sentinel-2 Time Series. Catena 2023, 223, 106924. [Google Scholar] [CrossRef]
  29. Zuo, L.J.; Xu, J.Y. Spatial-Temporal Land Use Change and Landscape Response in Bohai Sea Coastal Zone Area. Natl. Remote Sens. Bull. 2011, 15, 604–620. [Google Scholar]
  30. Yan, R.; Wang, S.; Du, Y. Development of a Two-Stage Ship Fuel Consumption Prediction and Reduction Model for a Dry Bulk Ship. Transp. Res. E Logist. Transp. Rev. 2020, 138, 101930. [Google Scholar] [CrossRef]
  31. Chen, D.; Zheng, J.; Wei, G.-W.; Pan, F. Extracting Predictive Representations from Hundreds of Millions of Molecules. J. Phys. Chem. Lett. 2021, 12, 10793–10801. [Google Scholar] [CrossRef]
  32. Liu, Y.; Wang, Y.; Lin, Y.; Ma, X.; Guo, S.; Ouyang, Q.; Sun, C. Habitat Quality Assessment and Driving Factors Analysis of Guangdong Province, China. Sustainability 2023, 15, 11615. [Google Scholar] [CrossRef]
  33. Zhang, Y.; Su, T.; Ma, Y.; Wang, Y.; Wang, W.; Zha, N.; Shao, M. Forest Ecosystem Service Functions and Their Associations with Landscape Patterns in Renqiu City. PLoS ONE 2022, 17, e0265015. [Google Scholar] [CrossRef] [PubMed]
  34. Niu, H.; Zhao, X.; Xiao, D.; Liu, M.; An, R.; Fan, L. Evolution and Influencing Factors of Landscape Pattern in the Yellow River Basin (Henan Section) Due to Land Use Changes. Water 2022, 14, 3872. [Google Scholar] [CrossRef]
  35. Zhang, L.Y.; Xia, J.S.; Ye, W.H. Discussion on Selection of Landscape Pattern Analysis Indices. Yunnan Geogr. Environ. Res. 2008, 20, 38–43. (In Chinese) [Google Scholar]
  36. Sertel, E.; Topaloğlu, R.; Şallı, B.; Yay Algan, I.; Aksu, G. Comparison of Landscape Metrics for Three Different Level Land Cover/Land Use Maps. IJGI 2018, 7, 408. [Google Scholar] [CrossRef]
  37. Luo, Y.; Wang, Z.; Zhou, X.; Hu, C.; Li, J. Spatial-Temporal Driving Factors of Urban Landscape Changes in the Karst Mountainous Regions of Southwest China: A Case Study in Central Urban Area of Guiyang City. Sustainability 2022, 14, 8274. [Google Scholar] [CrossRef]
  38. Cao, Y.; Li, Y.; Li, X.; Wang, X.; Dai, Z.; Duan, M.; Xu, R.; Zhao, S.; Liu, X.; Li, J.; et al. Relationships between the Visual Quality and Color Patterns: Study in Peri-Urban Forests Dominated by Cotinus Coggygria Var. Cinerea Engl. in Autumn in Beijing, China. Forests 2022, 13, 1996. [Google Scholar] [CrossRef]
  39. Li, F.; Zheng, W.; Wang, Y.; Liang, J.; Xie, S.; Guo, S.; Li, X.; Yu, C. Urban Green Space Fragmentation and Urbanization: A Spatiotemporal Perspective. Forests 2019, 10, 333. [Google Scholar] [CrossRef]
  40. Xu, G.; Ren, X.; Yang, Z.; Long, H.; Xiao, J. Influence of Landscape Structures on Water Quality at Multiple Temporal and Spatial Scales: A Case Study of Wujiang River Watershed in Guizhou. Water 2019, 11, 159. [Google Scholar] [CrossRef]
  41. Jin, X.M.; Schaepman, M.; Clevers, J.; Su, Z.; Hu, G. Correlation Between Annual Runoff in the Heihe River to the Vegetation Cover in the Ejina Oasis (China). Arid Land Res. Manag. 2010, 24, 31–41. [Google Scholar] [CrossRef]
  42. Gao, G.L.; Zhang, X.Y.; Yu, T.F. Land cover change and its driving forces in the Ejin Oasis during 1987–2008. J. Desert Res. 2015, 35, 821–828. (In Chinese) [Google Scholar]
  43. Zhang, H.; Xue, L.; Wei, G.; Dong, Z.; Meng, X. Assessing Vegetation Dynamics and Landscape Ecological Risk on the Mainstream of Tarim River, China. Water 2020, 12, 2156. [Google Scholar] [CrossRef]
  44. Song, D.; Pei, X.; Mao, L.; Wang, J.; Tian, Y.; An, X.; An, H. Study on the Spatial–Temporal Variation of Groundwater Depth and Its Impact on Vegetation Coverage in Ejina Oasis. Forests 2024, 15, 2034. [Google Scholar] [CrossRef]
  45. Wang, P.; Yu, J.; Zhang, Y.; Fu, G.; Min, L.; Ao, F. Impacts of Environmental Flow Controls on the Water Table and Groundwater Chemistry in the Ejina Delta, Northwestern China. Environ. Earth Sci. 2011, 64, 15–24. [Google Scholar] [CrossRef]
  46. Zhang, Z.Y.; Zhao, P.; Chang, X.S.; Wang, Y.Z.; Dong, G.T. Analysis of Groundwater Depth Change in Ejina Oasis from 1992 to 2015. Yellow River 2019, 41, 33–37. (In Chinese) [Google Scholar]
  47. Troch, P.A.; Dwivedi, R.; Liu, T.; Meira Neto, A.A.; Roy, T.; Valdés-Pineda, R.; Durcik, M.; Arciniega-Esparza, S.; Breña-Naranjo, J.A. Catchment-Scale Groundwater Recharge and Vegetation Water Use Efficiency. Hydrol. Earth Syst. Sci. 2018, 1–46. [Google Scholar] [CrossRef]
  48. Acharya, B.S.; Kharel, G.; Zou, C.B.; Wilcox, B.P.; Halihan, T. Woody Plant Encroachment Impacts on Groundwater Recharge: A Review. Water 2018, 10, 1466. [Google Scholar] [CrossRef]
  49. Peng, L.; Wan, Y.; Shi, H.; Anwaier, A.; Shi, Q. Influence of Climate, Topography, and Hydrology on Vegetation Distribution Patterns—Oasis in the Taklamakan Desert Hinterland. Remote Sens. 2023, 15, 5299. [Google Scholar] [CrossRef]
  50. Nian, Y.Y.; Wang, X.L.; Cai, D.H. Analysis on Climate and Ecological Environment Change in the Ejin Delta, the Lower reaches of the Heihe River. J. Arid. Meteorol. 2015, 33, 28–37. (In Chinese) [Google Scholar]
  51. Wang, P.; Yu, J.; Zhang, Y.; Liu, C. Groundwater Recharge and Hydrogeochemical Evolution in the Ejina Basin, Northwest China. J. Hydrol. 2013, 476, 72–86. [Google Scholar] [CrossRef]
  52. Xu, R.Z.; Wei, S.B.; Li, C.Y.; Cheng, X.X.; Zhou, X.Y. Groundwater circulation in the Ejina Plain: Insights from hydrochemical and environmental isotope studies. Earth Sci. Front. 2023, 30, 440–450. (In Chinese) [Google Scholar]
Figure 1. Geographic overview of the Ejina Delta.
Remotesensing 17 01843 g001
Figure 2. Temporal variations in runoff and NDVI in the Ejina Delta from 1990 to 2020. (a) The variation trend of runoff and NDVI; (b) correlation relationship between runoff and NDVI.
Remotesensing 17 01843 g002
Figure 3. Spatial variation in NDVI in the Ejina Delta (1990–2020).
Remotesensing 17 01843 g003
Figure 4. Spatial variations in landscape types in the Ejina Delta from 1990 to 2020.
Remotesensing 17 01843 g004
Figure 5. Variations in various landscape types in the Ejina Delta from 1990 to 2020. (a) Vegetation; (b) lakes, farmland, artificial surfaces, and rivers.
Remotesensing 17 01843 g005
Figure 6. The interconversions between different landscape types in the Ejina Delta from 1990 to 2020.
Remotesensing 17 01843 g006
Figure 7. Changes in landscape-level metrics in the Ejina Delta from 1990 to 2020.
Remotesensing 17 01843 g007
Figure 8. Changes in class-level metrics in the Ejina Delta from 1990 to 2020. (a) PLAND values of arbor vegetation, shrubland, and grassland; (b) LPI values of arbor vegetation, shrubland, and grassland; (c) PD values of arbor vegetation, shrubland, and grassland.
Remotesensing 17 01843 g008
Table 1. Summary of landscape metrics in this study.
Landscape MetricLevelFormulationInterpretations
PLANDClass Level C A A × 100 :   C A indicates the total area of a certain type of patch; A indicates the total area of landscape.The proportion of the area of a certain type of landscape (0–100). The larger the value, the larger the area of this type [36].
PDClass Level N i / A :   N i represents the number of patches in the type i of landscape; A indicates the total area of landscape.The number patches per unit area. The larger the value, the higher the degree of fragmentation [37].
LPIClass Level a m a x A × 100 :   a m a x indicates the area of the largest patch in a certain type of landscape; A indicates the total area of landscape.The proportion of the largest patch in a patch type to the entire landscape area. The larger of the value, the larger the area of patch contiguity [37].
NPLandscape Level i = 1 m N i :   N i indicates number of patches representing type i.The heterogeneity of the landscape. The greater the number of patches, the more fragmented the landscape [38].
LSILandscape Level Σ k = 1 m e i k 4 A : m indicates the number of patch types; e i k indicates the total length of adjacent patches between type i and type k.The complex shape of the landscape. The larger the value, the more irregular the shape, the higher the landscape complexity, and the lower the stability [39].
PAFRACLandscape Level 2 / [ Σ i = 1 n Σ j = 1 m ( ln P i j × ln A i j ) Σ i = 1 n Σ i = 1 m ln P i j Σ i = 1 n Σ i = 1 m ln A i j ] n i Σ i = 1 n Σ j = 1 m ln P i j 2 Σ i = 1 n Σ i = 1 m ln P i j :   a i j indicates the area of patch ij; Pij indicates the circumference of patch ij; n i indicates the number of patches.The degree of complexity of the landscape type. The larger the value, the more complex the shape of the landscape, and the more natural the landscape [40].
SHDILandscape Level Σ i = 1 m P i ln P i :   P i indicates the probability of patch type i appearing in the landscape; m indicates types of patches in the landscape.The richness of landscape components and the dynamic changes in the proportion of distinct landscape classes (>0). The larger the value, the more diverse the landscape types, and the higher the degree of heterogeneity [40].
Table 2. Changes in vegetation coverage (NDVI) in the Ejina Delta (1990–2020).
YearBare Land
(<0.10)
Low Coverage
(0.10–0.15)
Moderate Coverage
(0.15–0.20)
High Coverage
(0.20–0.25)
Higher Coverage
(>0.25)
199094.42%3.08%1.55%0.69%0.26%
199593.96%3.80%1.60%0.54%0.10%
200096.10%2.47%1.07%0.31%0.05%
200595.21%2.46%1.32%0.65%0.36%
201092.54%3.55%2.13%1.10%0.68%
201590.55%3.80%2.45%1.65%1.55%
202087.18%5.29%3.25%2.16%2.12%
Disclaimer/Publisher’s Note: The statements, opinions and data contained in all publications are solely those of the individual author(s) and contributor(s) and not of MDPI and/or the editor(s). MDPI and/or the editor(s) disclaim responsibility for any injury to people or property resulting from any ideas, methods, instructions or products referred to in the content.

