Article

A Deep Learning-Based Solution to the Class Imbalance Problem in High-Resolution Land Cover Classification

1
College of Earth and Environmental Sciences, Lanzhou University, Lanzhou 730000, China
2
Key Laboratory of Western China’s Environmental System, Ministry of Education, Lanzhou 730000, China
3
Mapping Institution of Gansu Province, Lanzhou 730000, China
*
Author to whom correspondence should be addressed.
Remote Sens. 2025, 17(11), 1845; https://doi.org/10.3390/rs17111845
Submission received: 17 March 2025 / Revised: 14 May 2025 / Accepted: 22 May 2025 / Published: 25 May 2025

Abstract

:
Class imbalance (CI) poses a significant challenge in machine learning, characterized by a substantial disparity in sample sizes between majority and minority classes, leading to a pronounced “long-tail effect” in statistical distributions and subsequent inference processes. This issue is particularly acute in high-resolution land cover classification within arid regions, where CI tends to bias classification outcomes towards majority classes, often at the expense of minority classes. Recent advancements in deep learning have opened new avenues for tackling the CI problem in this context, focusing on three key aspects: the semantic segmentation model, loss function design, and dataset composition. To address this issue, we propose the high-resolution U-shaped mamba network (HRUMamba), which integrates multiple innovations to enhance segmentation performance under imbalanced conditions. Specifically, HRUMamba adopts a pre-trained HRNet as the encoder for capturing fine-grained local features and incorporates a modified scaled visual state space (SVSS) block in the decoder to model long-range dependencies effectively. An adaptive awareness fusion (AAF) module is embedded within the skip connections to enhance target saliency. Additionally, we introduce a synthetic loss function that combines cross-entropy loss, Dice loss, and auxiliary loss to improve optimization stability. To quantitatively assess multi-class imbalance, we introduce the coefficient of variation (CV) as a novel evaluation metric. Experimental results on the ISPRS Vaihingen and Minqin datasets demonstrate the robustness and effectiveness of HRUMamba in mitigating CI. The proposed model achieves the highest mF1 scores of 92.25% and 89.88%, along with the lowest CV values of 0.0445 and 0.0574, respectively, outperforming state-of-the-art methods. These innovations underscore the potential of HRUMamba in advancing high-resolution land cover classification in imbalanced datasets.

Graphical Abstract

1. Introduction

Class imbalance (CI) is a long-standing and challenging issue in the field of machine learning, characterized by a significantly greater number of samples in majority classes compared to minority classes. This imbalance can lead to statistical bias and the “long-tail effect” during training, validation, and even final evaluation stages [1,2,3]. The CI problem is pervasive across various domains, including fraud detection, medical diagnosis, anomaly detection in manufacturing, and computer vision [4,5,6]. In high-resolution remote sensing image interpretation, CI exhibits a dual-layered complexity, manifesting as binary imbalance (e.g., in object detection, change detection, and small object recognition tasks [7,8]) and multi-class imbalance (e.g., in land cover classification tasks [9]). In particular, land cover classification is prone to long-tail distributions due to significant disparities in the area, morphology, and spatial distribution of different land types during data acquisition [7,10,11]. For example, in arid oasis regions, the desert area greatly exceeds that of the oasis; rural areas cover much more land than central urban zones; and forests and farmlands are typically far more extensive than artificial structures such as buildings and roads [12,13]. Therefore, the CI problem poses a serious constraint on the reliability of land cover products in applications such as urban planning, agricultural production, and disaster early warning.
To address this problem, existing research mainly focuses on three aspects: model innovation, loss function design, and data optimization strategies. However, significant bottlenecks still exist due to the characteristics of the field and the lack of synergy between these approaches. In terms of model innovation, efforts are primarily directed towards enhancing the model’s ability to express the features of minority classes by introducing structures such as attention mechanisms, multi-scale feature extraction, and long- anshort-range contextual relationship modeling. For example, Hu et al. [14] proposed the ASPP+-LANet model to leverage an improved atrous spatial pyramid pooling (ASPP) module to handle multi-scale semantic information, while the incorporated collaborative attention mechanism helps improve segmentation performance for ground object targets at different scales. Zheng et al. [15] embedded foreground–background relationship modules and foreground-aware optimization modules in the FarSeg model, which enhances foreground features while suppressing background noise. However, most of these models do not simultaneously address the other two aspects. Additionally, they still rely on convolutional neural networks (CNNs), which have a limited receptive field and restrict the model’s ability to model global spatial context. This, in turn, affects the model’s performance in distinguishing minority class targets in complex scenes.
The design of loss functions for addressing the CI problem has evolved from static class weighting [16,17] to dynamic gradient calibration [18,19]. For example, focal loss (FL) [20] introduces a adjustment factor into the cross-entropy loss, enabling the model to focus more on misclassified samples during training, thereby alleviating the imbalance between positive and negative samples. However, during backpropagation, FL often suffers from the problem of gradient vanishing. To address this, dual focal loss [21] improves the loss scaling mechanism and incorporates a regularization term to mitigate the issue of gradient diffusion, better constraining the number of negative samples and further reducing the loss of hard-to-classify classes. Nevertheless, solutions at this level still face three major limitations: first, fixed weight assignment (e.g., inverse class frequency) cannot adapt to the intra-class heterogeneity of remote sensing data; second, a single loss function cannot effectively account for the segmentation accuracy of multiple classes; third, task-specific losses are not well-suited for semantic segmentation tasks, which reduces the stability of model optimization.
Data optimization strategies include methods such as sampling [22], data augmentation [23], and data synthesis based on generative models [24]. For example, SMOTE increases the number of minority class samples through oversampling by generating new samples, thereby reducing the model’s bias toward majority classes [25]. However, this method is mostly based on numerical data and is not well suited for remote sensing visual tasks [26]. Generative methods often employ generative adversarial networks to produce new minority class samples [27], but these approaches often face issues such as insufficient realism of generated samples and distortion of spatial relationships between land cover types. In addition, given the importance of CI evaluation, researchers commonly use metrics such as F1 score, False Discovery Rate (FDR), G-mean, and ROC curve to assess model classification performance [28,29,30]. However, these metrics are more suitable for binary imbalance problems and lack evaluation indicators tailored to multi-class imbalance scenarios.
To address the above problems, we propose a comprehensive solution of collaborative model innovation, loss function design, and sample dataset optimization. The main contributions of this study are as follows:
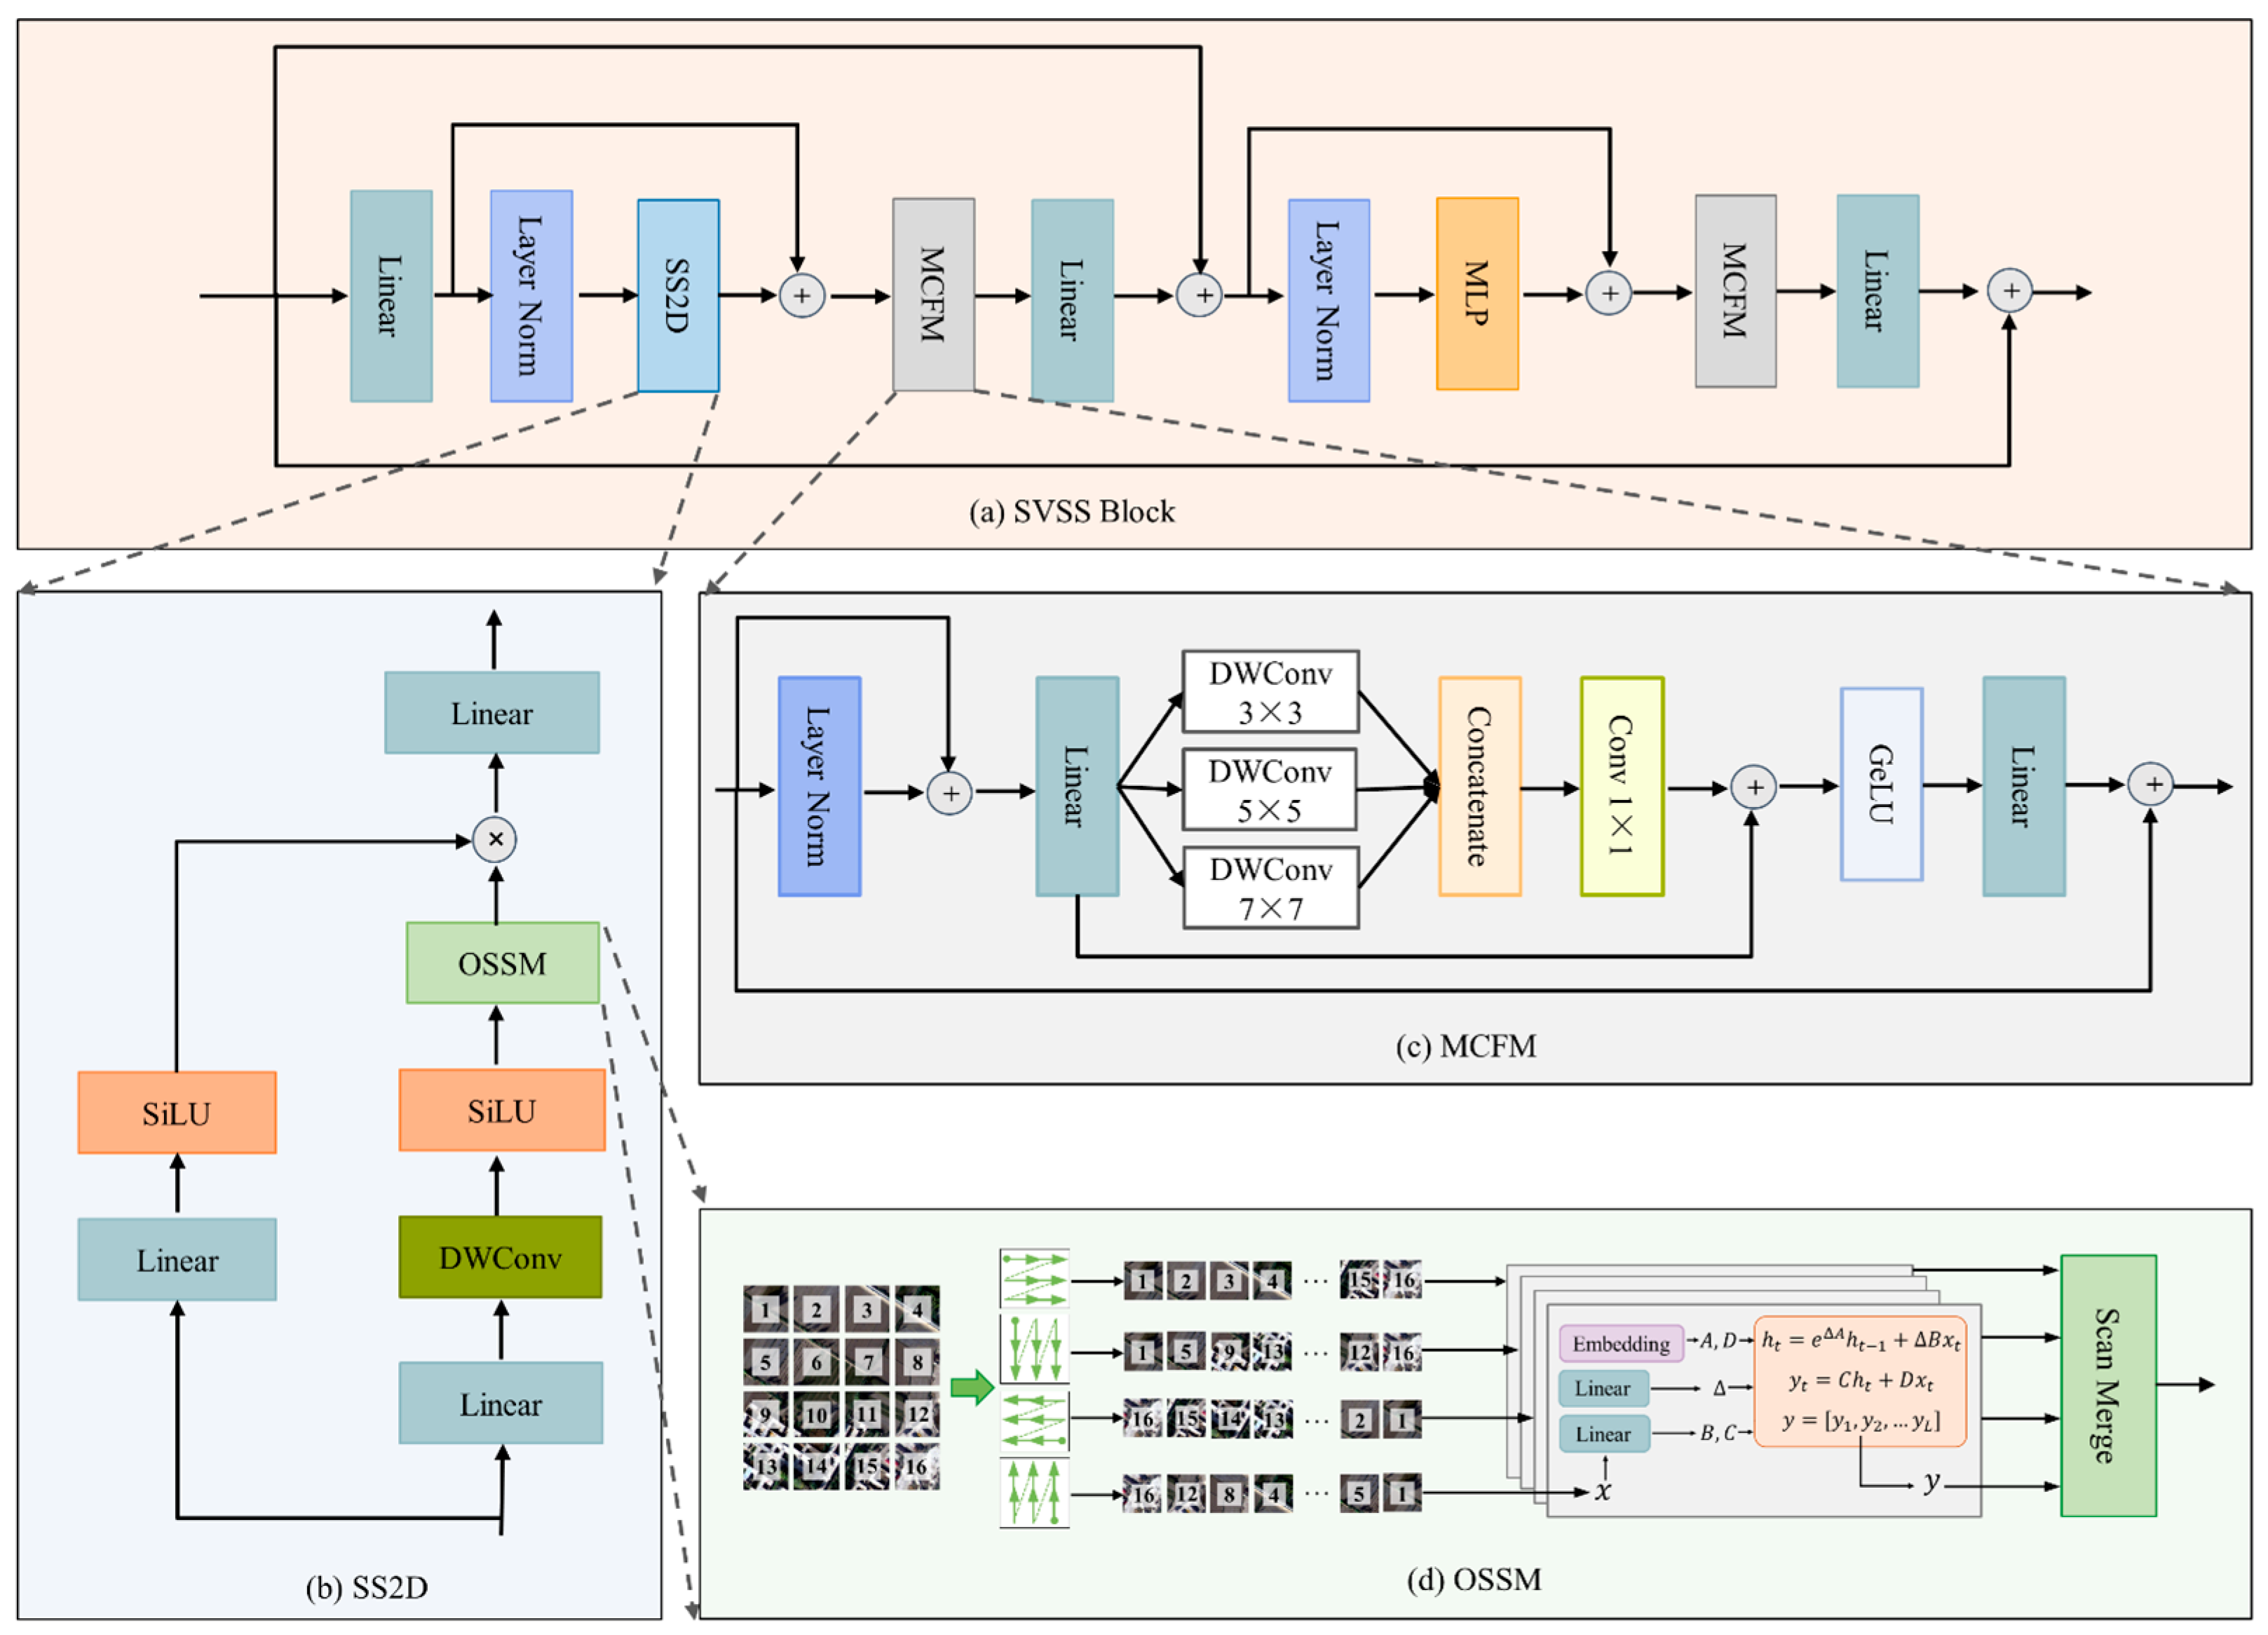
  • At the model level, we propose a high-resolution U-shaped mamba (HRUMamba) network to tackle the CI problem. This model employs the existing HRNet as the encoder to extract fine-grained short-range contextual features at multiple scales while preserving detailed information of small targets through feature fusion. The decoder incorporates a newly designed scaled visual state space (SVSS) block, which enhances long-range dependency modeling using the state-of-the-art mamba technique. Within the SVSS block, a novel multi-convolution fusion (MCF) module is proposed, leveraging multiple depthwise convolutions to further enhance inter-class discriminability across different spatial scales. Moreover, we embed three newly proposed attention-based adaptive awareness fusion (AAF) modules into the skip connections to effectively enhance object saliency while mitigating noise interference.
  • At the loss function level, we design a novel synthetic loss function consisting of a primary loss and an auxiliary loss. The primary loss, composed of cross-entropy loss and Dice loss, is mainly used to suppress CI problems in semantic segmentation. The auxiliary loss provides additional supervisory signals for the primary loss, thereby improving model performance and convergence speed.
  • At the sample dataset optimization level, we affine-transform the minority class samples in the training set by a certain pixel scale threshold to increase the number of minority class samples. Then, the Mosaic data augmentation technique is used in the training stage to increase the data diversity by splicing new images to help the model better learn different scene features.
  • In this study, the coefficient of variation (CV) is introduced for the first time as a new metric for multi-class imbalance evaluation. This metric provides a robust and standardized approach for assessing CI in complex multi-class land cover classification scenarios, addressing a critical gap in existing evaluation methods.
The remainder of this paper is organized as follows. Section 2 provides a comprehensive review of existing approaches addressing the CI problem in high-resolution remote sensing image interpretation. Section 3 presents the proposed HRUMamba model, including its architectural framework, key components, and the CV metric for CI evaluation. Section 4 systematically validates the proposed methodology through extensive ablation studies to demonstrate its effectiveness in mitigating CI, followed by comparative experiments against state-of-the-art models. Section 5 discusses critical issues and implications arising from the study, along with potential directions for future research. Finally, Section 6 concludes the paper by summarizing the key contributions and findings of this work.

2. Related Work

According to existing literature, methods for addressing the CI problem in semantic segmentation tasks can be categorized into three levels: model innovation, loss function design, and data optimization strategies.

2.1. Model Architecture for Addressing the CI Problem

Over the past decade, rapidly evolving deep learning-based methods have been used to solve CI problems arising in tasks such as remote sensing object detection, change detection, small target identification, and land cover classification [31,32,33,34]. Most existing land cover classification approaches are dominated by deep semantic segmentation methods, which are particularly affected by multi-class imbalance problems. To enhance the model’s ability to recognize small objects and minority classes, researchers have proposed numerous semantic segmentation models that integrate multi-scale feature extraction and attention mechanisms based on classical CNN architectures such as FCN [35], UNet [36], DeepLabV3+ [37], and HRNet [38]. For example, Huang et al. [39] utilized an improved residual mesh in the proposed GRRNet model to extract local features and introduced gated feature labeling units to filter unnecessary background information. Ma et al. [40] introduced a foreground activation branch in the proposed FactSeg model to enhance the perception of small target features. Wang et al. [41] utilized parallel dilated convolution and scale attention to extract multi-scale features in the proposed UCSANet model; a newly designed weight map strategy in the model can improve the feature learning ability of minority classes. However, such models are limited by the local sensing field of the convolution operation, and it is difficult to model long-range dependencies.
To overcome the limitations of CNN, recent studies have increasingly integrated transformer architectures [42,43]. Transformers enable the modeling of long-range contextual relationships through the introduction of multi-head self-attention (MHA) mechanisms. Xu et al. [44] designed an adaptive transformer fusion module in the proposed RSSFormer model, which can suppress background noise and enhance target saliency. The BANet model designed by Wang et al. [45] uses ResT [46] as the long-range dependent path to extract global features, and the upper and lower paths are achieved through stacked convolution operations, retaining more information of shallow small targets. Pang et al. [47] combined lightweight transformer with CNN in the proposed MarsNet model, improving the detail extraction of multi-scale buildings. To mitigate the problem of high computational complexity in the transformer, the recently proposed mamba structure replaces self-attention with a linear state space mechanism, which has the advantages of lower computational cost and higher segmentation performance [48,49]. For example, Liu et al. [50] integrated mamba into the decoder in the proposed CM-UNet model, improving the recognition ability of small targets. Zhang et al. [51] effectively improved the multi-scale feature representation by introducing the dense space pyramid pooling module and the pyramid fusion mamba module in the proposed PyramidMamba model. These models effectively demonstrate the excellent performance of mamba in land cover classification.

2.2. Loss Function for Addressing the CI Problem

The rational design of loss functions is another important way to cope with the CI problem, including weighting-based loss, adjustment factor-based loss, similarity index-based loss, and synthetic loss functions [52].
The loss function based on weighted values solves the CI problem by assigning higher weights to the minority classes. Representative examples include weighted cross-entropy loss [17,53], median frequency balancing loss [12], and parameter-free loss [29]. These methods are typically derived from innovative modifications of the standard cross-entropy loss (CEL) to better accommodate imbalanced data. The loss function based on the adjustment factor adjusts the loss value by introducing an adjustment factor into the base loss so as to better handle imbalanced data. The representative loss function is the focus loss (FL) [20], but in backpropagation, FL often causes the problem of vanishing gradients. To solve this problem, researchers have proposed dual-focus loss [21] and calibration focus loss [54]. The loss function based on the similarity index uses this index to measure the similarity between classes. For example, Dice loss (DL) [55] uses the Dice coefficient to measure the degree of overlap between the predicted class and the true class. This coefficient can provide an evaluation of equilibrium when the data are imbalanced. Log-Cosh Dice loss [56] combines DL and Log-Cosh loss, aiming to handle the sparse segmentation problem in imbalanced datasets. Tversky loss [57] improves DL, allowing for the control of the trade-off between false positives and false negatives by adjusting hyperparameters, which makes it particularly effective when dealing with imbalanced data.
Furthermore, based on the above loss function, researchers have proposed a more complex synthetic loss function to solve the CI problem more effectively. For example, Chen et al. [58] combined CEL and DL as the final loss function to mitigate the influence of CI on the model accuracy. Zhou et al. [59] integrated batch balanced comparison loss, DL and FL in the proposed synthetic loss function, ensuring the effective convergence of the model while eliminating the adverse effects of a large number of negative samples on it.

2.3. Data Optimization Strategies for Addressing the CI Problem

To reduce the impact of the CI problem, researchers often address this issue by optimizing the sample dataset. Firstly, data preparation is carried out for typical areas to minority class omission as much as possible. While suppressing the sample collection of the majority classes, the sampling quantity of the minority classes is increased as much as possible. Secondly, on the basis of existing data, data augmentation methods can be applied to increase the quantity of minority class samples. Traditional approaches mainly rely on sampling methods [22,25], but these are mostly based on numerical data and are not well suited for remote sensing visual tasks [26]. In remote sensing, dataset optimization methods usually involve transformations and generation techniques to augment the dataset and balance the distribution of samples among different classes [60]. Transformation-based methods commonly use operations such as cropping, rotation, scaling, color jitter, and brightness adjustment to increase the amount of minority class samples [61,62]. Generation-based methods typically use data augmentation techniques such as Copy-Paste [63] and Mosaic [64], as well as generative adversarial networks [27], to produce new minority class samples and achieve class balance. For example, the Mosaic method first selects four different original images and then stitches the entire or partial images together. This process attempts to increase the occurrence frequency of minority classes, thereby enhancing the representation of minority class samples.

2.4. Indicators for Measuring CI

The severity of CI is commonly quantified using the imbalance ratio (IR), which is defined as the ratio of the number of samples in the largest class to that in the smallest class [30]. A higher IR value indicates a more severe CI. To compensate for the shortcomings of IR, Zhu et al. [65] considered data dimensionality in CI measurement by incorporating the Pearson correlation test as a penalty term into the IR calculation, thereby addressing some limitations of the standard IR. Lu et al. [66] proposed an individual Bayesian imbalance impact indicator for measuring instance complexity and a Bayesian imbalance impact indicator for dataset measurement, though their experiments were conducted only on binary classification tasks. To evaluate the performance of CNN classifiers on CI datasets, Liu et al. [67] proposed a class balance metric that takes into account the joint distribution between two classes. However, these metrics are designed for binary classification, and there remains a lack of appropriate evaluation indicators for multi-class imbalance problems.

3. Methodology

3.1. HRUMamba Model

3.1.1. Model’s Encoder–Decoder Framework

HRUMamba consists of an encoder built with HRNet, skip connections composed of AAF modules, and a mamba decoder made up of SVSS blocks (Figure 1). The input image is first fed into the HRNet, which extracts features through four stages and four branches, resulting in four feature maps at different scales. Next, the low-resolution high-level features are passed into the mamba decoder for upsampling to extract global features of ground objects. Then, the AAF modules are used to fuse the local features extracted by the encoder with the global features extracted by the decoder. This process enhances the model’s sensitivity to minority classes and suppresses interference from irrelevant noise. Finally, after multi-stage fusion, the encoder outputs the final classification map.

3.1.2. HRNet Encoder

In this study, we employed HRNet as the encoder backbone for multi-scale feature extraction, as illustrated on the left side of Figure 1. HRNet consists of four stages and four parallel branches, capable of generating feature maps from high to low resolutions, which facilitates the capture of multi-scale local detail features and the preservation of critical small-object information. Specifically, Stage 1 corresponds to the first branch and simultaneously generates a new branch with doubled channel dimensions and halved feature map size. Based on the two branches from Stage 1, Stage 2 further creates a third branch with doubled channels and halved feature map size while performing feature fusion across the branches. By analogy, Stage 4 contains four branches that output feature maps with different spatial resolutions and number of channels, respectively. Given an input image I R C × H × W (C, H, and W denote the number of channels, height, and width, respectively), the resolution is first reduced to 1/4 of the original by means of two 3 × 3 convolutional layers with a step size of 2. Subsequently, the image is fed into a convolutional layer that contains four identical residual units for feature extraction and fusion of multi-resolution information. The mathematical representation of each branch’s operation can be formulated as follows:
F s r = b = 1 l f s b ( C o n v ( F ( s 1 ) b ) )
where Fsr denotes the output feature map of the rth branch at stage s. The function fsb(∙) represents the transformation operation responsible for multi-scale feature fusion, while Conv(∙) signifies the convolutional operation implemented through four residual layers. F(s−1)b corresponds to the feature output from the preceding stage. The parameter b indicates the sequential branch number being fused to the rth branch, and l represents the total number of branches involved in the fusion process. It is noteworthy that when s ≤ 3, l = s + 1, whereas when s = 4, l = s.

3.1.3. Block-Based SVSS Decoder

The decoder part comprises a four-layer SVSS block structure, as illustrated in the right panel of Figure 1. The detailed schematic of the SVSS block is presented in Figure 2a, with the SS2D and MCF modules serving as the core computational components. Specifically, the input feature maps are first dimensionally adjusted by linear layers and normalized by layer normalization (LN) to improve the stability of model training. Subsequently, the feature maps are fed into the SS2D module to model remote dependencies and extract global features. The output of this module is then summed with the output of the initial linear layer to compensate for feature losses that may occur during computation. Next, the output features are fed into the MCF module to enhance the local feature representation of multi-scale objects. After processing, the features are mapped through another linear layer and fused with the original input via a residual connection. The fused features are then enhanced through another round of LN and a multi-layer perceptron (MLP) module, followed by an additional residual fusion with the previous output. The output is further refined by a second pass through the MCF module, enhancing the expression of local multi-scale features. Finally, the feature map is passed through another linear layer to adjust its dimensionality and is fused with the initial input via a residual connection to form the final output features. The SVSS block is computed as follows:
F 1 = L i n e a r ( I ) + S S 2 D ( L N ( L i n e a r ( I ) ) ) F 2 = I + L i n e a r ( M C F M ( F 1 ) ) F 3 = F 2 + M L P ( L N ( F 2 ) ) F o u t = I + L i n e a r ( M C F M ( F 3 ) )
SS2D: As a pivotal component of the SVSS architecture, the SS2D module employs an orientation selective scanning module (OSSM) to process partitioned patch sequences. The SS2D structure comprises two parallel pathways: a primary processing branch and a residual branch, as illustrated in Figure 2b. In the primary branch, feature maps initially undergo linear layer for dimensional adjustment, followed by processing through a depthwise convolutional (DWConv) layer. This specialized convolutional operation employs independent filters for each channel, enabling efficient channel-wise feature extraction while significantly reducing parameter complexity and effectively capturing spatial features [68]. Subsequently, the processed features are activated through the sigmoid-weighted linear unit (SiLU) function before being fed into the OSSM for comprehensive multi-orientation long-range contextual feature extraction. The operational mechanism of OSSM’s multi-orientation scanning and long-range feature extraction is detailed in Figure 2d. To further understand this structure, readers are encouraged to refer to [48,49]. The other branch functions similarly to a residual connection. The input feature map first passes through a linear layer to adjust its dimensionality, followed by activation with the SiLU function. It is then fused with the output of the main branch through a Hadamard product to integrate different features. Finally, another linear layer is applied to restore the feature dimensionality to its original size. The mathematical representation of this feature computation is expressed as:
F 1 = O S S M ( S i L U ( D W C o n v ( I ) ) ) F 2 = S i L U ( L i n e a r ( I ) ) F o u t = L i n e a r ( F 1 F 2 )
where F denotes the output feature map and ⊙ represents the Hadamard product operation.
MCFM: To enhance the model’s multi-scale feature representation capability under CI conditions, we introduce a newly designed MCF module in the decoder (Figure 2c). Compared with existing multi-scale structures such as ASPP [37], PPM [69], and Inception [70], the MCF module leverages multiple groups of DWConv with varying kernel sizes to capture fine-grained features across scales while maintaining a lightweight design. This design particularly strengthens spatial awareness of small-scale object boundaries. At the same time, by adopting the synergistic design of multiple residual connections and nonlinear activation, the module balances detail preservation and semantic enhancement in the process of multilevel feature fusion and avoids the feature dilution problem that exists in the existing multi-scale feature extraction methods.
Specifically, the module first applies layer normalization to the input features and performs a residual fusion with the original input to enhance training stability. Then, a linear layer is used to adjust the feature dimensionality, followed by the application of DWConv modules with three different kernel sizes (3 × 3, 5 × 5, and 7 × 7) to extract multi-scale features. This multi-kernel design significantly improves the model’s ability to perceive objects of various scales. Next, the extracted multi-scale features are concatenated along the channel dimension and fused using a 1 × 1 convolution. The fused output is then added to the output of the previous linear layer to compensate for potential feature loss. Finally, a gaussian error linear unit (GeLU) is used for nonlinear activation, followed by a linear layer for channel reduction. The resulting features are fused with the original input through a residual connection to produce the final output. The feature computation within the MCF module can be formally expressed as follows:
F v D W = D W C o n v ( L i n e a r ( I + L N ( I ) ) ) F 1 = L i n e a r ( I + L N ( I ) ) + C o n v 1 × 1 ( C o n c a t ( F 3 D W , F 5 D W , F 7 D W ) ) F o u t = I + L i n e a r ( G e L U ( F 1 ) )
where F is the output feature map, F v D W is the feature from the multiple DWConv output, v V = 3 ,   5 ,   7 .

3.1.4. AAF Module

The AAF module comprises three core components: SAM, MHA mechanism, and MLP module, as illustrated in Figure 3. Specifically, the local features (Flocal) extracted from HRNet and the global features (Fglobal) extracted from mamba are first simultaneously fed into layer normalization to improve training stability. Then, the SAM from the channel-spatial attention mechanism [71] is used to learn the initial representations of local and global regions, respectively. Next, the two types of features are concatenated along the channel dimension and fused using a 1 × 1 convolution. After a Softmax activation, a saliency attention map (F′) is generated. F′ is then equally split into two parts: the fused local feature Flocal and the fused global feature Fglobal, which are further fused with the original features via residual connections to retain more important information. On this basis, the fused local and global features are separately used as the query (Q), key (K), and value (V) inputs to the MHA module to enhance the model’s ability to recognize minority classes. To further improve feature representation, a detail-aware attention mechanism [44] is introduced into the MHA module to promote feature interaction between different regions and significantly enhance the model’s capacity to capture fine object details. The extracted features are then further fused with the original local and global features to compensate for potential information loss. Finally, the output features are processed by LN and the MLP module and fused with the previous output via a residual connection to generate the final feature map. The computational process can be formally expressed as follows:
F = S o f m a x ( C o n v 1 × 1 ( C o n c a t ( S A M ( L N ( F l o c a l ) ) , S A M ( L N ( F g l o b a l ) ) ) ) )
F l o c a l , F g l o b a l = S p l i t ( F )
Q = ( F l o c a l F l o c a l ) W v K = ( F g l o b a l F g l o b a l ) W v V = ( F g l o b a l F g l o b a l ) W v
For the ith self-attention head in MHA, the self-attention computation is formally expressed as
h e a d i = S o f t max ( Q i ( K i ) T M / H ) V i F M H A = F l o c a l + F g l o b a l + C o n c a t ( h e a d 1 , h e a d 2 , , h e a d i ) F o u t = F M H A + M L P ( L N ( F M H A ) )
where Split(∙) represents the operation of evenly dividing the input features into two distinct parts and Concat(∙) denotes the feature concatenation operation. Q i ,   K i ,   V i R M 2 × C H are the three mapping matrices, where M represents the window size, C indicates the number of channels, and H corresponds to the number of self-attention heads. The transformation matrices W q , W k , W v R C 2 H , serve as the mapping matrices for generating the query, key, and value representations, respectively.

3.2. Synthetic Loss Function

To mitigate the impact of CI during model training, we propose a composite loss function comprising a primary loss term (pri) and three auxiliary loss terms (aux1, aux2, aux3), as illustrated in Figure 1. To theoretically validate the effectiveness of this composite loss function, we further analyze its mathematical foundation and optimization mechanism.
The primary loss function integrates cross-entropy loss (ce) [72] and Dice loss (dice) [55]. Cross-entropy loss can be viewed as a form of maximum likelihood estimation, which performs stably under class-balanced conditions. However, in imbalanced scenarios, it is often dominated by majority classes, causing gradient updates to be biased toward these classes. To address this limitation, we introduce Dice loss as a complementary term. Dice loss, essentially a set-based similarity metric, provides stronger gradient signals for minority-class regions and maintains favorable convergence properties, particularly when target areas are small or spatially sparse. Prior studies by Milletari et al. [73] and Sudre et al. [74] have validated the robustness of Dice loss in handling CI and its effectiveness in small-object segmentation.
Furthermore, the proposed composite loss introduces three auxiliary loss branches, forming a multi-level deep supervision mechanism that guides feature learning at different hierarchical stages. This design is inspired by the theoretical framework of loss functions proposed by Lee et al. [75], which suggests that imposing loss constraints at intermediate layers can accelerate training, reduce gradient vanishing, and enhance model generalization. For the auxiliary loss terms, we adopt cross-entropy loss to ensure training stability and avoid overfitting to minority classes in the early stages of optimization. The composite loss function () for the HRUMamba model is formally defined as follows:
L = L p r i + λ ( L a u x 1 + L a u x 2 + L a u x 3 )
where
L p r i = L c e + L d i c e L a u x 1 , L a u x 2 , L a u x 3 = L c e L c e = 1 N n = 1 N k = 1 K log y ^ k ( n ) L d i c e = 1 2 N n = 1 N k = 1 K y k ( n ) y ^ k ( n ) y k ( n ) + y ^ k ( n )
where λ is the weight factor of hyperparameter and defaults to 0.4. N and K denote the number of samples for each class and the number of classes, respectively. y k ( n ) denotes the ground truth, and y ^ k ( n ) denotes the confidence level that the number of samples n belongs to class k.

3.3. CI Indicators

Traditional approaches to quantifying CI have predominantly relied on the IR metric. While IR proves effective for binary classification scenarios, it demonstrates significant limitations when applied to multi-class classification problems, particularly in the context of land cover classification tasks. To address this limitation, our study proposes the CV as a more robust CI metric for multi-class scenarios. The CV, defined as the ratio of the standard deviation to the mean of class distribution, offers several advantages for evaluating datasets exhibiting the “long-tail effect”. This metric provides a normalized measure of dispersion that enables fair comparison across different classification scenarios.
The CV exhibits a direct correlation with the CI degree, where higher CV values indicate more severe CI problems. Conversely, CV values approaching zero suggest an increasingly uniform distribution across classes. In practical terms, a decreasing CV trend during model training or evaluation typically signifies improved classification accuracy for minority classes, reflecting the model’s enhanced capability to handle imbalanced class distributions. This relationship makes CV particularly valuable for monitoring and assessing model performance in land cover classification tasks where the minority class accuracy is on par with that of the majority classes. The relevant formula for CV can be expressed as follows:
C V = σ μ + ε
where σ denotes the class sample standard deviation and μ denotes the class sample mean.

4. Experiments and Results

4.1. Experimental Setup

4.1.1. Datasets and Preparation

This study employs the ISPRS Vaihingen dataset [76] and the Minqin dataset [77] as experimental data, both of which exhibit significant CI problems. The classification of majority and minority classes is based on the proportion of each class within the respective datasets, with classes accounting for less than 5% of the total pixels defined as minority classes, and all others as majority classes.
The Vaihingen dataset is widely recognized for its representativeness in urban land cover classification tasks. It comprises 33 orthorectified images with a ground sampling distance of 0.09 m. Each image includes only the near-infrared, red, and green spectral bands, with an average size of 2494 × 2064 pixels (Figure 4a). The dataset contains five foreground classes—impervious surfaces (Imp. surf.), buildings, low vegetation (Low veg.), trees, and cars—along with a background class. Among them, the car class is a minority class, accounting for only 1.25% of the total pixels. Due to the limited volume of annotated data, we selected images with IDs 2, 4, 6, 8, 10, 12, 14, 16, 20, 22, 24, 27, 29, 31, 33, 35, and 38 for validation and testing, while the remaining 16 images were used for training. All images were cropped into patches of 1024 × 1024 pixels for training and evaluation.
The Minqin dataset represents a specialized dataset for land cover classification in arid regions, developed through our previous research efforts [77]. This dataset specifically targets the unique characteristics of typical arid zones, as illustrated in Figure 4b. Comprising red, green, and blue spectral bands with a ground sampling distance of 0.5 m, the dataset encompasses 10 distinct land cover classes. Despite the vast bare land has been filtered in the dataset, it still has a significant CI challenges. Several land cover types, including garden land (0.71%), buildings (0.82%), roads (0.49%), artificial structures (Art. Stru., 1.46%), artificial excavation areas (Art. Exca., 0.16%), and water (0.69%), constitute minority classes due to their limited spatial representation. To facilitate model training and evaluation, the dataset was systematically processed into 512 × 512 samples, ensuring consistent input dimensions while preserving critical spatial information.

4.1.2. Evaluation Indicators

The experimental evaluation framework incorporates two distinct categories of metrics. The primary category focuses on assessing the comprehensive classification performance through three key indicators: overall accuracy (OA), mean F1 score (mF1), and mean intersection over union (mIoU). These metrics are mathematically defined as follows:
I o U = T P T P + F P + F N
m I o U = 1 N n = 1 N I o U n
F 1 = 2 × P r e c i s i o n × R e c a l l P r e c i s i o n + R e c a l l
m F 1 = 1 N n = 1 N F 1 n
O A = T P + T N T P + F P + T N + F N
where
P r e c i s i o n = T P T P + F P
R e c a l l = T P T P + F N
where TP, TN, FP, and FN denote true positive, true negative, false positive, and false negative, respectively. N is the total number of classes.
The second aspect is the CI metric represented by CV. These metrics are quantitatively derived from the class-specific F1 scores, providing a comprehensive measure of classification performance across both majority and minority classes.

4.1.3. Training Process

The experiments were conducted on the High-Performance Computing Platform at Lanzhou University. The hardware configuration included two Intel Xeon Cascade Lake 6248 CPUs and eight Nvidia NVLink Tesla V100 GPUs with 32 GB of memory each. The experimental environment was based on the CentOS Linux 7 operating system, with deep learning model training implemented using Python 3.10 and the PyTorch (v2.1.2) framework. GPU acceleration was supported by CUDA (v11.8) and cuDNN (v8.9.7). Additional major dependencies included torchvision (v0.16.2), numpy (v1.21), opencv-python (v4.8.1), albumentations (v1.4.16), mamba-ssm (v1.1.2), and yaml (v0.2.5), all of which contribute to the stability and reproducibility of the model training process.
During the training phase, the batch size was uniformly set to 16, and the number of training epochs was fixed at 100. A weight decay factor of 0.01 was applied. The AdamW optimizer was employed due to its favorable regularization properties, which facilitate stable training in multi-class remote sensing tasks. The initial learning rate was set to 6 × 10⁻⁴, while the learning rate for the backbone network was set to 6 × 10⁻⁵. A cosine annealing learning rate schedule was adopted to help avoid local minima and accelerate convergence in later stages. These hyperparameters were selected with reference to prior works on semantic segmentation of remote sensing images [44,50,78], and they were fine-tuned based on available hardware resources to achieve optimal segmentation performance without significantly increasing the training cost.
To mitigate the adverse effects of CI, particularly to enhance the representation of minority classes, we introduced a targeted data augmentation strategy during training. For the Vaihingen training set, all training images were initially subjected to horizontal and vertical flipping to increase the data volume. Subsequently, samples with a car class pixel ratio greater than 0.1 were further selected for additional augmentations, including horizontal and vertical flips as well as 90-degree rotations. This threshold ensured that the augmented samples contained a sufficient number of minority class, thereby effectively increasing their training weight. Although this strategy simultaneously increased the presence of other classes within the augmented images, it significantly improved the learning and recognition performance of minority classes. After augmentation, the training and testing sets contained 706 and 113 samples, respectively. During training, input images of size 1024 × 1024 were cropped to 512 × 512 patches, and the Mosaic augmentation technique was employed to further enhance data diversity, enabling the model to better learn from various scene characteristics.
For the Minqin dataset, a targeted data augmentation strategy was designed based on prior research findings [77]. Specifically, the focus was placed on three classes with relatively low segmentation accuracy: garden land, road, and artificial excavation areas. Samples containing any of these three classes with a pixel ratio exceeding 0.1 were further selected and subjected to horizontal and vertical flipping, as well as 90-degree rotations. Following this augmentation process, the training, validation, and test sets comprised 63,411, 18,297, and 18,297 samples, respectively. During training, the image size was maintained at 512 × 512 pixels. Additionally, the Mosaic data augmentation strategy was employed to improve sample diversity, thereby enhancing the model’s ability to learn features across varied scenes.
In the experiments, we used a HRNet pre-trained on ImageNet as the encoder part of the HRUMamba model. This pre-training strategy serves two primary purposes: (1) to significantly reduce the computational overhead during subsequent model training, and (2) to facilitate faster convergence of the learning process. The utilization of ImageNet’s extensive and diverse image collection for pre-training enables the model to acquire robust feature representations, thereby enhancing the overall training efficiency and model performance.

4.1.4. The Models Selected for Comparison

In this study, we conducted a comprehensive comparative analysis between the proposed HRUMamba model and several state-of-the-art semantic segmentation models across four distinct architectural categories: (1) CNN-based architectures, including FCN, UNet, DeepLabv3+, GRRNet [39], ASPP+-LANet [14], ABCNet [79]; (2) Transformer-based architectures, including Segmenter [42], SETR [80], Swin Transformer [43]; (3) hybrid CNN-Transformer architectures, including BANet [45], TransUNet [81], MarsNet [47], UNetFormer [78]; and (4) emerging CNN-Mamba hybrid architectures, including CM-UNet [50], PyramidMamba [51]. These comparative models were selected based on their demonstrated superior performance in previous segmentation studies.
To ensure a fair and consistent evaluation framework, we implemented our proposed primary loss function across all compared models for parameter optimization during training. This unified approach eliminates potential bias in performance comparison that could arise from different optimization strategies, allowing for a more accurate assessment of architectural differences.

4.2. Results of CI-Related Ablation Experiments

In this section, we conduct a comprehensive ablation study to evaluate the individual contributions of each HRUMamba module, the loss function, and data augmentation strategies in addressing CI problems. The effectiveness of each component is quantitatively assessed based on its capability to mitigate CI-related issues. For consistency and comparability, all ablation experiments are performed on the Vaihingen dataset unless otherwise specified. This systematic approach allows us to isolate and measure the impact of each architectural component and training strategy on the model’s performance in handling CI scenarios.

4.2.1. Ablation Results of the Key Modules of the HRUMamba Model

Table 1 presents the comprehensive performance evaluation of key modules and architectural components in the HRUMamba model. Without incorporating the AAF and MCF modules, the baseline model achieves an mIoU of 84.84%, an OA of 93.58%, and a CV value of 0.0492. These figures exceed those of the structurally similar CM-UNet by 3.26% in mIoU and 1.04% in OA, while reducing the CV by 0.0098, demonstrating the structural advantages of the proposed model. In the comparison model, PyramidMamba adopts a tandem structure to use the mamba block as a decoder, and by comparing it to CM-UNet with the same backbone, it can reflect the advantages that the skip connection. Specifically, the mIoU and OA values of CM-UNet are higher than those of the PyramidMamba model by 1.18% and 0.54%, respectively, while the HRUMamba model outperforms the CM-UNet in terms of performance, which indirectly verifies the validity and importance of the design of skip connections in the proposed model.
The comparison between the “Baseline” and “Baseline + AAFM” models, as well as between the “Baseline + MCFM” and “Baseline + AAFM + MCFM” models, highlights the performance advantages of the AAF module. In the first case, the inclusion of AAF results in an mIoU and OA improvement of 0.84% and 0.29%, respectively, along with a 0.0034 reduction in the CV value. Notably, the IoU of the car class (minority class) increases by 1.65%. In the second case, integrating the AAF module with the HRNet and SVSS modules, the HRUMamba model achieves 85.88% (+0.11%), 93.92% (−0.04%), and 0.0445 (−0.0019) in mIoU, OA, and CV, respectively, and the IoU for the car class is further improved to 83.99% (+0.5%). These results demonstrate the effectiveness of the AAF module in improving both overall performance and minority class recognition. Additionally, the results shown in the third, fourth, and sixth columns of Figure 5 further confirm that the introduction of the AAF module effectively suppresses segmentation noise and reduces misclassification.
The comparison between the “Baseline” and “Baseline + MCF” models highlights the performance advantages of the MCF module. With the integration of this module, the mIoU and OA increase by 0.93% and 0.38%, respectively, while the CV value decreases by 0.0028. Moreover, the IoU for the car class improves by 1.85%. As illustrated in the third and fifth columns of Figure 5, the incorporation of the MCF module significantly enhances the model’s segmentation performance, indicating its effectiveness in improving both overall accuracy and minority class representation.

4.2.2. Comparison Among Loss Functions

To systematically investigate the impact of various loss functions and their combinations on CI mitigation, we conducted a comprehensive comparative analysis of different loss function configurations. As shown in Table 2, the use of CEL alone leads to poor performance metrics with mIoU, OA, and CV values of 85.47%, 93.91, and 0.0467, respectively. This configuration particularly struggles with minority class representation, as evidenced by the car class achieving its lowest IoU of 81.15%. In contrast, the model demonstrates relatively strong performance on majority classes under this configuration, highlighting CEL’s inherent bias towards dominant classes in the dataset. This performance disparity clearly illustrates CEL’s limitation in addressing CI, as it primarily focuses on optimizing majority class performance at the expense of minority class feature extraction.
When combined with FL, although mIoU and OA decreased, CV decreased by 0.0014 and car class IoU increased by 1.23%, which proves that the addition of FL helps to mitigate the effect of the CI problem, but it is not friendly to the overall performance of the model. The best performance of mIoU, OA, and CV was achieved when the combined DL was added, with mIoU and OA increasing by 0.41% and 0.01%, respectively, and CV decreasing by 0.0022, which was significantly better than FL for mitigating the effects of the CI problem. From the perspective of individual class performance, the inclusion of DL leads to a reduced disparity in IoU across classes. Notably, the car class IoU increases by 2.84%, while the low vegetation and tree classes also show improvements, indicating that DL enhances feature learning for hard-to-classify, small-scale, and minority-class objects. When combining CEL, FL, and DL, although the car class achieves the highest IoU gain of 3.36%, the IoU values for most majority classes decline. Consequently, the overall performance in terms of mIoU, OA, and CV is inferior to that of the CEL + DL combination. Therefore, this combined loss was not selected as the final primary loss function in our model.
Table 3 presents a comprehensive analysis of the auxiliary loss impact on HRUMamba model training. The baseline configuration, without auxiliary loss integration, demonstrates suboptimal performance with relatively lower mIoU and higher CV values. The introduction of an auxiliary loss component showed a significant improvement in mIoU and OA by 0.62% and 0.19%, respectively, and the CV was reduced by 0.0033. At the individual class level, except for a slight decrease in the IoU of the building class, all other classes exhibited improvements. These results demonstrate that the incorporation of auxiliary losses can effectively enhance the overall performance of the model while also providing a certain degree of mitigation for the CI problem.

4.2.3. Effect of Data Augmentations

Table 4 systematically documents the substantial impact of data augmentation on classification performance. The implementation of data enhancement techniques resulted in an overall improvement in all assessment metrics, with an increase in mIoU and OA of 1.54% and 0.36%, respectively, and a significant decrease in CV of 0.0039. Particularly noteworthy is the remarkable 5.85% enhancement in IoU for the car class, which represents a minority class. These empirical results strongly indicate that data augmentation serves as an effective strategy for enhancing model segmentation accuracy while simultaneously demonstrating remarkable efficacy in addressing CI challenges. The pronounced improvement in minority class performance underscores the method’s sensitivity to CI issues and its capability to improve model robustness across diverse land cover types.

4.3. Comparison of Classification Results

4.3.1. Results Based on Vaihingen Dataset

Table 5 presents the comparative experimental results obtained from the Vaihingen test set, demonstrating the superior performance of our proposed HRUMamba model. The HRUMamba achieves state-of-the-art results with an optimal mF1 score of 92.25% and a significantly reduced CV value of 0.0445, outperforming all benchmark models in the comparison. Specifically, when compared to the Swin Transformer model, HRUMamba shows remarkable improvements with a 24.71% increase in mF1 score and a substantial 0.3708 reduction in CV value. Furthermore, relative to the TransUNet model, our approach maintains a competitive edge with a 1.86% enhancement in mF1 score and a 0.0062 decrease in CV value. These results collectively demonstrate HRUMamba’s exceptional capability in both overall classification accuracy and effective handling of CI challenges.
As shown in Table 5 and Figure 6, HRUMamba demonstrates outstanding F1 scores and IoU values across all land cover types. Notably, the proposed model achieves an F1 score of 91.3% and an IoU of 83.99% for the car class, representing improvements of at least 4.15% and 6.77%, respectively, over other comparison models. In addition, HRUMamba also excels in the classification of the low vegetation class, with its F1 score and IoU surpassing those of other models by at least 1.88% and 2.84%, respectively. These results further validate the dual advantage of HRUMamba in delivering strong overall classification performance while effectively mitigating the CI problem.
To conduct a comprehensive performance evaluation across different models, we present a visual comparison of segmentation results in Figure 7, focusing on three representative complex scenes. The proposed HRUMamba model demonstrates superior segmentation quality across multiple dimensions. Firstly, HRUMamba exhibits exceptional boundary preservation capabilities, accurately delineating edge details between parcels while effectively eliminating boundary blurring and parcel overlapping artifacts. In contrast, transformer-based models (Segmenter, SETR, and Swin Transformer) display significant limitations in boundary precision, producing coarse segmentation results with notable inaccuracies, particularly in distinguishing between low vegetation and tree classes.
Secondly, HRUMamba demonstrates remarkable proficiency in minority class segmentation, successfully identifying nearly every individual car class. This performance significantly outperforms competing models, effectively mitigating the negative impacts of CI and substantially reducing car omission errors. This achievement primarily stems from the model’s innovative CI mitigation strategy, which enhances feature learning for minority classes through advanced architectural components.
Furthermore, HRUMamba shows substantial advantages in reducing segmentation fragmentation. While other models produce discontinuous and incoherent results for buildings, low vegetation, and trees, HRUMamba maintains superior spatial continuity and structural integrity in these classes. The model’s segmentation results exhibit high consistency with ground truth data, demonstrating its capability to preserve both local details and global structural information simultaneously.

4.3.2. Results Based on Minqin Dataset

Table 6 presents the comprehensive evaluation results of various models on the Minqin test set, clearly demonstrating the superior performance of our proposed HRUMamba model. The HRUMamba achieves state-of-the-art results with an optimal mF1 score of 89.88% and a significantly reduced CV value of 0.0574 while consistently maintaining the highest F1 scores across all individual classes. In detailed comparative analysis, HRUMamba outperforms the CNN-based ASPP+-LANet model by a substantial margin of 5.12% in mF1 score and demonstrates a 0.0493 reduction in CV value. When compared to the transformer-based SETR model, our approach shows a 3.87% advantage in mF1 score and a 0.031 reduction in CV value. Notably, HRUMamba also surpasses CM-UNet, a representative hybrid model combining CNN and mamba architectures, with an 8.48% higher mF1 score and a 0.0635 lower CV value. These results collectively establish HRUMamba’s superior capability in handling complex land cover classification tasks in arid regions, particularly in addressing CI challenges.
As shown in Table 6 and Figure 8, HRUMamba also achieves outstanding F1 scores and IoU values across various land cover types in the Minqin dataset. In particular, the model demonstrates superior performance in classifying minority classes such as garden land, buildings, roads, artificial structures, artificial excavation areas, and water. Compared with other benchmark models, HRUMamba achieves at least 1.3% and 2.4% higher F1 scores and IoU values, respectively, for these classes. These experimental results strongly demonstrate HRUMamba’s dual capability to maintain high performance and effectively address the CI problem even in heterogeneous datasets, further highlighting its robustness and broad adaptability in complex remote sensing classification scenarios.
Figure 9 presents a comprehensive visual comparison of segmentation results across different models using the Minqin test dataset, clearly demonstrating HRUMamba’s superior performance in diverse scenarios. The proposed model consistently delivers optimal segmentation quality, particularly excelling in minority class identification, boundary precision, and fragmentation reduction. In the first test case, HRUMamba demonstrates exceptional capability in accurately delineating complex boundaries between farmland and buildings while maintaining precise extraction of garden land and road features. In contrast, competing models exhibit persistent issues including boundary ambiguity, class confusion, and noise artifacts.
The second test case, characterized by high inter-class homogeneity, reveals HRUMamba’s remarkable performance alongside the SETR model in accurately extracting artificial excavation areas. While other models often misclassify it as woodland and produce fragmented outputs with compromised continuity, HRUMamba maintains structural integrity and classification accuracy. The third test case focuses on the challenging segmentation of garden land, roads, and water. HRUMamba again outperforms competing models, achieving precise minority class identification and exceptional boundary consistency with ground truth data. Alternative approaches demonstrate various limitations, including misclassification of garden land as grassland, fragmentation of water and road, and general parcel discontinuity.
These visual results collectively demonstrate HRUMamba’s dual advantage in both fine-grained segmentation and fragmentation reduction. The model consistently maintains stable extraction of minority classes under varying CI conditions, effectively preserving object integrity and spatial accuracy. This performance substantiates HRUMamba’s capability to address fundamental challenges in land cover classification, particularly in complex, heterogeneous environments.
Figure 10 shows the results of IoU visualization on minority classes for representative models with different architectures. HRUMamba improves IoU by 22.23%, 6.41%, 17.48%, 13.30%, 14.14%, and 4.29% on the six minority classes compared to CM-UNet with a similar architecture (classes from left to right). Compared to ASPP+-LANet, SETR, and BANet with different architectures, HRUMamba improves IoU on the corresponding six categories by at least 7.36%, 3.90%, 11.80%, 5.47%, 3.94%, and 2.40%. Combined with Figure 11, it can be seen that HRUMamba performs optimally in terms of segmentation effect on a minority classes, with clear boundaries of each class and high consistency with the labels. In contrast, other comparison models generally suffer from rough boundaries, fractures, and fragmented classifications. These findings indicate that the proposed HRUMamba demonstrates strong modeling capabilities for minority classes and high generalizability across multiple datasets.

4.3.3. Comparison of Model Efficiency

We conducted a comprehensive evaluation of the computational efficiency of representative models with different architectures in Table 7. The results show that ABCNet, BANet, and CM-UNet exhibit higher computational efficiency, while SETR, Swin Transformer, and the HRUMamba model proposed in this paper show relatively lower computational efficiency. However, in terms of performance, hybrid architecture models outperform traditional CNN models and transformer models, mainly due to their ability to integrate the advantages of different architectures and compensate for the respective shortcomings of CNNs and transformers.
As shown in Figure 12, the relatively low computational efficiency of HRUMamba is primarily attributed to its backbone network, HRNet-W64. Within the model’s total parameters, HRNet-W64 accounts for 117.71 M, representing as much as 92.59% of the total, which is significantly higher than that of ResNet18 and ViT-Base. Although this results in a sacrifice of computational efficiency, it brings substantial performance gains. For example, on the Vaihingen dataset, HRUMamba achieves mIoU and mF1 scores that exceed those of other comparison models by more than 3.25% and 1.98%, respectively; on the Minqin dataset, its mIoU and mF1 scores also improve by over 4.2% and 2.82%, respectively. Moreover, the powerful multi-scale semantic representation capability of HRNet-W64 helps retain more information about small targets, thereby enhancing the recognition accuracy of minority classes. Therefore, in current remote sensing tasks, a moderate compromise in computational efficiency is acceptable in exchange for improved classification performance.

4.4. Loss Functions

Figure 13 illustrates the training dynamics of four distinct loss functions across successive epochs, revealing consistent convergence patterns for both training and validation datasets. The loss curves exhibit three distinct phases: (1) a rapid descent during the initial 10 epochs, (2) a gradual slowdown between epochs 11 and 50, and (3) stable convergence from epochs 51–100, indicating complete model optimization. Among the evaluated loss functions, CEL has the smallest value, followed by the combination of CEL and FL, then the combination of CEL and DL, and the highest value is for the combination of CEL, FL and DL.
This phenomenon can be attributed to two fundamental factors. Firstly, the intrinsic nature of loss function composition plays a significant role: while CEL operates as a singular loss metric, the other configurations represent composite loss functions that inherently yield larger values. However, it is crucial to note that higher loss values do not necessarily correlate with inferior model performance, as evidenced by the comprehensive evaluation metrics presented in Table 2 and Table 5. The experimental results demonstrate that the CEL + DL combination, despite its higher loss values, achieves optimal model performance with an mF1 score of 92.25% and mIoU of 85.88%. Secondly, the inherent characteristics of individual loss functions contribute to this pattern. CEL exhibits a natural bias toward optimizing majority classes due to their higher representation in the training data, consequently reducing the overall loss value while potentially neglecting minority classes. In contrast, FL addresses CI by amplifying the weight of minority classes, thereby increasing the loss value as it reduces the contribution from easily classified samples. DL, primarily designed for measuring inter-dataset similarity, excels in boundary optimization and local feature refinement. However, its emphasis on minority class representation in imbalanced datasets inherently leads to elevated overall loss values.

4.5. Comparison of IR and CV

The CI measurement results of IR and CV across different datasets are shown in Table 8. It can be observed that the minimum IR values correspond to different segmentation models in each dataset: GRRNet achieves the lowest IR on the Vaihingen dataset with a value of 21.8609, while PyramidMamba achieves the lowest on the Minqin dataset with a value of 135.0756. In contrast, the minimum CV values are consistently achieved by the HRUMamba model, with values of 0.0445 and 0.0574, respectively. The reason for this problem is that the IR computation only considers the extreme cases of the largest and smallest classes, and during multi-class evaluation, it includes misclassified pixels, which leads to biased assessment results. In the Minqin test set, the notably lower IR value for PyramidMamba is primarily due to the model’s instability—specifically the predicted results entirely lack the artificial excavation areas class, causing the calculation to select a different class as the minimum, which exposes another limitation of IR. It is also important to note that each dataset inherently has a baseline IR value, which contributes to generally high measurement values across all models.
In contrast, the CV metric introduced in this study demonstrates overall stability in multi-class CI evaluation. This is primarily because CV takes into account all classes in its calculation, rather than focusing solely on the most and least frequent classes. As a result, it provides a more comprehensive measure of the impact of class imbalance on classification performance. Moreover, CV exhibits greater robustness in multi-class tasks, as it effectively captures the distributional disparities across all classes. Its dimensionless nature also makes it adaptable to datasets of varying scales, further highlighting its general applicability and reliability in CI assessment.

5. Discussion

5.1. Comparison of Models in Dealing with CI Problems

Through comprehensive comparative analysis of various models, we observe that effective approaches to addressing CI challenges predominantly incorporate multi-scale frameworks for enhanced land cover information extraction. These frameworks significantly improve model sensitivity to minority classes, as evidenced by superior performance metrics in models such as UNet, ABCNet, BANet, TransUNet, UNetFormer, and CM-UNet, which have higher mF1, mIoU, and lower CV values (Figure 14). The effectiveness of these architectures stems from their ability to process and integrate multi-scale features, thereby enhancing recognition capabilities for minority classes across diverse object scales.
The multi-scale framework’s strength lies in its dual capacity to simultaneously capture fine-grained local details while maintaining global semantic context through hierarchical modeling of both short- and long-range contextual features. This integrated approach significantly improves the model’s performance in challenging scenarios, including the identification of land cover types with ambiguous boundaries or those particularly difficult to classify in complex environments, consequently mitigating CI effects. Furthermore, our analysis reveals that UNet-like architectures demonstrate superior minority class segmentation accuracy compared to alternative structural paradigms. This observation suggests that the characteristic encoder–decoder structure with skip connections in UNet-based models provides an effective framework for preserving and enhancing minority class features throughout the network’s processing hierarchy.
In addition, the integration of attention mechanisms into model architectures provides a dynamic framework for adaptive feature weighting, significantly enhancing minority class representation. These mechanisms enable context-aware adjustment of feature importance based on regional significance and classification complexity, ensuring optimal allocation of computational resources to challenging regions and minority classes during training. This adaptive approach substantially improves model learning capacity and effectively mitigates CI challenges. The efficacy of attention-enhanced architectures is empirically validated through superior performance metrics, as illustrated in Figure 14. Models incorporating attention mechanisms, including ABCNet, TransUNet, UNetFormer, and CM-UNet, demonstrate exceptional results across key evaluation metrics (OA, mF1, mIoU, and CV). The consistent performance advantage of these attention-based models underscores the critical role of adaptive feature weighting in addressing CI challenges and improving overall classification accuracy.
Figure 14 reveals distinct performance patterns among different architectural paradigms in addressing CI challenges. The comparative analysis demonstrates that hybrid models integrating CNN with either transformer or mamba architectures consistently outperform pure CNN-based and transformer-based models in CI mitigation. This performance disparity stems from fundamental architectural characteristics. Pure CNN-based models excel in local dependency modeling and boundary feature extraction but are limited by their constrained receptive fields in capturing long-range dependencies. Conversely, transformer-based models demonstrate strong long-range dependency modeling through self-attention mechanisms but often underperform in local feature extraction. Hybrid architectures effectively combine the strengths of both paradigms: leveraging CNNs for precise local feature extraction while utilizing transformers or mamba for comprehensive long-range dependency modeling. This synergistic integration significantly enhances the model’s capability to mitigate CI effects. Furthermore, the introduction of visual state-space methods in mamba makes the model more robust and efficient in handling complex visual tasks, compensating for the limitations of transformer.
To effectively address CI challenges in semantic segmentation, our study identifies four critical architectural considerations. Firstly, the integration of multi-scale feature extraction and fusion modules is essential, as these components enhance the model’s capability to interpret minority classes while preserving overall classification accuracy. Secondly, long-range contextual modeling proves crucial for capturing comprehensive spatial information of minority classes, particularly in complex landscapes. Thirdly, the incorporation of attention and self-attention mechanisms enables focused learning on sparsely distributed minority classes within the image space. Fourthly, the strategic design of composite loss functions and data augmentation techniques facilitates balanced learning across all classes under CI conditions. The proposed HRUMamba model embodies these principles through its innovative architecture. This comprehensive approach is further enhanced by our novel composite loss functions and data augmentation strategies specifically designed for CI mitigation. The experimental results validate the effectiveness of this approach, with HRUMamba achieving state-of-the-art performance across all key metrics (OA, mF1, mIoU). Notably, the model achieves significantly lower CV values of 0.0445 and 0.0574 on the respective datasets, outperforming all comparative models in CI mitigation.

5.2. Importance of the Collaboration with Model, Loss Function, and Sample Dataset to Address the CI Problems

As demonstrated in our study, the integration of specialized functional modules for short- and long-range contextual modeling, multi-scale feature processing, and attention mechanisms represents a comprehensive solution to CI challenges in semantic segmentation. The prevalence of CI in remote sensing datasets is particularly problematic due to the characteristic local-scale distribution and ambiguous boundaries of minority classes, which cannot be accurately segmented using local features alone. The synergistic combination of long-range dependency modeling and short-range detail extraction enables precise boundary delineation and effective global feature capture. This is evidenced by HRUMamba’s superior performance, achieving a 6.08% higher F1 score for cars in the Vaihingen dataset compared to conventional CNN or transformer models. Similarly, for the Minqin dataset, HRUMamba demonstrates at least 2% improvement in F1 scores for critical minority classes including garden land, buildings, roads, artificial structures, artificial excavation areas, and water.
The incorporation of multi-scale feature extraction and fusion mechanisms plays a pivotal role in enhancing minority class interpretation. Given the scale-dependent variability of object features in remote sensing imagery, where minority classes are frequently obscured by dominant classes, multi-scale processing enables comprehensive semantic information extraction across various spatial scales. This capability is exemplified by the MCF module, which contributes to a 1.85% increase in IoU for car detection. Furthermore, attention mechanisms significantly augment the model’s feature representation capacity for minority classes through dynamic feature weighting. The AAF module, for instance, yields a 1.65% improvement in IoU for car detection, demonstrating the mechanism’s efficacy in overcoming CI-induced limitations. These architectural innovations collectively enable the model to effectively address the fundamental challenges posed by CI in remote sensing image analysis.
The design and implementation of loss functions play a pivotal role in mitigating CI challenges in semantic segmentation. Through strategic formulation of composite loss functions, models can be effectively guided to prioritize minority class learning while maintaining balanced performance across all classes. Traditional CEL demonstrates inherent limitations in CI scenarios, exhibiting bias toward majority classes. However, our experimental results reveal that hybrid loss functions combining CEL with DL or FL significantly enhance minority class segmentation accuracy. The empirical evidence demonstrates the effectiveness of these composite loss functions: the CEL + FL combination yields a 1.23% improvement in IoU for car detection, while the CEL + DL configuration achieves a more substantial 2.84% enhancement. It is noteworthy that the IoU for car detection improves the most with 3.36% in the combined FL + DL + CEL approach. These findings underscore the importance of carefully designed loss functions in addressing fundamental challenges posed by CI in remote sensing image interpretation.
The quality and composition of training datasets fundamentally influence semantic segmentation model performance, particularly in addressing CI challenges. Strategic sample preparation, including class distribution adjustment and minority class sample enhancement, significantly improves minority class representation during training. Data augmentation techniques play a crucial role in this process by artificially expanding minority class samples, thereby facilitating more balanced learning across all classes and mitigating bias from sample scarcity or distribution imbalance. These findings emphasize that effective dataset preparation requires not only sufficient sample quantity but also careful consideration of class distribution equilibrium. Such balanced datasets enable models to fully realize their potential in overcoming CI limitations. The ablation study results presented in Table 4 provide empirical support for this approach, demonstrating that data augmentation strategies yield a substantial 5.85% improvement in IoU for car detection, with corresponding enhancements across other minority classes. This evidence underscores the importance of comprehensive dataset design in developing robust semantic segmentation models capable of handling CI challenges in remote sensing applications.
Therefore, effectively addressing CI challenges necessitates a comprehensive, multi-faceted approach that synergistically integrates model architecture optimization, loss function design, and strategic sample dataset preparation. This holistic framework enables the achievement of optimal classification performance by simultaneously enhancing minority class representation, improving feature learning mechanisms, and ensuring balanced class distribution throughout the training process.

6. Conclusions

In this study, we propose an integrated solution framework that synergizes advanced semantic segmentation architectures, category rebalancing loss functions, and sample dataset optimization strategies to effectively address the CI challenge in high-resolution land cover classification. The proposed model emphasizes three critical architectural components: (1) simultaneous extraction of short- and long-range contextual features, (2) multi-scale feature processing and fusion, and (3) adaptive attention mechanisms. These elements collectively enhance minority class classification accuracy through complementary mechanisms: long-range contextual modeling captures global semantic relationships, while short-range feature extraction preserves local detail precision. The multi-scale processing modules enable comprehensive land cover information extraction across varying spatial scales, significantly improving minority class recognition. Furthermore, the integrated attention mechanisms facilitate dynamic feature weighting, enhancing model focus on minority class parcels while mitigating majority class bias. Building upon these principles, we develop HRUMamba, a high-performance semantic segmentation model specifically designed for CI mitigation in land cover classification tasks. HRUMamba’s architecture synergistically combines these advanced modules to achieve optimal performance. Extensive experimental validation using the Vaihingen and Minqin datasets demonstrates the model’s superior effectiveness, consistently achieving state-of-the-art results in both overall accuracy and minority class recognition.
Second, the strategic formulation of composite loss functions plays a pivotal role in mitigating CI challenges. Traditional CEL demonstrates inherent limitations in CI scenarios, primarily due to its tendency to favor majority classes and neglect minority class representation. Our experimental results reveal that augmenting the loss function with FL or DL significantly enhances minority class segmentation accuracy. These specialized loss components explicitly prioritize hard-to-classify samples and minority classes through distinct mechanisms: FL addresses CI by adjusting the loss contribution based on classification difficulty while DL emphasizes spatial overlap accuracy, particularly beneficial for minority classes. Through systematic evaluation, we identify the combined CEL+DL configuration as the optimal loss function, demonstrating superior performance in balancing overall accuracy and minority class recognition. This selection is supported by empirical evidence showing substantial improvements in both quantitative metrics and qualitative segmentation results for minority classes.
Furthermore, the strategic preparation and composition of training datasets fundamentally influence model performance in addressing CI challenges. By optimizing class distribution through targeted sample augmentation and minority class enrichment, we significantly enhance minority class representation and recurrence rates during training. The implementation of data augmentation techniques in HRUMamba’s training regimen demonstrates substantial improvements in minority class segmentation accuracy while maintaining performance across other classes. These findings underscore the importance of comprehensive dataset optimization, particularly in achieving balanced class distribution, as a critical strategy for CI mitigation.
In this study, we introduce the coefficient of variation (CV) as a novel, robust metric for evaluating multi-class imbalance scenarios. Unlike traditional metrics that focus on extreme class distributions, CV provides a comprehensive assessment by considering variability across all classes. Our experimental results demonstrate CV’s superior stability and reliability compared to conventional imbalance metrics, offering a more nuanced understanding of CI effects in complex classification tasks.
Although the proposed model demonstrates excellent accuracy, it falls short in terms of efficiency and still has room for improvement in addressing the CI problem. In future research, we will further optimize the network architecture and explore new CI mitigation strategies to enhance the model’s learning capability for minority classes.

Author Contributions

P.C. and Y.L. conceived and designed the experiments; P.C. and Y.R. performed the experiments; P.C. and Y.L. edited the manuscript. P.C., B.Z. and Y.Z. made datasets for the experiments. Y.L., P.C. and Y.R. were responsible for validating the experimental conclusions and reviewing the manuscript. All authors have read and agreed to the published version of the manuscript.

Funding

This research was funded by the Science and Technology Project of Gansu Provincial Department of Natural Resources (No. 202425).

Data Availability Statement

The original contributions presented in the study are included in the article, further inquiries can be directed to the corresponding author.

Acknowledgments

The authors thank the Supercomputing Center of Lanzhou University for its support and the Mapping Institution of Gansu Province for its valuable contribution to the preparation of the Minqin dataset.

Conflicts of Interest

The authors declare no conflict of interest.

References

  1. Japkowicz, N.; Stephen, S. The class imbalance problem: A systematic study. Intell. Data Anal. 2002, 6, 429–449. [Google Scholar] [CrossRef]
  2. Megahed, F.M.; Chen, Y.J.; Megahed, A.; Ong, Y.; Altman, N.; Krzywinski, M. The class imbalance problem. Nat. Methods 2021, 18, 1270–1272. [Google Scholar] [CrossRef] [PubMed]
  3. Zhang, Y.; Kang, B.; Hooi, B.; Yan, S.; Feng, J. Deep Long-Tailed Learning: A Survey. IEEE Trans. Pattern Anal. Mach. Intell. 2023, 45, 10795–10816. [Google Scholar] [CrossRef] [PubMed]
  4. Ghosh, K.; Bellinger, C.; Corizzo, R.; Branco, P.; Krawczyk, B.; Japkowicz, N. The class imbalance problem in deep learning. Mach. Learn. 2024, 113, 4845–4901. [Google Scholar] [CrossRef]
  5. Johnson, J.M.; Khoshgoftaar, T.M. Survey on deep learning with class imbalance. J. Big Data 2019, 6, 27. [Google Scholar] [CrossRef]
  6. Patel, V.; Bhavsar, H. An Empirical Study of Multi-class Imbalance Learning Algorithms. In Proceedings of ICT Systems and Sustainability: Proceedings of ICT4SD 2022; Springer: Berlin/Heidelberg, Germany; pp. 161–174. [CrossRef]
  7. Oksuz, K.; Cam, B.C.; Kalkan, S.; Akbas, E. Imbalance Problems in Object Detection: A Review. IEEE Trans. Pattern Anal. Mach. Intell. 2021, 43, 3388–3415. [Google Scholar] [CrossRef]
  8. Jiang, W.D.; Sun, Y.L.; Lei, L.; Kuang, G.Y.; Ji, K.F. Change detection of multisource remote sensing images: A review. Int. J. Digit. Earth 2024, 17, 2398051. [Google Scholar] [CrossRef]
  9. Qin, R.J.; Liu, T. A Review of Landcover Classification with Very-High Resolution Remotely Sensed Optical Images-Analysis Unit, Model Scalability and Transferability. Remote Sens. 2022, 14, 646. [Google Scholar] [CrossRef]
  10. Tang, H.K.; Wang, H.L.; Zhang, X.P. Multi-class change detection of remote sensing images based on class rebalancing. Int. J. Digit. Earth 2022, 15, 1377–1394. [Google Scholar] [CrossRef]
  11. Ning, X.G.; Zhang, H.C.; Zhang, R.Q.; Huang, X. Multi-stage progressive change detection on high resolution remote sensing imagery. Isprs J. Photogramm. 2024, 207, 231–244. [Google Scholar] [CrossRef]
  12. Tong, X.Y.; Xia, G.S.; Zhu, X.X. Enabling country-scale land cover mapping with meter-resolution satellite imagery. ISPRS J. Photogramm. 2023, 196, 178–196. [Google Scholar] [CrossRef]
  13. Ren, Y.Y.; Zhang, X.F.; Ma, Y.J.; Yang, Q.Y.; Wang, C.J.; Liu, H.L.; Qi, Q. Full Convolutional Neural Network Based on Multi-Scale Feature Fusion for the Class Imbalance Remote Sensing Image Classification. Remote Sens. 2020, 12, 3547. [Google Scholar] [CrossRef]
  14. Hu, L.; Zhou, X.; Ruan, J.C.; Li, S.P. ASPP+-LANet: A Multi-Scale Context Extraction Network for Semantic Segmentation of High-Resolution Remote Sensing Images. Remote Sens. 2024, 16, 1036. [Google Scholar] [CrossRef]
  15. Zheng, Z.; Zhong, Y.; Wang, J.; Ma, A. Foreground-Aware Relation Network for Geospatial Object Segmentation in High Spatial Resolution Remote Sensing Imagery. In Proceedings of the IEEE/CVF Conference on Computer Vision and Pattern Recognition (CVPR), Seattle, WA, USA, 13–19 June 2020; pp. 4095–4104. [Google Scholar] [CrossRef]
  16. Kossmann, D.; Wilhelm, T.; Fink, G.A. Towards Tackling Multi-Label Imbalances in Remote Sensing Imagery. In Proceedings of the 2020 25th International Conference on Pattern Recognition (ICPR), Milan, Italy, 10–15 January 2021; pp. 5782–5789. [Google Scholar] [CrossRef]
  17. Chen, X.; Li, L.Y.; Li, Z.H.; Liu, M.; Li, Q.L.; Qi, H.G.; Ma, D.L.; Wen, Y.; Cao, G.T.; Yu, P.L.H. KD loss: Enhancing discriminability of features with kernel trick for object detection in VHR remote sensing images. Eng. Appl. Artif. Intell. 2024, 129, 107641. [Google Scholar] [CrossRef]
  18. Tan, J.R.; Li, B.; Lu, X.; Yao, Y.Q.; Yu, F.W.; He, T.; Ouyang, W.L. The Equalization Losses: Gradient-Driven Training for Long-tailed Object Recognition. IEEE Trans. Pattern Anal. Mach. Intell. 2023, 45, 13876–13892. [Google Scholar] [CrossRef]
  19. Tan, J.R.; Wang, C.B.; Li, B.Y.; Li, Q.Q.; Ouyang, W.L.; Yin, C.Q.; Yan, J.J. Equalization Loss for Long-Tailed Object Recognition. In Proceedings of the 2020 IEEE/CVF Conference on Computer Vision and Pattern Recognition (CVPR 2020), Seattle, WA, USA, 13–19 June 2020; pp. 11659–11668. [Google Scholar] [CrossRef]
  20. Yuan, M.; Ren, D.B.; Feng, Q.S.; Wang, Z.B.; Dong, Y.K.; Lu, F.X.; Wu, X.L. MCAFNet: A Multiscale Channel Attention Fusion Network for Semantic Segmentation of Remote Sensing Images. Remote Sens. 2023, 15, 361. [Google Scholar] [CrossRef]
  21. Hossain, M.S.; Betts, J.M.; Paplinski, A.P. Dual Focal Loss to address class imbalance in semantic segmentation. Neurocomputing 2021, 462, 69–87. [Google Scholar] [CrossRef]
  22. Quan, Y.H.; Zhong, X.; Feng, W.; Chan, J.C.W.; Li, Q.; Xing, M.D. SMOTE-Based Weighted Deep Rotation Forest for the Imbalanced Hyperspectral Data Classification. Remote Sens. 2021, 13, 464. [Google Scholar] [CrossRef]
  23. Perez, L.; Wang, J. The effectiveness of data augmentation in image classification using deep learning. arXiv 2017, arXiv:1712.04621. [Google Scholar]
  24. Gong, Z.; Duan, L.J.; Xiao, F.J.; Wang, Y.X. MSAug: Multi-Strategy Augmentation for rare classes in semantic segmentation of remote sensing images. Displays 2024, 84, 102779. [Google Scholar] [CrossRef]
  25. Chawla, N.V.; Bowyer, K.W.; Kegelmeyer, W.P. SMOTE: Synthetic Minority Over-sampling Technique. J. Artif. Intell. Res. 2002, 16, 321–357. [Google Scholar] [CrossRef]
  26. Chen, J.F.; Chen, G.; Fang, B.; Wang, J.J.; Wang, L.Z. Class-Aware Domain Adaptation for Coastal Land Cover Mapping Using Optical Remote Sensing Imagery. IEEE J. Sel. Top. Appl. Earth Obs. Remote. Sens. 2021, 14, 11800–11813. [Google Scholar] [CrossRef]
  27. Shumilo, L.; Okhrimenko, A.; Kussul, N.; Drozd, S.; Shkalikov, O. Generative adversarial network augmentation for solving the training data imbalance problem in crop classification. Remote Sens. Lett. 2023, 14, 1131–1140. [Google Scholar] [CrossRef]
  28. Leichtle, T.; Geiss, C.; Lakes, T.; Taubenböck, H. Class imbalance in unsupervised change detection—A diagnostic analysis from urban remote sensing. Int. J. Appl. Earth Obs. 2017, 60, 83–98. [Google Scholar] [CrossRef]
  29. Du, J.; Zhou, Y.H.; Liu, P.; Vong, C.M.; Wang, T.F. Parameter-Free Loss for Class-Imbalanced Deep Learning in Image Classification. IEEE Trans. Neural Netw. Learn. Syst. 2023, 34, 3234–3240. [Google Scholar] [CrossRef] [PubMed]
  30. He, H.; Garcia, E.A. Learning from imbalanced data. IEEE Trans. Knowl. Data Eng. 2009, 21, 1263–1284. [Google Scholar] [CrossRef]
  31. Xiao, A.; Xuan, W.; Wang, J.; Huang, J.; Tao, D.; Lu, S.; Yokoya, N. Foundation models for remote sensing and earth observation: A survey. arXiv 2024, arXiv:2410.16602. [Google Scholar]
  32. Li, Y.X.; Li, X.; Dai, Y.M.; Hou, Q.B.; Liu, L.; Liu, Y.X.; Cheng, M.M.; Yang, J. LSKNet: A Foundation Lightweight Backbone for Remote Sensing. Int. J. Comput. Vision. 2024, 133, 1410–1431. [Google Scholar] [CrossRef]
  33. Wei, W.; Cheng, Y.; He, J.F.; Zhu, X.Y. A review of small object detection based on deep learning. Neural Comput. Appl. 2024, 36, 6283–6303. [Google Scholar] [CrossRef]
  34. Gui, S.X.; Song, S.; Qin, R.J.; Tang, Y. Remote Sensing Object Detection in the Deep Learning Era-A Review. Remote Sens. 2024, 16, 327. [Google Scholar] [CrossRef]
  35. Long, J.; Shelhamer, E.; Darrell, T. Fully convolutional networks for semantic segmentation. In Proceedings of the IEEE Conference on Computer Vision and Pattern Recognition (CVPR), Boston, MA, USA, 7–12 June 2015; pp. 3431–3440. [Google Scholar] [CrossRef]
  36. Ronneberger, O.; Fischer, P.; Brox, T. U-Net: Convolutional Networks for Biomedical Image Segmentation. Med. Image Comput. Comput. -Assist. Interv. 2015, 9351, 234–241. [Google Scholar] [CrossRef]
  37. Chen, L.C.E.; Zhu, Y.K.; Papandreou, G.; Schroff, F.; Adam, H. Encoder-Decoder with Atrous Separable Convolution for Semantic Image Segmentation. In Computer Vision–ECCV 2018; Springer: Berlin/Heidelberg, Germany, 2018; Volume 11211, pp. 833–851. [Google Scholar] [CrossRef]
  38. Wang, J.D.; Sun, K.; Cheng, T.H.; Jiang, B.R.; Deng, C.R.; Zhao, Y.; Liu, D.; Mu, Y.D.; Tan, M.K.; Wang, X.G.; et al. Deep High-Resolution Representation Learning for Visual Recognition. IEEE Trans. Pattern Anal. Mach. Intell. 2021, 43, 3349–3364. [Google Scholar] [CrossRef]
  39. Huang, J.F.; Zhang, X.C.; Xin, Q.C.; Sun, Y.; Zhang, P.C. Automatic building extraction from high-resolution aerial images and LiDAR data using gated residual refinement network. Isprs J. Photogramm. 2019, 151, 91–105. [Google Scholar] [CrossRef]
  40. Ma, A.; Wang, J.; Zhong, Y.; Zheng, Z. FactSeg: Foreground Activation-Driven Small Object Semantic Segmentation in Large-Scale Remote Sensing Imagery. IEEE Trans. Geosci. Remote. Sens. 2022, 60, 1–16. [Google Scholar] [CrossRef]
  41. Wang, H.; Zhang, M.M.; Li, W.; Gao, Y.H.; Gui, Y.Y.; Zhang, Y.X. Unbalanced Class Learning Network With Scale-Adaptive Perception for Complicated Scene in Remote Sensing Images Segmentation. IEEE Trans. Geosci. Remote. Sens. 2024, 62, 1–12. [Google Scholar] [CrossRef]
  42. Strudel, R.; Garcia, R.; Laptev, I.; Schmid, C. Segmenter: Transformer for semantic segmentation. In Proceedings of the IEEE/CVF International Conference on Computer Vision (ICCV), Montreal, QC, Canada, 10–17 October 2021; pp. 7262–7272. [Google Scholar] [CrossRef]
  43. Liu, Z.; Lin, Y.; Cao, Y.; Hu, H.; Wei, Y.; Zhang, Z.; Lin, S.; Guo, B. Swin transformer: Hierarchical vision transformer using shifted windows. In Proceedings of the 2021 IEEE/CVF International Conference on Computer Vision (ICCV), Montreal, QC, Canada, 10–17 October 2021; pp. 10012–10022. [Google Scholar] [CrossRef]
  44. Xu, R.T.; Wang, C.W.; Zhang, J.G.; Xu, S.B.; Meng, W.L.; Zhang, X.P. RSSFormer: Foreground Saliency Enhancement for Remote Sensing Land-Cover Segmentation. IEEE Trans. Image Process. 2023, 32, 1052–1064. [Google Scholar] [CrossRef]
  45. Wang, L.B.; Li, R.; Wang, D.Z.; Duan, C.X.; Wang, T.; Meng, X.L. Transformer Meets Convolution: A Bilateral Awareness Network for Semantic Segmentation of Very Fine Resolution Urban Scene Images. Remote Sens. 2021, 13, 3065. [Google Scholar] [CrossRef]
  46. Zhang, Q.; Yang, Y.-B. Rest: An efficient transformer for visual recognition. Adv. Neural Inf. Process. Syst. 2021, 34, 15475–15485. [Google Scholar] [CrossRef]
  47. Pang, Z.J.; Hu, R.M.; Zhu, W.; Zhu, R.Y.; Liao, Y.X.; Han, X.Y. A Building Extraction Method for High-Resolution Remote Sensing Images with Multiple Attentions and Parallel Encoders Combining Enhanced Spectral Information. Sensors 2024, 24, 1006. [Google Scholar] [CrossRef]
  48. Gu, A.; Dao, T. Mamba: Linear-time sequence modeling with selective state spaces. arXiv 2023, arXiv:2312.00752. [Google Scholar]
  49. Zhu, L.; Liao, B.; Zhang, Q.; Wang, X.; Liu, W.; Wang, X. Vision mamba: Efficient visual representation learning with bidirectional state space model. arXiv 2024, arXiv:2401.09417. [Google Scholar]
  50. Liu, M.; Dan, J.; Lu, Z.; Yu, Y.; Li, Y.; Li, X. CM-UNet: Hybrid CNN-Mamba UNet for Remote Sensing Image Semantic Segmentation. arXiv 2024, arXiv:2405.10530. [Google Scholar]
  51. Wang, L.; Li, D.; Dong, S.; Meng, X.; Zhang, X.; Hong, D. PyramidMamba: Rethinking Pyramid Feature Fusion with Selective Space State Model for Semantic Segmentation of Remote Sensing Imagery. arXiv 2024, arXiv:2406.10828. [Google Scholar]
  52. Chen, P.D.; Ren, Y.R.; Zhang, B.A.; Zhao, Y. Class Imbalance in the Automatic Interpretation of Remote Sensing Images: A Review. IEEE J. Sel. Top. Appl. Earth Obs. Remote. Sens. 2025, 18, 9483–9508. [Google Scholar] [CrossRef]
  53. Li, J.; Ding, W.; Li, H.; Liu, C. Semantic Segmentation for High-Resolution Aerial Imagery Using Multi-Skip Network and Markov Random Fields. In Proceedings of the 2017 IEEE International Conference on Unmanned Systems (ICUS), Beijing, China, 27–29 October 2017; pp. 12–17. [Google Scholar] [CrossRef]
  54. Bai, H.W.; Cheng, J.; Su, Y.Z.; Liu, S.Y.; Liu, X. Calibrated Focal Loss for Semantic Labeling of High-Resolution Remote Sensing Images. IEEE J. Sel. Top. Appl. Earth Obs. Remote. Sens. 2022, 15, 6531–6547. [Google Scholar] [CrossRef]
  55. Hong, D.F.; Zhang, B.; Li, H.; Li, Y.X.; Yao, J.; Li, C.Y.; Werner, M.; Chanussot, J.; Zipf, A.; Zhu, X.X. Cross-city matters: A multimodal remote sensing benchmark dataset for cross-city semantic segmentation using high-resolution domain adaptation networks. Remote Sens. Environ. 2023, 299, 113856. [Google Scholar] [CrossRef]
  56. Xu, H.Z.; He, H.J.; Zhang, Y.; Ma, L.F.; Li, J.A.T. A comparative study of loss functions for road segmentation in remotely sensed road datasets. Int. J. Appl. Earth Obs. 2023, 116, 103159. [Google Scholar] [CrossRef]
  57. Farhadpour, S.; Warner, T.A.; Maxwell, A.E. Selecting and Interpreting Multiclass Loss and Accuracy Assessment Metrics for Classifications with Class Imbalance: Guidance and Best Practices. Remote Sens. 2024, 16, 533. [Google Scholar] [CrossRef]
  58. Chen, Y.; Dong, Q.; Wang, X.F.; Zhang, Q.C.; Kang, M.L.; Jiang, W.X.; Wang, M.Y.; Xu, L.X.; Zhang, C. Hybrid Attention Fusion Embedded in Transformer for Remote Sensing Image Semantic Segmentation. IEEE J. Sel. Top. Appl. Earth Obs. Remote. Sens. 2024, 17, 4421–4435. [Google Scholar] [CrossRef]
  59. Zhou, Y.; Wang, F.K.; Zhao, J.Q.; Yao, R.; Chen, S.L.; Ma, H.P. Spatial-Temporal Based Multihead Self-Attention for Remote Sensing Image Change Detection. IEEE Trans. Circuits Syst. Video Technol. 2022, 32, 6615–6626. [Google Scholar] [CrossRef]
  60. Li, G.; Gao, Q.; Yang, M.; Gao, X. Active learning based on similarity level histogram and adaptive-scale sampling for very high resolution image classification. Neural Netw. 2023, 167, 22–35. [Google Scholar] [CrossRef] [PubMed]
  61. Lu, N.; Li, L.; Qin, J. PV Identifier: Extraction of small-scale distributed photovoltaics in complex environments from high spatial resolution remote sensing images. Appl. Energ. 2024, 365, 123311. [Google Scholar] [CrossRef]
  62. Chen, C.; Fan, L. Scene segmentation of remotely sensed images with data augmentation using U-net++. In Proceedings of the 2021 International Conference on Computer Engineering and Artificial Intelligence (ICCEAI), Shanghai, China, 27–29 August 2021; pp. 201–205. [Google Scholar] [CrossRef]
  63. Suo, Z.L.; Zhao, Y.B.; Chen, S.; Hu, Y.L. BoxPaste: An Effective Data Augmentation Method for SAR Ship Detection. Remote Sens. 2022, 14, 5761. [Google Scholar] [CrossRef]
  64. Chen, B.Y.; Xia, M.; Qian, M.; Huang, J.Q. MANet: A multi-level aggregation network for semantic segmentation of high-resolution remote sensing images. Int. J. Remote Sens. 2022, 43, 5874–5894. [Google Scholar] [CrossRef]
  65. Zhu, R.; Guo, Y.W.; Xue, J.H. Adjusting the imbalance ratio by the dimensionality of imbalanced data. Pattern Recogn. Lett. 2020, 133, 217–223. [Google Scholar] [CrossRef]
  66. Lu, Y.; Cheung, Y.M.; Tang, Y.Y. Bayes Imbalance Impact Index: A Measure of Class Imbalanced Data Set for Classification Problem. IEEE Trans. Neural Networks Learn. Syst. 2020, 31, 3525–3539. [Google Scholar] [CrossRef]
  67. Liu, Y.C.; Lai, K.W.C. The Performance Index of Convolutional Neural Network-Based Classifiers in Class Imbalance Problem. Pattern Recogn. 2023, 137, 109284. [Google Scholar] [CrossRef]
  68. Zhao, S.J.; Chen, H.; Zhang, X.L.; Xiao, P.F.; Bai, L.; Ouyang, W.L. RS-Mamba for Large Remote Sensing Image Dense Prediction. IEEE Trans. Geosci. Remote. Sens. 2024, 62, 1–14. [Google Scholar] [CrossRef]
  69. Zhao, H.S.; Shi, J.P.; Qi, X.J.; Wang, X.G.; Jia, J.Y. Pyramid scene parsing network. In Proceedings of the IEEE/CVF Conference on Computer Vision and Pattern Recognition (CVPR), Honolulu, HI, USA, 21–26 July 2017; pp. 2881–2890. [Google Scholar] [CrossRef]
  70. Szegedy, C.; Liu, W.; Jia, Y.Q.; Sermanet, P.; Reed, S.; Anguelov, D.; Erhan, D.; Vanhoucke, V.; Rabinovich, A. Going deeper with convolutions. In Proceedings of the IEEE/CVF Conference on Computer Vision and Pattern Recognition (CVPR), Boston, MA, USA, 8–10 June 2015; pp. 1–9. [Google Scholar] [CrossRef]
  71. Woo, S.H.; Park, J.; Lee, J.Y.; Kweon, I.S. CBAM: Convolutional Block Attention Module. In Computer Vision–ECCV 2018; Springer: Berlin/Heidelberg, Germany, 2018; Volume 11211, pp. 3–19. [Google Scholar] [CrossRef]
  72. Mao, A.; Mohri, M.; Zhong, Y. Cross-Entropy Loss Functions: Theoretical Analysis and Applications. In Proceedings of the 40th International Conference on Machine Learning, Honolulu, HI, USA, 23–29 July 2023; pp. 23803–23828. [Google Scholar]
  73. Milletari, F.; Navab, N.; Ahmadi, S.A. V-Net: Fully Convolutional Neural Networks for Volumetric Medical Image Segmentation. In Proceedings of the 2016 Fourth International Conference on 3D Vision (3DV), Stanford, CA, USA, 25–28 October 2016; pp. 565–571. [Google Scholar] [CrossRef]
  74. Sudre, C.H.; Li, W.Q.; Vercauteren, T.; Ourselin, S.; Cardoso, M.J. Generalised Dice Overlap as a Deep Learning Loss Function for Highly Unbalanced Segmentations. In Deep Learning in Medical Image Analysis and Multimodal Learning for Clinical Decision Support; Springer: Berlin/Heidelberg, Germany, 2017; Volume 10553, pp. 240–248. [Google Scholar] [CrossRef]
  75. Lee, C.Y.; Xie, S.N.; Gallagher, P.W.; Zhang, Z.Y.; Tu, Z.W. Deeply-Supervised Nets. In Proceedings of the 18th International Conference on Artificial Intelligence and Statistics, San Diego, CA, USA, 9–12 May 2015; Volume 38, pp. 562–570. [Google Scholar] [CrossRef]
  76. Rottensteiner, F.; Sohn, G.; Jung, J.; Gerke, M.; Baillard, C.; Benitez, S.; Breitkopf, U. The ISPRS benchmark on urban object classification and 3D building reconstruction. ISPRS Ann. Photogramm. Remote Sens. Spat. Inf. Sci. 2012, 1, 293–298. [Google Scholar] [CrossRef]
  77. Chen, P.D.; Liu, Y.; Liu, Y.; Ren, Y.R.; Zhang, B.A.; Gao, X.L. High-resolution feature pyramid attention network for high spatial resolution images land-cover classification in arid oasis zones. Int. J. Remote Sens. 2024, 45, 3664–3688. [Google Scholar] [CrossRef]
  78. Wang, L.B.; Li, R.; Zhang, C.; Fang, S.H.; Duan, C.X.; Meng, X.L.; Atkinson, P.M. UNetFormer: A UNet-like transformer for efficient semantic segmentation of remote sensing urban scene imagery. ISPRS J. Photogramm. 2022, 190, 196–214. [Google Scholar] [CrossRef]
  79. Li, R.; Zheng, S.Y.; Zhang, C.; Duan, C.X.; Wang, L.B.; Atkinson, P.M. ABCNet: Attentive bilateral contextual network for efficient semantic segmentation of Fine-Resolution remotely sensed imagery. ISPRS J. Photogramm. 2021, 181, 84–98. [Google Scholar] [CrossRef]
  80. Zheng, S.; Lu, J.; Zhao, H.; Zhu, X.; Luo, Z.; Wang, Y.; Fu, Y.; Feng, J.; Xiang, T.; Torr, P.H. Rethinking semantic segmentation from a sequence-to-sequence perspective with transformers. In Proceedings of the IEEE/CVF International Conference on Computer Vision (ICCV), Montreal, QC, Canada, 10–17 October 2021; pp. 6881–6890. [Google Scholar] [CrossRef]
  81. Chen, J.; Lu, Y.; Yu, Q.; Luo, X.; Adeli, E.; Wang, Y.; Lu, L.; Yuille, A.L.; Zhou, Y. TransUNet: Transformers Make Strong Encoders for Medical Image Segmentation. arXiv 2021, arXiv:2102.04306. [Google Scholar]
Figure 1. Architecture of the HRUMamba model.
Remotesensing 17 01845 g001
Figure 2. SVSS block and its components. (a) SVSS block; (b) SS2D; (c) MCFM; (d) OSSM.
Remotesensing 17 01845 g002
Figure 3. Composition of the AAF module.
Remotesensing 17 01845 g003
Figure 4. Datasets and CI of land cover classes. The solid yellow- and red-line boxes show the extent of dataset collection. (a) represents the region in which the Vaihingen dataset is located and the proportion of each class. (b) represents the proportion of regions and classes in which the Minqin dataset is located.
Remotesensing 17 01845 g004
Figure 5. Visualization of ablation results for each component on the Vaihingen dataset. The red boxes indicate the areas with poor classification.
Remotesensing 17 01845 g005
Figure 6. Visualization of different models for each category of IoU on Vaihingen dataset.
Remotesensing 17 01845 g006
Figure 7. Visualization results of models on Vaihingen test set.
Remotesensing 17 01845 g007
Figure 8. Visualization results of models on Minqin test set.
Remotesensing 17 01845 g008
Figure 9. Visualization results of different models on Minqin test set.
Remotesensing 17 01845 g009
Figure 10. Visualization of minority class IoU in representative models.
Remotesensing 17 01845 g010
Figure 11. Sample results of representative model minority class classification.
Remotesensing 17 01845 g011
Figure 12. The number of parameters in different backbone networks.
Remotesensing 17 01845 g012
Figure 13. Variation of loss functions with the HRUMamba model using Vaihingen dataset.
Remotesensing 17 01845 g013
Figure 14. Visualization of evaluation metrics for each model on different datasets. (a) represent the evaluation metrics of each model on the Vaihingen dataset. (b) represent the evaluation metrics of each model on the Minqin dataset.
Remotesensing 17 01845 g014
Table 1. Ablation studies of HRUMamba modules, where “Baseline” denotes the model structure of HRUMamba without AAF module and MCF module, i.e., “HRNet + VSS Blocks”; “Baseline + AAFM” denotes “HRNet + AAFM + VSS Blocks”; ’Baseline + MCFM’ denotes ’HRNet + SVSS Blocks’; “Baseline + AAFM + MCFM” denotes “HRNet + AAFM + SVSS Blocks”. The best values are shown in bold.
ModelAAFMMCFMIoU (%)mIoU
(%)
OA
(%)
CV
Imp. Surf.BuildingLow. Veg.TreeCar
Baseline92.2492.3673.6682.0181.6484.8493.580.0492
HRUMamba94.4393.0274.9482.7183.2985.6893.870.0458
94.7393.1474.9082.5983.4985.7793.960.0464
94.4892.7975.2282.9483.9985.8893.920.0445
CM-UNet--92.8589.7971.7781.3272.1681.5892.540.0590
PyramidMamba--92.4988.7469.8980.1470.8680.4092.000.0632
Table 2. Comparison on the combinations of loss functions. The best values are shown in bold.
CELFLDLIoU (%)mIoU
(%)
OA
(%)
CV
Imp. Surf.BuildingLow. Veg.TreeCar
94.6093.0074.8882.7381.1585.4793.910.0467
94.3292.7375.1882.7082.3885.4693.820.0453
94.4892.7975.2282.9483.9985.8893.920.0445
94.4192.9874.6182.4184.5185.7193.790.0463
Table 3. Effect of auxiliary loss function for training the HRUMamba model. The best values are shown in bold.
Auxiliary LossIoU (%)mIoU
(%)
OA
(%)
CV
Imp. Surf.BuildingLow. Veg.TreeCar
without94.4092.8574.1682.4182.4685.2693.730.0478
with94.4892.7975.2282.9483.9985.8893.920.0445
Table 4. Effect of data augmentation. The best values are shown in bold.
Data AugmentationIoU (%)mIoU
(%)
OA
(%)
CV
Imp. Surf.BuildingLow. Veg.TreeCar
without94.0191.9774.8282.7578.1484.3493.560.0484
with94.4892.7975.2282.9483.9985.8893.920.0445
Table 5. Comparison of classification results based on the Vaihingen dataset. The best values are shown in bold.
ModelsBackboneF1 (%)mF1 (%)CV
Imp. Surf.BuildingLow. Veg.TreeCar
FCNResNet1895.0392.3080.7588.2866.7284.610.1201
UNet-96.3093.5482.0788.7785.2289.180.0585
DeepLabv3+ResNet1895.4792.1179.8088.2779.4287.010.0743
GRRNetResNet1895.3492.5080.6788.4779.4487.280.0722
ASPP+-LANet-96.0493.5281.8488.7477.8787.600.0783
ABCNetResNet1896.4795.1283.8890.1579.9589.110.0714
SegmenterViT-Base90.4784.0469.5877.7221.8068.720.3559
SETRViT-Base92.7689.2975.6883.0235.0975.170.2776
Swin TransformerSwin-Base90.9485.9370.1077.4513.2967.540.4153
BANetResT-Base96.4595.0483.8589.7586.2790.270.0539
TransUNetResNet1896.5194.3483.9889.9887.1590.390.0507
MarsNetResNet1896.5995.3183.8589.8481.8489.480.0661
UNetFormerResNet1896.5194.5983.8189.9085.1289.990.0557
CM-UNetResNet1896.2994.6283.5689.7083.8389.600.0590
PyramidMambaResNet1896.1094.0382.2888.9882.9488.870.0632
HRUMambaHRNet-W6497.1696.2685.8690.6791.3092.250.0445
Table 6. Comparison among models with the Minqin dataset. The best values are shown in bold.
ModelsBackboneF1 (%)mF1
(%)
CV
FarmlandGarden-landWoodlandGrasslandBuildingRoadArt.stru.Art.exca.Bare-landWater
FCNResNet1892.0561.6894.8070.8883.2847.5472.1669.6890.8990.2275.880.1904
UNet-94.5173.4396.0979.5489.8269.7579.4477.1092.6794.4483.590.1103
DeepLabv3+ResNet1892.9765.8395.2074.1085.1459.2672.4469.9991.5092.8578.490.1556
GRRNetResNet1891.6053.4094.4467.5485.0450.7971.0256.8490.6190.9673.470.2187
ASPP+-LANetResNet1895.2080.3196.6283.0987.7666.0079.2180.9993.6794.1584.760.1067
ABCNetResNet1895.2577.8396.6082.4489.2168.3079.1777.2793.6994.6584.420.1082
SegmenterViT-Base94.3179.5696.2480.6382.7148.2176.6480.7593.0891.1881.350.1602
SETRViT-Base95.4180.6296.6983.5887.7172.0881.2683.1693.5994.6586.010.0884
Swin TransformerSwin-Base91.7863.6294.7170.7377.1133.4168.1664.4891.0489.5472.780.2393
BANetResT-Base95.8480.0396.9485.2690.5674.0482.7184.1193.9395.3587.060.0841
TransUNetResNet1894.1371.1395.9178.1688.6166.4577.6376.0392.5094.3182.280.1229
MarsNetResNet1893.1665.3995.2973.5284.5754.1571.4160.9191.6392.1576.670.1826
UNetFormerResNet1893.6872.0095.4376.0489.0769.3076.9676.5091.6594.3882.290.1163
CM-UNetResNet1893.3569.0095.4075.4889.0469.3777.0776.8291.5994.3081.900.1209
PyramidMambaResNet1890.0046.9593.4763.8982.2852.1168.880.0089.5891.7465.240.4088
HRUMambaHRNet-W6496.2885.6597.2286.5192.8582.7586.3686.6994.6096.6589.880.0574
Table 7. Computational efficiency and performance of representative models with different architectures. All models were tested on an Nvidia NVLink Tesla V100 GPU, with an input image size of 512 × 512 and a batch size of 1. The value before the “/” corresponds to the results on the Vaihingen dataset, and the value after the “/” corresponds to the results on the Minqin dataset. “↓” indicates that smaller values are better. “↑” indicates that the larger the value, the better. The best values are shown in bold.
ModelBackboneMemory (MB)↓Parameters (M)↓FLOPs (G)↓Speed (FPS)↑mIoU (%)↑mF1 (%)↑
ABCNetResNet18143.5813.393.91159.5180.95/74.1389.11/84.42
SegmenterViT-Base575.2100.4119.8487.2856.84/70.5368.72/81.35
SETRViT-Base715.4489.2031.17110.5664.06/76.2475.17/86.01
BANetResNet18172.2212.733.2667.7182.63/77.8090.27/87.06
CM-UNetResNet18184.3113.553.1732.4781.54/70.5589.60/81.90
HRUMambaHRNet-W641002.19127.1340.0012.0885.88/82.0092.25/89.88
Table 8. Comparison of CI indicators in Vaihingen and Minqin datasets for test. The best values are shown in bold.
MethodVaihingenMinqin
IRCVIRCV
FCN26.50900.1201396.07370.1904
UNet24.25570.0585362.76870.1103
DeepLabv3+27.81980.0743356.52630.1556
GRRNet21.86090.0722377.31610.2187
ASPP+-LANet25.26520.0783338.19650.1067
ABCNet28.75760.0714359.76620.1082
Segmenter43.32460.3559377.00610.1602
SETR35.54110.2776368.54800.0884
Swin Transformer144.71440.4153428.25750.2393
BANet26.18610.0539367.17010.0841
TransUNet23.00940.0507378.81400.1229
MarsNet28.09080.0661401.55290.1826
UNetFormer25.30690.0557324.91790.1163
CM-UNet23.65910.0590339.46280.1209
PyramidMamba24.73070.0632135.07560.4088
HRUMamba23.93420.0445312.13250.0574
Test set benchmark IR values21.7113310.3823
Disclaimer/Publisher’s Note: The statements, opinions and data contained in all publications are solely those of the individual author(s) and contributor(s) and not of MDPI and/or the editor(s). MDPI and/or the editor(s) disclaim responsibility for any injury to people or property resulting from any ideas, methods, instructions or products referred to in the content.

